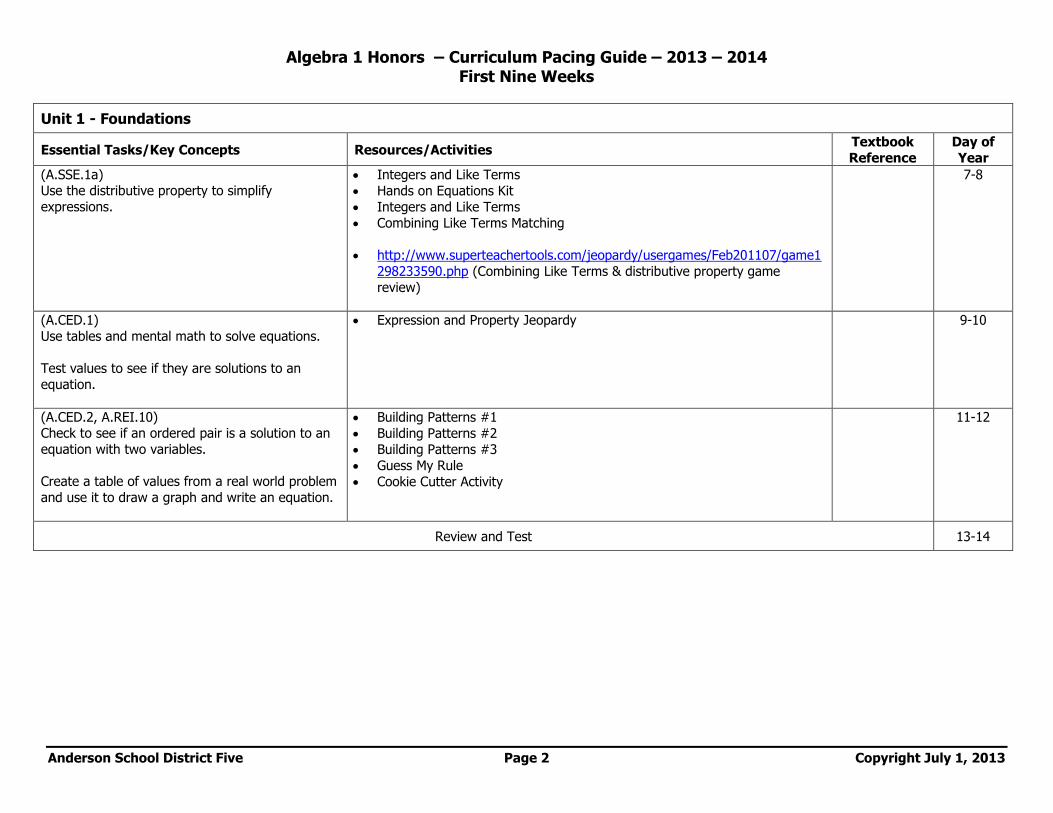
Algebra 1 Honors – Curriculum Pacing Guide – 2013 – 2014 First Nine Weeks Anderson School District Five Page 1 Copyright July 1, 2013 Unit 1 - Foundations N.RN.3 Explain why sums and products of rational numbers are rational, that the sum of a rational number and irrational number is irrational, and that the product of a nonzero rational number and an irrational number is irrational. A.SSE.1 Interpret expressions that represent a quantity in terms of its context. A.SSE.1a Interpret parts of an expression, such as terms, factors, and coefficients. A.SSE.1b Interpret complicated expressions by viewing one or more of their parts as a single entity. A.SSE.2 Use the structure of an expression to identify ways to rewrite it. A.CED.1 Create equations and inequalities in one variable and use them to solve problems. Include equations arising from linear and quadratic functions, and simple rational and exponential functions. A.CED.2 Create equations in two or more variables to represent relationships between quantities; graph equations on coordinate axes with labels and scales. A.REI.10 Understand that the graph of an equation in two variables is the set of all its solutions plotted in the coordinate plane, often forming a curve (which could be a line). Unit 1 - Foundations Essential Tasks/Key Concepts Resources/Activities Textbook Reference Day of Year (A.SSE.1, A.SSE.1a) Write equations from verbal expressions and create linear equations to represent real-world applications. Expression Bingo Substitute using Literal Equations http://www.math-play.com/Algebraic-Expressions-Millionaire/algebraic- expressions-millionaire.html (Game to practice writing equations from expressions) http://www.math-drills.com/algebra.shtml#translating (to generate worksheets) 1-2 (A.SSE.1b, A.SSE.2) Evaluate numerical expressions and algebraic expressions using the order of operations. Order of Operations Practice Sheet http://writingtolearntoteach.wordpress.com/2012/08/10/my-favorite-friday- order-of-operations-activity/ (Activity to use for order of operations) http://illuminations.nctm.org/LessonDetail.aspx?id=L730 (Order of operations Bingo game) https://itunes.apple.com/us/app/5-dice-order-operations- game/id572774867?ls=1&mt=8 (Ipad App) 3-4 (N.RN.3) Review real numbers, properties of real numbers, and operations with real numbers. Use the Closure property to explain and identify whether sums or products of two real numbers is rational or irrational. Glencoe Common Core State Standards Supplement, p. 57 Pearson Concept Byte, p. 45 Real numbers Venn diagram Identify the Real Numbers Properties Quiz Hands on Equations Kit 5-6
Transcript
Algebra 1 Honors – Curriculum Pacing Guide – 2013 – 2014 First Nine Weeks
Anderson School District Five Page 1 Copyright July 1, 2013
Unit 1 - Foundations N.RN.3 Explain why sums and products of rational numbers are rational, that the sum of a rational number and irrational number is irrational, and that the
product of a nonzero rational number and an irrational number is irrational.
A.SSE.1 Interpret expressions that represent a quantity in terms of its context. A.SSE.1a Interpret parts of an expression, such as terms, factors, and coefficients.
A.SSE.1b Interpret complicated expressions by viewing one or more of their parts as a single entity. A.SSE.2 Use the structure of an expression to identify ways to rewrite it.
A.CED.1 Create equations and inequalities in one variable and use them to solve problems. Include equations arising from linear and quadratic functions, and simple rational and exponential functions.
A.CED.2 Create equations in two or more variables to represent relationships between quantities; graph equations on coordinate axes with labels and scales.
A.REI.10 Understand that the graph of an equation in two variables is the set of all its solutions plotted in the coordinate plane, often forming a curve (which could be a line).
Algebra 1 Honors – Curriculum Pacing Guide – 2013 – 2014 First Nine Weeks
Anderson School District Five Page 3 Copyright July 1, 2013
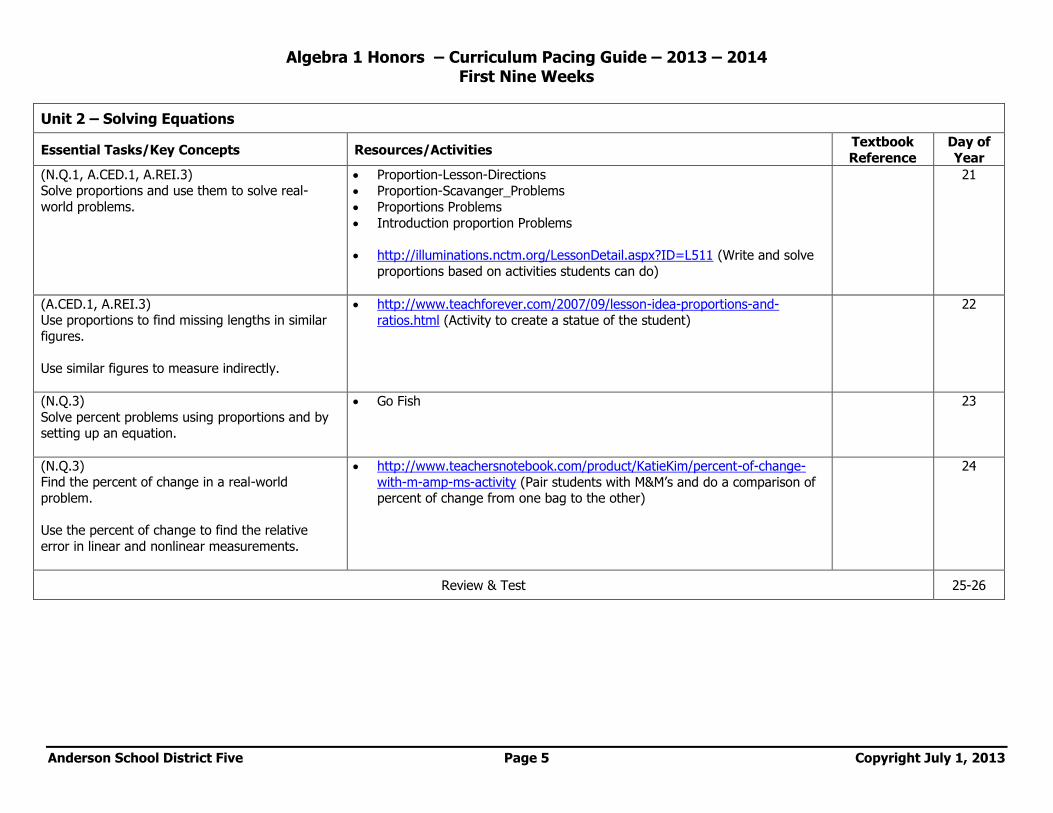
Unit 2 – Solving Equations N.Q.1 Use units as a way to understand problems and to guide the solution of multi-step problems; choose and interpret units consistently in formulas;
choose and interpret the scale and the origin in graphs and data displays.
N.Q.2 Define appropriate quantities for the purpose of descriptive modeling. N.Q.3 Choose a level of accuracy appropriate to limitations on measurement when reporting quantities.
A.CED.1 Create equations and inequalities in one variable and use them to solve problems. Include equations arising from linear and quadratic functions, and simple rational and exponential functions.
A.CED.4 Rearrange formulas to highlight a quantity of interest, using the same reasoning as in solving equations.
A.REI.1 Explain each step in solving a simple equation as following from the equality of numbers asserted at the previous step, starting from the assumption that the original equation has a solution. Construct a viable argument to justify a solution method.
A.REI.3 Solve linear equations and inequalities in one variable, including equations with coefficients represented by letters.
Algebra 1 Honors – Curriculum Pacing Guide – 2013 – 2014 First Nine Weeks
Anderson School District Five Page 6 Copyright July 1, 2013
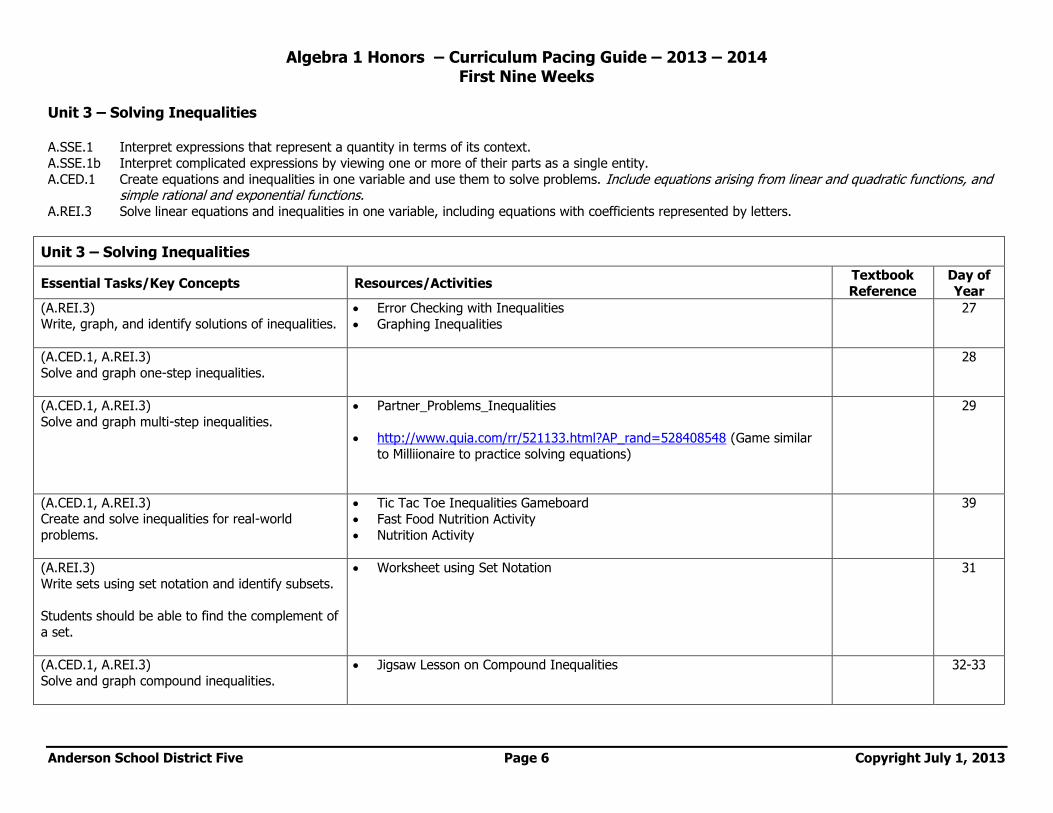
Unit 3 – Solving Inequalities A.SSE.1 Interpret expressions that represent a quantity in terms of its context.
A.SSE.1b Interpret complicated expressions by viewing one or more of their parts as a single entity.
A.CED.1 Create equations and inequalities in one variable and use them to solve problems. Include equations arising from linear and quadratic functions, and simple rational and exponential functions.
A.REI.3 Solve linear equations and inequalities in one variable, including equations with coefficients represented by letters.
Algebra 1 Honors – Curriculum Pacing Guide – 2013 – 2014 First Nine Weeks
Anderson School District Five Page 8 Copyright July 1, 2013
Algebra 1 Honors – Curriculum Pacing Guide – 2013 – 2014 Second Nine Weeks
Anderson School District Five Page 9 Copyright July 1, 2013
Unit 4 - Statistics N.Q.1 Use units as a way to understand problems and to guide the solution of multi-step problems; choose and interpret units consistently in formulas;
choose and interpret the scale and the origin in graphs and data displays.
N.Q.2 Define appropriate quantities for the purpose of descriptive modeling. S.ID.1 Represent data with plots on the real number line (dot plots, histograms, and box plots).
S.ID.2 Use statistics appropriate to the shape of the data distribution to compare center (median, mean) and spread (interquartile range, standard deviation) of two or more different data sets.
S.ID.3 Interpret differences in shape, center, and spread in the context of the data sets, accounting for possible effects of extreme data points (outliers). S.ID.5 Summarize categorical data for two categories in two-way frequency tables. Interpret relative frequencies in the context of the data (including joint,
marginal, and conditional relative frequencies). Recognize possible associations and trends in the data.
Algebra 1 Honors – Curriculum Pacing Guide – 2013 – 2014 Second Nine Weeks
Anderson School District Five Page 11 Copyright July 1, 2013
Unit 5 – Introduction to Functions N.Q.1 Use units as a way to understand problems and to guide the solution of multi-step problems; choose and interpret units consistently in formulas;
choose and interpret the scale and the origin in graphs and data displays.
N.Q.2 Define appropriate quantities for the purpose of descriptive modeling. A.SSE.1 Interpret expressions that represent a quantity in terms of its context.
A.SSE.1a Interpret parts of an expression, such as terms, factors, and coefficients. A.SSE.1b Interpret complicated expressions by viewing one or more of their parts as a single entity.
A.SSE.2 Use the structure of an expression to identify ways to rewrite it. A.REI.10 Understand that the graph of an equation in two variables is the set of all its solutions plotted in the coordinate plane, often forming a curve (which
could be a straight line). A.REI.11 Explain why the x-coordinates of the points where the graphs of the equations and intersect are the solutions of the equation
; find the solutions approximately, e.g., using technology to graph the functions, make tables of values, or find successive approximations.
Include cases where and/or are linear, polynomial, rational, absolute value, exponential, and logarithmic functions.
F.IF.1 Understand that a function from one set (called the domain) to another set (called the range) assigns to each element of the domain exactly one element of the range. If is a function and is an element of its domain, then denotes the output of corresponding to the input . The
graph of is the graph of the equation . F.IF.2 Use function notation, evaluate functions for inputs in their domains, and interpret statements that use function notation in terms of a context. F.IF.3 Recognize that sequences are functions, sometimes defined recursively, whose domain is a subset of the integers.
F.IF.4 For a function that models a relationship between two quantities, interpret key features of graphs and tables in terms of the quantities, and sketch graphs showing key features given a verbal description of the relationship. Key features include: intercepts; intervals where the function is increasing,
decreasing, positive, ore negative; relative maximums and minimums; symmetries; end behavior; and periodicity.
F.IF.5 Relate the domain of a function to its graph and, where applicable, to the quantitative relationship it describes. F.BF.1 Write a function that describes a relationship between two quantities.
F.BF.1a Determine an explicit expression, a recursive process, or steps for calculation from a context. F.BF.2 Write arithmetic and geometric sequences both recursively and with an explicit formula, use them to model situations, and translate between the two
forms. F.LE.2 Construct linear and exponential functions, including arithmetic and geometric sequences, given a graph, a description of a relationship, or two input-
output pairs (including reading these from a table).
Algebra 1 Honors – Curriculum Pacing Guide – 2013 – 2014 Second Nine Weeks
Anderson School District Five Page 13 Copyright July 1, 2013
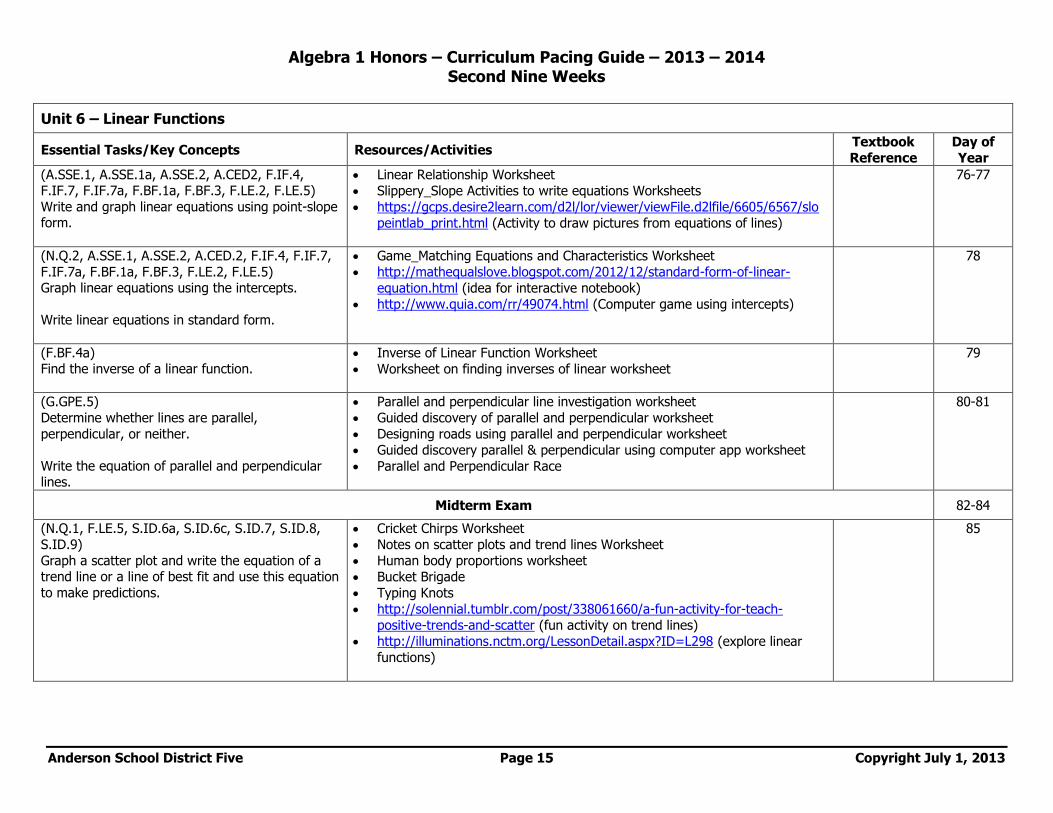
Unit 6 – Linear Functions N.Q.1 Use units as a way to understand problems and to guide the solution of multi-step problems; choose and interpret units consistently in formulas;
choose and interpret the scale and the origin in graphs and data displays.
N.Q.2 Define appropriate quantities for the purpose of descriptive modeling. A.SSE.1 Interpret expressions that represent a quantity in terms of its context.
A.SSE.1a Interpret parts of an expression, such as terms, factors, and coefficients. A.SSE.2 Use the structure of an expression to identify ways to rewrite it.
A.CED.2 Create equations in two or more variables to represent relationships between quantities; graph equations on coordinate axes with labels and scales. F.IF.4 For a function that models a relationship between two quantities, interpret key features of graphs and tables in terms of the quantities, and sketch
graphs showing key features given a verbal description of the relationship. Key features include: intercepts; intervals where the function is increasing,
decreasing, positive, ore negative; relative maximums and minimums; symmetries; end behavior; and periodicity. F.IF.6 Calculate and interpret the average rate of change of a function (presented symbolically or as a table) over a specified interval. Estimate the rate of
change from a graph. F.IF.7 Graph functions expressed symbolically and show key features of the graph, by hand in simple cases and using technology for more complicated
cases.
F.IF.7a Graph linear and quadratic functions and show intercepts, maxima, and minima. F.IF.7b Graph square root, cube root, and piecewise-defined functions, including step functions and absolute value functions.
F.BF.1a Determine an explicit expression, a recursive process, or steps for calculation from a context. F.BF.3 Identify the effect on the graph of replacing by and for specific values of (both positive and negative); find the
value of given the graphs. Experiment with cases and illustrate an explanation of the effects on the graph using technology.
F.BF.4a Solve an equation of the form for a simple function that has an inverse and write an expression for the inverse.
F.LE.1b Recognize situations in which one quantity changes at a constant rate per unit interval relative to another.
F.LE.2 Construct linear and exponential functions, including arithmetic and geometric sequences, given a graph, a description of a relationship, or two input-output pairs (include reading these from a table).
F.LE.5 Interpret the parameters in a linear or exponential function in terms of a context. G.GPE.5* Prove the slope criteria for parallel and perpendicular lines and use them to solve geometric problems (e.g., find the equation of a line parallel or
perpendicular to a give line that passes through a given point). S.ID.6a Fit a function to the data; use functions fitted to data to solve problems in the context of the data. Use given functions or choose a function suggested
by the context. Emphasize linear, quadratic, and exponential models. S.ID.6b Informally assess the fit of a function by plotting and analyzing residuals. S.ID.7 Interpret the slope (rate of change) and the intercept (constant term) of a linear model in the context of the data.
S.ID.8 Compute (using technology) and interpret the correlation coefficient of a linear fit. S.ID.9 Distinguish between correlation and causation.
Algebra 1 Honors – Curriculum Pacing Guide – 2013 – 2014 Second Nine Weeks
Anderson School District Five Page 14 Copyright July 1, 2013
Algebra 1 Honors – Curriculum Pacing Guide – 2013 – 2014 Third Nine Weeks
Anderson School District Five Page 17 Copyright July 1, 2013
Unit 7 – Systems of Equations & Inequalities N.Q.2 Define appropriate quantities for the purpose of descriptive modeling.
N.Q.3 Choose a level of accuracy appropriate to limitations on measurement when reporting quantities.
A.CED.3 Represent constraints by equations or inequalities, and by systems of equations and/or inequalities, and interpret solutions as viable or non-viable options in a modeling context.
A.REI.5 Prove that, given a system of two equations in two variables, replacing one equation by the sum of that equation and a multiple of the other produces a system with the same solutions.
A.REI.6 Solve systems of linear equations exactly and approximately (e.g., with graphs), focusing on pairs of linear equations in two variables. A.REI.12 Graph the solutions to a linear inequality in two variables as a half-plane (excluding the boundary in the case of a strict inequality), and graph the
solution set to a system of linear inequalities in two variables as the intersection of the corresponding half-planes.
Algebra 1 Honors – Curriculum Pacing Guide – 2013 – 2014 Third Nine Weeks
Anderson School District Five Page 19 Copyright July 1, 2013
Unit 8 – Exponential Functions N.RN.1 Explain how the definition of the meaning of rational exponents follows from extending the properties of integer exponents to those values, allowing
for a notation for radicals in terms of rational exponents.
N.RN.2 Rewrite expressions involving radicals and rational exponents using the properties of exponents. A.SSE.1 Interpret expressions that represent a quantity in terms of its context.
A.SSE.1a Interpret parts of an expression, such as terms, factors, and coefficients. A.SSE.1b Interpret complicated expressions by viewing one or more of their parts as a single entity.
A.SSE.3c Use the properties of exponents to transform expressions for exponential functions. A.CED.2 Create equations in two or more variables to represent relationships between quantities; graph equations on coordinate axes with labels and scales.
A.REI.11 Explain why the x-coordinates of the points where the graphs of the equations y = f(x) and y = g(x) intersect are the solutions of the equation f(x) =
g(x); find the solutions approximately, e.g., using technology to graph the functions, make tables of values, or find successive approximations. Include
cases where f(x) and/or g(x) are linear, polynomial, rational, absolute value, exponential, and logarithmic functions.★
F.IF.3 Recognize that sequences are functions, sometimes defined recursively, whose domain is a subset of the integers.
F.IF.4 For a function that models a relationship between two quantities, interpret key features of graphs and tables in terms of the quantities, and sketch graphs showing key features given a verbal description of the relationship. Key features include: intercepts; intervals where the function is increasing, decreasing, positive, or negative; relative maximums and minimums; symmetries; end behavior; and periodicity.★
F.IF.5 Relate the domain of a function to its graph and, where applicable, to the quantitative relationship it describes.
F.IF.7 Graph functions expressed symbolically and show key features of the graph, by hand in simple cases and using technology for more complicated cases.
F.IF.7a Graph linear and quadratic functions and show intercepts, maxima, and minima. F.IF.8b Use the properties of exponents to interpret expressions for exponential functions.
F.IF.9 Compare properties of two functions each represented in a different way (algebraically, graphically, numerically in tables, or by verbal descriptions).
F.BF.1 Write a function that describes a relationship between two quantities. F.BF.1a Determine an explicit expression, a recursive process, or steps for calculation from a context.
F.BF.2 Write arithmetic and geometric sequences both recursively and with an explicit formula, use them to model situations, and translate between the two forms.
F.BF.3 Identify the effect on the graph of replacing f(x) by f(x) + k, k f(x), f(kx), and f(x + k) for specific values of k (both positive and negative); find the
value of k given the graphs. Experiment with cases and illustrate an explanation of the effects on the graph using technology. Include recognizing even and odd functions from their graphs and algebraic expressions for them.
F.LE.1c Recognize situations in which a quantity grows or decays by a constant percent rate per unit interval relative to another. F.LE.2 Construct linear and exponential functions, including arithmetic and geometric sequences, given a graph, a description of a relationship, or two input-
output pairs (including reading these from a table). F.LE.5 Interpret the parameters in a linear or exponential function in terms of a context.
Algebra 1 Honors – Curriculum Pacing Guide – 2013 – 2014 Third Nine Weeks
Anderson School District Five Page 20 Copyright July 1, 2013
Algebra 1 Honors – Curriculum Pacing Guide – 2013 – 2014 Third Nine Weeks
Anderson School District Five Page 21 Copyright July 1, 2013
Unit 9 – Polynomials & Factoring A.SSE.1 Interpret expressions that represent a quantity in terms of its context.
A.SSE.1a Interpret parts of an expression, such as terms, factors, and coefficients.
A.SSE.1b Interpret complicated expressions by viewing one or more of their parts as a single entity. A.SSE.2 Use the structure of an expression to identify ways to rewrite it.
A.APR.1 Understand that polynomials from a system analogous to the integers, namely, they are closed under the operations of addition, subtraction, and multiplication; add, subtract, and multiply polynomials.
Anderson School District Five Page 23 Copyright July 1, 2013
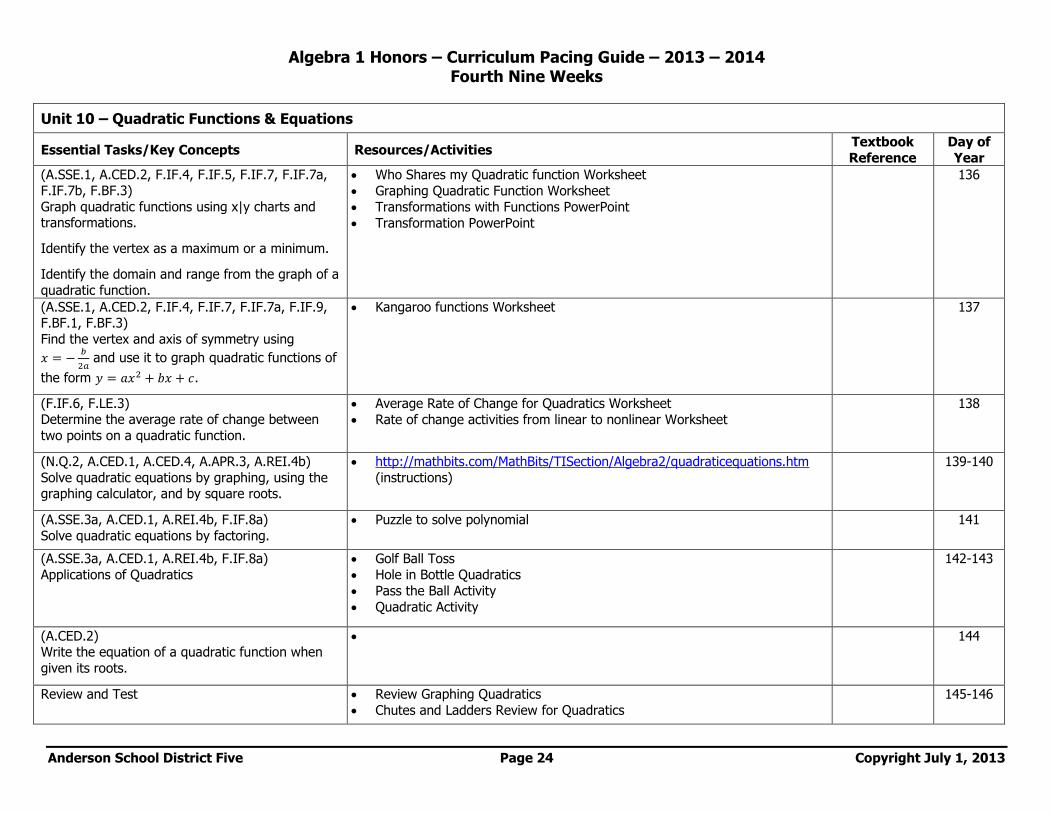
Unit 10 – Quadratic Functions & Equations N.RN.2 Rewrite expressions involving radicals and rational exponents using the properties of exponents.
N.Q.2 Define appropriate quantities for the purpose of descriptive modeling.
A.SSE.1 Interpret expressions that represent a quantity in terms of its context. A.SSE.3a Factor a quadratic expression to reveal the zeros on the function it defines.
A.APR.3* Identify zeros of polynomials when suitable factorizations are available, and use the zerois to construct a rough graph of the function defined by the polynomial.
A.CED.1 Create equations and inequalities in one variable and use them to solve problems. Include equations arising from linear and quadratic functions, and simple rational and exponential functions.
A.CED.2 Create equations in two or more variables to represent relationships between quantities; graph equations on coordinate axes with labels and scales.
A.CED.4 Rearrange formulas to highlight a quantity of interest, using the same reasoning as in solving equations. A.REI.4b Solve quadratic equations by inspection (e.g., for ), taking square roots, completing the square, the quadratic formula and factoring, as
appropriate to the initial form of the equation. Recognize when the quadratic formula gives complex solutions and write them as for real
numbers and .
F.IF.4 For a function that models a relationship between two quantities, interpret key features of graphs and tables in terms of the quantities, and sketch graphs showing key features given a verbal description of the relationship. Key features include: intercepts; intervals where the function is increasing, decreasing, positive, or negative; relative maximums and minimums; symmetries; end behavior; and periodicity.★
F.IF.5 Relate the domain of a function to its graph and, where applicable, to the quantitative relationship it describes.
F.IF.6 Calculate and interpret the average rate of change of a function (presented symbolically or as a table) over a specified interval. Estimate the rate of change from a graph.
F.IF.7 Graph functions expressed symbolically and show key features of the graph, by hand in simple cases and using technology for more complicated cases.
F.IF.7a Graph linear and quadratic functions and show intercepts, maxima, and minima.
F.IF.7b Graph square root, cube root, and piecewise-defined functions, including step functions and absolute value functions. F.IF.8a Use the process of factoring and completing the square in a quadratic function to show zeros, extreme values, and symmetry of the graph, and
interpret these in terms of a context. F.IF.9 Compare properties of two functions each represented in a different way (algebraically, graphically, numerically in tables, or by verbal descriptions).
F.BF.1 Write a function that describes a relationship between two quantities.
F.BF.3 Identify the effect on the graph of replacing f(x) by f(x) + k, k f(x), f(kx), and f(x + k) for specific values of k (both positive and negative); find the value of k given the graphs. Experiment with cases and illustrate an explanation of the effects on the graph using technology. Include recognizing even and odd functions from their graphs and algebraic expressions for them.
F.LE.3 Observe using graphs and tables that a quantity increasing exponentially eventually exceeds a quantity increasing linearly, quadratically, or (more
Anderson School District Five Page 25 Copyright July 1, 2013
Unit 11 – More on Quadratic Functions N.Q.3 Choose a level of accuracy appropriate to limitations on measurement when reporting quantities.
A.SSE.1 Interpret expressions that represent a quantity in terms of its context.
A.SSE.1a Interpret parts of an expression, such as terms, factors, and coefficients. A.SSE.1b Interpret complicated expressions by viewing one or more of their parts as a single entity. A.SSE.3b Complete the square in a quadratic expression to reveal the maximum or minimum value of the function it defines. A.CED.1 Create equations and inequalities in one variable and use them to solve problems. Include equations arising from linear and quadratic functions, and
simple rational and exponential functions. A.CED.3 Represent constraints by equations or inequalities, and by systems of equations and/or inequalities, and interpret solutions as viable or non-viable
options in a modeling context.
A.REI.1 Explain each step in solving a simple equation as following from the equality of numbers asserted at the previous step, starting from the assumption that the original equation has a solution. Construct a viable argument to justify a solution method.
A.REI.4 Solve quadratic equations in one variable. A.REI.4a Use the method of completing the square to transform any quadratic equation in into an equation of the form that has the same
solutions. Derive the quadratic formulas from this form. A.REI.4b Solve quadratic equations by inspection (e.g., for ), taking square roots, completing the square, the quadratic formula and factoring, as
appropriate to the initial form of the equation. Recognize when the quadratic formula gives complex solutions and write them as for real
numbers and .
A.REI.7* Solve a simple system consisting of a linear equation and a quadratic equation in two variables algebraically and graphically. A.REI.11 Explain why the x-coordinates of the points where the graphs of the equations and intersect are the solutions of the equation
; find the solutions approximately, e.g., usimg technology to graph the functions, make tables of values, or find successive
approximations. Include cases where and /or are linear, polynomial, rational, absolute value, exponential, and logarithmic functions.
F.IF.4 For a function that models a relationship between two quantities, interpret key features of graphs and tables in terms of the quantities, and sketch graphs showing key features given a verbal description of the relationship. Key features include: intercepts; intervals where the function is increasing, decreasing, positive, or negative; relative maximums and minimums; symmetries; end behavior; and periodicity.★
F.IF.8 Write a function defined by an expression in different but equivalent forms to reveal and explain different properties of the function.
F.BF.1b Combine standard function types using arithmetic operations. F.LE.1a Prove that linear functions grow by equal differences over equal intervals, and that exponential functions grow by equal factors over equal intervals.
F.LE.2 Construct linear and exponential functions, including arithmetic and geometric sequences, given a graph, a description of a relationship, or two input-output pairs (including reading these from a table).
F.LE.3 Observe using graphs and tables that a quantity increasing exponentially eventually exceeds a quantity increasing linearly, quadratically, or (more
generally) as a polynomial function. S.ID.6a Fit a function to the data; use functions fitted to data to solve problems in the context of the data. Use given functions or choose a function
suggested by the context. Emphasize linear and exponential models. S.ID.6b Informally assess the fit of a function by plotting and analyzing residuals.
Anderson School District Five Page 27 Copyright July 1, 2013
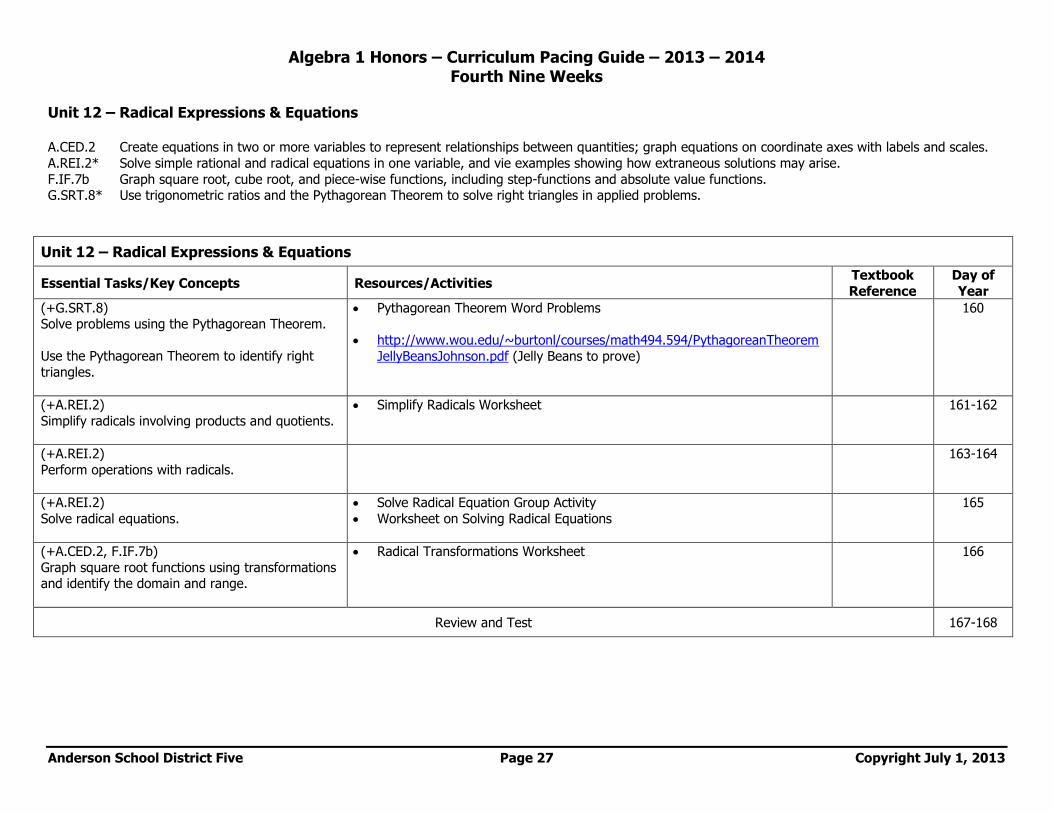
Unit 12 – Radical Expressions & Equations A.CED.2 Create equations in two or more variables to represent relationships between quantities; graph equations on coordinate axes with labels and scales.
A.REI.2* Solve simple rational and radical equations in one variable, and vie examples showing how extraneous solutions may arise.
F.IF.7b Graph square root, cube root, and piece-wise functions, including step-functions and absolute value functions. G.SRT.8* Use trigonometric ratios and the Pythagorean Theorem to solve right triangles in applied problems.
Anderson School District Five Page 28 Copyright July 1, 2013
Unit 13 * - Rational Expressions & Functions
A.APR.6* Rewrite simple rational expressions in different forms; write
in the form
, where and are polynomials with the
degree of less than the degree of , using inspection, long division, or , for the more complicated examples, a computer algebra system.
A.APR.7* Understand that rational expressions form a system analogous to the rational numbers, closed under addition, subtraction, multiplication, and division
by a nonzero rational expression; add, subtract, multiply, and divide rational expressions. A.CED.1 Create equations and inequalities in one variable and use them to solve problems. Include equations arising from linear and quadratic functions, and
simple rational and exponential functions. A.CED.2 Create equations in two or more variables to represent relationships between quantities; graph equations on coordinate axes with labels and scales. A.REI.2* Solve simple rational and radical equations in one variable, and vie examples showing how extraneous solutions may arise.
F.IF.4 For a function that models a relationship between two quantities, interpret key features of graphs and tables in terms of the quantities, and sketch graphs showing key features given a verbal description of the relationship. Key features include: intercepts; intervals where the function is increasing, decreasing, positive, or negative; relative maximums and minimums; symmetries; end behavior; and periodicity.★
F.IF.5 Relate the domain of a function to its graph and, where applicable, to the quantitative relationship it describes.