78
ALGEBRA CONTENT ACADEMY Statistics SOL A.9, A.10, A.11 SOL AII.2, AII.9, AII.10, AII.11, AII.12 February 18, 2015 & March 4, 2015
| Date post: | 21-Dec-2015 |
| Category: |
Documents |
| Upload: | curtis-booth |
| View: | 235 times |
| Download: | 3 times |
ALGEBRA CONTENT ACADEMY
StatisticsSOL A.9, A.10, A.11
SOL AII.2, AII.9, AII.10, AII.11, AII.12
February 18, 2015 & March 4, 2015
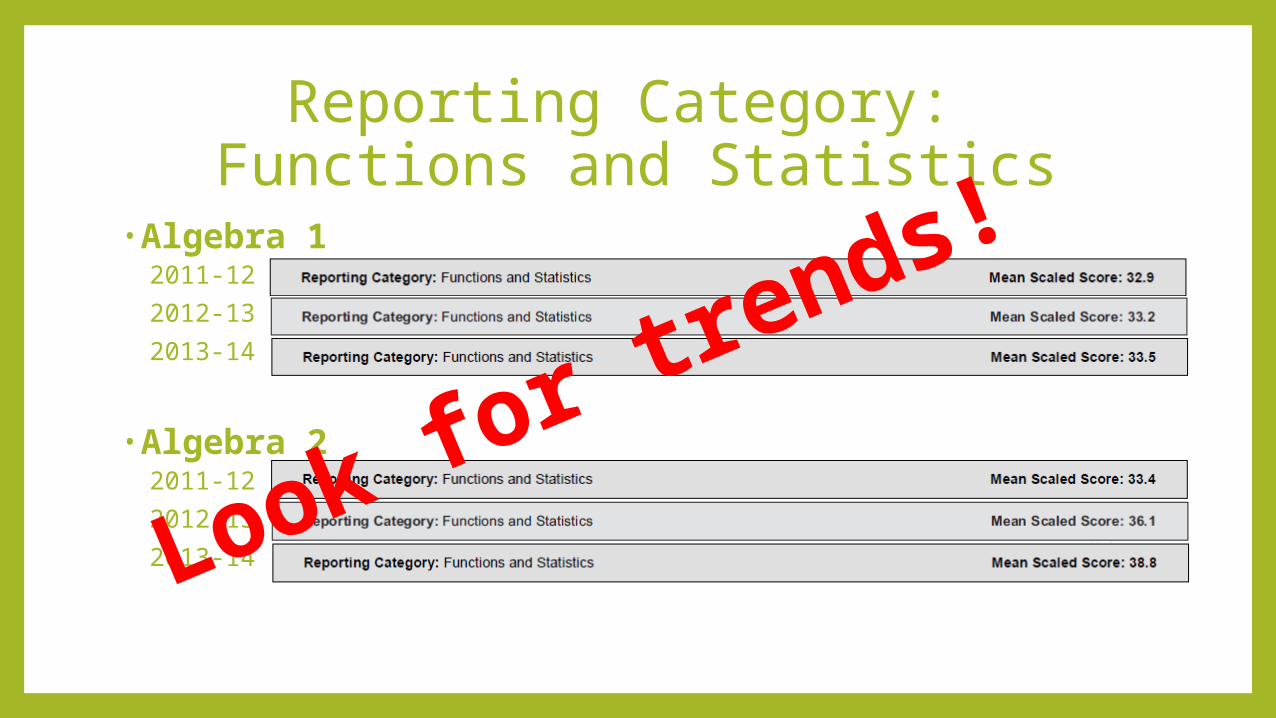
Reporting Category: Functions and Statistics
•Algebra 12011-12
2012-13
2013-14
•Algebra 22011-12
2012-13
2013-14Look for trends!

Curriculum framework
What are th
e
verbs?

Henrico Curriculum Guide• http://blogs.henrico.k12.va.us/math/courses/
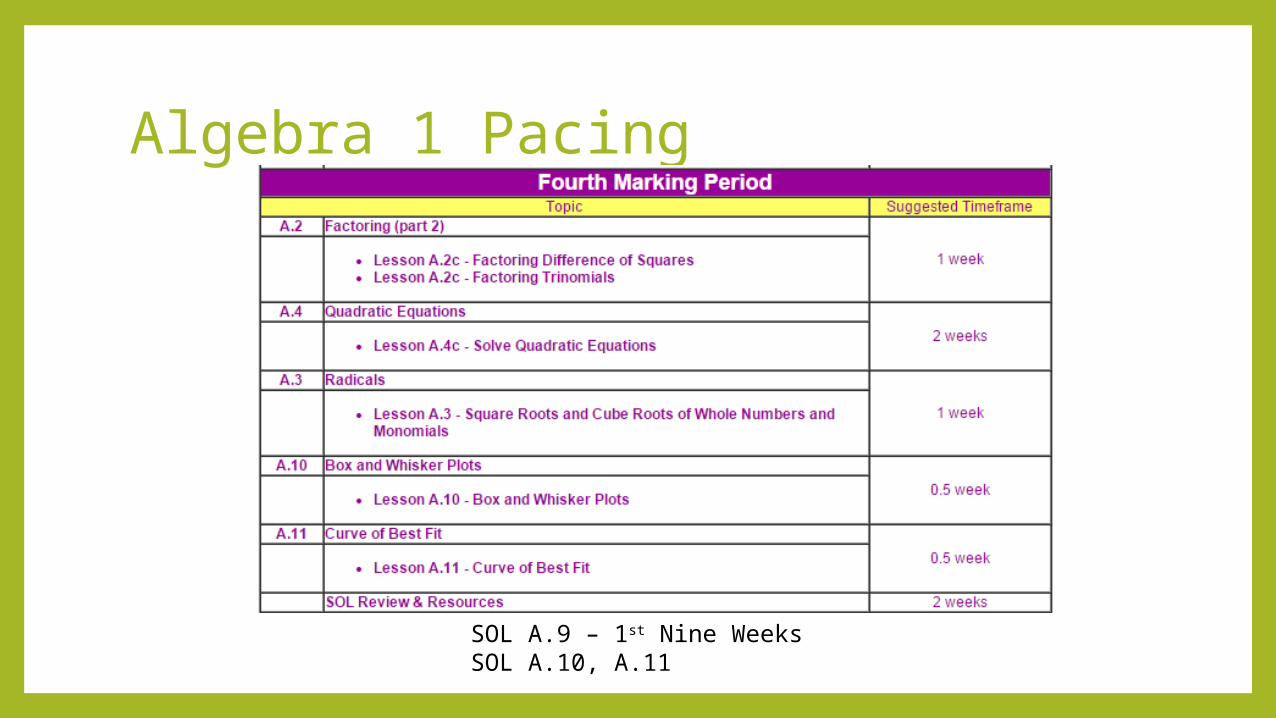
Algebra 1 Pacing
SOL A.9 – 1st Nine WeeksSOL A.10, A.11
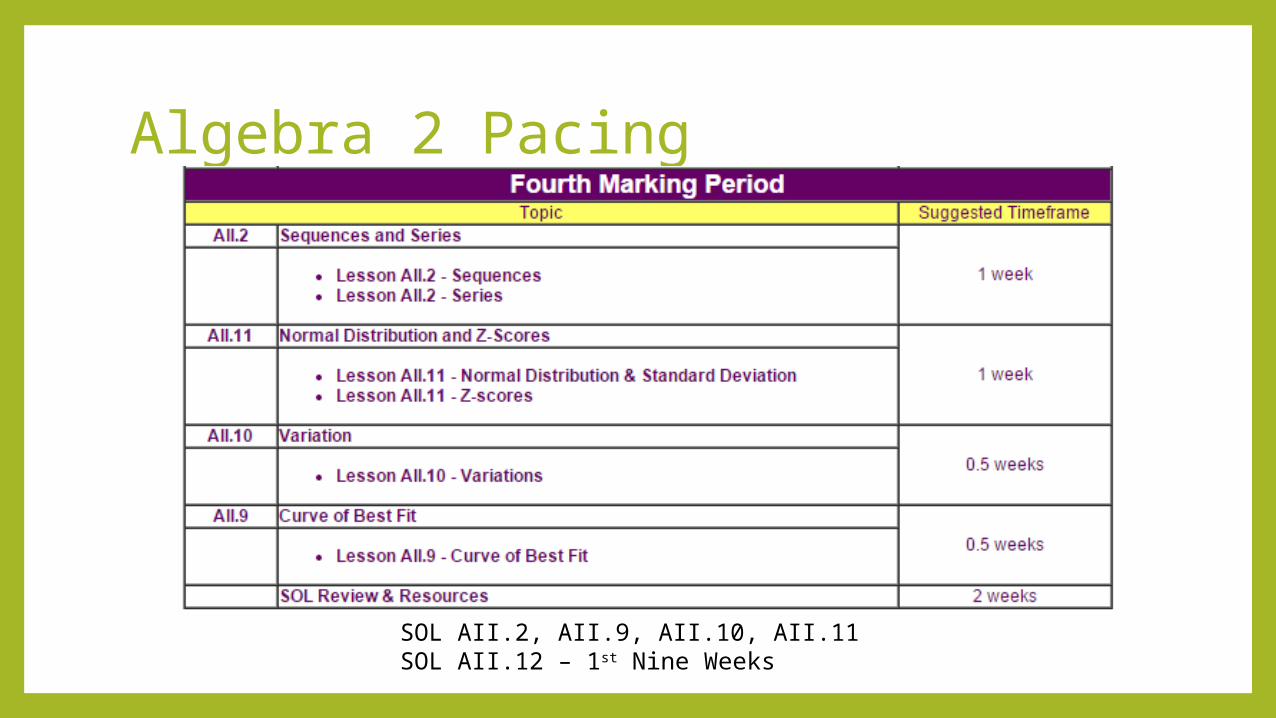
Algebra 2 Pacing
SOL AII.2, AII.9, AII.10, AII.11 SOL AII.12 – 1st Nine Weeks
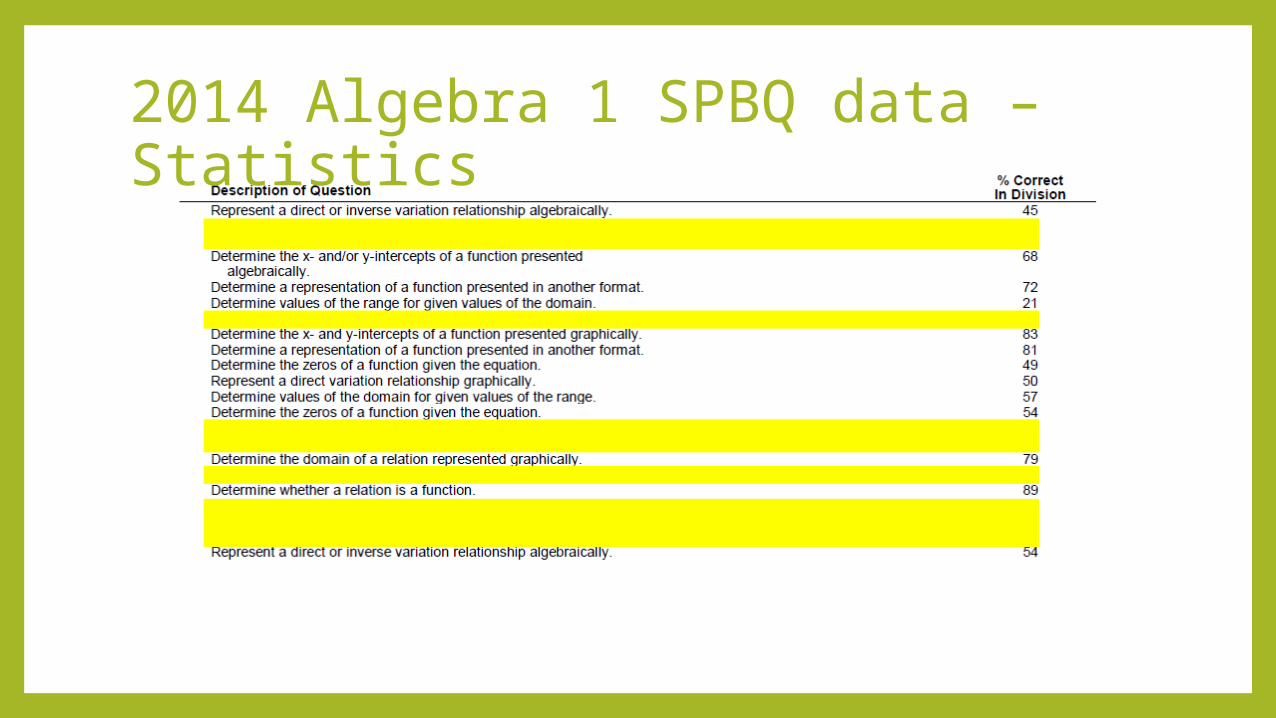
2014 Algebra 1 SPBQ data – Statistics
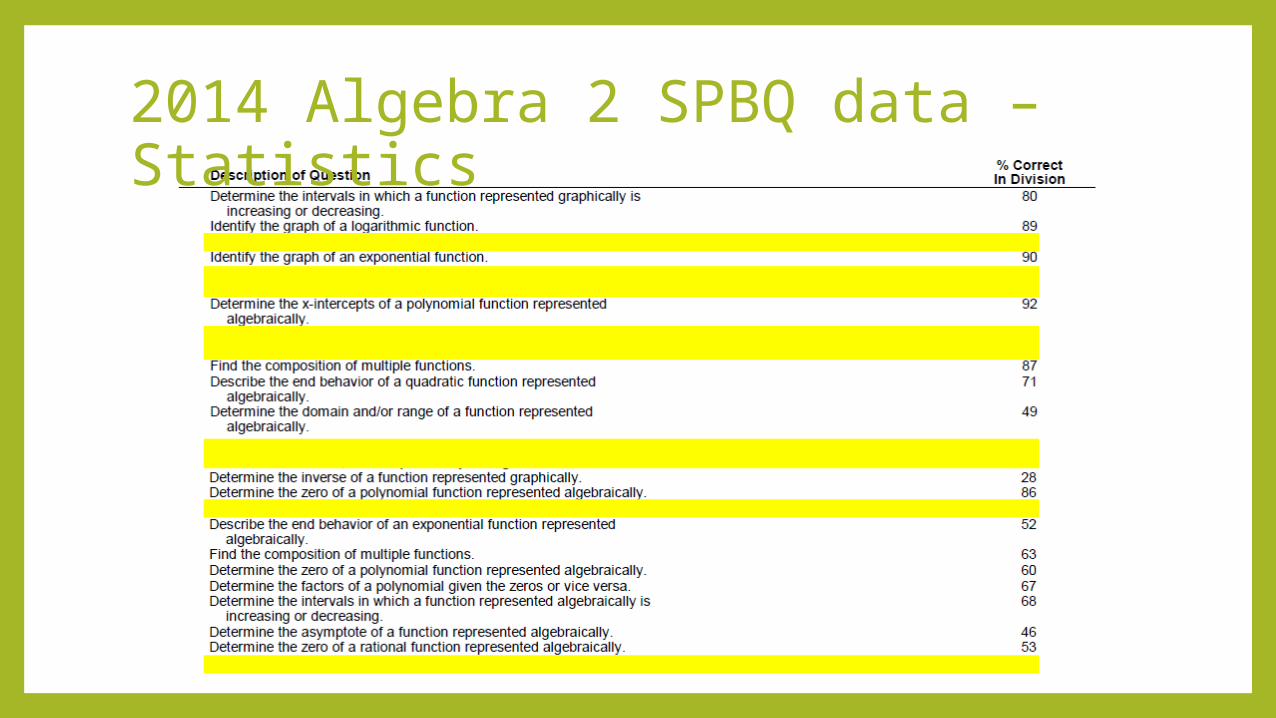
2014 Algebra 2 SPBQ data – Statistics
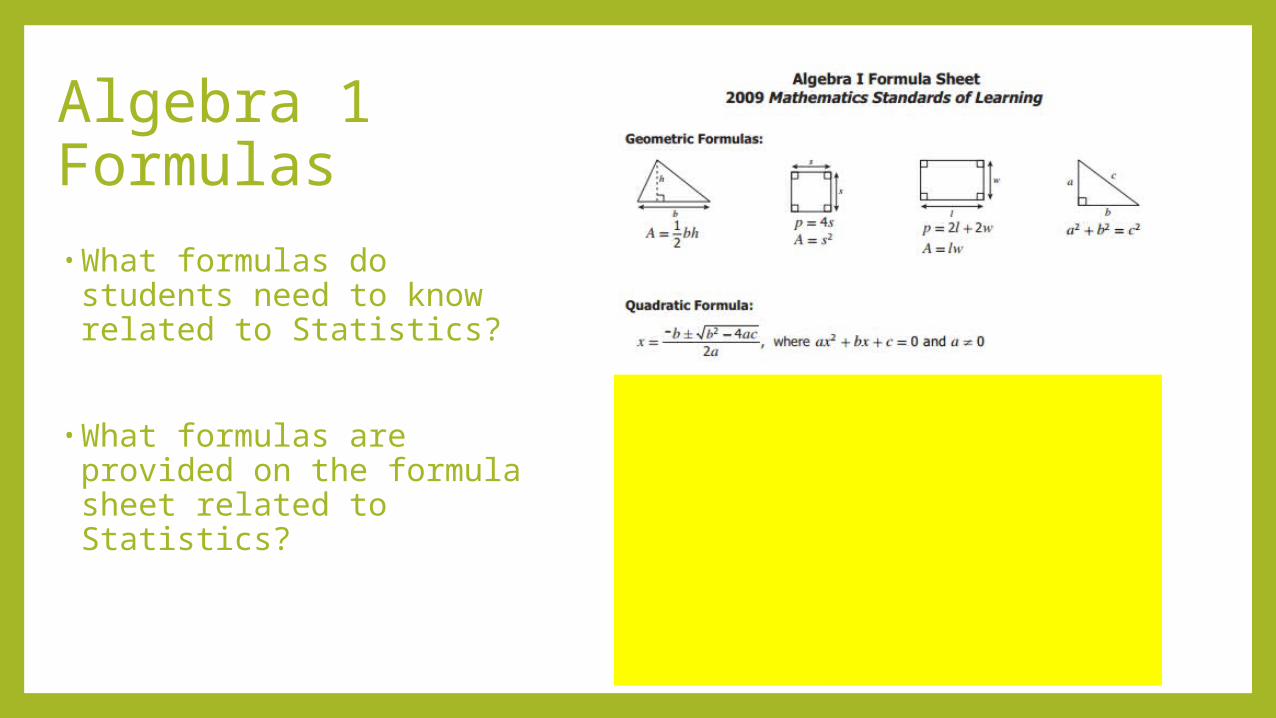
Algebra 1 Formulas•What formulas do students need to know related to Statistics?
•What formulas are provided on the formula sheet related to Statistics?
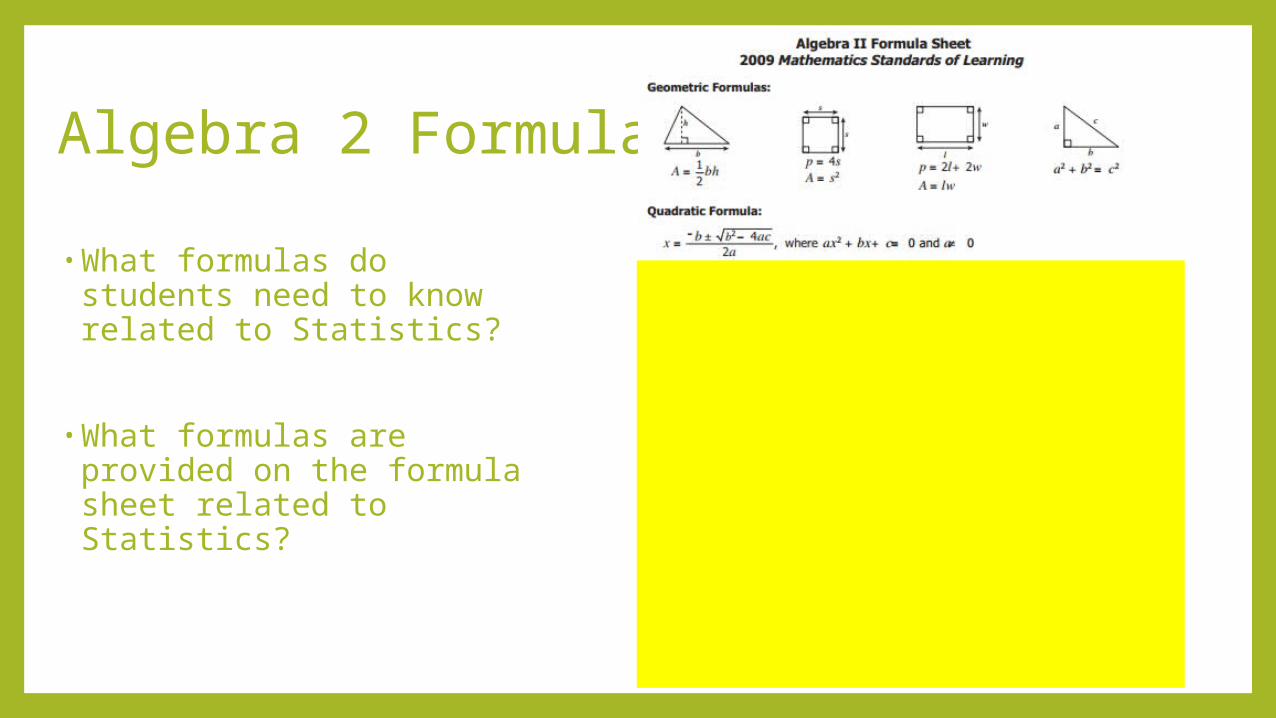
Algebra 2 Formulas
•What formulas do students need to know related to Statistics?
•What formulas are provided on the formula sheet related to Statistics?
STANDARD DEVIATION &
NORMAL CURVEStatistics
SOL A.9
SOL AII.11
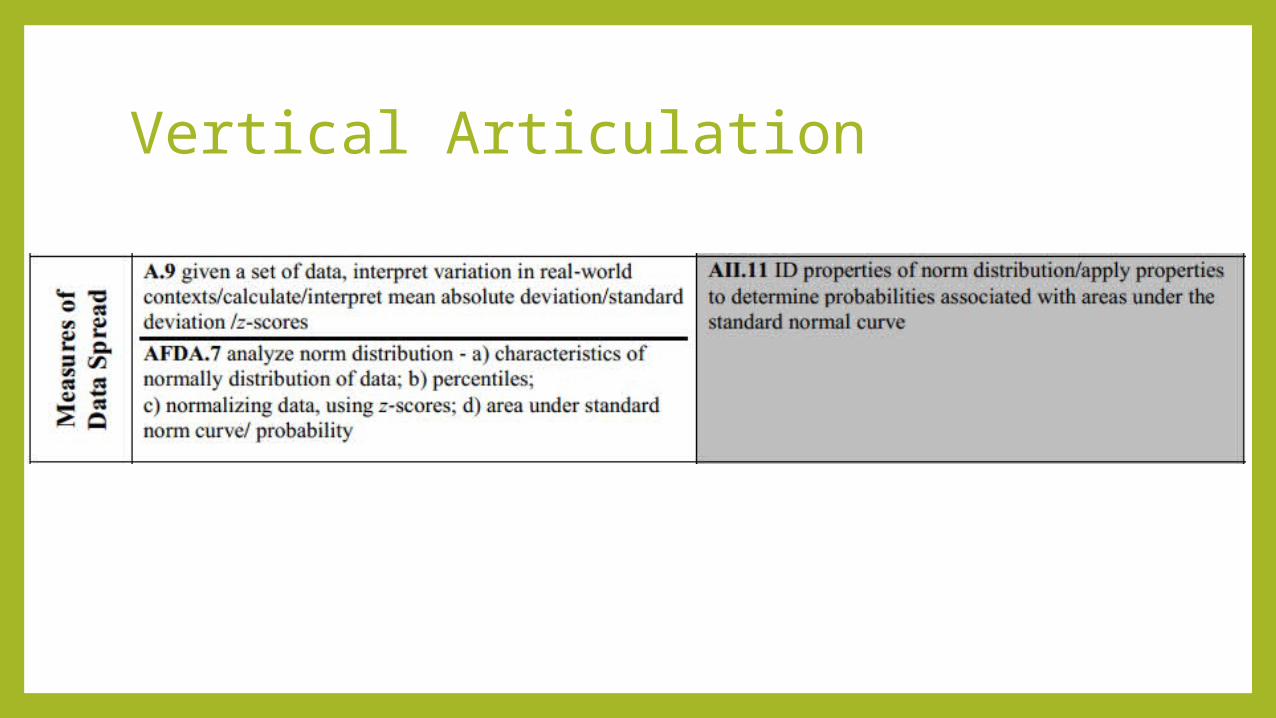
Vertical Articulation
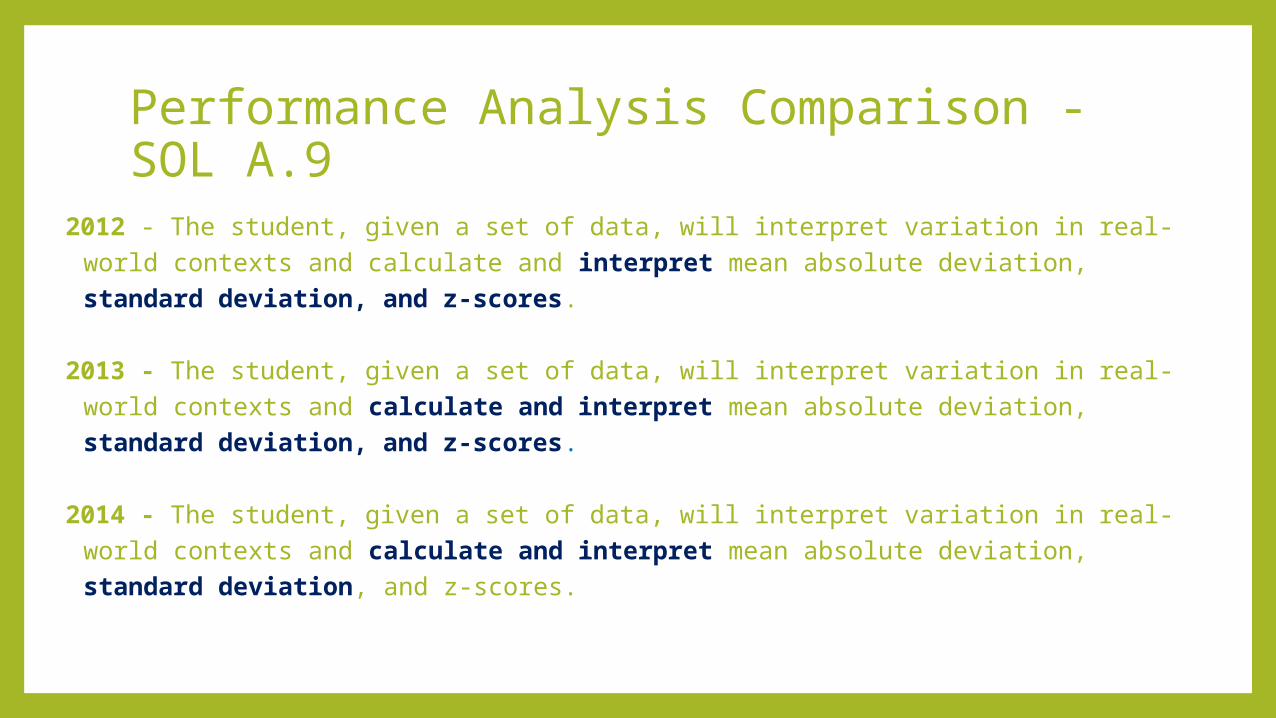
Performance Analysis Comparison - SOL A.9
2012 - The student, given a set of data, will interpret variation in real-world contexts and calculate and interpret mean absolute deviation, standard deviation, and z-scores.
2013 - The student, given a set of data, will interpret variation in real-world contexts and calculate and interpret mean absolute deviation, standard deviation, and z-scores.
2014 - The student, given a set of data, will interpret variation in real-world contexts and calculate and interpret mean absolute deviation, standard deviation, and z-scores.
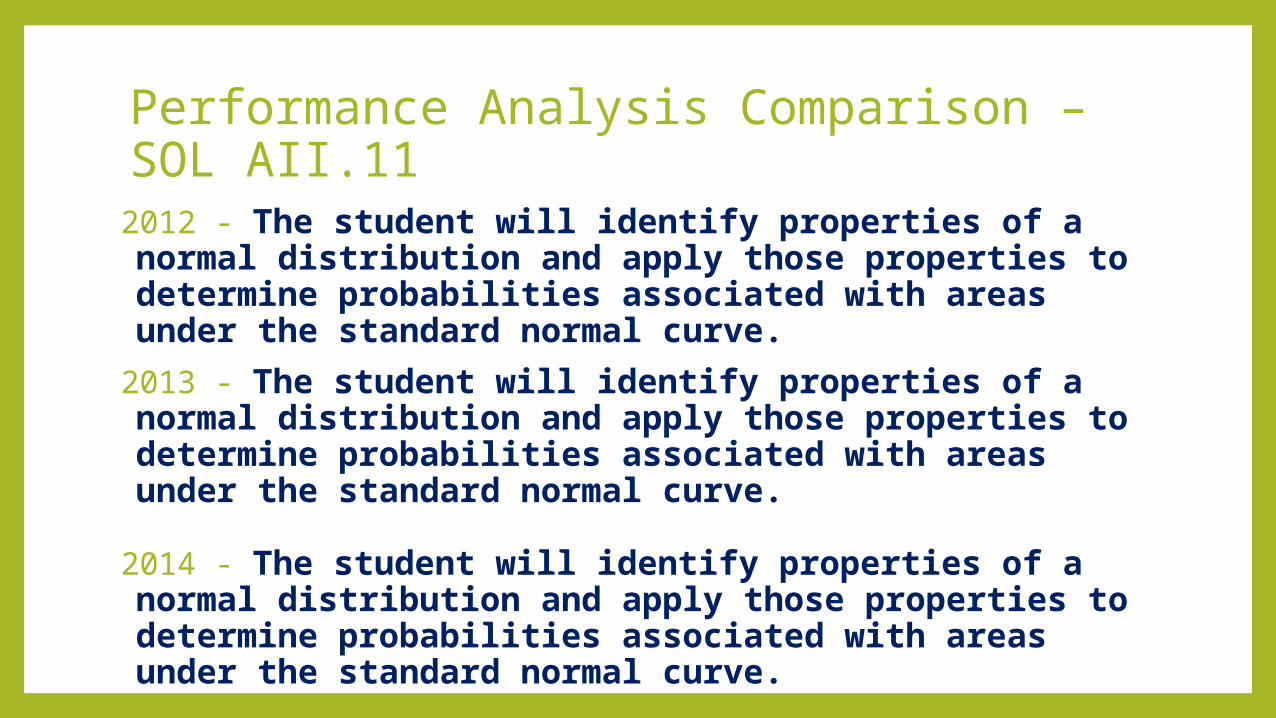
Performance Analysis Comparison – SOL AII.112012 - The student will identify properties of a normal distribution and apply those properties to determine probabilities associated with areas under the standard normal curve.
2013 - The student will identify properties of a normal distribution and apply those properties to determine probabilities associated with areas under the standard normal curve.
2014 - The student will identify properties of a normal distribution and apply those properties to determine probabilities associated with areas under the standard normal curve.
Breakout Sessions
•Work problems from A.9 and AII.11 in small groups.
•Make sure you are able to do the problems on the calculator and know the keystrokes.
ALGEBRA 1 A.9
Standard Deviation and z-score
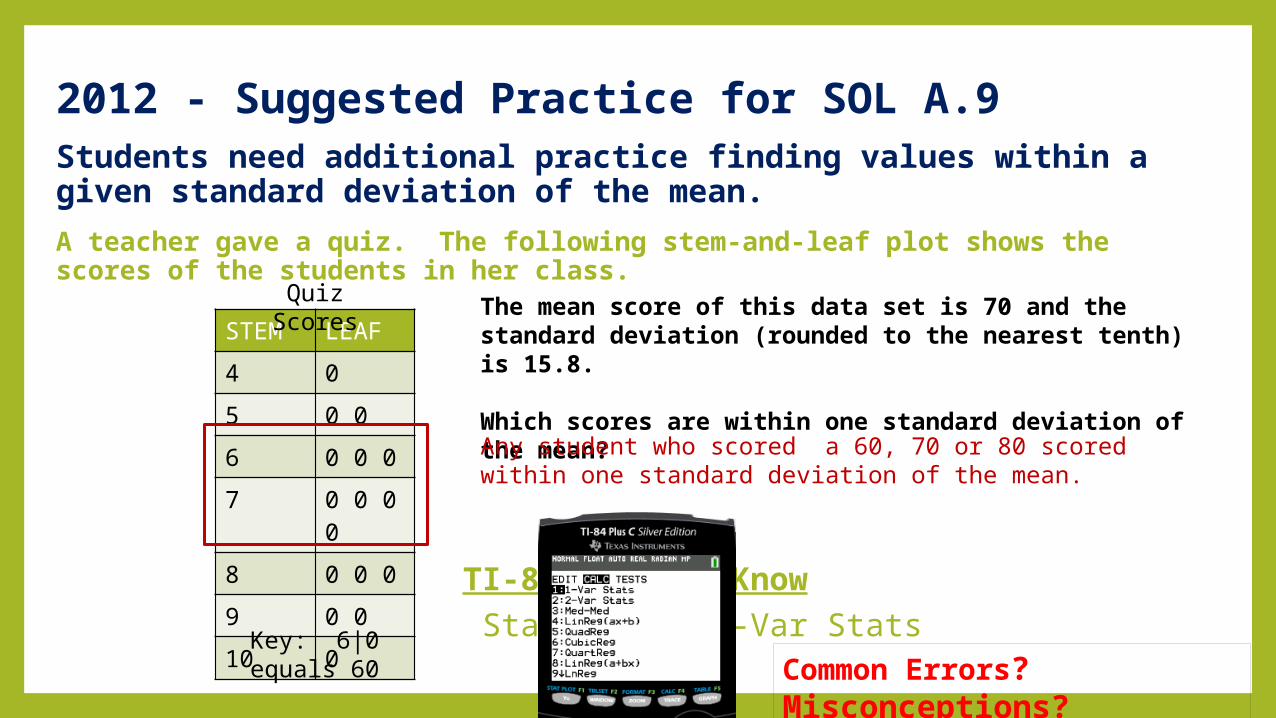
2012 - Suggested Practice for SOL A.9Students need additional practice finding values within a given standard deviation of the mean.
A teacher gave a quiz. The following stem-and-leaf plot shows the scores of the students in her class.
TI-84 Need to Know Stat, Calc, 1-Var Stats
STEM LEAF
4 0
5 0 0
6 0 0 0
7 0 0 0 0
8 0 0 0
9 0 0
10 0
The mean score of this data set is 70 and the standard deviation (rounded to the nearest tenth) is 15.8.
Which scores are within one standard deviation of the mean?Any student who scored a 60, 70 or 80 scored within one standard deviation of the mean.
Key: 6|0 equals 60
Quiz Scores
Common Errors? Misconceptions?
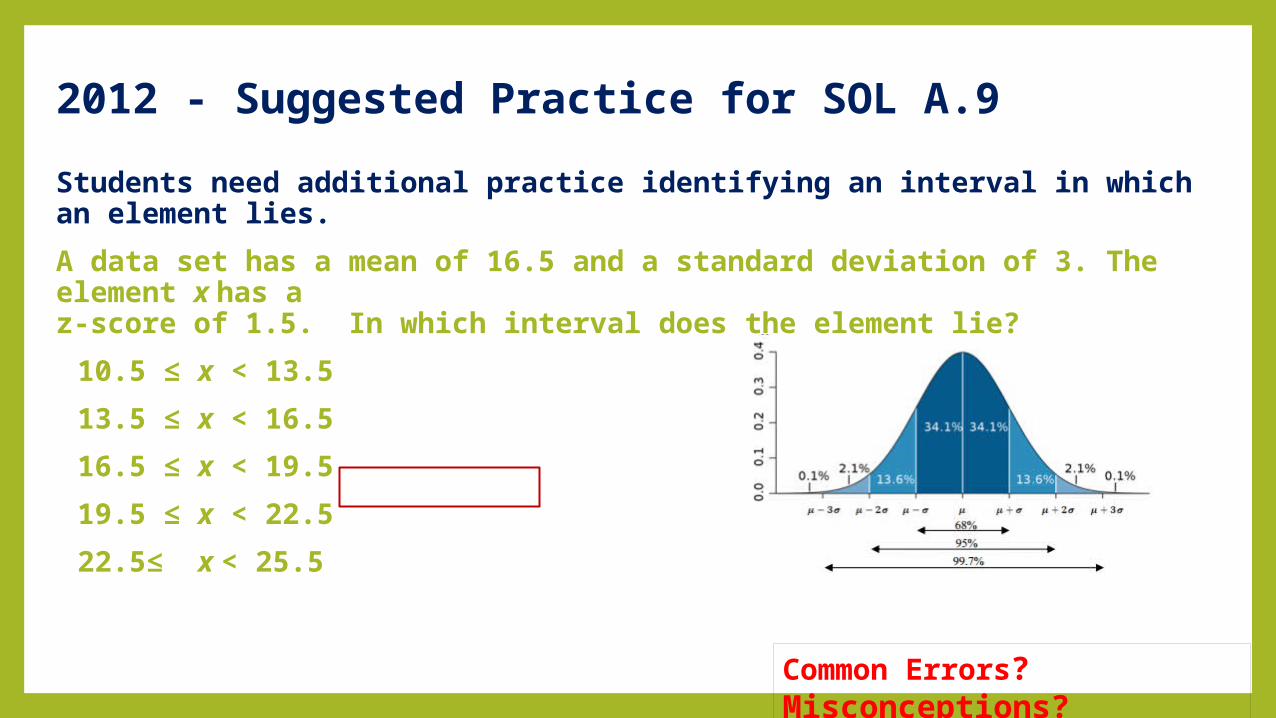
Students need additional practice identifying an interval in which an element lies.
A data set has a mean of 16.5 and a standard deviation of 3. The element x has a z-score of 1.5. In which interval does the element lie?
10.5 ≤ x < 13.5
13.5 ≤ x < 16.5
16.5 ≤ x < 19.5
19.5 ≤ x < 22.5
22.5≤ x < 25.5
2012 - Suggested Practice for SOL A.9
Common Errors? Misconceptions?
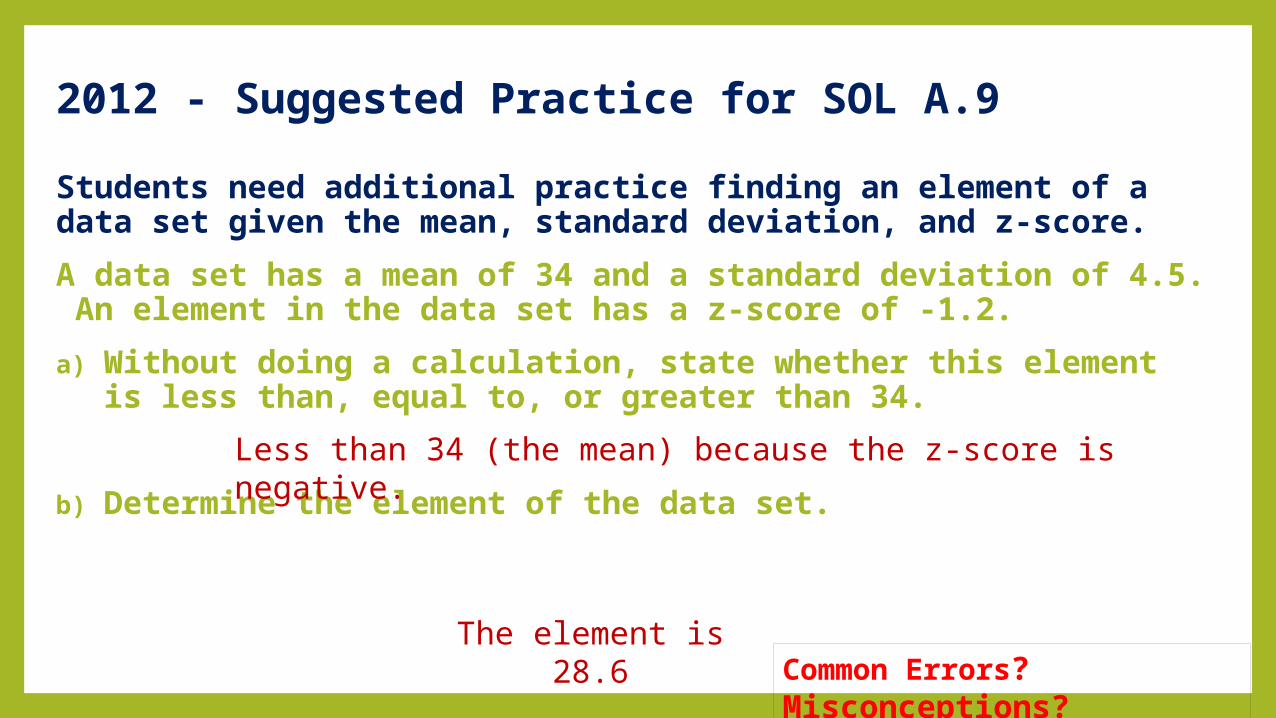
Students need additional practice finding an element of a data set given the mean, standard deviation, and z-score.
A data set has a mean of 34 and a standard deviation of 4.5. An element in the data set has a z-score of -1.2.
a) Without doing a calculation, state whether this element is less than, equal to, or greater than 34.
b) Determine the element of the data set.
Less than 34 (the mean) because the z-score is negative.
The element is 28.6
2012 - Suggested Practice for SOL A.9
Common Errors? Misconceptions?
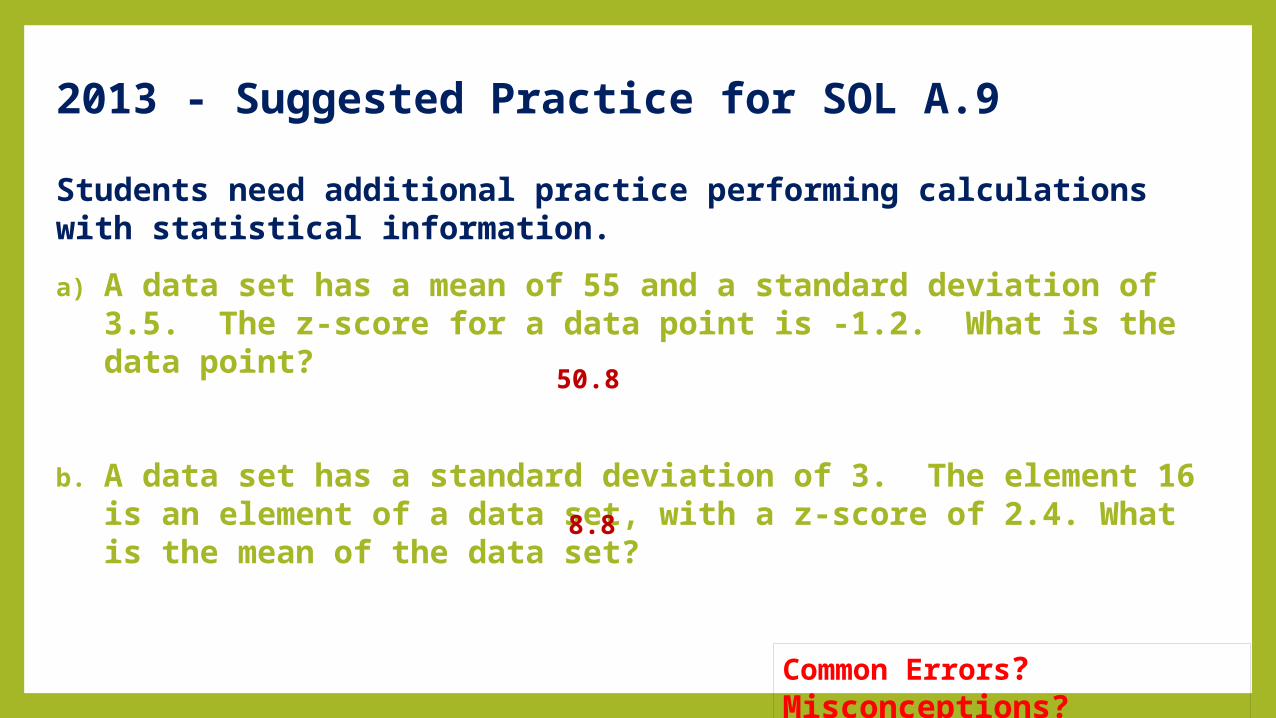
Students need additional practice performing calculations with statistical information.
a) A data set has a mean of 55 and a standard deviation of 3.5. The z-score for a data point is -1.2. What is the data point?
b. A data set has a standard deviation of 3. The element 16 is an element of a data set, with a z-score of 2.4. What is the mean of the data set?
50.8
8.8
2013 - Suggested Practice for SOL A.9
Common Errors? Misconceptions?
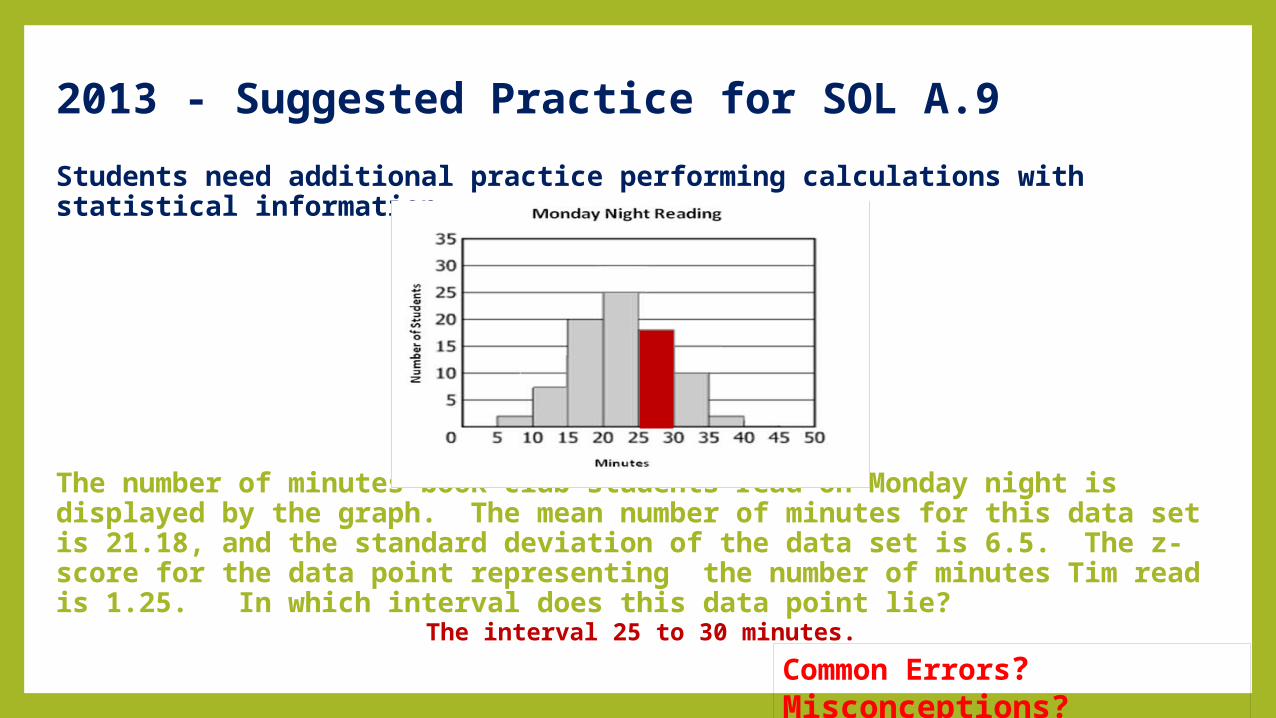
Students need additional practice performing calculations with statistical information.
The number of minutes book club students read on Monday night is displayed by the graph. The mean number of minutes for this data set is 21.18, and the standard deviation of the data set is 6.5. The z-score for the data point representing the number of minutes Tim read is 1.25. In which interval does this data point lie?
Heights of Basketball Team Members
The interval 25 to 30 minutes.
2013 - Suggested Practice for SOL A.9
Common Errors? Misconceptions?
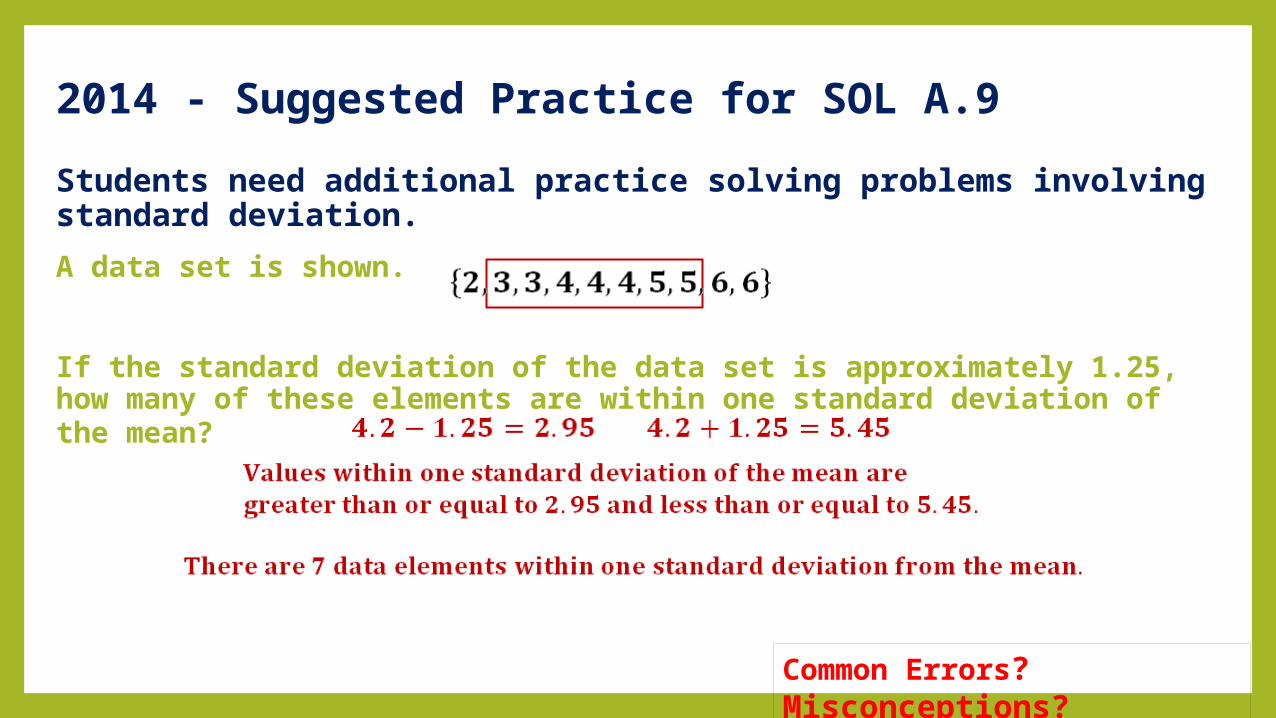
Students need additional practice solving problems involving standard deviation.
A data set is shown.
If the standard deviation of the data set is approximately 1.25, how many of these elements are within one standard deviation of the mean?
2014 - Suggested Practice for SOL A.9
Common Errors? Misconceptions?
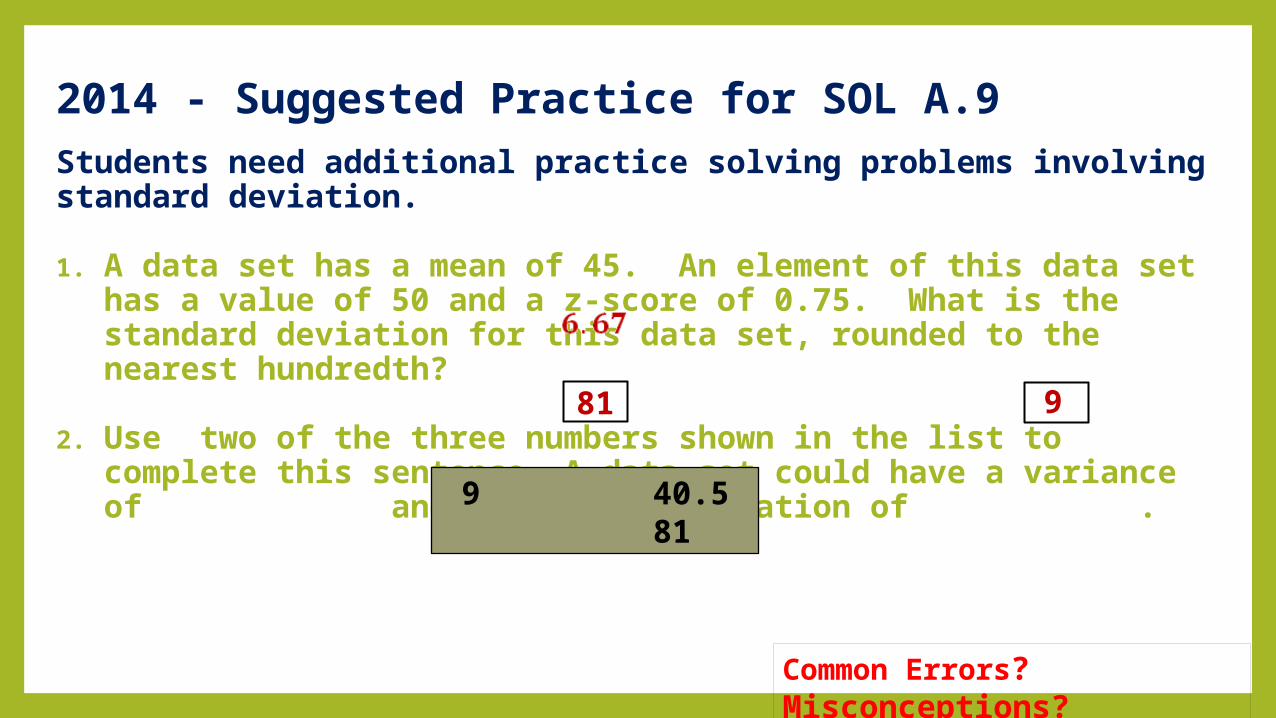
Students need additional practice solving problems involving standard deviation.
1. A data set has a mean of 45. An element of this data set has a value of 50 and a z-score of 0.75. What is the standard deviation for this data set, rounded to the nearest hundredth?
2. Use two of the three numbers shown in the list to complete this sentence. A data set could have a variance of and a standard deviation of .
9 40.5 8181 9
2014 - Suggested Practice for SOL A.9
Common Errors? Misconceptions?
ALGEBRA 2 A.11
Normal Distribution
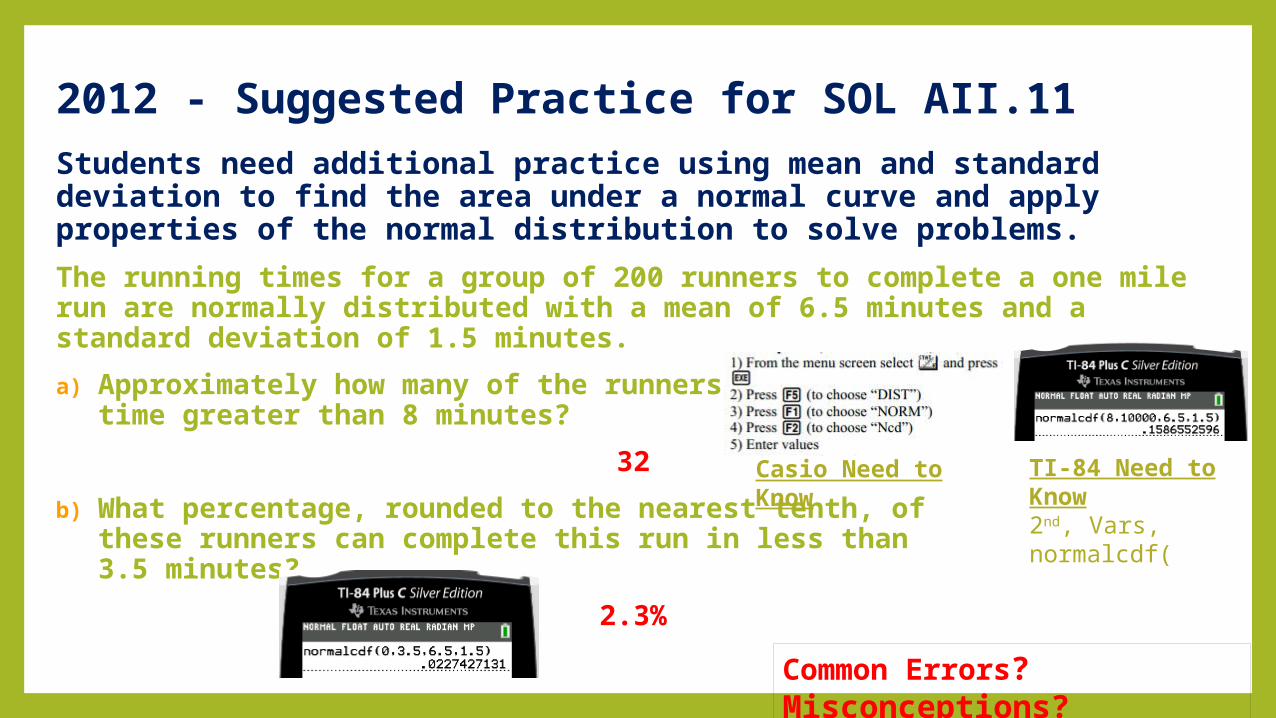
Students need additional practice using mean and standard deviation to find the area under a normal curve and apply properties of the normal distribution to solve problems.
The running times for a group of 200 runners to complete a one mile run are normally distributed with a mean of 6.5 minutes and a standard deviation of 1.5 minutes.
a) Approximately how many of the runners have a time greater than 8 minutes?
32
b) What percentage, rounded to the nearest tenth, of these runners can complete this run in less than 3.5 minutes?
2.3%
2012 - Suggested Practice for SOL AII.11
Common Errors? Misconceptions?
TI-84 Need to Know2nd, Vars, normalcdf(
Casio Need to Know
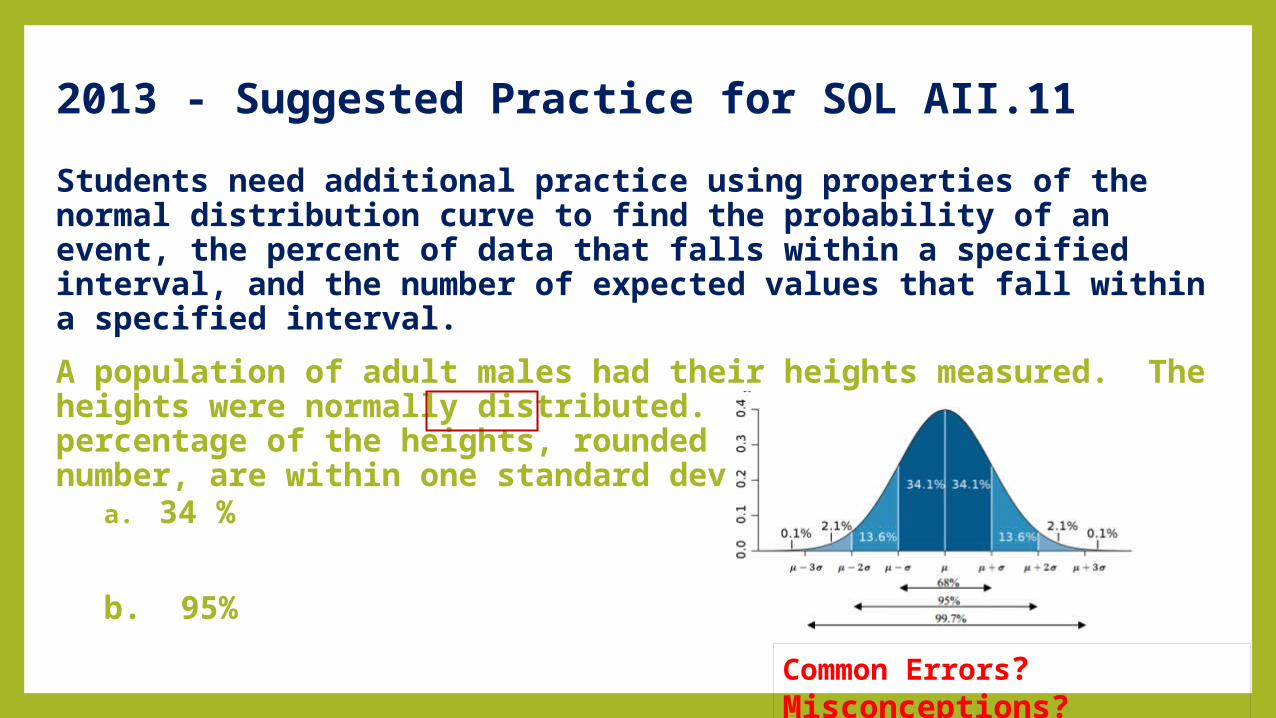
Students need additional practice using properties of the normal distribution curve to find the probability of an event, the percent of data that falls within a specified interval, and the number of expected values that fall within a specified interval.
A population of adult males had their heights measured. The heights were normally distributed. Approximately what percentage of the heights, rounded to the nearest whole number, are within one standard deviation of the mean?
a. 34 % c. 68%
b. 95% d. 99.7%
2013 - Suggested Practice for SOL AII.11
Common Errors? Misconceptions?
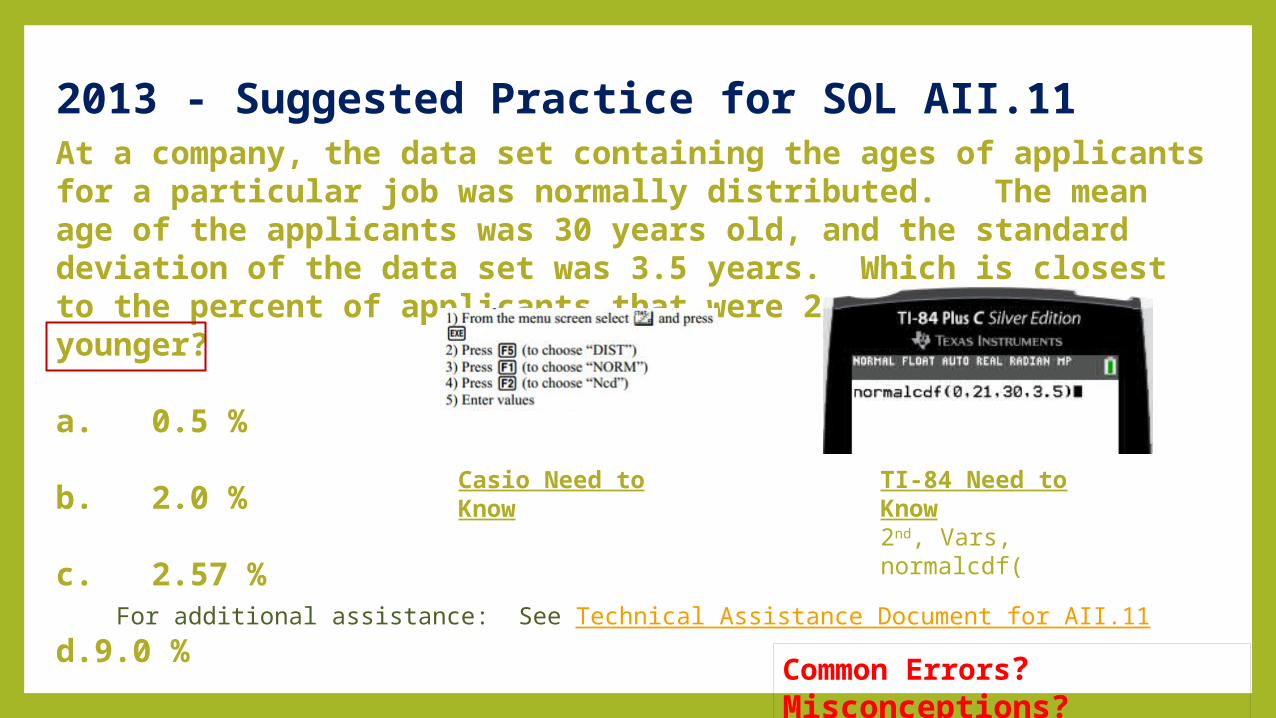
At a company, the data set containing the ages of applicants for a particular job was normally distributed. The mean age of the applicants was 30 years old, and the standard deviation of the data set was 3.5 years. Which is closest to the percent of applicants that were 21 years old or younger?
a. 0.5 %
b. 2.0 %
c. 2.57 %
d.9.0 %
2013 - Suggested Practice for SOL AII.11
Common Errors? Misconceptions?
TI-84 Need to Know2nd, Vars, normalcdf(
For additional assistance: See Technical Assistance Document for AII.11
Casio Need to Know
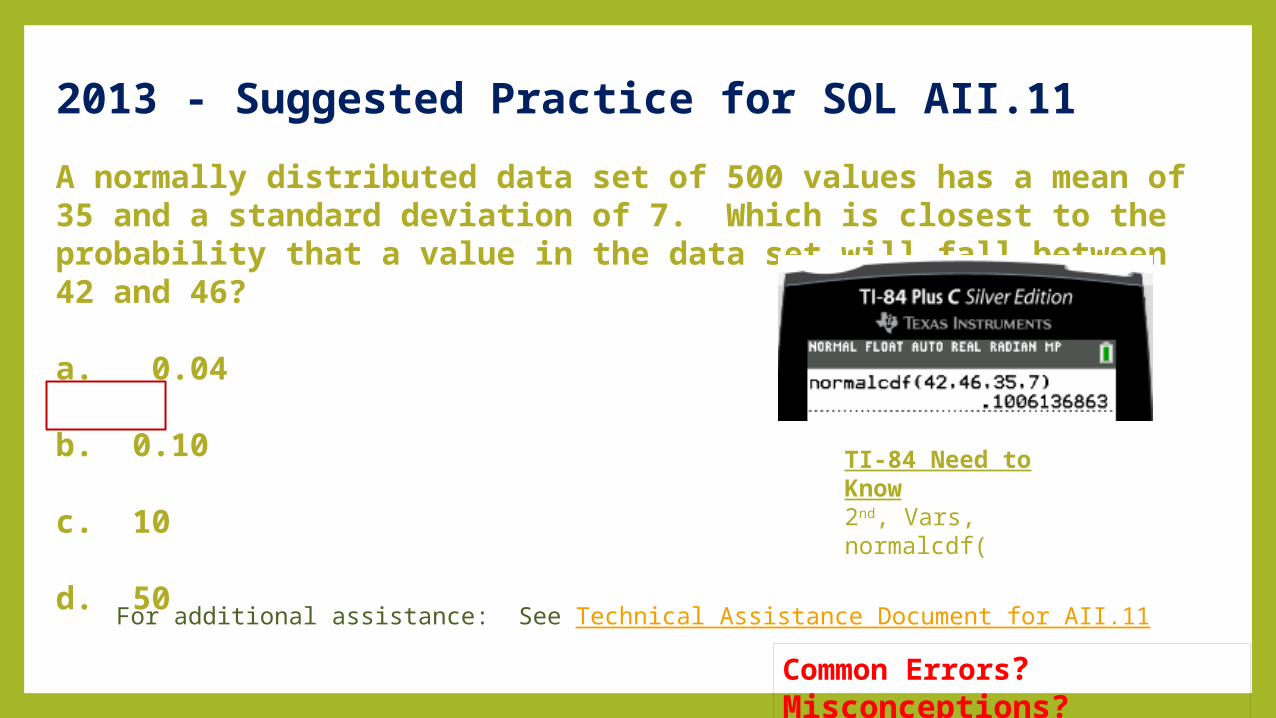
A normally distributed data set of 500 values has a mean of 35 and a standard deviation of 7. Which is closest to the probability that a value in the data set will fall between 42 and 46?
a. 0.04
b. 0.10
c. 10
d. 50
2013 - Suggested Practice for SOL AII.11
Common Errors? Misconceptions?
TI-84 Need to Know2nd, Vars, normalcdf(
For additional assistance: See Technical Assistance Document for AII.11
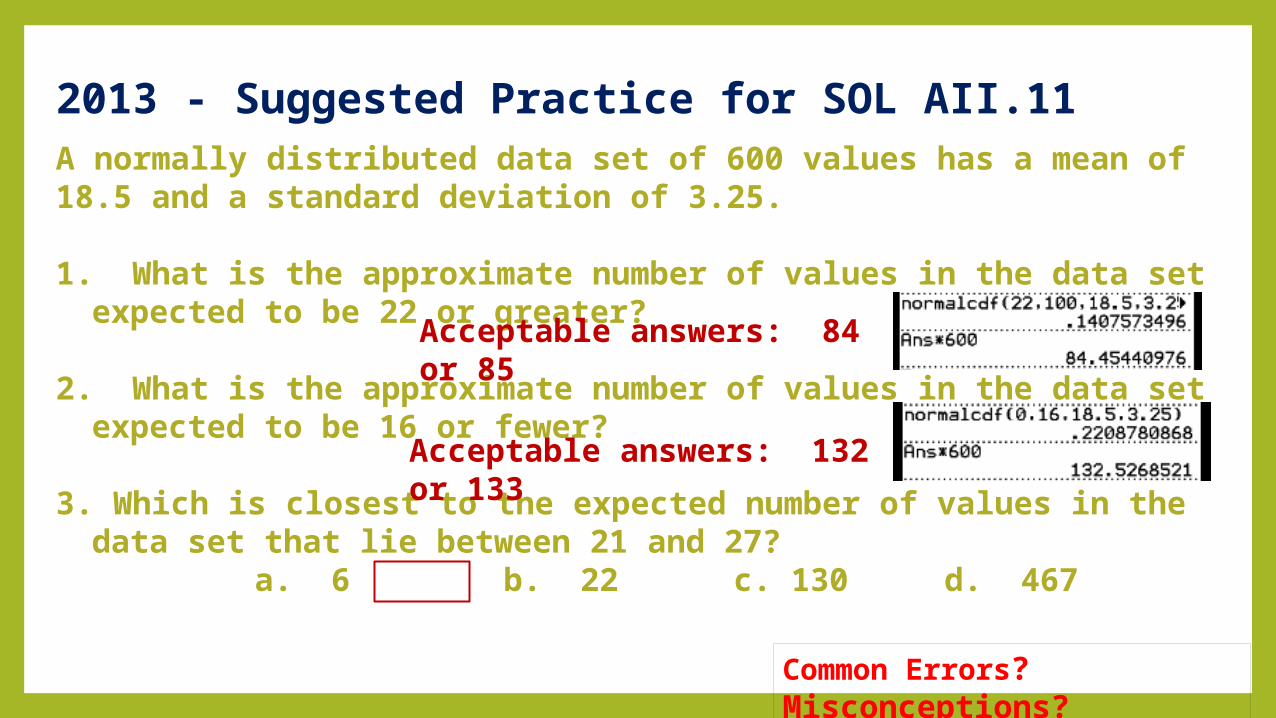
A normally distributed data set of 600 values has a mean of 18.5 and a standard deviation of 3.25.
1. What is the approximate number of values in the data set expected to be 22 or greater?
2. What is the approximate number of values in the data set expected to be 16 or fewer?
3. Which is closest to the expected number of values in the data set that lie between 21 and 27?
a. 6 b. 22 c. 130 d. 467
Acceptable answers: 84 or 85
Acceptable answers: 132 or 133
2013 - Suggested Practice for SOL AII.11
Common Errors? Misconceptions?
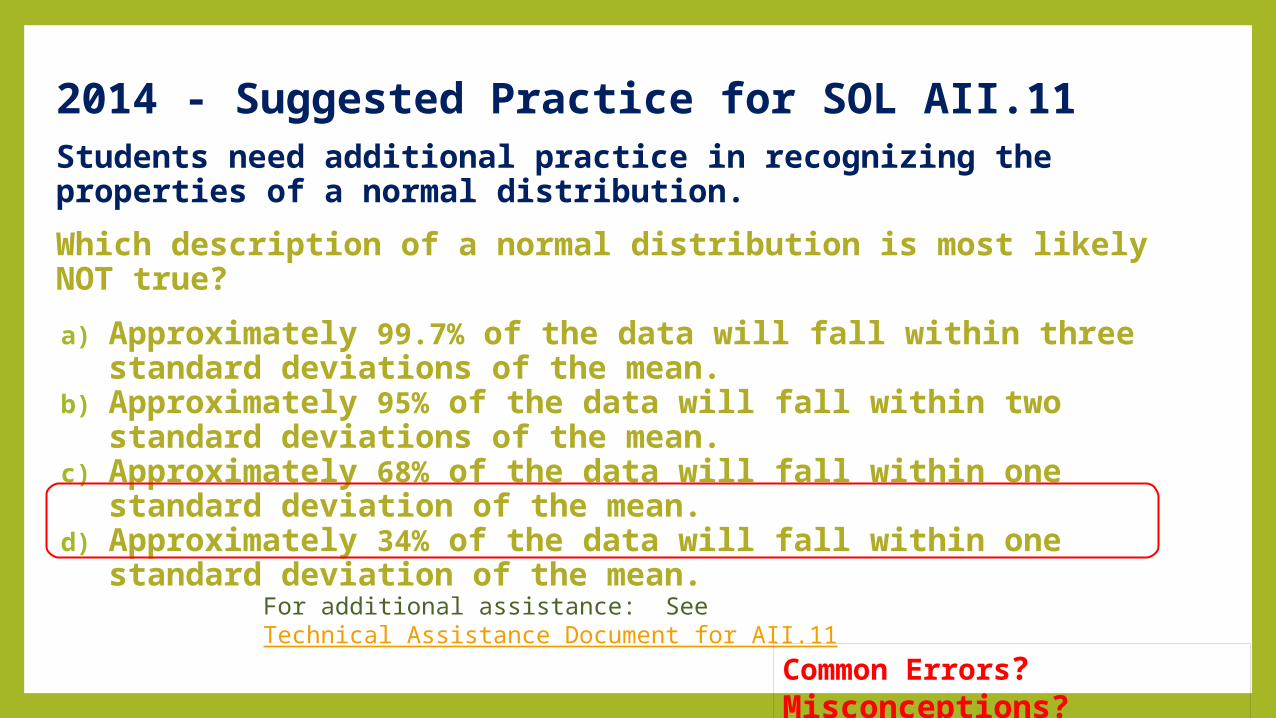
Students need additional practice in recognizing the properties of a normal distribution.
Which description of a normal distribution is most likely NOT true?
a) Approximately 99.7% of the data will fall within three standard deviations of the mean.
b) Approximately 95% of the data will fall within two standard deviations of the mean.
c) Approximately 68% of the data will fall within one standard deviation of the mean.
d) Approximately 34% of the data will fall within one standard deviation of the mean.
For additional assistance: See Technical Assistance Document for AII.11
2014 - Suggested Practice for SOL AII.11
Common Errors? Misconceptions?
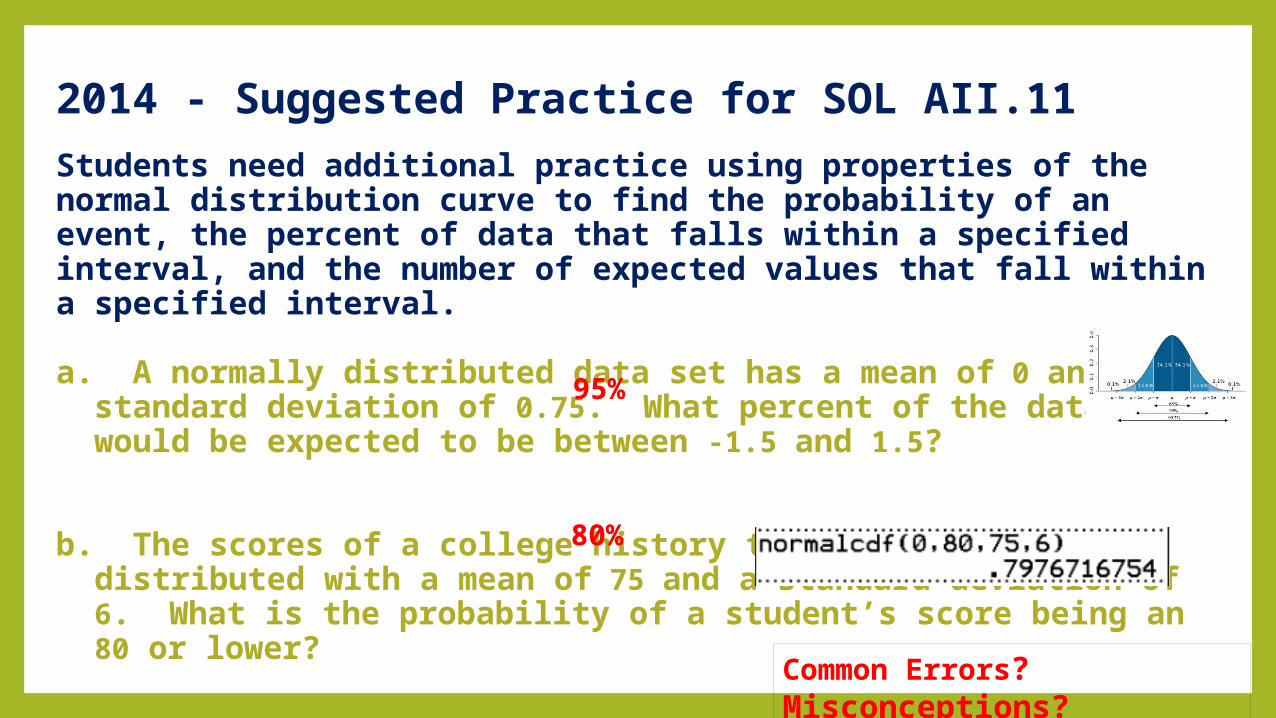
Students need additional practice using properties of the normal distribution curve to find the probability of an event, the percent of data that falls within a specified interval, and the number of expected values that fall within a specified interval.
a. A normally distributed data set has a mean of 0 and a standard deviation of 0.75. What percent of the data would be expected to be between -1.5 and 1.5?
b. The scores of a college history test were normally distributed with a mean of 75 and a standard deviation of 6. What is the probability of a student’s score being an 80 or lower?
95%80%
2014 - Suggested Practice for SOL AII.11
Common Errors? Misconceptions?
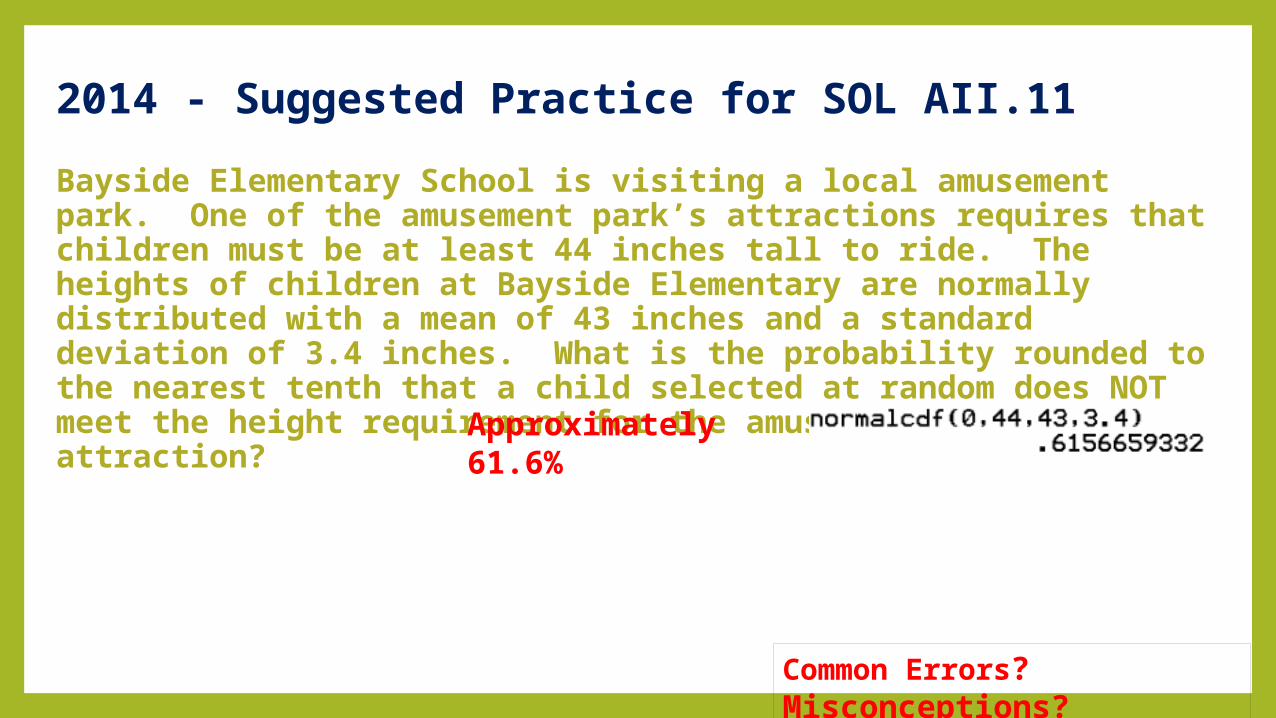
Bayside Elementary School is visiting a local amusement park. One of the amusement park’s attractions requires that children must be at least 44 inches tall to ride. The heights of children at Bayside Elementary are normally distributed with a mean of 43 inches and a standard deviation of 3.4 inches. What is the probability rounded to the nearest tenth that a child selected at random does NOT meet the height requirement for the amusement park attraction?Approximately 61.6%
2014 - Suggested Practice for SOL AII.11
Common Errors? Misconceptions?
CURVE OF BEST FIT
StatisticsSOL A.11
SOL AII.9
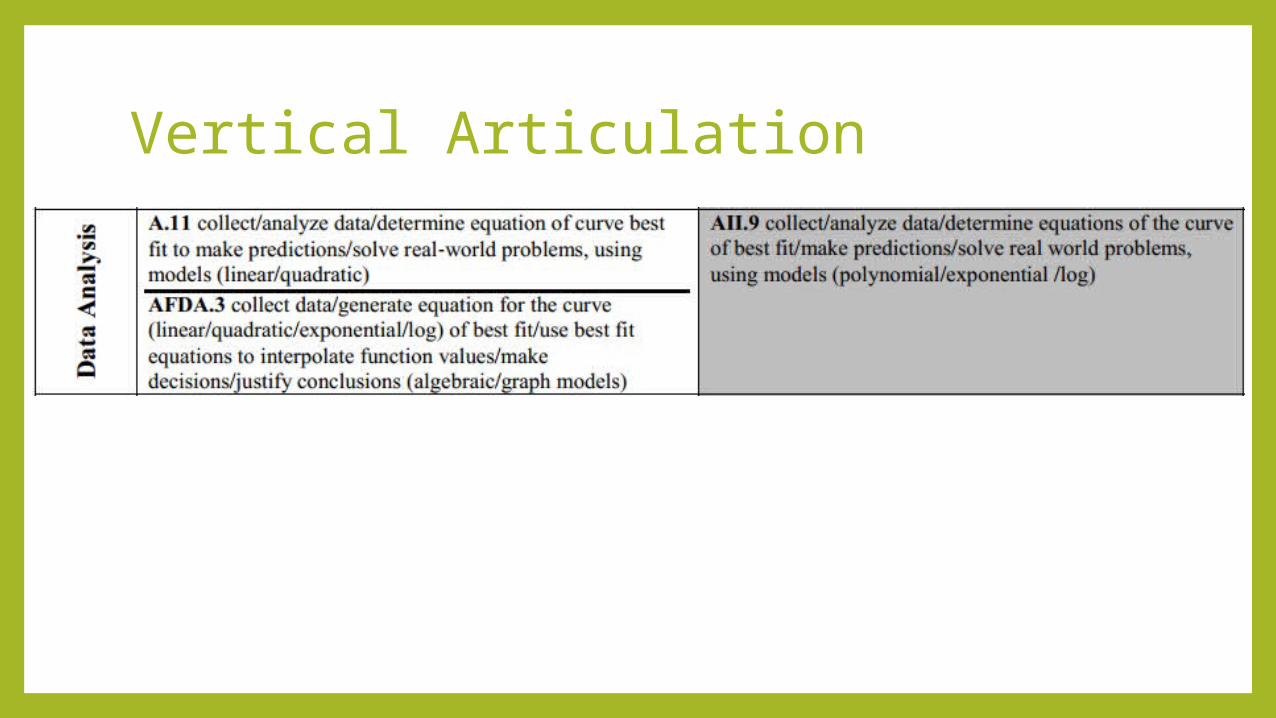
Vertical Articulation
Performance Analysis Comparison - SOL A.11
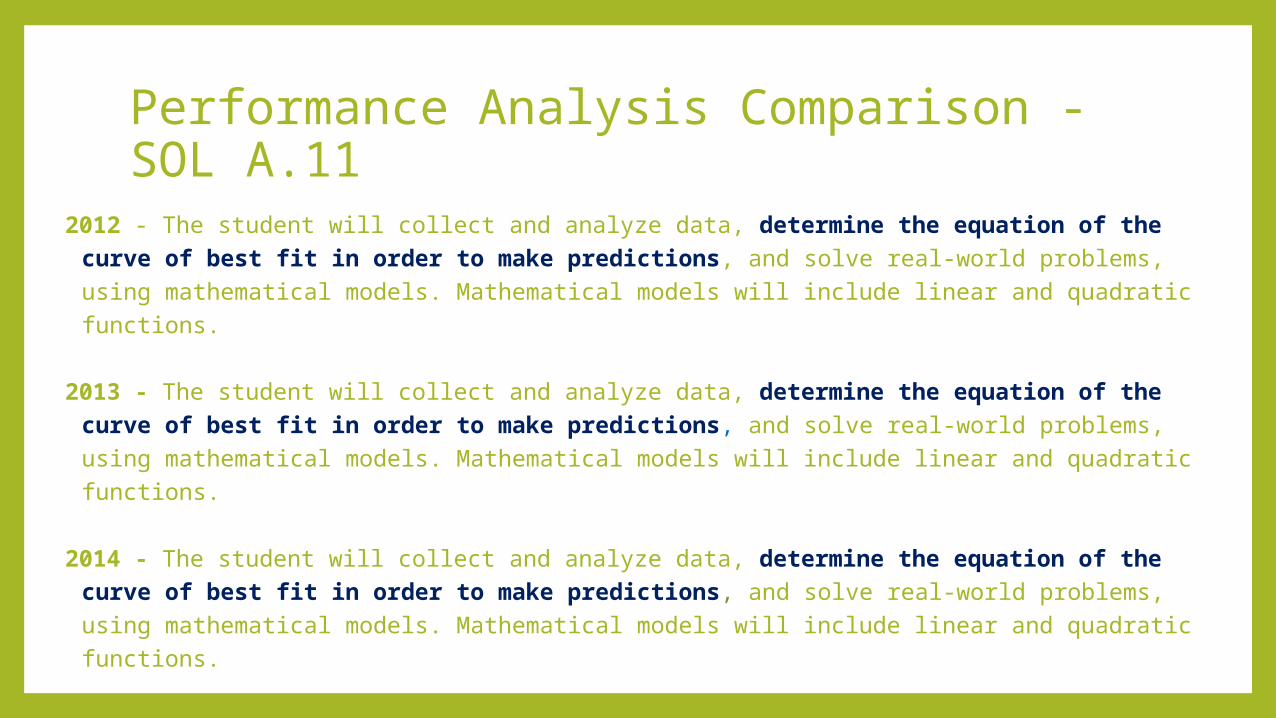
2012 - The student will collect and analyze data, determine the equation of the curve of best fit in order to make predictions, and solve real-world problems, using mathematical models. Mathematical models will include linear and quadratic functions.
2013 - The student will collect and analyze data, determine the equation of the curve of best fit in order to make predictions, and solve real-world problems, using mathematical models. Mathematical models will include linear and quadratic functions.
2014 - The student will collect and analyze data, determine the equation of the curve of best fit in order to make predictions, and solve real-world problems, using mathematical models. Mathematical models will include linear and quadratic functions.
Performance Analysis Comparison – SOL AII.9
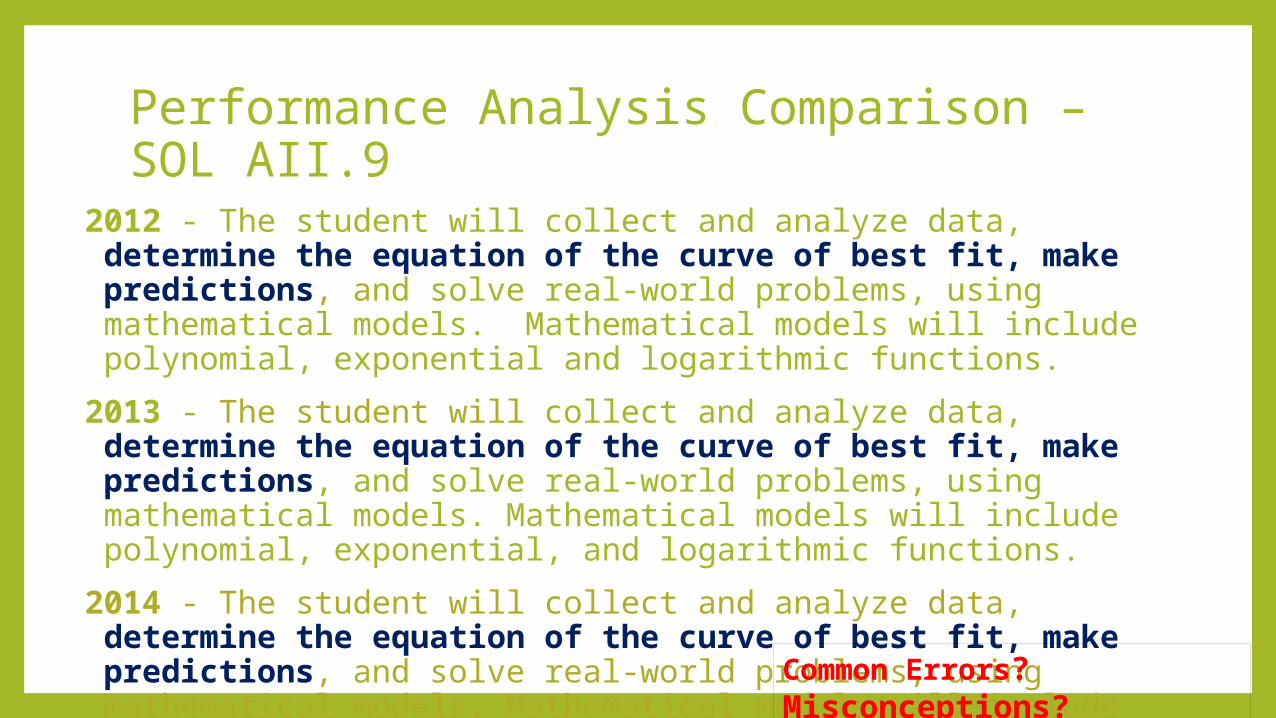
2012 - The student will collect and analyze data, determine the equation of the curve of best fit, make predictions, and solve real-world problems, using mathematical models. Mathematical models will include polynomial, exponential and logarithmic functions.
2013 - The student will collect and analyze data, determine the equation of the curve of best fit, make predictions, and solve real-world problems, using mathematical models. Mathematical models will include polynomial, exponential, and logarithmic functions.
2014 - The student will collect and analyze data, determine the equation of the curve of best fit, make predictions, and solve real-world problems, using mathematical models. Mathematical models will include polynomial, exponential, and logarithmic functions.
Common Errors? Misconceptions?

Breakout Sessions
•Work problems from A.11 and AII.9 in small groups.
•Make sure you are able to do the problems on the calculator and know the keystrokes.

ALGEBRA 1 A.11
Curve of Best Fit
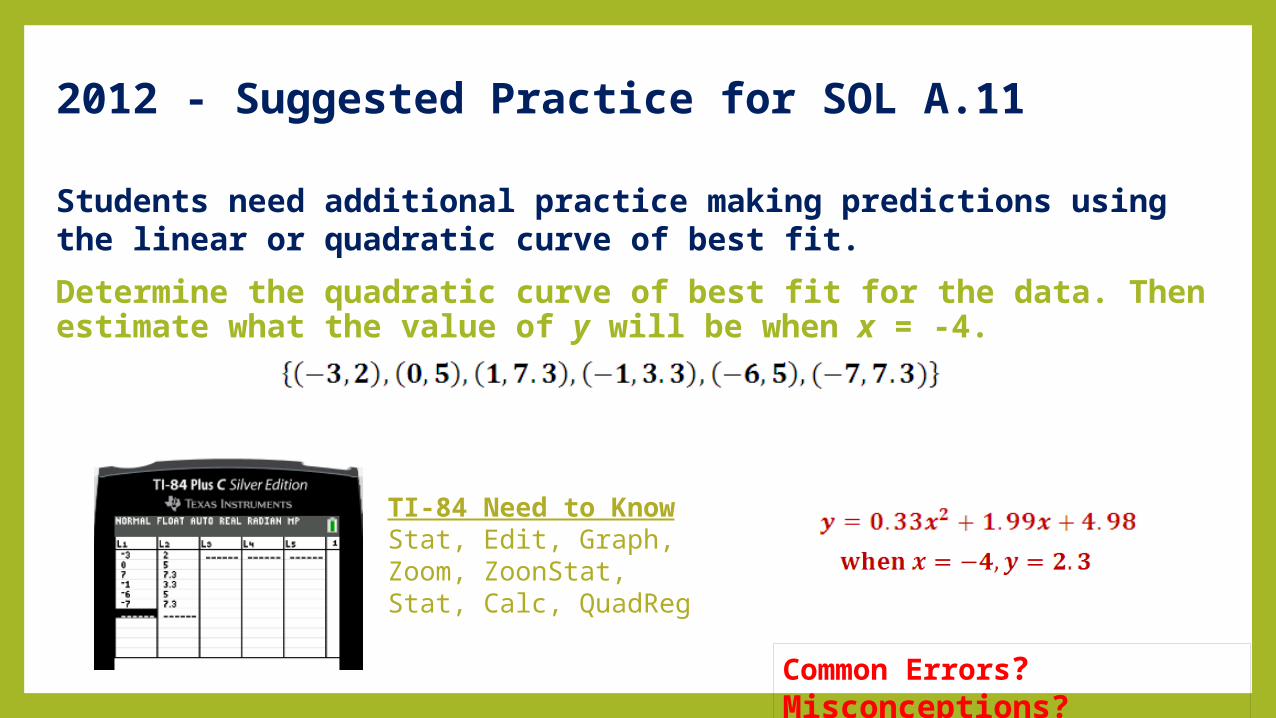
Students need additional practice making predictions using the linear or quadratic curve of best fit.
Determine the quadratic curve of best fit for the data. Then estimate what the value of y will be when x = -4.
2012 - Suggested Practice for SOL A.11
Common Errors? Misconceptions?
TI-84 Need to KnowStat, Edit, Graph, Zoom, ZoonStat, Stat, Calc, QuadReg
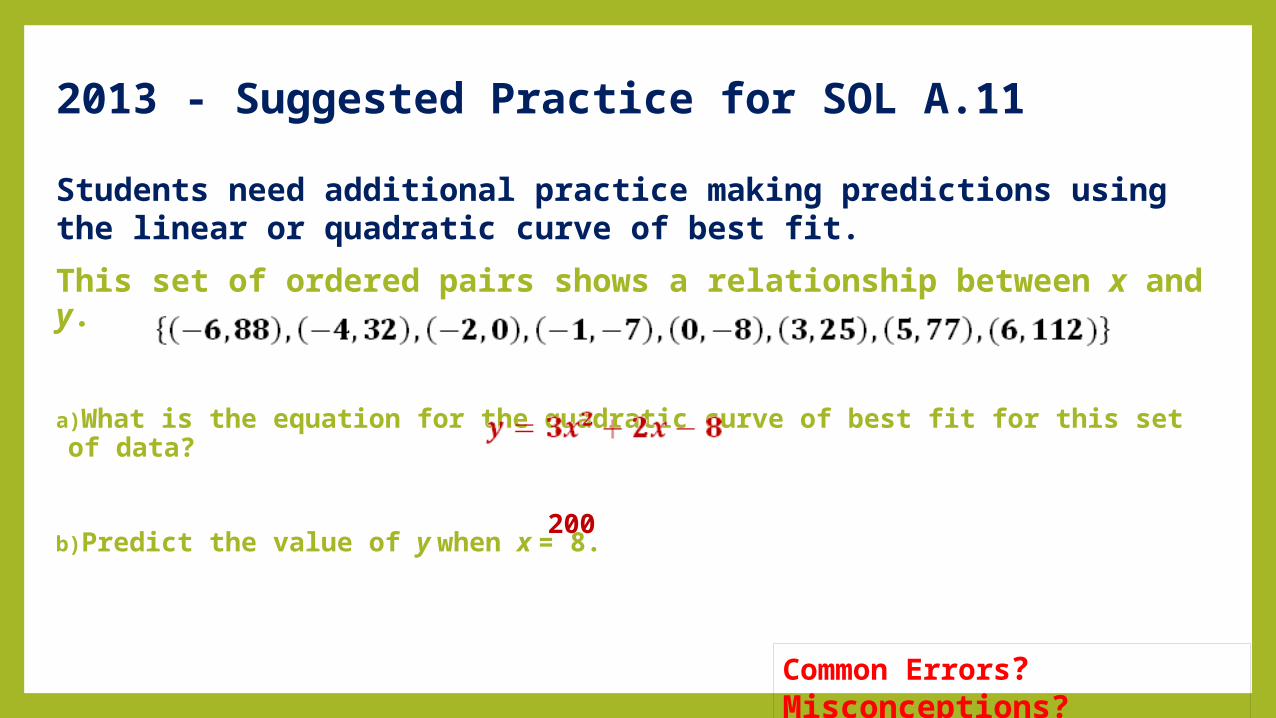
Students need additional practice making predictions using the linear or quadratic curve of best fit.
This set of ordered pairs shows a relationship between x and y.
a)What is the equation for the quadratic curve of best fit for this set of data?
b)Predict the value of y when x = 8.
200
2013 - Suggested Practice for SOL A.11
Common Errors? Misconceptions?
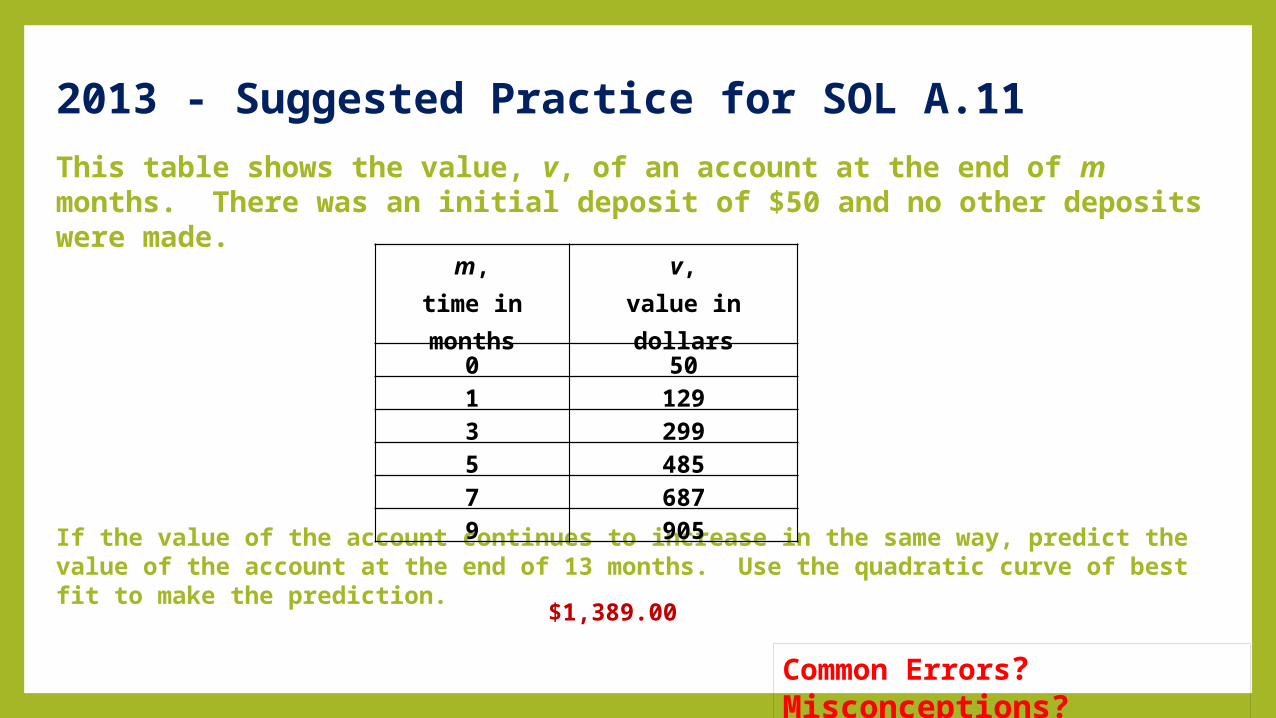
This table shows the value, v, of an account at the end of m months. There was an initial deposit of $50 and no other deposits were made.
If the value of the account continues to increase in the same way, predict the value of the account at the end of 13 months. Use the quadratic curve of best fit to make the prediction.
m,time in months
v,value in dollars
0 501 1293 2995 4857 6879 905
$1,389.00
2013 - Suggested Practice for SOL A.11
Common Errors? Misconceptions?
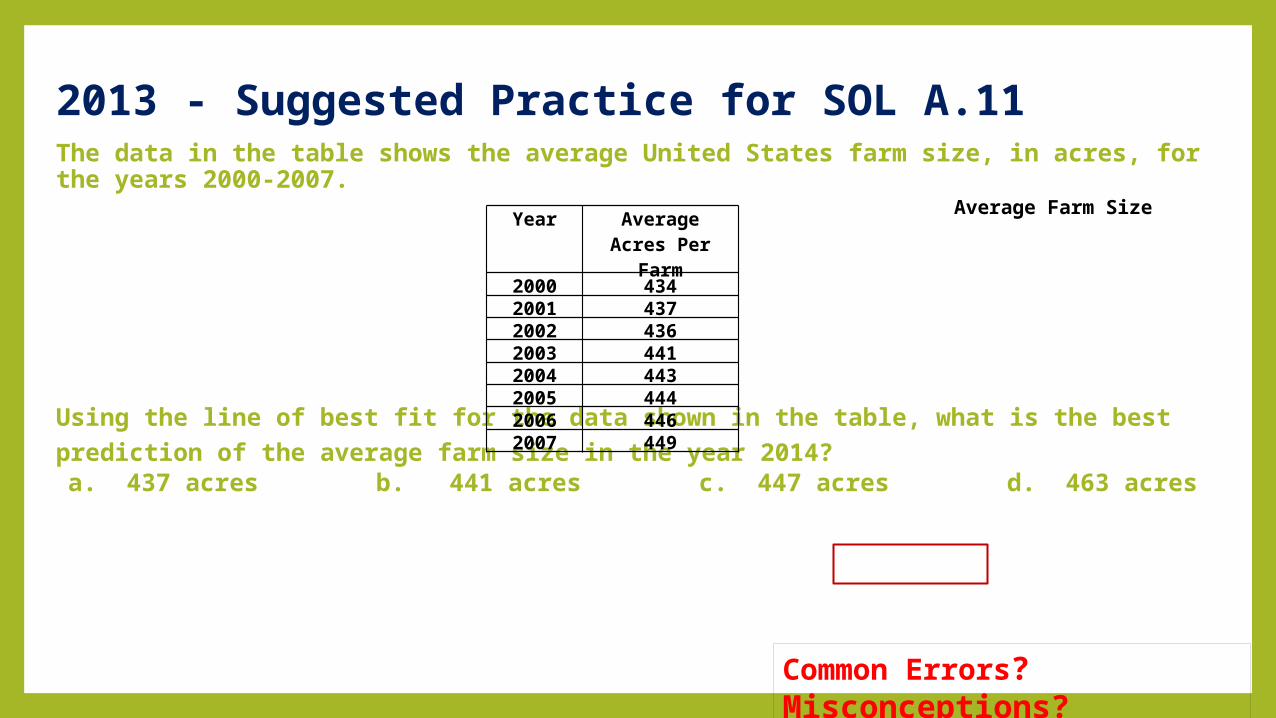
The data in the table shows the average United States farm size, in acres, for the years 2000-2007. Average Farm Size
Using the line of best fit for the data shown in the table, what is the best prediction of the average farm size in the year 2014?
a. 437 acres b. 441 acres c. 447 acres d. 463 acres
Year Average Acres Per Farm
2000 4342001 4372002 4362003 4412004 4432005 4442006 4462007 449
2013 - Suggested Practice for SOL A.11
Common Errors? Misconceptions?
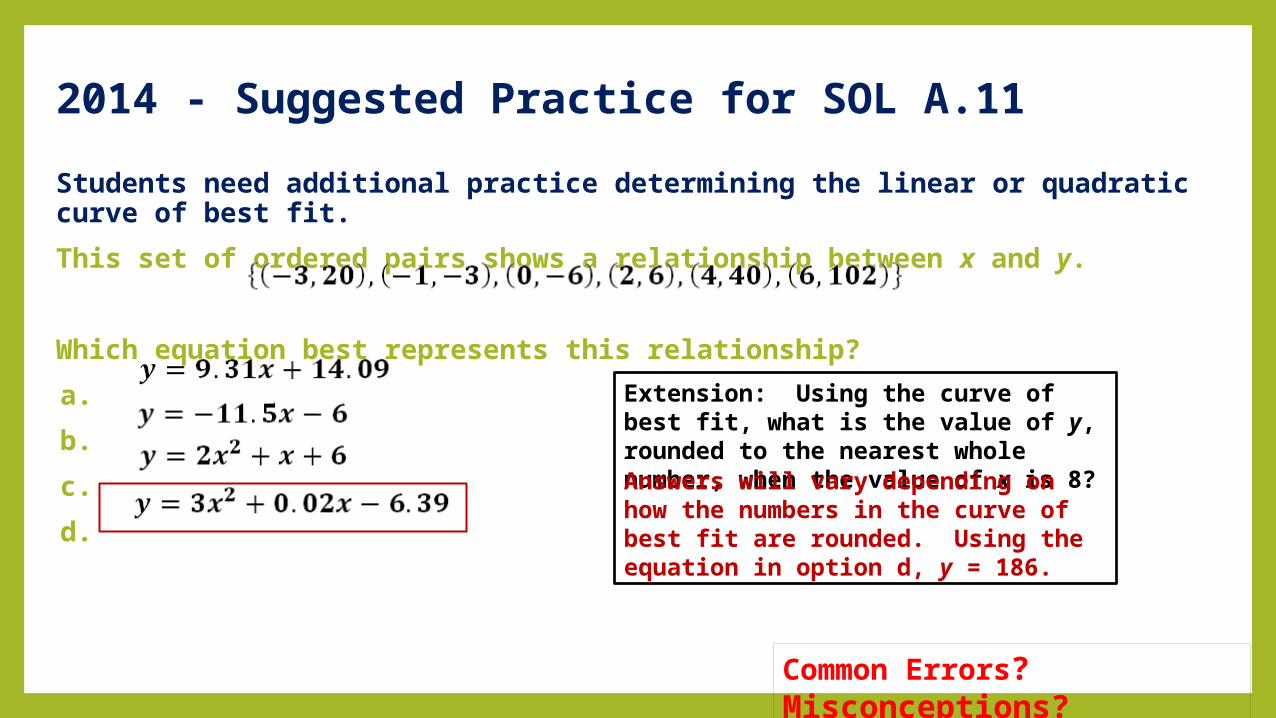
Students need additional practice determining the linear or quadratic curve of best fit.
This set of ordered pairs shows a relationship between x and y.
Which equation best represents this relationship?
a.
b.
c.
d.
Extension: Using the curve of best fit, what is the value of y, rounded to the nearest whole number, when the value of x is 8?Answers will vary depending on how the numbers in the curve of best fit are rounded. Using the equation in option d, y = 186.
2014 - Suggested Practice for SOL A.11
Common Errors? Misconceptions?
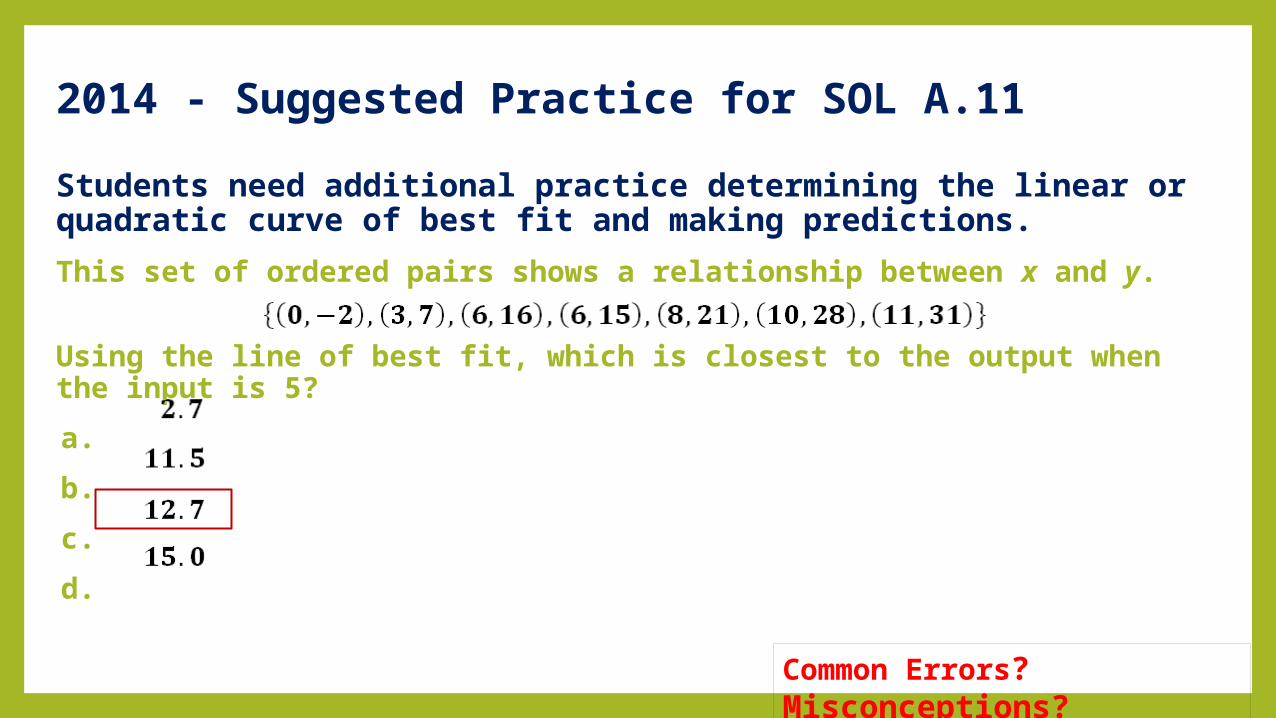
Students need additional practice determining the linear or quadratic curve of best fit and making predictions.
This set of ordered pairs shows a relationship between x and y.
Using the line of best fit, which is closest to the output when the input is 5?
a.
b.
c.
d.
2014 - Suggested Practice for SOL A.11
Common Errors? Misconceptions?
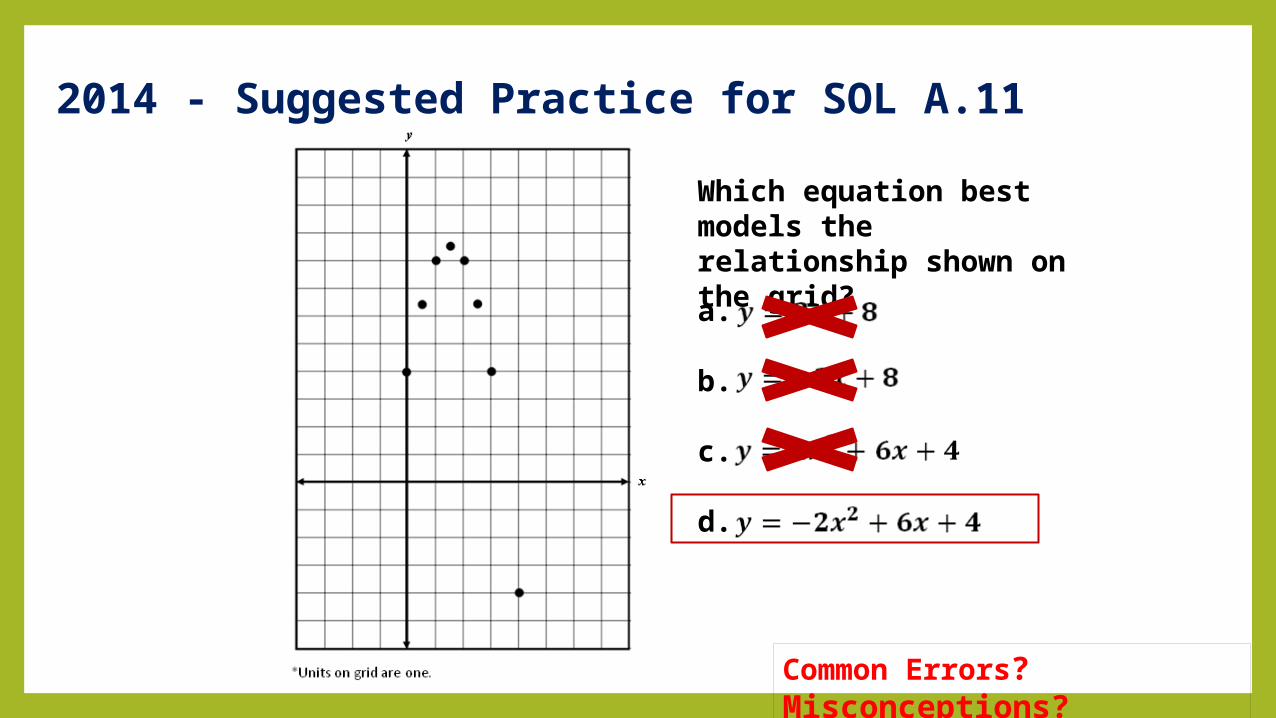
Which equation best models the relationship shown on the grid?
a.
b.
c.
d.
2014 - Suggested Practice for SOL A.11
Common Errors? Misconceptions?

ALGEBRA 2 AII.9
Curve of Best Fit
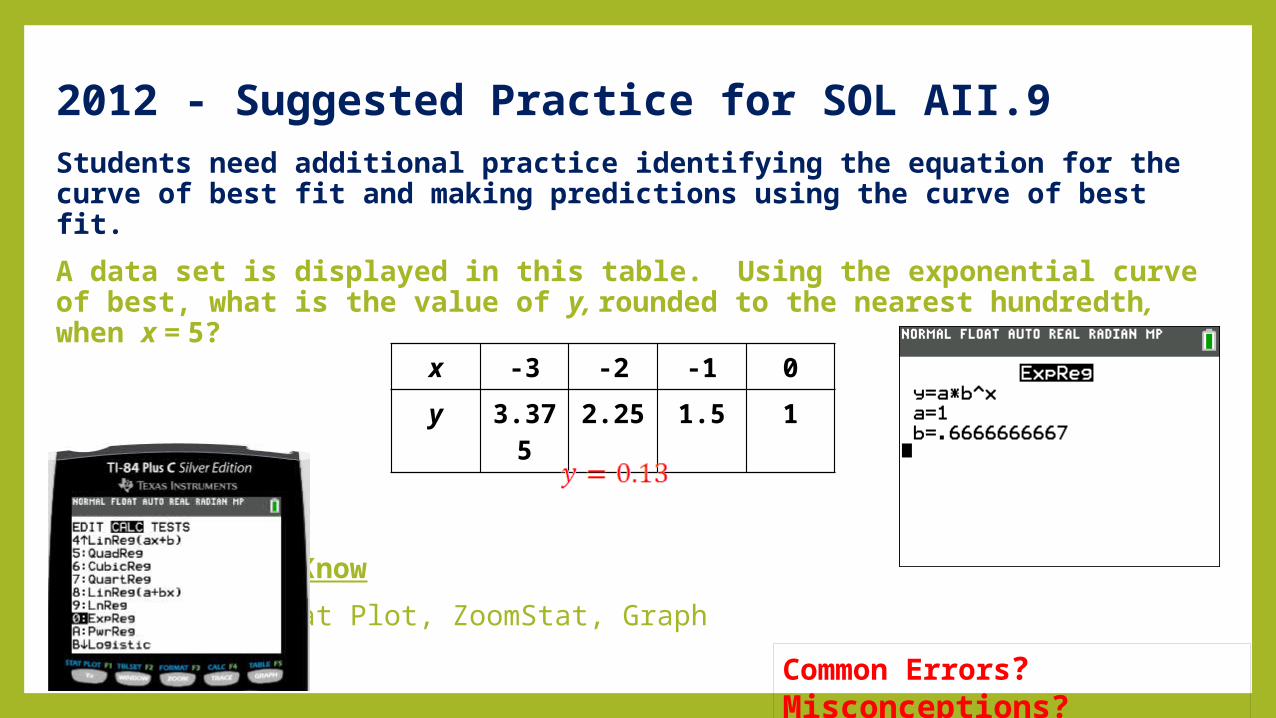
Students need additional practice identifying the equation for the curve of best fit and making predictions using the curve of best fit.
A data set is displayed in this table. Using the exponential curve of best, what is the value of y, rounded to the nearest hundredth, when x = 5?
TI-84 Need to Know
Stat, Calc, Stat Plot, ZoomStat, Graph
x -3 -2 -1 0
y 3.375 2.25 1.5 1
2012 - Suggested Practice for SOL AII.9
Common Errors? Misconceptions?
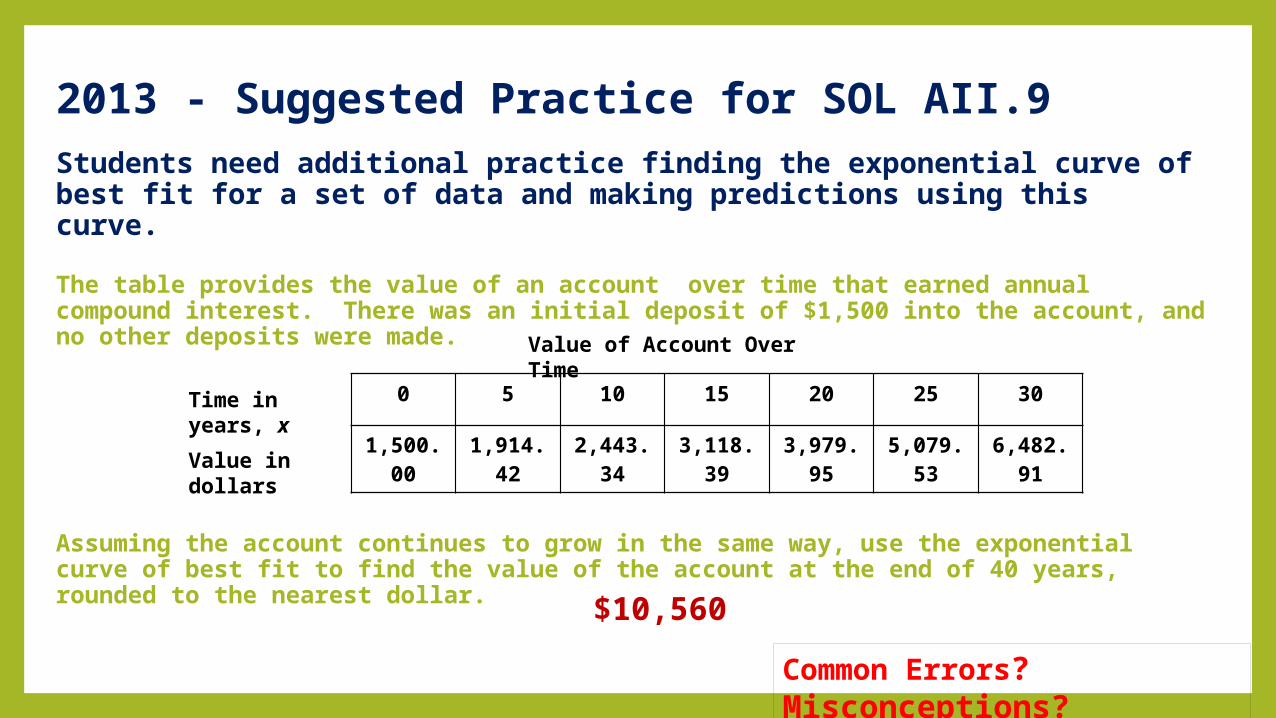
Students need additional practice finding the exponential curve of best fit for a set of data and making predictions using this curve.
The table provides the value of an account over time that earned annual compound interest. There was an initial deposit of $1,500 into the account, and no other deposits were made.
Assuming the account continues to grow in the same way, use the exponential curve of best fit to find the value of the account at the end of 40 years, rounded to the nearest dollar.
0 5 10 15 20 25 30
1,500.00
1,914.42
2,443.34
3,118.39
3,979.95
5,079.53
6,482.91
Time in years, x
Value in dollars
Value of Account Over Time
$10,560
2013 - Suggested Practice for SOL AII.9
Common Errors? Misconceptions?
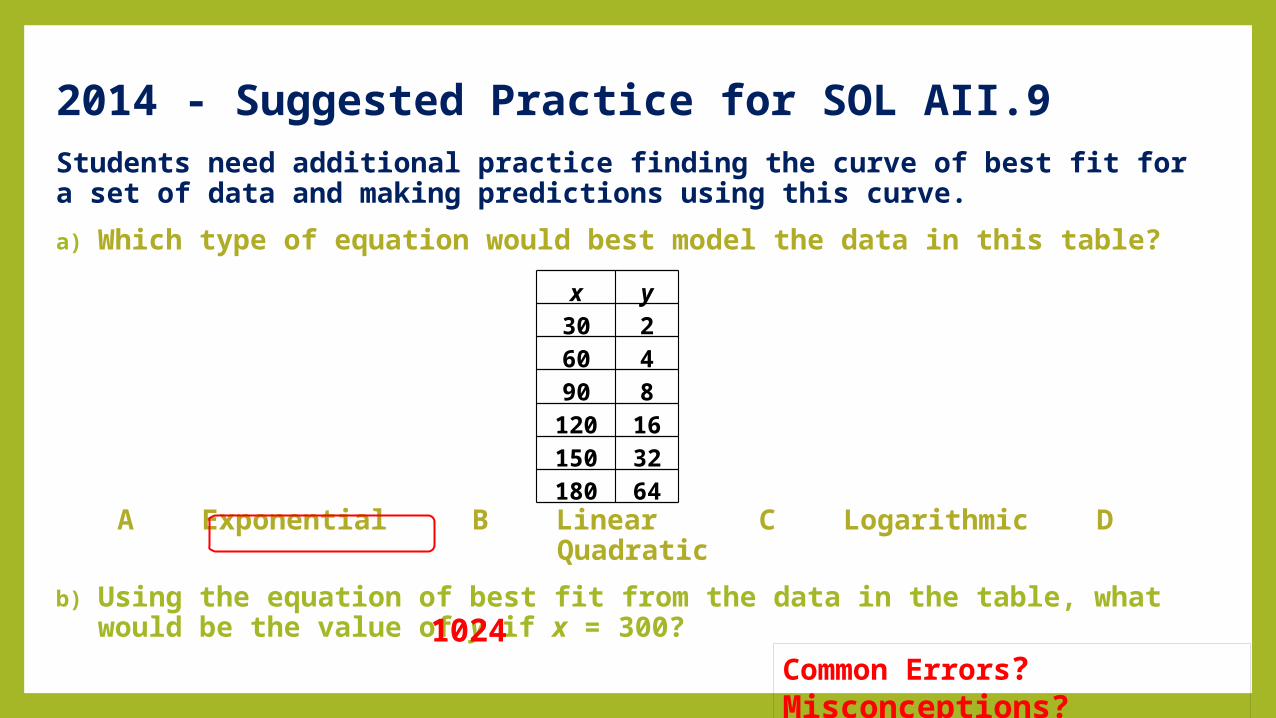
Students need additional practice finding the curve of best fit for a set of data and making predictions using this curve.
a) Which type of equation would best model the data in this table?
A Exponential B Linear C Logarithmic D Quadratic
b) Using the equation of best fit from the data in the table, what would be the value of y if x = 300?1024
x y30 260 490 8120 16150 32180 64
2014 - Suggested Practice for SOL AII.9
Common Errors? Misconceptions?

MISCELLANEOUS CONTENT
StatisticsSOL A.10
SOL AII.2, AII.10, AII.12
Breakout Sessions
•Work problems from A.10 and AII.2, AII.10, AII.12 in small groups.
•Make sure you are able to do the problems on the calculator and know the keystrokes.

ALGEBRA 1 A.10
Box-and-Whisker Plots
Performance Analysis Comparison - SOL A.10
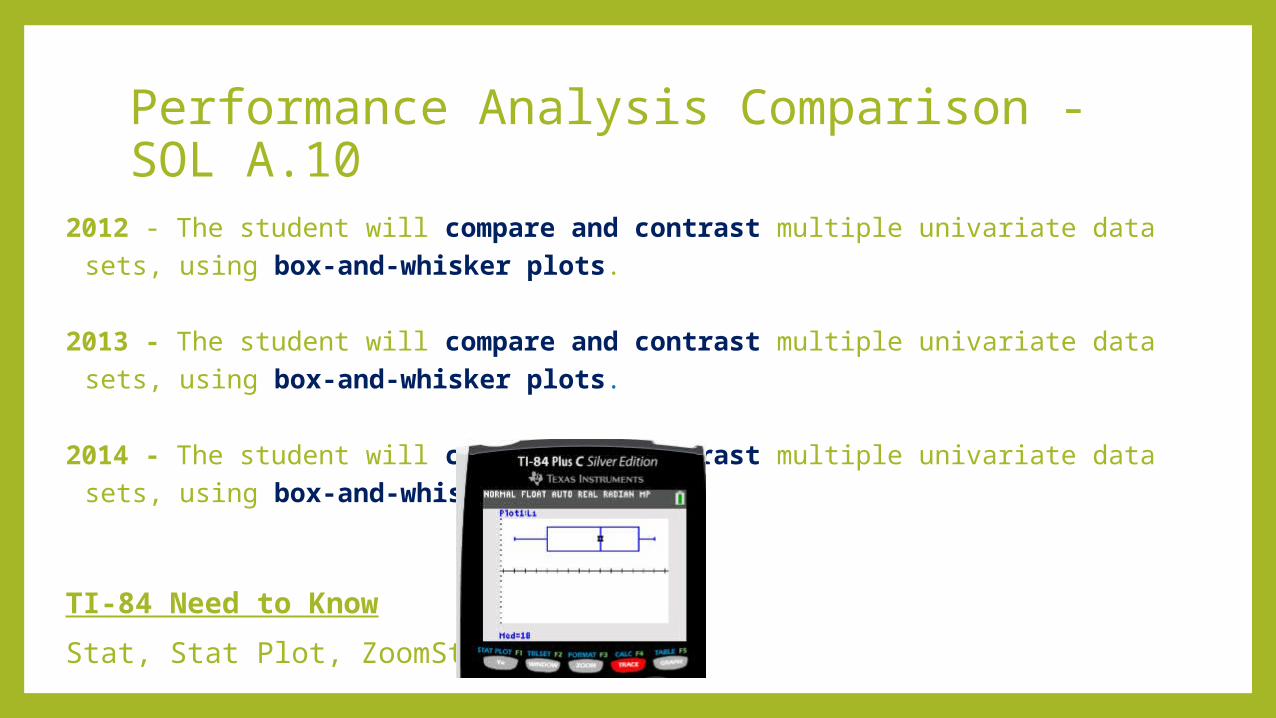
2012 - The student will compare and contrast multiple univariate data sets, using box-and-whisker plots.
2013 - The student will compare and contrast multiple univariate data sets, using box-and-whisker plots.
2014 - The student will compare and contrast multiple univariate data sets, using box-and-whisker plots.
TI-84 Need to Know
Stat, Stat Plot, ZoomStat, Graph
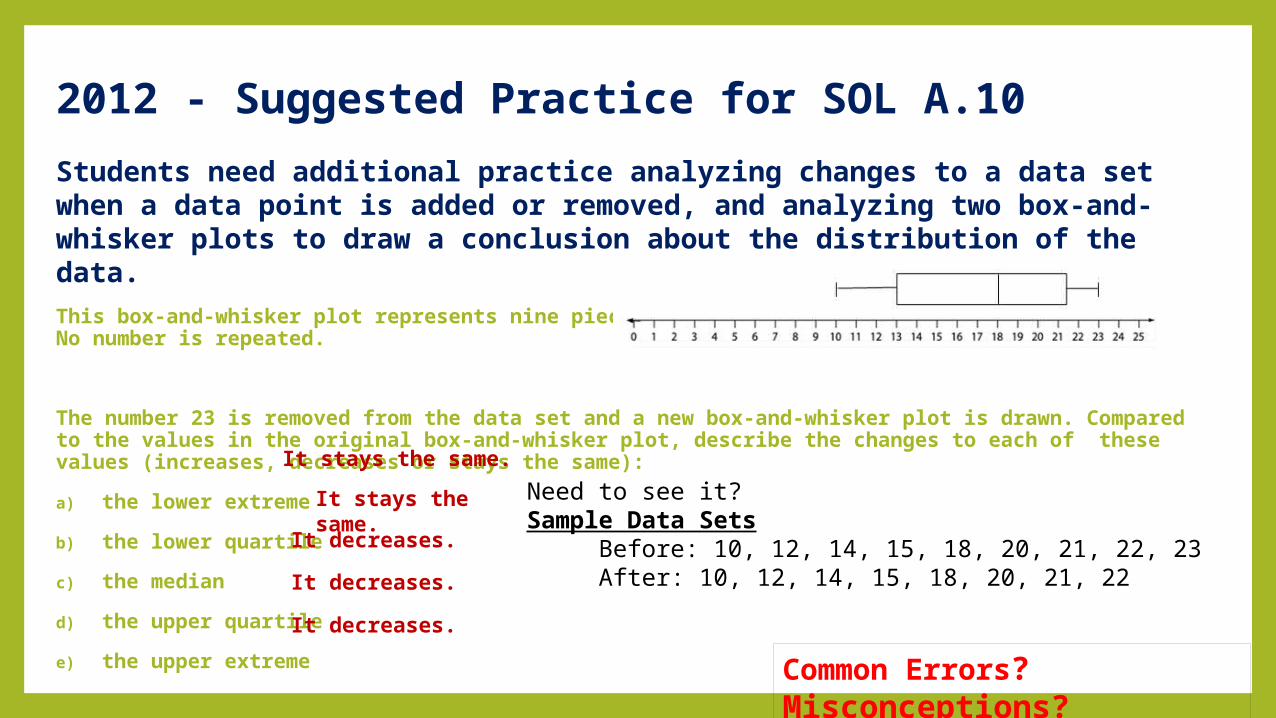
Students need additional practice analyzing changes to a data set when a data point is added or removed, and analyzing two box-and-whisker plots to draw a conclusion about the distribution of the data.
This box-and-whisker plot represents nine pieces of data. No number is repeated.
The number 23 is removed from the data set and a new box-and-whisker plot is drawn. Compared to the values in the original box-and-whisker plot, describe the changes to each of these values (increases, decreases or stays the same):
a) the lower extreme
b) the lower quartile
c) the median
d) the upper quartile
e) the upper extreme
It stays the same.
It stays the same.
It decreases.
It decreases.
It decreases.
2012 - Suggested Practice for SOL A.10
Common Errors? Misconceptions?
Need to see it? Sample Data Sets Before: 10, 12, 14, 15, 18, 20, 21, 22, 23 After: 10, 12, 14, 15, 18, 20, 21, 22
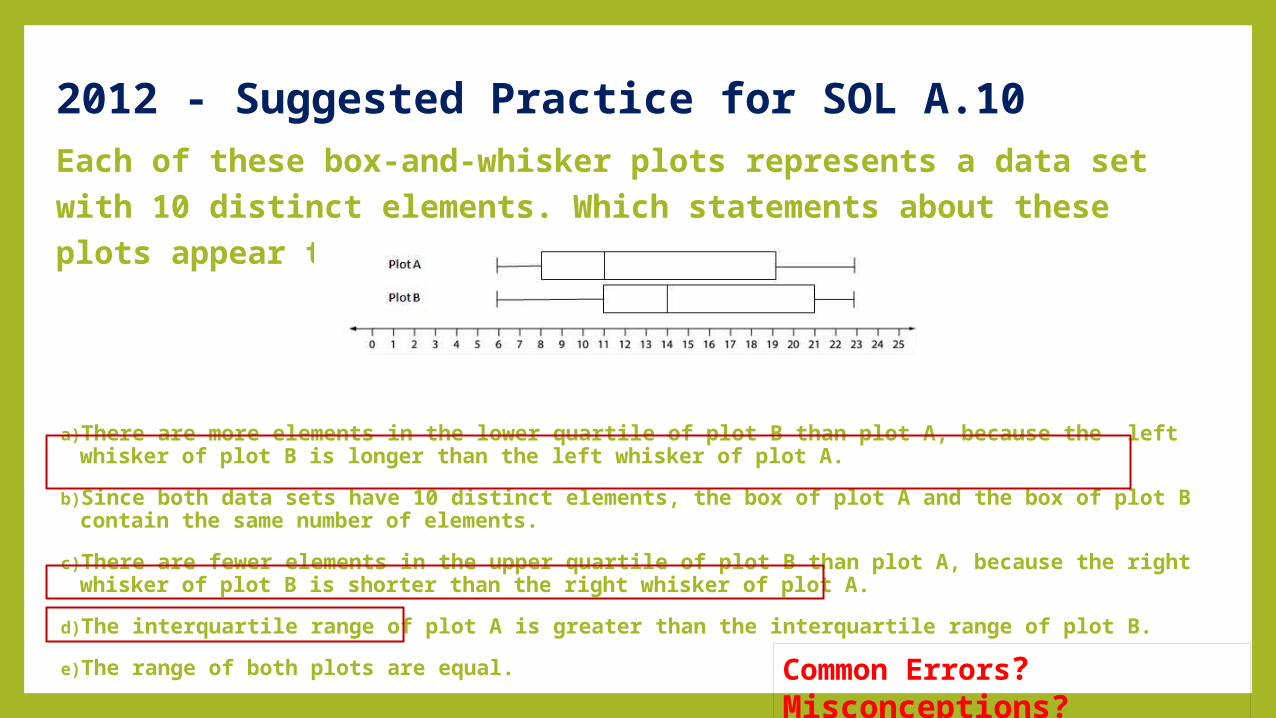
Each of these box-and-whisker plots represents a data set with 10 distinct elements. Which statements about these plots appear to be true?
a)There are more elements in the lower quartile of plot B than plot A, because the left whisker of plot B is longer than the left whisker of plot A.
b)Since both data sets have 10 distinct elements, the box of plot A and the box of plot B contain the same number of elements.
c)There are fewer elements in the upper quartile of plot B than plot A, because the right whisker of plot B is shorter than the right whisker of plot A.
d)The interquartile range of plot A is greater than the interquartile range of plot B.
e)The range of both plots are equal.
2012 - Suggested Practice for SOL A.10
Common Errors? Misconceptions?
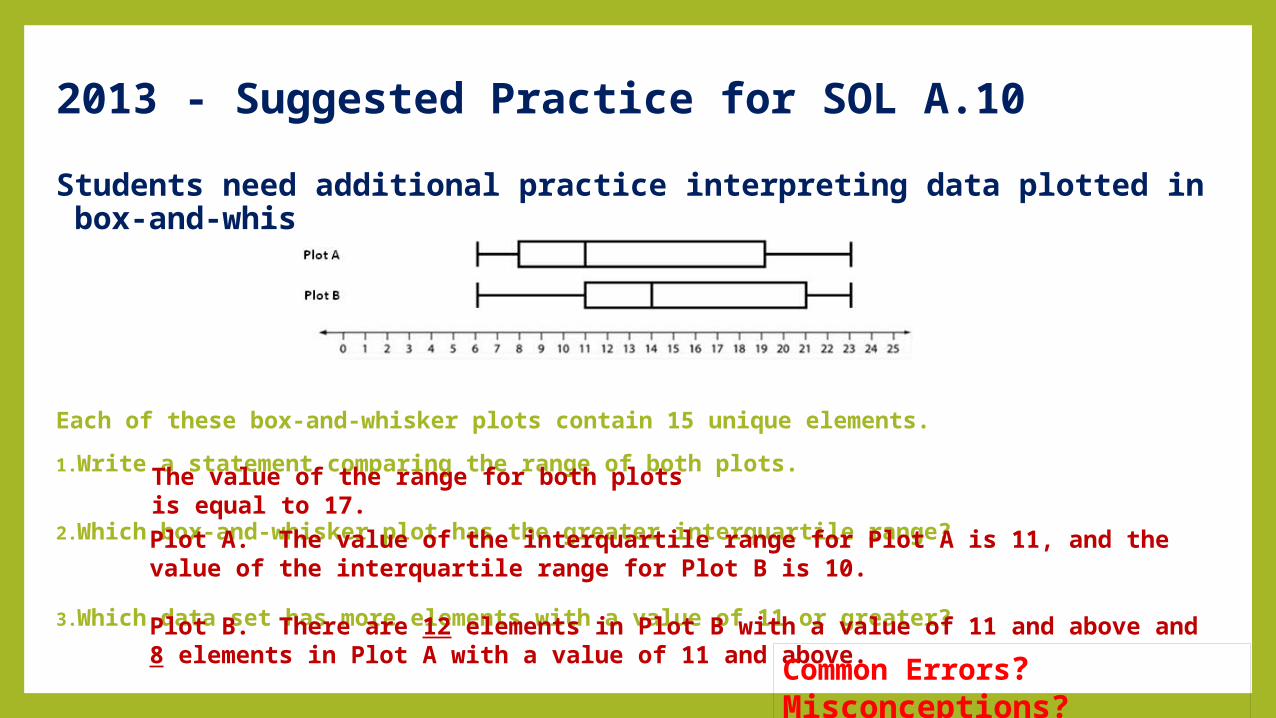
Students need additional practice interpreting data plotted in box-and-whisker plots.
Each of these box-and-whisker plots contain 15 unique elements.
1.Write a statement comparing the range of both plots.
2.Which box-and-whisker plot has the greater interquartile range?
3.Which data set has more elements with a value of 11 or greater?
The value of the range for both plots is equal to 17.Plot A. The value of the interquartile range for Plot A is 11, and the value of the interquartile range for Plot B is 10.
Plot B. There are 12 elements in Plot B with a value of 11 and above and 8 elements in Plot A with a value of 11 and above.
2013 - Suggested Practice for SOL A.10
Common Errors? Misconceptions?
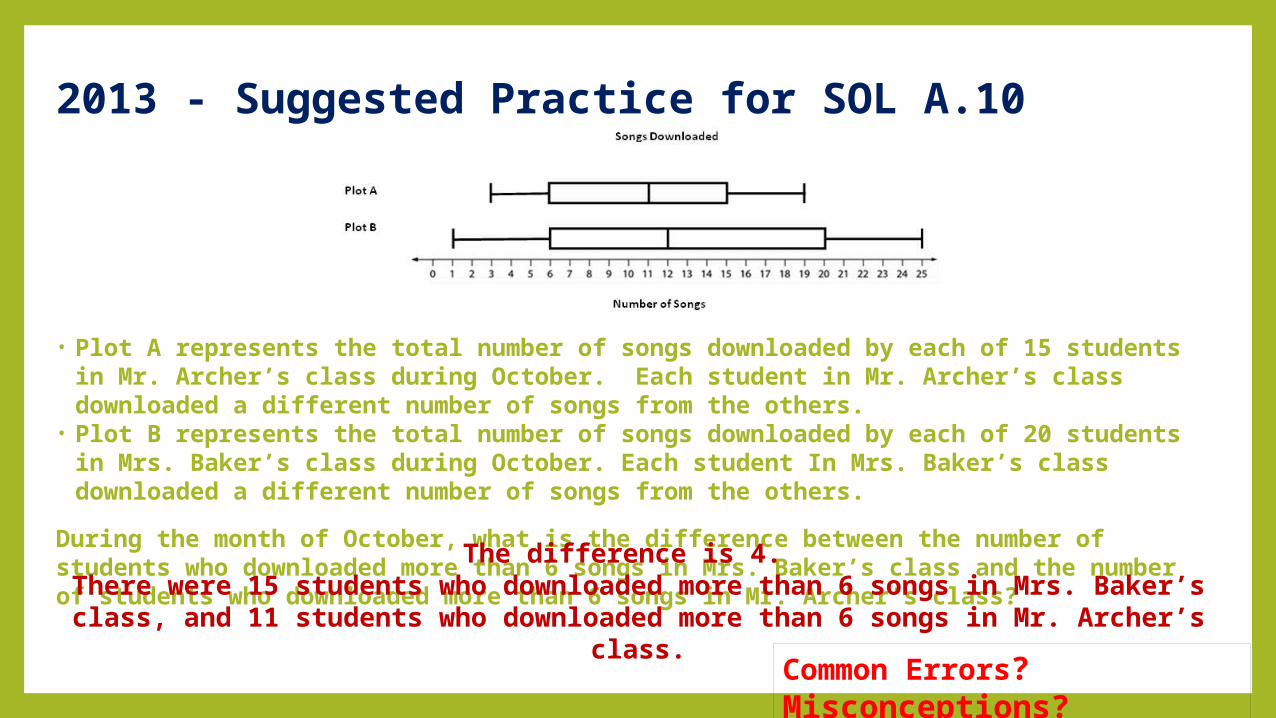
• Plot A represents the total number of songs downloaded by each of 15 students in Mr. Archer’s class during October. Each student in Mr. Archer’s class downloaded a different number of songs from the others.
• Plot B represents the total number of songs downloaded by each of 20 students in Mrs. Baker’s class during October. Each student In Mrs. Baker’s class downloaded a different number of songs from the others.
During the month of October, what is the difference between the number of students who downloaded more than 6 songs in Mrs. Baker’s class and the number of students who downloaded more than 6 songs in Mr. Archer’s class?
The difference is 4. There were 15 students who downloaded more than 6 songs in Mrs. Baker’s class, and 11 students who downloaded more than 6 songs in Mr. Archer’s
class.
2013 - Suggested Practice for SOL A.10
Common Errors? Misconceptions?
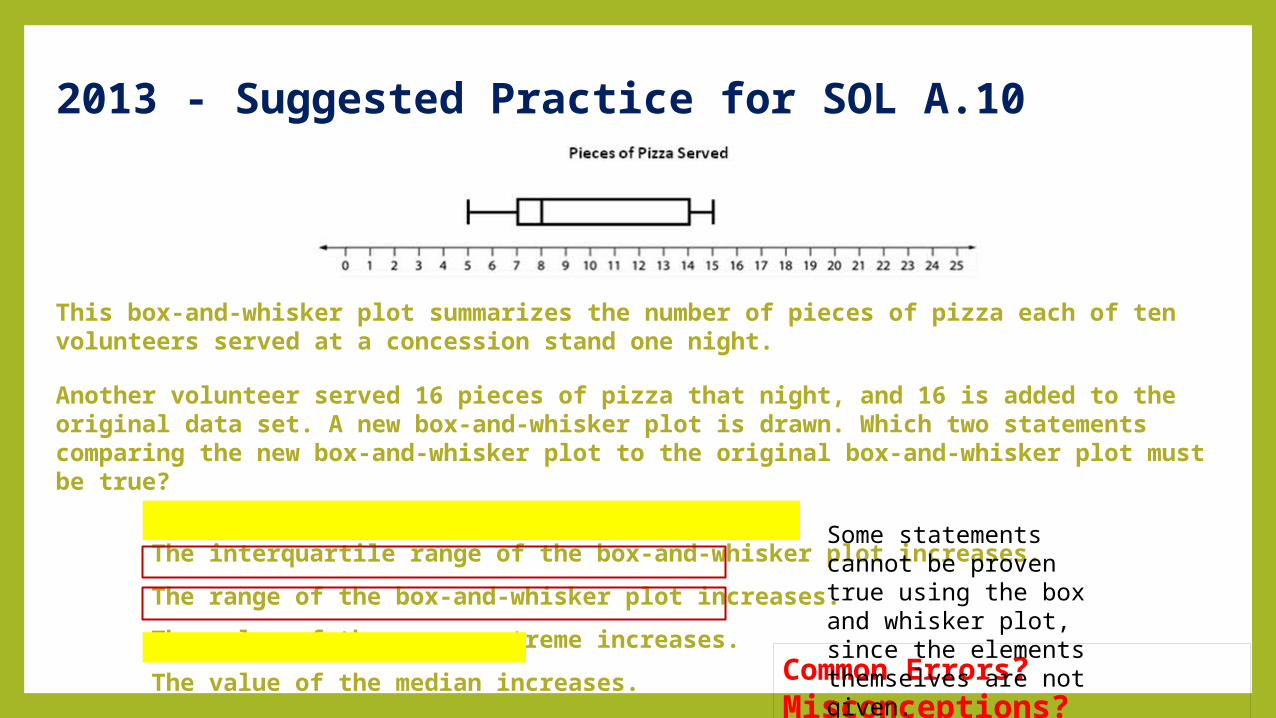
This box-and-whisker plot summarizes the number of pieces of pizza each of ten volunteers served at a concession stand one night.
Another volunteer served 16 pieces of pizza that night, and 16 is added to the original data set. A new box-and-whisker plot is drawn. Which two statements comparing the new box-and-whisker plot to the original box-and-whisker plot must be true?
The interquartile range of the box-and-whisker plot increases.
The range of the box-and-whisker plot increases.
The value of the upper extreme increases.
The value of the median increases.
2013 - Suggested Practice for SOL A.10
Common Errors? Misconceptions?
Some statements cannot be proven true using the box and whisker plot, since the elements themselves are not given.
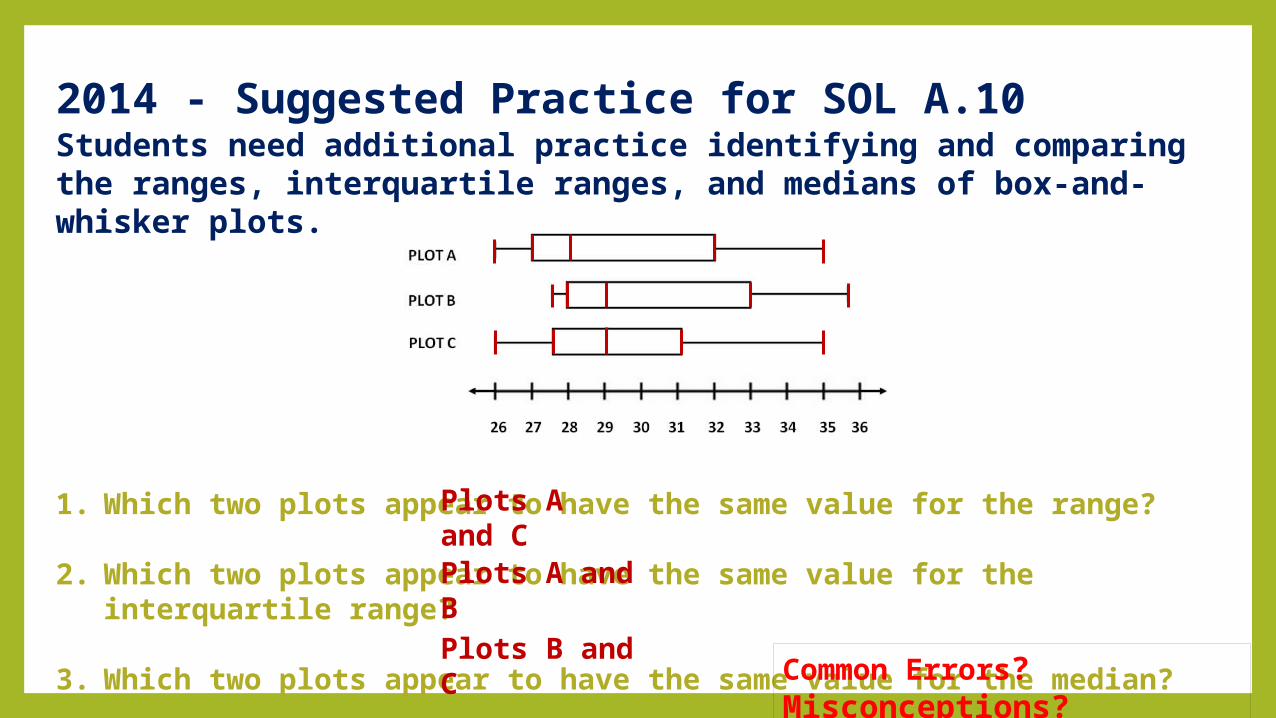
Students need additional practice identifying and comparing the ranges, interquartile ranges, and medians of box-and-whisker plots.
1. Which two plots appear to have the same value for the range?
2. Which two plots appear to have the same value for the interquartile range?
3. Which two plots appear to have the same value for the median?
Plots A and B
Plots A and C
Plots B and C
2014 - Suggested Practice for SOL A.10
Common Errors? Misconceptions?
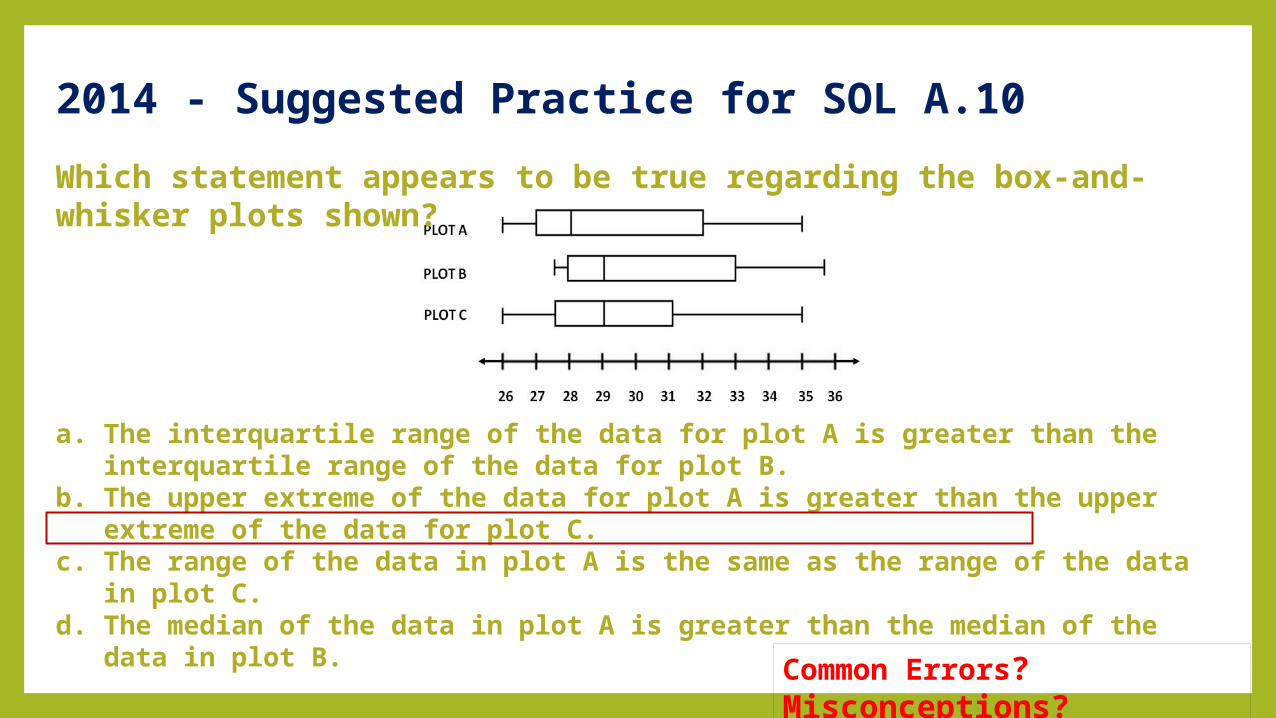
a. The interquartile range of the data for plot A is greater than the interquartile range of the data for plot B.
b. The upper extreme of the data for plot A is greater than the upper extreme of the data for plot C.
c. The range of the data in plot A is the same as the range of the data in plot C.
d. The median of the data in plot A is greater than the median of the data in plot B.
Which statement appears to be true regarding the box-and-whisker plots shown?
2014 - Suggested Practice for SOL A.10
Common Errors? Misconceptions?

ALGEBRA 2 AII.2
Sequences and Series
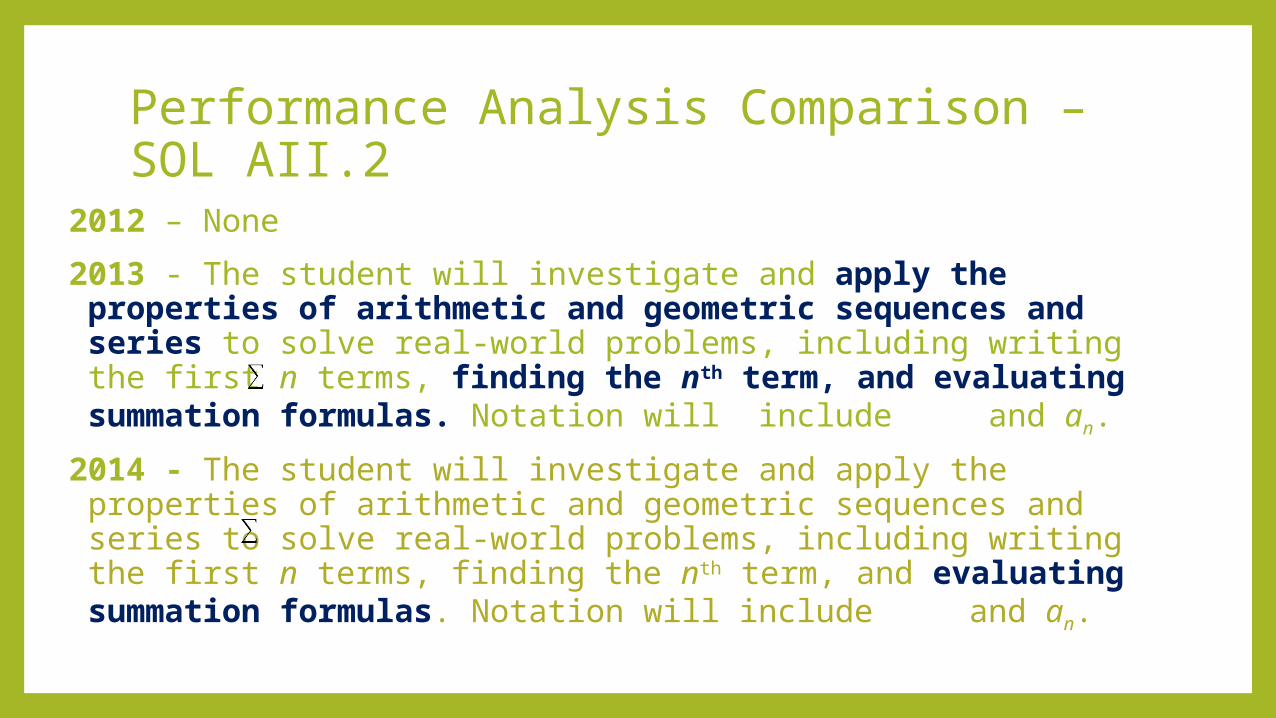
Performance Analysis Comparison – SOL AII.2
2012 – None
2013 - The student will investigate and apply the properties of arithmetic and geometric sequences and series to solve real-world problems, including writing the first n terms, finding the nth term, and evaluating summation formulas. Notation will include and an.
2014 - The student will investigate and apply the properties of arithmetic and geometric sequences and series to solve real-world problems, including writing the first n terms, finding the nth term, and evaluating summation formulas. Notation will include and an.
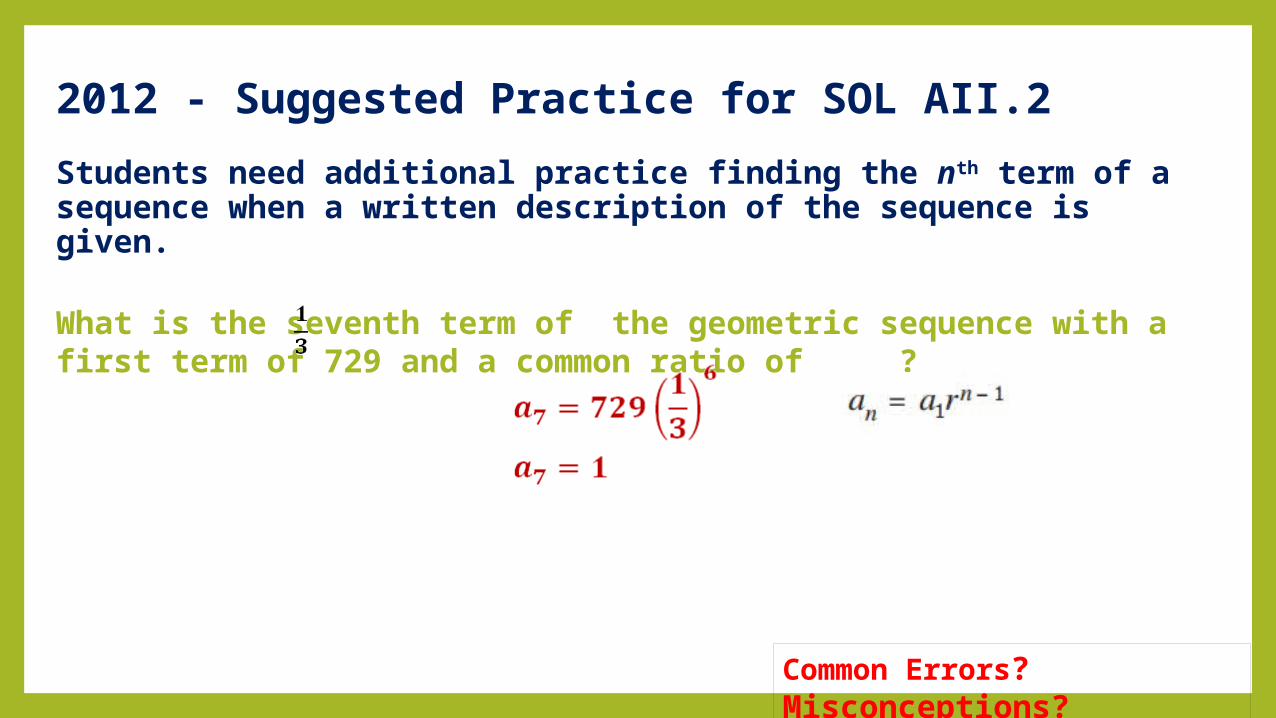
Students need additional practice finding the nth term of a sequence when a written description of the sequence is given.
What is the seventh term of the geometric sequence with a first term of 729 and a common ratio of ?
2012 - Suggested Practice for SOL AII.2
Common Errors? Misconceptions?
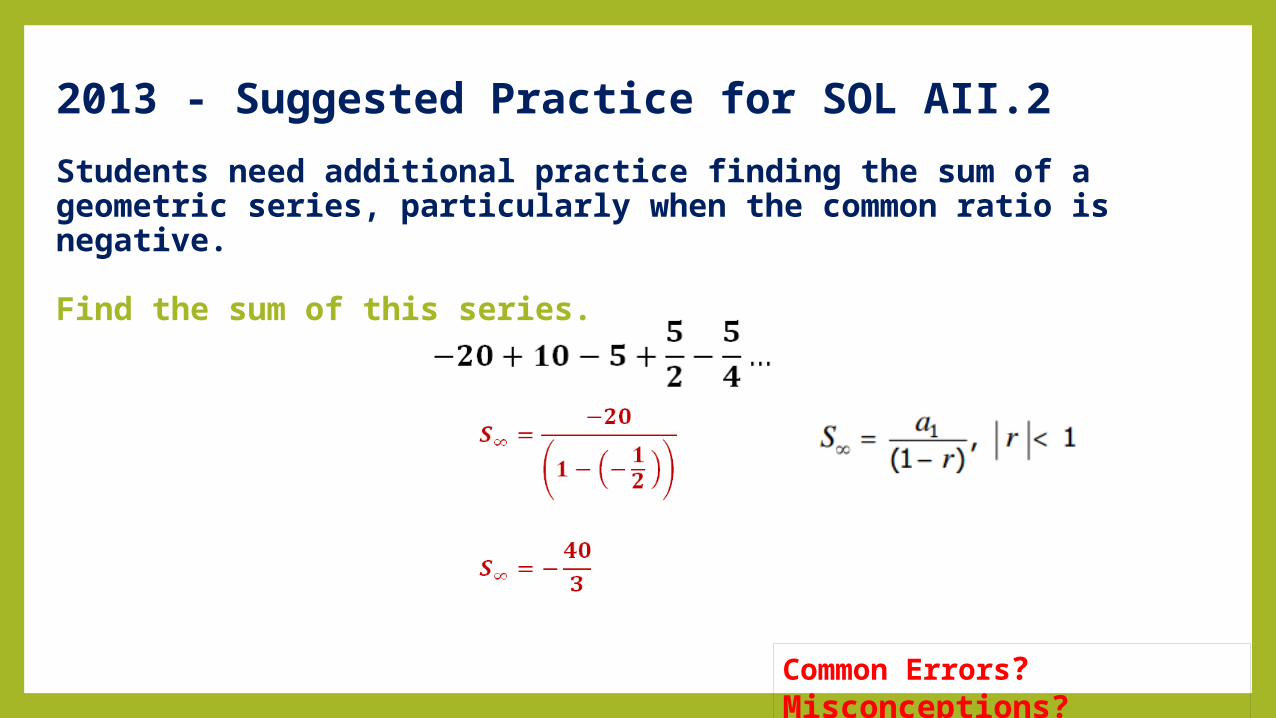
Students need additional practice finding the sum of a geometric series, particularly when the common ratio is negative.
Find the sum of this series.
2013 - Suggested Practice for SOL AII.2
Common Errors? Misconceptions?
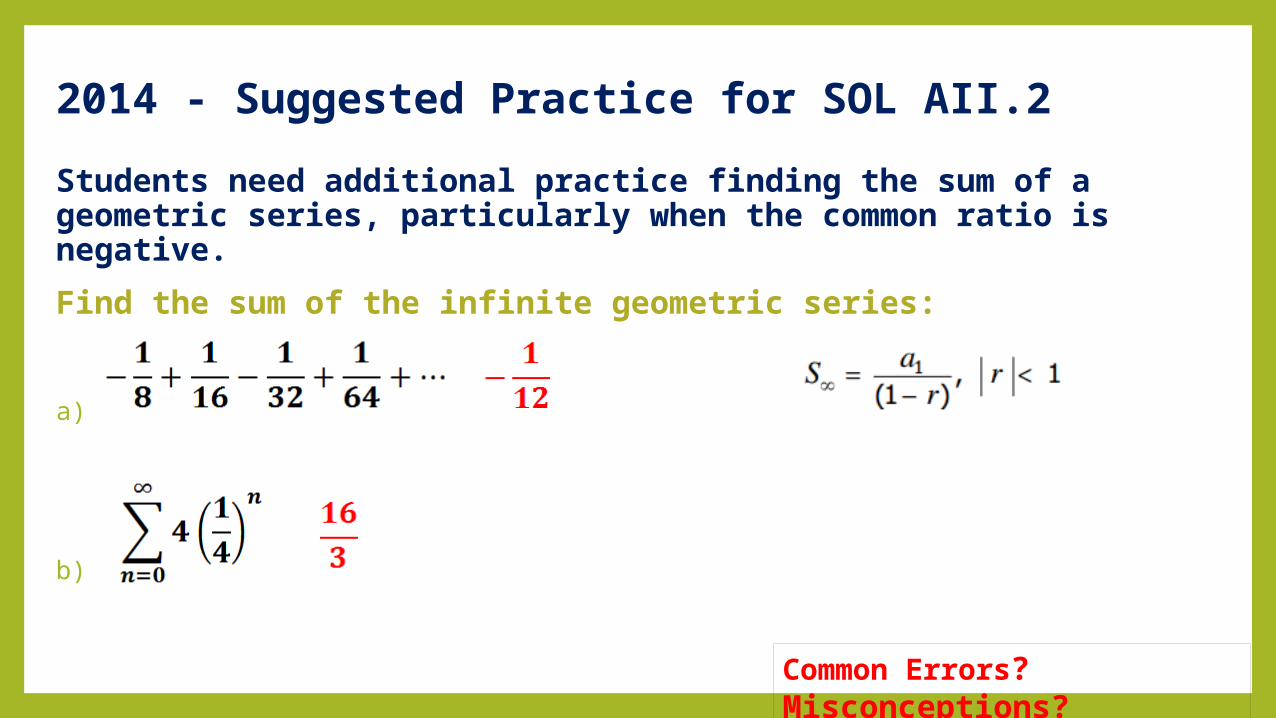
Students need additional practice finding the sum of a geometric series, particularly when the common ratio is negative.
Find the sum of the infinite geometric series:
a)
b)
2014 - Suggested Practice for SOL AII.2
Common Errors? Misconceptions?
ALGEBRA 2 AII.10
Variations
Performance Analysis Comparison – SOL AII.102012 - The student will identify, create, and solve real-world problems involving inverse variation, joint variation, and a combination of direct and inverse variations.
2013 - The student will identify, create, and solve real-world problems involving inverse variation, joint variation, and a combination of direct and inverse variations.
2014 - The student will identify, create, and solve real-world problems involving inverse variation, joint variation, and a combination of direct and inverse variations.
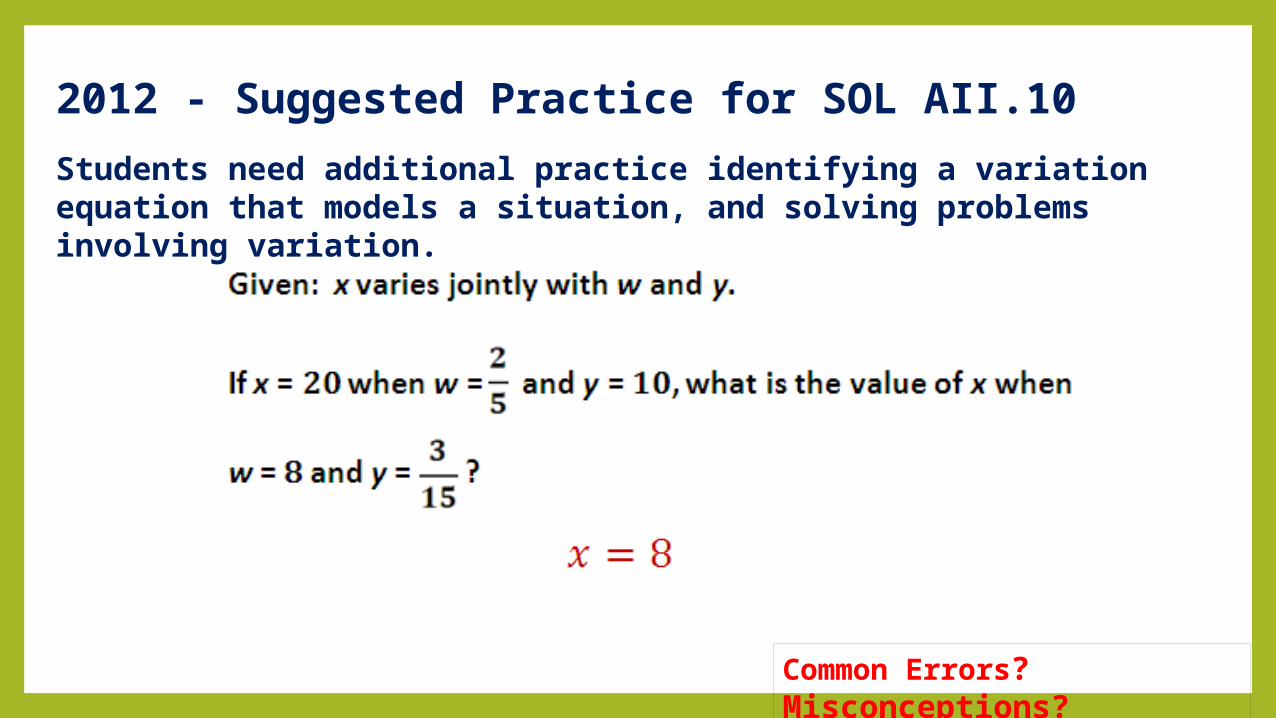
Students need additional practice identifying a variation equation that models a situation, and solving problems involving variation.
2012 - Suggested Practice for SOL AII.10
Common Errors? Misconceptions?
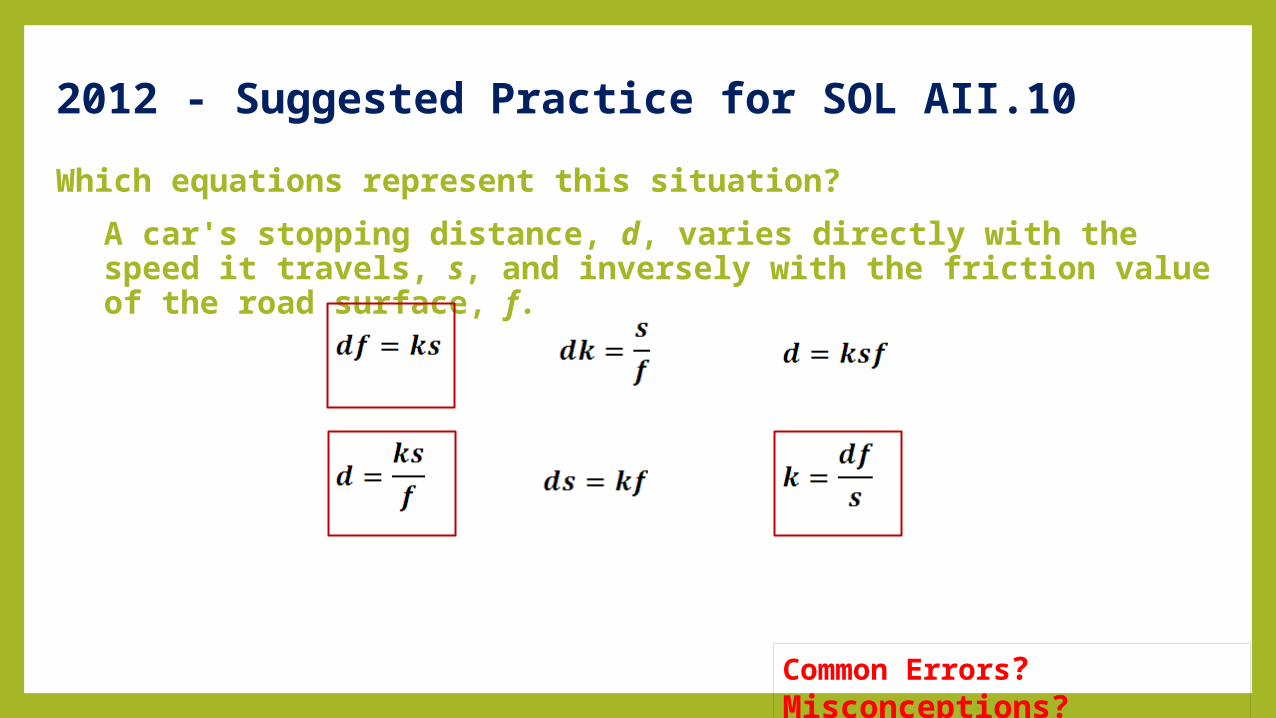
Which equations represent this situation?
A car's stopping distance, d, varies directly with the speed it travels, s, and inversely with the friction value of the road surface, f.
2012 - Suggested Practice for SOL AII.10
Common Errors? Misconceptions?
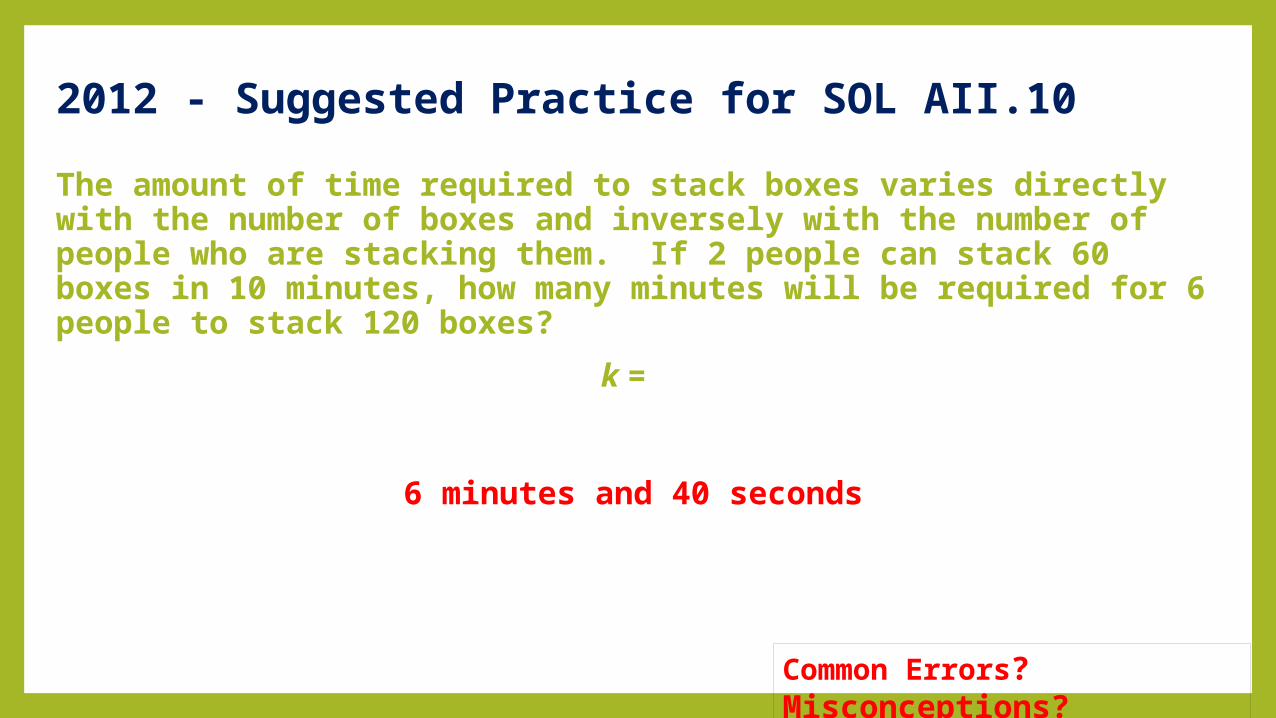
The amount of time required to stack boxes varies directly with the number of boxes and inversely with the number of people who are stacking them. If 2 people can stack 60 boxes in 10 minutes, how many minutes will be required for 6 people to stack 120 boxes?
k =
6 minutes and 40 seconds
2012 - Suggested Practice for SOL AII.10
Common Errors? Misconceptions?
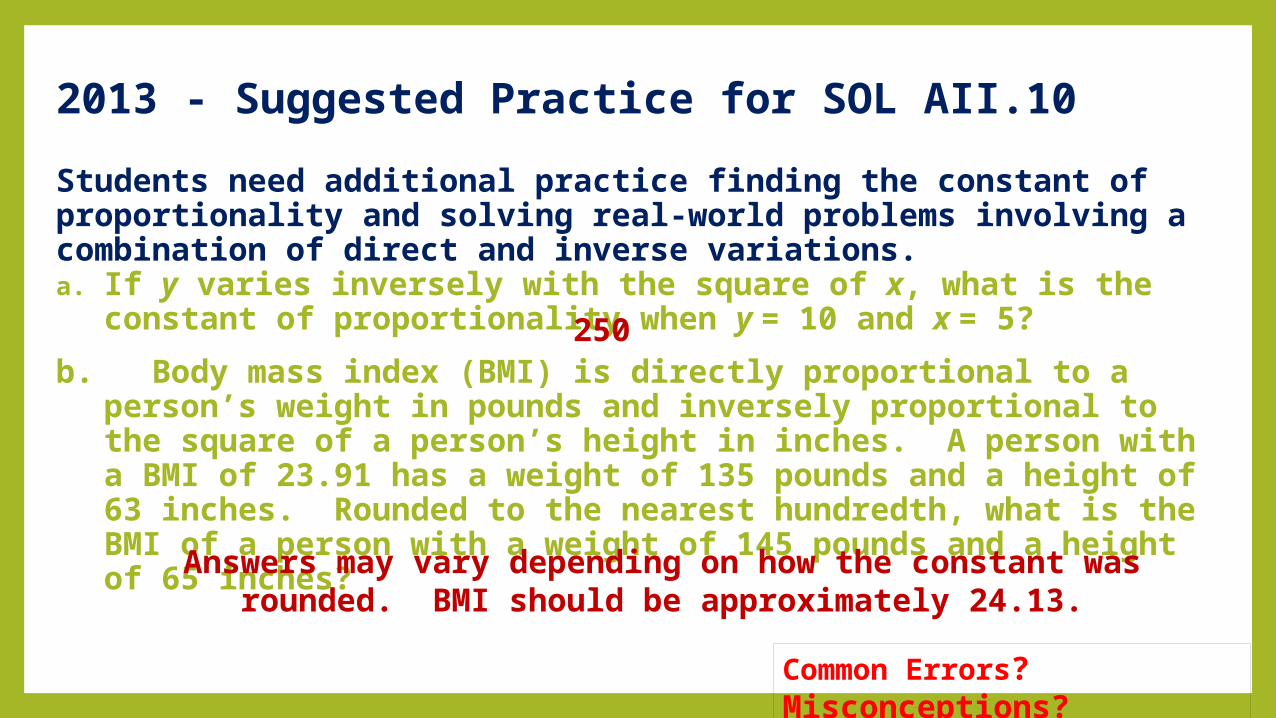
Students need additional practice finding the constant of proportionality and solving real-world problems involving a combination of direct and inverse variations. a. If y varies inversely with the square of x, what is the
constant of proportionality when y = 10 and x = 5?
b. Body mass index (BMI) is directly proportional to a person’s weight in pounds and inversely proportional to the square of a person’s height in inches. A person with a BMI of 23.91 has a weight of 135 pounds and a height of 63 inches. Rounded to the nearest hundredth, what is the BMI of a person with a weight of 145 pounds and a height of 65 inches?
250
Answers may vary depending on how the constant was rounded. BMI should be approximately 24.13.
2013 - Suggested Practice for SOL AII.10
Common Errors? Misconceptions?
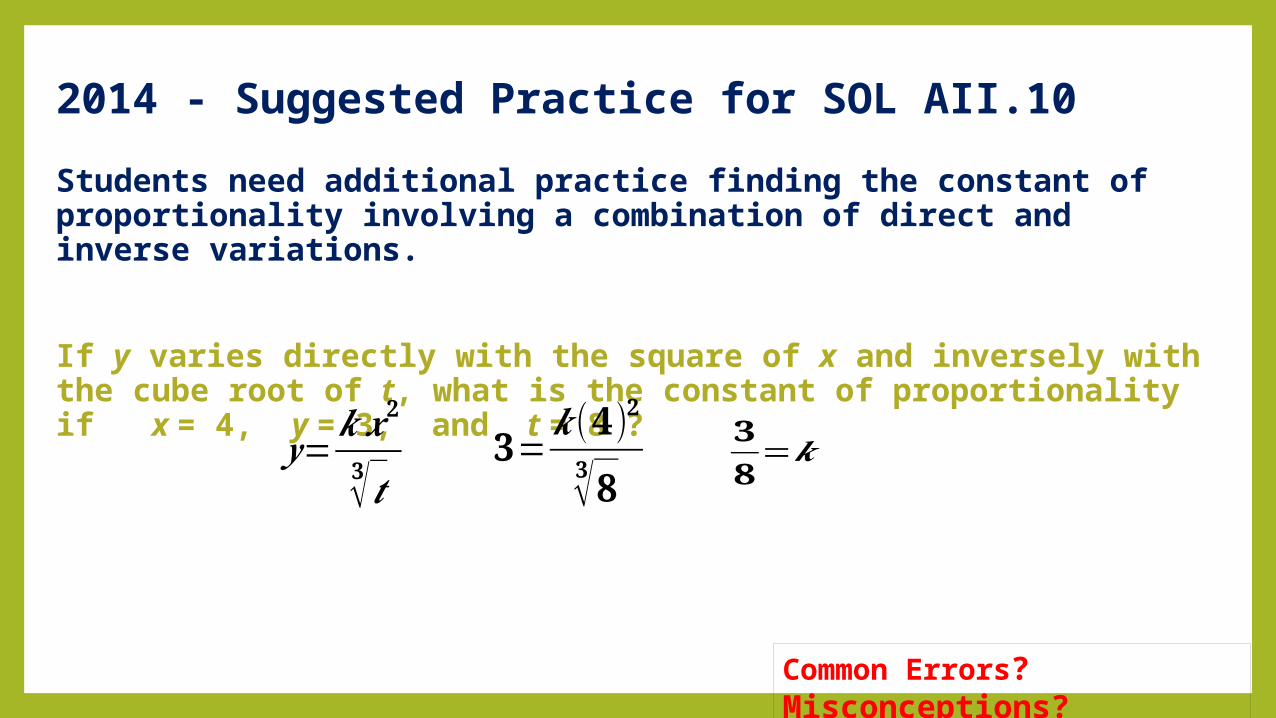
Students need additional practice finding the constant of proportionality involving a combination of direct and inverse variations.
If y varies directly with the square of x and inversely with the cube root of t, what is the constant of proportionality if x = 4, y = 3, and t = 8 ?
𝒚=𝒌𝒙𝟐
𝟑√𝒕𝟑=
𝒌(𝟒)𝟐𝟑√𝟖
𝟑𝟖
=𝒌
2014 - Suggested Practice for SOL AII.10
Common Errors? Misconceptions?
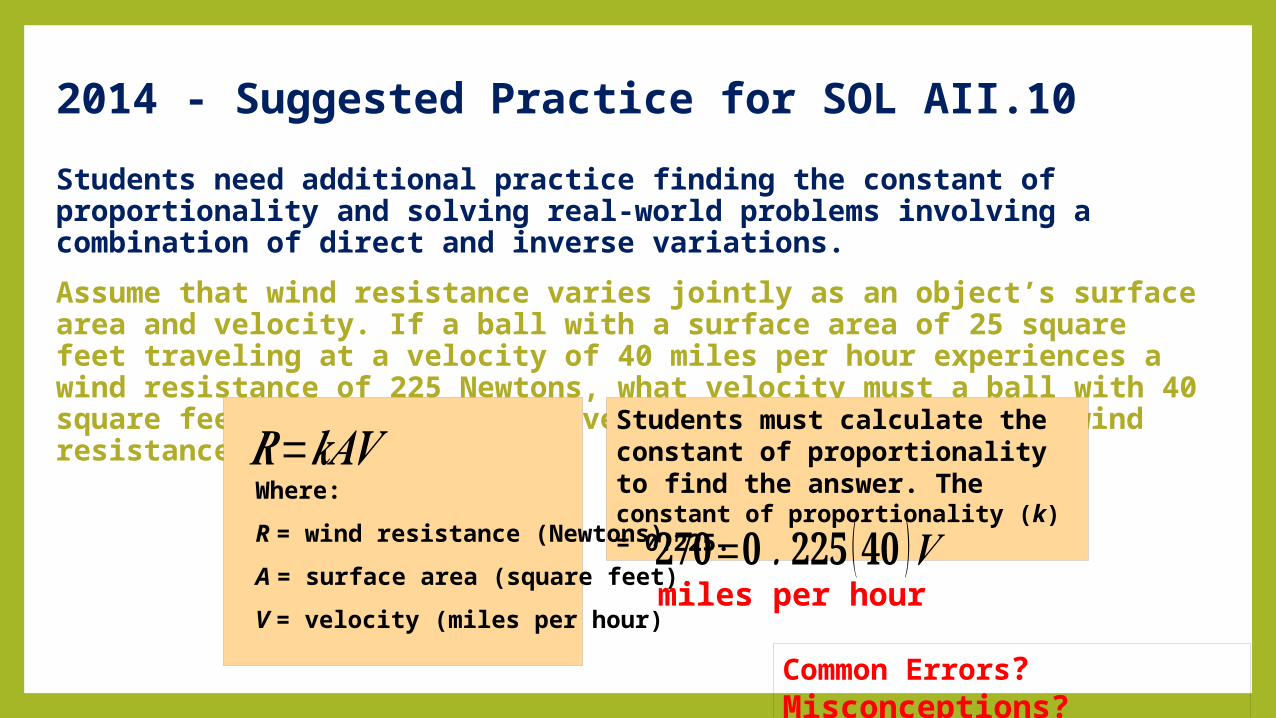
Students need additional practice finding the constant of proportionality and solving real-world problems involving a combination of direct and inverse variations.
Assume that wind resistance varies jointly as an object’s surface area and velocity. If a ball with a surface area of 25 square feet traveling at a velocity of 40 miles per hour experiences a wind resistance of 225 Newtons, what velocity must a ball with 40 square feet of surface area have in order to experience a wind resistance of 270 Newtons?
Students must calculate the constant of proportionality to find the answer. Theconstant of proportionality (k) = 0.225.𝟐𝟕𝟎=𝟎 .𝟐𝟐𝟓 (𝟒𝟎 )𝑽
Where:
R = wind resistance (Newtons)
A = surface area (square feet)
V = velocity (miles per hour)
𝑹=𝒌𝑨𝑽
miles per hour
2014 - Suggested Practice for SOL AII.10
Common Errors? Misconceptions?
ALGEBRA 2 AII.12
Permutations and Combinations
Performance Analysis Comparison – SOL AII.122012 - The student will compute and distinguish between permutations and combinations and use technology for applications.
2013 – None
2014 - None
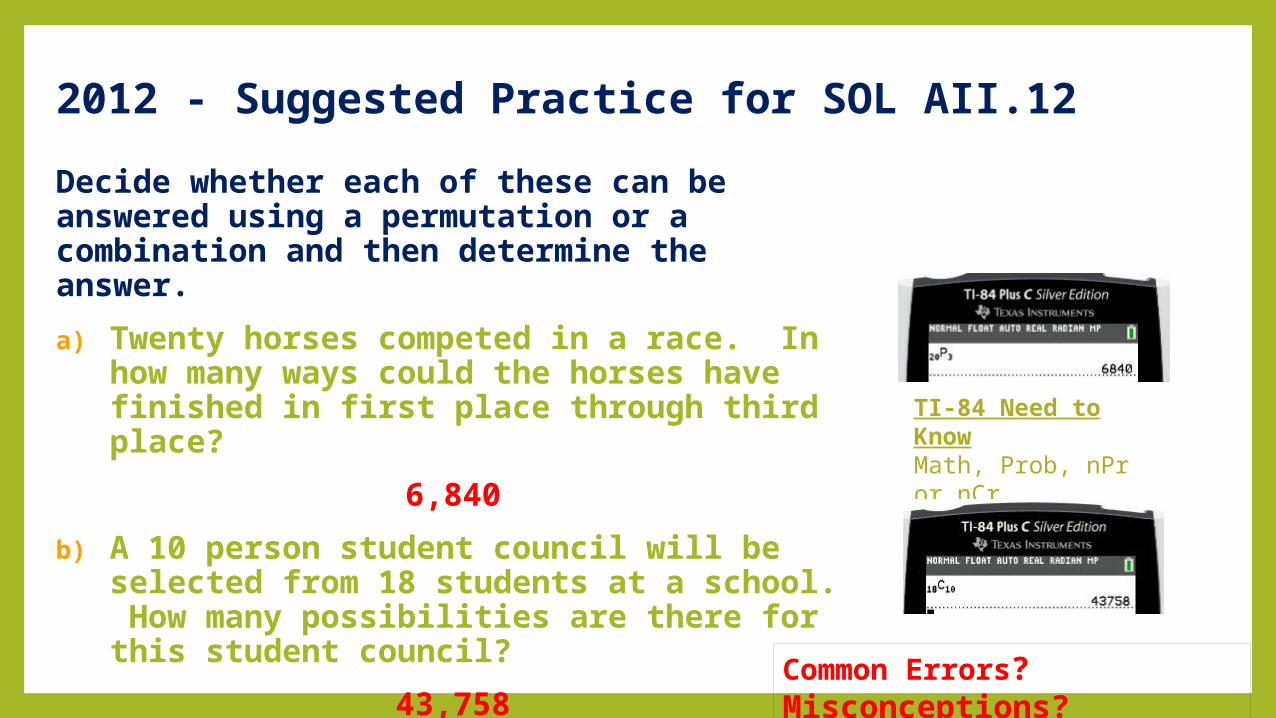
Decide whether each of these can be answered using a permutation or a combination and then determine the answer.
a) Twenty horses competed in a race. In how many ways could the horses have finished in first place through third place?
6,840
b) A 10 person student council will be selected from 18 students at a school. How many possibilities are there for this student council?
43,758
2012 - Suggested Practice for SOL AII.12
Common Errors? Misconceptions?
TI-84 Need to KnowMath, Prob, nPr or nCr
FINAL THOUGHTSStatistics
SOL A.9, A.10, A.11
SOL AII.2, AII.9, AII.10, AII.11, AII.12
February 18, 2015 & March 4, 2015

Instructional Resources1. ExamView Banks
2. NextLesson.org
3. HCPS Math Website - http://teachers.henrico.k12.va.us/math/courses/ • VDOE Enhanced Scope and Sequence• Skills - JMU Pivotal Items
4. ExploreLearning
• Teaching Strategies
• Student Engagement
• Activities


