Quiz Tomorrow (13) Page 264 – 266 #6 – 16 Even, 22, 24, 30 and 32 (14) Chapter Review Test for *******TEST TOMORROW******* (15) Standardized Test Prep Page 59 #17, 18, Page 268 #1 – 9 Page
388 #8 and 9
2 | P a g e
1.7 Introduction to Functions (I,E)
A ________________ is a rule that establishes a relationship between two quantities, called the __________ and the ____________.
**For each input there is exactly one output** The collection of all input values is the ___________________ of the function and the collection of all output values is the _________________ of the function.
E1. Does the table represent a function?
E2. Make an input-output table for the function. Use 0, 1, 2 and 3 as the domain.
y = 3x + 2
E3. Make an input-output table for the function. Use 1, 1.5, 3, 4.5 and 6 as the domain.
y = x2 – 0.5
Input 0 1 3 4 Output 3 1 1 2
Input Output
1 3
2 6
3 11
4 18
0
1
3
4
3
1
2
Input Output
3 | P a g e
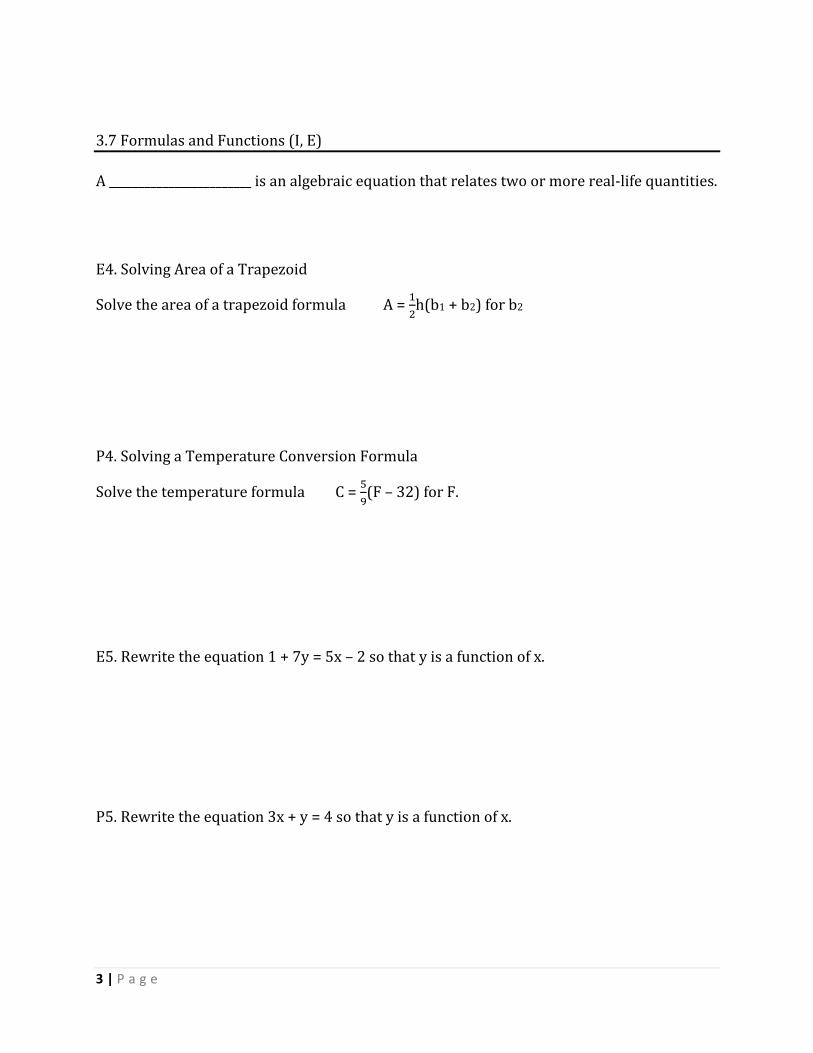
3.7 Formulas and Functions (I, E)
A ________________________ is an algebraic equation that relates two or more real-life quantities.
E4. Solving Area of a Trapezoid
Solve the area of a trapezoid formula A = 1
2h(b1 + b2) for b2
P4. Solving a Temperature Conversion Formula
Solve the temperature formula C = 5
9(F – 32) for F.
E5. Rewrite the equation 1 + 7y = 5x – 2 so that y is a function of x.
P5. Rewrite the equation 3x + y = 4 so that y is a function of x.
4 | P a g e
4.8 Functions and Relations (I,E)
A ___________________________ is defined to be any set of ordered pairs. A function is a relation in which each input corresponds to exactly one output. Two ways to determine if a relation is a function
1. Given a set of ordered pairs: Examine the domain (set of inputs) a. If the domain repeats, then the relation is not a function (Repeat/Relation)
2. Given a graph: Use the Vertical Line Test a. If any vertical line can be drawn to pass through two or more points on the
graph, then the graph is not a function (Repeat/Relation)
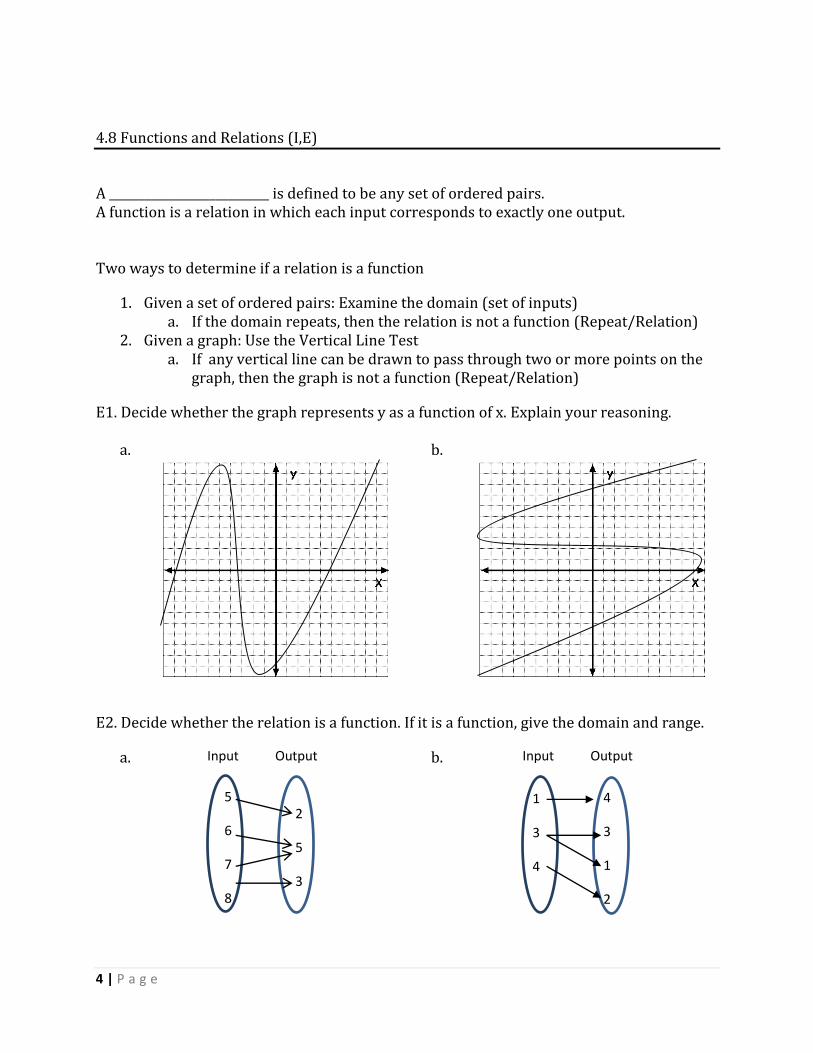
E1. Decide whether the graph represents y as a function of x. Explain your reasoning.
a. b.
E2. Decide whether the relation is a function. If it is a function, give the domain and range.
a. b.
5
6
7
8
2
5
3
Input Output Input Output
4
3
1
2
1
3
4
5 | P a g e
4.8 Functions and Relations (I,E)
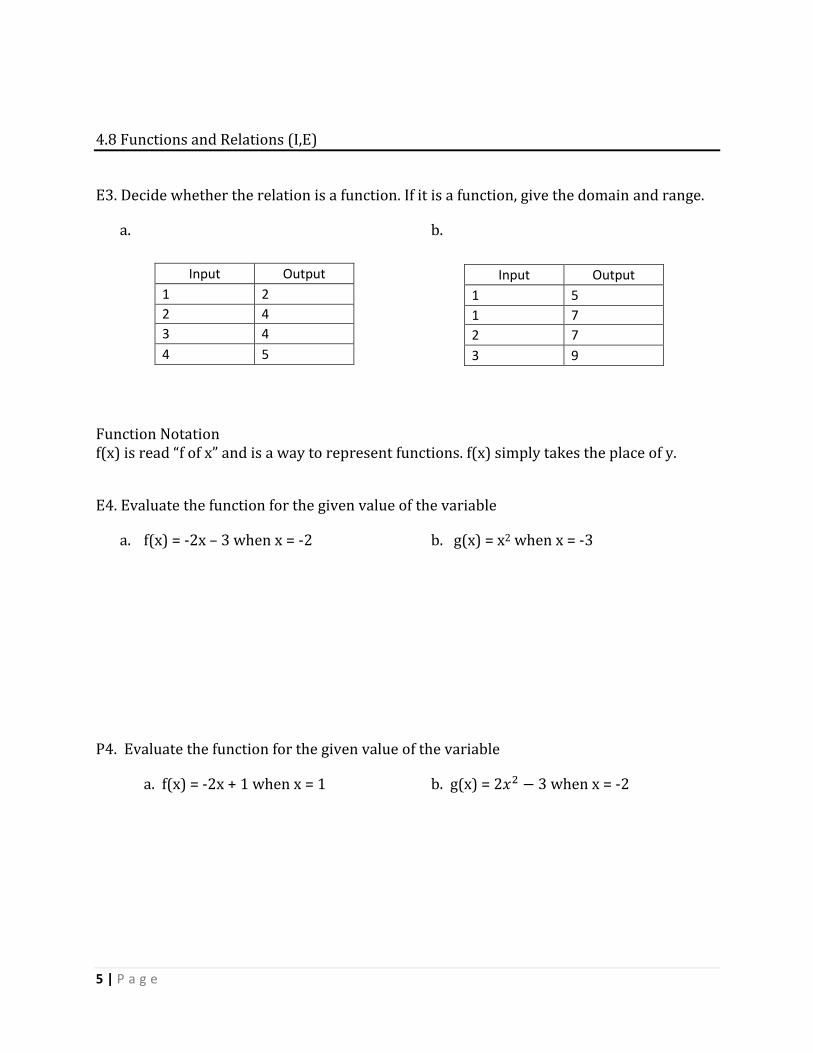
E3. Decide whether the relation is a function. If it is a function, give the domain and range.
a. b.
Function Notation f(x) is read “f of x” and is a way to represent functions. f(x) simply takes the place of y.
E4. Evaluate the function for the given value of the variable
a. f(x) = -2x – 3 when x = -2 b. g(x) = x2 when x = -3
P4. Evaluate the function for the given value of the variable
a. f(x) = -2x + 1 when x = 1 b. g(x) = 2𝑥2 − 3 when x = -2
Input Output
1 2
2 4
3 4
4 5
Input Output
1 5
1 7
2 7
3 9
6 | P a g e
4.4 Slope of a Line (E)
The __________________ m of a nonvertical line is the number of units the line rises or falls for
each unit of horizontal change from left to right. (aka steepness of a line)
Given two points (x1, y1) and (x2, y2):
Slope = 𝑟𝑖𝑠𝑒
𝑟𝑢𝑛 =
𝑐ℎ𝑎𝑛𝑔𝑒 𝑖𝑛 𝑦
𝑐ℎ𝑎𝑛𝑔𝑒 𝑖𝑛 𝑥 =
𝑦2−𝑦1
𝑥2−𝑥1
Positive slope means line rises from left to right
Negative slope means line falls from left to right
Zero slope means line is horizontal (HOY)
Undefined slope means line is vertical (VUX)
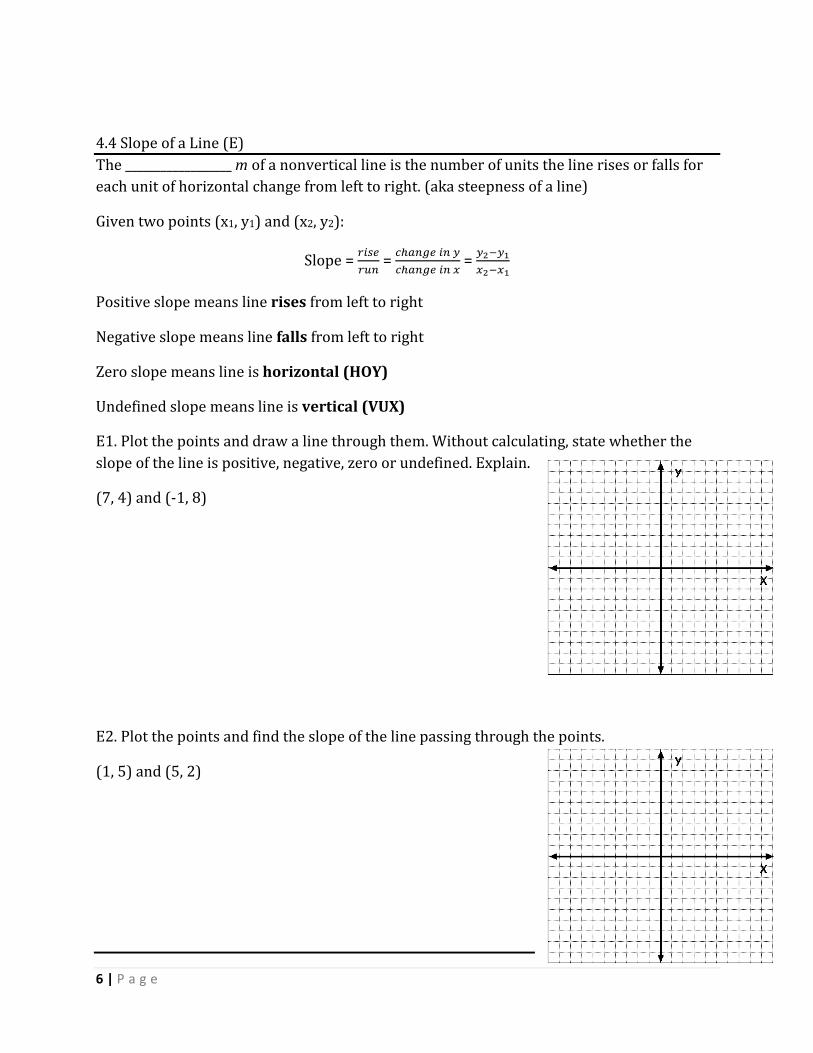
E1. Plot the points and draw a line through them. Without calculating, state whether the
slope of the line is positive, negative, zero or undefined. Explain.
(7, 4) and (-1, 8)
E2. Plot the points and find the slope of the line passing through the points.
(1, 5) and (5, 2)
7 | P a g e
4.4 Slope of a Line (E)
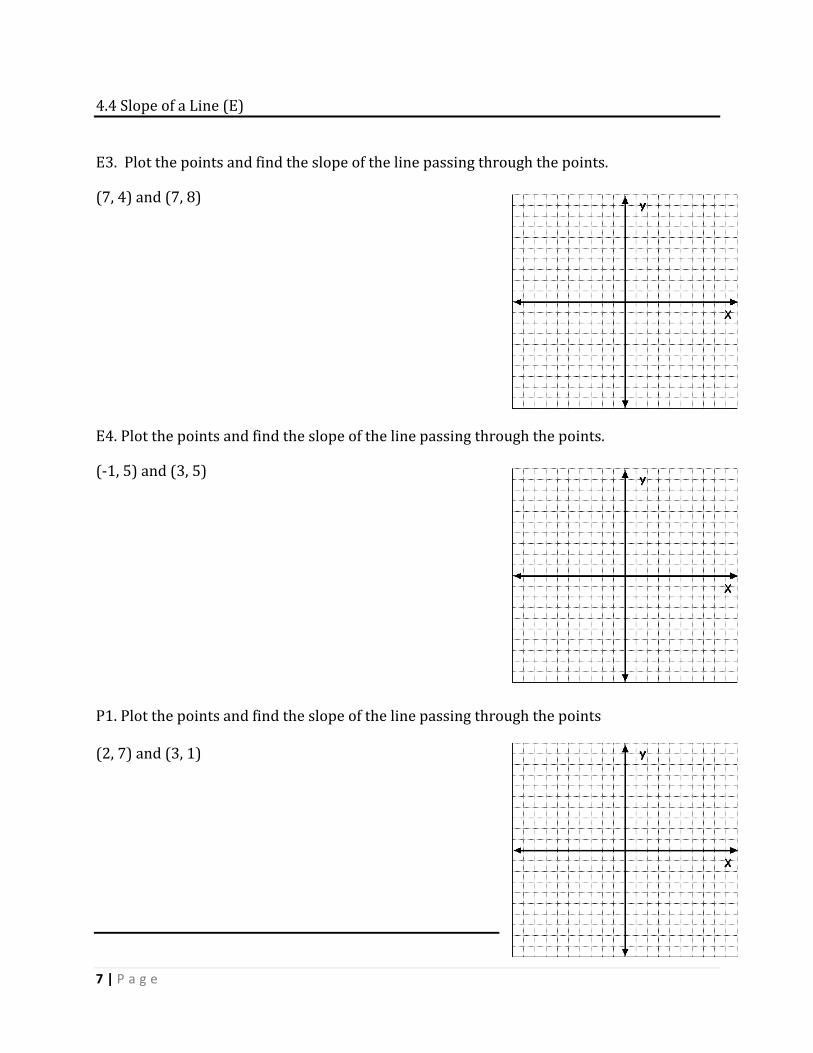
E3. Plot the points and find the slope of the line passing through the points.
(7, 4) and (7, 8)
E4. Plot the points and find the slope of the line passing through the points.
(-1, 5) and (3, 5)
P1. Plot the points and find the slope of the line passing through the points (2, 7) and (3, 1)
8 | P a g e
4.2 Graphing Linear Equations-Equation, Table and Graph (E)
E1. Use the graph to decide whether the point lies on the graph of the line. Justify your answer algebraically.
a. (2, 3) b. (-1, 2)
E2. Decide whether the given ordered pair is a solution of the equation.
6y – 3x = -9; (2, -1)
E3. Rewrite the equation in function form
2x + 3y = 6
Graph using a table of values. Label each graph on the coordinate plane.
E4. y + 2 = 3x
E5. -3x = 6 (VUX)
E6. 2y + 1 = 9 (HOY)
y = 1
2x + 2
9 | P a g e
4.3 Quick Graphs Using Intercepts (E)
An __________________________________is the x – coordinate of a point where the graph crosses
the x-axis. A __________________________________ is the y-coordinate of a point where the graph
crosses the y-axis.
E7. Find the x-intercept and the y-intercept of the graph of the equation 2x + 3y = 6
E8. Graph the equation y = 4x + 4 using the intercept method.
10 | P a g e
4.6 Quick Graphs Using Slope – Intercept Form (E)
Slope – Intercept Form (SIF)
y = mx + b
The _______________ of the line is m
The ___________________ of the line is b
E9. State the slope and y-intercept of the graph of y = -x + 2
E10. Write the equation in slope-intercept form (SIF).
2x – 4y = 16
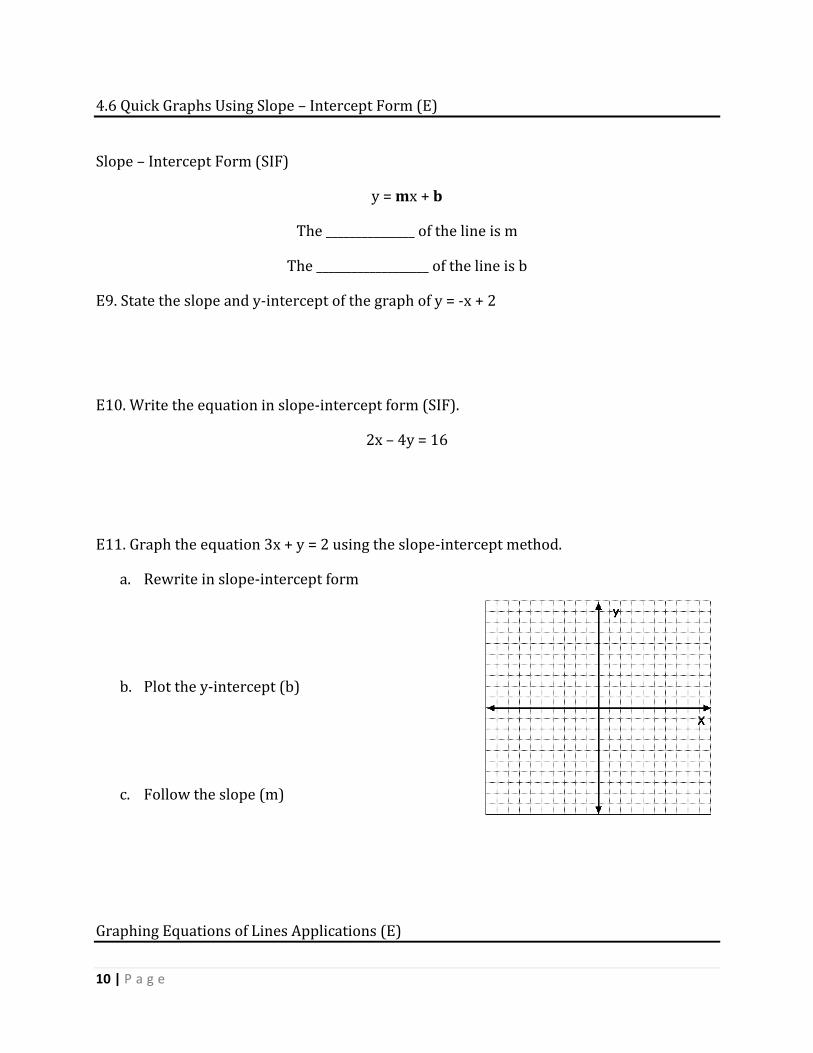
E11. Graph the equation 3x + y = 2 using the slope-intercept method.
a. Rewrite in slope-intercept form
b. Plot the y-intercept (b)
c. Follow the slope (m)
Graphing Equations of Lines Applications (E)
11 | P a g e
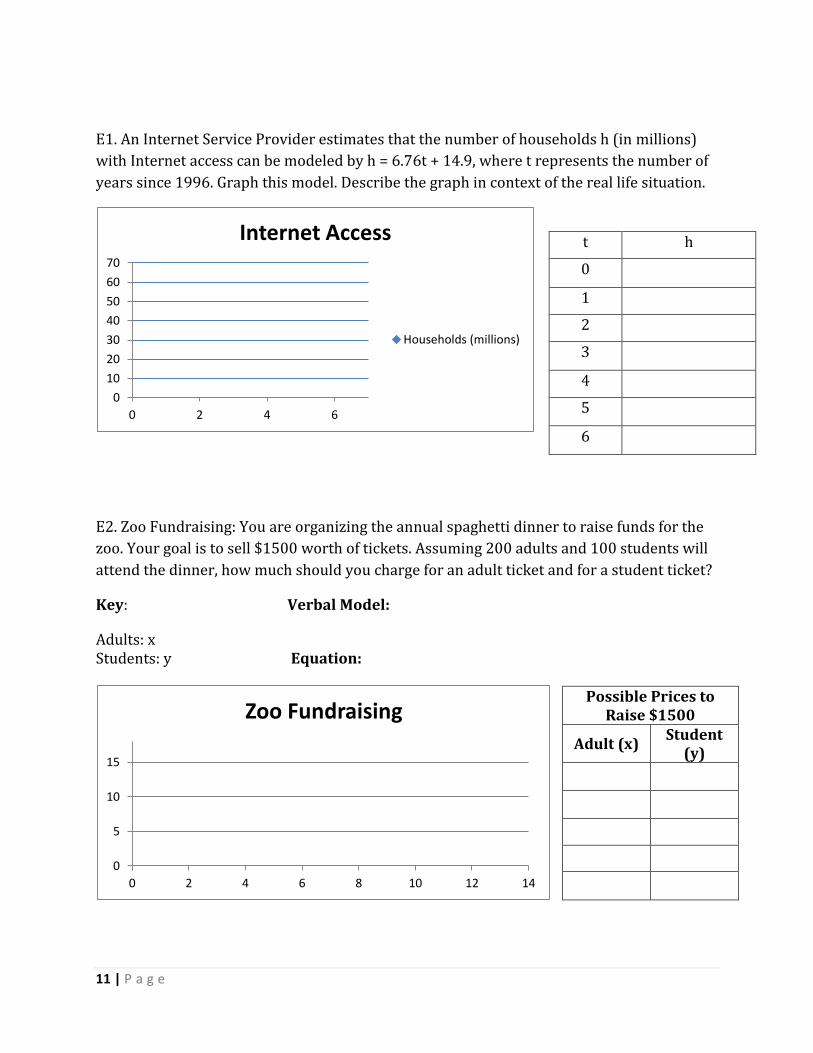
E1. An Internet Service Provider estimates that the number of households h (in millions)
with Internet access can be modeled by h = 6.76t + 14.9, where t represents the number of
years since 1996. Graph this model. Describe the graph in context of the real life situation.
E2. Zoo Fundraising: You are organizing the annual spaghetti dinner to raise funds for the
zoo. Your goal is to sell $1500 worth of tickets. Assuming 200 adults and 100 students will
attend the dinner, how much should you charge for an adult ticket and for a student ticket?
Key: Verbal Model:
Adults: x Students: y Equation:
0
10
20
30
40
50
60
70
0 2 4 6
Internet Access
Households (millions)
0
5
10
15
0 2 4 6 8 10 12 14
Zoo Fundraising
t h
0
1
2
3
4
5
6
Possible Prices to Raise $1500
Adult (x) Student
(y)
12 | P a g e
Graphing Equations of Lines Applications (E)
A __________________ of _____________________ compares two different quantities that are
changing. Slope provides an important way of visualizing a rate of change.
E3. You are parachuting. At time t = 0 seconds, you open your parachute at height h =
2500 feet above the ground. At time t = 35 seconds, you are at height h = 2115 feet.
a. What is your rate of change in height?
Use the formula for slope to find the rate of change.
Verbal Model Rate of Change = 𝐶ℎ𝑎𝑛𝑔𝑒 𝑖𝑛 ℎ𝑒𝑖𝑔ℎ𝑡
𝐶ℎ𝑎𝑛𝑔𝑒 𝑖𝑛 𝑡𝑖𝑚𝑒
b. About when will you reach the ground?
Verbal Model Time =𝐷𝑖𝑠𝑡𝑎𝑛𝑐𝑒
𝑅𝑎𝑡𝑒
E4. City Planning: You are an intern at a city planner’s office and are asked to create a
graph for a planning board meeting. The graph will represent different heights of a local
river during a flood.
You are given the following equations to model the changing river heights. In each
equation, h represents the height of the river (in feet) and t represents the time (in hours)