Page 1
Algorithm Theoretical Basis
Document for the Precipitation
Product Processors of the NWC/GEO
Code:NWC/CDOP2/GEO/AEMET/SCI/ATBD/Precipitation
Issue: 1.11 Date: 15 October 2016 File:NWC-CDOP2-GEO-AEMET-SCI-ATBD-
Precipitation_v1.1.doc
Page: 1/63
Algorithm Theoretical Basis Document
for the Precipitation Product Processors
of the NWC/GEO
NWC/CDOP2/GEO/AEMET/SCI/ATBD/Precipitation, Issue 1, Rev. 1
15 October 2016
Applicable to
GEO-PC-v153 (NWC-018)
GEO-CRR-v401 (NWC-023)
GEO-PC-Ph-v1.1 (NWC-076a)
GEO-CRR-Ph-v1.1 (NWC-080a)
Prepared by AEMET
Page 2
Algorithm Theoretical Basis
Document for the Precipitation
Product Processors of the NWC/GEO
Code:NWC/CDOP2/GEO/AEMET/SCI/ATBD/Precipitation
Issue: 1.11 Date: 15 October 2016 File:NWC-CDOP2-GEO-AEMET-SCI-ATBD-
Precipitation_v1.1.doc
Page: 2/63
REPORT SIGNATURE TABLE
Function Name Signature Date
Prepared by Cecilia Marcos (AEMET)
Antonio Rodríguez (AEMET)
15 October 2016
Reviewed by Xavier Calbet (AEMET) 15 October 2016
Authorised by Pilar Rípodas
NWC SAF Project Manager
15 October 2016
Page 3
Algorithm Theoretical Basis
Document for the Precipitation
Product Processors of the NWC/GEO
Code:NWC/CDOP2/GEO/AEMET/SCI/ATBD/Precipitation
Issue: 1.11 Date: 15 October 2016 File:NWC-CDOP2-GEO-AEMET-SCI-ATBD-
Precipitation_v1.1.doc
Page: 3/63
DOCUMENT CHANGE RECORD
Version Date Pages CHANGE(S)
1.0 29 November 2013 61 Initial version (content derived from Algorithm
Theoretical Basis Document for “Convective
Rainfall Rate” (CRR-PGE05 v4.0) and
Algorithm Theoretical Basis Document for
“Precipitation products from Cloud Physical
Properties” (PPh-PGE14: PCPh v1.0 & CRPh
v1.0))
Indications and recommendations given by the
NWC SAF SW Package GEO V2015 PDCR
have been included, except for RIDs 049 and 056
that will be implemented in next version of the
document and RID 055 that will be implemented
in the Product User Manual document.
1.1 15 October 2016
63 Inclusion of PC product information and update
of precipitation products description and
validation for STRR.
Update of precipitation products description and
validation for DRR.
Indications and recommendations given by the
NWC SAF SW Package GEO V2016 STRR and
GEO V2016 DRR have been included.
Page 4
Algorithm Theoretical Basis
Document for the Precipitation
Product Processors of the NWC/GEO
Code:NWC/CDOP2/GEO/AEMET/SCI/ATBD/Precipitation
Issue: 1.11 Date: 15 October 2016 File:NWC-CDOP2-GEO-AEMET-SCI-ATBD-
Precipitation_v1.1.doc
Page: 4/63
Table of contents
1. INTRODUCTION ................................................................................................................... 7
1.1 SCOPE OF THE DOCUMENT ....................................................................................................... 7 1.2 SOFTWARE VERSION IDENTIFICATION ..................................................................................... 7 1.3 IMPROVEMENT FROM PREVIOUS VERSION ................................................................................ 7 1.4 DEFINITIONS, ACRONYMS AND ABBREVIATIONS ..................................................................... 7 1.5 REFERENCES ........................................................................................................................... 9
1.5.1 Applicable Documents ....................................................................................................... 9 1.5.2 Reference Documents ........................................................................................................ 9
2. DESCRIPTION OF PRECIPITATING CLOUDS (PC) PRODUCT .............................. 11
2.1 PRECIPITATING CLOUDS (PC) OVERVIEW ............................................................................. 11 2.2 PRECIPITATING CLOUDS (PC) ALGORITHM DESCRIPTION ...................................................... 11
2.2.1 Theoretical description .................................................................................................... 11 2.2.2 Practical considerations .................................................................................................. 11
2.3 ASSUMPTIONS AND LIMITATIONS ............................................................................. 14
3. DESCRIPTION OF CONVECTIVE RAINFALL RATE (CRR) PRODUCT ................ 11
3.1 CONVECTIVE RAINFALL RATE (CRR) OVERVIEW .................................................................. 15 3.2 CONVECTIVE RAINFALL RATE (CRR) ALGORITHM DESCRIPTION ........................................... 16
3.2.1 Theoretical description .................................................................................................... 16 3.2.2 Practical considerations .................................................................................................. 28
3.3 ASSUMPTIONS AND LIMITATIONS .......................................................................................... 33 3.4 REFERENCES ......................................................................................................................... 34
4. DESCRIPTION OF PRECIPITATING CLOUDS FROM CLOUD PHYSICAL
PROPERTIES (PC-PH) PRODUCT FOR DAYTIME ............................................................. 35
4.1 PRECIPITATING CLOUDS FROM CLOUD PHYSICAL PROPERTIES (PC-PH) OVERVIEW .............. 35 4.2 PRECIPITATING CLOUDS FROM CLOUD PHYSICAL PROPERTIES (PC-PH) DAYTIME ALGORITHM
DESCRIPTION ..................................................................................................................................... 35 4.2.1 Theoretical description .................................................................................................... 35 4.2.2 Practical considerations .................................................................................................. 41
4.3 ASSUMPTIONS AND LIMITATIONS .......................................................................................... 43 4.4 REFERENCES ......................................................................................................................... 44
5. DESCRIPTION OF CONVECTIVE RAINFALL RATE FROM CLOUD PHYSICAL
PROPERTIES (CRR-PH) PRODUCT FOR DAYTIME .......................................................... 45
5.1 CONVECTIVE RAINFALL RATE FROM CLOUD PHYSICAL PROPERTIES (CRR-PH) OVERVIEW .. 45 5.2 CONVECTIVE RAINFALL RATE FROM CLOUD PHYSICAL PROPERTIES (CRR-PH) DAYTIME
ALGORITHM DESCRIPTION ................................................................................................................. 45 5.2.1 Theoretical description .................................................................................................... 45 5.2.2 Practical considerations .................................................................................................. 51
5.3 ASSUMPTIONS AND LIMITATIONS .......................................................................................... 56 5.4 REFERENCES ......................................................................................................................... 57
6. ANNEX A: PARALLAX CORRECTION .......................................................................... 58
7. ANNEX B: LIGHTNING ALGORITHM ........................................................................... 60
8. ANNEX C: HOURLY ACCUMULATIONS ...................................................................... 62
Page 5
Algorithm Theoretical Basis
Document for the Precipitation
Product Processors of the NWC/GEO
Code:NWC/CDOP2/GEO/AEMET/SCI/ATBD/Precipitation
Issue: 1.11 Date: 15 October 2016 File:NWC-CDOP2-GEO-AEMET-SCI-ATBD-
Precipitation_v1.1.doc
Page: 5/63
List of Tables and Figures
Table 1: List of Applicable Documents .............................................................................................9
Table 2: List of Referenced Documents ..........................................................................................10
Table 3. PC SEVIRI inputs .............................................................................................................11
Table 4. Description of the radar calibration data ...........................................................................18
Table 5. CRR SEVIRI inputs ..........................................................................................................28
Table 6. False alarm ratio obtained for 0% < PoP ≤ 20% depending on ICP .................................39
Table 7. False alarm ratio obtained for 20% < PoP ≤ 40% depending on ICP ...............................39
Table 8. False alarm ratio obtained for 40% < PoP ≤ 60% depending on ICP ...............................39
Table 9. False alarm ratio obtained for 60% < PoP ≤ 80% depending on ICP ..............................40
Table 10. False alarm ratio obtained for 80% < PoP ≤ 100% depending on ICP ...........................40
Figure 1. Example of the precipitating clouds product over a day-time scene on 9th June 2015 at
12:00 UTC .............................................................................................................................14
Figure 2. Example of the precipitating clouds product over a night-time scene on 9th June 2015 at
03:30 UTC ...............................................................................................................................14
Figure 3. From calibration matrices to analytical functions ...........................................................18
Figure 4. Height of the 2-V function plotted between 205K and 235K .........................................20
Figure 5. Coefficient related to the position of the symmetry axis of the 2-V function .................20
Figure 6. Coefficient that provides information on the width of the 2-V function .........................21
Figure 7. Height of the 3-V function plotted between 205K and 235K . ........................................22
Figure 8. Coefficient related to the position of the symmetry axis of the 3-V function . ................22
Figure 9. Coefficient that provides information on the width of the 3-V function .........................23
Figure 10. Dependence of the 3-V function on the Normalized Visible Reflectances....................24
Figure 11. Dependence of the Normalized Visible reflectances on Latitude ..................................24
Figure 12. CRR instantaneous intensities output corresponding to 9th June 2015 at 12:00Z .........32
Figure 13. CRR hourly accumulations output corresponding to 9th June 2015 at 12:00Z .............32
Figure 14. Schematic illustration of the procedure followed to tune PC-Ph product representing
the CWP isolines connected with the different FAR values (no real data). ............................37
Figure 15. Data pairs obtained for PC-Ph tuning . ..........................................................................37
Figure 16. Function that connects probability of precipitation with CWP ......................................38
Figure 17. PC-Ph probability of precipitation for 9th June 2015 at 15:00 UTC over Europe and
North Africa.............................................................................................................................43
Figure 18. Annular bins used for calibration over a Radar image on the left and over a rain/no rain
CWP map on the right. ............................................................................................................46
Figure 19. Accuracy statistics obtained in the comparison of number of rainy pixels in annular
bins for Spanish storms ...........................................................................................................47
Page 6
Algorithm Theoretical Basis
Document for the Precipitation
Product Processors of the NWC/GEO
Code:NWC/CDOP2/GEO/AEMET/SCI/ATBD/Precipitation
Issue: 1.11 Date: 15 October 2016 File:NWC-CDOP2-GEO-AEMET-SCI-ATBD-
Precipitation_v1.1.doc
Page: 6/63
Figure 20. Results of rain rates calibration. Radar rain rates vs CWP, thresholds . ........................47
Figure 21. Average of (N-CRR-Phmax/ N-Radarmax) for different ICP ranges ............................49
Figure 22. Percentage of the cases when N-CRR-Phmax is lower or equal N-Radarmax. ..................50
Figure 23. Percentage of the cases when N-CRR-Phmax is lower or equal than two times N-
Radarmax. ..................................................................................................................................50
Figure 24. Percentage of the cases when N-CRR-Phmax is lower or equal than three times N-
Radarmax ...................................................................................................................................50
Figure 25. Relation between ICP and CRR-Ph_IQF .......................................................................51
Figure 26. CRR-Ph instantaneous rain rates for 9th June 2015 at 15:00 UTC over Europe and
North Africa.............................................................................................................................55
Figure 27. CRR-Ph hourly accumultions for 9th June 2015 at 15:00 UTC over Europe and North
Africa .......................................................................................................................................55
Figure 28. CRR-Ph illumination quality flag for 9th June 2015 at 15:00 UTC over Europe and
North Africa.............................................................................................................................56
Figure 29. Parallax geometry ..........................................................................................................58
Figure 30. Spreading of the RLR value in a 5 by 5 pixels box .......................................................60
Figure 31. Diagram that shows the relationship between Δτ and Δt ...............................................61
Figure 32. Trapezoidal integration ..................................................................................................62
Page 7
Algorithm Theoretical Basis
Document for the Precipitation
Product Processors of the NWC/GEO
Code:NWC/CDOP2/GEO/AEMET/SCI/ATBD/Precipitation
Issue: 1.11 Date: 15 October 2016 File:NWC-CDOP2-GEO-AEMET-SCI-ATBD-
Precipitation_v1.1.doc
Page: 7/63
1. INTRODUCTION
The Eumetsat “Satellite Application Facilities” (SAF) are dedicated centres of excellence for
processing satellite data, and form an integral part of the distributed EUMETSAT Application
Ground Segment (http://www.eumetsat.int). This documentation is provided by the SAF on
Support to Nowcasting and Very Short Range Forecasting, NWC SAF. The main objective of
NWC SAF is to provide, further develop and maintain software packages to be used for
Nowcasting applications of operational meteorological satellite data by National Meteorological
Services. More information can be found at the NWC SAF webpage, http://www.nwcsaf.org. This
document is applicable to the NWC SAF processing package for geostationary meteorological
satellites, NWC/GEO.
1.1 SCOPE OF THE DOCUMENT
This document is the Algorithm Theoretical Basis Document for the precipitation products
Precipitating Clouds (PC), Convective Rainfall Rate (CRR) and Precipitation products from
Cloud Physical Properties (PPh) of the NWC/GEO software package. PPh generates two different
products: Precipitating Clouds from Cloud Physical Properties (PC-Ph) and Convective Rainfall
rate from Cloud Physical Properties (CRR-Ph).
The Algorithm Theoretical Basis Document describes the physics of the problem together with the
mathematical description of the algorithm. It also provides information on the objectives, the
needed input data and the outputs of the products.
Although it was foreseen to make available night-time algorithms for PPh products in NWC/GEO
v2016 software package, it has not been possible to include the relevant information in this
document. Most probably, the availability of such night-time algorithms should be postponed to
subsequent versions of the package.
1.2 SOFTWARE VERSION IDENTIFICATION
This document describes the algorithms implemented in the release 2016 of the NWC-GEO
software package (GEO-PC v1.5.3, GEO-CRR v4.0.1, GEO-PC-Ph v1.0 and GEO-CRR-Ph
v1.0.1).
1.3 IMPROVEMENT FROM PREVIOUS VERSION
Since 2013 release, these technical improvements have been implemented:
Interface to updated NWCLIB
New output format
Technical adaptation to process other meteorological geostationary satellites than MSG
New calibration of GEO-PPh (to be done)
1.4 DEFINITIONS, ACRONYMS AND ABBREVIATIONS
AEMET Agencia Estatal de Meteorología
ATBD Algorithm Theoretical Basis Document
BALTRAD Baltic Radar Network
CAPPI Constant Altitude Plan Position Indicator
Page 8
Algorithm Theoretical Basis
Document for the Precipitation
Product Processors of the NWC/GEO
Code:NWC/CDOP2/GEO/AEMET/SCI/ATBD/Precipitation
Issue: 1.11 Date: 15 October 2016 File:NWC-CDOP2-GEO-AEMET-SCI-ATBD-
Precipitation_v1.1.doc
Page: 8/63
COT Cloud Optical Thickness
CRR-Ph Convective Rainfall Rate from Cloud Physical Properties
CRR Convective Rainfall Rate
CSI Critical Success Index
CT Cloud Type
CWP Cloud Water Path
EUMETSAT European Organisation for the Exploitation of Meteorological Satellites
FAR False Alarm Ratio
HRIT High Rate Information Transmission
ICD Interface Control Document
ICP Illumination Conditions Parameter
IQF Illumination Quality Flag
IR Infrared
MAE Mean Absolute Error
CTMP Cloud Top Microphysical Properties
ME Mean Error
MRV Maximum Reflectivity in the Vertical
MSG Meteosat Second Generation
NIR Near Infrared
NWCLIB Nowcasting SAF Library
NWC SAF Satellite Application Facility for Nowcasting
PC Precipitating Clouds
PC Percentage of Corrects
PC-Ph Precipitating Clouds from Cloud Physical Properties
PGE Product Generation Element
POD Probability of Detection
PoP Probability of Precipitation
PPh Precipitation from Cloud Physical Properties
PWRH Moisture Correction Factor
Reff Effective Radius
RLR Rainfall-Lightning Ratio
RMSE Root Mean Square Error
RR Rain Rate
SAF Satellite Application Facility
SEVIRI Spinning Enhanced Visible and Infrared Imager
SW Software
Page 9
Algorithm Theoretical Basis
Document for the Precipitation
Product Processors of the NWC/GEO
Code:NWC/CDOP2/GEO/AEMET/SCI/ATBD/Precipitation
Issue: 1.11 Date: 15 October 2016 File:NWC-CDOP2-GEO-AEMET-SCI-ATBD-
Precipitation_v1.1.doc
Page: 9/63
2-V 2-Variable
3-V 3-Variable
VIS Visible
VIS-N Normalized Visible
WV Water Vapour
1.5 REFERENCES
1.5.1 Applicable Documents
The following documents, of the exact issue shown, form part of this document to the extent
specified herein. Applicable documents are those referenced in the Contract or approved by the
Approval Authority. They are referenced in this document in the form [AD.X].
For dated references, subsequent amendments to, or revisions of, any of these publications do not
apply. For undated references, the current edition of the document referred applies.
Current documentation can be found at the NWC SAF Helpdesk web: http://www.nwcsaf.org
Reference Title Code Vers Date
[AD. 1] Proposal for the Second Continuous
Development and Operations Phase (CDOP)
March 2012 – February 2017
NWC/CDOP2/MGT/AEMET/PRO 1.0 15/03/11
[AD. 2] NWCSAF Project Plan NWC/CDOP2/SAF/AEMET/MGT/
PP
1.9 15/10/16
[AD 3] Configuration Management Plan for the NWC
SAF
NWC/CDOP2/SAF/AEMET/MGT/
CMP
1.4 15/10/16
[AD 4] NWCSAF Product Requirements Document NWC/CDOP2/SAF/AEMET/MGT/
PRD
1.9 31/08/16
Table 1: List of Applicable Documents
1.5.2 Reference Documents
The reference documents contain useful information related to the subject of the project. These
reference documents complement the applicable ones, and can be looked up to enhance the
information included in this document if it is desired. They are referenced in this document in the
form [RD.X].
For dated references, subsequent amendments to, or revisions of, any of these publications do not
apply. For undated references, the current edition of the document referred applies.
Current documentation can be found at the NWC SAF Helpdesk web: http://www.nwcsaf.org
Page 10
Algorithm Theoretical Basis
Document for the Precipitation
Product Processors of the NWC/GEO
Code:NWC/CDOP2/GEO/AEMET/SCI/ATBD/Precipitation
Issue: 1.11 Date: 15 October 2016 File:NWC-CDOP2-GEO-AEMET-SCI-ATBD-
Precipitation_v1.1.doc
Page: 10/63
Reference Title Code Vers Date
[RD 1] Algorithm Theoretical Basis Document for
SAFNWC/MSG “Precipitating Cloud” (PC-
PGE04 v1.5)
SAF/NWC/CDOP2/SMHI/SCI/AT
BD/4
1.5.4 15/07/13
[RD 2] Scientific and Validation Report for the
Precipitation Product Processors of the
NWC/GEO
NWC/CDOP2/GEO/AEMET/SCI/
VR/Precipitation
1.0 15/10/16
[RD 3] Data Output Format for the NWC/GEO NWC/CDOP2/GEO/AEMET/SW/
DOF
1.1 15/01/15
[RD 4] Interface Control Document for Internal and
External Interfaces of the NWC/GEO
NWC/CDOP2/GEO/AEMET/SW/I
CD/1
1.1 15/01/15
[RD 5] User User Manual for the Precipitation Product
Processors of the NWC/GEO
NWC/CDOP2/GEO/AEMET/SCI/
UM/Precipitation
1.0 15/10/16
[RD 6] Algorithm Theoretical Basis Document for the
Cloud Product Processors of the NWC/GEO NWC/CDOP2/GEO/MFL/SCI/AT
BD/Cloud
1.1 15/10/16
[RD 7] Software User Manual of the Parallax
Correction Processor of the NWC/GEO NWC/CDOP2/GEO/AEMET/SW/S
UM/PLAX
1.0d 18/05/15
Table 2: List of Referenced Documents
Page 11
Algorithm Theoretical Basis
Document for the Precipitation
Product Processors of the NWC/GEO
Code:NWC/CDOP2/GEO/AEMET/SCI/ATBD/Precipitation
Issue: 1.11 Date: 15 October 2016 File:NWC-CDOP2-GEO-AEMET-SCI-ATBD-
Precipitation_v1.1.doc
Page: 11/63
2. DESCRIPTION OF PRECIPITATING CLOUDS (PC) PRODUCT
2.1 PRECIPITATING CLOUDS (PC) OVERVIEW
Refer to section 2.1 of Algorithm Theoretical Basis Document for SAFNWC/MSG
“PrecipitatingCloud” (PC-PGE04 v1.5) [RD 1].
2.2 PRECIPITATING CLOUDS (PC) ALGORITHM DESCRIPTION
2.2.1 Theoretical description
Refer to section 2.2 of Algorithm Theoretical Basis Document for SAFNWC/MSG
“PrecipitatingCloud” (PC-PGE04 v1.5) [RD 1].
2.2.2 Practical considerations
2.2.2.1 List of Precipitating Clouds (PC) inputs
Satellite imagery:
The following SEVIRI brightness temperatures and visible reflectances are needed at full IR
spatial resolution:
VIS0.6 NIR1.6 IR3.9 IR6.2 IR7.3 IR10.8 IR12.0
Day-time Day-time Day-time Day-time and Night-
time
Day-time and Night-
time
Day-time and Night-
time
Day-time and Night-
time
Table 3. PC SEVIRI inputs
The SEVIRI channels are input by the user in HRIT format and extracted on the desired region by
NWC-GEO software package.
Cloud type (CT) product output:
CT output, in NetCDF format, is mandatory input to PC.
NWP parameters:
NWP surface temperature is a mandatory input for PC.
Sun and satellite angles associated to satellite imagery
This information is mandatory. It is computed by the PC software itself, using the definition of the
region and the satellite characteristics.
2.2.2.2 Description of the Precipitating Clouds (PC) output
The content of the PC output is described in the Data Output Format Document [RD 3]. A summary
is given below:
Page 12
Algorithm Theoretical Basis
Document for the Precipitation
Product Processors of the NWC/GEO
Code:NWC/CDOP2/GEO/AEMET/SCI/ATBD/Precipitation
Issue: 1.11 Date: 15 October 2016 File:NWC-CDOP2-GEO-AEMET-SCI-ATBD-
Precipitation_v1.1.doc
Page: 12/63
Container Content
PC NWC GEO PC Total Precipitation Likelihood:
Class Total Precipitation Likelihood (%)
0 0
1 10
2 20
3 30
4 40
5 50
6 60
7 70
8 80
9 90
10 100
FillValue No data or corrupted data
Geophysical Conditions Field Type Description
Space Flag Set to 1 for space pixels
Illumination Parameter Defines the illumination condition
0: N/A (space pixel)
1: Night
2: Day
3: Twilight
Sunglint Flag Set to 1 if Sunglint
Land_Sea Parameter 0: N/A (space pixel)
1: Land
2: Sea
3: Coast
Page 13
Algorithm Theoretical Basis
Document for the Precipitation
Product Processors of the NWC/GEO
Code:NWC/CDOP2/GEO/AEMET/SCI/ATBD/Precipitation
Issue: 1.11 Date: 15 October 2016 File:NWC-CDOP2-GEO-AEMET-SCI-ATBD-
Precipitation_v1.1.doc
Page: 13/63
Processing Conditions Field Type Description
Satellite_input_data Parameter Describes the Satellite input data status
0: N/A (space pixel)
1: All satellite data are available
2: At least one useful satellite channel is missing
3: At least one mandatory satellite channel is missing
NWP_input_data Parameter Describes the NWP input data status
0: N/A (space pixel or NWP data not used)
1: All NWP data are available
2: At least one useful NWP field is missing
3: At least one mandatory NWP field is missing
Product_input_data Parameter Describes the Product input data status
0: N/A (space pixel or Auxiliary data not used)
1: All input Product data are available
2: At least one useful input Product is missing
3: At least one mandatory input Product is missing
Auxiliary_input_data Parameter Describes the Auxiliary input data status
0: N/A (space pixel or Auxiliary data not used)
1: All Auxiliary data are available
2: At least one useful Auxiliary field is missing
3: At least one mandatory Auxiliary field is missing
Quality Field Type Description
Nodata Flag Set to 1 if pixel is NODATA
Internal_consistency Flag Set to 1 if an internal consistency check has been performed. Internal
consistency checks will be based in the comparison of the retrieved
meteorological parameter with physical limits, climatological limits,
neighbouring data, NWP data, etc.
Temporal_consistency Flag Set to 1 if a temporal consistency check has been performed
Temporal consistency checks will be based in the comparison of the retrieved
meteorological parameters with data obtained in previous slots.
Quality Parameter Retrieval Quality
0: N/A (no data)
1: Good
2: Questionable
3: Bad
4: Interpolated
Another file is generated including statistical information related to the product generation. It
contains histograms of precipitation probability and processing flags, and it is generated in ascii
format. This file may be useful to get statistics on general algorithm performance.
Page 14
Algorithm Theoretical Basis
Document for the Precipitation
Product Processors of the NWC/GEO
Code:NWC/CDOP2/GEO/AEMET/SCI/ATBD/Precipitation
Issue: 1.11 Date: 15 October 2016 File:NWC-CDOP2-GEO-AEMET-SCI-ATBD-
Precipitation_v1.1.doc
Page: 14/63
2.2.2.3 Example of Precipitating Clouds (PC) visualisation
Examples of both day-time and night-time PC product can be found below:
Figure 1. Example of the precipitating clouds product over a day-time scene on 9th June 2015 at
12:00 UTC
Figure 2. Example of the precipitating clouds product over a night-time scene on 9th June 2015 at
03:30 UTC
2.3 ASSUMPTIONS AND LIMITATIONS
Refer to section 3 of Algorithm Theoretical Basis Document for SAFNWC/MSG
“PrecipitatingCloud” (PC-PGE04 v1.5) [RD 1].
Page 15
Algorithm Theoretical Basis
Document for the Precipitation
Product Processors of the NWC/GEO
Code:NWC/CDOP2/GEO/AEMET/SCI/ATBD/Precipitation
Issue: 1.11 Date: 15 October 2016 File:NWC-CDOP2-GEO-AEMET-SCI-ATBD-
Precipitation_v1.1.doc
Page: 15/63
3. DESCRIPTION OF CONVECTIVE RAINFALL RATE (CRR)
PRODUCT
3.1 CONVECTIVE RAINFALL RATE (CRR) OVERVIEW
Convective Rainfall Rate (CRR) product is a Nowcasting tool that provides information on
convective, and stratiform associated to convection, instantaneous rain rates and hourly accumulations. This product does not distinguish the phase of the estimated precipitation.
In the processing of the product, CRR uses some calibration analytical functions that have been
calibrated taking as “truth” the radar data. There are two types of functions:
• 2-Variable (2-V) function that depends on 10.8IR and (10.8IR - 6.2WV) SEVIRI data
• 3-Variable (3-V) function that depends on 10.8IR, (10.8IR - 6.2WV) and 0.6VIS-N
SEVIRI data
The 3-V calibration analytical function gives better results but there are some situations in which
it can’t be used, for instance, during the night time. The type of calibration to be used can be chosen by the user through the CRR model configuration file.
The analytical functions have been calibrated using radar data from:
Baltic radar network
Hungarian radar network
Spanish radar network
To take into account the influence of environmental and orographic effects on the precipitation
distribution, some corrections can be applied to the basic CRR value. The possible corrections are
the moisture correction, the cloud top growth/decaying rates or evolution correction, the cloud top
temperature gradient correction and the orographic correction.
At this stage, the CRR precipitation pattern computed in the previous step is combined with a
precipitation pattern derived through a lightning algorithm.
At the end of the process CRR product produces five different outputs.
In one of them, the CRR value in mm/h is converted into classes. There are 12 classes that divide
the rain rates in some different ranges and each pixel of the output image has a rain class assigned.
There exists an output that contains the information on the instantaneous rain rate in mm/h in each
pixel of the image. The hourly accumulation output gives information about the precipitation
occurred during the last hour.
The classes, the instantaneous rain rate in mm/h and the hourly accumulation outputs have the
same colour palette.
Information on the corrections applied and the processing status is available on the
CRR_QUALITY and CRR_DATAFLAG outputs respectively.
Page 16
Algorithm Theoretical Basis
Document for the Precipitation
Product Processors of the NWC/GEO
Code:NWC/CDOP2/GEO/AEMET/SCI/ATBD/Precipitation
Issue: 1.11 Date: 15 October 2016 File:NWC-CDOP2-GEO-AEMET-SCI-ATBD-
Precipitation_v1.1.doc
Page: 16/63
3.2 CONVECTIVE RAINFALL RATE (CRR) ALGORITHM DESCRIPTION
3.2.1 Theoretical description
In this section the theoretical basis and practical implementation of the algorithm are described.
3.2.1.1 Physics of the problem
All visible and infrared precipitation estimation schemes are necessary indirect because the
radiation does not penetrate through the cloud. The cloud’s brightness temperature and visible
reflectance may be related to the rain falling from it, but the raindrops themselves are not directly
sensed (Kidder and Vonder Haar, 1995).
The empirical relationship that the higher and thicker are the clouds the higher is the probability
of occurrence and the intensity of precipitation is used in the CRR algorithm. Information about
cloud top height and about cloud thickness can be obtained, respectively, from the infrared
brightness temperature (IR) and from the visible reflectances (VIS) (Scofield, 1987) (Vicente and
Scofield, 1996).
IR-WV brightness temperature difference is a useful parameter for extracting deep convective
cloud with heavy rainfall (Kurino, 1996). Negatives values of the IR-WV brightness temperature
difference have been shown to correspond with convective cloud tops that are at or above the
tropopause (Schmetz et al., 1997).
Some observable features (like environmental moisture, cloud growth, cloud top structure,
topography underneath, etc.) affect to convective precipitation rates more than the stratiform rain
cases (Vicente, 1998) (Vicente, 1999).
It is stated that convective phenomena are related to the electrical activity in the clouds. The
lightning algorithm is based on the assumption that the higher is the spatial and temporal density
of lightning occurrence, the stronger is the convective phenomenon and the higher is the
probability of occurrence and the intensity of convective precipitation.
3.2.1.2 Mathematical Description of the Convective Rainfall Rate (CRR) algorithm
3.2.1.2.1 Convective Rainfall Rate (CRR) algorithm outline
The CRR algorithm developed within the NWC SAF context estimates rainfall rates from
convective systems, using IR, WV and VIS-N MSG SEVIRI imagery and calibration analytical
functions generated by combining SEVIRI and Radar data.
The calibration functions, which have been calibrated through a statistical process, try to connect
satellite multi-band imagery with rain rates. In the calibration process composite radar data are
compared pixel by pixel with geographically matched MSG data with the same resolution.
Rainfall rate RR is obtained, as a function of two or three variables (IR brightness temperature,
IR-WV brightness temperature differences and normalised VIS reflectances):
RR = f (IR, IR-WV, VIS-N), for 3-V calibration
RR = f (IR, IR-WV), for 2-V calibration
The basic CRR mm/h value for each pixel is obtained from the calibration functions. If in a pixel
the sun zenith angle is lower than a threshold and the solar channel is used, the basic CRR data is
Page 17
Algorithm Theoretical Basis
Document for the Precipitation
Product Processors of the NWC/GEO
Code:NWC/CDOP2/GEO/AEMET/SCI/ATBD/Precipitation
Issue: 1.11 Date: 15 October 2016 File:NWC-CDOP2-GEO-AEMET-SCI-ATBD-
Precipitation_v1.1.doc
Page: 17/63
obtained from a 3-V analytical function which uses 10.8IR, 6.2WV and 0.6VIS-N imagery. If in a
pixel the sun zenith angle is higher than the threshold or lower, but the solar channel is not going
to be used, the basic rain rate values are obtained from 2-V analytical function which only uses
10.8IR and 6.2WV imagery. The threshold that decides, depending on the sun zenith angle,
whether the solar channel can be used or not, is chosen by the user through the CRR model
configuration file. The name of this threshold in the configuration file is
DAY_NIGHT_ZEN_THRESHOLD and its default value is 80º.
When the solar channel is used, the normalised visible reflectances are obtained dividing by the
cosine of the solar zenith angle. The option of using the solar channel in the computation of the
CRR values can be chosen by the user through the CRR model configuration file.
In the retrieval of basic CRR values from 3-V calibration function, some pixels could occasionally
present normalised visible reflectances greater than 100. In those cases the CRR values will be
retrieved using the 2-V calibration function. This occurs in few instances and has been observed
mainly under very low sun illumination conditions. Those pixels can be easily identified as they
will have assigned a value as a missing data in some channel in the CRR_DATAFLAG output.
A filtering process is performed in order to eliminate stratiform rain data which are not associated
to convective clouds: the obtained basic CRR data are set to zero if all the pixels in a grid of a
selected semisize (def. value: 3pix) centred on the pixel have a value lower than a selected
threshold (def. value: 3mm/h). The threshold and the size of the grid can be modified by the user
by means of the model configuration file.
To take into account the temporal and spatial variability of cloud tops, the amount of moisture
available to produce rain and the influence of orographic effects on the precipitation distribution,
several correction factors can be applied to the basic CRR value. Therefore, the possible
correction factors are the moisture correction, the cloud top growth/decaying rates or evolution
correction, the cloud top temperature gradient correction and the orographic correction.
Lightning activity can provide valuable information about convection. A lightning algorithm can
be applied to derive a precipitation pattern that will be combined with the CRR one computed in
the previous step in order to complement it.
At the end of the process the final values of the CRR rainfall rates in mm/h are used in order to
obtain three different outputs:
CRR rainfall rates in mm/h
CRR classes: rainfall rate in mm/h is divided into twelve classes.
CRR hourly accumulations: A trapezoidal integration is performed in order to
compute the hourly accumulations. The description of this process can be found in
ANNEX C: Hourly accumulations.
Page 18
Algorithm Theoretical Basis
Document for the Precipitation
Product Processors of the NWC/GEO
Code:NWC/CDOP2/GEO/AEMET/SCI/ATBD/Precipitation
Issue: 1.11 Date: 15 October 2016 File:NWC-CDOP2-GEO-AEMET-SCI-ATBD-
Precipitation_v1.1.doc
Page: 18/63
3.2.1.2.2 Convective Rainfall Rate (CRR) calibration analytical functions procedure
The analytical functions have been built taking the previous calibration matrices as starting point.
The calibration matrices obtaining method can be read in ATBD for CRRv3.1.1.
The calibration matrices were modelled and described by the analytical functions that best fitted
them. An example of this modelling can be seen in Figure3.
1 Figure 3. From calibration matrices to analytical functions
The perfect matching between matrices and functions is impossible to reach; also, the calibration
process over a function is easier than over a matrix. For these reasons a new calibration process
was done over the functions.
3.2.1.2.2.1 Analytical functions calibration process
The calibration process was done using the following radar data:
Radar network
Type of
radar
Frequency Scanning
Radar
Dataset used
Type of product
used
MSG scans over the
radar area
Matching time
Baltrad network
C- Band 15 minutes 21 rainy days June-
August 2004
Pseudo-CAPPI at
2Km
About 11 min later than the
MSG time slot
MSG time slot 15 min later than the radar
one.
Hungarian radar network
C- Band 15 minutes 18 rainy days May-September
2009
Maximum reflectivity in the
vertical
(MRV) and
Echotop
About 11 min later than the MSG time
slot
MSG time slot 15 min later than the radar one.
Spanish radar
network
C- Band 10 minutes 111 rainy days
throughout 2009
PPI and Echotop
About 10 min later than the
MSG time slot
0 and 30 min MSG slots have been
matched to 10 and 40 min radar images
respectively.
Table 4. Description of the radar calibration data
Page 19
Algorithm Theoretical Basis
Document for the Precipitation
Product Processors of the NWC/GEO
Code:NWC/CDOP2/GEO/AEMET/SCI/ATBD/Precipitation
Issue: 1.11 Date: 15 October 2016 File:NWC-CDOP2-GEO-AEMET-SCI-ATBD-
Precipitation_v1.1.doc
Page: 19/63
For a better matching of radar – satellite images, the radar products were converted into MSG
projection using a bi-linear interpolation scheme.
A quality control has been used for the Spanish radar dataset taking advantage of the quality
image generated for the radar national composite products (Gutierrez and Aguado, 2006). No
quality control methods have been used for Baltrad and Hungarian radar datasets.
Ground echoes, like anomalous propagation echoes, were removed in Pseudo-CAPPI, MRV and
PPI scenes. To that end 10.8IR SEVIRI imagery were used together with the basic
AUTOESTIMATOR algorithm (Vicente et al., 1998).
Considering that CRR is a specific product for convective situations, only images with convective
echoes, as far as possible, were used during the calibration process. To that end, Echotop product
was used when available. Only scenes where the ratio between the number of echoes greater than
6 Km and the ones greater than 0 Km was lower than 15% in the Echotop image were selected.
Since images with convective situations can also include non convective echoes, a calibration area
was selected. This selection included the area corresponding to 15x15 pixels boxes centred on that
ones that reached a top of 6 km and a rain rate of 3 mm/h simultaneously.
Since the perfect matching is not possible a smoothing process in 3x3 pixels boxes was done for a
better radar-satellite matching.
Once the radar calibration dataset was prepared, CRR was run using the analytical functions
applying small shifts to the coefficients. Also a smoothing process in 3x3 pixels boxes was done
over CRR imagery. Then several comparisons between CRR rain rates and radar rain rates were
done computing accuracy and categorical scores. Special attention was paid to RMSE, POD and
FAR. The coefficients of the functions were adjusted and the ones which got the best scores were
chosen.
3.2.1.2.2.2 Analytical functions description
An analytical function is easier to handle and to analyze than a big matrix. Two calibration
functions were obtained:
2-V calibration function: RR (IR, IR-WV)
The function independent variable is (10.8IR-6.2WV) SEVIRI data and its coefficients have a
dependence on 10.8IR SEVIRI data. The mathematical formulation of this function is the
following:
2
)(
)()(*5.0exp*)()/(
IRW
IRCWVIRIRHhmmRR
Where RR is the rain rate in mm/h, and H(IR), C(IR) and W(IR) are coefficient functions
depending on 10.8IR SEVIRI data.
Looking at the formula of this function it can be observed that it is a symmetric bell-shaped curve
where H(IR) is the height, C(IR) is the position of the symmetry axis and W(IR) is related to the
width of the curve. All these parameters, depending on 10.8IR data, have a meaning.
The mathematical formula of the coefficient function related to the height of the 2-V calibration
function, H(IR), is the following:
IRbaIRH *exp*)(
Where the coefficients are: a = 8*108 and b = - 0.082
According to these coefficients the graph of this curve is shown in Figure 4.
Page 20
Algorithm Theoretical Basis
Document for the Precipitation
Product Processors of the NWC/GEO
Code:NWC/CDOP2/GEO/AEMET/SCI/ATBD/Precipitation
Issue: 1.11 Date: 15 October 2016 File:NWC-CDOP2-GEO-AEMET-SCI-ATBD-
Precipitation_v1.1.doc
Page: 20/63
H(IR)
0
5
10
15
20
25
30
35
40
45
50
200 205 210 215 220 225 230 235 240
IR (K)
Figure 4. Height of the 2-V function plotted between 205K and 235K
It is clear from the curve that the lower the IR brightness temperature the higher H(IR), so the
higher are the estimated rain rates.
Regarding the position of the symmetry axis C(IR), the formula is:
dIRcIRC *)(
Where the coefficients are: c = 0.2 and d = - 45.0
This function is plotted in Figure 5.
C(IR)
-5
-4
-3
-2
-1
0
1
2
3
200 205 210 215 220 225 230 235 240
IR (K)
Figure 5. Coefficient related to the position of the symmetry axis of the 2-V function
As it has been seen, the 2-V calibration function is a symmetric bell-shaped curve whose
independent variable is (IR-WV) and whose coefficients depend on IR. The symmetry axis of the
"bell curve" is given by C(IR). Looking at Figure 5 it can be deduced that the highest rain rates are
estimated for IR-WV values close to zero; and the lower are the IR brightness temperatures, the
lower the value of IR-WV that provides the highest rain rates estimations.
Finally, the equation that provides information on the width of the bell-shaped curve is:
Page 21
Algorithm Theoretical Basis
Document for the Precipitation
Product Processors of the NWC/GEO
Code:NWC/CDOP2/GEO/AEMET/SCI/ATBD/Precipitation
Issue: 1.11 Date: 15 October 2016 File:NWC-CDOP2-GEO-AEMET-SCI-ATBD-
Precipitation_v1.1.doc
Page: 21/63
jh
gIRfIRW
2
5.0exp*)(
Where f = 1.5; g = - 215.0; h = 3.0 and j = 2.0
The graph of the W(IR) is plotted in Figure 6.
W(IR)
1
1,5
2
2,5
3
3,5
4
200 205 210 215 220 225 230 235 240
IR(K)
Figure 6. Coefficient that provides information on the width of the 2-V function
W(IR) is also a symmetric bell-shaped curve whose symmetry axis is centred in 215K. This
means that for this brightness temperature the curve gets wider so it could be deduced that for
IR=215K, there is a higher likelihood of precipitation occurrence although the rain rates are not
the highest.
3-V calibration function: RR(IR, IR-WV, VIS)
The 3-V function independent variables are 10.8IR-6.2WV and 0.6VIS-N SEVIRI data and its
coefficients have dependence on 10.8IR SEVIRI data and on latitude. Its mathematical
formulation is the following:
22
)(
)()(*5.0exp*)(*
5.8
)(__*5.0exp)/(
IRW
IRCWVIRIRH
LatVisCNVIShmmRR
)_()_( IRWVFactorNVISFactor
The 3-V calibration function is the product of two symmetric bell-shaped curves, Factor_VIS-N
and Factor_IRWV. The Factor_IRWV one is similar to the 2-V function and Factor_VIS-N
depends on the VIS-N imagery.
The interpretation of the bell-shaped curve Factor_IRWV is the same as in the case of the 2-V
function. For the 3-V function the H(IR), C(IR) and W(IR) coefficients are the following:
IRbaIRH *exp*)(
Where: a = 1.25*108 and b = - 0.073
Page 22
Algorithm Theoretical Basis
Document for the Precipitation
Product Processors of the NWC/GEO
Code:NWC/CDOP2/GEO/AEMET/SCI/ATBD/Precipitation
Issue: 1.11 Date: 15 October 2016 File:NWC-CDOP2-GEO-AEMET-SCI-ATBD-
Precipitation_v1.1.doc
Page: 22/63
H(IR)
0
5
10
15
20
25
30
35
40
45
50
200 205 210 215 220 225 230 235 240
IR (K)
Figure 7. Height of the 3-V function plotted between 205K and 235K .
dIRcIRC *)(
Where: c = 0.25 and d = - 53.75
C(IR)
-4
-3
-2
-1
0
1
2
3
4
5
6
200 205 210 215 220 225 230 235 240
IR (K)
Figure 8. Coefficient related to the position of the symmetry axis of the 3-V function .
jh
gIRfIRW
2
5.0exp*)(
Where: f = 1.5; g = - 227.0; h = 14.0 and j = 4.0
Page 23
Algorithm Theoretical Basis
Document for the Precipitation
Product Processors of the NWC/GEO
Code:NWC/CDOP2/GEO/AEMET/SCI/ATBD/Precipitation
Issue: 1.11 Date: 15 October 2016 File:NWC-CDOP2-GEO-AEMET-SCI-ATBD-
Precipitation_v1.1.doc
Page: 23/63
W(IR)
4
4,2
4,4
4,6
4,8
5
5,2
5,4
5,6
200 205 210 215 220 225 230 235 240
IR (K)
Figure 9. Coefficient that provides information on the width of the 3-V function
Regarding the H(IR) coefficients for 2-V and 3-V functions, both the shape and the maximum rain
rates estimated are very similar.
As for the position of the symmetry axis, the lower the IR brightness temperatures, the lower the
value of IR-WV that provides the highest rain rates estimations for both 2-V and 3-V functions.
The difference is that in 3-V case, the (IR-WV) values that provide the highest rain rates are a bit
higher than in the case of 2-V function.
In the case of the coefficient that provides information on the width of the 2-V and 3-V functions,
the difference is higher. It can be observed that the 3-V function is always much wider and the IR
brightness temperature for which there is a higher likelihood of precipitation occurrence is warmer
(227K) than in the case of the 2-V function. This means that 3-V function rain rates estimations
are higher for the same range of IR brightness temperatures and (IR-WV) differences than 2-V
function rain rates estimations. 2-V function limits the rain rate estimations to lower IR brightness
temperatures.
It must be taken into account that 3-V function is also composed of other symmetric bell-shaped
curve Factor_VIS-N that depends on the VIS-N imagery. It can be interpreted that Factor_IRWV
is the height of Factor_VIS-N, so the highest estimations given by 3-V function will be given by
Factor_IRWV, and Factor_VIS-N filters these estimations depending on the normalized visible
reflectances.
The higher is the VIS-N reflectance, the higher is the optical thickness of the cloud so the higher
should be the rain rate assigned. This can be seen in Figure 10.
It has been seen that for Spanish latitudes the highest rain rates are obtained for VIS reflectances
of about 82%, for different years. According to the other radar-satellite datasets (Hungary and
Baltrad) reflectances that provide the highest rain rates decrease with latitude. The quantity of
solar energy that reaches higher latitudes is lower than the ones that reach latitudes closer to the
equator and normalization process is not good enough to fix this problem. This dependence on the
latitude could be a corrective effect additional to the normalization.
To take account of this fact a latitude dependency has been included in the 3-V function. As can
be observed in Figure 10, the lower is the latitude the higher is the reflectance for which 3-V
function assigns higher rain rates. This latitude dependence can be observed in Figure 11.
Page 24
Algorithm Theoretical Basis
Document for the Precipitation
Product Processors of the NWC/GEO
Code:NWC/CDOP2/GEO/AEMET/SCI/ATBD/Precipitation
Issue: 1.11 Date: 15 October 2016 File:NWC-CDOP2-GEO-AEMET-SCI-ATBD-
Precipitation_v1.1.doc
Page: 24/63
0
0,1
0,2
0,3
0,4
0,5
0,6
0,7
0,8
0,9
1
0 20 40 60 80 100
VIS (%)
(*)
C_Vis(Lat=0) = 84
C_Vis(Lat=20) = 83,5
C_Vis(Lat=40) = 82
C_Vis(Lat=60) = 74,5
Figure 10. Dependence of the 3-V function on the Normalized Visible Reflectances.
C_Vis(Lat)
0
10
20
30
40
50
60
70
80
90
-90 -70 -50 -30 -10 10 30 50 70 90
Latitude (º)
Figure 11. Dependence of the Normalized Visible reflectances on Latitude
3.2.1.2.3 Convective Rainfall Rate (CRR) correction factors description
3.2.1.2.3.1 Moisture Correction Factor
When thunderstorms take place in quite moist environments the computed rainfall rate should be
greater than when they occur in dry air masses. To take into account this effect a moisture
correction factor has been developed. It adjusts the estimates when the air is dry or quite moist.
This factor has been defined as the product of the total precipitable water, PW, in the layer from
surface to 500 hPa. by the relative humidity, RH, (mean value between surface and 500 hPa.
level), obtained from a numerical model.
In order to compute the PWRH factor, the precipitable water is expressed in inches of water and
the relative humidity in percentage. This factor takes values between 0.0 and 2.0. An environment
is considered to be dry if PWRH is significantly below 1.0 and quite moist if PWRH is greater
than 1.0.
Page 25
Algorithm Theoretical Basis
Document for the Precipitation
Product Processors of the NWC/GEO
Code:NWC/CDOP2/GEO/AEMET/SCI/ATBD/Precipitation
Issue: 1.11 Date: 15 October 2016 File:NWC-CDOP2-GEO-AEMET-SCI-ATBD-
Precipitation_v1.1.doc
Page: 25/63
The PWRH factor decreases rainfall rates in very dry environments and increases them in very
moist ones. However, for high latitudes where convective systems can contain hail (so that radar
rainfall is unrealistically high), if IR cloud top temperature is lower than 215K , there is no need to
increase the rainfall rates, but instead, it is necessary to decrease them whenever the environment
is dry (PWRH<1.0). Based on this justification, the following criterion is applied:
If latitude >55°N, T10.8 < 215 K and PWRH >1.0 the computed rainfall rate should not be
multiplied by the PWRH correction factor.
Otherwise, the computed rainfall rate is multiplied by the PWRH correction factor.
3.2.1.2.3.2 Cloud Growth Rate Correction Factor
Convective rain is assumed to be associated with growing clouds exhibiting overshooting tops.
Consecutive satellite IR images are used to indicate vertically growing and decaying cloud
systems.
A convective system is more active and produces greater rainfall rates when the tops are
becoming colder and expanding. Based on the conclusion that decaying clouds with cold tops that
are becoming warmer produce little or no rainfall, the output is modified according to the
following:
· If a IR pixel in the second scene is colder than in the first one, convection is intensifying,
so rainfall rate computed in that pixel with the information from the second scene remains
the same.
· If a IR pixel in the second scene is warmer than in the first one, convection is weakening.
In this case, rainfall rate computed with the information from the second scene is
multiplied by a coefficient. The coefficient value can be modified by the user through the
Keyword COEFF_EVOL_GRAD_CORR_00 in the model configuration file (Default
value for Normal Mode (0.35) is set in the configuration file. Recommended value for
Rapid Scan mode is 0.55).
· If there is no change in the cloud-top temperature in the two consecutive scenes (no
growth or decay), rainfall rate computed from the second scene stays the same.
Therefore, the cloud growth correction factor, also designated as evolution correction factor, is
only applied if the analysed pixel becomes warmer in the second image.
3.2.1.2.3.3 Cloud-top Temperature Gradient Correction Factor
When consecutive IR scenes are not available, cloud growth rate correction factor can not be
applied. Then cloud-top temperature gradient correction is used instead.
This alternative correction method is based on the fact that much information can be extracted
from cloud-top structure on a single IR image.
Cloud-top temperature gradient correction factor, also designated as gradient correction factor, is
based on a search of the highest (coldest) and lowest (less cold) cloud tops. The concept of finite
difference is used to locate the maximum and minimum local temperature within grids of 3x3 or
5x5 pixels centred on the point P0=(x0,y0). The idea is to search for the pixels that are below the
average cloud top surface temperature (local temperature minima) and assume that these pixels
indicate active convection connected to precipitation beneath.
Cloud-top temperature can be named as T=T(x,y), where T is the cloud-top temperature as a
function of the x and y co-ordinates. For those pixels whose T is lower than 250K, the following
analysis is done:
Page 26
Algorithm Theoretical Basis
Document for the Precipitation
Product Processors of the NWC/GEO
Code:NWC/CDOP2/GEO/AEMET/SCI/ATBD/Precipitation
Issue: 1.11 Date: 15 October 2016 File:NWC-CDOP2-GEO-AEMET-SCI-ATBD-
Precipitation_v1.1.doc
Page: 26/63
Maxima and minima can be found studying the first and second derivative of T. The process is the
following:
Second derivative of T in the point P0=(x0, y0):
00
0
0
,
2
00
2
2
0
2
2
0
),(''
)(''
)(''
yyxx
xy
yy
y
xx
x
yx
TyyxxT
y
TyyT
x
TxxT
Hessian in P0=(x0, y0):
2
0000 )),(''())(''())(''( yyxxTyyTxxTH xyyx
P0 is characterized in the following way:
H > 0 and T''x(x=x0) < 0 maximum
H > 0 and T''x(x=x0) > 0 minimum
H < 0 no maximum, no minimum
H = 0 not known
Once this analysis has been done in a grid of 3x3 pixels, the previous derived rainfall rate is
adjusted in the following way:
If the pixel P0 has a temperature maximum, indicating a relatively low cloud top
with P0 warmer than its surrounding, the previous rainfall rate is multiplied by a
coefficient whose value can be modified by the user through the keyword
COEFF_EVOL_GRAD_CORR_01 in the model configuration file (Default value: 0.25).
If the pixel P0 has a temperature minimum, which means that P0 is colder than the
surrounding indicating a high cloud top, the previous rainfall rate stays the same.
If P0 has not a temperature maximum or minimum, which means that P0 is at the
same height and temperature as the surrounding pixels, the previous rainfall rate is
multiplied by a coefficient whose value can be modified by the user through the keyword
COEFF_EVOL_GRAD_CORR_02 in the model configuration file (Default value: 0.50).
If P0 temperature can not be defined as a maximum or a minimum, the whole
process is repeated using pixels within a 5x5 pixel's grid.
Finally, if P0 temperature remains undefined as a maximum or a minimum within
the 5x5 pixel’s grid, the original rainfall rate value is not modified.
3.2.1.2.3.4 Orographic Correction Factor
Local topography has long been recognised to have an effect on the distribution and intensity of
precipitation. However, the rain induced by orographic forcing is a complex process associated
with complicated flows. Rainfall amounts are dependent on the atmospheric flow over the
mountains and on the characteristics of the flow disturbances created by the mountains
themselves.
Page 27
Algorithm Theoretical Basis
Document for the Precipitation
Product Processors of the NWC/GEO
Code:NWC/CDOP2/GEO/AEMET/SCI/ATBD/Precipitation
Issue: 1.11 Date: 15 October 2016 File:NWC-CDOP2-GEO-AEMET-SCI-ATBD-
Precipitation_v1.1.doc
Page: 27/63
This correction factor uses the interaction between the wind vector (corresponding to 850 hPa
level from the NWP) and the local terrain height gradient in the wind direction to create a
multiplier that enhances or diminishes the previous rainfall estimate, as appropriate.
The wind direction for the 48-km grid cell containing the location being tested is assumed to be
constant in magnitude and direction. A one-dimensional cross-section of the terrain, determined
by the wind direction, is extracted from the elevation map. The wind path length, D pixels, is
variable from 3 km (pixel resolution) to 24 km (8 pixels), depending upon wind speed.
Accordingly, D is determined by a 15-minute fetch (converted into units of pixels) of the wind
speed U:
pixelm
sUD
/3000
900
The extracted terrain cross-section extends D pixels upwind and downwind from the reference
site, giving a total length of 2D+ 1 pixel. The height of the test location can be denoted as ZD+1;
the location farthest upwind is Z1, the location farthest downwind is Z2D+1. The slope between a
point A and a downwind point B can be defined as
AB
ZZS AB
AB
For each pixel, A, upwind of the site and the site itself (i.e., from 1 to D+1), the slope between it
and each point B within D pixels downwind is calculated (i.e., from A+1 to A+D). The maximum
slope found for each point A is retained as the slope SA. The net slope S, used for the correction, is
equal to the mean of the SA values.
Finally, we can define a rainfall rate enhancement parameter, M, as the result of the vertical
velocity induced by a wind with horizontal speed U blowing over a surface with slope of S. Since
M should not have effect on the rainfall amounts on a flat terrain, it can be written as:
USM 1
M is limited to be between 0.2 and 3.5. Every CRR rain point is multiplied by the co-located M
values. The eight pixels all around the image edge can not be corrected.
3.2.1.2.3.5 Parallax Correction Factor
For a better convective precipitation area location a parallax correction [ANNEX A: Parallax
Correction] can be applied to this product. This option is chosen by the user through the product
model configuration file and it is applied by default.
3.2.1.2.4 Lightning algorithm
As lightning activity is related with convection, an option to use this information to improve
precipitation estimates has been added to the product.
An algorithm for rainfall estimation using lightning information has been developed. Its
description can be found in ANNEX B: Lightning algorithm.
Page 28
Algorithm Theoretical Basis
Document for the Precipitation
Product Processors of the NWC/GEO
Code:NWC/CDOP2/GEO/AEMET/SCI/ATBD/Precipitation
Issue: 1.11 Date: 15 October 2016 File:NWC-CDOP2-GEO-AEMET-SCI-ATBD-
Precipitation_v1.1.doc
Page: 28/63
3.2.2 Practical considerations
3.2.2.1 List of Convective Rainfall Rate (CRR) inputs
Satellite imagery:
The following SEVIRI brightness temperatures and normalized visible reflectances are needed at
full IR spatial resolution:
T10.8m TPrev10.8m T6.2m VIS0.6m
Mandatory Optional* Mandatory Optional
Table 5. CRR SEVIRI inputs
The SEVIRI channels are input by the user in HRIT format and extracted on the desired region by
NWC-GEO software package.
* If TPrev10.8m is not available, the Cloud Growth Rate Correction Factor cannot be computed
but the Cloud-top Temperature Gradient Correction Factor is computed instead as an alternative.
Numerical model:
This information is mandatory for moisture and orographic corrections. When this information is
not available, CRR is computed without applying these two corrections.
Parallax correction can run without the NWP parameters using the climatological profile.
For moisture correction:
Relative Humidity at 1000, 925, 850, 700 and 500 hPa
Dew Point temperature at 2 m
Temperature at 2 m
Temperature at 1000, 925, 850, 700, 500 hPa
Surface Pressure
For parallax correction:
Temperature at 1000, 925, 850, 700, 500, 400, 300, 250 and 200 hPa
Geopotential at 1000, 925, 850, 700, 500, 400, 300, 250 and 200 hPa
For orographic correction:
U and V wind components in 850 hPa
Lightning information file for CRR:
A file with information on every lightning strike occurred in a time interval is mandatory to
choose the option of adjusting the CRR precipitation pattern with the lightning information
provided by ground based lightning detection networks. Information about this lightning
information file structure can be found in the Interface Control Document for Internal and
External Interfaces of the NWC/GEO [RD 4].
Page 29
Algorithm Theoretical Basis
Document for the Precipitation
Product Processors of the NWC/GEO
Code:NWC/CDOP2/GEO/AEMET/SCI/ATBD/Precipitation
Issue: 1.11 Date: 15 October 2016 File:NWC-CDOP2-GEO-AEMET-SCI-ATBD-
Precipitation_v1.1.doc
Page: 29/63
Sun angles associated to satellite imagery
This information is mandatory for normalising the VIS image when the solar channel is used. It is
also used to choose whether to run day-time or night-time algorithm.
Ancillary data sets:
All this information is included in the software package:
Saturation Vapour table is mandatory for Humidity correction and is located in the
$SAFNWC/import/Aux_data/ CRR directory.
Saturation Vapour Polynomial Coefficients table is mandatory for Humidity correction
and is located in the $SAFNWC/import/Aux_data/CRR directory.
Elevation mask is mandatory for orographic correction and is located in the
$SAFNWC/import/Aux_data/ Common directory.
Climatological profile is necessary as a backup for Parallax correction in case NWP is
not available. This information is located in the $SAFNWC/import/Aux_data/CRR
directory
Model configuration file for CRR:
The CRR model configuration file contains configurable system parameters in the product
generation process related to algorithm thresholds, ancillary datasets, numerical model data,
corrections to be applied, etc. The complete list of these parameters and the explanation of the
most useful ones is available in the User Manual for the Precipitation Product Processors of the
NWC/GEO [RD 5].
3.2.2.2 Description of the Convective Rainfall Rate (CRR) output
The content of the CRR output is described in the Data Output Format Document [RD 2]. A
summary is given below:
Container Content
crr NWC GEO CRR Convective Rainfall Rate Class:
Class Rainfall Intensity (mm/h)
0 [ 0.0, 0.2)
1 [ 0.2, 1.0)
2 [ 1.0, 2.0)
3 [ 2.0, 3.0)
4 [ 3.0, 5.0)
5 [ 5.0, 7.0)
6 [ 7.0, 10.0)
7 [10.0, 15.0)
8 [15.0, 20.0)
9 [20.0, 30.0)
10 [30.0, 50.0)
11 [50.0, )
FillValue No data or corrupted data
Page 30
Algorithm Theoretical Basis
Document for the Precipitation
Product Processors of the NWC/GEO
Code:NWC/CDOP2/GEO/AEMET/SCI/ATBD/Precipitation
Issue: 1.11 Date: 15 October 2016 File:NWC-CDOP2-GEO-AEMET-SCI-ATBD-
Precipitation_v1.1.doc
Page: 30/63
Container Content
crr_intensity NWC GEO CRR Convective Rainfall Intensity:
crr_intensity(mm/h) = scale_factor * counts + add_offset
where:
scale_factor = 0.1
add_offset = 0.0
crr_accum NWC GEO CRR Convective Hourly Rainfall Accumulation:
crr_accum(mm) = scale_factor * counts + add_offset
where:
scale_factor = 0.1
add_offset = 0.0
crr_status_flag 13 bits indicating
Applied Corrections:
Bit 0: Humidity correction applied
Bit 1: Evolution correction applied
Bit 2: Gradient correction applied
Bit 3: Parallax correction applied
Bit 4: Orographic correction applied
Use of optional data:
Bit 5: Solar channel used
Bit 6: Lightning data used
Processing information
Bit 7: crr_intensity set to 0 due to filtering process
Bit 8: crr_intensity was a hole because of the parallax correction, and then was filled
by the median filter
Bit 9,10, 11: Use of bands for accumulation
1: All required bands were available
2: One previous CRR band is missing
3: At least two previous CRR bands are missing (no consecutive)
4: At least two previous CRR bands are missing (some are consecutive)
Bit 12: Accumulation quality flag. Set to 1 if:
not all crr values are available to perform the accumulation,
OR
any of the crr_intensity values was set to 0 due to filtering process
OR
Any of the crr_intensity values was a hole because parallax correction
Geophysical Conditions Field Type Description
Space Flag Set to 1 for space pixels
Illumination Parameter Defines the illumination condition
0: N/A (space pixel)
1: Night
2: Day
3: Twilight
Sunglint Flag Set to 1 if Sunglint
Land_Sea Parameter 0: N/A (space pixel)
1: Land
2: Sea
3: Coast
Page 31
Algorithm Theoretical Basis
Document for the Precipitation
Product Processors of the NWC/GEO
Code:NWC/CDOP2/GEO/AEMET/SCI/ATBD/Precipitation
Issue: 1.11 Date: 15 October 2016 File:NWC-CDOP2-GEO-AEMET-SCI-ATBD-
Precipitation_v1.1.doc
Page: 31/63
Processing Conditions Field Type Description
Satellite_input_data Parameter Describes the Satellite input data status
0: N/A (space pixel)
1: All satellite data are available
2: At least one useful satellite channel is missing
3: At least one mandatory satellite channel is missing
NWP_input_data Parameter Describes the NWP input data status
0: N/A (space pixel or NWP data not used)
1: All NWP data are available
2: At least one useful NWP field is missing
3: At least one mandatory NWP field is missing
Product_input_data Parameter Describes the Product input data status
0: N/A (space pixel or Auxiliary data not used)
1: All input Product data are available
2: At least one useful input Product is missing
3: At least one mandatory input Product is missing
Auxiliary_input_data Parameter Describes the Auxiliary input data status
0: N/A (space pixel or Auxiliary data not used)
1: All Auxiliary data are available
2: At least one useful Auxiliary field is missing
3: At least one mandatory Auxiliary field is missing
Quality Field Type Description
Nodata Flag Set to 1 if pixel is NODATA
Internal_consistency Flag Set to 1 if an internal consistency check has been performed. Internal
consistency checks will be based in the comparison of the retrieved
meteorological parameter with physical limits, climatological limits,
neighbouring data, NWP data, etc.
Temporal_consistency Flag Set to 1 if a temporal consistency check has been performed
Temporal consistency checks will be based in the comparison of the retrieved
meteorological parameters with data obtained in previous slots.
Quality Parameter Retrieval Quality
0: N/A (no data)
1: Good
2: Questionable
3: Bad
4: Interpolated
Page 32
Algorithm Theoretical Basis
Document for the Precipitation
Product Processors of the NWC/GEO
Code:NWC/CDOP2/GEO/AEMET/SCI/ATBD/Precipitation
Issue: 1.11 Date: 15 October 2016 File:NWC-CDOP2-GEO-AEMET-SCI-ATBD-
Precipitation_v1.1.doc
Page: 32/63
3.2.2.3 Example of Convective Rainfall Rate (CRR) visualisation
3.2.2.3.1 Instantaneous Rates
Below is shown an image corresponding to CRR classes output. It has been obtained at full
resolution and all corrections have been applied.
Figure 12. CRR instantaneous intensities output corresponding to 9th June 2015 at
12:00Z
3.2.2.3.2 Hourly Accumulations
Below is shown an image corresponding to CRR hourly accumulations output. It has been
obtained at full resolution and all corrections have been applied.
Figure 13. CRR hourly accumulations output corresponding to 9th June 2015 at 12:00Z
Page 33
Algorithm Theoretical Basis
Document for the Precipitation
Product Processors of the NWC/GEO
Code:NWC/CDOP2/GEO/AEMET/SCI/ATBD/Precipitation
Issue: 1.11 Date: 15 October 2016 File:NWC-CDOP2-GEO-AEMET-SCI-ATBD-
Precipitation_v1.1.doc
Page: 33/63
3.3 ASSUMPTIONS AND LIMITATIONS
The CRR product is based on a calibration method that requires the availability of a training set of
precipitation data derived from radar information, to be used as ground truth to derive the
relationship between satellite information and rainfall rate.
Regarding the radar data:
- The drop size distribution, used to obtain the radar rainfall rates (mm/h) from the radar
reflectivity (dBZ), has been assumed to be the Marshall Palmer type throughout the
calibration and validation procedures.
- No online operational method has been applied in order to adjust the radar rainfall
intensities using rain gauge measurements.
- The limited availability of radar data at the time of carrying out the CRR calibration
caused that three different radar datasets, with different radar products, had to be used. In
the case of the Spanish radar data, PPI product were used and a quality control, taking
advantage of a quality image generated for the radar national composite products
(Gutierrez and Aguado, 2006), was used. In the case of the Hungarian radar data, rain rates
based on Maximum reflectivity in the vertical were used, while in the case of Baltrad
network, Pseudo-CAPPI at 2Km were used to derive rain rates. Is should be borne in
mind that no quality control methods were used for Baltrad and Hungarian radar datasets.
- Data from the radar networks in different areas were not compared to an independent
reference.
Regarding the lightning algorithm:
- The CRR lightning algorithm and the coefficients applied have been derived for Spain
using the lightning information from the AEMET lightning detection network. Concerning
this particular, it is important to highlight that ground based lightning detection networks
provide information with different performances in detection efficiency and location
accuracy. For this reason, in the model configuration file the keyword
APPLY_LIGHTNING is set to 0 and by default the lightning information is not used.
- Before to use the lightning algorithm it is highly recommended to the user to adapt the
coefficients to the specific performances of the lightning detection network serving that
information.
- This issue could be solved in a satisfactory manner in the future with the use of lightning
information provided by MTG Lightning Imager which will be able to provide lightning
information with uniform and controlled performances all around the coverage area.
The relatively weak coupling between spectral features in the visible and infrared channels with
precipitation rate for all situations except for convection makes it in most cases doubtful to try to
assign precipitation rates from GEO data alone. For this reason, this product has been calibrated
only for convective events, and so, it obtains the best results for convective events. For other type
of precipitation, like the stratiform one, serious underestimation, overestimation or unforecasted
events are likely to occur.
This product does not distinguish the phase of the estimated precipitation.
Page 34
Algorithm Theoretical Basis
Document for the Precipitation
Product Processors of the NWC/GEO
Code:NWC/CDOP2/GEO/AEMET/SCI/ATBD/Precipitation
Issue: 1.11 Date: 15 October 2016 File:NWC-CDOP2-GEO-AEMET-SCI-ATBD-
Precipitation_v1.1.doc
Page: 34/63
3.4 REFERENCES
Algorithm Theoretical Basis Document for “Convective Rainfall Rate” (CRR-PGE05 v3.1.1).
SAF/NWC/CDOP/INM/SCI/ATBD/05.
Gutierrez, J. M. and Aguado, F.: Quality image for the Spanish Radar National Composite,
Proceedings of ERAD 2006, 318-320.
Jorge Sánchez-Sesma and Marco Antonio Sosa: EPPrePMex, A Real-time Rainfall Estimation
System Based on GOES-IR Satellite Imagery. IPWG, October 2004, Monterey, California, USA.
Kidder, S.Q., and T.H. Vonder Haar, 1995: Satellite Meteorology: An Introduction. Academic
Press
Kurino, T., 1996: A Rainfall Estimation with the GMS-5 Infrared Split-Window and Water
Vapour Measurements, Tech. Rep., Meteorological Satellite Centre, Japan Meteorological
Agency.
Schmetz J., S. S. Tjemkes, M. Gube and L. van de Berg, 1997: Monitoring deep convection and
convective overshooting with METEOSAT. Adv. Space Res., Vol. 19, pp433-441.
Scofield, R.A., 1987: The NESDIS operational convective precipitation estimation technique,
Mon. Wea. Rev., Vol.115, pp.1773-1792.
Tapia, A., Smith, J. A., Dixon, M., 1998: Estimation of Convective Rainfall from Lightning
Observations, Bull. American Meteorological Society, Vol. 37, pp. 1497-1509.
Vicente, G.A. and R.A. Scofield, 1996: Experimental GOES-8/9 derived rainfall estimates for
flash flood and hydrological applications, Proc. 1996 Meteorological Scientific User's Conference,
Vienna, Austria, EUM P19, pp.89-96.
Vicente, G.A., Davenport, J.C. and Scofield, R.A., 1999: The role of orographic and parallax
corrections on real time high resolution satellite rainfall estimation, Proc. 1999 Eumetsat
Meteorological Satellite Data User's Conferences, EUM P26, pp. 161-168.
Vicente, G.A., Scofield, R.A. and Menzel W.P. 1998: The Operational GOES Infrared Rainfall
Estimation Technique, Bull. American Meteorological Society, Vol. 79, No. 9, pp. 1883-1898.
Page 35
Algorithm Theoretical Basis
Document for the Precipitation
Product Processors of the NWC/GEO
Code:NWC/CDOP2/GEO/AEMET/SCI/ATBD/Precipitation
Issue: 1.11 Date: 15 October 2016 File:NWC-CDOP2-GEO-AEMET-SCI-ATBD-
Precipitation_v1.1.doc
Page: 35/63
4. DESCRIPTION OF PRECIPITATING CLOUDS FROM CLOUD
PHYSICAL PROPERTIES (PC-PH) PRODUCT FOR DAYTIME
4.1 PRECIPITATING CLOUDS FROM CLOUD PHYSICAL PROPERTIES (PC-PH)
OVERVIEW
Precipitating Clouds from Cloud Physical Properties (PC-Ph) product, developed within the NWC
SAF context, is a Nowcasting tool that provides estimation on the probability of precipitation
(PoP) occurrence.
In our context, PoP is defined as the instantaneous probability that a rain rate greater than or equal
to 0.2 mm/h occurs at the pixel level.
The PoP estimation is done using information on the cloud top microphysical properties (CTMP),
Effective Radius (Reff) and Cloud Optical Thickness (COT). Using these two parameters the
Cloud Water Path (CWP) is computed. A relation between CWP and PoP has been obtained in
order to assign a PoP to each SEVIRI pixel.
The microphysical properties are computed within the NWC SAF Cloud Microphysics (CMIC)
product for daytime, so it is necessary to run CMIC product previous to run PC-Ph. The main
limitation of this product is that only provides results during daytime.
4.2 PRECIPITATING CLOUDS FROM CLOUD PHYSICAL PROPERTIES (PC-PH)
DAYTIME ALGORITHM DESCRIPTION
4.2.1 Theoretical description
In this section the theoretical basis and practical implementation of the algorithm are described.
4.2.1.1 Physics of the problem
Reflected IR solar radiation by the cloud tops can be useful to obtain information on microphysics
and rain processes near cloud tops (Pilewskie and Twomey, 1987). The radiative properties of a
cloud can be characterized through the Effective Radius (Reff) and Cloud Optical Thickness
(COT).
The most relevant measure that indicates the possibility of occurrence of rain formation processes
in observed clouds is the effective radius (Rosenfeld and Gutman, 1994). The effective radius is
defined as the ratio of the third to second moments of the droplet size distribution.
0
2
0
3
)(
)(
drrrN
drrrN
Reff
Where N(r) is the concentration of particles having radius r.
Cloud optical thickness depends on the moisture density as well as the vertical thickness of the
cloud. The higher is the COT, the higher is the possibility of occurrence of rain formation
processes. It is possible to retrieve COT values from SEVIRI (Roebeling et al., 2006).
Page 36
Algorithm Theoretical Basis
Document for the Precipitation
Product Processors of the NWC/GEO
Code:NWC/CDOP2/GEO/AEMET/SCI/ATBD/Precipitation
Issue: 1.11 Date: 15 October 2016 File:NWC-CDOP2-GEO-AEMET-SCI-ATBD-
Precipitation_v1.1.doc
Page: 36/63
Two SEVIRI channels are used, together with a radiative transfer model, in order to retrieve Reff
and COT. The cloud reflectance at VIS0.6 channel is directly related with COT while Reff is
connected with the reflectance variations measured in near infrared channels like NIR1.6 and
IR3.9. Due to the number of disadvantages that IR3.9 channel presents (Roebeling et al., 2006),
NIR1.6 has been used.
Under certain assumptions, these two cloud top microphysical properties can be used to estimate
the amount of water available to produce rain within a cloud (Roebeling and Holleman, 2009).
The Effective Radius and the Cloud Optical Thickness used by this algorithm are retrieved within
the CMIC algorithm [RD 6].
4.2.1.2 Mathematical Description of the Precipitating Clouds from Cloud Physical
Properties (PC-Ph) daytime algorithm
This section contains the description of the algorithm used to obtain the probability of
precipitation from cloud top microphysical properties as well as it has been calibrated. Although
the calibration methodology it is not completely rigorous mathematically it has been proved that it
provides good results.
For the retrieval of the probability of precipitation, the Cloud Water Path (CWP) is used. CWP
means Liquid Water Path for water clouds and Ice Water Path of ice clouds. This parameter is
computed using the following equation (Roebeling and Holleman, 2009):
COTRCWP eff **3
2
The tuning of this PC-Ph algorithm has been done comparing Spanish composite radar data
(rainy/no rainy pixel) with CWP maps. Radar pixels with rain rates greater than or equal to 0.2
mm/h have been considered as rainy. The dataset used to that end contains 111 rainy days all over
2009.
The calibration area has been restricted to 15x15 pixel boxes around radar rainy pixels. CWP
values have only been computed for those pixels identified by CT product with water, ice or
mixed phase. Pixels with no computed CWP value have been excluded from the calibration
process.
A database of pairs CWP - Radar rainy/no rainy pixel has been built. SAFNWC/MSG Parallax
Correction tool has been applied to CWP maps. As the perfect matching between Radar and MSG
images is not possible, a smoothing process in 3x3 pixels boxes has been applied to both types of
data (CWP and Radar rain rates) previous to build the database.
The probability of precipitation occurrence has been connected with the CWP values taking into
account that the higher CWP the higher the probability of precipitation.
Five iterative computations have been done to connect CWP with FAR.
A satellite pixel has been considered as rainy when its CWP is higher than a CWP specific
threshold that connects to a specific FAR. The first CWP specific threshold computed (CWP1) is
the one that provides FAR=20%. To find this CWP1 threshold, several iterations have been
computed using the database data pairs, assuming that a satellite pixel with CWP ≥ CWP1 is a
rainy pixel. This way CWP1 with FAR=20% has been obtained. This CWP1 threshold takes a
value of 970 gm-2.
According to this method, those data pairs with CWP ≥ CWP1 have a PoP greater than or equal to
80%. This way has been obtained the data pair (CWP1 = 970 gm-2, PoP1 = 80%).
Page 37
Algorithm Theoretical Basis
Document for the Precipitation
Product Processors of the NWC/GEO
Code:NWC/CDOP2/GEO/AEMET/SCI/ATBD/Precipitation
Issue: 1.11 Date: 15 October 2016 File:NWC-CDOP2-GEO-AEMET-SCI-ATBD-
Precipitation_v1.1.doc
Page: 37/63
At next step the CWP2 threshold is computed. CPW2 is the one that provides a FAR = 40% using
those data pairs with CWP2 ≤ CWP < CWP1. In line with the previous step, a second data pair
have been obtained (CWP2 = 591 gm-2, PoP2 = 60%).
The same procedure has been followed in order to match CWP thresholds with different PoPs.
Figure 14. Schematic illustration of the procedure followed to tune PC-Ph product representing
the CWP isolines connected with the different FAR values (no real data).
The pairs CWP-PoP obtained for this PC-Ph tuning can be seen in Figure 15:
Figure 15. Data pairs obtained for PC-Ph tuning .
The function that best adjusted to these CWP-PoP data pairs is:
Where PoP is the Probability of Precipitation occurrence (%) and CWP is the Cloud Water Path
(gm-2).
The graph of this function can be observed in Figure 16.
6.149)(*0.33 CWPLnPoP
Page 38
Algorithm Theoretical Basis
Document for the Precipitation
Product Processors of the NWC/GEO
Code:NWC/CDOP2/GEO/AEMET/SCI/ATBD/Precipitation
Issue: 1.11 Date: 15 October 2016 File:NWC-CDOP2-GEO-AEMET-SCI-ATBD-
Precipitation_v1.1.doc
Page: 38/63
Figure 16. Function that connects probability of precipitation with CWP
As the cloud top microphysical properties used by this algorithm depend directly on SEVIRI solar
channel reflectances, there could be a degradation of the results given by this algorithm under
poor illumination conditions.
An independent study has been done in order to check this possible degradation with illumination
conditions. Data belonging to 103 rainy days throughout 2008 have been used for this purpose.
The illumination conditions parameter (ICP), which takes into account the illumination conditions
and the view angle, has been computed for each SEVIRI pixel used for this study. This ICP has
been defined as:
SunZenSatZenICP cos*cos
Where SatZen is the satellite zenith angle and SunZen is the sun zenith angle. This parameter
takes account of solar illumination conditions as well as SEVIRI pixel position that influence the
quantity of radiance that reaches the satellite sensor reflected from surface or cloud tops.
As deduced from its definition, ICP takes values from 0 to 1. It is clear that the higher ICP the
better illumination conditions.
A database of triads PoP - Radar rainy/no rainy pixel - ICP has been built. SAFNWC/MSG
Parallax Correction tool has been applied to the satellite derived products. As the perfect matching
between Radar and MSG images is not possible, a smoothing process in 3x3 pixels boxes has
been applied to all types of data (PoP, Radar rain rates and ICP) previous to build the database.
Then, a comparison between PoP and Radar have done and categorical scores have been
computed. This comparison has been done for different PoP intervals as well as for different ICP
intervals. Regarding the satellite estimations, for comparisons, only pixels belonging to the PoP
category that is being compared in each moment are taken into account, and all of them are
considered as satellite rainy pixels, so POD will always be 100%. Special attention has to be paid
to FAR values and it should bear in mind that a region with the probability of precipitation
interval A-B% should have 100-B ≤ FAR < 100-A.
PoP has been divided into five intervals: 0-20%, 20-40%, 40-60%, 60-80% and 80-100%. In each
PoP interval, different ICP intervals have been compared taking always 1.0 as upper limit. Since
Page 39
Algorithm Theoretical Basis
Document for the Precipitation
Product Processors of the NWC/GEO
Code:NWC/CDOP2/GEO/AEMET/SCI/ATBD/Precipitation
Issue: 1.11 Date: 15 October 2016 File:NWC-CDOP2-GEO-AEMET-SCI-ATBD-
Precipitation_v1.1.doc
Page: 39/63
this study have been done over Spain, few values of ICP > 0.7 have been found, so this has been
taken as the last lower limit of the ICP intervals. Results can be seen in the following tables:
0% < PoP ≤ 20%
Expected FAR:
80% < FAR ≤ 100%
ICP interval
lower limit
N FAR (%)
0.1 1613571 93,05
0.2 1613571 93,05
0.3 1611726 93,05
0.4 1216130 92,95
0.5 59112 96,15
0.6 1 100,00
Table 6. False alarm ratio obtained for 0% < PoP ≤ 20% depending on ICP
20% < PoP ≤ 40%
Expected FAR:
60% < FAR ≤ 80%
ICP interval
lower limit
N FAR (%)
0.1 702028 81,05
0.2 702028 81,05
0.3 700955 81,04
0.4 531071 80,65
0.5 28444 89,65
0.6 1 100,00
Table 7. False alarm ratio obtained for 20% < PoP ≤ 40% depending on ICP
40% < PoP ≤ 60%
Expected FAR:
40% < FAR ≤ 60%
ICP interval lower limit
N FAR (%)
0.1 453418 62,7
0.2 453418 62,7
0.3 452266 62,67
0.4 345179 61,98
0.5 17380 76,73
0.6 4 75,00
Table 8. False alarm ratio obtained for 40% < PoP ≤ 60% depending on ICP
Page 40
Algorithm Theoretical Basis
Document for the Precipitation
Product Processors of the NWC/GEO
Code:NWC/CDOP2/GEO/AEMET/SCI/ATBD/Precipitation
Issue: 1.11 Date: 15 October 2016 File:NWC-CDOP2-GEO-AEMET-SCI-ATBD-
Precipitation_v1.1.doc
Page: 40/63
60% < PoP ≤ 80%
Expected FAR:
20% < FAR ≤ 80%
ICP interval lower limit
N FAR (%)
0.1 255794 39,53
0.2 255794 39,53
0.3 254958 39,46
0.4 190320 38,02
0.5 7784 52,48
0.6 11 9,09
Table 9. False alarm ratio obtained for 60% < PoP ≤ 80% depending on ICP
80% < PoP ≤ 100%
Expected FAR:
0% < FAR ≤ 20%
ICP interval lower limit
N FAR (%)
0.1 144543 23,05
0.2 144543 23,05
0.3 144346 23,05
0.4 100557 20,19
0.5 2914 20,93
0.6 24 12,50
Table 10. False alarm ratio obtained for 80% < PoP ≤ 100% depending on ICP
Comparisons with wider ICP ranges contain values estimated under worse illumination
conditions. If illumination conditions would affect PC-Ph estimations, higher fluctuations of the
categorical scores should have been obtained among the different ICP ranges considered.
According to the tables, the highest fluctuation obtained for all PoP intervals that gets the worse
categorical scores, is the one that uses ICP values higher than 0.6, but, this specific range is the
one computed under the best illumination conditions. The reason could be that few data pairs are
included in this interval. Also can be observed that few data with ICP < 0.3 was obtained in this
study. In relation to this, it should be bear in mind that PC-Ph are computed only for sun zenith
angles lower than 70º.
From these results it can be concluded that illumination conditions don’t affect the quality of this
product within the studied zenith angle range. The effect over higher latitudes will be studied in
the future.
For a better precipitation area location a parallax correction [ANNEX A: Parallax Correction] can
be applied to this product. This option is chosen by the user through the product model
configuration file and it is applied by default.
Page 41
Algorithm Theoretical Basis
Document for the Precipitation
Product Processors of the NWC/GEO
Code:NWC/CDOP2/GEO/AEMET/SCI/ATBD/Precipitation
Issue: 1.11 Date: 15 October 2016 File:NWC-CDOP2-GEO-AEMET-SCI-ATBD-
Precipitation_v1.1.doc
Page: 41/63
4.2.2 Practical considerations
4.2.2.1 List of Precipitating Clouds from Cloud Physical Properties (PC-Ph) inputs
CMIC product physical properties:
CMIC Phase, COT and Reff parameters are mandatory inputs to PC-Ph.
Satellite imagery:
IR10.8 SEVIRI brightness temperature at full IR spatial resolution is a mandatory input to
compute Parallax Correction.
Numerical model:
Temperature at 1000, 925, 850, 700, 500, 400, 300, 250 and 200 hPa
Geopotential at 1000, 925, 850, 700, 500, 400, 300, 250 and 200 hPa
This information is used by default for parallax correction. In case of lack of NWP parameters
parallax correction will be run using a climatological profile.
Ancillary data sets:
Climatological profile is necessary as a backup for Parallax correction in case NWP is not
available. This information is included in the software package and is located in the
$SAFNWC/import/Aux_data directory.
Model configuration file for PPh:
PPh model configuration file contains configurable system parameters in the generation process of
both PC-Ph and CRR-Ph products. The PC-Ph product related parameters refers to ancillary
datasets, numerical model data and parallax correction. The complete list of these parameters and
the explanation of the most useful ones is available in the User Manual for the Precipitation
Product Processors of the NWC/GEO [RD 5].
4.2.2.2 Description of the Precipitating Clouds from Cloud Physical Properties (PC-Ph)
output
The content of the PC-Ph output is described in the Data Output Format Document [RD 3]. A
summary is given below:
Container Content
pcph NWC GEO PC-Ph Precipitating Clouds from cloud Physical Properties
pcph(%) = scale_factor * counts + add_offset
where:
scale_factor = 1.0
add_offset = 0.0
pcph_status_flag 5 bits indicating
Data Availability:
Bit 0: Reff or COT not computed (out of cloud, night time or undefined phase)
Bit 1: Phase not computed or undefined
Bit 2: IR band missing (used in parallax correction)
Applied Correction:
Bit 3: Parallax correction applied
Other information
Bit 8: pc_intensity was a hole because of the parallax correction, and then was
filled by the median filter
Page 42
Algorithm Theoretical Basis
Document for the Precipitation
Product Processors of the NWC/GEO
Code:NWC/CDOP2/GEO/AEMET/SCI/ATBD/Precipitation
Issue: 1.11 Date: 15 October 2016 File:NWC-CDOP2-GEO-AEMET-SCI-ATBD-
Precipitation_v1.1.doc
Page: 42/63
Geophysical Conditions Field Type Description
Space Flag Set to 1 for space pixels
Illumination Parameter Defines the illumination condition
0: N/A (space pixel)
1: Night
2: Day
3: Twilight
Sunglint Flag Set to 1 if Sunglint
Land_Sea Parameter 0: N/A (space pixel)
1: Land
2: Sea
3: Coast
Processing Conditions Field Type Description
Satellite_input_data Parameter Describes the Satellite input data status
0: N/A (space pixel)
1: All satellite data are available
2: At least one useful satellite channel is missing
3: At least one mandatory satellite channel is missing
NWP_input_data Parameter Describes the NWP input data status
0: N/A (space pixel or NWP data not used)
1: All NWP data are available
2: At least one useful NWP field is missing
3: At least one mandatory NWP field is missing
Product_input_data Parameter Describes the Product input data status
0: N/A (space pixel or Auxiliary data not used)
1: All input Product data are available
2: At least one useful input Product is missing
3: At least one mandatory input Product is missing
Auxiliary_input_data Parameter Describes the Auxiliary input data status
0: N/A (space pixel or Auxiliary data not used)
1: All Auxiliary data are available
2: At least one useful Auxiliary field is missing
3: At least one mandatory Auxiliary field is missing
Quality Field Type Description
Nodata Flag Set to 1 if pixel is NODATA
Internal_consistency Flag Set to 1 if an internal consistency check has been performed. Internal
consistency checks will be based in the comparison of the retrieved
meteorological parameter with physical limits, climatological limits,
neighbouring data, NWP data, etc.
Temporal_consistency Flag Set to 1 if a temporal consistency check has been performed
Temporal consistency checks will be based in the comparison of the retrieved
meteorological parameters with data obtained in previous slots.
Quality Parameter Retrieval Quality
0: N/A (no data)
1: Good
2: Questionable
3: Bad
4: Interpolated
Page 43
Algorithm Theoretical Basis
Document for the Precipitation
Product Processors of the NWC/GEO
Code:NWC/CDOP2/GEO/AEMET/SCI/ATBD/Precipitation
Issue: 1.11 Date: 15 October 2016 File:NWC-CDOP2-GEO-AEMET-SCI-ATBD-
Precipitation_v1.1.doc
Page: 43/63
4.2.2.3 Example of Precipitating Clouds from Cloud Physical Properties (PC-Ph)
visualisation
Below is shown an example of the PCPh product. It has been obtained at full resolution. For an
easier visualization, pixels with NO DATA values due to an unknown phase have been plotted in
black.
Figure 17. PC-Ph probability of precipitation for 9th June 2015 at 15:00 UTC over Europe and
North Africa
4.3 ASSUMPTIONS AND LIMITATIONS
The PCPh product is based on a calibration method which requires the availability of a training set
of precipitation data derived from radar information, to be used as ground truth to derive the
relationship between satellite information and rainfall rate. As for this radar training dataset, the
drop size distribution, used to obtain the radar rainfall rates (mm/h) from the radar reflectivity
(dBZ), has been assumed to be the Marshall Palmer type throughout the calibration and validation
procedures. No online operational method has been applied in order to adjust the radar rainfall
intensities using rain gauge measurements.
This algorithm can be run only over daytime.
For undefined phase pixels, Reff and COT values are not computed by CMIC, so a NO DATA
value is assigned in these cases by the algorithm.
As the main inputs of the product are computed by CMIC, there exists the need to run CMIC
previous to run PPh.
It has been observed that pixels located in the surroundings of snow according to CMIC take
sometimes high values of CWP, so a probability of precipitation higher than 0% is assigned
erroneously.
It is highly recommended to apply parallax correction for a better location of precipitation areas
with respect to the ground below.
This product obtains the best results for convective events.
Page 44
Algorithm Theoretical Basis
Document for the Precipitation
Product Processors of the NWC/GEO
Code:NWC/CDOP2/GEO/AEMET/SCI/ATBD/Precipitation
Issue: 1.11 Date: 15 October 2016 File:NWC-CDOP2-GEO-AEMET-SCI-ATBD-
Precipitation_v1.1.doc
Page: 44/63
4.4 REFERENCES
Pilewskie, P. and Twomey, S., 1987. Discrimination of ice from water in clouds by optical remote
sensing. Atmos. Res., 21:113-122
Roebeling, R.A. and I. Holleman, 2009. SEVIRI rainfall retrieval and validation using weather
radar observations. J. Geophys. Res., D2120, 114.
Roebeling, R.A., A.J. Feijt and P. Stammes, Cloud property retrievals for climate monitoring:
implications of differences between SEVIRI on METEOSAT-8 and AVHRR on NOAA-17 J.
Geophys. Res., 2006, 111, 20210, doi:10.1029/2005JD006990.
Rosenfeld, D., and G. Gutman, 1994. Retrieving microphysical properties near the tops of
potential rain clouds by multispectral analysis of AVHRR data, Atmos. Res., 34, 259–283,
doi:10.1016/0169-8095(94)90096-5.
Page 45
Algorithm Theoretical Basis
Document for the Precipitation
Product Processors of the NWC/GEO
Code:NWC/CDOP2/GEO/AEMET/SCI/ATBD/Precipitation
Issue: 1.11 Date: 15 October 2016 File:NWC-CDOP2-GEO-AEMET-SCI-ATBD-
Precipitation_v1.1.doc
Page: 45/63
5. DESCRIPTION OF CONVECTIVE RAINFALL RATE FROM
CLOUD PHYSICAL PROPERTIES (CRR-PH) PRODUCT FOR
DAYTIME
5.1 CONVECTIVE RAINFALL RATE FROM CLOUD PHYSICAL PROPERTIES (CRR-
PH) OVERVIEW
Convective Rainfall Rate from Cloud Physical Properties (CRR-Ph) product, developed within the
NWC SAF context, is a Nowcasting tool that provides information on convective, and stratiform
associated to convection, instantaneous rain rates and hourly accumulations. This product does not
distinguish the phase of the estimated precipitation.
The main inputs of this product are the cloud top microphysical properties generated by CMIC,
Cloud Top Phase, Effective Radius and Cloud Optical Thickness.
The first step of the processing of the product is the computation of Cloud Water Path (CWP).
Then, depending on some Reff and CWP thresholds, the precipitation area is enclosed. Only in
those pixels belonging to the precipitation area, the rain rate is computed.
To assign an instantaneous rain rate to each pixel, a relationship between CWP and precipitation
intensity is applied. In the following step, taking into account the instantaneous rain rates
computed in the last hour time interval, hourly accumulations are computed through a trapezoidal
integration.
At this stage, the CRR-Ph precipitation pattern computed in the previous step is combined with a
precipitation pattern derived through a lightning algorithm (ANNEX B: Lightning algorithm).
This step is optional.
Parameters used by this product are highly dependent on satellite solar channels. For this reason
this product can only be generated during daytime.
It has been seen that this product provides erroneous rain rates for poor illumination conditions.
For this reason an Illumination Conditions Quality flag, that provides information on the
confidence of the estimated rain rates, is computed and delivered with the product.
5.2 CONVECTIVE RAINFALL RATE FROM CLOUD PHYSICAL PROPERTIES (CRR-
PH) DAYTIME ALGORITHM DESCRIPTION
5.2.1 Theoretical description
In this section the theoretical basis and practical implementation of the algorithm are described.
5.2.1.1 Physics of the problem
Since both PC-Ph and CRR-Ph daytime algorithms are based on the same foundation, information
provided in section 4.2.1.1 applies in this section.
5.2.1.2 Mathematical Description of the Convective Rainfall rate from Cloud Physical
Properties (CRR-Ph) algorithm
The cloud top microphysical properties used to retrieve the CRR-Ph rain rates are the ones
described in section 4.2.1.1.
Page 46
Algorithm Theoretical Basis
Document for the Precipitation
Product Processors of the NWC/GEO
Code:NWC/CDOP2/GEO/AEMET/SCI/ATBD/Precipitation
Issue: 1.11 Date: 15 October 2016 File:NWC-CDOP2-GEO-AEMET-SCI-ATBD-
Precipitation_v1.1.doc
Page: 46/63
The calibration of this algorithm has been done in two steps. Firstly the precipitation area has been
enclosed, and then, rain rates have been assigned to the enclosed precipitation area.
The dataset used for the calibration of both, the precipitation area and the rain rates assignment,
includes 40 storms over Spain occurred from May to September 2009. PPI composites of the C-
Band Spanish Radar network have been used. Since these radar products are available every 10
minutes and the MSG scanning over Spain takes place about 10 minutes later than the MSG slot
time, 0 and 20 minutes MSG slots have been matched to the 10 and 40 minutes radar images
respectively.
Since illumination conditions are very important for this kind of algorithm, only SEVIRI imagery
measured close to the hours of highest sun elevation have been included in this calibration dataset
in order to avoid errors due to poor illumination conditions.
For a better matching of radar – satellite images, the radar products were converted into MSG
projection using a bi-linear interpolation scheme.
A quality control has been used for the Spanish radar dataset taking advantage of the quality
image generated for the radar national composite products (Gutierrez and Aguado, 2006).
Calibration of the rainy area:
According to the literature, clouds need, at least, cloud top effective radius higher than 14 μm to
produce rain (Rosenfeld and Gutman, 1994) so this threshold have been accepted to detect rainy
clouds.
SAFNWC/MSG Parallax tool has been applied to CWP maps.
To establish a CWP threshold, the number of rainy pixels in radar and CWP images have been
compared. The threshold to consider a radar pixel as rainy was fixed to 0.2 mm/h. In the case of
CWP images, a pixel has been considered as rainy when CWP in that pixel was higher than a
certain threshold. The determination of this threshold has been done by comparing the number of
rainy pixels summed up in annular bins with different radius. The centre of the annuli matches
with the centre of the storm, see Figure 18. The centre of the storm was taken as the pixel with the
highest radar rain rate. The number of rainy pixels included in each annulus in radar images has
been compared with the ones obtained in satellite images using different CWP thresholds.
Accuracy measurements (RMSE, MAE, ME) in the comparison between the number of radar
rainy pixels obtained and the satellite ones using a certain CWP threshold have been obtained.
Figure 19 shows the results obtained, indicating that the most appropriate CWP threshold that
indicates a rainy area is 356 g/m2.
Figure 18. Annular bins used for calibration over a Radar image on the left and over a rain/no
rain CWP map on the right.
Page 47
Algorithm Theoretical Basis
Document for the Precipitation
Product Processors of the NWC/GEO
Code:NWC/CDOP2/GEO/AEMET/SCI/ATBD/Precipitation
Issue: 1.11 Date: 15 October 2016 File:NWC-CDOP2-GEO-AEMET-SCI-ATBD-
Precipitation_v1.1.doc
Page: 47/63
Figure 19. Accuracy statistics obtained in the comparison of number of rainy pixels in annular
bins for Spanish storms
Calibration of the rain rates:
A similar calculation has been done for the rain rates calibration. This time the number of radar
rainy pixels has been summed up for different rain rate thresholds, and for each threshold it has
been compared with the number of satellite estimated rainy pixels from algorithms using different
CWP thresholds. The CWP threshold algorithm with lower RMSE has been selected for each
radar rain rate threshold.
Results of this comparison are shown in Figure 20.
Figure 20. Results of rain rates calibration. Radar rain rates vs CWP, thresholds .
Rain rates estimation from geostationary satellite data can not be very accurate so trying to
estimate rain rates higher than 50 mm/h using this type of data is not realistic. For this reason a
maximum limit of 50 mm/h has been established. Then an adjustment with the obtained dots has
been done in order to obtain the best fit function. This analytical function (MCTP function - blue
line) is shown in Figure 20. The mathematical expression of it is the following:
Page 48
Algorithm Theoretical Basis
Document for the Precipitation
Product Processors of the NWC/GEO
Code:NWC/CDOP2/GEO/AEMET/SCI/ATBD/Precipitation
Issue: 1.11 Date: 15 October 2016 File:NWC-CDOP2-GEO-AEMET-SCI-ATBD-
Precipitation_v1.1.doc
Page: 48/63
02.30.40010*6exp*0.2 4 CWPRR
where:
RR – Rain rates (mmh-1)
CWP – Cloud Water Path (gm-2)
It has been seen that, under some conditions, rain rates assigned by this product are erroneously
high. In order to provide the user with information about the reliability of the estimated rain rates,
an illumination quality flag (CRR-Ph_IQF) has been developed. For this purpose the illumination
conditions parameter (ICP), which takes into account the illumination conditions and the view
angle, as described in section 4.2.1.2, has been used:
SunZenSatZenICP cos*cos
Where SatZen is the satellite zenith angle and SunZen is the sun zenith angle.
In order to define the influence of the illumination conditions in the degradation of the product a
comparison between radar and CRR-Ph has been done. 40 storms over Spain from May to
September 2009 and from 6:30 to 17:30 UTC (except for 12:00 UTC because this time was used
for calibration of the product) every 30 minutes, were used for this purpose. Rain rates of radar
higher than 50 mm/h were set to 50 mm/h.
Assuming that the centre of the storm is placed in the pixel with highest radar rain rate, two
parameters have been computed in circular areas of 50 km radius centred in that pixel:
N-CRR-Phmax: the number of CRR-Ph pixels with estimated rain rates higher than or equal
to the highest radar rain rate
N-Radarmax: the number of radar pixels with rain rates equal to the highest radar rain rate
A study of the data pairs obtained for each storm (N-CRR-Phmax, N-Radarmax) has been done
taking into account the ICP registered at the centre of the storm.
The usual behaviour of this kind of satellite derived precipitation products is to provide lower rain
rates and wider precipitation areas than the ones detected by the radar. The degradation of the
product estimations under poor illumination conditions leads to an overestimation of the estimated
rain rates remaining the precipitation area well detected.
It can be assumed that under good illumination conditions, the following relationship should apply
most of the times:
1max
max
RadarN
CRPhN
Figure 21 shows the average of (N-CRR-Phmax/ N-Radarmax) for different ICP ranges.
Page 49
Algorithm Theoretical Basis
Document for the Precipitation
Product Processors of the NWC/GEO
Code:NWC/CDOP2/GEO/AEMET/SCI/ATBD/Precipitation
Issue: 1.11 Date: 15 October 2016 File:NWC-CDOP2-GEO-AEMET-SCI-ATBD-
Precipitation_v1.1.doc
Page: 49/63
Figure 21. Average of (N-CRR-Phmax/ N-Radarmax) for different ICP ranges
Figure 21 shows that the lower value takes ICP, the higher is the number of too high rain rates
estimated by CRR-Ph. In other words, the poorer are the illumination conditions, the higher is the
overestimation of CRR-Ph rain rates. Other conclusion that can be obtained from Figure 21 is that,
for ICP values higher than 0.65, CRR-Ph rain rates estimations are not overestimated.
Looking at the triads (N-CRR-Phmax, N-Radarmax, ICP) it can be observed that even for ICP < 0.65
it happens that N-CRR-Phmax is lower or equal than N-Radarmax in some cases. So the percentage
of the cases when N-CRR-Phmax is lower or equal N-Radarmax, has been computed for some ICP
intervals taking into account the ICP ≥ 0.65 threshold. Figure 22 shows the percentage of the cases
when N-CRR-Phmax is lower or equal N-Radarmax. To test whether the previous relationship is too
restrictive, the percentage of cases when N-CRR-Phmax is lower or equal two times, and three
times, N-Radarmax have been computed and can be seen in Figure 23 and Figure 24, respectively.
So these two last graphs have been computed in order to ensure that the previous assumption (N-
CRR-Phmax/ N-Radarmax 1) is acceptable.
The best results are obtained for ICP > 0,6 when 76% of cases accomplishes the condition. It must
be taken into account that, even for good illumination conditions, the condition could not be
accomplished in some cases and it doesn’t mean bad CRR-Ph results.
ICP > 0,5 accomplishes the condition in more than 67% of the cases, and ICP > 0,4 in more than
66% of the cases.
Page 50
Algorithm Theoretical Basis
Document for the Precipitation
Product Processors of the NWC/GEO
Code:NWC/CDOP2/GEO/AEMET/SCI/ATBD/Precipitation
Issue: 1.11 Date: 15 October 2016 File:NWC-CDOP2-GEO-AEMET-SCI-ATBD-
Precipitation_v1.1.doc
Page: 50/63
Figure 22. Percentage of the cases when N-CRR-Phmax is lower or equal N-Radarmax.
Figure 23. Percentage of the cases when N-CRR-Phmax is lower or equal than two times N-
Radarmax.
Figure 24. Percentage of the cases when N-CRR-Phmax is lower or equal than three times N-
Radarmax
Page 51
Algorithm Theoretical Basis
Document for the Precipitation
Product Processors of the NWC/GEO
Code:NWC/CDOP2/GEO/AEMET/SCI/ATBD/Precipitation
Issue: 1.11 Date: 15 October 2016 File:NWC-CDOP2-GEO-AEMET-SCI-ATBD-
Precipitation_v1.1.doc
Page: 51/63
It can be complicated for the forecaster to directly use ICP value so, using an average of the
results obtained in Figure 22, Figure 23 and Figure 24, the percentage of cases, depending on ICP,
when the algorithm provides good results, as far as illuminations conditions and viewing angles
are concerned, have been computed. This percentage of confidence on the CRR-Ph rain rates is
included in the variable CRR-Ph_IQF and depends on ICP on the following way:
CRR-Ph_IQF = 109.95 * ICP + 11.09
If CRR-Ph_IQF < 0 then CRR-Ph_IQF = 0
If CRR-Ph_IQF > 100 then CRR-Ph_IQF = 100
Figure 25. Relation between ICP and CRR-Ph_IQF
CRR-Ph_IQF (%) is included as an output of the product and it must be understood as an indicator
of the confidence that a forecaster can have on the rain rates estimated by the product.
For a better convective precipitation area location a parallax correction [ANNEX A: Parallax
Correction] can be applied to this product. This option is chosen by the user through the product
model configuration file and it is applied by default.
Lightning activity can provide valuable information about convection. A lightning algorithm can
be applied to derive a precipitation pattern that will be combined with the CRR-Ph one computed
in the previous step in order to complement it. Description of the lightning algorithm can be found
in ANNEX B: Lightning algorithm.
Using the computed rain rates, hourly accumulations are computed. The description of this
process can be found in ANNEX C: Hourly accumulations.
5.2.2 Practical considerations
5.2.2.1 List of Convective Rainfall rate from Cloud Physical Properties (CRR-Ph) inputs
CMIC product physical properties:
CMIC Phase, COT and Reff parameters are mandatory inputs to CRR-Ph.
Satellite imagery:
IR10.8 SEVIRI brightness temperature at full IR spatial resolution is a mandatory input to
compute Parallax Correction.
Numerical model:
Temperature at 1000, 925, 850, 700, 500, 400, 300, 250 and 200 hPa
Geopotential at 1000, 925, 850, 700, 500, 400, 300, 250 and 200 hPa
This information is used by default for parallax correction. In case of lack of NWP parameters
parallax correction will be run using a climatological profile.
Ancillary data sets:
Climatological profile is necessary as a backup for Parallax correction in case NWP is not
available. This information is included in the software package and is located in the
$SAFNWC/import/Aux_data directory
Lightning information file for CRR-Ph product:
Page 52
Algorithm Theoretical Basis
Document for the Precipitation
Product Processors of the NWC/GEO
Code:NWC/CDOP2/GEO/AEMET/SCI/ATBD/Precipitation
Issue: 1.11 Date: 15 October 2016 File:NWC-CDOP2-GEO-AEMET-SCI-ATBD-
Precipitation_v1.1.doc
Page: 52/63
A file with information on every lightning occurred in a time interval is mandatory to choose the
option of adjusting the CRR-Ph precipitation pattern with the lightning information. Information
about this lightning information file structure can be found in the Interface Control Document for
Internal and External Interfaces of the NWC/GEO [RD 4].
Model configuration file for PPh:
PPh model configuration file contains configurable system parameters in the generation process of
both PC-Ph and CRR-Ph products. The CRR-Ph product related parameters refers to ancillary
datasets, numerical model data, lightning algorithm and parallax correction. . The complete list of
these parameters and the explanation of the most useful ones is available in the User Manual for
the Precipitation Product Processors of the NWC/GEO [RD 5].
5.2.2.2 Description of the Convective Rainfall rate from Cloud Physical Properties (CRR-
Ph) output
The content of the CRR-Ph output is described in the Data Output Format Document [RD 3]. A
summary is given below:
Container Content
crrph_intensity NWC GEO CTMP-CRR Convective Rainfall Intensity
crrph_intensity(mm/h) = scale_factor * counts + add_offset
where:
scale_factor = 0.1
add_offset = 0.0
crrph_accum NWC GEO CTMP-CRR Convective Hourly Rainfall Accumulation
crrph_accum(mm) = scale_factor * counts + add_offset
where:
scale_factor = 0.1
add_offset = 0.0
crrph_iqf NWC GEO CTMP-CRR Confidence based on illumination conditions
crrph_iqf(%) = scale_factor * counts + add_offset
where:
scale_factor = 1.0
add_offset = 0.0
Page 53
Algorithm Theoretical Basis
Document for the Precipitation
Product Processors of the NWC/GEO
Code:NWC/CDOP2/GEO/AEMET/SCI/ATBD/Precipitation
Issue: 1.11 Date: 15 October 2016 File:NWC-CDOP2-GEO-AEMET-SCI-ATBD-
Precipitation_v1.1.doc
Page: 53/63
Container Content
crrph_status_flag 10 bits indicating
Data Availability:
Bit 0: Reff or COT not computed (out of cloud, night time, phase not defined)
Bit 1: Phase not computed or undefined
Bit 2: IR band missing (used in parallax correction)
Applied Correction:
Bit 3: Parallax correction applied
Use of optional data:
Bit 6: Lightning data used
Other information
Bit 8: crr_intensity was a hole because of the parallax correction, and then was
filled by the median filter
Bit 9, 10, 11: Use of bands for accumulation
1: All required bands were available
2: One previous CRR band is missing
3: At least two previous CRR bands are missing (no consecutive)
4: At least two previous CRR bands are missing (some are consecutive)
Bit 12: Accumulation quality flag. Set to 1 if:
not all crr values are available to perform the accumulation,
OR
any of the crr_intensity values was set to 0 due to filtering process
OR
Any of the crr_intensity values was a hole because parallax correction
Geophysical Conditions Field Type Description
Space Flag Set to 1 for space pixels
Illumination Parameter Defines the illumination condition
0: N/A (space pixel)
1: Night
2: Day
3: Twilight
Sunglint Flag Set to 1 if Sunglint
Land_Sea Parameter 0: N/A (space pixel)
1: Land
2: Sea
3: Coast
Page 54
Algorithm Theoretical Basis
Document for the Precipitation
Product Processors of the NWC/GEO
Code:NWC/CDOP2/GEO/AEMET/SCI/ATBD/Precipitation
Issue: 1.11 Date: 15 October 2016 File:NWC-CDOP2-GEO-AEMET-SCI-ATBD-
Precipitation_v1.1.doc
Page: 54/63
Processing Conditions Field Type Description
Satellite_input_data Parameter Describes the Satellite input data status
0: N/A (space pixel)
1: All satellite data are available
2: At least one useful satellite channel is missing
3: At least one mandatory satellite channel is missing
NWP_input_data Parameter Describes the NWP input data status
0: N/A (space pixel or NWP data not used)
1: All NWP data are available
2: At least one useful NWP field is missing
3: At least one mandatory NWP field is missing
Product_input_data Parameter Describes the Product input data status
0: N/A (space pixel or Auxiliary data not used)
1: All input Product data are available
2: At least one useful input Product is missing
3: At least one mandatory input Product is missing
Auxiliary_input_data Parameter Describes the Auxiliary input data status
0: N/A (space pixel or Auxiliary data not used)
1: All Auxiliary data are available
2: At least one useful Auxiliary field is missing
3: At least one mandatory Auxiliary field is missing
Quality Field Type Description
Nodata Flag Set to 1 if pixel is NODATA
Internal_consistency Flag Set to 1 if an internal consistency check has been performed. Internal
consistency checks will be based in the comparison of the retrieved
meteorological parameter with physical limits, climatological limits,
neighbouring data, NWP data, etc.
Temporal_consistency Flag Set to 1 if a temporal consistency check has been performed
Temporal consistency checks will be based in the comparison of the retrieved
meteorological parameters with data obtained in previous slots.
Quality Parameter Retrieval Quality
0: N/A (no data)
1: Good
2: Questionable
3: Bad
4: Interpolated
Page 55
Algorithm Theoretical Basis
Document for the Precipitation
Product Processors of the NWC/GEO
Code:NWC/CDOP2/GEO/AEMET/SCI/ATBD/Precipitation
Issue: 1.11 Date: 15 October 2016 File:NWC-CDOP2-GEO-AEMET-SCI-ATBD-
Precipitation_v1.1.doc
Page: 55/63
5.2.2.3 Example of Precipitating Clouds from Convective Rainfall rate from Cloud Physical
Properties (CRR-Ph) visualisation
Below is shown an example of the CRR-Ph instantaneous rain rates. It has been obtained at full
resolution . For an easier visualization, pixels with NO DATA values due to an unknown phase
have been plotted in black.
Figure 26. CRR-Ph instantaneous rain rates for 9th June 2015 at 15:00 UTC over Europe and
North Africa
Below is shown an example of the CRR-Ph hourly accumulations. It has been obtained at full
resolution. For an easier visualization, pixels with NO DATA values due to an unknown phase
have been plotted in black.
Figure 27. CRR-Ph hourly accumultions for 9th June 2015 at 15:00 UTC over Europe and North
Africa
Page 56
Algorithm Theoretical Basis
Document for the Precipitation
Product Processors of the NWC/GEO
Code:NWC/CDOP2/GEO/AEMET/SCI/ATBD/Precipitation
Issue: 1.11 Date: 15 October 2016 File:NWC-CDOP2-GEO-AEMET-SCI-ATBD-
Precipitation_v1.1.doc
Page: 56/63
Below is shown an example of the CRR-Ph illumination quality flag.
Figure 28. CRR-Ph illumination quality flag for 9th June 2015 at 15:00 UTC over Europe and
North Africa
5.3 ASSUMPTIONS AND LIMITATIONS
The CRR-Ph product is based on a calibration method which requires the availability of a training
set of precipitation data derived from radar information, to be used as ground truth to derive the
relationship between satellite information and rainfall rate. As for this radar training dataset, the
drop size distribution, used to obtain the radar rainfall rates (mm/h) from the radar reflectivity
(dBZ), has been assumed to be the Marshall Palmer type throughout the calibration and validation
procedures. No online operational method has been applied in order to adjust the radar rainfall
intensities using rain gauge measurements.
This algorithm can be run only over daytime.
For undefined phase pixels, Reff and COT values are not computed by CMIC, so a NO DATA
value is assigned in these cases by the algorithm.
As the main inputs of the product are computed by CMIC, there exists the need to run CMIC
previous to run PPh.
It has been observed that pixels located in the surroundings of snow according to CMIC take high
values of CWP, so a rain rate higher than 0 mm/h is assigned erroneously.
It is highly recommended to apply parallax correction for a better location of precipitation areas
with respect to the ground below.
There exists a high dependence on illumination conditions for this product.
The relatively weak coupling between spectral features in the visible and infrared channels with
precipitation rate for all situations except for convection makes it in most cases doubtful to try to
assign precipitation rates from GEO data alone. For this reason, this product has been calibrated
only for convective events, and so, it obtains the best results for convective events. For other type
Page 57
Algorithm Theoretical Basis
Document for the Precipitation
Product Processors of the NWC/GEO
Code:NWC/CDOP2/GEO/AEMET/SCI/ATBD/Precipitation
Issue: 1.11 Date: 15 October 2016 File:NWC-CDOP2-GEO-AEMET-SCI-ATBD-
Precipitation_v1.1.doc
Page: 57/63
of precipitation, like the stratiform one, serious underestimation, overestimation or unforecasted
events are likely to occur.
This product does not distinguish the phase of the estimated precipitation.
It must be borne in mind that these kind of cloud top based precipitation indirect methods
necessarily have uncertainties. Although not found during the calibration and validation processes,
according to the literature it is possible to find small ice particles in high-level strong updrafts of
deep convective clouds (Rosenfeld et al., 2008). This could cause erroneous rain rate estimations.
As for the lightning data, the lightning algorithm and the coefficients applied have been derived
for Spain using the lightning information from the AEMET lightning detection network.
Concerning this particular, it is important to highlight that ground based lightning detection
networks provide information with different performances in detection efficiency and location
accuracy. For this reason, in the model configuration file the keyword APPLY_LIGHTNING is
set to 0 and by default the lightning information is not used. Therefore, before to use the lightning
algorithm, it is highly recommended to the user to adapt the coefficients to the specific
performances of the lightning detection network serving that information.
5.4 REFERENCES
Gutierrez, J. M. and Aguado, F.: Quality image for the Spanish Radar National Composite,
Proceedings of ERAD 2006, 318-320.
Rosenfeld, D. and G. Gutman, 1994. Retrieving microphysical properties near the tops of
potential rain clouds by multispectral analysis of AVHRR data, Atmos. Res., 34, 259–283,
doi:10.1016/0169-8095(94)90096-5.
Rosenfeld, D., William L. Woodley, Amit Lerner, Guy Kelman, Daniel T. Lindsey, 2008. Satellite
detection of severe convective storms by their retrieved vertical profiles of cloud particle effective
radius and thermodynamic phase. J. Geophys. Res. D4, 113.
Tapia, A., Smith, J. A., Dixon, M., 1998: Estimation of Convective Rainfall from Lightning
Observations, Bull. American Meteorological Society, Vol. 37, pp. 1497-1509.
Page 58
Algorithm Theoretical Basis
Document for the Precipitation
Product Processors of the NWC/GEO
Code:NWC/CDOP2/GEO/AEMET/SCI/ATBD/Precipitation
Issue: 1.11 Date: 15 October 2016 File:NWC-CDOP2-GEO-AEMET-SCI-ATBD-
Precipitation_v1.1.doc
Page: 58/63
6. ANNEX A: PARALLAX CORRECTION
Two important factors for accurate precipitation estimations from satellite imagery are the
position of the cloud tops and the influence of orographic effects on the distribution of
precipitation.
The exact cloud position with respect to the ground below is needed to apply the CRR orographic
correction. This is not a problem when a cloud is located directly below the satellite; however, as
one looks away from the sub-satellite point, the cloud top appears to be farther away from the
satellite than the cloud base. This effect increases as you get closer to the limb and as clouds get
higher. Since parallax correction rectifies this effect, it is needed to be applied before orographic
correction in the case of the CRR product.
Figure 29. Parallax geometry
The parallax correction depends on three factors: a) the cloud height, b) the apparent position on
the earth of that cloud and c) the position of the satellite.
The last two factors are known, but the first one has to be estimated. Two height estimation
methods have been studied: numerical model and climatological profile obtained from the 1962
standard atmosphere model. Both of them are based on the conversion of each 10.8IR brightness
temperature to height.
By default, height is estimated using NWP data. Parallax correction needs the NWP geopotential
and temperature data at some levels (1000, 925, 850, 700, 500, 400, 300, 250 and 200). If NWP
previous and next (according to the forecast time) models are available for the current slot time, a
linear interpolation between these two models is performed.
Using 10.8IR brightness temperature, a linear interpolation is done among NWP temperatures and
geopotential giving as a result the cloud height for each pixel. This height is then converted to
meters.
In case of lack of NWP data or different number of pressure levels found (between temperature
and geopotential) the NWP method for height calculation won’t be used, and the climatological
profile will be applied instead.
The used climatological data contain geopotential and temperature information related to five
zones: 0º-15º, 15º-30º, 30º-45º, 45º-60º and 60º-75º. Two seasons are considered, summer and
winter. A linear interpolation is used for latitude position and a cosine interpolation is used for
Julian date.
Cloud height (in meters) is obtained using a bi-lineal interpolation according to the pixel
temperature and considering the nearest four climatological temperature and geopotential
measurements.
Page 59
Algorithm Theoretical Basis
Document for the Precipitation
Product Processors of the NWC/GEO
Code:NWC/CDOP2/GEO/AEMET/SCI/ATBD/Precipitation
Issue: 1.11 Date: 15 October 2016 File:NWC-CDOP2-GEO-AEMET-SCI-ATBD-
Precipitation_v1.1.doc
Page: 59/63
Parallax correction begins by converting the point and satellite locations into cartesian coordinates
using the Earth centre as the origin. The Earth's surface is considered as an ellipsoid with an
equatorial radius of 6378.077 Km. and a polar radius of 6356.577 Km. A virtual ellipsoid (as the
earth's one) is performed using the distance from the cloud top to the earth centre. The cross point
between the line joining the satellite and the apparent cloud surface position and this ellipsoid is
found. The surface point connecting it with the Earth centre is then obtained, providing as result
the new co-ordinate of the pixel. Finally, cartesian coordinates are converted into geographical
ones.
When Parallax Correction is working, a spatial shift is applied to every pixel with precipitation
according to the basic CRR value. In this re-mapping process, and only for a very small
percentage of pixels, it could happen that (1) two pixels of the original image are assigned to the
same pixel of the final image or (2) a pixel of the final image is not associated to any pixel of the
original image (a “hole” appears in the final image). To solve these special cases, the next
solutions have been implemented in the software:
- Case (1): the algorithm takes the maximum value of the rainfall rate
- Case (2): the software identifies the pixels with “hole”. A 3x3 median filter centred on that
hole pixel is applied in order to assign a rainfall rate value (to compute the median, the pixels
within the 3x3 box identified as holes are excluded)
The theoretical basis used in the computing of the Parallax correction in the CRR and CRR-Ph
products and the Parallax Correction Processor of the NWC/GEO [RD 7] is the same.
Page 60
Algorithm Theoretical Basis
Document for the Precipitation
Product Processors of the NWC/GEO
Code:NWC/CDOP2/GEO/AEMET/SCI/ATBD/Precipitation
Issue: 1.11 Date: 15 October 2016 File:NWC-CDOP2-GEO-AEMET-SCI-ATBD-
Precipitation_v1.1.doc
Page: 60/63
7. ANNEX B: LIGHTNING ALGORITHM
The lightning algorithm is based on the assumption than the higher is the spatial and temporal
density of lightning occurrence, the stronger is the convective phenomenon and the higher is the
probability of occurrence and the intensity of convective precipitation.
Only Cloud-to-Ground lightning flashes are used by this algorithm. To incorporate this
information into the product a rain rate has been assigned to every lightning depending on:
- the time distance (Δτ) between the lightning event and scanning time of the processing
region centre.
- the location of the lightning
- the spatial density of lightning in a time interval.
In order to know the rain rate to be assigned to each lightning the process proposed in Tapia et all.
(Tapia et al., 1998) has been followed in this way:
A representative set of convective storms occurred over Spain have been selected. For each of
them a Rainfall-Lightning Ratio (RLR) has been computed. This RLR takes into account the
quantity of precipitation measured as well as the number of lightning occurred during each event.
The mean of the RLR obtained for the selected storms is 10.08 mm/lightning.
The procedure followed is the following:
First of all, the number of lightning occurred within an interval Δt before the scanning time of the
processing region centre, are assigned to each pixel according to its latitude and longitude. The
interval Δt is selected by the user (default value: 15 minutes).
Afterwards a rain amount is assigned to every pixel according to the number of lightning allocated
to it. The variability of the spatial correlation between lightning and rainfall within the storm area
suggest the use of a uniform distribution of rainfall about lightning flashes (Tapia et al., 1998).
For this reason, instead of assigning the RLR just to one pixel, this quantity of precipitation is
spread around the pixel in order to obtain a more homogeneous pattern of precipitation in this
way:
Figure 30. Spreading of the RLR value in a 5 by 5 pixels box
Page 61
Algorithm Theoretical Basis
Document for the Precipitation
Product Processors of the NWC/GEO
Code:NWC/CDOP2/GEO/AEMET/SCI/ATBD/Precipitation
Issue: 1.11 Date: 15 October 2016 File:NWC-CDOP2-GEO-AEMET-SCI-ATBD-
Precipitation_v1.1.doc
Page: 61/63
Being Z1, Z2, Z3 and Z4 the rain rate assignments according to the RLR obtained in the
calibration process. The spreading of the RLR value has been done in the following way:
Z1= 0.228 * RLR (default value: 2.30 mm)
Z2= 0.074 * RLR (default value: 0.75 mm)
Z3= 0.025 * RLR (default value: 0.25 mm)
Z4= 0.010 * RLR (default value: 0.10 mm)
Simultaneously, the time of occurrence of each lightning event is taken into account. Since the
point of view of instantaneous precipitation rates, lightning closer in time to the instant of rainfall
measurement are better spatially correlated to the convective nuclei at that moment. So a higher
weight is given to those lightning that occurred closer in time to the scanning time of the
processing region centre (CRR-Ph time). To do that, all rain rates already assigned are multiplied
by the factor COEFF_τ being:
1)(10*3)(10*1_ 2347 COEF
Where Δτ is the interval of time between the time of occurrence of the lightning and the CRR-Ph
time:
Figure 31. Diagram that shows the relationship between Δτ and Δt
Based on the fact than the higher is the spatial density of lightning occurrence the higher is the
probability of the occurrence of greater intensities of precipitations, the density of lightning
around each pixel is taken into account in the last step. To do that, rain rate corresponding to each
pixel is multiplied by COEFF_N with:
NbaNCOEFF 1_
Where N is the number of lightning occurred in a 11x11 pixels box centred on every pixel within
the Δt interval. a and b are the parameters of the equation (default values: a=0,45; b=0,7).
Once the precipitation pattern has been computed, it is compared to the CRR-Ph precipitation
pattern in order to obtain the final product. This final product contains the highest rain rate of the
two.
Instructions on how to tune lightning algorithm can be found in the User Manual for the
Precipitation Product Processors of the NWC/GEO [RD 5].
Page 62
Algorithm Theoretical Basis
Document for the Precipitation
Product Processors of the NWC/GEO
Code:NWC/CDOP2/GEO/AEMET/SCI/ATBD/Precipitation
Issue: 1.11 Date: 15 October 2016 File:NWC-CDOP2-GEO-AEMET-SCI-ATBD-
Precipitation_v1.1.doc
Page: 62/63
8. ANNEX C: HOURLY ACCUMULATIONS
At the end of the process the final values of the rainfall rates in mm/h are used in order to obtain
hourly accumulations. A trapezoidal integration (Sánchez-Sesma and Sosa, 2004) is performed in
order to compute the hourly accumulations.
Normal mode:
Six scenes are used in this process: the instantaneous scene corresponding to the time of the
hourly accumulation and the five previous instantaneous scenes. The rain rate in mm/h output is
the one used to make the computing.
Figure 32. Trapezoidal integration
The nominal time of a scene corresponds to the moment when the satellite starts the scanning.
Some minutes are needed to overpass the centre of the region where the product is being running.
In order to avoid the time window effect, the following equation has been used to compute the
hourly accumulations:
)(2222
655
43221
6
TII
TI
TITITIII
A
Where:
- Ai: hourly accumulation, in mm, corresponding to the time i.
- T: time interval between scenes in hours (T= 0.25)
- Ф: part of T that corresponds to the time that takes the satellite to reach the
centre of the region.
- Ii: Instantaneous rainfall rate for each scene in mm/h
The hourly accumulation won’t be computed when there is a lack of more than two scenes
or two consecutive ones in the complete interval.
Rapid Scan mode:
Fourteen scenes are used in this case: the instantaneous scene corresponding to the time of the
hourly accumulation and the thirteen previous instantaneous scenes.
The equation that is used in the trapezoidal integration for the Rapid Scan mode is:
TII
TI
TITIII
Ai
i2222
14131312
3
22114
Page 63
Algorithm Theoretical Basis
Document for the Precipitation
Product Processors of the NWC/GEO
Code:NWC/CDOP2/GEO/AEMET/SCI/ATBD/Precipitation
Issue: 1.11 Date: 15 October 2016 File:NWC-CDOP2-GEO-AEMET-SCI-ATBD-
Precipitation_v1.1.doc
Page: 63/63
Where:
- Ai: hourly accumulation, in mm, corresponding to the time i.
- T: time interval between scenes in hours (T= 1/12)
- Ф: part of T that corresponds to the time that takes the satellite to reach the
centre of the region.
- Ii: Instantaneous rainfall rate for each scene in mm/h
The hourly accumulation won’t be computed when there is a lack of more than six scenes or four
consecutive ones in the complete interval.


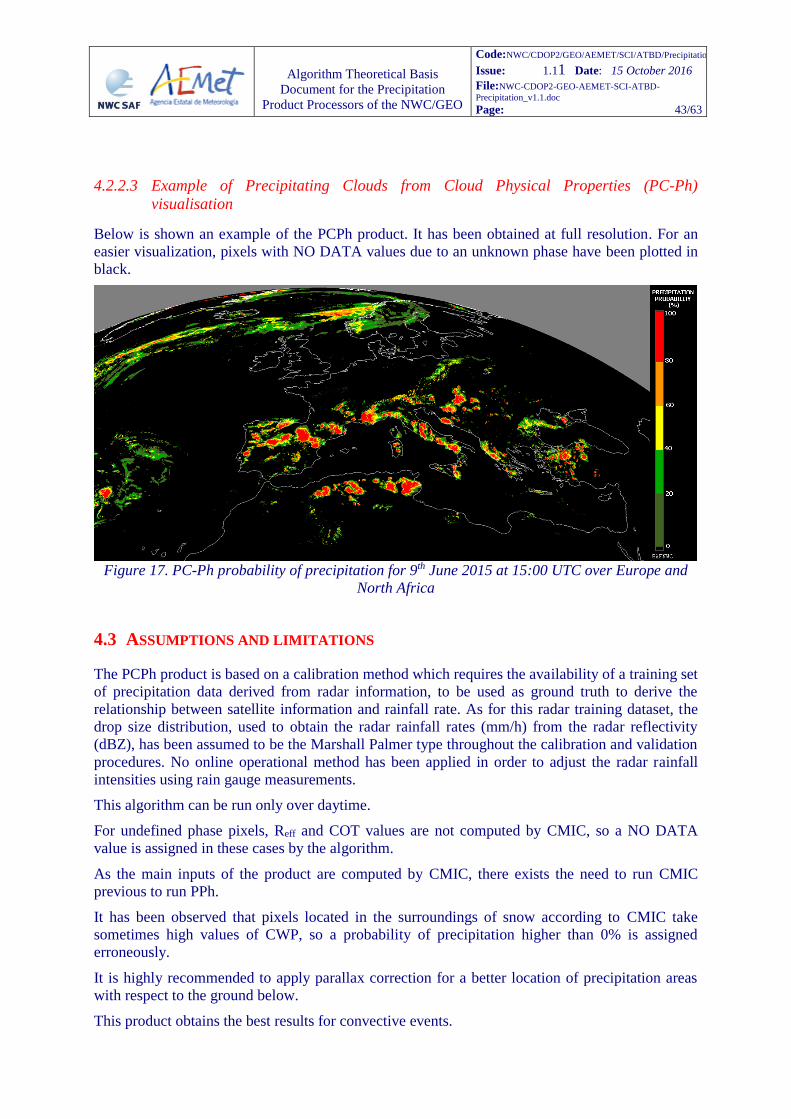


![ALGORITHM THEORETICAL BASIS DOCUMENT Offline Tropospheric … · 2017-03-02 · ALGORITHM THEORETICAL BASIS DOCUMENT Offline Tropospheric Ozone, Cloud slicing Version 1 ... 2014].](https://static.documents.pub/doc/80x56/5ec8b973e75795012711ba65/algorithm-theoretical-basis-document-offline-tropospheric-2017-03-02-algorithm.jpg)


