Algorithmic Application to Stock Trading Methods Edward Celella Supervisor: Dr Shan He School of Computer Science, University of Birmingham, Birmingham B15 2TT, UK [email protected]Abstract. The purpose of this paper is to provide reasoning as to why machine learning is an effective tool in the field of stock trading. This is achieved by an examination of the traditional methods used by ac- tive traders, namely fundamental and technical analysis. The review of these techniques includes the models utilised, as well as the underlying economic theories each strategy rests on. The conclusion reached by this paper is that machine learning is applicable to the field, as many of the underlying structures used by machine learning models (e.g. linear and non-linear), are already utilised within the field. Furthermore, the task is shown to be easily formulated into other types of problem structures (e.g. Bayesian and ensemble). However, although machine learning is shown to be an effective tool, it is noted that many studies in the field train models using technical indicators (e.g. past price values). This paper in- stead advocates for the use of fundamental indicators over technical, due to the underlying economic theories technical analysis rests on, produc- ing inherent noise in the data. In comparison, fundamental data does not suffer from this problem. Thus, the case is made that it can be used to produce more accurate, and universally applicable models. Keywords: Stock Trading · Fundamental Analysis · Technical Analysis · Algorithmic Trading · Machine Learning Application ? Preprint submitted for Individual Study 2 (2020)
Transcript
Algorithmic Application to Stock TradingMethods
Edward CelellaSupervisor: Dr Shan He
School of Computer Science, University of Birmingham,Birmingham B15 2TT, [email protected]
Abstract. The purpose of this paper is to provide reasoning as to whymachine learning is an effective tool in the field of stock trading. Thisis achieved by an examination of the traditional methods used by ac-tive traders, namely fundamental and technical analysis. The review ofthese techniques includes the models utilised, as well as the underlyingeconomic theories each strategy rests on. The conclusion reached by thispaper is that machine learning is applicable to the field, as many of theunderlying structures used by machine learning models (e.g. linear andnon-linear), are already utilised within the field. Furthermore, the task isshown to be easily formulated into other types of problem structures (e.g.Bayesian and ensemble). However, although machine learning is shownto be an effective tool, it is noted that many studies in the field trainmodels using technical indicators (e.g. past price values). This paper in-stead advocates for the use of fundamental indicators over technical, dueto the underlying economic theories technical analysis rests on, produc-ing inherent noise in the data. In comparison, fundamental data does notsuffer from this problem. Thus, the case is made that it can be used toproduce more accurate, and universally applicable models.
16 Bayesian probability formulation of price to earnings ratio. . . . . . 16
Algorithmic Application to Stock Trading Methods 1
1 Introduction
Every day businesses require capital in order to operate. One such method ofobtaining funding is through investors. Investors provide funding, in return forshares of a business. These shares recuperate investments via dividends payedto the holder, or through selling them when they are valued at a higher price.In order for investors to mitigate the risk of losing money (in the event a busi-ness shares lose value and/or profits), they require techniques which can predictwhether an investment is good or bad.
Investment funds are traditionally managed using one of two techniques, passiveor active. Both of which use widely different approaches.
Passive investors utilise indexes in order to make decisions. Indexes are a collec-tion of companies that fall within a specific sector, each companies stock priceis taken in order to produce an overall price for the index (either as an averageor weighted calculation). This provides a snapshot of the economic sector. Anexample of an index is the FTSE 100, which is a collection of the top 100 compa-nies with the largest market capitalisation (market value of outstanding stocks)on the London Stock Exchange. Passive investors merely invest in an index, thegoal being not to beat the market, merely match its growth (O’Shaughnessy1997, p.1).
Active investors on the other hand attempt to beat the market. They achievethis by analysing a companies history, using past prices, growth rates and amultitude of other factors in order to reach a decision. These variables are thenused to forecast the future trend of a companies price, and thus deducing whetherto buy or sell shares in that particular company (O’Shaughnessy 1997, p.1).Active investment strategies generally fall into one of two camps. The first beingtechnical analysis, which solely uses the historical data of a companies stockprice, in order to forecast future prices. The second is fundamental analysis,which looks at the business itself in order to make decisions.
Algorithmic trading is a relatively new field of study, and is the application ofcomputer programs to the world of trading. This study will outline how the fieldof machine learning is being used to develop new strategies that help investors intrading world. Furthermore it will delve into the world of stock trading, outlin-ing the traditional methods used, in order to develop an understanding of howthe data can be used with established machine learning models, and using thisknowledge, provide evidence as to why they are applicable.
2 E. Celella
2 Technical Analysis
2.1 Introduction
Technical analysis solely uses the past share prices in order to generate a forecastfor the future(Becket & Essen 2010, p.70). It is based upon the economic theorycastle-in-the-air which was proposed by John M. Keynes in 1936. The theory isbased on the idea that movements in the market are not governed by the valueof a company, but instead the psychological behaviour of investors. The generalidea is that investors ”follow the crowd”, thus when a subset begin to investothers do so as well. This herd mentality builds up hope on investment oppor-tunities, hence producing ”castles in the air”. Therefore, in order to forecast themovement of stock prices, one must identify which opportunities are ”susceptibleto public castle-building and then buying before the crowd”. (de Prado 2018,p.100)Malkiel1973
The methodology is also based heavily on the efficient market theory. An efficientmarket is any capital market in which security prices at any time ”fully reflectall available information” (Fama 1970). This is formally defined in equation 1where: E is the expected value operator, pj,t is the price of security j at time t,rj,t+1 is the one period percentage return (pj,t+1− pj,t)/pj,t, and Φt is the set ofinformation available. Variables with the tilde indicate random variables (Fama1970).
E(pj,t+1|Φt) = [1 + E(rj,t+1|Φt)]pj,t (1)
However, the efficient market hypothesis also works against the idea of technicalanalysis. This is due to two factors. The first being that because security pricesfully reflect all available information, each change in price is therefore indepen-dent to the previous (as the information between each step changes). The secondfactor is that each change is identically distributed. This means that althoughthe current market information is the same across all price changes, each price isa different representation of said information. These two factors form the randomwalk hypothesis, which states that the movement of prices is merely a series ofrandom steps. Therefore, using only the previous price data will give no insightinto future movements. (Fama 1970)
But proponents of technical analysis refute this claim. Lo and MacKinley intheir book ”A non-random walk down wall street” (Lo & MacKinlay 1999),state that prices are not random but move in trends, and thus can be predicted.Furthermore, the idea that the market as a whole is random does not necessarilymean technical analysis is a redundant system. As the market ”may witness
Algorithmic Application to Stock Trading Methods 3
extended periods of random fluctuation, interspersed with shorter periods ofnonrandom behaviour” (Schwager 1999, p.1).
Combining these two theories forms the core of technical analysis. Each pricemovement is a causation of all available information. This information is availableto investors, and so technical analysts (chartists) can use past data to predictbehavioural patterns.
2.2 Models and Techniques
The field of technical analysis utilises a variety of techniques in order to forecastfuture price movements. Jack Schwager, in his book ”Getting Starting in Tech-nical Analysis” (Schwager 1999, p.1), lays out the key methods utilised, and howto form models using these methods. This section will provide an overview ofsaid methods.
2.2.1 Trends
The ability to identify price trends is one of the fundamental building blocksof technical analysis. Trends are displayed visually using trend lines. Uptrendlines connect a series of significant higher low values, and downtrend lines con-nect a series of significant lower high values. There is no consensus on how todraw trend lines due to the process being fundamentally subjective. However,objective methods have been developed such as only connecting the two mostrecent relative high or low values (DeMark 1994). Generally, trend lines can beused to identify profit taking zones. These zones occur when a trend line changesdirection, which indicates to buy if a downward trend is penetrated, and to sellif an upwards trend is penetrated. Internal trend lines are a different form oftrend analysis, which simply draws a line which approximates the relative highand low points, without any consideration to extremes. These internal lines areanalysed in the same way as the standard.
Another method of trend analysis is through the use of moving averages. Amoving average is simply the average price over the past N time steps (equation2). Normally, a moving average is calculated by taking the closing price overthe past N days, but any price metric (i.e. high, low, open) and time step(i.e week, month, year) can be used. These points can be plotted, which notonly accurately reflects trends in the price, but also smoothes out unimportantfluctuations (with higher values of N producing smoother graphs). However,these smoothing properties come at the expense of time-lag, which means suddenchanges in trend take longer to catch.
4 E. Celella
Fig. 1: Graph showing an uptrend line. (Schwager 1999)
MA =
∑Nt=1 ptN
(2)
where:
t = The current time step.
N = Amount of time steps.
pt = The price at time step t.
Variations of moving averages seek to improve responsiveness to market changesby weighting values. The two most common variations are linear weighted movingaverage (LWMA), and exponentially weighted moving average (EWMA). Boththese techniques weight recent prices higher than older prices, in order to catchsudden movements in the market more quickly. LWMA weights each day by thetime step (equation 3). Whereas EWMA, defined in equation 4, uses a smoothingconstant (α), which weights all previous prices with an exponentially decreasingdrop-off.
LWMA =
∑Nt=1 pt∑Nt=1 t
(3)
EWMA = α.pt + (1− α).EWMAt−1 (0 ≤ α ≤ 1) (4)
Algorithmic Application to Stock Trading Methods 5
Fig. 2: Moving average graph plotted against stock price. (Schwager 1999)
These techniques form the basis of trend following models, which identify trendsand invest assuming that the trend will continue. The most common form ofmodel in this category are moving average models. In general these models usetwo moving average trend lines, one with a high N (slow trend line), and theother with a low N (fast trend line). If the slow trend line rises above the fasttrend line, this is an indicator to sell. The reverse is true to buy. Breakout systemsare another common trend model. These models simply track the markets abilityto reach new high and low points over the past N days, and assume the marketwill continue along this trend.
2.2.2 Chart Patterns
Chart patterns are predefined patterns which occur in price charts. Each patternserves as an indicator to the future direction of market movement. A few commonpatterns are described briefly in appendix A . These patterns on their own donot provide solid indication of a price movement, however pattern recognitionmodels can combine multiple patterns in order to produce accurate forecasts(e.g. if 5 specific patterns occur then initiate transaction).
2.2.3 Oscillators
Oscillators are mathematical models which calculate the rate of change in orderto describe the momentum of a market. A strong momentum indicates that the
6 E. Celella
trend will continue, and vice versa. Usually all oscillators use the close priceas the daily value in calculations, with the most basic oscillator being that ofmomentum which is simply the current price subtracted by the price N daysago (equation 5). The rate of change (ROC) is another common oscillator whichsimply divides instead of subtracting (equation 6). These oscillators use a signalline, which is simply the median value, and initiate buy or sell signals if themomentum line crosses above or below said signal line respectively.
Momentum = pt − pt−N (5)
ROC =pt
pt−N(6)
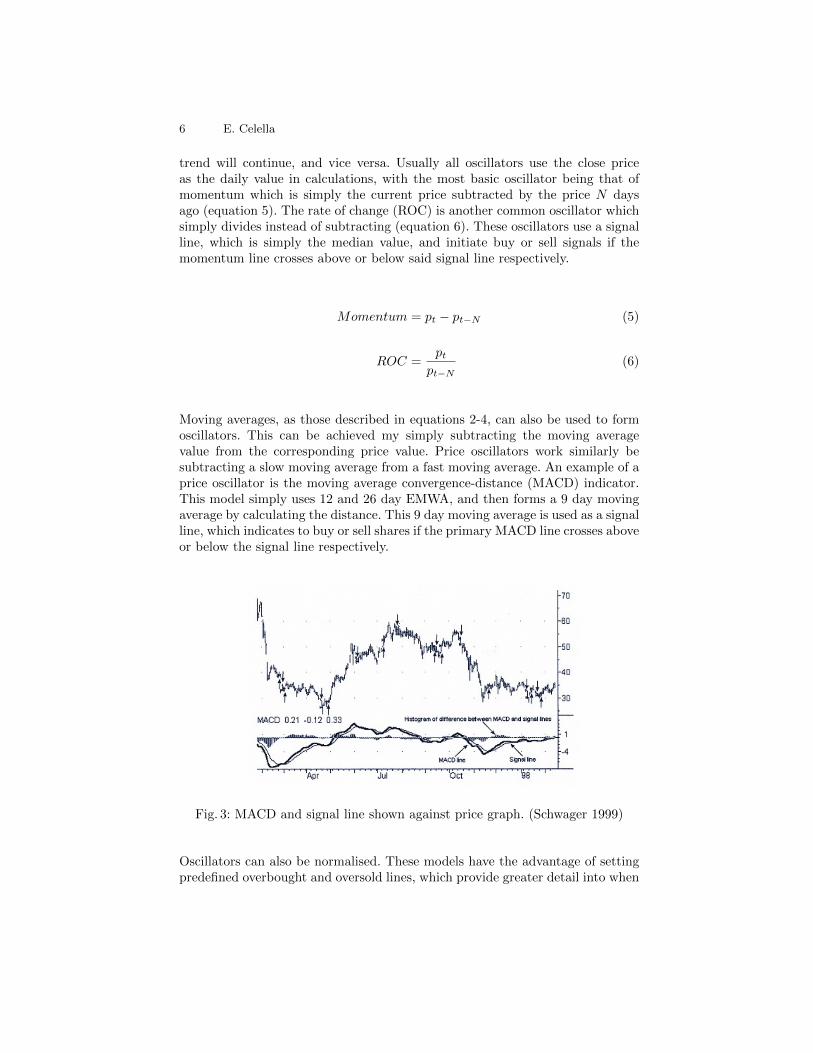
Moving averages, as those described in equations 2-4, can also be used to formoscillators. This can be achieved my simply subtracting the moving averagevalue from the corresponding price value. Price oscillators work similarly besubtracting a slow moving average from a fast moving average. An example of aprice oscillator is the moving average convergence-distance (MACD) indicator.This model simply uses 12 and 26 day EMWA, and then forms a 9 day movingaverage by calculating the distance. This 9 day moving average is used as a signalline, which indicates to buy or sell shares if the primary MACD line crosses aboveor below the signal line respectively.
Fig. 3: MACD and signal line shown against price graph. (Schwager 1999)
Oscillators can also be normalised. These models have the advantage of settingpredefined overbought and oversold lines, which provide greater detail into when
Algorithmic Application to Stock Trading Methods 7
to buy or sell shares. One such example of a normalised oscillator is the relativestrength index (RSI) (Wilder 1978), which is formally defined in equation 7.
RSI = 100− 100
1 + average price increase/average price decrease(7)
where:
average price increase =
∑Nt=1
0 if less than 0︷ ︸︸ ︷(pt − pt−1)
N
average price decrease =
∑Nt=1
0 if greater than 0︷ ︸︸ ︷(pt − pt−1)
N
Fig. 4: RSI against stock price. (Schwager 1999)
Oscillators are the basis of countertrend models, which use these mathematicalmodels and indicators for trend reversal. It is at these points an investor shouldbuy or sell shares depending on the direction of change.
8 E. Celella
3 Fundamental Analysis
3.1 Introduction
Fundamental analysis is the study of a businesses economic strength. The goalof fundamental analysis is to provide a measure of companies value, which canthen in turn be used to guide investment strategies. It is based on the Firm-Foundation economic theory, which hypothesises that each investment opportu-nity has an intrinsic value. This value can be determined through analysis of thepast, present, and future conditions (Malkiel 1973, p.29).
This idea was formalised by John B. Williams in his book ”The Theory of In-vestment Value” (Williams 1938), which relates the value of a stock to the valueof future dividends. In other words, Williams directly relates the value of a stockto the claim on future goods. The model proposed is built upon the time valueof money, which simply takes into account that money over time will increasedue to interest (equation 8) (Chen 2020).
FV = PV × (1 + i) (8)
where:
FV = future value
PV = present value
i = interest rate
Williams expands upon this concept, by using the idea that the future value ofa stock is solely the dividends expected the next year. Therefore, the presentintrinsic value of a stock can be determined by discounting the interest rates onfuture dividends (equation 9) (Williams 1938). This calculated intrinsic valuecan then be compared to the actual current stock price, to evaluate whether theinvestment is over or under priced. This idea of formulating an intrinsic value, isthe core idea behind all fundamental models, and many of the techniques usedaim to forecast a companies future dividends. This makes logical sense, as forinvestors to make money they must locate opportunities that are undervalued,with the expectation they will grow.
V0 =
N∑t=1
πt.
(1
1− i
)t
(9)
Algorithmic Application to Stock Trading Methods 9
However, like technical analysis, the random walk hypothesis apposes this theory.This is due to the idea that the markets efficiency in capturing and applyinginformation to current prices (equation 1), cannot be matched. In other words,the market uses information at a size, and applies this information at a rate,which cannot be replicated by any investors models. Furthermore, the techniquesemployed by fundamental analysis relies on the assumption that the information,and application of this information, can correctly estimate the intrinsic value ofa company. And even if these methods are correct, the market may never reflectthe true intrinsic value of a company, due to its inherent volatility (Malkiel 1973,p.132). As Malkeil describes, ”the security analyst must be a prophet withoutthe benefit of divine inspiration” (Malkiel 1973, p.129).
But supporters of fundamental analysis disagree with the efficient market hy-pothesis (and by extension the random walk). Starting that the theory treatsthe market as a separate entity from the actual businesses it represents, when inreality the market is merely built upon these businesses (Shostak 1997). There-fore, by definition, analysis of the business allows prediction of its share price. Inaddition to this, even if the information used is incorrect, as all investors haveaccess to the same information, it is merely the interpretation of the informationwhich guides price. Further to this point, in James O’Shaughnessy book ”WhatWorks on Wall Street”, the idea is proposed that it is not the models whichare ineffective, but merely the humans which implement them (O’Shaughnessy1997, p.1). The theory that human judgement is limited has been a well knownidea within the scientific world. This was first cemented by David Faust, whofound that numerical models outperformed human judges over a variety of fieldsconsistently (Faust 1984). In relation to the stock trading, O’Shaughnessy foundthis to be also true, with even simple models such as the Dogs of Dow, seeing acompound return of of 12.4% per year(O’Shaughnessy 1997, p.10).
3.2 Models and Techniques
Fundamental analysis takes two-forms, quantitative and qualitative. Qualitativetechniques involve an investor making a judgement of a businesses value throughmethods such as interviews with the CEO and employees. These methods areuseful, however as previously discussed it is human judgement which causes thefailure of models. As O’Shaughnessy states ”In almost every instance, from stockanalysts to doctors, we naturally prefer qualitative, intuitive methods. In mostinstances, we’re wrong”(O’Shaughnessy 1997, p.14).
In contrast the quantitative method use a companies current financial situation,as well as its financial history in order to make predictions. The models developedfor this task use this data to produce indicator values, which measure a wide
10 E. Celella
variety of factors such as risk, volatility, and return on investment. Appendix Bdescribes some of the common indicators used, detailed in the book ”How theStock Market Works” (Becket & Essen 2010, p.58). This section evaluates thetwo main strategies in fundamental analysis, value and growth, as detailed inJames P. O’Shaughnessy book ”What Works On Wall Street” (O’Shaughnessy1997, p.1).
3.2.1 Value Factors
Value investing is the process of identifying undervalued stocks, with the ideathat these prices will rise to their intrinsic values. There are five main indicatorsutilised by value investors, which provide a ratio between the price of a shareand a certain aspect of the companies financial information:
1. The price-to-earning factor provides a ratio between the earnings of a com-pany per share, and the price of a share (equation 10). Investors interpretprice-to-earnings ratio differently, with value investors believing the righttime to invest is when the ratio is a low value, as this shows the price of theshare is at a discount.
2. Price-to-Book provides another value ratio, but instead measures the price ofa share against the book value per share. The book value per share is simplythe equity available to a shareholder divided by the number of outstandingshares (Hayes 2020). Low values indicate that the share price is close to theliquidated value of the company, thus meaning investors will be paying a lowprice for the companies assets.
3. Price-to-Cashflow measures the price of a share against a businesses cashflow.Lower values indicate a stock that is being sold below the intrinsic value ofa company and so should be bought.
4. Price-to-Sales is another measure of the reasonability of a shares currentprice. It is a ratio between the price of a share and the amount of sales it hasmade in a year. Again, lower ratios indicate the company is undervalued,and thus is an indication to buy.
5. Measuring a companies dividend yield is another straightforward value indi-cator of a stock. It simply divides the annual dividend rate paid to investorsper share, by the price of the share. This value is then converted to a per-centage. Stocks with high dividend yields are therefore intrinsically worthmore, due to the fact ”dividends have historically accounted for more thanhalf a stock’s total return”(O’Shaughnessy 1997, p.143).
Each of these indicators, although simple, can be used to identify investmentopportunities to a surprisingly accurate effect. With, O’Shaughnessy findingthat the price-to-sales ratio performed the best, returning a compound return of15.95% between 1951 and 2003 (O’Shaughnessy 1997, p.128).
Algorithmic Application to Stock Trading Methods 11
3.2.2 Growth Factors
Growth investing techniques aim to identify stocks which will outperform themarket, due to their intrinsic value and future potential. As with value investing,there are a variety of indicators used to measure the growth of a company.
One common strategy used by growth analysts is the increase in a companiesearnings over time. This method uses the same price-to-earnings ratio (equation10) as discussed with value investing. However, growth investors believing higherratio values are better investment opportunities, as the value indicates futuregrowth. This strategy can taken further by evaluating the percentage change inthe price-to-earnings over a multi-year period (usually 5 years). This mitigatesthe chance a company has had a single good year, providing a more accuratepicture of a companies growth rate.
P/E =Share Price
Earnings per Share(10)
Another method used to evaluate a companies growth is the evaluation of itsprofits. Two indicators which measure this are Profit Margin (equation 11) andReturn on Equity (equation 12). These are given by the ratio of the company’snet income to net sales and shareholder equity respectively. Higher profit marginsshow that a company has a greater operating efficiency, and are more competitivewithin its respective market. Whilst return on equity indicates how effective acompany is investing its assets.
Profit Margin =Income− Expenses
Net Sales× 100 (%) (11)
Return on Equity =Income− Expenses
Shareholder Equity(12)
In addition to these models, a simpler strategy is often deployed by growthinvestors, which is that stocks that are increasing value will continue to increase.This is idea is formalised as the relative price strength of a company, and simplydivides the price share of one company by another in the same industry. Thismodel is directly related to technical analysis, as it involves identifying the stockswhich are undergoing an upwards trend (which is achieved by comparing thecurrent price strength to its past price strength). However, different investorsinterpret the result of this indicator differently, with some preferring decliningcompany strength in order to identify stocks which are cheap, and are ready torise back to their intrinsic value.
12 E. Celella
Unlike the value factors, O’Shaughnessys’ research models showed that thegrowth indicators failed to beat the market a majority of the time (O’Shaughnessy1997, p.194 and p.219). The best results came from the use of the relativestrength index, which when utilised as a short-term indicator achieved a com-pound return of 12.6% between 1951 and 2003. But this was a high risk strategy,having a standard deviation of 37.8% (O’Shaughnessy 1997, p.222)
3.2.3 Multi-Factor Models
Although each of the indicators discussed in this section can be used indepen-dently to make investment decisions, the predictive ability of these factors in-creases when they are used together. These multi-factor models simply take acertain number of factors, and indicate to investors stocks which meet all thecriteria. Both growth and value factors can be used in multi-factor models, witheach strategy seeing an increase in its predictive capability.
A common two factor model is the combination of a price ratio factor along sidethe relative price strength of a company over a one year period. This strategysimply involves evaluating all companies using a price ratio, and then selecting Ncompanies with the best relative price strength that achieve a price ratio belowa certain value. These two factor models can themselves be further extended,by combining multiple two factor models. This strategy works by evaluatingcompanies using each model independently, and then weighting the investmentby the amount of times it is indicated by the models. This results in the samereturn on investment as using the models independently, but reduces the overallrisk. (O’Shaughnessy 1997, p.243)
Algorithmic Application to Stock Trading Methods 13
4 Algorithmic Trading
4.1 Introduction
The application of computer algorithms to the field of trading is an expansiveand fastly developing field. The focus of this study will be on how machinelearning algorithms are applied to the field, and why they work. However, itshould be noted that this isn’t the only form of algorithmic trading. For example,the simplest form of this field is the direct implementation of the previouslydescribed models (sections 2 and 3), as computer programs. Although this is arelatively simple approach, it does come with a few advantages over manuallyusing the models. Firstly, fully automated systems are faster than humans, andare less error prone. This advantage in time provides a competitive edge overtraders who do not use computerised systems, as it allows investment in viablebusinesses before the crowd. This time advantage is especially prevalent whenapplied to technical analysis, which requires a trend to start before investing(Chan 2009, p.80).
Furthermore, the removal of human judgement from the decision making processallows the models to perform at their best. As previously discussed O’Shaughnessyfound that, when investing took a consistent approach, many of the models usedwere accurate predictors. It was merely the lack of discipline, and human bias,which caused deviation from these strategies and thus losses (O’Shaughnessy1997, p.14).
The remainder of this chapter focuses on how financial data can be applied tomachine learning models. Each section explains why certain models are appli-cable to the domain problem, and provides examples of research applying themodels.
4.2 Training and Testing using Financial Data
The first task of developing any machine learning algorithm is an understand-ing of the data being used, as well as appropriate preparation for training andtesting. As discussed throughout this report, financial data falls into one of twocategories, fundamental or technical. Both types of data can be applied to ma-chine learning models with varying effect.
One of the main issues that plagues the financial application of machine learningis backtesting, which is the evaluation of a trading model using historic data.One of the main approaches in determining the fitness of a model is cross vali-dation, however due to the nature of financial data, this method can often lead
14 E. Celella
to misleading results. The problem is due to leakage, which occurs as financialdata has a serialised structure.
Supervised learning models require an input vector, x, and a correspondinglabel, y. The models goal is to develop a system which can approximate y fromx. As financial data is serially correlated, this means that the labels correspondto overlapping data points (equation 13) (de Prado 2018, p.103-111). As crossvalidation partitions the data, this means that t and t+ 1 will occur in differentsets. Thus meaning some of the training set occurs in the test set. This leads toinaccurate results, as the model is more likely to predict yt+1, even if x containsfeatures irrelevant to the prediction making process. The problem compounds,resulting in an overfitted model. (de Prado 2018, p.103-111)
xt ≈ xt+1 (13)
∴ yt ≈ yt+1
A solution to this problem is simply to remove overlapping data from the train-ing set, which occurs in the test set. Methods which reduce overfitting such asbagging, can also mitigate the impact of leaked data.(de Prado 2018, p.103-111)In addition to this, there are other challenges which must be contended withwhen preparing financial data such as (Jansen 2018, p.130):
1. Survivorship Bias - Ensuring past data includes securities which are no longerlisted.
2. Look-Ahead Bias - Ensuring the past data used for testing, was only availableat that time (e.g. corrections on financial reports).
3. Outlier Control - Outliers in financial data can sometimes be the most in-formative data points, therefore any outliers must be carefully consideredbefore removing.
4.3 Linear Models
Linear regression is a widely used technique, in formulating a model which de-scribes the relationship between a set of features and an output, by redistributingweights between features (equation 14). Formulating stock prediction as a linearregression task can work in two ways. The first method is to use the raw finan-cial data as the input. The second option is to use the numeric results producedfrom the fundamental factors (see section 2 and appendix B). This option formsthe basis for factor models, which are widely used to evaluate to relationshipbetween risk and return of an investment. (Jansen 2018, p.175)
Algorithmic Application to Stock Trading Methods 15
y = β0 +
N∑i=1
βi.xi + ε (14)
One of the most prominently used linear factor models is the fama-french three-factor model, which was proposed by Eugene Fama and Kenneth French, intheir paper ”Multifactor Explanations of Asset Pricing Anomalies” (FAMA &FRENCH 1996). In their study, they discovered that the 95% of the return ona stock trading portfolio is determined by the three factors:
1. Market risk.
2. The performance of small capitalization companies relative to high capital-ization companies (SMB).
3. The out performance of companies with a low book-to-market ratio relativeto those with a high ratio (HML).
These three factors can be used to predict expected return of an investmentportfolio (equation 15), and their research shows that investments in small cap-italization companies, and value stocks outperform investments in high capital-ization companies and growth stocks(FAMA & FRENCH 1996). In 2015 thismodel was extended to include two other factors, profitability and investment.(Fama & French 2015)
(Rm −Rf ) = Total Market Portfolio Return - Risk Free Rate of Return
SMB = Size Premium (Small Minus Big)
HML = Value Premium (High Minus Low)
bi, si, hi = Coefficients
As shown by equation 15, linear models have a solid foundation within theworld of stock prediction. Noting this precedent, shows a clear use for linearregression within this industry. It is therefore unsurprising that this a field ofactive research, with many studies obtaining promising results.
16 E. Celella
4.4 Non-Linear Models
As with linear, non-linear models also have a precedent within traditional stockmarket techniques. For example the moving average models, such as EMWA andMACD (section 2.2.1 and 2.2.3), are all examples of non-linear models. Thesetechniques formulate the process of forecasting stocks as a time series problem.This method of structuring the data is natural in this field, as financial data isalready organised in this way (e.g. daily share price data).
Neural networks are one of the most commonly used non-linear machine learn-ing algorithms. It is therefore of no surprise that these algorithms have beenapplied to this topic in many formats. One particular study of note by MinQi(Qi 1999)compared linear models to non-linear neural networks, in predict-ing the movement of the S&P 500 index. The study found that the non-linearneural networks produced more accurate predictions. In addition to this whencomparing recursive linear and non-linear models, the non-linear models had ahigher risk-adjustment returns.
4.5 Bayesian Models
The traditional process of stock market forecasting required investors to makedecisions on securities, using indicators to guide judgement. This process can beformalised as a Bayesian model. For example, equation 16 shows how the use ofprice-to-earnings ratio (equation 10) can be expressed in this manner.
P (Stock Increasing | P/E ) =P ( Stock Increasing )× P ( P/E | Stock Increasing )
P ( P/E )(16)
Formulating the problem as a Bayesian probability model provides many ad-vantages, as it allows for prior beliefs to be updated given new information.This method can be applied to a both fundamental and technical indicators,and even allows the combination of multiple factors. Furthermore the use of aBayesian framework allows model parameters to be inferred from given financialdata (e.g. income of a company, stock price movements etc.). This can furtherenhance linear and non-linear models, as well as used independently as its ownmodel. (Jansen 2018, p.268)
One such example of Bayesian models being applied to this field, was a studyconducted in 2015 which used 9 economic factors in order to produce a dynamicBayesian factor graph. This model was then used to forecast the movement
Algorithmic Application to Stock Trading Methods 17
of the ShenZhen and S&P 500 indexes. This solution managed to capture allmajor changes in trend for both indexes, which were indicated through structuralchanges to the graph.(Wang et al. 2015)
4.6 Ensemble Methods
As with any application of machine learning, bias, variance, and noise are prob-lems which must be contended with. The choice of which to reduce is dependenton the type of data used. For example, fundamental data is considered to haverelatively low noise, whereas technical data does. This means that for funda-mental techniques, boosting is a more useful tool. However, bagging providesa reduction in overfitting, which tackles the main problem when working withfinancial data as discussed in section 4.2 .(de Prado 2018, p.100)
One specific ensemble method which is of high use in this field are randomforests. This is because decision trees can formalise the decision making process ofinvestors, removing human judgement. Figure 5 demonstrates this, by modellinga two-factor model described in section 3.2.3. The use of decision trees are aneffective tool, due to the fact they can clearly show relationships between data,however they are prone to overfitting. This problem is overcome through theuse of random forests, which reduces the variance of a a group of models, whilstpreventing overfitting due to its additional random element. Random forests cannot only be applied to machine learning algorithms, but also the traditionalmethods discussed in sections 2 and 3.
Fig. 5: Decision tree of P/E and RPS two factor model.
18 E. Celella
The application of random forests in this way has been studied and producedpromising results. One such study, used a variety of traditional technical indica-tors and models, such as trend signals, oscillators and volume indicators. Thesemetrics were then applied to a random forest algorithm, and the resulting modelwas then tested by simulating trading using businesses in the S&P 500. In thistest, the resulting algorithm did not beat the benchmark, and thus failed as aprofitable solution. However, when used with a non-stationary time series the re-sults improved, indicating that the model could work given live data.( Ladyzynskiet al. 2013)
4.7 Evolutionary Models
The use of evolutionary models within this subject is also an extensive pointof research. A majority of studies use evolutionary techniques conjunction withother models, in order to improve their performance. One such example of thisused particle swarm optimisation, in order to improve the fitness of single layerneural networks trained on past share prices (technical indicators). The result-ing networks are then used to calculated recommendations on 350 S&P 500stocks, with each output then passed into a hyperbolic tangent function, whichproduces a value of -1, 0 or +1 used to rank stocks. The strategy managed toconsistently beat the market (with a low commission fee of 0.15%), shown infigure 6. (Nenortaite & Simutis 2004)
Fig. 6: Profit estimations obtained from partcle swarm and neural network model.(Nenortaite & Simutis 2004)
Algorithmic Application to Stock Trading Methods 19
However, with the relatively recently developments in evolutionary program-ming, some researchers have generated forecasting models directly from evo-lutionary techniques. A study conducted in 2000, used genetic programming toconstruct a regression models for this purpose, utilising technical indicators. Theresulting model produced an effective single-day trading strategy, showing thatthe application of genetic programming could work in this field. However, themodel being limited forecast to a single day shows that work in this field stillrequires development. (Kaboudan 2000)
20 E. Celella
5 Concluding Remarks and Discussion
As shown in this paper, the field of stock trading is a diverse subject, witha multitude of techniques, models and strategies. Machine learning enhancesthis field, providing a new avenue for predictions to be made. However, afterresearching the current state of the field, it is clear that there are some problems,many of which I believe stem from a lack of domain knowledge on the side ofcomputer scientists. One of the main points of contention I have with the currentapplication of machine learning models, is the use of technical analysis as theinput, which many studies do. I believe there are factors intrinsic to the datathat lead to sub-optimal, or misleading results.
One problem machine learning models encounter, is noise and overfitting. Thetheory technical analysis is built upon the efficient market hypothesis, meaningthat a stock price is influenced by all information within the market. This bydefinition means that price data has a large amount of built in noise, as althoughthe price may represent all necessary information, this does not necessarily meanthat all information is equally impactful.
Furthermore, as proponents of the efficient market point out, each stock is a dif-ferent representation of the market information, thus any model which is trainedon past price will be overfitted for that specific stock. This means for each stockthat requires forecasting, the model will need to be trained on that data. Thisis a waste of computational resources, and in the world of finance, the speed ofa system can be the cause of majour gains or losses.
In addition to this, even technical proponents accept that for the efficient mar-ket to be a true explanation, this must include random points of stock pricemovement. This only compounds the problem of noise within the data. This isa specific problem which cannot be overcome, as there is no way of knowingif a price move is random, without introducing fundamental factors to explainmovements. Therefore, the conclusion can be made of just using the fundamentalfactors to begin with.
The use of fundamental factors solves the problems outlined above. This is dueto financial data of a company being less up for interpretation. For example, theamount of sales which a company has made, reflects exactly what it describes.Although noise will still be prevalent in the data, this will be a much lower ratewhen compared with technical indicators, and unlike with technical indicatorscan be removed with thorough preprocessing. Using fundamental factors alsoallows for models to be developed, which can be deployed at a more generallevel. This is because if a relationship is found between factors and a movement,this can be applied to a wider range of stocks.
Algorithmic Application to Stock Trading Methods 21
Another aspect of algorithmic trading which I’ve noted, is that some researchersin the field are aiming to develop one global model which can be solely used toidentify stocks. It is my belief that this is the wrong approach. When lookingat the traditional trading methods, it was never the case that one model orindicator was used, as the combination of multiple factors provided a bettermethod of forecasting. Because of this, the use of ensemble and evolutionarymodels (through genetic programming) are of particular interest, as they canbe used to simulate the decision making process of investors. This allows formultiple machine learning models to be combined in the same way investorscombine traditional methods.
In my future work on this topic, I would like to explore the use of geneticprogramming in building decision trees. These will include machine learningmodels trained using fundamental data, as well as traditional models. In additionto this, the use of genetic algorithms to build factor models is an interestingavenue of research. For example, I would be interested in building new factormodels, using the traditional factor models as the initial population, in order todiscover if any new relationships can be found.
Bibliography
Becket, M. & Essen, Y. (2010), How the Stock Market Works: A Beginner’sGuide to Investment, 3rd edn, Kogan Page.
Chan, E. (2009), Quantitative Trading: How to Build Your Own AlgorithmicTrading Business, The Wiley trading series, John Wiley & Sons.
Chen, J. (2020), ‘Time value of money (tvm) definition’.URL: https://www.investopedia.com/terms/t/timevalueofmoney.asp
de Prado, M. (2018), Advances in Financial Machine Learning, Wiley.DeMark, T. (1994), The New Science of Technical Analysis, Wiley Finance,
Wiley.Fama, E. F. (1970), ‘Efficient capital markets: A review of theory and empirical
work’, The Journal of Finance 25(2), 383–417.FAMA, E. F. & FRENCH, K. R. (1996), ‘Multifactor explanations of asset
pricing anomalies’, The Journal of Finance 51(1), 55–84.Fama, E. F. & French, K. R. (2015), ‘A five-factor asset pricing model’, Journal
of Financial Economics 116(1), 1–22.Faust, D. (1984), The Limits of Scientific Reasoning, ned - new edition edn,
University of Minnesota Press.Hayes, A. (2020), ‘Book value of equity per share (bvps) definition’.URL: https://www.investopedia.com/terms/b/bvps.asp
Jansen, S. (2018), Hands-On Machine Learning for Algorithmic Trading: Designand implement investment strategies based on smart algorithms that learn fromdata using Python, Packt Publishing.
Kaboudan, M. A. (2000), ‘Genetic programming prediction of stock prices’, Com-putational Economics 16(3), 207–236.
Ladyzynski, P., Zbikowski, K. & Grzegorzewski, P. (2013), Stock trading withrandom forests, trend detection tests and force index volume indicators, inL. Rutkowski, M. Korytkowski, R. Scherer, R. Tadeusiewicz, L. A. Zadeh &J. M. Zurada, eds, ‘Artificial Intelligence and Soft Computing’, Springer BerlinHeidelberg, Berlin, Heidelberg, pp. 441–452.
Lo, A. W. & MacKinlay, A. C. (1999), A Non-Random Walk Down Wall Street,Princeton University Press.
Malkiel, B. G. (1973), A Random Walk Down Wall Street, Norton, New York.Nenortaite, J. & Simutis, R. (2004), Stocks’ trading system based on the particle
swarm optimization algorithm, in M. Bubak, G. D. van Albada, P. M. A. Sloot& J. Dongarra, eds, ‘Computational Science - ICCS 2004’, Springer BerlinHeidelberg, Berlin, Heidelberg, pp. 843–850.
O’Shaughnessy, J. (1997), What Works on Wall Street: A Guide to the Best-performing Investment Strategies of All Time, What Works on Wall Street,McGraw-Hill.
Qi, M. (1999), ‘Nonlinear predictability of stock returns using financial and eco-nomic variables’, Journal of Business Economic Statistics 17(4), 419–429.
Algorithmic Application to Stock Trading Methods 23
Schwager, J. (1999), Getting Started in Technical Analysis, Getting Started In...,Wiley.
Shostak, F. (1997), ‘In defense of fundamental analysis: A critique of the efficientmarket hypothesis’, The Review of Austrian Economics 10(2), 27–45.
Wang, L., Wang, Z., Zhao, S. & Tan, S. (2015), ‘Stock market trend predictionusing dynamical bayesian factor graph’, Expert Systems with Applications 42.
Wilder, J. (1978), New Concepts in Technical Trading Systems, Trend Research.Williams, J. (1938), The Theory of Investment Value, Investment value, Harvard
University Press.
24 E. Celella
A Technical Analysis Chart Patterns
Table 1: Patterns observed on price charts. (Schwager 1999)
Pattern Description
Gaps Gaps are days in which the daily low value of a day is above theprevious days high value, or vice versa.
Spike High A spike high is a day whose high value is drastically above theproceeding and succeeding days high value, whilst the days closeis the near the lower end of the days range. This indicates thatthe market is about to downtrend.
Spike Low A spike low is a day whose low value is drastically below theproceeding and succeeding days low value, whilst the days closeis the near the higher end of the days range. This indicates thatthe market is about to uptrend.
Reversal Days A reversal day is a day in which the market reaches a new highor low and then reverses direction at the close price. Formally,a reversal high day is a day which beats the previous days high,but closes below the previous days low. A reversal low day is aday whose low beats the previous days low, but then closes abovethe previous days high. These are interpreted as market trendreversals (much like spikes).
Thrust Days Thrust days are categorised by their direction of movement. Up-thrust days are days which close above the previous days high, anddown thrust days are days which close below the previous dayslow. Series of upthrust days indicate a strong market, whereasseries of down thrust days indicate the opposite.
Wide RangingDays
A wide ranging day is any day whose range (difference betweenhigh and low values) is significantly larger than the preceding days.Wide ranges days can be formally defined as any day whose rangeis above the average range of the past $N$ days. Wide rangingdays can also indicate a reversal in market trend, depending onif the close price is near the higher or lower end, and the currentmarket trend.
ContinuationPatterns
Continuation patterns are merely phases of side ways movementthat occur with long-term trends. These patterns are generallybroken by the same trend that preceded them.
Triangles Triangles are patterns which show the trend of a market. Theyare formed by drawing two trend lines, one connecting the relativehighs, and the other connecting the relative lows. If the triangleis symmetrical, this is seen as an indication the market will carryon the current trend. Whereas in any other case, the direction ofthe hypotenuse shows the trend.
Continued on next page
Algorithmic Application to Stock Trading Methods 25
Continued from previous pagePattern Description
Flags andPennants
Flags and pennants are shorter congestion patterns within trends.They are interpreted as mere pauses in the current trend, andformed by drawing two trend lines in the same fashion as triangles.If the lines are parallel this is a flag, else it is a pennant.
V Tops andBottoms
A V-pattern is a turn around point of a down or uptrend. Thesecan generally only be defined through a combination of other pat-terns.
Double Topsand Bottoms
Double tops and bottoms are two peaks or troughs that occurwithin the same price vicinity sequentially. They occur after largeprice moves and are indications for market reversal. (Note thatany number of tops and bottoms can occur, for example tripletops, but these are extremely rare)
Head andShoulders
Head and shoulder patterns consist of one large peak or troughnested between two smaller peaks or troughs sequentially. The twolow points between the three formations form a neckline, if thisneckline is penetrated it is consider an indicator of trend reversal.
Rounded Topsand Bottoms
Rounded tops and bottoms are defined as the name implies. Theyindicate trend reversal.
Wedges Wedges are either rising or declining. They are formed by usingtwo lines which connect the relative highs and lows respectively.In rising wedges, prices increase in a converging pattern. Decliningwedges show prices decreasing in a converging pattern. If the pricebreaks a wedge line, this can be interpreted as a sell or buy signal(depending on the direction of the break).
Island Rever-sals
Island reversals are similar to spike and reversal days. They occurwhen two price gaps isolate a small cluster of days, and implytrend reversal.
26 E. Celella
B Fundamental Analysis Indicators
Table 2: Fundamental analysis indicators. (Becket & Essen 2010)
Indicators Description Formula
Acid Test(QuickRatio)
Measures a companies readilyliquidable assets in order to payshort-term debts. A score lowerthan 1 means that the compa-nies assets are less in value thanthe outstanding debts. Whereasa score higher than 2 indicatesthat a companies asset value isdouble that of the debts, indicat-ing the company is financially se-cure.
Predicts the likelihood of a com-pany becoming insolvent withinthe next two years. It uses 5ratios, each weighted differentlyto determine a companies abil-ity to pay its outstanding debtson their due dates. The ratiosused are: Working Capital (a),Retained Earnings (b), Operat-ing Income (c), Sales (d), TotalAssets (e), Net Worth (f), To-tal Debt (g). The score producedranges from a value of -4 and 8,with scores lower that 1.8 indi-cating insolvency is likely, andabove 3 indicating insolvency isunlikely.
(1.2a+1.4b+3.3c+d+0.6(f/g))e
Continued on next page
Algorithmic Application to Stock Trading Methods 27
Continued from previous pageIndicators Description Formula
Beta
Beta measures the volatility ofthe share price of a company rel-ative to the rest of the indus-try. This is ratio of the move-ment of an individual share rel-ative to the market. A high pos-itive beta value indicates that ashare will move in line with themarket, at a more volatile rate. Anegative beta value indicates theshare will move in the oppositedirection to other shares.
Share Price MovementMarket Movement
CurrentRatio
Assesses a company’s ability topay its bills by comparing cur-rent assets to its current debts.
Current AssetsCurrent Liabilities
DividendCover
(Cover)
The proportion of a company’searnings that are paid to share-holders.
DividendYield (Yield)
This measures a company’s re-turn on investment at the currentshare price and the rate of pay-ments by the company.
Dividend per ShareShare Price (%)
EmployeeEfficiency
The proportion of sales that arepaid out in employee wages.
WagesSales (%)
Gearing(Debt/equity
ratio)
Gearing is an indication of acompany’s risk. It is calculatedby comparing the amount ofmoney a company has borrowedwith the amount that has beeninvested by the shareholders (eq-uity).
Total BorrowingsTotal Amount of Shareholders’ Funds
Net AssetValue (Asset
backing)
Provides a ratio between the netvalue of all a company’s assets af-ter any costs, and the number ofshares issued. This provides theshareholders’ equity in the com-pany per share. (CA representscurrent assets, L represents lia-bilities, and CC represents capi-tal charges)
CA−L−CCNumber of Shares
Continued on next page
28 E. Celella
Continued from previous pageIndicators Description Formula
Net CurrentAssets
The total current assets of thecompany minus the total currentliabilities. This gives and indica-tion of its solvency in the shortterm.
Current Assets−Current Liabilities
Price /Earnings
Ratio
A measure of how long it willtake for a company’s profitsto reach the total price of itsshares. Calculated by comparingthe company’s profits to its shareprice.
Share PriceEarnings per Share
ProfitMargin
Ratio of a company’s operatingprofit and turnover to indicate itsunderlying profitability.
Trading ProfitTurnover (%)
Return onCapital
Employed
Measures how efficiently a com-pany is using its capital in thelong term. A company could havea low return on capital, even ifprofit margins are high.
Trading ProfitAverage Capital Employed (%)
Return onSales
Measures the ratio of pre-taxprofit and sales, giving as an in-dication of profit margins.
Pre-tax Profit Before InterestTotal Sales × 10
Return perEmployee
Indicates how efficiently a busi-ness uses its employees.
Operating ProfitNumber of Employees
Return toShareholders
Measures the total performanceof an equity over a given pe-riod. (CSP represents change inshare price, D represents divi-dends, and ID represents inter-est on dividends)
CSP+D+IDStarting Price (%)
StockTurnover
The proportion of sales cost tothe end of year stock level.
Cost of SalesStock Level at the End of the Year
Value AddedIndicates how a business has in-creased the value of shareholderinvestment.