This article was downloaded by: [Anatoly A. Gitelson] On: 29 April 2015, At: 00:04 Publisher: Taylor & Francis Informa Ltd Registered in England and Wales Registered Number: 1072954 Registered office: Mortimer House, 37-41 Mortimer Street, London W1T 3JH, UK Click for updates Remote Sensing Letters Publication details, including instructions for authors and subscription information: http://www.tandfonline.com/loi/trsl20 Algorithms for estimating green leaf area index in C3 and C4 crops for MODIS, Landsat TM/ETM+, MERIS, Sentinel MSI/OLCI, and Venμs sensors Anthony L. Nguy-Robertson a & Anatoly A. Gitelson ab a Center for Advanced Land Management Information Technologies, School of Natural Resources, University of Nebraska–Lincoln, Lincoln, Nebraska, USA b Faculty of Civil and Environmental Engineering, Israel Institute of Technology (Technion), Haifa, Israel Published online: 28 Apr 2015. To cite this article: Anthony L. Nguy-Robertson & Anatoly A. Gitelson (2015) Algorithms for estimating green leaf area index in C3 and C4 crops for MODIS, Landsat TM/ETM+, MERIS, Sentinel MSI/OLCI, and Venμs sensors, Remote Sensing Letters, 6:5, 360-369, DOI: 10.1080/2150704X.2015.1034888 To link to this article: http://dx.doi.org/10.1080/2150704X.2015.1034888 PLEASE SCROLL DOWN FOR ARTICLE Taylor & Francis makes every effort to ensure the accuracy of all the information (the “Content”) contained in the publications on our platform. However, Taylor & Francis, our agents, and our licensors make no representations or warranties whatsoever as to the accuracy, completeness, or suitability for any purpose of the Content. Any opinions and views expressed in this publication are the opinions and views of the authors, and are not the views of or endorsed by Taylor & Francis. The accuracy of the Content should not be relied upon and should be independently verified with primary sources of information. Taylor and Francis shall not be liable for any losses, actions, claims, proceedings, demands, costs, expenses, damages, and other liabilities whatsoever or howsoever caused arising directly or indirectly in connection with, in relation to or arising out of the use of the Content. This article may be used for research, teaching, and private study purposes. Any substantial or systematic reproduction, redistribution, reselling, loan, sub-licensing, systematic supply, or distribution in any form to anyone is expressly forbidden. Terms &
Transcript
This article was downloaded by: [Anatoly A. Gitelson]On: 29 April 2015, At: 00:04Publisher: Taylor & FrancisInforma Ltd Registered in England and Wales Registered Number: 1072954 Registeredoffice: Mortimer House, 37-41 Mortimer Street, London W1T 3JH, UK
Click for updates
Remote Sensing LettersPublication details, including instructions for authors andsubscription information:http://www.tandfonline.com/loi/trsl20
Algorithms for estimating green leafarea index in C3 and C4 crops forMODIS, Landsat TM/ETM+, MERIS,Sentinel MSI/OLCI, and Venµs sensorsAnthony L. Nguy-Robertsona & Anatoly A. Gitelsonab
a Center for Advanced Land Management InformationTechnologies, School of Natural Resources, University ofNebraska–Lincoln, Lincoln, Nebraska, USAb Faculty of Civil and Environmental Engineering, Israel Instituteof Technology (Technion), Haifa, IsraelPublished online: 28 Apr 2015.
To cite this article: Anthony L. Nguy-Robertson & Anatoly A. Gitelson (2015) Algorithmsfor estimating green leaf area index in C3 and C4 crops for MODIS, Landsat TM/ETM+,MERIS, Sentinel MSI/OLCI, and Venµs sensors, Remote Sensing Letters, 6:5, 360-369, DOI:10.1080/2150704X.2015.1034888
To link to this article: http://dx.doi.org/10.1080/2150704X.2015.1034888
PLEASE SCROLL DOWN FOR ARTICLE
Taylor & Francis makes every effort to ensure the accuracy of all the information (the“Content”) contained in the publications on our platform. However, Taylor & Francis,our agents, and our licensors make no representations or warranties whatsoever as tothe accuracy, completeness, or suitability for any purpose of the Content. Any opinionsand views expressed in this publication are the opinions and views of the authors,and are not the views of or endorsed by Taylor & Francis. The accuracy of the Contentshould not be relied upon and should be independently verified with primary sourcesof information. Taylor and Francis shall not be liable for any losses, actions, claims,proceedings, demands, costs, expenses, damages, and other liabilities whatsoever orhowsoever caused arising directly or indirectly in connection with, in relation to or arisingout of the use of the Content.
This article may be used for research, teaching, and private study purposes. Anysubstantial or systematic reproduction, redistribution, reselling, loan, sub-licensing,systematic supply, or distribution in any form to anyone is expressly forbidden. Terms &
Algorithms for estimating green leaf area index in C3 and C4 cropsfor MODIS, Landsat TM/ETM+, MERIS, Sentinel MSI/OLCI, and
Venµs sensors
Anthony L. Nguy-Robertsona and Anatoly A. Gitelsona,b*
aCenter for Advanced Land Management Information Technologies, School of Natural Resources,University of Nebraska–Lincoln, Lincoln, Nebraska, USA; bFaculty of Civil and Environmental
Engineering, Israel Institute of Technology (Technion), Haifa, Israel
(Received 26 January 2015; accepted 20 March 2015)
This study developed a set of algorithms for satellite mapping of green leaf area index(LAI) in C3 and C4 crops. In situ hyperspectral reflectance and green LAI data,collected across eight years (2001–2008) at three AmeriFlux sites in Nebraska USAover irrigated and rain-fed maize and soybean, were used for algorithm development.The hyperspectral reflectance was resampled to simulate the spectral bands of sensorsaboard operational satellites (Aqua and Terra: MODIS, Landsat: TM/ETM+), a legacysatellite (Envisat: MERIS), and future satellites (Sentinel-2, Sentinel-3, and Venµs).Among 15 vegetation indices (VIs) examined, five VIs – wide dynamic range vegeta-tion index (WDRVI), green WDRVI, red edge WDRVI, and green and red edgechlorophyll indices – had a minimal noise equivalent for estimating maize and soybeangreen LAI ranging from 0 to 6.5 m2 m−2. The algorithms were validated usingMODIS, TM/ETM+, and MERIS satellite data. The root mean square error of greenLAI prediction in both crops from all sensors examined in this study ranged from 0.73to 0.95 m2 m−2 and coefficient of variation ranged between 17.0 and 29.3%. Thealgorithms using the red edge bands of MERIS and future space systems Sentinel-2,Sentinel-3, and Venµs allowed accurate green LAI estimation over areas containingmaize and soybean with no re-parameterization.
1. Introduction
Leaf area index (LAI) is used in various applications such as weather, carbon fluxes,ecological and crop models, among many others. Green LAI is generally preferred since itis a measure of the area available for photosynthesis. Different methods have been appliedto estimate green LAI remotely using the visible and near-infrared (NIR) regions of thespectrum such as radiative transfer modelling, neural networks, support vector machinesregression, genetic algorithms, lookup tables, and vegetation indices (VIs) (e.g. Xiao et al.2014). Measured LAI was paired with either in situ-, aerial-, or satellite-based reflectancedata to calibrate the algorithms for the developing green LAI products (e.g. Doelling et al.2012; Samani Majd et al. 2013). Different procedures have been developed for validatingand correcting satellite products such as using image inter-calibration, comparison withreflectance collected by different satellites, aerial- and ground-based sensors, or a combi-nation thereof (e.g. Maiersperger et al. 2013). While many satellite products have
reasonably low errors, in some cases ground-based sensors have been shown to be moreaccurate in estimating green LAI (Perez, Seals, and Zelenka 1997).
The goal of this paper is to develop and implement an approach for estimating thegreen LAI of C3 and C4 crops, maize and soybean, using satellite data. It includes (a) thedevelopment of algorithms using multiyear in situ green LAI and reflectance data taken atclose range; (b) assessing the accuracy of developed algorithms using Moderate-Resolution Imaging Spectroradiometer (MODIS), Landsat Thematic Mapper (TM) andEnhanced Thematic Mapper Plus (ETM+), as well as Medium Resolution ImagingSpectrometer (MERIS) satellite data collected in 2001 through 2012; and (c) assessingthe accuracy of LAI estimation by three future satellite missions (Sentinel-2, Sentinel-3,and Venµs). Our focus was on the development of algorithms having minimal estimationerrors in the entire range of green LAI for both C3 and C4 crops with no re-parameterization.
2. Materials and methods
The study area included three 65-ha fields involved in the University of Nebraska-LincolnCarbon Sequestration Program located at UNL Agricultural Research and DevelopmentCenter, Nebraska, USA, under different management conditions from 2001 to 2012. Thisset of three sites is a part of the AmeriFlux network. US-Ne1 was continuous irrigatedmaize. US-Ne2 was irrigated from 2001 to 2008 on a maize/soybean rotation. From 2009to 2012 US-Ne2 was converted to continuous maize. US-Ne3 was a rain-fed maize/soybean rotation. The data includes a wide variety of climatic conditions, hybrids, watertreatments, soil moisture, yield, and dynamic range of LAI (Suyker and Verma 2012).
The green LAI was calculated from the leaf area determined from plants harvestedfrom a 1 m length of one or two rows (6 ± 2 plants) from six small (20 m × 20 m) plotsestablished in each field. The plants were collected every 10–14 days from each field andtransported on ice to the laboratory for separation into green and dead leaves. The leafarea of the green leaves per plant was measured using an area metre (LI-3100, Li-Cor,Inc., Lincoln, NE, USA). Green LAI was determined by multiplying the green leaf areaper plant by the plant population within the sampling plot. The green LAI values from allsix plots were averaged to provide a field-level green LAI. The results of measurementswere interpolated using a spline function and then used for the dates of reflectancemeasurements (Nguy-Robertson et al. 2012).
The use of in situ data for calibration minimized uncertainty in the data collection andprocessing compared to satellite imagery (e.g. atmospheric correction, view and illumina-tion geometry). Reflectance was collected using a dual-fibre system and two Ocean OpticsUSB2000 radiometers in the spectral range of 400–1000 nm. One fibre was fitted with acosine diffuser to measure incoming downwelling irradiance, and the second one mea-sured upwelling radiance of the canopy. These fibres were mounted on a self-levellingplatform to ensure nadir and zenith views. The field of view of the downward sensor waskept constant (approximately 2.4 m in diameter) along the growing season by placing theradiometer at a height of 5.5 m above the top of the canopy. An average of 10 reflectancespectra collected at 36 points in each field was calculated; it resulted in a total of 360spectral measurements per field on each sampling date. Test sites where reflectancemeasurements were conducted were representative of those where destructive samplingof green LAI occurred (Viña et al. 2011). Reflectance measurements were carried outduring the growing season beginning at sowing when LAI was zero. This resulted in atotal of 266 reflectance spectra for maize and 133 spectra for soybean; green LAI was up
Remote Sensing Letters 361
Dow
nloa
ded
by [
Ana
toly
A. G
itels
on]
at 0
0:04
29
Apr
il 20
15
to 6.5 m2 m−2 for maize and up to 6.2 m2 m−2 for soybean. The hyperspectral reflectancespectra were resampled to simulate the spectral response of MODIS, Landsat TM,MERIS/OLCI (Sentinel-3), MSI (Sentinel-2), and Venµs. Fifteen different VIs werecalculated (Table 1). For details see Nguy-Robertson et al. (2012, 2014).
All statistical analyses were performed using the statistical package R (V. 3.0.1, The RFoundation for Statistical Computing). Since the goal of this study was to identify VIscapable of estimating green LAI throughout its wide dynamic range and apply theserelationships to satellite images, VIs with non-linear relationships must be identified. Thiswas performed using noise equivalent (NE) versus green LAI relationship:
NE LAI ¼ RMSE VI vs: green LAIf gd VIð Þ=d green LAIð Þ (1)
where RMSE{VI vs. green LAI} is root mean squared error of VI versus green LAIrelationship over the entire dynamic range of the green LAI and d(VI)/d(green LAI) is thefirst derivative of the best-fit function of the VI versus green LAI relationship (Viña andGitelson 2005). The best-fit functions for VIs with a linear relationship green LAI/VI weredetermined using a k-fold cross-validation procedure, where k was set to the sample sizeof each in situ data set (for maize, soybean, or both crops) minus one. This cross-validation technique was used for calibration purposes only, such that the entire in situ
Table 1. Vegetation indices (VIs) utilized in the study. The blue, green, red, red edge, and nearinfrared (NIR) bands were identical for VIs for each sensor except for the MERIS TerrestrialChlorophyll Index (MTCI). See Viña et al. 2011 and Nguy-Robertson et al. 2012 for referencesto the specific VIs.
Index Equation
Simple Ratio (SR) NIRRed
Normalized Difference Vegetation Index (NDVI) NIR�RedNIRþRed
Green Normalized Difference Vegetation Index (green NDVI) NIR�GreenNIRþGreen
Red Edge Normalized Difference Vegetation Index (red edge NDVI) NIR�Red EdgeNIRþRed Edge
Enhanced Vegetation Index 2 (EVI2) 2.5 NIR�RedNIRþ2:4Redþ1
Green Atmospherically Resistant Index (GARI) NIR� Green�γ Blue�Redð Þ½ �NIRþ Green�γ Blue�Redð Þ½ �
Optimized Soil-Adjusted Vegetation Index (OSAVI) 1þ1:16ð Þ NIR�Redð ÞRedþNIRþ0:16
Modified Triangular Vegetation Index 2 (MTVI2) &Modified Chlorophyll Absorption Index (MCARI2)
Wide Dynamic Range Vegetation Index (WDRVI) α NIRð Þ�Redα NIRð ÞþRed
Green Wide Dynamic Range Vegetation Index(green WDRVI)
α NIRð Þ�Greenα NIRð ÞþGreen
Red Edge Wide Dynamic Range Vegetation Index (red edgeWDRVI)
α NIRð Þ�Red Edgeα NIRð ÞþRed Edge
Green Chlorophyll Index (CIgreen) NIRGreen � 1
Red edge Chlorophyll Index (CIred edge) NIRRed Edge � 1
MERIS Terrestrial Chlorophyll Index (MTCI) NIR�Red EdgeRed Edge þRed
362 A.L. Nguy-Robertson and A.A. Gitelson
Dow
nloa
ded
by [
Ana
toly
A. G
itels
on]
at 0
0:04
29
Apr
il 20
15
data set was used in training the algorithms and only one sample was left out in eachiteration. Error metrics utilized included standard error estimates of algorithm coefficients,coefficient of determination (R2), root mean square error (RMSE), mean fractional bias(MFB), and coefficients of variation (CV). In order to estimate the variation in thecoefficients for the best-fit models, the standard error of each coefficient was determinedfrom all iterations of k. Analysis of variance (ANOVA) tests were performed between thecoefficients of the best-fit functions for both crops taken together and all simulations ofapplicable satellite sensors (details in Nguy-Robertson et al. 2012).
MODIS, Landsat-5 TM, Landsat-7 ETM+, and MERIS data were utilized to validatethe algorithms developed using in situ reflectance data. The MODIS 250-m eight-daysurface reflectance products were used for both Aqua (MYD09Q1) and Terra(MOD09Q1) sensors. The date of pixel acquisition was used rather than the start dateof the eight-day composite (Guindin-Garcia et al. 2012). Due to the potential of mixedpixels, the VIs tested were limited to those in which only the red and NIR bands wereavailable. These are the only two bands in MODIS with a spatial resolution of 250 m.Additionally the central pixel from each field was selected in order to avoid mixed pixels.The high temporal resolution of MODIS allowed for a large data set (n = 685) forvalidation of the algorithms. The method for selecting optimal pixels was similar to thatof Sakamoto et al. (2012) with one exception – excluding pixels if there was a poor-quality pixel identified by the QA flags (i.e. cloud, cloud shadow) within 1 km (i.e. 4pixels) of the study site.
The Landsat images were acquired between 2001 and 2008 and identified as cloud-free. Surface reflectance was determined using the Landsat Ecosystem DisturbanceAdaptive Processing System provided through GSFC/NASA. The median value of thepixels (n > 500) from each field was used as the field-level reflectance for each image.Due to the existence of green band, more VIs were tested on the Landsat data set thanMODIS 250-m resolution data. However, the temporal resolution of Landsat is much lessthan MODIS. Therefore, fewer points (n = 148) were collected over the study area for theLandsat data set (details in Gitelson et al. 2012).
The MERIS imagery was collected between 2003 and 2011. The level 2 full-resolu-tion geophysical products for ocean, land, and atmosphere (MER_FR__2P) MERISproducts were converted from the Envisat N1 product to GeoTIFF using Beam VISAT(v. 4.11, Brockmann Consult and contributors). The remaining processing steps wereconducted in ArcGIS (v. 10.2, ESRI, Inc.) using python’s integrated development envir-onment, IDLE (v. 2.7.3 Python Software Foundation). Quality-control flags (band 32 inthe MER_FR__2P product) indicating contamination (e.g. clouds, cloud shadows) orother issues (input/output errors) within 3 km (10 pixels) of the study sites were excluded.Even with this simple processing, some of the remaining pixels were still impacted byhaze due to the poor atmospheric correction over land when water vapour was high(Guanter, Del Carmen González-Sanpedro, and Moreno 2007). To reduce noise in theMERIS data set caused by haze, any pixel with the aerosol optical thickness at 443 nm(band 26 of the MER_FR__2P product) above 0.1 was excluded from analysis. Thecentral pixel from each study site was selected to avoid mixed pixels. Thus, the MERISdata set was the smallest (n = 75) of the three satellite data sets used.
3. Results and discussion
The first step of algorithms development was the selection of VIs that were sensitive togreen LAI throughout its entire dynamic range (from 0.2 to 6.5) with linear or close-to-
Remote Sensing Letters 363
Dow
nloa
ded
by [
Ana
toly
A. G
itels
on]
at 0
0:04
29
Apr
il 20
15
linear relationships with green LAI. Fifteen VIs were examined in this study (Table 1). NEof green LAI estimation in two crops taken together showed that SR, WDRVIs, and CIshad linear or very-close-to-linear relationships with green LAI across the entire dynamicrange of green LAI (Figure 1). While the SR versus green LAI relationship was nearlylinear, NE exceeded 1 m2 m−2. The NE of other VIs (i.e. NDVI in Figure 1) was below0.8 m2 m−2 for LAI < 2, indicating quite high accuracy of green LAI estimation. However,for green LAI > 3, NE increased drastically.
Five VIs were chosen as candidates to estimate green LAI from satellite data –WDRVI, green WDRVI, red edge WDRVI, CIgreen, and CIred edge. The algorithms werecalibrated for maize and soybean separately (designated further as crop-specific algo-rithms) and for both crops taken together (designated further as unified algorithms) for theseven satellite sensors (Table 2). Using WDRVI with reflectances simulated in MODISred and NIR bands and red edge WDRVI with simulated Sentinel-2 MSI bands, unifiedalgorithms were able to estimate green LAI in crops with a different canopy architecture,leaf structure, and photosynthetic pathway (C3 vs. C4) with no re-parameterization(Figure 2). While the WDRVI-based algorithm for MODIS had reasonably small errorsfor both crops taken together, there was a clear departure between the crops due to well-documented differences in leaf structure and canopy architecture between maize andsoybean (e.g. Gitelson et al. 2005). This discrepancy cannot be eliminated when onlyred and NIR bands are used (Peng and Gitelson 2012). Thus, the algorithms estimatinggreen LAI using WDRVI, green WDRVI, and CIgreen were species-specific(p-value < 1.4 × 10⁻²⁴).
The difference in green LAI estimates between crops was smaller when VIs used the rededge bands. In the red edge region light penetrates deeper into the leaf and canopy andabsorption by the canopy does not saturate at high crop densities (Gitelson et al. 2005). RededgeWDRVI and CIred edge weremuch less species-specific with a p-value > 1.0 × 10⁻⁵ for theMERIS/OLCI andMSI sensors. For the Venµs sensor, the p-value was lower (4.2 × 10⁻¹⁰) dueto the red edge band centred at a shorter wavelength (702 nm) than in OLCI and MSI. Thisfinding is in accord with previous studies where VIs with red edge bands were utilized indeveloping non-species-specific algorithms for estimating canopy chlorophyll content(Gitelson et al. 2005), gross primary production (Peng and Gitelson 2012), and green LAI(Nguy-Robertson et al. 2014) in maize and soybean.
Figure 1. The noise equivalent of green LAI estimation in maize and soybean taken together byvegetation indices using in situ measured reflectance simulated in spectral bands of (a) MODIS250 m resolution, (b) Landsat TM/ETM+, and (c) MERIS or OLCI. The NE of GARI was notdisplayed as it was similar to Green NDVI.
364 A.L. Nguy-Robertson and A.A. Gitelson
Dow
nloa
ded
by [
Ana
toly
A. G
itels
on]
at 0
0:04
29
Apr
il 20
15
Table
2.Algorith
msforgreenLAIestim
ationby
MODIS,Landsat
TM/ETM+,MERIS/OLCI,MSI,andVenµssatellite
sensorsformaize,soyb
ean,
andbo
thcrop
stakentogether.The
slop
e(m
)andintercept(b)of
thegreenLAIversus
VIrelatio
nshipwerecalculated
usingthek-fold
cross-valid
ationmetho
dandaregiventheir
respectiv
evalues
±thestandard
error.R2andRMSEarethecoefficientof
determ
inationandroot
meansquare
errorof
greenLAI,respectiv
ely.
VI
Sensor
Maize
Soy
bean
Maize
andSoy
bean
mb
R2
RMSE
(m2m
−2)
mb
R2
RMSE
(m2m
−2)
mb
R2
RMSE
(m2m
−2)
WDRVI*
MODIS
5.06
±0.11
−0.47
±0.10
0.89
0.57
3.68
±0.13
−0.24
±0.11
0.86
0.59
4.51
±0.11
−0.30
±0.10
0.81
0.76
greenWDRVI*
TM/ETM+
7.27
±0.14
−1.34
±0.10
0.91
0.52
5.23
±0.17
−0.71
±0.12
0.88
0.56
6.49
±0.14
−1.03
±0.10
0.84
0.69
CI green*
TM/ETM+
0.48
±0.01
0.16
±0.09
0.88
0.58
0.33
±0.01
0.30
±0.09
0.87
0.57
0.41
±0.01
0.33
±0.09
0.80
0.77
rededge
WDRVI
MERIS/
OLCI
8.28
±0.17
0.02
±0.08
0.90
0.55
8.02
±0.27
0.03
±0.10
0.87
0.57
8.27
±0.14
0.01
±0.06
0.90
0.55
rededge
WDRVI
MSI
7.29
±0.15
0.00
±0.09
0.89
0.55
6.69
±0.22
0.02
±0.10
0.88
0.56
7.22
±0.13
−0.03
±0.07
0.89
0.57
rededge
WDRVI*
Venµs
6.81
±0.14
−0.03
±0.09
0.89
0.55
6.07
±0.20
−0.01
±0.10
0.88
0.56
6.70
±0.12
−0.07
±0.07
0.89
0.58
CI red
edge
MERIS/
OLCI
0.80
±0.02
0.63
±0.08
0.88
0.59
0.86
±0.03
0.39
±0.09
0.87
0.58
0.82
±0.01
0.53
±0.06
0.89
0.59
CI red
edge
MSI
0.64
±0.01
0.71
±0.08
0.87
0.60
0.65
±0.02
0.46
±0.09
0.87
0.58
0.65
±0.01
0.58
±0.06
0.88
0.60
CI red
edge*
Venus
0.56
±0.01
0.74
±0.08
0.87
0.61
0.55
±0.02
0.47
±0.09
0.87
0.57
0.57
±0.01
0.60
±0.06
0.87
0.62
Note:
*Ind
icates
that
theVIwas
species-specific
(p-value
<1×10
–6).
Remote Sensing Letters 365
Dow
nloa
ded
by [
Ana
toly
A. G
itels
on]
at 0
0:04
29
Apr
il 20
15
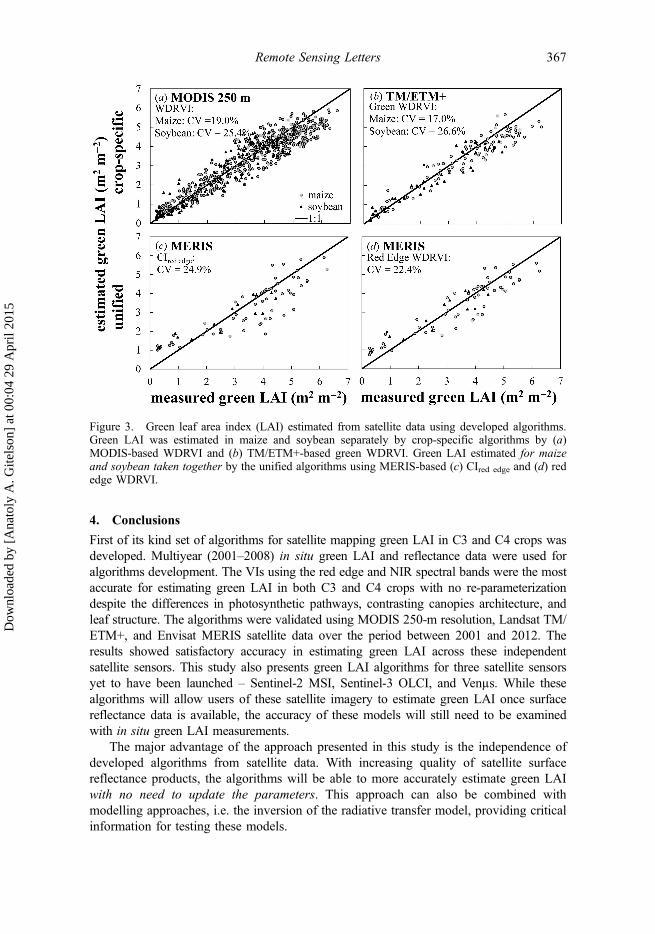
The final step was validation of the algorithms using satellite data. The algorithmsdeveloped were remarkably accurate (Table 3, Figure 3). The crop-specific algorithms hadthe lowest errors. The CV of the unified algorithms varied between 22.4 and 27.9%.Estimating green LAI in soybean and maize with no re-parameterization remains aproblem when only red or green, in conjunction with NIR, bands are available.However, in the absence of detailed crop maps, the unified algorithms using VIs withred and NIR bands may still be useful. All algorithms showed a clear bias (MFB was1.3–14%) except for WDRVI (MFB: 0.8–3.9%; Table 3). This bias was likely driven bythe slightly higher VI values in the satellite data than for in situ measured over sparsevegetation. The bias may be related to poor atmospheric correction (e.g. issues with hazefor MERIS imagery), variation in spatial averaging (e.g. 300 m pixel in MERIS vs.average of 36 points along an access road for ground-based reflectance), among manyother variables. Despite the bias, the algorithms using the red edge VIs outperformed theother VIs with similar mathematical formulations in estimating green LAI in both maizeand soybean.
Figure 2. Performance of unified algorithms for maize and soybean developed using in situmeasured reflectance: (a) MODIS sensor with WDRVI; (b) MSI sensor with red edge WDRVI.The 95% prediction interval (PI) provides an estimate in which future observations will fall.
Table 3. Performance of the algorithms in estimating green LAI using MODIS 250-m resolution,Landsat TM/ETM+, and MERIS data. Error statistics root mean square error (RMSE), coefficient ofvariation (CV), and mean fractional bias (MFB) are presented for both the species-specific andunified algorithms.
First of its kind set of algorithms for satellite mapping green LAI in C3 and C4 crops wasdeveloped. Multiyear (2001–2008) in situ green LAI and reflectance data were used foralgorithms development. The VIs using the red edge and NIR spectral bands were the mostaccurate for estimating green LAI in both C3 and C4 crops with no re-parameterizationdespite the differences in photosynthetic pathways, contrasting canopies architecture, andleaf structure. The algorithms were validated using MODIS 250-m resolution, Landsat TM/ETM+, and Envisat MERIS satellite data over the period between 2001 and 2012. Theresults showed satisfactory accuracy in estimating green LAI across these independentsatellite sensors. This study also presents green LAI algorithms for three satellite sensorsyet to have been launched – Sentinel-2 MSI, Sentinel-3 OLCI, and Venµs. While thesealgorithms will allow users of these satellite imagery to estimate green LAI once surfacereflectance data is available, the accuracy of these models will still need to be examinedwith in situ green LAI measurements.
The major advantage of the approach presented in this study is the independence ofdeveloped algorithms from satellite data. With increasing quality of satellite surfacereflectance products, the algorithms will be able to more accurately estimate green LAIwith no need to update the parameters. This approach can also be combined withmodelling approaches, i.e. the inversion of the radiative transfer model, providing criticalinformation for testing these models.
Figure 3. Green leaf area index (LAI) estimated from satellite data using developed algorithms.Green LAI was estimated in maize and soybean separately by crop-specific algorithms by (a)MODIS-based WDRVI and (b) TM/ETM+-based green WDRVI. Green LAI estimated for maizeand soybean taken together by the unified algorithms using MERIS-based (c) CIred edge and (d) rededge WDRVI.
Remote Sensing Letters 367
Dow
nloa
ded
by [
Ana
toly
A. G
itels
on]
at 0
0:04
29
Apr
il 20
15
The developed algorithms were validated for maize and soybean in Nebraska, USA.Several other studies have shown that algorithms calibrated over these Nebraska siteshave been applicable to accurately estimate maize yield across the USA (Sakamoto,Gitelson, and Arkebauer 2014), maize and soybean gross primary production across thecorn belt (Gitelson et al. 2012), and green LAI of wheat and potato grown in Israel (Nguy-Robertson et al. 2014). Thus, it is likely that these algorithms are applicable in otheragroecosystems. However, care should be taken in applying these algorithms for estimat-ing green LAI to other vegetation types as other studies have demonstrated mixed results(Brantley, Zinnert, and Young 2011; Heiskanen et al. 2013). Future research is necessaryto determine the accuracy of these algorithms for different crops and vegetation types.
AcknowledgementsThis research was supported by NASA NACP and, partially, by the U.S. Department of Energy. Wesincerely appreciate the support and the use of facilities and equipment provided by the Center forAdvanced Land Management Information Technologies, School of Natural Resources and data fromCarbon Sequestration Program, the University of Nebraska-Lincoln. This research was funded, inpart, by a Nebraska Space Grant Fellowship to ANR. AG is thankful to BARD and Marie CurieInternational Incoming Fellowships for supporting this study. We thank Tim Arkebauer and hisgroup for the green LAI data, and to Toshihiro Sakamoto and Yi Peng for their assistance inprocessing the MODIS and Landsat TM/ETM+ imagery. We grateful to Jose Moreno for providingthe spectral response curves for MERIS and the sensors aboard the upcoming Sentinel satellites.
Disclosure statementNo potential conflict of interest was reported by the authors.
ReferencesBrantley, S. T., J. C. Zinnert, and D. R. Young. 2011. “Application of Hyperspectral Vegetation
Indices to Detect Variations in High Leaf Area Index Temperate Shrub Thicket Canopies.”Remote Sensing of Environment 115 (2): 514–523. doi:10.1016/j.rse.2010.09.020.
Doelling, D. R., C. Lukashin, P. Minnis, B. Scarino, and D. Morstad. 2012. “Spectral ReflectanceCorrections for Satellite Intercalibrations Using SCIAMACHY Data.” IEEE Geoscience andRemote Sensing Letters 9 (1): 119–123. doi:10.1109/LGRS.2011.2161751.
Gitelson, A. A., Y. Peng, J. G. Masek, D. C. Rundquist, S. B. Verma, A. E. Suyker, J. M. Baker, J.L. Hatfield, and T. Meyers. 2012. “Remote Estimation of Crop Gross Primary Production withLandsat Data.” Remote Sensing of Environment 121: 404–414. doi:10.1016/j.rse.2012.02.017.
Gitelson, A. A., A. Viña, V. S. Ciganda, D. C. Rundquist, and T. J. Arkebauer. 2005. “RemoteEstimation of Canopy Chlorophyll Content in Crops.” Geophysical Research Letters 32 (8):L08403. doi:10.1029/2005GL022688.
Guanter, L., M. Del Carmen González-Sanpedro, and J. Moreno. 2007. “A Method for theAtmospheric Correction of ENVISAT/MERIS Data over Land Targets.” International Journalof Remote Sensing 28 (3–4): 709–728. doi:10.1080/01431160600815525.
Guindin-Garcia, N., A. A. Gitelson, T. J. Arkebauer, J. Shanahan, and A. Weiss. 2012. “AnEvaluation of MODIS 8- and 16-Day Composite Products for Monitoring Maize Green LeafArea Index.” Agricultural and Forest Meteorology 161: 15–25. doi:10.1016/j.agrformet.2012.03.012.
Heiskanen, J., M. Rautiainen, P. Stenberg, M. Mõttus, and V.-H. Vesanto. 2013. “Sensitivity ofNarrowband Vegetation Indices to Boreal Forest LAI, Reflectance Seasonality and SpeciesComposition.” ISPRS Journal of Photogrammetry and Remote Sensing 78: 1–14.doi:10.1016/j.isprsjprs.2013.01.001.
Maiersperger, T. K., P. L. Scaramuzza, L. Leigh, S. Shrestha, K. P. Gallo, C. B. Jenkerson, and J. L.Dwyer. 2013. “Characterizing LEDAPS Surface Reflectance Products by Comparisons with
AERONET, Field Spectrometer, and MODIS Data.” Remote Sensing of Environment 136: 1–13.doi:10.1016/j.rse.2013.04.007.
Nguy-Robertson, A. L., A. A. Gitelson, Y. Peng, A. Viña, T. J. Arkebauer, and D. C. Rundquist.2012. “Green Leaf Area Index Estimation in Maize and Soybean: Combining Vegetation Indicesto Achieve Maximal Sensitivity.” Agronomy Journal 104 (5): 1336–1347. doi:10.2134/agronj/2012.0065.
Nguy-Robertson, A. L., Y. Peng, A. A. Gitelson, T. J. Arkebauer, A. Pimstein, I. Herrmann, A.Karnieli, D. C. Rundquist, and D. J. Bonfil. 2014. “Estimating Green LAI in Four Crops:Potential of Determining Optimal Spectral Bands for a Universal Algorithm.” Agricultural andForest Meteorology 192–193: 140–148. doi:10.1016/j.agrformet.2014.03.004.
Peng, Y., and A. A. Gitelson. 2012. “Remote Estimation of Gross Primary Productivity in Soybeanand Maize Based on Total Crop Chlorophyll Content.” Remote Sensing of Environment. 117:440–448. doi:10.1016/j.rse.2011.10.021.
Perez, R., R. Seals, and A. Zelenka. 1997. “Comparing Satellite Remote Sensing and GroundNetwork Measurements for the Production of Site/Time Specific Irradiance Data.” Solar Energy60 (2): 89–96. doi:10.1016/S0038-092X(96)00162-4.
Sakamoto, T., A. A. Gitelson, and T. J. Arkebauer. 2014. “Near Real-Time Prediction of U.S. CornYields Based on Time-Series MODIS Data.” Remote Sensing of Environment 147: 219–231.doi:10.1016/j.rse.2014.03.008.
Sakamoto, T., A. A. Gitelson, A. L. Nguy-Robertson, T. J. Arkebauer, B. D. Wardlow, A. E. Suyker,S. B. Verma, and M. Shibayama. 2012. “An Alternative Method Using Digital Cameras forContinuous Monitoring of Crop Status.” Agricultural and Forest Meteorology 154–155:113–126. doi:10.1016/j.agrformet.2011.10.014.
Samani Majd, A. M., M. P. Bleiweiss, D. DuBois, and M. K. Shukla. 2013. “Estimation of theFractional Canopy Cover of Pecan Orchards Using Landsat 5 Satellite Data, Aerial Imagery, andOrchard Floor Photographs.” International Journal of Remote Sensing 34 (16): 5937–5952.doi:10.1080/01431161.2013.800951.
Suyker, A. E., and S. B. Verma. 2012. “Gross Primary Production and Ecosystem Respiration ofIrrigated and Rainfed Maize–Soybean Cropping Systems over 8 Years.” Agricultural and ForestMeteorology 165: 12–24. doi:10.1016/j.agrformet.2012.05.021.
Viña, A., and A. A. Gitelson. 2005. “New Developments in the Remote Estimation of the Fractionof Absorbed Photosynthetically Active Radiation in Crops.” Geophysical Research Letters 32(17): L17403. doi:10.1029/2005GL023647.
Viña, A., A. A. Gitelson, A. L. Nguy-Robertson, and Y. Peng. 2011. “Comparison of DifferentVegetation Indices for the Remote Assessment of Green Leaf Area Index of Crops.” RemoteSensing of Environment 115 (12): 3468–3478. doi:10.1016/j.rse.2011.08.010.
Xiao, Z., S. Liang, J. Wang, P. Chen, X. Yin, L. Zhang, and J. Song. 2014. “Use of GeneralRegression Neural Networks for Generating the GLASS Leaf Area Index Product from Time-Series MODIS Surface Reflectance.” IEEE Transactions on Geoscience and Remote Sensing 52(1): 209–223. doi:10.1109/TGRS.2013.2237780.


![Instuderingsfr%C3%A5gor - Marknadsf%C3%B6ring[1]](https://static.documents.pub/doc/80x56/552034774a79595e718b4682/instuderingsfrc3a5gor-marknadsfc3b6ring1.jpg)


