65
ALGT investor day Maury Gallagher – Chairman & CEO November 2012

ALGT investor day Maury Gallagher – Chairman & CEO
November 2012

Forward looking statements
2
This presentation as well as oral statements made by officers or directors of Allegiant Travel Company, its advisors and affiliates (collectively or separately, the "Company“) will contain forward-looking statements that are only predictions and involve risks and uncertainties. Forward-looking statements may include, among others, references to future performance and any comments about our strategic plans. There are many risk factors that could prevent us from achieving our goals and cause the underlying assumptions of these forward-looking statements, and our actual results, to differ materially from those expressed in, or implied by, our forward-looking statements. These risk factors and others are more fully discussed in our filings with the Securities and Exchange Commission. Any forward-looking statements are based on information available to us today and we undertake no obligation to update publicly any forward-looking statements, whether as a result of future events, new information or otherwise. The Company cautions users of this presentation not to place undue reliance on forward looking statements, which may be based on assumptions and anticipated events that do not materialize.
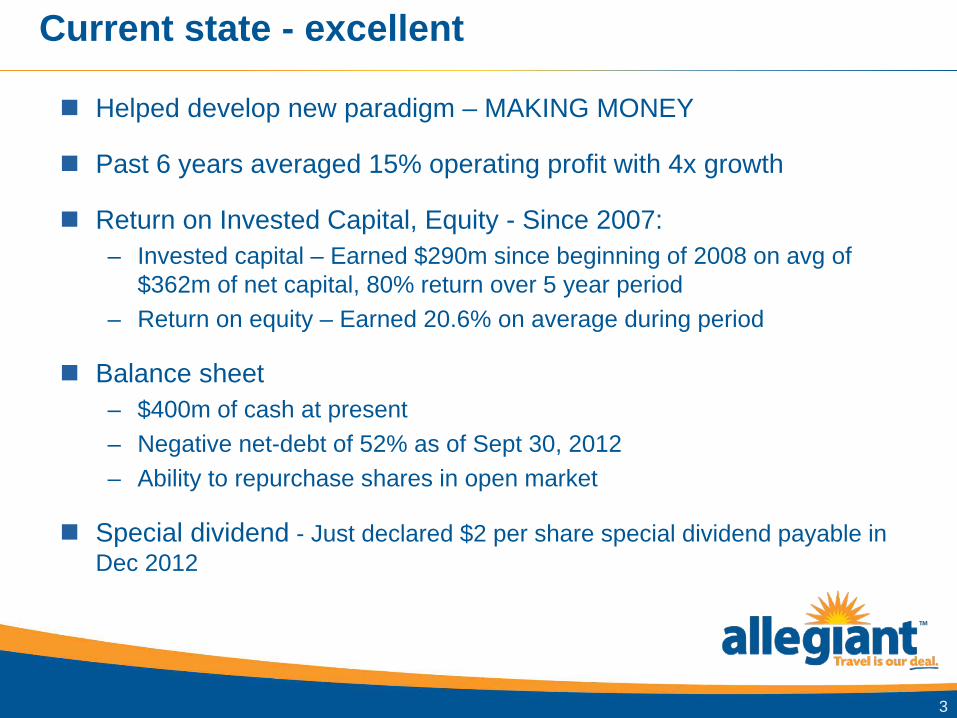
Current state - excellent
Helped develop new paradigm – MAKING MONEY
Past 6 years averaged 15% operating profit with 4x growth
Return on Invested Capital, Equity - Since 2007: – Invested capital – Earned $290m since beginning of 2008 on avg of
$362m of net capital, 80% return over 5 year period – Return on equity – Earned 20.6% on average during period
Balance sheet – $400m of cash at present – Negative net-debt of 52% as of Sept 30, 2012 – Ability to repurchase shares in open market
Special dividend - Just declared $2 per share special dividend payable in Dec 2012
3

Very low cost structure
Have lowest ex-fuel costs in US - 5 cent plus cost/ASM – Closest is Spirit at 6 cents – 15% advantage over Spirit
Almost 50% advantage over – Southwest – 7.7 cents – Alaska – 7.6 cents
Southwest LTM 3Q12 spent $91 per passenger ex fuel – G4 $57
4
CASM ex fuel figures are LTM 3Q12

Future – focused on more of the same
Maintain/improve cost structure
Continue model with low cost aircraft - market is good
Take advantage of strong balance sheet - cash position
Take advantage of automation – Increase product offerings – Unit revenues
5

Map with lines
6

Map with no lines
7

ALGT investor day Jude Bricker – SVP Planning/Treasurer
November 2012

2012 capacity growth
9
30 New market launches Focus on HI, PGD, and Airtran back-fill
2012 New Markets

Current 2013 capacity plan
10
0%
5%
10%
15%
20%
25%
Gauge Change Hawaii Same StoreFrequency
New CONUSRoutes
DiscontinuedRoutes
Total Growth
Year over Year ASM Growth
“Gauge Change” includes changes from MD80 to 757 or A319 Total growth is midpoint of guided range
Current growth plan is primarily comprised of 166 seat + Hawaii
2013 scheduled ASM YoY growth expected to be +15 to +20%
6.0%
10.6% 1.0%
3.6%
-3.7%
17.5%
2012 v 2011 8.8% 3.7% 2.8% 7.4% -2.9% 19.7%

A319 capacity planning
11
A319s are not in the schedule through June (replacement only)
Fall 2013 capacity load could include (based on A319 capabilities):
− Shorter and higher airfield markets
− Long range
− Mexican / Caribbean
− Incremental off-peak flying

Aircraft cost comparison (utilization of 8.9 hours/day)
$52 $41
$5 $10
$15 $9
$17 $18
$17 $18
MD80 (166 seats) A319 used
12
Projected costs per passenger
Other
Aircraft
Total
$72
$34
$60
$36
Fuel Ownership Maintenance Other Labor Assumptions Ownership includes depreciation & amortization and aircraft rent $3.25 fuel cost per gallon 90% load factor Top 20 lines of flying are 8.9 BH/day
Ex fuel costs = $54 Fuel cost = $52
Total MD-80 = $106
Ex fuel costs = $55 Fuel cost = $41
Total A319 = $96
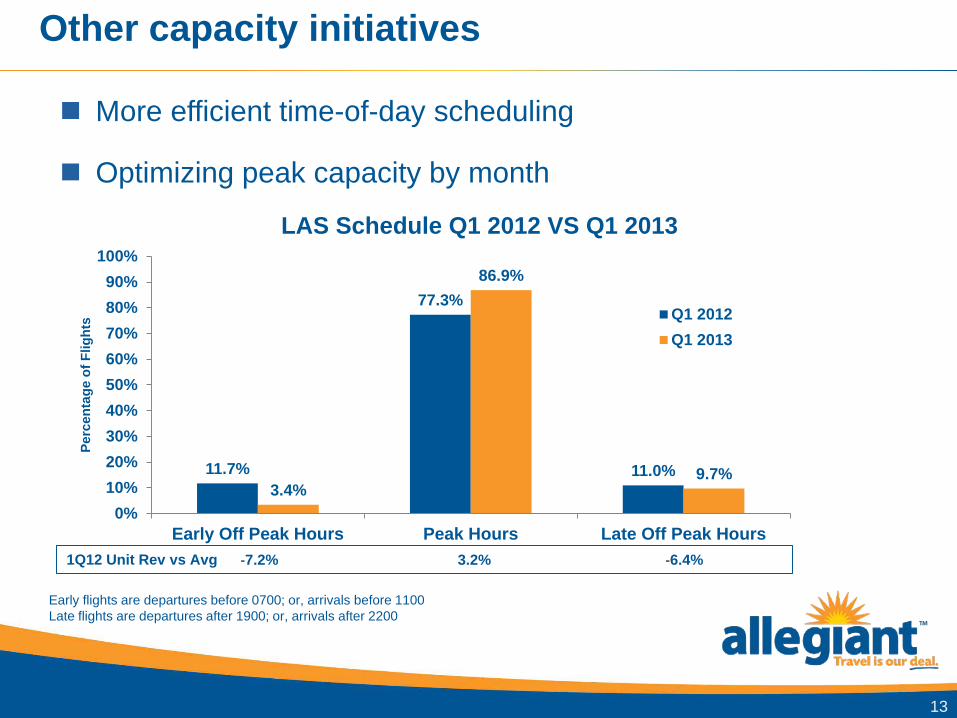
Other capacity initiatives
13
More efficient time-of-day scheduling
Optimizing peak capacity by month
11.7%
77.3%
11.0% 3.4%
86.9%
9.7%
Early Off Peak Hours Peak Hours Late Off Peak Hours0%
10%20%30%40%50%60%70%80%90%
100%
Perc
enta
ge o
f Flig
hts
LAS Schedule Q1 2012 VS Q1 2013
Q1 2012Q1 2013
-7.2% 3.2% -6.4% 1Q12 Unit Rev vs Avg
Early flights are departures before 0700; or, arrivals before 1100 Late flights are departures after 1900; or, arrivals after 2200

Pricing initiatives
14
Algorithmic approach to price
Next step – applying the same methods to all products
0%
10%
20%
30%
40%
50%
60%
70%
80%
90%
100%
$60
$70
$80
$90
$100
$110
$120
$130
$140
$150
12/22 12/29 01/05 01/12 01/19 01/26 02/02 02/09 02/16 02/23 03/01 03/08 03/15 03/22 03/29
Load
Fac
tor
Ave
rage
Airf
are
March 2012 v 2010 Trailing 100 Days Booking Curve
Avg Fare 2012 Avg Fare 2010 Load Factor 2012 Load Factor 2010

Catchment area expansion
15
Stockton Catchment 2009 Stockton Catchment 2012
Continue to see market growth in mature markets
Customers show willingness to travel for access to low fares
Heat map by credit card zip code; darkest green is more than 400 segments

Revenue initiatives
Overhead bags + Airport bag fees
Seat Assignment pricing
Tripflex display and pricing
Priority boarding revamp
16
$31.46 $30.38
$31.51 $32.39
$33.90
$37.05
$28
$30
$32
$34
$36
$38
2Q11 3Q11 4Q11 1Q12 2Q12 3Q12
$ pe
r pas
seng
er
Avg fare – ancillary air related

Other revenue
Fixed Fee flying − Caesar's contract ends in January 2013
− “Free” MD-87 available to support Ad-Hoc charters through 1H13
− DOD charter opportunities with B757
B757 leases have been terminated and aircraft returned
17

Fleet update
18
Six 757s in-service by 1Q13
51 MD80s modified to 166 seat configuration by 1Q13 − 1 MD87 retires YE 2012; 1 MD87 retires summer 2013
− 5 150 seat MD80s retiring through YE 2013
9 ex-Easyjet A319s – lease is final; 1st delivery at year end
10 ex-Cebu A319s – purchase is still being negotiating
YE 2012 1Q13E 2Q13E 3Q13E 4Q13E FY 2013 FY 2014
MD80 (owned) 58
57
56
52
51
51
51
B757 (owned)
6
6
6
6
6
6
6
A319 (leased)
1
2
2
2
2
2
4
A319 (owned)
-
1
2
4
7
7
10
Total
65
66
66
64
66
66
71
Delivery dates are shown

A320 used market
19
A320 opportunities for replacement and growth
Used A320 market catalysts: − Obsolesce due to new engine models
− Spread on debt financing new vs used equipment
− Slow demand growth
− Increasing production rates by the OEMs
− Airline consolidation
− Fleet replacements
− Other: stronger dollar, higher interest rates, or slower inflation/deflation

$-
$0.50
$1.00
$1.50
$2.00
$2.50
$3.00
$3.50
0
5
10
15
20
25
30
35
1993 1995 1997 1999 2001 2003 2005 2007 2009 2011
Pric
e U
SD P
er G
allo
n
Val
ue (
$m)
AVITAS 737-300 Bi-Yearly Forecast Values 1993-2010 (Left Axis)737-300 1993 Market Values 1993-2010 (Left Axis)Jet Fuel Price USD/Gallon (Right Axis)
737NG 800 Introduced in June 1997
737NG 700 Introduced in December 1996
Source: AVITAS Blue Book of Jet Aircraft Values 1993-2010Source: BLOOMBERG - 04-01-10 Historical Jet Fuel Prices
B737 classic values
20

MD80 values keep costs down
21
MD80 engines trade at a discount to maintenance value
Market conditions should continue with AA MD80 retirements
STANDARD 2010 2011 2012 ESV Cost/cyc ($) $161.82 $166.67 $171.67 LLP Cost/cyc (inc spoilage) ($) $77.46 $82.88 $88.68 Total Cost/cyc ($) $239.28 $249.55 $260.35
Total MD80 Engine Cycles 95,972 98,034 105,266 Total Standard Cost ($mm) $23.0 $24.5 $27.4
Cost/Avg AC (MD80 only) $450,270 $465,988 $472,517
ALLEGIANT Engine OH ($mm) $5.1 $18.3 $7.1 Incr. Depreciation ($mm) $1.8 $2.0 $2.3 Net Gain/Loss($mm) $2.8 $2.3 $2.1 Total Actual Cost ($M) $9.7 $22.6 $11.5
Cost/Avg AC (MD80 only) $190,909 $430,188 $198,654
“Standard” rates include average over haul rates of $1mm per ESV2 and $500K per ESV1 LLP costs are per OEM CLP

ALGT investor day Kris Bauer – SVP Operations
November 2012

Getting the Airbus on our certificate
Manuals submitted
Training begun – Maintenance, pilots, flight attendants
Proving runs scheduled for February – Will be performed in Phoenix
In service targeted 2Q13
First aircraft has undergone C-check and painted in Allegiant livery
23

Allegiant A319
24

Managing 3rd aircraft type
Dedicated fleet manager positions – Flight operations and maintenance
Substantially improved technical management
Substantially improved safety department
Enhanced safety programs – ASAP, FOQA, FRMS
Improved reliability will reduce day to day complexity
25

Labor update
Flight attendants
Pilots
Dispatchers
26

ALGT investor day Scott Sheldon - CFO
November 2012

Aircraft fuel
Improving fuel efficiency even before adding A319s – Over 7% improvement 3Q12 vs 3Q11
28
59.1 60.1
61.4 62.0
63.3 64.9
55.00
60.00
65.00
3Q 11 4Q 11 1Q 12 2Q 12 3Q 12 4Q 12E
ASMs per gallon
150 seat MD-80 49 47 39 30 20 13 -15
166 seat MD-80 1 7 17 26 36 43-45
757 1 1 1 3 4 4
$ per gallon $3.12 $3.08 $3.28 $3.14 $3.11 $3.20
Aircraft counts are end of period 4Q12E ASMs per gallon are estimated between 64 and 65 4Q 12E fuel price is estimate based on forward curve as of 11/8/12
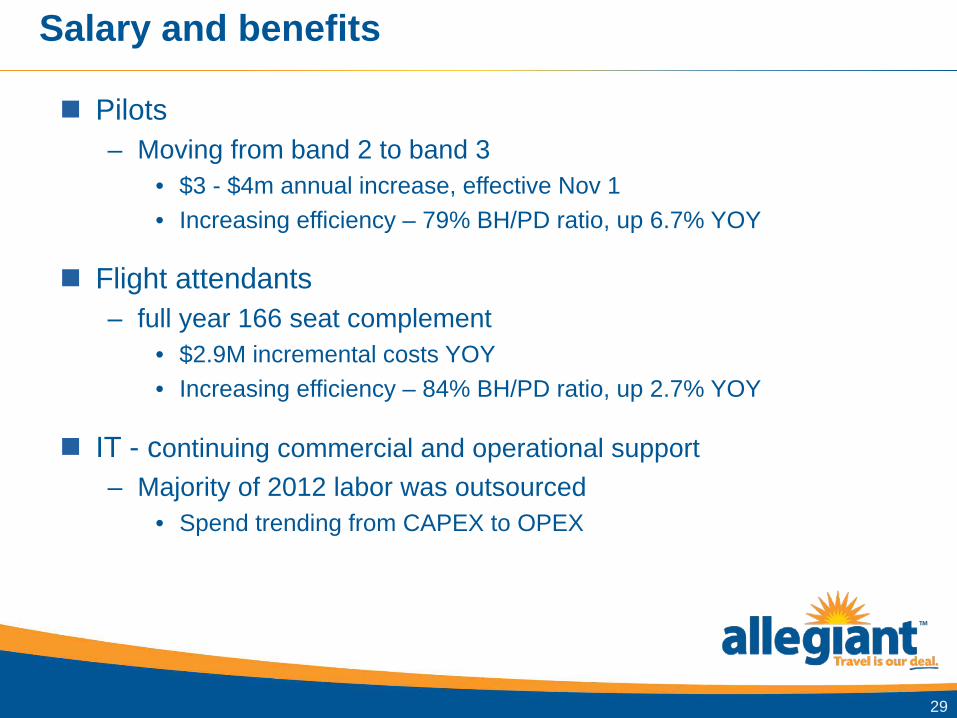
Salary and benefits
Pilots – Moving from band 2 to band 3
• $3 - $4m annual increase, effective Nov 1 • Increasing efficiency – 79% BH/PD ratio, up 6.7% YOY
Flight attendants – full year 166 seat complement
• $2.9M incremental costs YOY • Increasing efficiency – 84% BH/PD ratio, up 2.7% YOY
IT - continuing commercial and operational support – Majority of 2012 labor was outsourced
• Spend trending from CAPEX to OPEX
29

Station operations
Major destinations – Las Vegas – same footprint, $4.5m annual increase in 2013 – Hawaii – nearly 2x average destination turn cost
Secondary/smaller cities – More efficient, lower costs – Good cost control, trending towards $1k per departure – Average 40% lower cost per departure than destination cities
30

Maintenance and repairs
Heavy check line $$ flat YoY, events slightly up
Engine overhauls – 1st RB211 with minimal JT8D activity – Expect $7-$10m in 2013 vs ~$7m in 2012
31
$102.6 $102.7
$128.9
$102.5 $105.0
$61.9 $64.1 $70.4 $62.5 $62.5
$40
$60
$80
$100
$120
$140
2009 2010 2011 2012E 2013E
$ pe
r AC
/Mos
(000
)
Maintenance per aircraft per month
Total maintenance expense per AC per mos Mx exp less C-checks and engine OH
2012E maintenance per AC/Mos expected $100-$105k, non c-check/engines per AC/Mos expected $60-$65k 2013E maintenance per AC/Mos expected $100-$110k, non c-check/engines per AC/Mos expected $60-$65k

Ownership costs
D&A pressure due to 166 seat mods, 757s, A319s
Accelerating MD-80 depreciation due to future retirements
32
$0$10$20$30$40$50$60$70$80$90
$100
2009 2010 2011 2012E 2013E
$ pe
r AC
/mos
(000
)
AC lease rental & depreciation/AC/month
AC rent/AC/mos AC depreciation/AC/mos Total depreciation/AC/mos
AC rent $m $1.9 $1.7 $1.1 $0 $4 to $6
AC D&A per AC $49.7 $51.3 $56.9 ~$68 $70 to $72
Amounts are per AC/month - $000s

Continued cost improvement
Lowest CASM ex in the U.S.
Airbus fleet expected to lower unit costs
33
5.1
5.7 5.4 5.2
4.6
4.8
5.0
5.2
5.4
5.6
5.8
2010 2011 2012 E 2013 E
CASM ex fuel
1.6%
Year over year change
13.0%
(7.0) – (5.0)%
(6.0) – (1.0)%
CASM ex fuel 2012 and 2013 CASM ex numbers assume midpoint of guided ranges
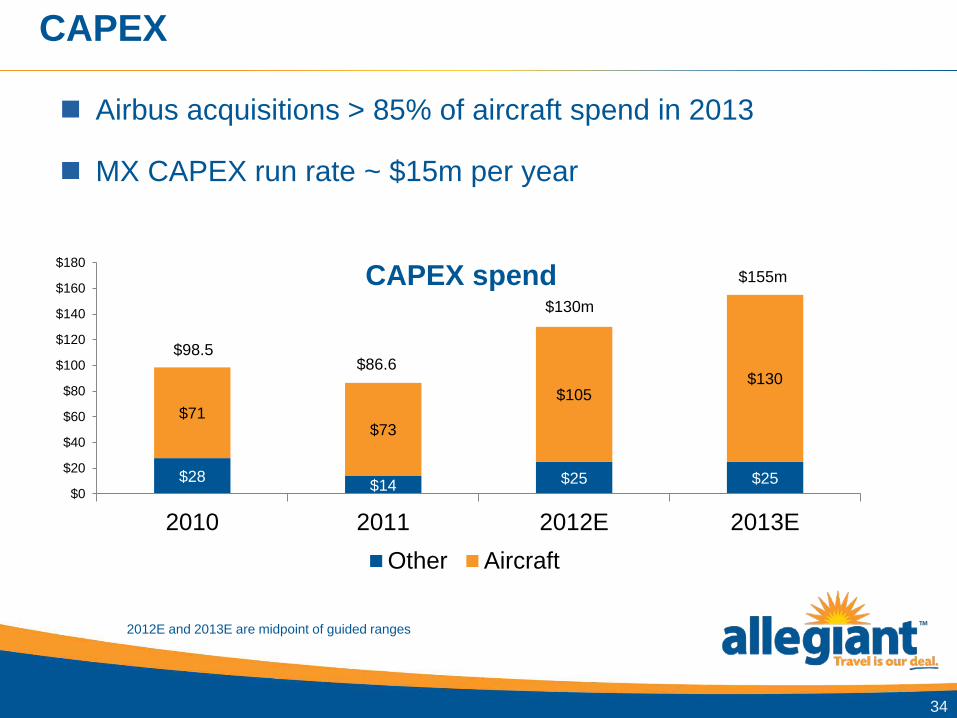
CAPEX
34
$130m
$155m
Airbus acquisitions > 85% of aircraft spend in 2013
MX CAPEX run rate ~ $15m per year
$86.6 $98.5
2012E and 2013E are midpoint of guided ranges
$28 $14 $25 $25
$71 $73
$105 $130
$0
$20
$40
$60
$80
$100
$120
$140
$160
$180
2010 2011 2012E 2013E
CAPEX spend
Other Aircraft

Strong cash generation
$140 $127
$179
$100
$125
$150
$175
$200
2010 2011 LTM 3Q12
$ m
m
35
EBITDA
$2.9
$2.4
$3.1
$2.0
$3.0
$4.0
2010 2011 LTM 3Q12
$ m
m
EBITDA per AC
Free cash flow
$0
$42
$82
-$25
$0
$25
$50
$75
$100
2010 2011 LTM 3Q12
$ m
m
($122)
($173) ($218)
-$300
-$225
-$150
-$75
$02010 2011 LTM 3Q12
$ m
m
Net debt
See reconciliation tables below

Balance sheet strength
15.3% 15.5%
4.4%
9.5%
0%
10%
20%
2011 LTM 3Q12 LUV LTM3Q12
ALK LTM3Q12
36
Return on capital employed
15.0% 19.6%
7.3%
24.8%
0%
10%
20%
30%
2011 LTM 3Q12 LUV LTM3Q12
ALK LTM3Q12
Return on equity
17.7 x 21.3 x
10.8 x 12.2 x
0
5
10
15
20
25
2011 LTM 3Q12 LUV LTM3Q12
ALK LTM3Q12
Interest coverage
1.2 x 0.9 x
3.3 x
2.3 x
0
1
2
3
4
2011 LTM 3Q12 LUV LTM3Q12
ALK LTM3Q12
Debt / EBITDA
LUV = Southwest Airlines, based on published information ALK = Alaska Airlines, based on published information
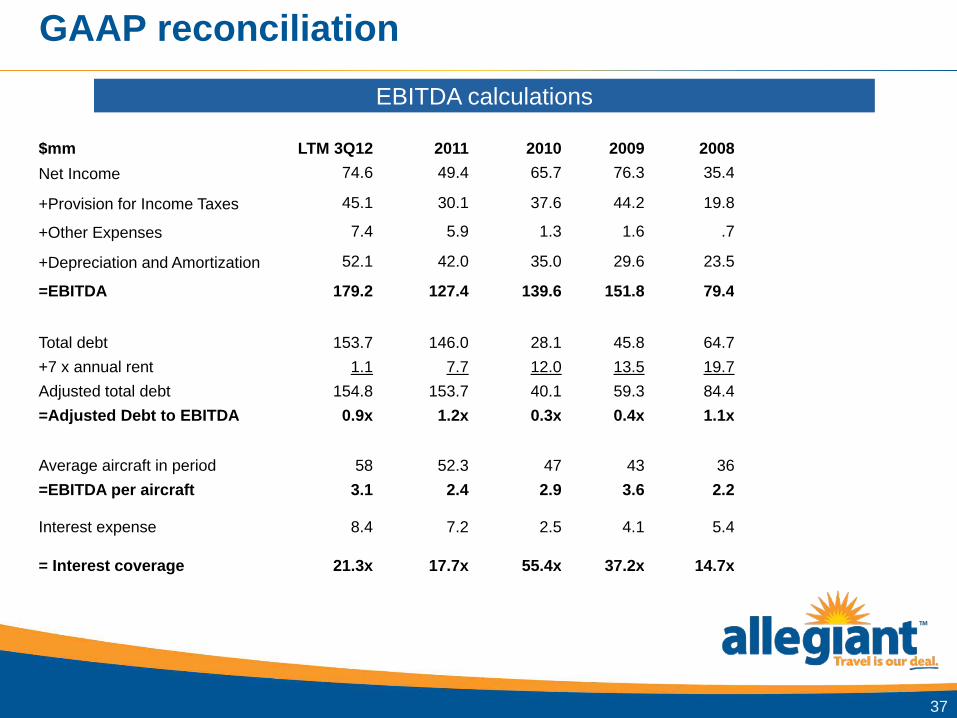
GAAP reconciliation
EBITDA calculations
37
$mm LTM 3Q12 2011 2010 2009 2008 Net Income 74.6 49.4 65.7 76.3 35.4
+Provision for Income Taxes 45.1 30.1 37.6 44.2 19.8
+Other Expenses 7.4 5.9 1.3 1.6 .7
+Depreciation and Amortization 52.1 42.0 35.0 29.6 23.5
=EBITDA 179.2 127.4 139.6 151.8 79.4
Total debt 153.7 146.0 28.1 45.8 64.7 +7 x annual rent 1.1 7.7 12.0 13.5 19.7 Adjusted total debt 154.8 153.7 40.1 59.3 84.4 =Adjusted Debt to EBITDA 0.9x 1.2x 0.3x 0.4x 1.1x
Average aircraft in period 58 52.3 47 43 36 =EBITDA per aircraft 3.1 2.4 2.9 3.6 2.2
Interest expense 8.4 7.2 2.5 4.1 5.4
= Interest coverage 21.3x 17.7x 55.4x 37.2x 14.7x

GAAP reconciliation
Return on equity
38
$mm LTM 3Q12 2011 2010 2009 Net Income ($mm) 74.6 49.4 65.7 76.3
Sept 2012 Sept 2011 Dec 2011 Dec 2010 Dec 2009
Total shareholders equity ($mm) 423.1 339.1 351.5 297.7 292.0
Return on equity 20% 15% 22%
ROE = Net income / Avg shareholders equity

GAAP reconciliation
Return on capital employed calculation
$mm LTM 3Q12 2011 2010 2009 + Net income 74.6 49.4 65.7 76.3
+ Income tax 45.1 30.1 37.6 44.2
+ Interest expense 8.4 7.2 2.5 4.7
- Interest income 1.0 1.2 1.2 2.5
EBIT 127.1 85.5 104.6 122.7
+ Interest income 1.0 1.2 1.2 2.5
Tax rate 37.7% 37.9% 36.4% 36.2%
Numerator 79.8 53.9 67.3 79.6 Total assets prior year 690.1 501.3 499.6 424.0
- Current liabilities prior year 181.3 166.6 158.6 131.0
+ ST debt of prior year 7.9 16.5 23.3 25.3
Denominator 516.7 351.2 364.3 318.3
= Return on capital employed 15.4% 15.3% 18.5% 25.0%
39

GAAP reconciliation
Free cash flow calculations
40
$mm LTM 3Q12 2011 2010 Cash from operations 188.3 129.9 98.0
- CAPEX 106.5 88.0 98.5
= Free cash flow 81.8 41.9 (0.5)
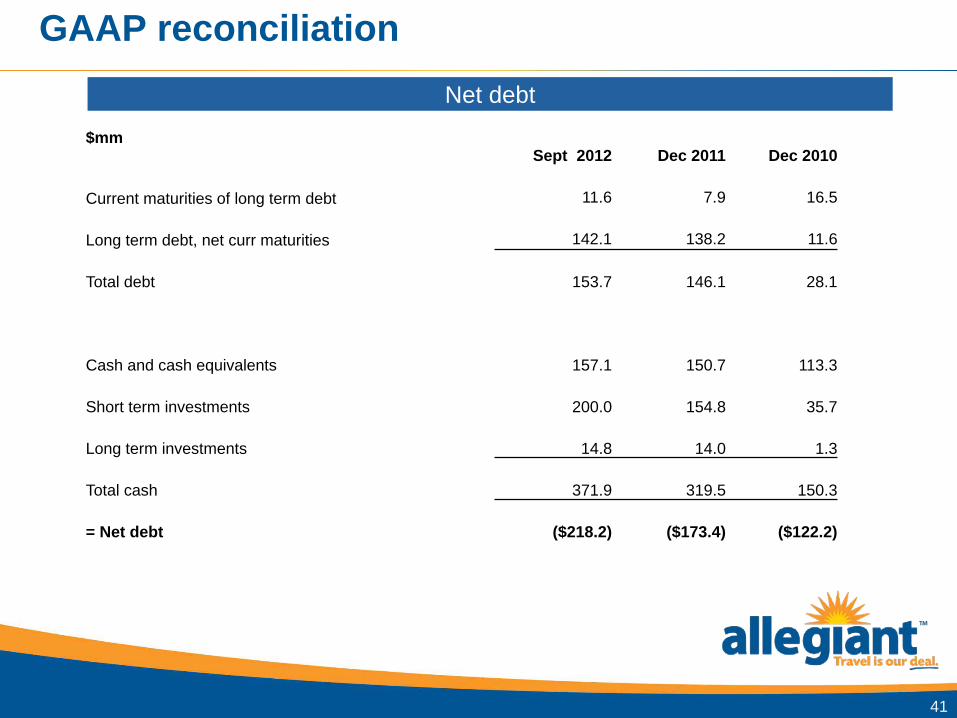
GAAP reconciliation
Net debt
41
$mm Sept 2012 Dec 2011 Dec 2010
Current maturities of long term debt 11.6 7.9 16.5
Long term debt, net curr maturities 142.1 138.2 11.6
Total debt 153.7 146.1 28.1
Cash and cash equivalents 157.1 150.7 113.3
Short term investments 200.0 154.8 35.7
Long term investments 14.8 14.0 1.3
Total cash 371.9 319.5 150.3
= Net debt ($218.2) ($173.4) ($122.2)
ALGT investor day Scott Allard - CIO
November 2011
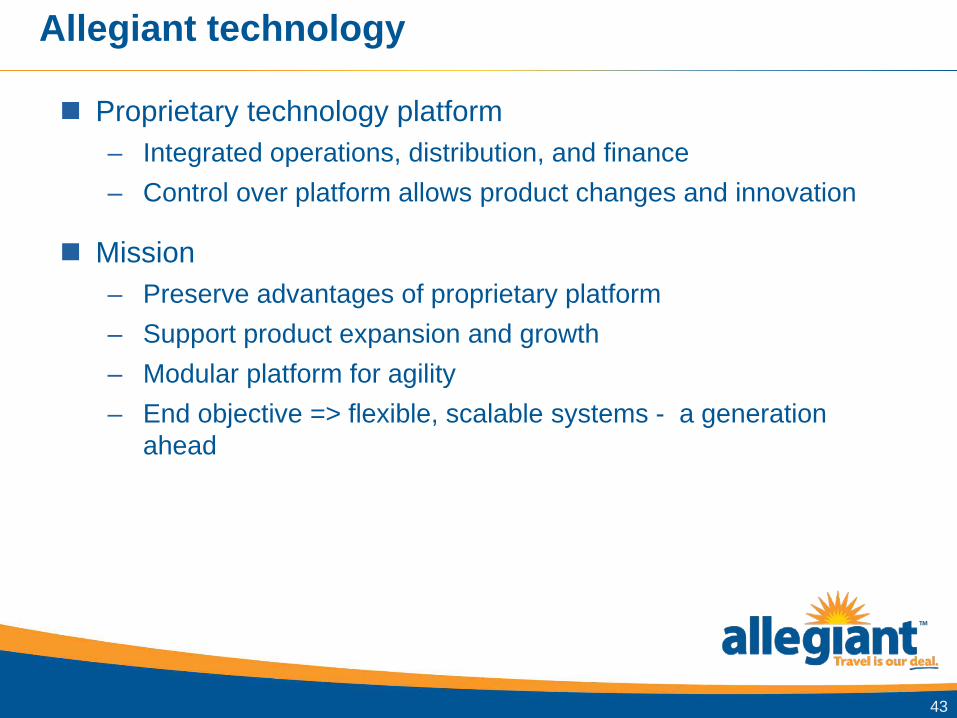
Allegiant technology
Proprietary technology platform – Integrated operations, distribution, and finance – Control over platform allows product changes and innovation
Mission – Preserve advantages of proprietary platform – Support product expansion and growth – Modular platform for agility – End objective => flexible, scalable systems - a generation
ahead
43
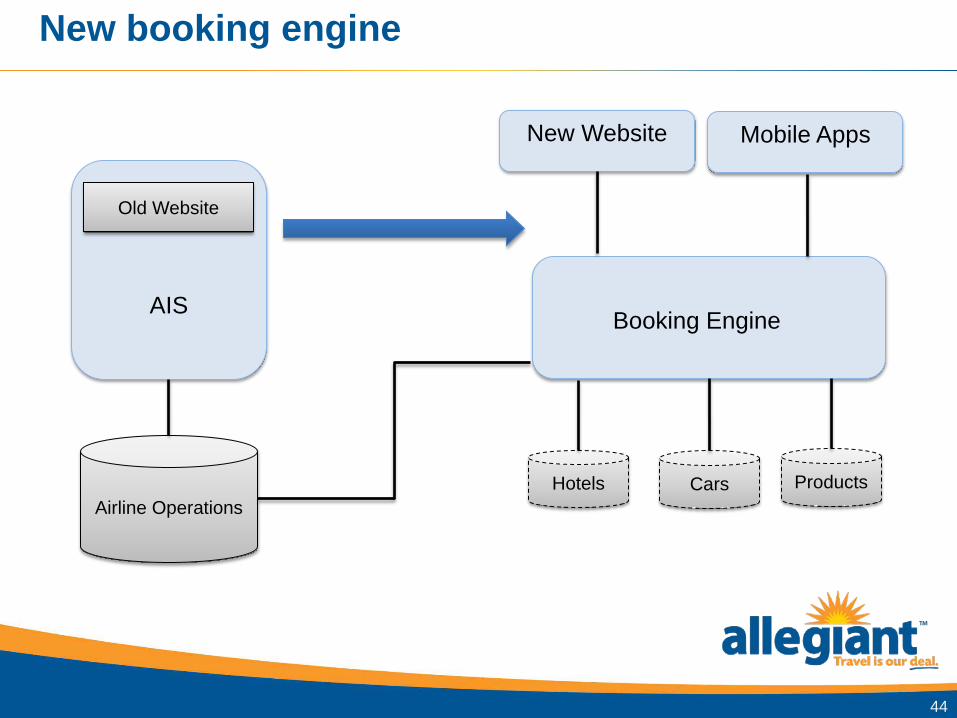
New booking engine
44
AIS
Old Website
Airline Operations
New Website Mobile Apps
Booking Engine
Hotels Cars Products

New platform advantages
Scalability
Flexibility and Agility
Marketing drives, not IT
Content management system for efficient merchandising
A/B testing offers continual improvement
45

Technology timeline CRM – 2Q13
– Co-branded credit card – Travel Club
Pricing Enhancements - 3Q13 – Additional Air fare buckets – Market directional pricing – Market-specific hotel pricing
SuperPNR - 3Q13 – Standalone hotel, ancillary sales – Other Air sales
International – 4Q13
46
Mobile opportunities 20% of web traffic comes from mobile
Mobile extends the selling window – Ancillary upsells during mobile check-in – Onboard sales via mobile flight attendant app – In-market ancillary sales via Deals app
47
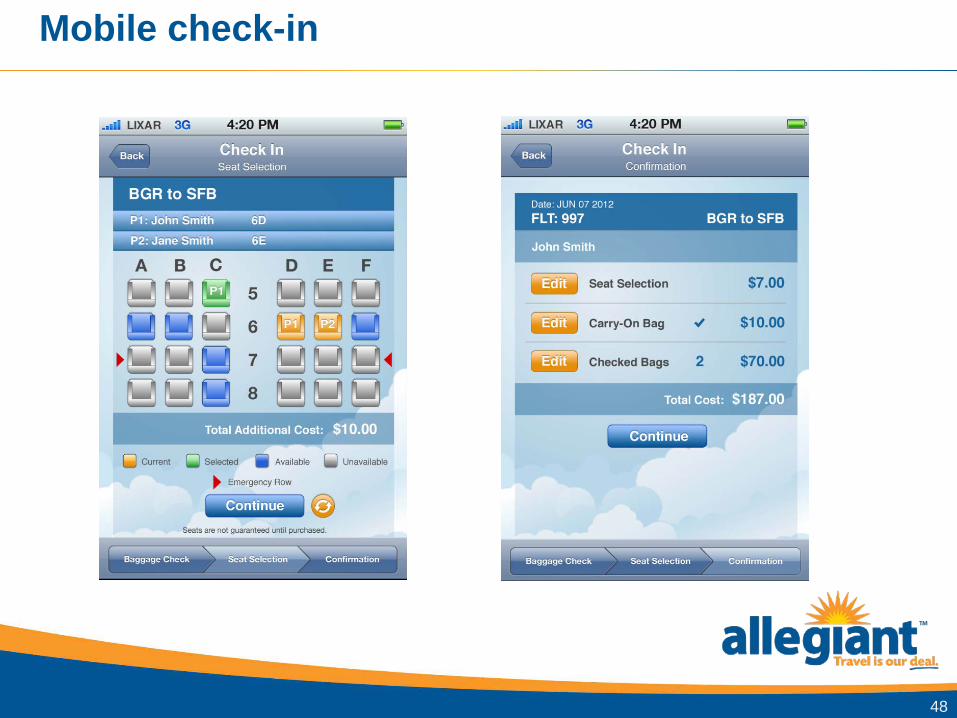
Mobile check-in
48

Buy on-board
49
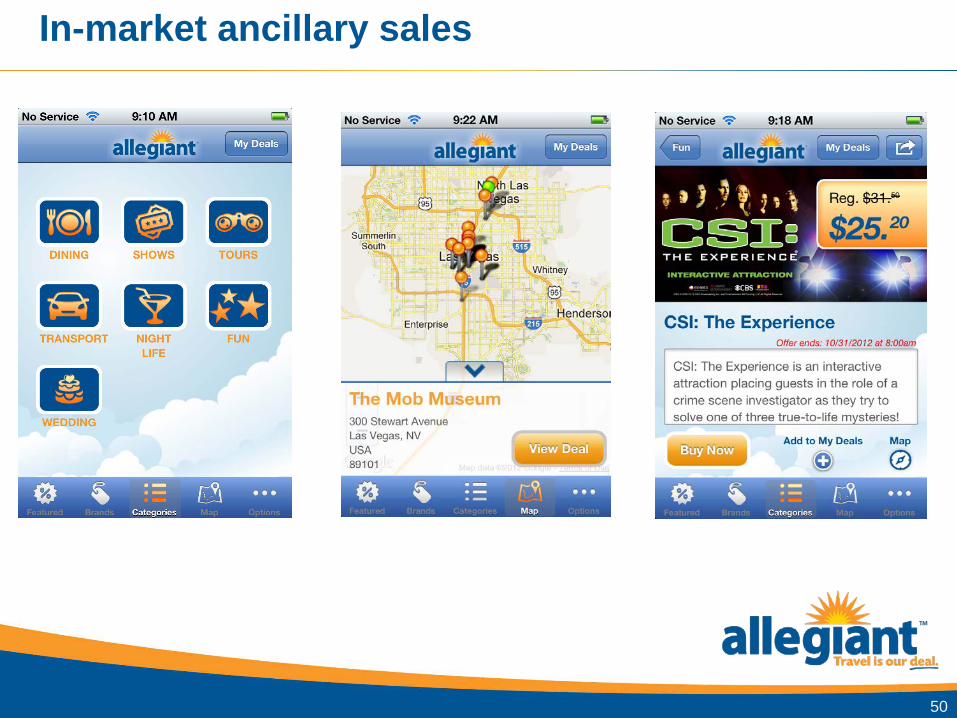
In-market ancillary sales
50

ALGT investor day Andrew Levy - President
November 2012

Commercial 2012
Ancillary - unbundled
Hawaii, PGD, OAK
Debit card discount – Implemented in July 2012 – RASM up, transaction costs down – Debit card take rate ~ 40% 3Q12
52
$89.15 $89.58
$31.18 $33.77 $5.18 $5.42
$50
$70
$90
$110
$130
$150
2011 LTM 3Q12
Total fare
Avg fare Avg Ancil/pax Avg 3rd party/pax
$125.51 $128.78
8.88 8.65
3.11 3.26 0.52 0.52
02468
101214
2011 LTM 3Q12
Total TRASM
PRASM Avg Ancil/ASM Avg 3rd party/ASM
12.50 12.43

Commercial 2013
Booking engine and new tools
Ancillary
Demand generation
Mobile
International
53

Booking engine
100% of our originating traffic
A/B testing – holding variables constant – Optimize user experience, conversion, revenue, profit
Pricing tools – Air – buckets – 3rd party – directional, city specific pricing
Early results, good
54
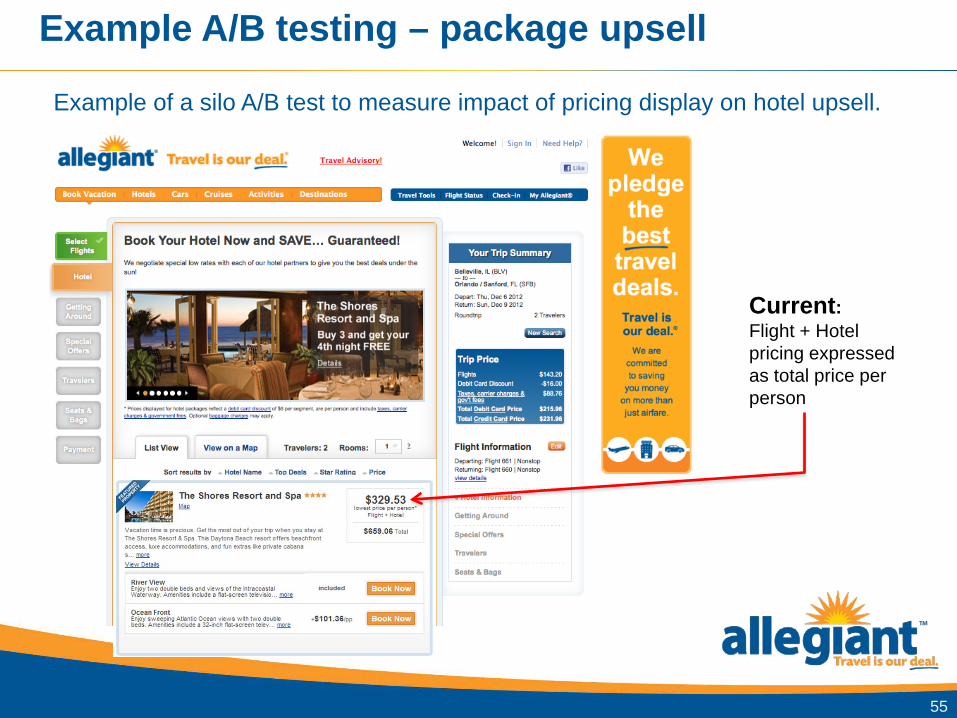
Example A/B testing – package upsell
55
Example of a silo A/B test to measure impact of pricing display on hotel upsell.
Current: Flight + Hotel pricing expressed as total price per person

Example A/B testing – package upsell
56
Example of a silo A/B test to measure impact of pricing display on hotel upsell.
Test: Flight + Hotel pricing expressed as a per night total price per person

Ancillary momentum
57
$4.34
$5.18 $5.27
$5.57
$4.00
$4.50
$5.00
$5.50
$6.00
2010 2011 YTD11 YTD12
Average fare - ancillary third party products
$30.24
$31.17 $31.07
$34.40
$30.00
$32.00
$34.00
2010 2011 YTD11 YTD12
Average fare - ancillary air-related charges
$34.58 $36.35 $36.34
$39.97 $42.64
$20
$25
$30
$35
$40
$45
2010 2011 YTD11 YTD12 3Q12
Average ancillary - total
All revenue is revenue per scheduled passenger, YTD nine months ending Sept 30

Air related ancillary - room to grow
Spirit ancillary products – Travel club – Credit card – Ticket counter charge
58
$51.70 $51.47 $49.81
$32.39 $33.90 $37.05
$0
$10
$20
$30
$40
$50
$60
1Q 12 2Q 12 3Q 12
Spirit Allegiant
Spirit – non ticket revenue per passenger segment Allegiant – ancillary air revenue per passenger

Third party products
YTD hotel net revenue +13%
YTD transportation net revenue +35%
Call center – Transition to a sales force – Push packages
59
% of total hotel room nights -
2012
% of total car rental days -
2012 % of total seats –
2012 % of total seats -
2013
Las Vegas 84% 8% 35% 31%
Remainder of system 16% 92% 65% 69%
Hotel room nights and car rental days are YTD 2012

Demand generation
Marketing strategy and tactics – Management – Metrics – Expect ROI justified increase in spend
Kayak – limited experiment
Email campaigns – Deep linking into booking flow – conversion rate increase +200% – Database of email addresses, ~3m active subscribers
60

Email campaign without deep linking
The email call to action links the customer to the website, but nothing is pre-selected. Customer must perform the whole search.
Many clicks and a large time investment are required to discover the advertised price point.
61

Email campaign featuring deep linking
Email with relevant price point for the customer’s market – The call to action links the customer deeper into the website. – The clicked route and travel dates are pre-selected. – The price advertised in the email is highlighted and easily
discovered.
62

Mobile
Deals app, only in Las Vegas now, other locations coming
Check in
Full product
Buy on board
Stations
63

International
Late 2013 / early 2014
Small cities to Las Vegas / Orlando
Destination markets – Cancun
Automation - payment, taxes
Bilingual capabilities - website, call center, inflight & stations
Regulatory
A319
64

Guidance recap
65
Item Guidance 2013 Scheduled ASMs - YoY +15 to 20% 2013 CASM ex fuel - YoY (6%) – (1)% 2013 CAPEX $150m to $160m 2013 Aircraft rent $4m to $6m 2013 AC depreciation/AC/mo $70k to $72k 2013 Maintenance/AC/mo $100k to $110k


![PM 2014 investor day 2014-06-26-Operations Investor Day Slides [FINAL]](https://static.documents.pub/doc/80x56/577cbc651a28aba7118da314/pm-2014-investor-day-2014-06-26-operations-investor-day-slides-final.jpg)
![PM 2014 investor day 2014-06-26-CEO Investor Day Slides [FINAL]](https://static.documents.pub/doc/80x56/577cbc651a28aba7118da313/pm-2014-investor-day-2014-06-26-ceo-investor-day-slides-final.jpg)


