ALKALI-SILICA REACTION IN PORTLAND CEMENT CONCRETE: TESTING METHODS AND MITIGATION ALTERNATIVES RESEARCH REPORT ICAR - 301-1f Sponsored by the Aggregates Foundation for Technology, Research and Education
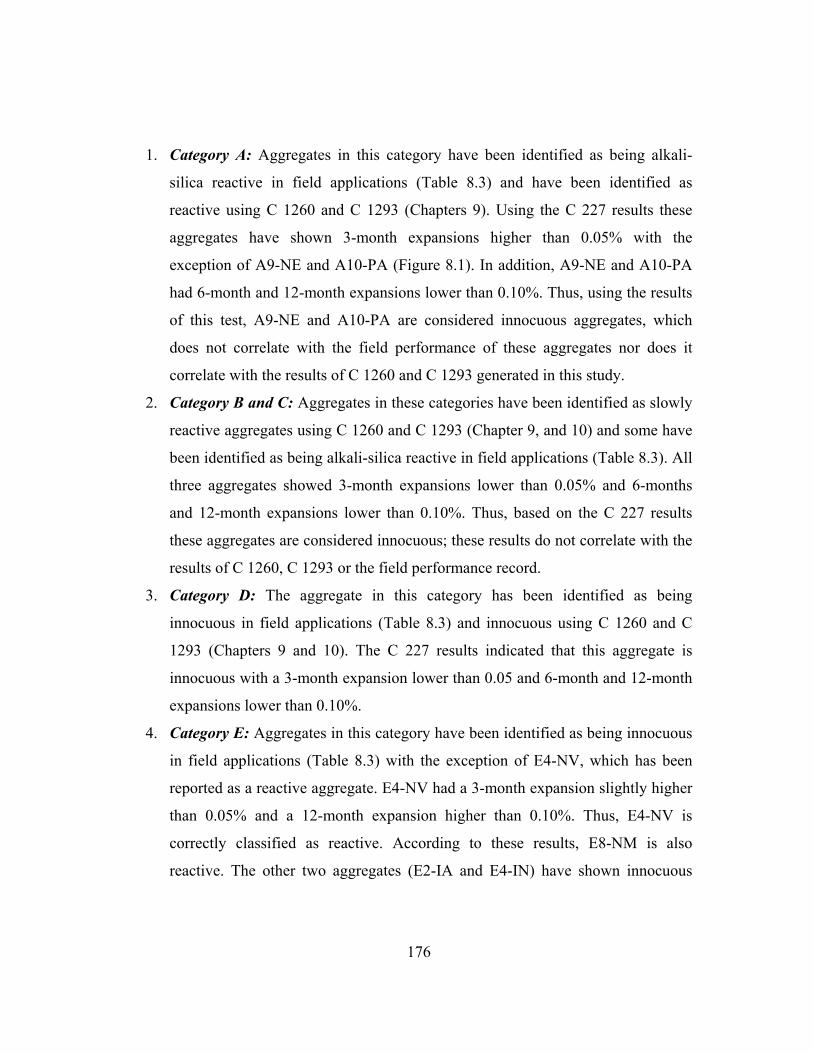
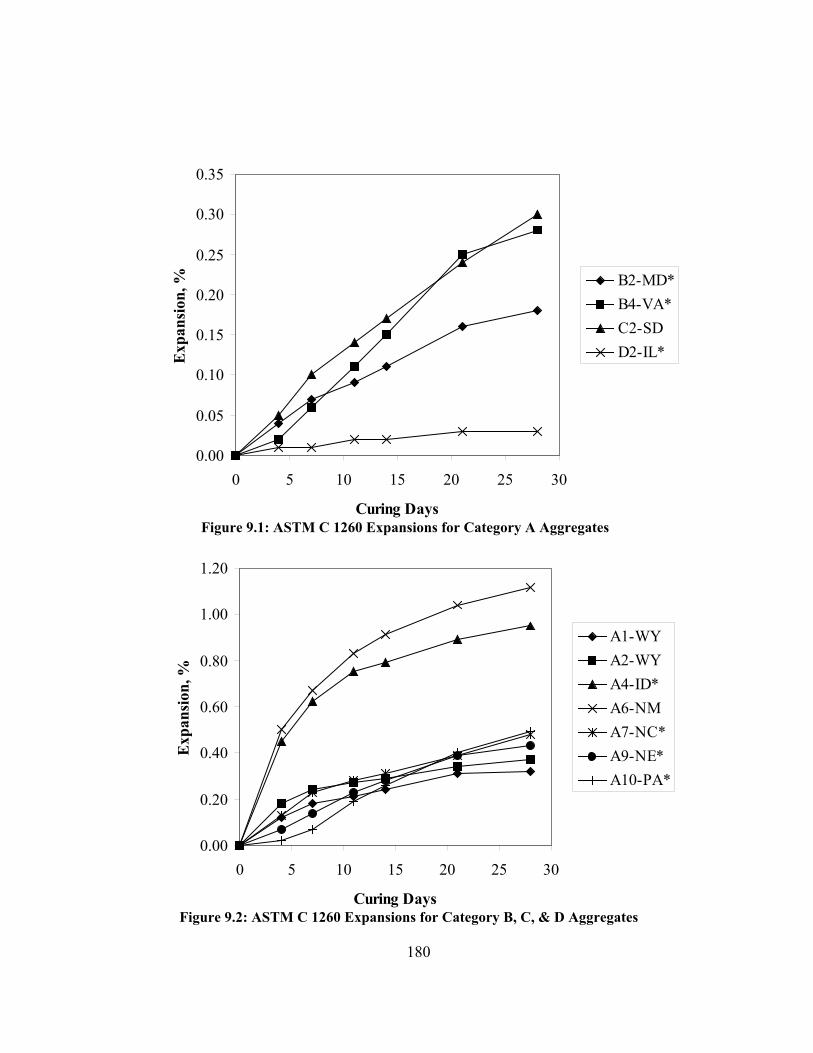
2. Government Accession No. 3. Recipient’s Catalog No.
5. Report Date July 2001
4. Title and Subtitle ALKALI-SILICA REACTION IN PORTLAND CEMENT CONCRETE:
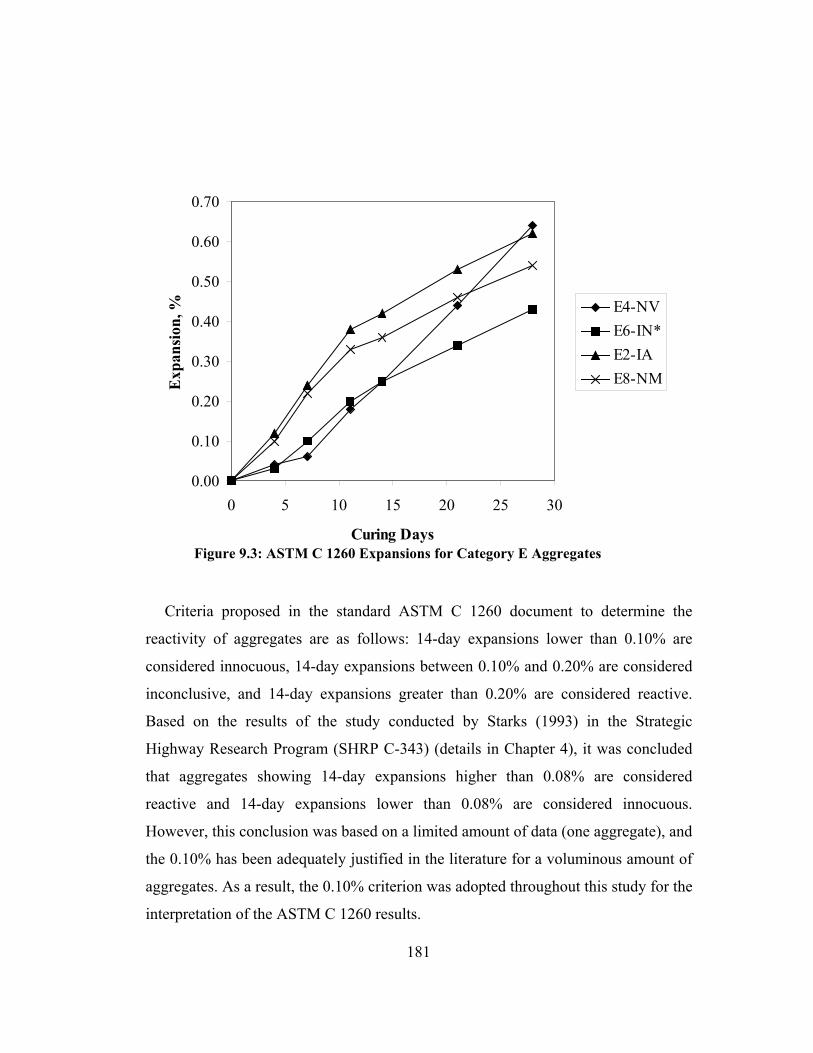
TESTING METHODS AND MITIGATION ALTERNATIVES 6. Performing Organization Code
7. Author(s) Wissam E. Touma, David F. Fowler, Ramon L. Carrasquillo
8. Performing Organization Report No. Research Report ICAR 301-1F
10. Work Unit No. (TRAIS) 9. Performing Organization Name and Address International Center for Aggregates Research The University of Texas at Austin Cockrell Hall 5.200 Austin, TX 78712-1076
11. Contract or Grant No. Project No. ICAR-301
13. Type of Report and Period Covered Research Report January 1998-December 2000
12. Sponsoring Agency Name and Address Aggregates Foundation for Technology, Research, and Education c/o National Sand, Stone, and Gravel Association 2101 Wilson Boulevard, Suite 100 Arlington, VA 22201 14. Sponsoring Agency Code
15. Supplementary Notes Research performed in cooperation with the Aggregates Foundation for Technology, Research, and Education. Research Project Title: Alkali-Silica Reaction in Portland Cement Concrete
16. Abstract Identifying the susceptibility of an aggregate to alkali-silica reaction (ASR) before using it in concrete is one of the most efficient practices for preventing damage and failure. Several tests have been developed for identifying aggregates subject to ASR, but each has its limitations. A three-year research study was initiated on January 1, 1998 at The University of Texas at Austin for investigating ASR in portland cement concrete. The scope of the study was essentially three fold: (1) investigate the predictive ability of ASTM C 1260 and C 1293, (2) develop more accurate and more efficient modifications of these procedures, and (3) investigate ASR mitigation alternatives. Aggregate samples from 14 sources from around the United States were acquired for the investigation. Aggregates were used in an extensive testing program during which guidelines for predicting the potential ASR of aggregates were developed and recommendations for minimizing concrete damage due to ASR were formulated. This report includes a review of the state-of-the-art of ASR, an evaluation of testing protocols and recommendations for dramatically shortening test time, test results, and mitigation options.
ALKALI-SILICA REACTION IN PORTLAND CEMENT CONCRETE: TESTING METHODS AND MITIGATION ALTERNATIVES
by
Wissam Touma, Ph.D.
Civil Engineering Department The University of Texas at Austin
David Fowler, Ph.D., P.E.
Civil Engineering Department The University of Texas at Austin
and
Ramon Carrasquillo, Ph.D., P.E. Civil Engineering Department
The University of Texas at Austin
Research Report ICAR 301-1F Research Project Number ICAR-301
Research Project Title Alkali-Silica Reaction in Portland Cement Concrete
Sponsored by the Aggregates Foundation for Technology, Research, and Education
July 2001
International Center for Aggregates Research The University of Texas at Austin
Austin, Texas 78712 and
Texas A &M University College Station, Texas 77843
DISCLAIMER
The contents of this report reflect the view of the authors who are responsible for the facts and accuracy of the data presented therein. The contents do not necessarily reflect the views of policies of the International Center for Aggregates Research (ICAR). This report does not constitute a standard, specification, or regulation.
ii
ACKNOWLEDGEMENTS
This is the final report of the Aggregates Foundation for Technology, Research, and Education Research Project 301 titled Alkali-Silica Reaction in Portland Cement Concrete. This research project was conducted at The University of Texas at Austin. This report is a product of the combined efforts of many. Norman R. Nelson of Lyman-Richey Sand and Gravel Company, Chair of both Task Force Three of the International Center for Aggregates Research (ICAR) entitled “Alkali-Silica/Alkali-Carbonate Reaction in Portland Cement Concrete” and Project 301’s Advisory Panel provided invaluable assistance. The authors would also like to commend the sterling efforts of the other advisory panelists and task force members. In addition, the authors are grateful to the Aggregates Foundation for Technology, Research, and Education and the National Stone, Sand, and Gravel Association for sponsoring this research through ICAR. Finally, the authors would also like to thank the organizations that contributed materials to this study.
iii
TABLE OF CONTENTS
Chapter 1 – Introduction
Chapter 2 – Alkali-Silica Reaction Mechanisms
Chapter 3 – Review of Selective Research
Chapter 4 – Review of International Experience with ASR
Chapter 5 – Testing Materials
Chapter 6 – Laboratory Testing Procedures
Chapter 7 – Mixture Proportions
Chapter 8 – Miscellaneous Testing Results
Chapter 9 – ASTM C 1260 Results and Discussion
Chapter 10 – ASTM C 1293 Results and Discussion
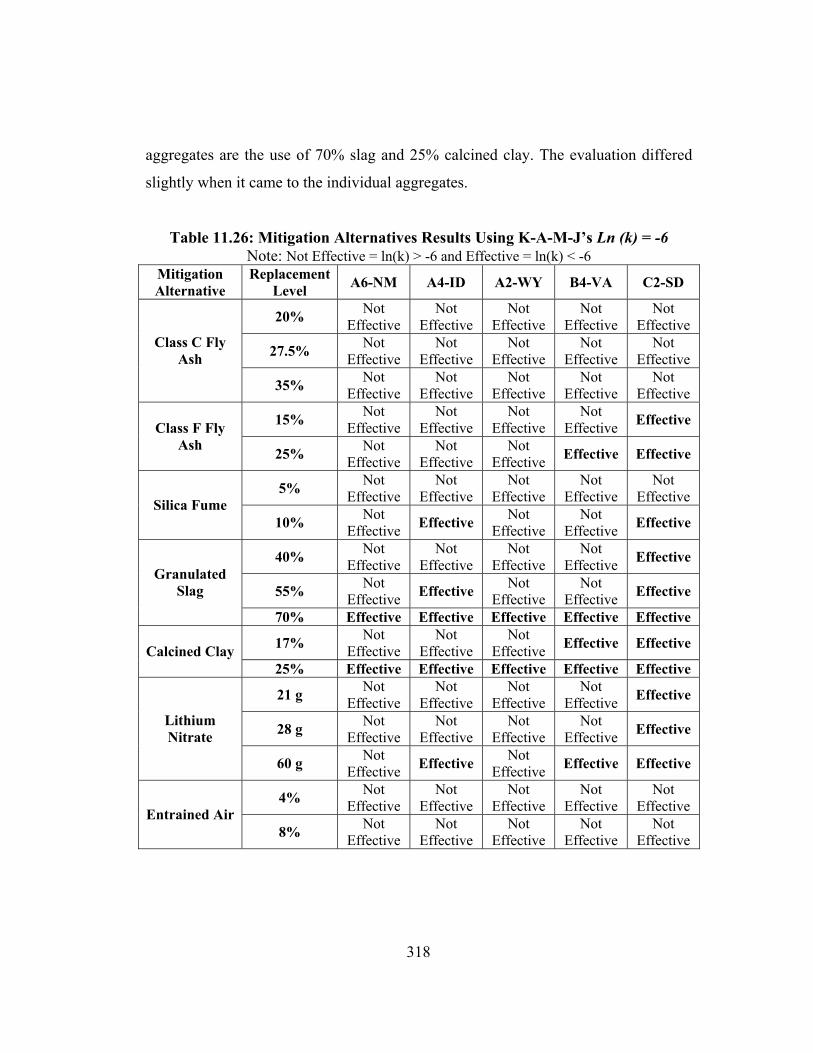
Chapter 11 – Investigation of Mitigation Alternatives Using ASTM C 1260
Chapter 12 – Investigation of Mitigation Alternatives Using ASTM C 1293
Chapter 13 – Comparison Between C 1260, C 1293, Petrographic Analysis, and Field Investigation
Results
Chapter 14 – Guidelines and Recommendations
Chapter 15 – Summary of Conclusions
Appendix A – Effect of Changing the Curing Solution Molarity on the Results of ASTM C 1260
Appendix B – Variables for the K-A-M-J Model using C 1260 Expansions Up to 28 Days
Appendix C – Effective Levels of Cement Replacement with Class C Fly Ash, Class F Fly Ash, and Silica Fume Appendix D – Petrographic Analysis and Field Performance Documentation of Aggregates
Appendix E – Petrographic Examination of Mortar Bars After Being Tested in Accordance with ASTM C
1260
References
TABLE OF CONTENTS
Chapter Page
CHAPTER ONE - INTRODUCTION 1.1 GENERAL ............................................................................................. 1 1.2 BACKGROUND AND PROJECT JUSTIFICATION ............................................ 1 1.2.1 ASR Survey..................................................................................................... 1 1.2.2 Testing Procedures ......................................................................................... 3 1.2.3 Mitigation Alternatives ................................................................................... 5 1.3 PROJECT OBJECTIVE .......................................................................................... 6 1.4 WORK PLAN .......................................................................................................... 7 1.5 BENEFITS .............................................................................................................. 9 CHAPTER TWO – ALKALI-SILICA REACTION MECHANISMS 2.1 GENERAL DEFINITION ..................................................................................... 11 2.2 CONTRIBUTION OF THE SILICA TO THE REACTION ................................. 12 2.3 ALKALI CONTRIBUTION TO THE REACTION …….……………………...14 CHAPTER THREE – REVIEW OF SELECTIVE RESEARCH 3.1 INTRODUCTION ............................................................................................... 16 3.2 TESTING FOR POTENTIAL REACTIVITY OF AGGREGATES ................... 16 3.2.1 Petrographic Examination: ASTM C 295 .................................................. 17 3.2.2 Chemical Method: ASTM C 289 .............................................................. 18 3.2.3 Mortar-Bar Method: ASTM C 227 ............................................................ 18 3.2.4 Accelerated Mortar-Bar Method: ASTM C 1260 ...................................... 21 3.2.5 Autoclave Mortar-Bar Methods ................................................................. 22 3.2.6 Concrete Prism Method: CAN/CSA-A23.2-14A (ASTM C 1293) ............ 23 3.2.7 Accelerated Concrete Prism Method (Used in Quebec) ............................. 24 3.2.8 The Duggan Test ....................................................................................... 24 3.2.9 Conclusions of the Survey by Fournier and Bérubé ................................... 24 3.3 ASR MITIGATION MEASURES ...................................................................... 27 3.3.1 Minimizing Alkalis ..................................................................................... 29 3.3.2 Effectiveness of Supplementary Cementious Materials ............................ 30 3.3.3 Control Mechanisms of Supplementary Cementitious Materials ............... 57 3.4 FINAL REMARKS ............................................................................................. 59 CHAPTER FOUR – REVIEW OF INTERNATIONAL EXPERIENCE WITH ASR 4.1 INTRODUCTION ................................................................................................ 60 4.2 RILEM SURVEY ................................................................................................. 60 4.2.1 Specific RILEM Survey Conclusions Related to Testing ........................... 62 4.3 ASR IN AUSTRALIA .......................................................................................... 63 4.3.1 Evaluating the Reactivity of Aggregates ..................................................... 63 4.3.2 ASR Preventive Measures ........................................................................... 68 4.4 ASR IN CHINA ..................................................................................................... 69
ii
4.6.1 Evaluating the Reactivity of Aggregates ..................................................... 70 4.6.2 ASR Preventive Measures ........................................................................... 70 4.6.3 ASR in Beijing ............................................................................................ 70 4.5 ASR IN CANADA ............................................................................................... 71 4.5.1 Evaluating the Reactivity of Aggregates ..................................................... 71 4.5.1.1 “Testing Concrete for AAR in NaOH and NaCl Solutions at 380C and 800C” ............................................................................ 71 4.5.1.2 “Effectiveness of High-Volume Fly Ash Concrete in Controlling Expansion Due to Alkali-Silica Reaction” ..................................... 72 4.5.1.3 Inter-Laboratory Test Evaluation ....................................................... 77 4.5.2 ASR Preventive Measures ........................................................................... 78 4.5.2.1 Field Performance .............................................................................. 78 4.5.2.2 Laboratory Studies ............................................................................. 79 4.5.2.3 Preventive Measures .......................................................................... 80 4.6 ASR IN DENMARK ............................................................................................ 81 4.6.1 Alkali Content of the Concrete .................................................................... 82 4.6.2 Environmental Classification ...................................................................... 82 4.6.3 Aggregate Specification .............................................................................. 82 4.6.4 Concrete Specification ................................................................................ 83 4.7 ASR IN FRANCE ................................................................................................. 84 4.7.1 Evaluating the Reactivity of Aggregates ..................................................... 87 4.7.2 ASR Preventive Measures ........................................................................... 87 4.7.2.1 Alkali Content of the Concrete .......................................................... 89 4.7.2.2 Acceptable Level of Risk and Environmental Conditions ................. 89 4.8 ASR IN THE NETHERLANDS ........................................................................... 94 4.8.1 Evaluating the Reactivity of Aggregates ..................................................... 95 4.8.2 ASR Preventive Measures ........................................................................... 95 4.9 ASR IN KOREA ................................................................................................... 96 4.10 ASR IN NORWAY ............................................................................................. 96 4.10.1 Evaluating the Reactivity of Aggregates ................................................... 96 4.10.1.1 Petrographic Analysis ...................................................................... 97 4.10.1.2 NBRI Accelerated Mortar-Bar Test (C 1260) .................................. 97 4.10.1.3 The Concrete-Prism Test ................................................................. 98 4.10.1.4 Testing Protocol ............................................................................... 98 4.10.2 ASR Preventive Measures ......................................................................... 98 4.11 ASR IN PORTUGAL ......................................................................................... 98 4.12 ASR IN NEW ZEALAND .................................................................................. 99 4.13 ASR IN HONG KONG .................................................................................... 100 4.14 ASR IN TAIWAN ............................................................................................ 100 4.15 ASR IN ITALY ................................................................................................ 101 4.16 ASR IN ICELAND ........................................................................................... 102 4.17 ASR IN THE UNITED KINGDOM................................................................... 102 4.18 ASR IN THE UNITED STATES OF AMERICA ............................................ 106
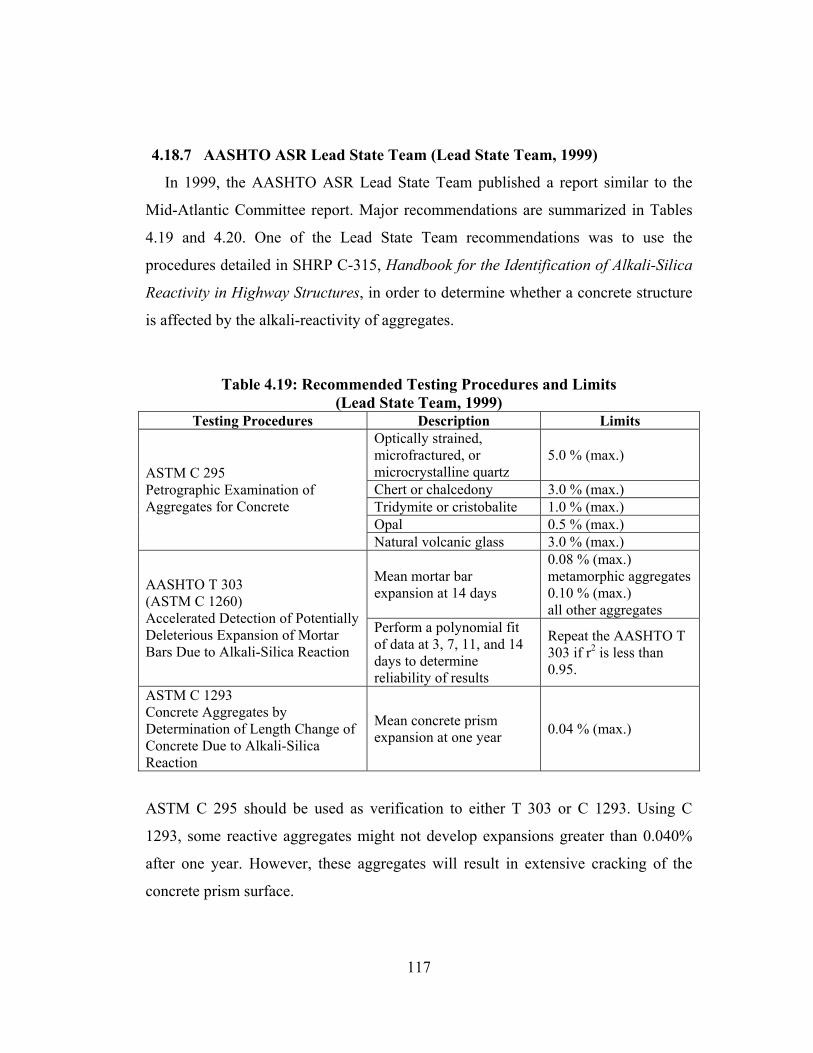
4.18.1 DOT Survey ............................................................................................ 106 4.18.2 Strategic Highway Research Program (SHRP) ....................................... 106 4.18.3 ASR in North Carolina............................................................................. 112
iii
4.18.4 ASR in Virginia........................................................................................ 112 4.18.5 ASR in South Dakota (Polynomial and Avrami) .................................... 114 4.18.6 Mid-Atlantic Regional Technical Committee .......................................... 115 4.18.7 AASHTO ASR Lead State Team............................................................. 117 4.18.8 Portland Cement Association ................................................................... 118 4.18.9 The National Aggregates Association ...................................................... 118 4.18.10 Lithium as a Preventive Measure ........................................................... 120
4.20 FINAL REMARKS ........................................................................................... 122 CHAPTER FIVE – TESTING MATERIALS 5.1 AGGREGATE SELECTION ............................................................................. 123 5.2 OTHER TESTING MATERIALS ...................................................................... 126 CHAPTER SIX – LABORATORY TESTING PROCEDURES 6.1 INTRODUCTION .............................................................................................. 132 6.2 STAGE 1: AGGREGATE TESTING AND PREPARATION .......................... 132 6.3 STAGE 2: TESTING FOR THE POTENTIAL ALKALI-SILICA REACTIVITY OF AGGREGATES ............................................... 135 6.3.1 Aggregate Testing Using ASTM C 227 .................................................... 135 6.3.2 Aggregate Testing Using ASTM C 1260 .................................................. 135 6.3.3 Aggregate Testing Using ASTM C 1293 .................................................. 142 6.4 STAGE 3: ASR MITIGATION ALTERNATIVES ........................................... 147 6.5 SUMMARY OF THE TESTING PROGRAM ................................................... 149 CHAPTER SEVEN – MIXTURE PROPORTIONS 7.1 ASTM C 227 MIXTURE PROPORTIONS ....................................................... 150 7.2 ASTM C 1260 MIXTURE PROPORTIONS ................................................... 151 7.3 ASTM C 1293 MIXTURE PROPORTIONS ................................................... 160 CHAPTER EIGHT – MISCELLANEOUS TESTING RESULTS 8.1 INTRODUCTION .............................................................................................. 169 8.2 PHYSICAL PROPERTY TESTS RESULTS ................................................... 169 8.3 PETROGRAPHIC EXAMINATION, CHEMICAL ANALYSIS AND FIELD PERFORMANCE DOCUMENTATION ............................................ 169 8.4 ASTM C 227 RESULTS OF TESTING .......................................................... 173 CHAPTER NINE – ASTM C 1260 RESULTS AND DISCUSSION 9.1 ASTM C 1260 ..................................................................................................... 178 9.2 ASTM C 1260 PERFORMED NY THE NAA ................................................... 183 9.3 MODIFIED C 1260: EXPANSION UP TO 56 DAYS ...................................... 185 9.4 MODIFIED C 1260: ADJUSTING WATER CONTENT TO ACCOUNT FOR AGGREGATES ABSORPTION ............................................................... 189 9.5 MODIFIED C 1260: USING A POLYNOMIAL FITTING PROCEDURE FOR INTERPRETATION OF RESULTS ......................................................... 193 9.6 MODIFIED C 1260: USING KOLMOGOROV-AVRAMI-MEHL- JOHNSTON’S MODEL FOR INTERPRETATION OF RESULTS ................. 194
iv
9.6.1 K-A-M-J’s Model Applied To NAA Data ................................................ 196 9.6.2 K-A-M-J’s Model Applied To Virginia’s Data ......................................... 297 9.7 MODIFIED C 1260: CHANGING THE MOLARITY OF THE TESTING SOLUTION ........................................................................................................ 298 CHAPTER TEN – ASTM C 1293 RESULTS AND DISCUSSION 10.1 ASTM C 1293 ................................................................................................... 210 10.2 MODIFIED C 1293: PRISMS STORED IN A 1N NaOH SOLUTION AT 800C ........................................................................................................... 217 10.3 MODIFIED C 1293: PRISMS STORED IN A 1N NaOH SOLUTION AT 380C ........................................................................................................... 227 10.4 MODIFIED C 1293: PRISMS STORED OVER WATER, AT 100% R.H. AND 600C ................................................................................................... 235 10.5 SUMMARY: STANDARD AND MODIFIED C 1293 TESTING PROCEDURES ........................................................................................... 241 CHAPTER ELEVEN – INVESTIGATION OF MITIGATION ALTERNATIVES USING ASTM C 1260 11.1 INTRODUCTION ............................................................................................ 243 11.2 EFFECT OF CLASS C FLY ASH USING C 1260 .......................................... 243 11.3 EFFECT OF CLASS F FLY ASH USING C 1260 ............................................ 249 11.4 EFFECT OF SILICA FUME USING C 1260 .................................................. 255 11.5 EFFECT OF GRANULATED SLAG USING C 1260 ...................................... 260 11.6 EFFECT OF CALCINED CLAY USING C 1260 ........................................... 266 11.7 EFFECT OF AIR ENTRAINMNT USING C 1260........................................... 274 11.8 EFFECT OF WATER-CEMENT RATIO USING C 1260 .............................. 279 11.9 EFFECT OF LITHIUM NITRATE (LiNO3) USING C 1260 ............................ 285 11.10 SUMMARY OF MITIGATION ALTERNATIVES INVESTIGATION USING C 1260 .............................................................................................. 292 11.11 EFFECTIVENESS OF THE MITIGATION ALTERNATIVES AT DIFFERENT CEMENT ALKALI CONTENT ............................................. 294 11.11.1 Effect of Class C Fly Ash Coupled with Various Cement Alkali Contents ................................................................................................ 305 11.11.2 Effect of Class F Fly Ash Coupled with Various Cement Alkali Contents ................................................................................................ 306 11.11.3 Effect of Granulated Slag Coupled with Various Cement Alkali Contents ................................................................................................ 307 11.11.4 Effect of Silica Fume Coupled with Various Cement Alkali Contents ................................................................................................ 308 11.11.5 Effect of Air Entrainment Coupled with Various Cement Alkali Contents ................................................................................................ 309 11.11.6 Effect of Calcined Clay Coupled with Various Cement Alkali Contents ................................................................................................ 309 11.12 EVALUATION OF THE MITIGATION ALTERNATIVES C 1260 RESULTS USING K-A-M-J’S MODEL ....................................................... 310 11.13 EVALUATION OF THE MITIGATION ALTERNATIVES C 1260
v
RESULTS USING K-A-M-J’S MODEL ....................................................... 319 11.14 ASTM C 1260 INVESTIGATION OF MITIGATION ALTERNATIVES: SUMMARY ................................................................... 325 11.15 COMPARISON OF THE MITIGATION ALTERNATIVES ........................ 327 CHAPTER TWELVE – INVESTIGATION OF MITIGATION ALTERNATIVES USING ASTM C 1293 12.1 INTRODUCTION ............................................................................................ 331 12.2 INVESTIGATION OF MITIGATION ALTERNATIVES USING C 1293 ................................................................................................ 334 12.2.1 Effect of Class C Fly Ash Using C 1293 ................................................. 334 12.2.2 Effect of Class F Fly Ash Using C 1293 ................................................... 338 12.2.3 Effect of Silica Fume Using C 1293 ....................................................... 342 12.2.4 Effect of Granulated Slag Using C 1293................................................... 346 12.2.5 Effect of Calcined Clay Using C 1293 .................................................... 350 12.2.6 Effect of Lithium Nitrate (Lino3) Using C 1293 ....................................... 355 12.2.7 Effect of Air Entrainmnt Using C 1293 .................................................... 360 12.3 COMPARISON BETWEEN ONE YEAR C 1293 RESULTS AND 13-WEEK ACCELERATED C 1293 RESULTS ............................................ 367 12.4 INVESTIGATION OF MITIGATION ALTERNATIVES USING ACCELERATED C 1293 ................................................................. 368 12.4.1 Effect Class C Fly Ash Accelerated C 1293 ........................................... 369 12.4.2 Effect Class F Fly Ash Accelerated C 1293.............................................. 373 12.4.3 Effect Silica Fume Accelerated C 1293 .................................................. 378 12.4.4 Effect Granulated Slag Accelerated C 1293.............................................. 383 12.4.5 Effect Calcined Clay Accelerated C 1293 ............................................... 388 12.4.6 Effect Lithium Nitrate Accelerated C 1293............................................... 393 12.4.7 Effect Air Entrainmnt Accelerated C 1293 ............................................... 398 12.4.8 Effect of Lowering the Cement Alkali Content Using Accelerated C 1293 ............................................................................... 403 12.4.9 Comparison Betwwn the Effectiveness of the Different Mitigation Alternatives ............................................................................ 408 12.4.10 Summary of the Evaluation of the Mitigation Alternatives Using the Accelerated Concrete-Prism Test ........................................ 411 12.5 INVESTIGATION OF MITIGATION ALTERNATIVES USING ACCELERATED c 1293 RESULTS AND CEMENTS WITH DIFFERENT Na2Oequiv. CONTENTS ...................................................................................... 413 12.6 SUMMARY AND SPECIFICATION ............................................................. 418 CHAPTER THIRTEEN – COMPARISON BETWEEN C 1260, C 1293, PETROGRAPHIC ANALYSIS, AND FIELD INVESTIGATION RESULTS 13.1 INTRODUCTION ............................................................................................ 420 13.2 ASTM C 1260, ASTM C 1293, PETROGRAPHIC EXAMINATION AND FIELD PERFORMANCE ....................................................................... 420 13.3 ASTM C 1260 MITIGATION ALTERNATIVES VS. C 1293 MITIGATION ALTERNATIVES ................................................................... 427
vi
13.4 EVALUATING THE EFFECT OF CEMENT TOTAL ALKALI CONTENT USING ASTM C 1260 AND ACCELERATED C 1293 ............. 435 13.5 EVALUATING THE EFFECTIVENESS OF MITIGATION ALTERNATIVES WITH A 0.80% Na2Oequiv. CEMENT USING ASTM C 1260 AND ACCELERATED C 1293 ................................................ 437
CHAPTER FOURTEEN – GUIDELINES AND RECOMMENDATIONS 14.1 INTRODUCTION ............................................................................................ 438 14.2 PREDICTING THE POTENTIAL ALKALI-SILICA REACTIVITY OF AGGREGATES ......................................................................................... 439 14.2.1 Field Performance Record ....................................................................... 439 14.2.2 Laboratory Testing .................................................................................. 442 14.3 MINIMIZING POTENTIAL FOR ASR-RELATED DAMAGE ..................... 445 14.4 COST OF USING THE DIFFERENT MITIGATION ALTERNATIVES............................................................................................... 448 14.5 CONCLUDING REMARKS ............................................................................ 449 CHAPTER FIFTEEN – SUMMARY OF CONCLUSIONS 15.1 INTRODUCTION ............................................................................................ 452 15.2 ASSESSING AGGREGATE REACTIVITY ................................................... 452 15.3 EFFECTIVE MITIGATION ALTERNATIVES .............................................. 456 15.4 FINAL REMARKS .......................................................................................... 463 APPENDIX A – EFFECT OF CHANGING THE CURING SOLUTION MOLARITY ON THE RESULTS OF ASTM C 1260 ...................... 464 APPENDIX B – VARIABLES FOR THE K-A-M-J MODEL USING C 1260 EXPANSIONS UP TO 28 DAYS......................................................... 473 APPENDIX C - EFFECTIVE LEVELS OF CEMENT REPLACEMENT
WITH CLASS C FLY ASH, CLASS F FLY ASH, AND SILICA FUME EVALUATED USING THE K-M-A-J’S MODEL FOR A6-NM, A4-ID, A2-WY, C2-SD, AND B4-VA .……………...480
APPENDIX D – PETROGRAPHIC ANALYSIS AND FIELD PERFORMANCE DOCUMENTATION OF AGGREGATES ...................................... 484 REFERENCES ........................................................................................................... 501
vii
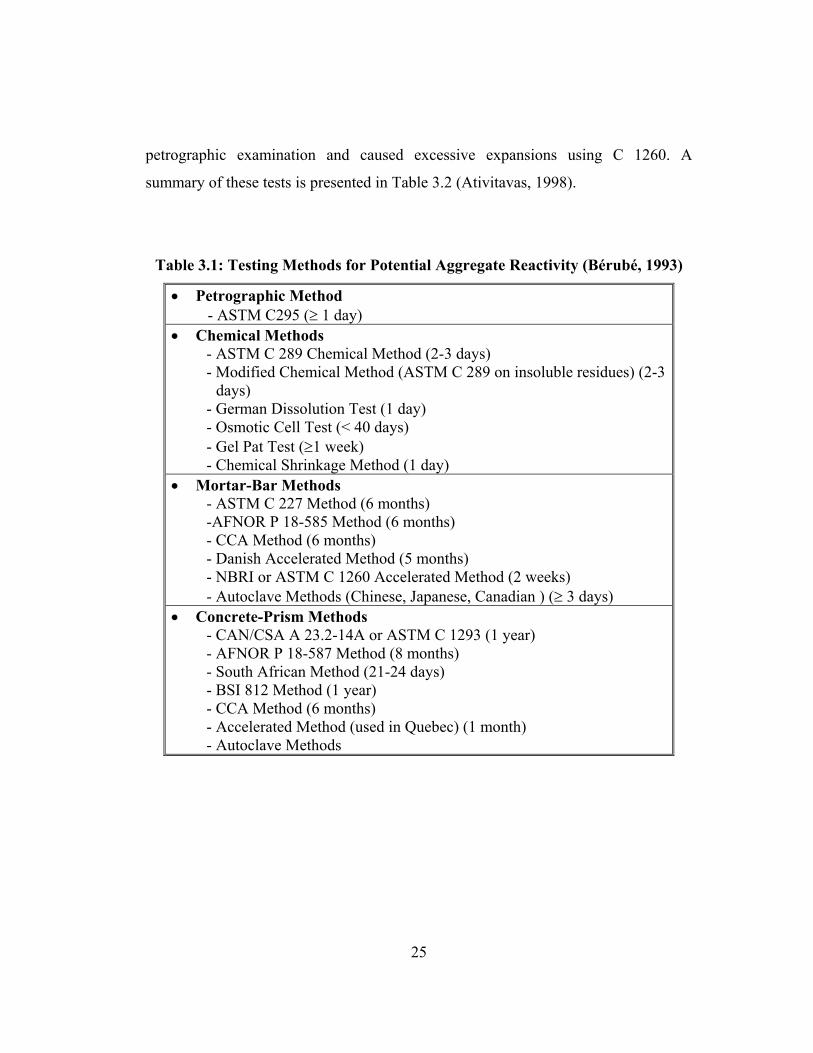
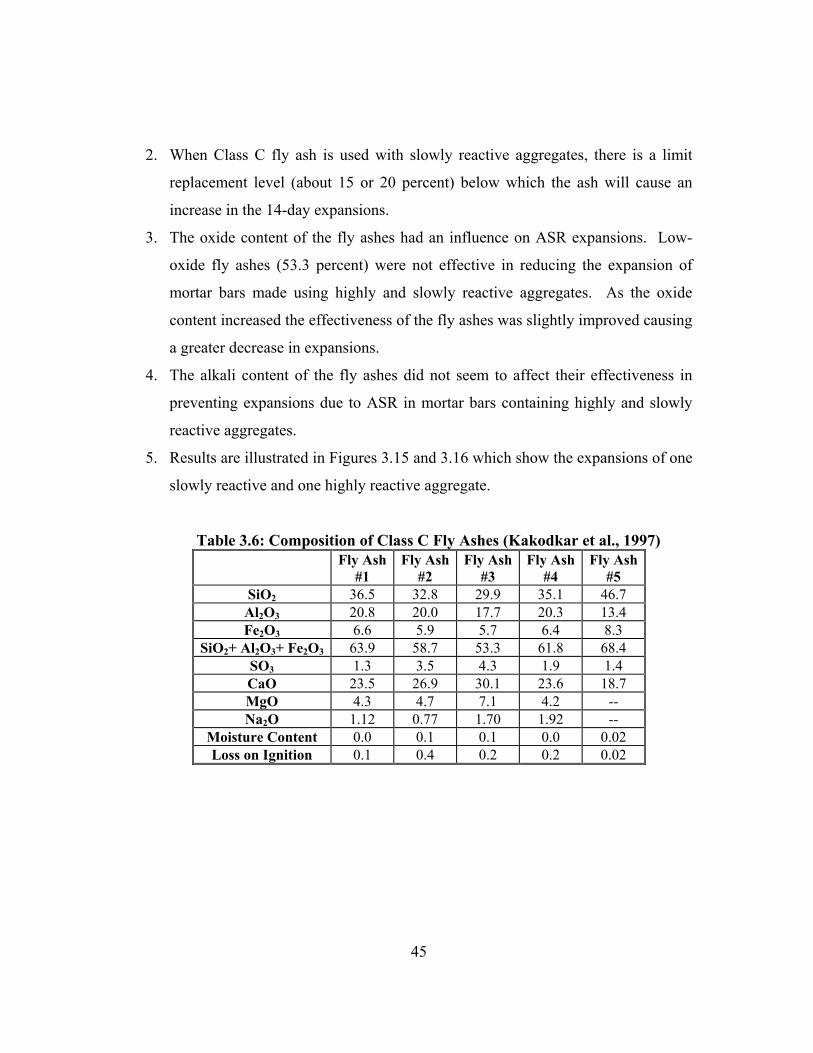
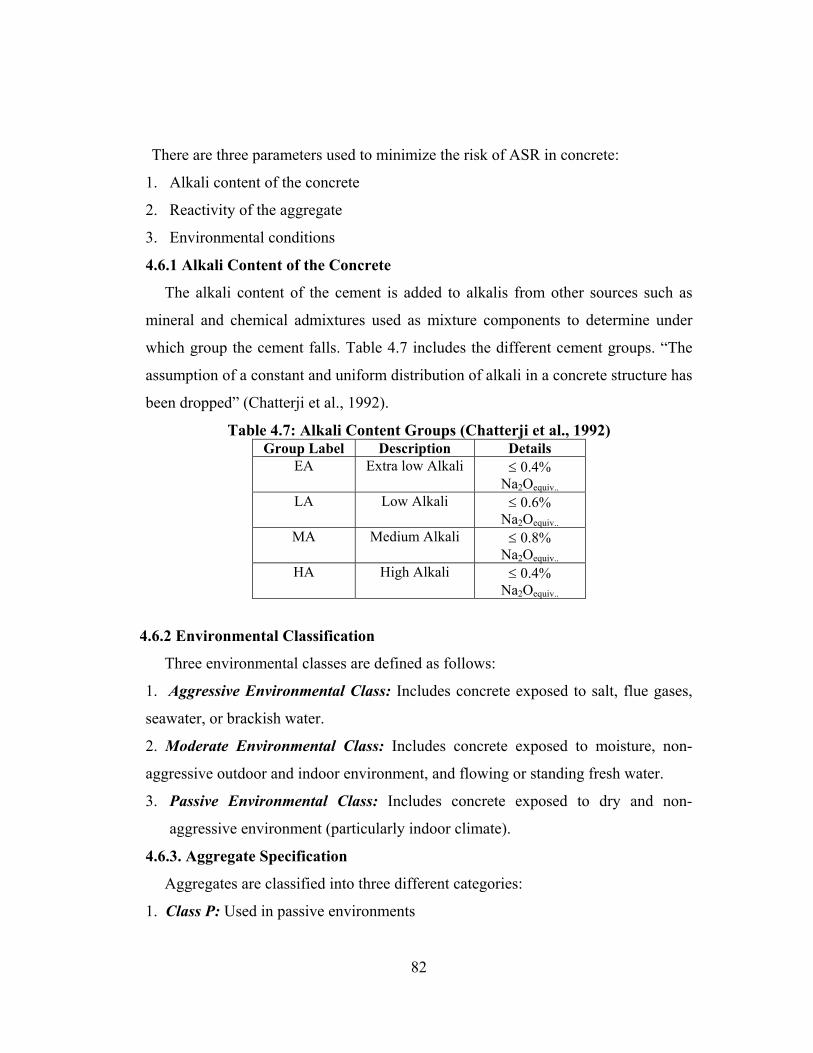
LIST OF TABLES Table Page 3.1 Testing Methods for Potential Aggregate Reactivity ....................................................25 3.2 Most Widely Used Aggregate Tests for Identifying ASR Reactivity...........................26 3.3 Alkali Contribution from Fly Ash: Concrete with Cristobalite.....................................38 3.4 Chemical Compositions of Three Investigated Ashes..................................................39 3.5 Tallowa Dam Cement and Fly Ash Properties ..............................................................42 3.6 Composition of Class C Fly Ashes (Kakodkar et al., 1997)..........................................45 3.7 Composition of Selective Natural Pozzolans Tested By Johnston et al ........................48 3.8 Properties of Investigated Fly Ashes (Chen et al. 1993) ...............................................51 3.9 Properties of Investigated Silica Fume, Natural Pozzolan, and Slag ............................51 3.10 Effective Levels of Replacements for Materials Effective in Mitigating the ASR Damage……………….. .............................................................................................52 3.11 Example for Specifying Fly Ash with Reactive Aggregates.......................................56 3.12 Slag Specification Example.........................................................................................57 4.1 Survey Results (published by RILEM in 1996) ..........................................................61 4.2 Classification of Aggregates by Different Test Methods (Shayan, 1992)...................66 4.3 Maximum Alkali Content (Tang et al., 1996) .............................................................82 4.4 Properties of Aggregates Investigated (Fournier, Bilodeau, and Malhotra; 1994)......75 4.5 Proposed Limits for Different Testing Conditions (Fournier et al., 1994)..................76 4.6 Recommended Procedures and Limits to Detect Alkali-Reactive Aggregates (Berube, 1992) ..........................................................................................79 4.7 Alkali Content Groups (Chatterji et al. 1992) ...............................................................82 4.8 Sand Classification (Chatterji et al. 1992).....................................................................83 4.9 Coarse Aggregate Classification (Chatterji et al. 1992) ................................................83 4.10 Specifications for Concrete (Chatterji et al. 1992) ......................................................84 4.11 Summary of the Different AFNOR Testing Procedures (Le Roux et al., 1996) .........88 4.12 Level of Prevention as Determined by the Category and Exposure of the Structure (Le Roux et al., 1996) ..................................................................................................89 4.13 Methodology Used for Level B Prevention (Le Roux et al., 1996) ............................90 4.14 Aggregate Sources Investigated Throughout the Study (Starks, 1993) ....................108 4.15 Results of the C 1260 Test (Starks, 1993).................................................................110 4.16 Investigated Aggregate Source, Field Performance, & C 227 Results (Lane, 1994) 113 4.17 Recommended Testing Procedures and Limits (Mid-Atlantic RTC, 1993) ..............116 4.18 Recommended Mitigation Alternatives and Methods of Validation (RTC 1993) ...116 4.19 Recommended Testing Procedures and Limits (Lead State Team, 1999).................117 4.20 Recommended Mitigation Alternatives and Methods of Validation (Lead State Team, 1999) .............................................................................................................118 4.21 C 1260 and C 1293 Results of Testing Performed by NAA (NAA, 1999) ...............121 5.1 Aggregates Representing the Complete Spectrum of ASR Reactivity......................123 5.2 Aggregates and Aggregate Sources Selected for the Study ......................................125 5.3 Chemical and Physical Properties of Type I/II Cement with High Alkali Content...127 5.4 Chemical and Physical Properties of Type I/II Cement with Low Alkali Content ...128 5.5 Chemical Properties of Granualted Slag ...................................................................128 5.6 Chemical and Physical Properties of Calcined Clay .................................................129 5.7 Chemical and Physical Properties of the Class C Fly Ash ........................................130
viii
5.8 Chemical and Physical Properties of the Class F Fly Ash ........................................130 5.9 Properties of Chemical Admixtures ..........................................................................131 6.1 Aggregate Testing Performed....................................................................................132 6.2 ASTM C 227 and C1260 Aggregate Grading Requirements ....................................133 6.3 ASTM C 1293 Coarse Aggregate Grading Requirements ........................................133 6.4 Aggregates and Test Combinations Used to Investigate Mitigation Alternatives.....148 6.5 Summary of the Testing Program..............................................................................149 7.1 Proportions and Mortar Properties for C 227 Mixtures.............................................150 7.2 Mortar Mixtures Used for ASTM C 1260, C 1260M1, C 1260M2, C 1260 M3, AND C 1260M4........................................................................................................151 7.3 Mortar Mixtures Used to Evaluate the Effect of Class C Fly Ash ............................152 7.4 Mortar Mixtures Used to Evaluate the Effect of Class F Fly Ash.............................153 7.5 Mortar Mixtures Used to Evaluate the Effect of Silica Fume ...................................153 7.6 Mortar Mixtures Used to Evaluate the Effect of Granulated Slag ............................154 7.7 Mortar Mixtures Used to Evaluate the Effect of Lithium Nitrate .............................155 7.8 Mortar Mixtures Used to Evaluate the Effect of Entrained Air ................................156 7.9 Mortar Mixtures Used to Evaluate the Effect Calcined Clay ....................................157 7.10 Mortar Mixtures Used to Evaluate the Effect of W/C...............................................158 7.11 Mortar Mixtures Used to Count for the Absorption of Aggregates ..........................159 7.12 Concrete Mix Proportions for ASTM C 1293 and Modified C 1293........................161 7.13 Concrete Mixtures Used to Investigate the Effect of Air Entrainment .....................162 7.14 Concrete Mixtures Used to Investigate the Effect of Silica Fume ............................163 7.15 Concrete Mixtures Used to Investigate the Effect of Class C Fly Ash .....................164 7.16 Concrete Mixtures Used to Investigate the Effect of Class F Fly Ash......................165 7.17 Concrete Mixtures Used to Investigate the Effect of Granulated Slag......................166 7.18 Concrete Mixtures Used to Investigate the Effect of Calcined Clay.........................167 7.19 Concrete Mixtures Used to Investigate the Effect of Lithium Nitrate.......................168 8.1 Physical Properties of Aggregates Investigated ........................................................170 8.2 Chemical Analysis of Aggregates .............................................................................171 8.3 Summary of Available Documentation on Aggregates Investigated ........................172 8.4 ASTM C 227 Expansion Results for Aggregates investigated..................................173 9.1 ASTM C 1260 Expansion Test Results.....................................................................179 9.2 ASTM C 1260 Performed by NAA...........................................................................183 9.3 Differences Between NAA Results and Results Generated in this Study .................183 9.4 Variations from the Mean of the NAA and the C 1260 Results Generated Through this Study ..................................................................................184 9.5 Expansions up to 56 days in 1N NaOH Curing Solution ..........................................185 9.6a C 1260 Expansions for Mixtures Adjusted for Aggregate Absorption .....................190 9.6b Expansions of Category A Aggregates (Different Molarity Solutions) ....................199 9.7 Expansions of Category B, C, & D Agg. (Different Molarity Solutions) .................200 9.8 Expansions of Category E Aggregates (Different Molarity Solutions).....................201 9.9 14-Day Expansions of the Different Testing Solutions.............................................202 9.10 Effect of Na2Oequiv. Content on ASR Using ASTM C 1260 ......................................208 10.1 ASTM C 1293 Results for Category A Aggregates ..................................................211 10.2 ASTM C 1293 Results for Category B, C, & D Aggregates ............................................211 10.3 Standard ASTM C 1293 Results for Category E Aggregates ..................................212
ix
10.4 Expansions of Concrete Prisms Stored in 1N NaOH Solution at 80oC for Category A Aggregates ................................................................................................................217 10.5 Expansions of Concrete Prisms Stored in 1N NaOH Solution at 80oC for Category B, C, & D Aggregates ...............................................................................................218 10.6 Expansions of Concrete Prisms Stored in 1N NaOH Solution at 80oC for Category E Aggregates ................................................................................................................218 10.7 Summary of Generated Results: ASTM C 1293 vs 1N NaOH at 800C Using Respectively 0.040% at One-year and 0.040% at Four-Week as Failure Criteria ...223 10.8 Summary of Generated Results: ASTM C 1293 vs 1N NaOH at 800C Using Respectively 0.040% at One-year and 0.060% at 1-week as Failure Criteria .........225 10.9 Expansions of Concrete Prisms Stored in 1N NaOH Solution at 38oC for Category A Aggregates ................................................................................................................227 10.10 Expansions of Concrete Prisms Stored in 1N NaOH Solution at 38oC for Category B, C, & D Aggregates ...............................................................................................228 10.11 Expansions of Concrete Prisms Stored in 1N NaOH Solution at 38oC for Category E Aggregates ................................................................................................................228 10.12 Summary of Generated Results: ASTM C 1293 vs 1N NaOH at 800C Using Respectively 0.040% at One-year and 0.040% at 26-week as Failure Criteria .......233 10.13 Expansions of Category A Aggregate Concrete Prisms Stored Over Water, at 100% R.H., and 600C ......................................................................235 10.14 Expansions of Category B, C, & D Aggregate Concrete Prisms Stored Over Water, at 100% R.H., and 600C...........................................................................................235 10.15 Expansions of Category E Aggregate Concrete Prisms Stored Over Water, at 100% R.H., and 600C...........................................................................................236 10.16 Summary of Generated Results: ASTM C 1293 vs C 1293 at 600C Using Respectively 0.040% at One-year and 0.040% at 13-week as Failure Criteria .......239 10.17 Expansion Limits for the Different C 1293 Procedures ...........................................241 10.18 Aggregate’s Reactivity Classification for the Different C 1293 Procedures............241 10.19 Summary Results of the Different C 1293 Procedures.............................................242 11.1 C 1260 Expansions Using Class C Fly Ash .............................................................244 11.2 Effect of Class C Fly Ash on the 14-Day C 1260 Expansions.................................249 11.3 C 1260 Expansions Using Class F Fly Ash..............................................................250 11.4 Effect of Class F Fly Ash on the 14-Day C 1260 Expansions .................................254 11.5 C 1260 Expansions Using Silica Fume ....................................................................255 11.6 Effect of Silica Fume on the 14-Day C 1260 Expansions........................................260 11.7 C 1260 Expansions Using Granulated Slag..............................................................261 11.8 Effect of Granulated Slag on the 14-Day C 1260 Expansions .................................266 11.9 C 1260 Expansions Using Calcined Clay.................................................................267 11.10 Category E C 1260 Expansions Using Calcined Clay..............................................272 11.11 Effect of Calcined Clay on the 14-Day C 1260 Expansions ....................................273 11.12 C 1260 Expansions Using Air Entrainment .............................................................274 11.13 Effect of Air Entrainment on the 14-Day C 1260 Expansions .................................279 11.14 C 1260 Expansions Using Various Water-Cement Ratios .......................................280 11.15 C 1260 Expansions Using Different LiNO3 Dosages...............................................286 11.16 Effect of LiNO3 on the 14-Day C 1260 Expansions ................................................291 11.17 Effectiveness of the Mitigation Alternatives Using the
x
14-day of 0.10% Criteria ..........................................................................................293 11.18 Expansion Results of A6-NM Used with Mitigation Alternatives at Different Cement Alkali Content.............................................................................295 11.19 Exposure Solution Normalities Investigated and their Corresponding Na2Oequiv. Content and Recommended Expansion Limits .........................................................305 11.20 Effectiveness of Class C Fly Ash at Different Cement Alkali Contents with the Highly Reactive Aggregate A6-NM (0.92% C1260, 14-Day)............................306 11.21 Effectiveness of Class F Fly Ash at Different Cement Alkali Contents with the Highly Reactive Aggregate A6-NM (0.92% C1260, 14-Day)............................307 11.22 Effectiveness of Granulated Slag at Different Cement Alkali Contents with the Highly Reactive Aggregate A6-NM (0.92% C1260, 14-Day)............................308 11.23 Effectiveness of Silica Fume at Different Cement Alkali Contents with the Highly Reactive Aggregate A6-NM (0.92% C1260, 14-Day)............................308 11.24 Effectiveness of Air Entrainment at Different Cement Alkali Contents with the Highly Reactive Aggregate A6-NM (0.92% C1260, 14-Day)............................309 11.25 Effectiveness of Calcined Clay at Different Cement Alkali Contents with the Highly Reactive Aggregate A6-NM (0.92% C1260, 14-Day)............................310 11.26 Mitigation Alternatives Results Using K-A-M-J’s Ln (k) = -6 ................................318 11.27 Predicted Levels of Replacement Using the K-M-A-J’s Model...............................319 11.28 C 1260 Expansions of Some Predicted Values of K-M-A-J’s Model .....................320 11.29 Effective ASR Mitigation Alternatives When Evaluating Aggregates Using ASTM C 1260 with 1N NaOH Solution (1.5% Na2Oequiv.).......................................327 11.30 Effective ASR Mitigation Alternatives for Highly Reactive Aggregate A6-NM (C1260 14-day of 0.92%) Evaluated Using C 1260 with 0.75N, 0.50N, & 0.35N NaOH Solutions .................................................................326 12.1 Aggregates Used for Mitigation Alternative Investigation ......................................333 12.2 C 1293 Expansions Using Class C Fly Ash .............................................................335 12.3 Effect of Class C Fly Ash on ASR Using C 1293....................................................338 12.3a C 1293 Expansions Using Class F Fly Ash ..............................................................341 12.4 Effect of Class F Fly Ash on ASR Using C 1293 ....................................................342 12.5 C 1293 Expansions Using Silica Fume ....................................................................343 12.6 Effect of Silica Fume on ASR Using C 1293...........................................................346 12.7 C 1293 Expansions Using Granulated Slag..............................................................347 12.8 Effect of Granulated Slag on ASR Using C 1293 ....................................................350 12.9 C 1293 Expansions Using Granulated Slag..............................................................351 12.10 Effect of Calcined Clay on ASR Using C 1293 .......................................................354 12.11 C 1293 Expansions Using Lithium Nitrate ..............................................................356 12.12 Effect of Lithium Nitrate on ASR Using C 1293 .....................................................359 12.13 C 1293 Expansions Using Air Entrainment .............................................................363 12.14 Effect of Air Entrainment on ASR Using C 1293....................................................364 12.15 Additional C 1293 Expansions Using Air Entrainment ...........................................365 12.16 Accelerated C 1293 Expansions Using Class C Fly Ash .........................................372 12.17 Effect of Class C Fly Ash on ASR Using Accelerated C 1293................................373 12.18 Accelerated C 1293 Expansions Using Class F Fly Ash..........................................374 12.19 Effect of Class F Fly Ash on ASR Using Accelerated C 1293 ................................378 12.20 Accelerated C 1293 Expansions Using Silica Fume ................................................379
xi
12.21 Effect of Silica Fume on ASR Using Accelerated C 1293.......................................383 12.22 Accelerated C 1293 Expansions Using Granulated Slag..........................................384 12.23 Effect of Granulated Slag on ASR Using Accelerated C 1293 ................................388 12.24 Accelerated C 1293 Expansions Using Granulated Slag..........................................389 12.25 Effect of Calcined Clay on ASR Using Accelerated C 1293 ...................................393 12.26 Accelerated C 1293 Expansions Using Lithium Nitrate ..........................................394 12.27 Effect of Lithium Nitrate on ASR Using Accelerated C 1293 .................................398 12.28 Accelerated C 1293 Expansions Using Air Entrainment .........................................399 12.29 Effect of Air Entrainment on ASR Using Accelerated C 1293 ................................403 12.30 Accelerated C 1293 Expansions Using Different Cement Na2Oequiv. Contents ........404 12.31 Effect of Na2Oequiv. Content on ASR Using Accelerated C 1293 .............................408 12.32 Effectiveness of the Mitigation Alternatives Using the Accelerated C 1293 Criteria..412 12.33 Accelerated C 1293 Expansions of Aggregate A6-NM Using Different Mitigation Alternatives and 0.80% Na2Oequiv. Content Cement................................414 12.34 Effectiveness of Different Mitigation Alternatives Using the Accelerated C 1293 with Aggregate A6-NM and 0.80% Na2Oequiv. Cement ............417 12.35 Effective ASR Mitigation Alternatives When Evaluating Aggregates Using Accelerated C 1293 at 600C ........................................................418 12.36 Effective ASR Mitigation Alternatives for Highly Reactive Aggregate A6-NM (Accelerated C 1293 13-week of 0.407%) Evaluated Using Accelerated C 1293 (600C) with 0.80% Na2Oequiv. Cement ......................................419 13.1 C 1260 14-Day Expansions and C 1293 52-Week Expansions ...............................421 13.2 Expansion Limits Used to Evaluate Effectiveness of Mitigation Alternatives ........427 13.3 Effectiveness of Mitigation Alternatives with Aggregate A4-ID Evaluated Using C 1260 and Accelerated C 1293....................................................428 13.4 Effectiveness of Mitigation Alternatives with Aggregate A2-WY Evaluated Using C 1260 and Accelerated C 1293....................................................429 13.5 Effectiveness of Mitigation Alternatives with Aggregate C2-SD Evaluated Using C 1260 and Accelerated C 1293....................................................430 13.6a Effect of Na2Oequiv. Content on ASR Using ASTM C 1260 .....................................436 13.6b Effect of Na2Oequiv. Content on ASR Using Accelerated C 1293 .............................436 13.7 Effective ASR Mitigation Alternatives for Highly Reactive Aggregate A6-NM (C1260 14-day of 0.92%) Evaluated Using a Cement Alkali Content of 0.80% Na2Oequiv. ..438 14.1 Expansion Limits for Identifying Potentially Alkali-Silica Reactive Aggregates....444 14.2 Determination of the Degree of Alkali-Silica Reactivity of Aggregates..................444 14.3 Cost of Materials Used Throughout Investigation ...................................................448 14.4 Cost of Using the Mitigation Alternatives for a Cementitious Material Content of 710 lb/yd3................................................................................................449 15.1 Effectiveness of the Mitigation Alternatives Using the 14-Day C 1260 Test with 0.10% Criteria .................................................................456 15.2 Effective ASR Mitigation Alternatives for Highly Reactive Aggregate A6-NM (C1260 14-Day Expansion of 0.92%) Evaluated with 0.75N, 0.50N, & 0.35N NaOH Solutions .........................................................457 15.3 Effectiveness of the Mitigation Alternatives Using the Accelerated C 1293 Criteria......................................................................................459 15.4 Effective ASR Mitigation Alternatives ....................................................................461
xii
15.5 Effective ASR Mitigation Alternatives for Highly Reactive Aggregate A6-NM (ASTM C 1293 One-year Expansion of 0.411%) Using 0.80% Na2Oequiv. Cement .462
xiii
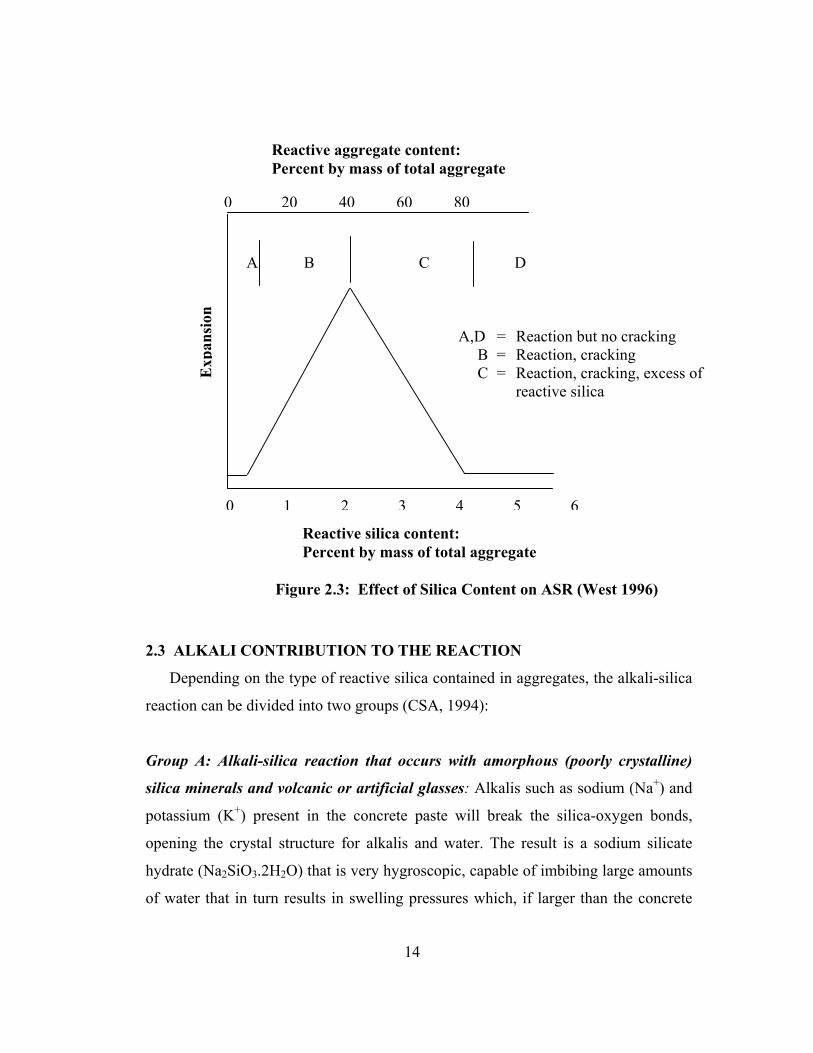
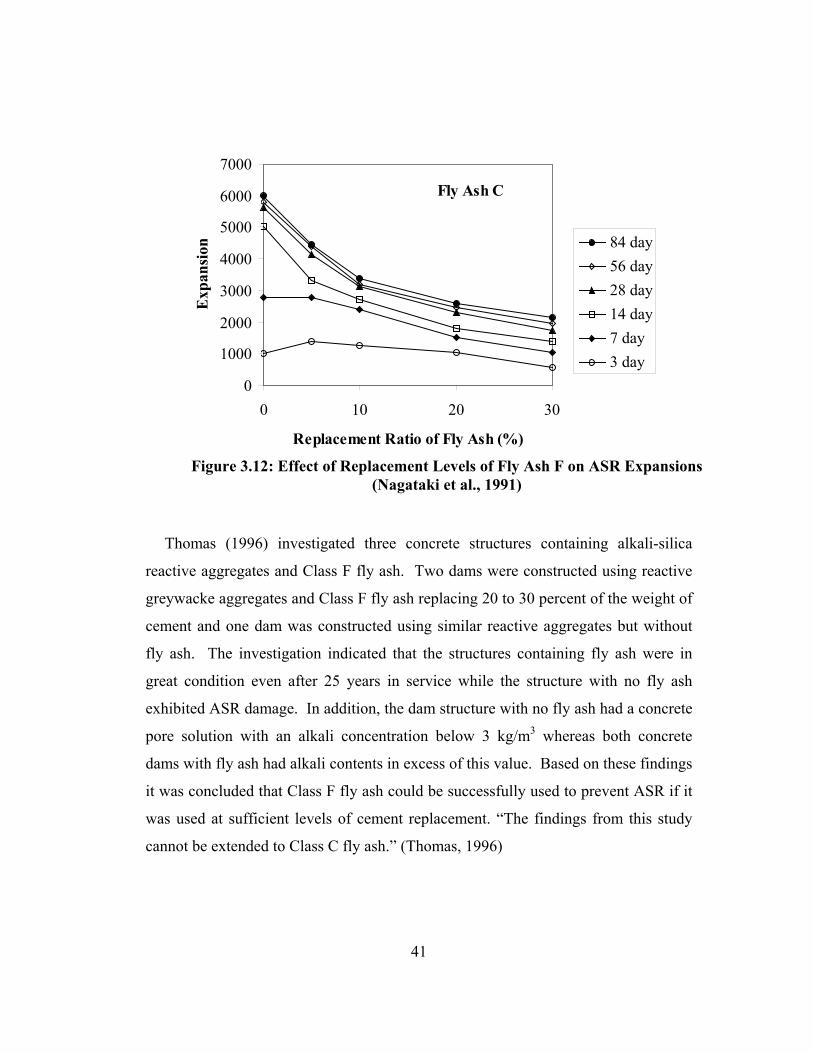
LIST OF FIGURES Figure Page 1.1 Results of the DOT Survey ...........................................................................................2 2.1 Silicon Tetrahedron (Silica) ........................................................................................12 2.2 Quartz Structure (SiO2) (Crystalline Structure) ............................................................12 2.3 Effect of Silica Content On ASR...................................................................................14 3.1 Effect of alkali content (% Na2Oeq) in the ASTM C 227 Mortar-Bar Method (Siliceous limestone from Ottawa, Ontario).................................................................19 3.2 Effect of water-cement ratio in the ASTM C 227 Mortar-Bar Method (Siliceous Limestone from Trois-Rivieres, Quebec) ....................................................................20 3.3 Comparison Between ASTM C 1260 and ASTM C 1293 Results Illustrating the Severity of ASTM C 1260 .....................................................................................21 3.4 Effect of Aggregate Reactivity and Percent Fly Ash Replacement on the Effective Alkali Contribution from Fly Ash ................................................................33 3.5 Effect of Aggregate Reactivity Effective Alkali Contribution from Fly Ash ...............34 3.6 Using 25% Class F Fly Ash to Prevent Cracking of Concrete Made with a Moderately Reactive Aggregate (flint).........................................................................35 3.7 Effect of Using 6% Class F Fly Ash with a Moderately Reactive Aggregate (flint) 35 3.8 Effect of Class F Fly Ash on Cracking of Concrete Made with a Highly Reactive Aggregate ......................................................................................................36 3.9 Effect of Class F Fly Ash on Expansions of Concrete Containing a Highly Reactive Aggregate (Cristobalite) ................................................................................38 3.10 Effect of Replacement Levels of Fly Ash A on ASR Expansions ..............................40 3.11 Effect of Replacement Levels of Fly Ash B on ASR Expansions...............................40 3.12 Effect of Replacement Levels of Fly Ash F on ASR Expansions...............................41 3.13 Expansion Curves for Concrete Cores Taken from Several Locations of the Dam and Stored in a 1M NaOH Solution at 400C..................................................43 3.14 ASTM C 1260 vs. Replacement Levels of Cement with Class F Fly Ash..................44 3.15 Comparison of 14-Dya Expansions of Mortar Bars Made with the Different Fly Ashes and a Slowly Reactive Aggregate................................................46 3.16 Comparison of 14-Dya Expansions of Mortar Bars Made with the Different Fly Ashes and a Highly Reactive Aggregate ................................................46 3.17 Effect of Class F Fly Ash on the 14-Day Expansions of Mortar Bars Made with a Highly Reactive Aggregates and Tested Using ASTM C 1260 ......................47 3.18 Effect of Selective Natural Pozzolans on the 14-Day Expansions of Mortar Bars Made with a Highly Reactive Aggregates and Tested Using C 1260................49 3.19 Expansions of Concrete Prisms Made Using a Cement with 1.13% alkalis, a Reactive Aggregate (Spratt), and 58% Class F Fly Ash: Prisms Stored in a 1M NaOH Solution at 380C.................................................................................50 3.20 C 227 Expansion after 6 Months for Specimens Made with Multiple Replacement Levels ...................................................................................................54 4.1 Decision Chart for Determining the Potential ASR of ConcreteAggregates .................81 4.2 Flowchart of Testing Procedures Used to Evaluate Aggregate Reactivity....................94 4.3 Failure Criteria for Determining Safe Cement Alkali Level for
xiv
Deleterious Aggregates ..............................................................................................111 4.4 Flow Chart Suggested by PCA....................................................................................119 5.1 Locations of the Selected Aggregate Sources ...........................................................124 6.1 Aggregate Washing Over #100 Sieve .......................................................................134 6.2 Sieve Sizes Required For C 227 and C 1260 Mortar Bars ..........................................134
6.3 Mortar Bars Cured for 24 Hours in a Moisture Room, Immediately after Formation(C 227 and C 1260)……………… ....................................................................................136
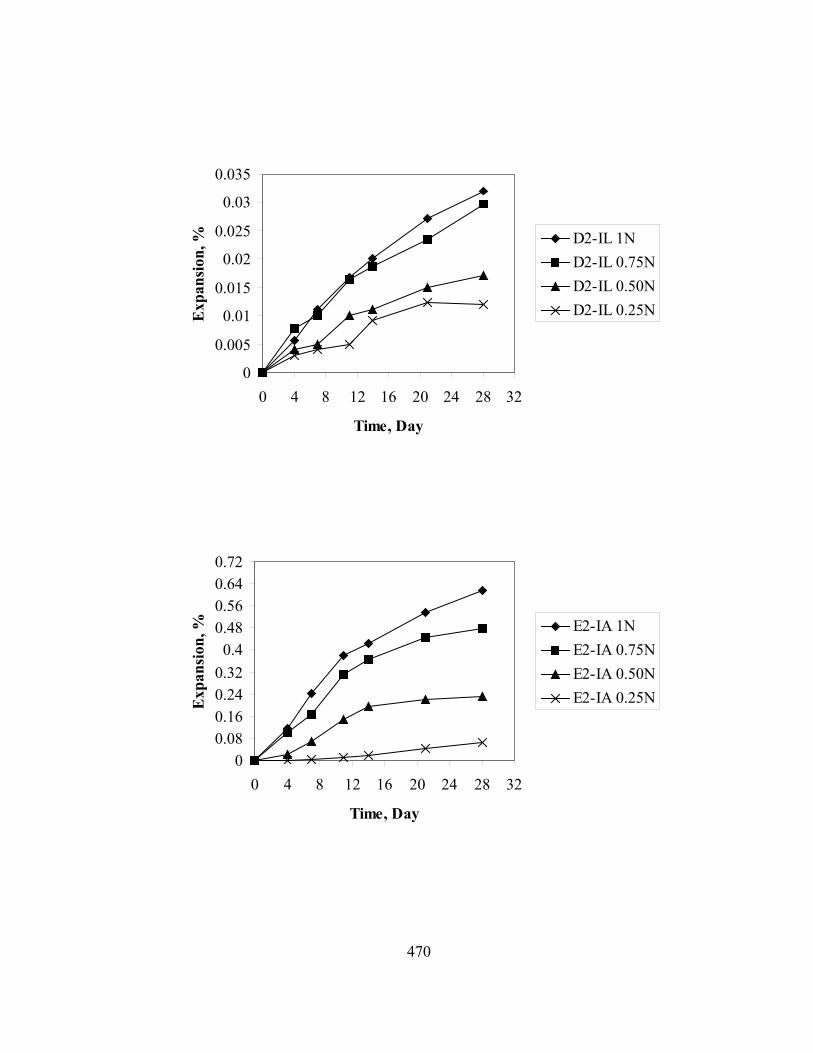
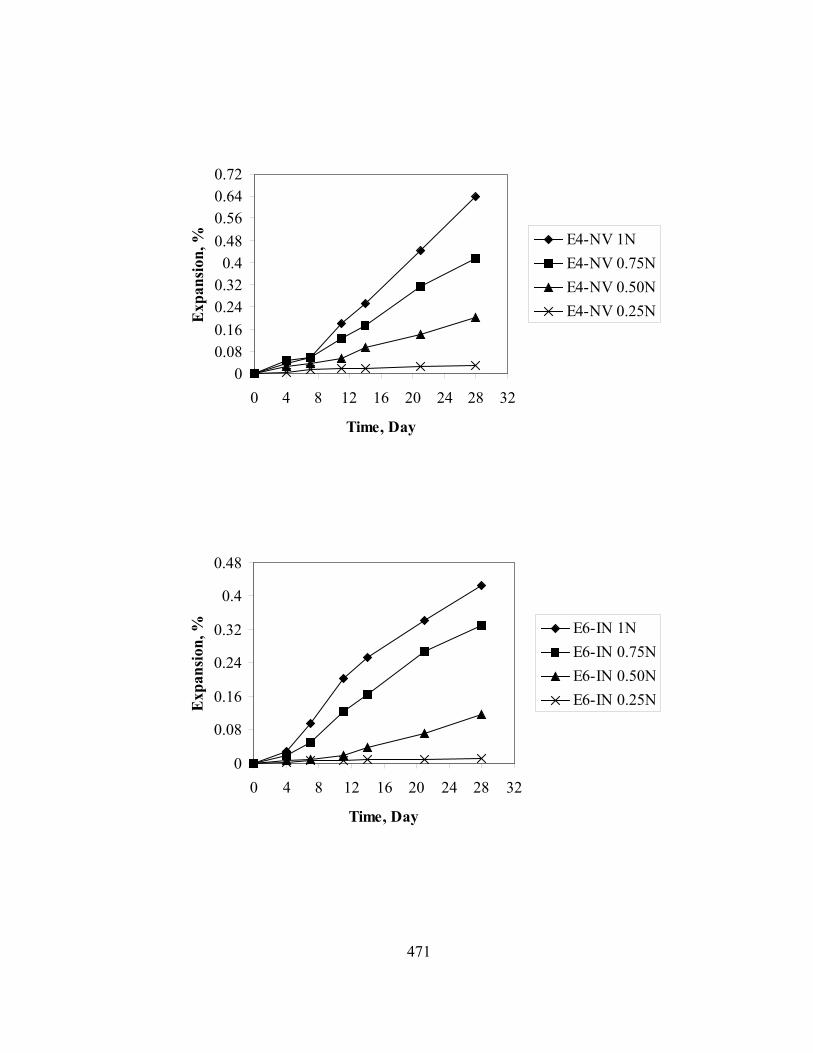
6.4 Mortar Bars Stored over Sater, in Containers with No Sicks, in an Environmental Room at 380C …………………………...…………………………………………..136
6.5 First Step in Performing ASTM C 227........................................................................137 6.6 Second Step in Performing ASTM C 227 ...................................................................138 6.7 Mortar Bars Stored in a 1N NaOH Solution Used for C 1260 ....................................140 6.8 Mortar Bars Stored in an Oven at 800C, in 1N NaOH Solution (C 1260
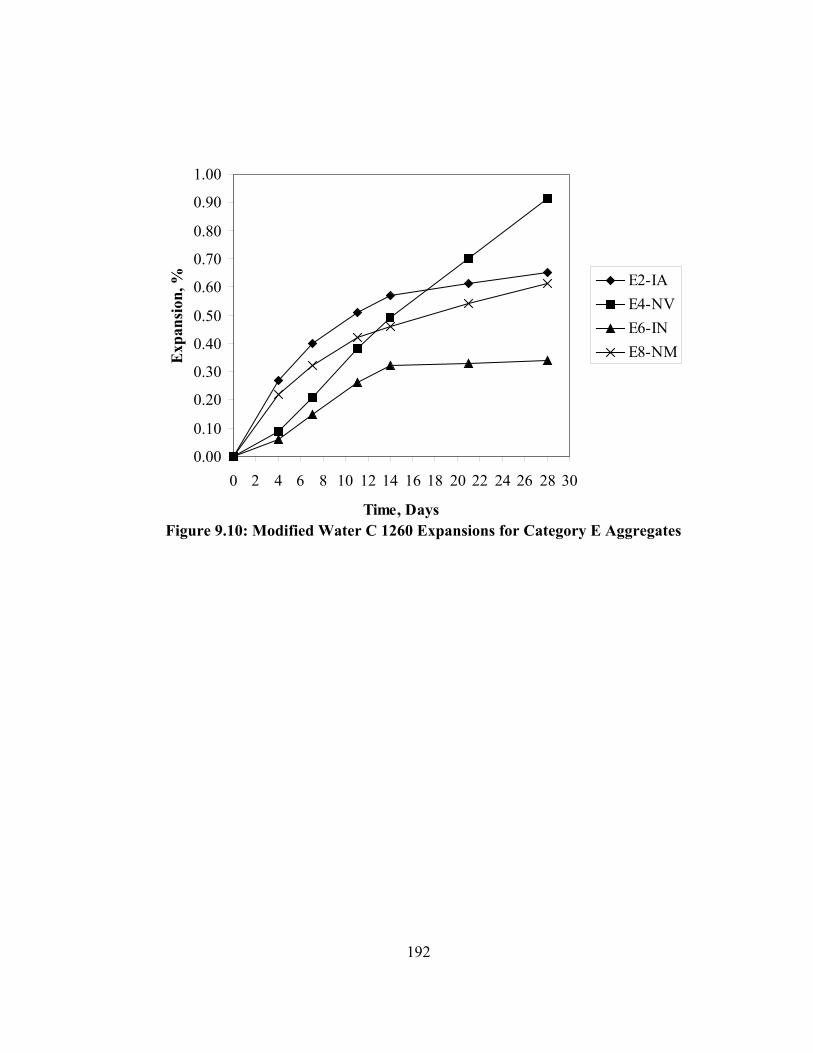
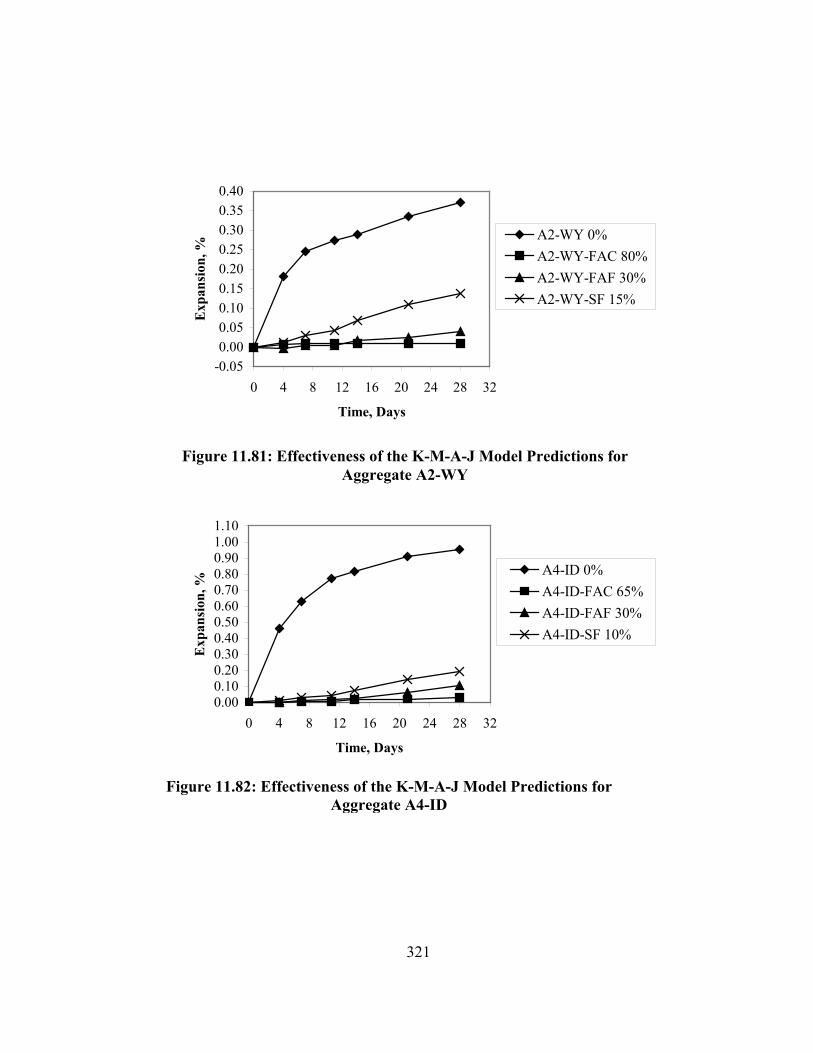
Requirements) …………………………………………………………………140 6.9 ASTM C 1260 Procedures ..........................................................................................141 6.10 Concrete Prisms Stored Over Water, in 6-gal Buckets with Wicks, in an Environmental Room at 380C...................................................................................143 6.11 C 1293 Buckets Stored for 16 h in a Moisture Room before Measuring Scheduled Expansion Eeadings..............................................................144 6.12 Top View of a C 1293 Bucket; Concrete Prisms over Water; Wicks on the Sides; Seal Cover ...............................................................................144 6.13 Concrete Prism Being Measured for Expansion........................................................144 6.14 Aggregate Preparation for C 1293.............................................................................145 6.15 C 1293 Concrete Prism Procedures...........................................................................146 8.1 ASTM C 227 Results for Category A Aggregates .....................................................174 8.2 ASTM C 227 Results of Category B, C, & D Aggregates .........................................174 8.3 ASTM C 227 Results for Category E Aggregates......................................................175 9.1 ASTM C 1260 Expansions for Category A Aggregates ............................................180 9.2 ASTM C 1260 Expansions for Category B, C, & D Aggregates ...............................180 9.3 ASTM C 1260 Expansions for Category E Aggregates .............................................181 9.4 Comparison Between the 14-Day Expansions Generated for the ASTM C 1260 and for the 56-Day Extended ASTM C 1260.............................................................186 9.5 56-Day C 1260 Results for Category A Aggregates ..................................................187 9.6 56-Day C 1260 Results for Category B, C, & D Aggregates.....................................187 9.7 56-Day C 1260 Results for Category E Aggregates...................................................188 9.8 Modified Water C 1260 Expansions for Category A Aggregates ..............................191 9.9 Modified Water C 1260 Expansions for Category B, C, & D Aggregates.................191 9.10 Modified Water C 1260 Expansions for Category E Aggregates ............................192 9.11 Polynomial Regression Coefficients A1 vs. A2 ........................................................193 9.12a Avrami’s Exponent M versus ln(k) Illustrating Avrami’s Equation ......................195 9.12b K-A-M-J’s Model Results For NAA C 1260 Data.................................................196 9.12c K-A-M-J’s Model Results For Virginia Aggregates ..............................................197 9.13 14-Day Expansion Comparison Between Different Curing Solutions, Category A Aggregates .....................................................................................................203 9.14 14-Day Expansion Comparison Between Different Curing Solutions Category B, C, & D Aggregates..............................................................................203
xv
9.15 14-Day Expansion Comparison Between Different Curing Solutions Category E Aggregates ………………………………………………………………..204
9.16 Category A Results at Different Solution Normalities and Cement Alkali Content ...........................................................................................205 9.17 Category B, C, & D Results at Different Solution Normalities and Cement Alkali Content .................................................................205 9.18 Category E Results at Different Solution Normalities and Cement Alkali Content .....................................................................................206 10.1a ASTM C 1293 Results for Category A Aggregates ...............................................212 10.1b ASTM C 1293 Results for Coarse Aggregates of Category A...............................213 10.1c ASTM C 1293 Results for Fine Aggregates of Category A...................................213 10.2 ASTM C 1293 Results for Category B, C, & D Aggregates....................................214 10.3 ASTM C 1293 Results for Category E Aggregates..................................................214 10.4 Comparison Between the 12-month Expansions of Tested Coarse and Fine Aggregates from the Same Source ...........................................................................215 10.5a 52-Week (One-year) Expansions of Concrete Prisms Stored in 1N NaOH Solution at 80oC for Category A Aggregates .........................................................219 10.5b Four-Week Expansions of Concrete Prisms Stored in 1N NaOH Solution at 80oC for Category A Aggregates ...........................................................................219 10.6a 52-Week (One-year) Expansions of Concrete Prisms Stored in 1N NaOH Solution at 80oC for Category B, C, and D Aggregates ........................................220 10.6b Four-Week Expansions of Concrete Prisms Stored in 1N NaOH Solution at 80oC for Category B, C, and D Aggregates...........................................................220 10.7a 52-Week (One-year) Expansions of Concrete Prisms Stored in 1N NaOH Solution at 80oC for Category E Aggregates.........................................................221 10.7b Four-Week Expansions of Concrete Prisms Stored in 1N NaOH Solution at 80oC for Category E Aggregates ...........................................................................221 10.8 Comparison Between the Standard C 1293 procedures and Modified C 1293 Storing Prisms in 1N NaOH at 800C .......................................................................226 10.9a 52-Week (One-year) Expansions of Concrete Prisms Stored in 1N NaOH Solution at 38oC for Category A Aggregates ........................................................229 10.9b 13-Week (6-Month) Expansions of Concrete Prisms Stored in 1N NaOH Solution at 38oC for Category A Aggregates ........................................................229 10.10a 52-Week (One-year) Expansions of Concrete Prisms Stored in 1N NaOH Solution at 38oC for Category B, C, & D Aggregates.........................................230 10.10b 13-Week (6-month) Expansions of Concrete Prisms Stored in 1N NaOH Solution at 38oC for Category B, C, & D Aggregates...........................................230 10.11a 52-Week (One-year) Expansions of Concrete Prisms Stored in 1N NaOH Solution at 38oC for Category E Aggregates.......................................................231 10.11b 13-Week (6-month) Expansions of Concrete Prisms Stored in 1N NaOH Solution at 38oC for Category E Aggregates.......................................................231 10.12 Comparison Between the Standard C 1293 procedures and Modified C 1293 Storing Prisms in 1N NaOH at 380C .....................................................................234 10.13 Expansions of Category A Aggregate Concrete Prisms Stored Over Water, at 100% R.H., and 600C....................................................................236 10.14 Expansions of Category B, C, & D Aggregate Concrete Prisms Stored Over
xvi
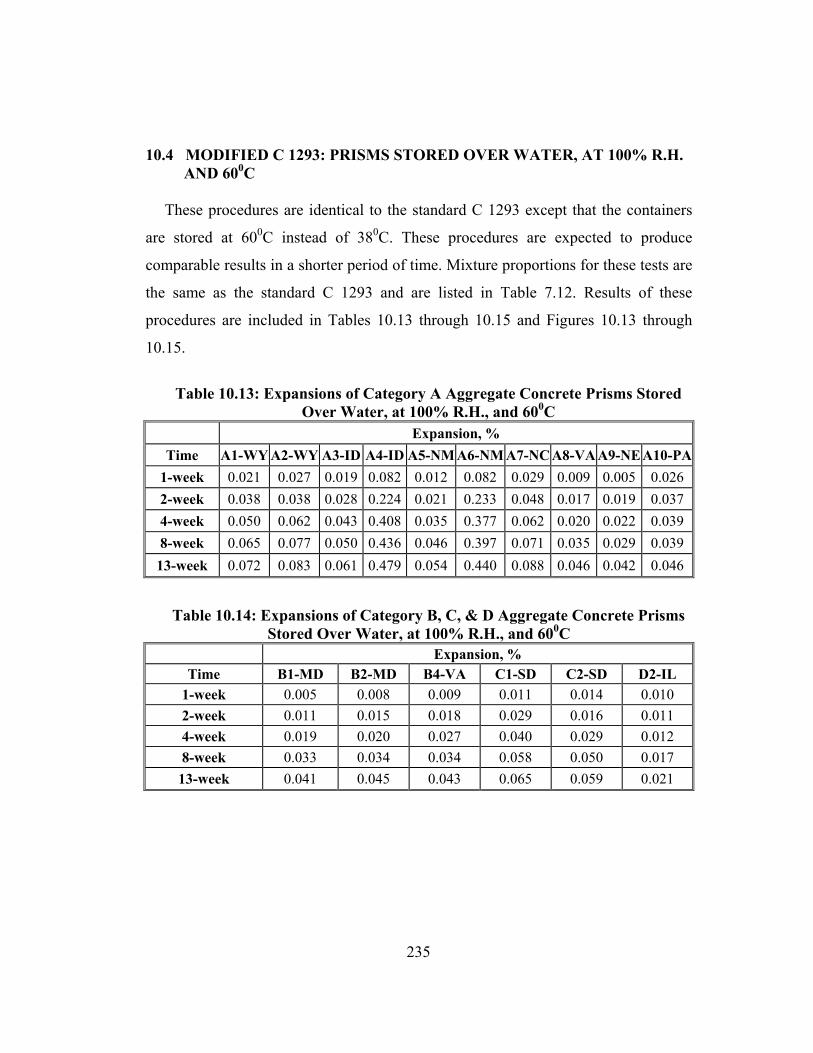
Water, at 100% R.H., and 600C.............................................................................237 10.15 Expansions of Category E Aggregate Concrete Prisms Stored Over Water, at 100% R.H., and 600C ............................................................................................237 10.16 Comparison Between the Standard C 1293 procedures and Modified C 1293 at 600C ...................................................................................................240 11.1 Effect of Class C Fly Ash on C 1260 Expansions of Aggregate A2-WY ..............................................................................................245 11.2 Effect of Class C Fly Ash on C 1260 Expansions of Aggregate A4-ID .................................................................................................245 11.3 Effect of Class C Fly Ash on C 1260 Expansions of Aggregate A6-NM ...............................................................................................246 11.4 Effect of Class C Fly Ash on C 1260 Expansions of Aggregate B4-VA ................................................................................................246 11.5 Effect of Class C Fly Ash on C 1260 Expansions of Aggregate C2-SD ................................................................................................247 11.6 Effect of Class C Fly Ash on C 1260 Expansions of Aggregate E2-IA .................................................................................................247 11.7 Comparison of the 14-Day C 1260 Expansions for the Different Aggregates and Levels of Class C Fly Ash Replacement ........................................................248 11.8 Effect of Class F Fly Ash on C 1260 Expansions of Aggregate A2-WY ..............................................................................................250 11.9 Effect of Class F Fly Ash on C 1260 Expansions of Aggregate A4-ID .................................................................................................251 11.10 Effect of Class F Fly Ash on C 1260 Expansions of Aggregate A6-NM ...............................................................................................251 11.11 Effect of Class F Fly Ash on C 1260 Expansions of Aggregate B4-VA ................................................................................................252 11.12 Effect of Class F Fly Ash on C 1260 Expansions of Aggregate C2-SD ................................................................................................252 11.13 Effect of Class F Fly Ash on C 1260 Expansions of Aggregate E2-IA .................................................................................................253 11.14 Comparison of the 14-Day C 1260 Expansions for the Different Aggregates and Levels of Class F Fly Ash Replacement.........................................................253 11.15 Effect of Silica Fume on C 1260 Expansions of Aggregate A2-WY ...................256 11.16 Effect of Silica Fume on C 1260 Expansions of Aggregate A4-ID .....................256 11.17 Effect of Silica Fume on C 1260 Expansions of Aggregate A6-NM ...................257 11.18 Effect of Silica Fume on C 1260 Expansions of Aggregate B4-VA ....................257 11.19 Effect of Silica Fume on C 1260 Expansions of Aggregate C2-SD .....................258 11.20 Effect of Silica Fume on C 1260 Expansions of Aggregate E2-IA ......................258 11.21 Comparison of the 14-Day C 1260 Expansions for the Different Aggregates and Levels of Silica Fume Replacement ...............................................................259 11.22 Effect of Granulated Slag on C 1260 Expansions of Aggregate A2-WY ..............................................................................................262 11.23 Effect of Granulated Slag on C 1260 Expansions of Aggregate A4-ID .................................................................................................262 11.24 Effect of Granulated Slag on C 1260 Expansions of
xvii
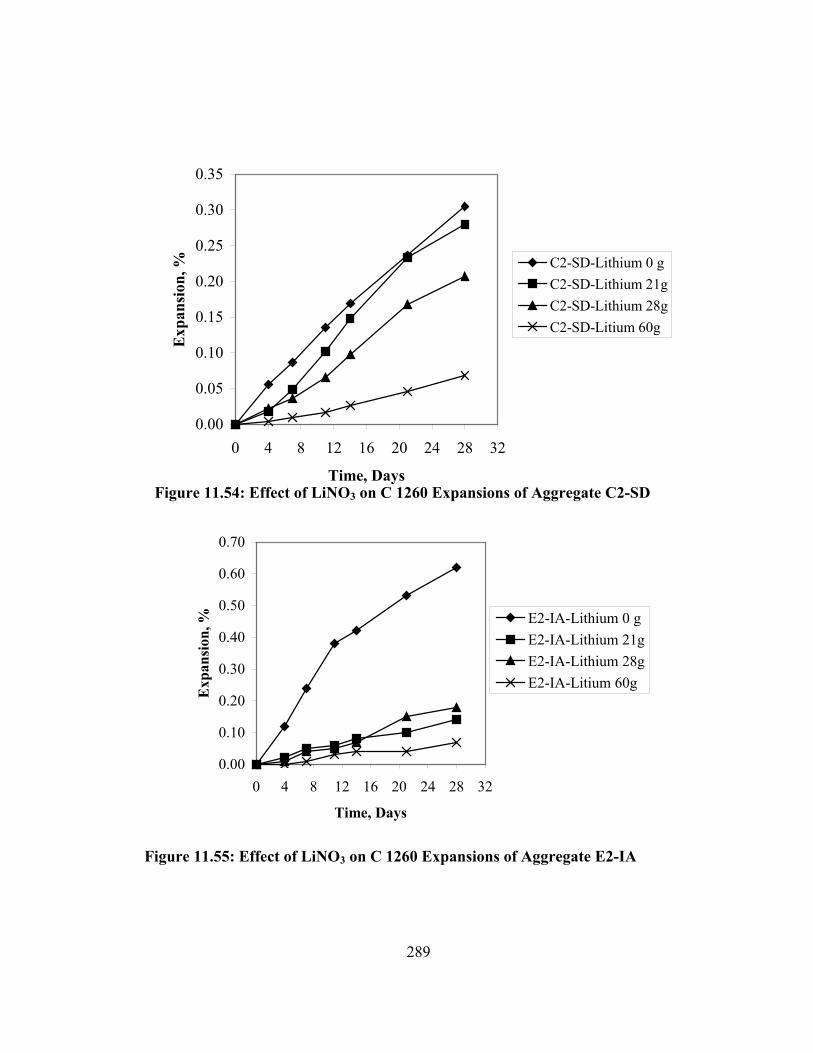
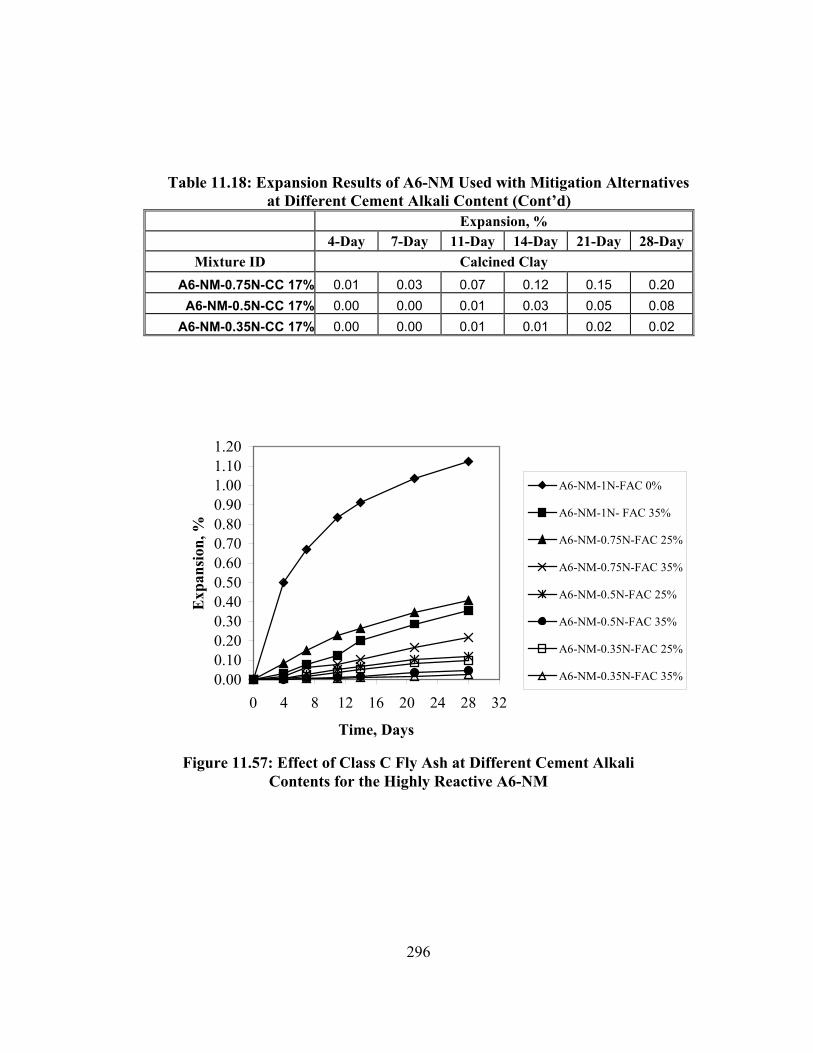
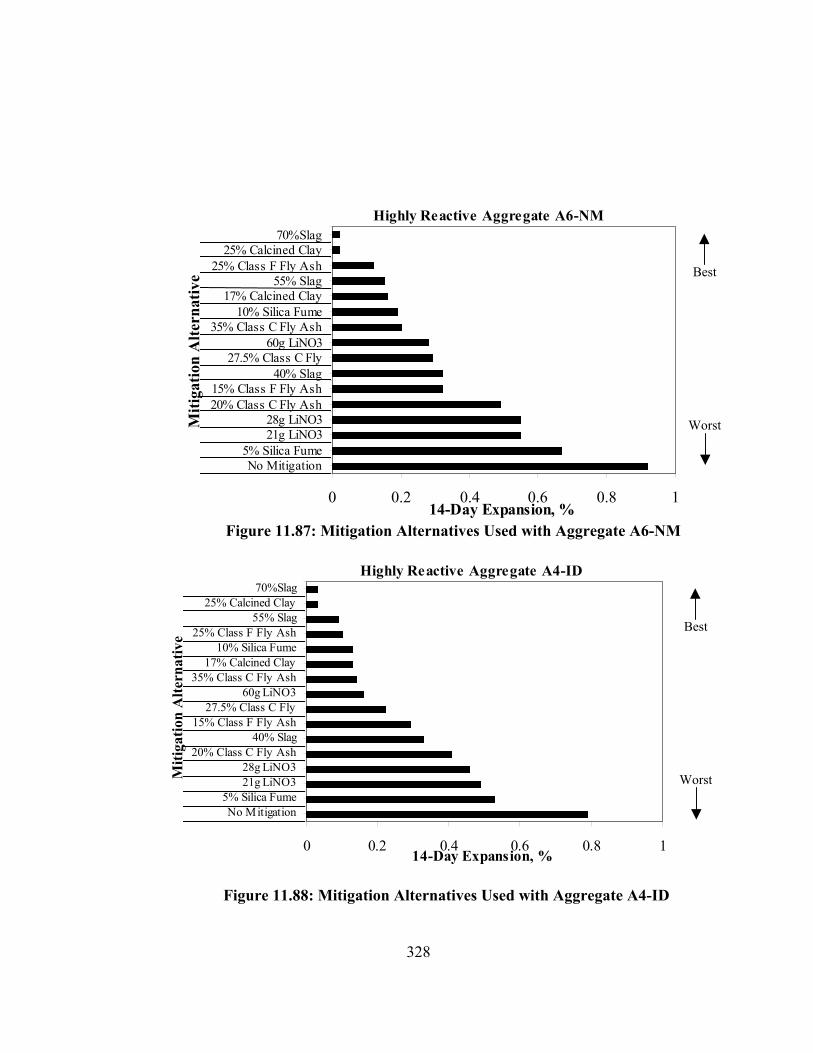
Aggregate A6-NM ...............................................................................................263 11.25 Effect of Granulated Slag on C 1260 Expansions of Aggregate B4-VA ................................................................................................263 11.26 Effect of Granulated Slag on C 1260 Expansions of Aggregate C2-SD ................................................................................................264 11.27 Effect of Granulated Slag on C 1260 Expansions of Aggregate E2-IA .................................................................................................264 11.28 Comparison of the 14-Day C 1260 Expansions for the Different Aggregates and Levels of Granulated Slag Replacement.........................................................265 11.29 Effect of Calcined Clay on C 1260 Expansions of Aggregate A2-WY ...............268 11.30 Effect of Calcined Clay on C 1260 Expansions of Aggregate A4-ID ..................268 11.31 Effect of Calcined Clay on C 1260 Expansions of Aggregate A6-NM ................269 11.32 Effect of Calcined Clay on C 1260 Expansions of Aggregate B4-VA ................269 11.33 Effect of Calcined Clay on C 1260 Expansions of Aggregate C2-SD .................270 11.34 Effect of Calcined Clay on C 1260 Expansions of Aggregate E2-IA ..................270 11.35 Comparison of the 14-Day C 1260 Expansions for the Different Aggregates and Levels of Calcined Clay Replacement............................................................271 11.36 Effect of Calcined Clay on the 14-Day C 1260 Expansions of Category E Aggregates .....................................................................................272 11.37 Effect of Air Entrainment on C 1260 Expansions of Aggregate A2-WY ..............................................................................................275 11.38 Effect of Air Entrainment on C 1260 Expansions of Aggregate A4-ID .................................................................................................275 11.39 Effect of Air Entrainment on C 1260 Expansions of Aggregate A6-NM ...............................................................................................276 11.40 Effect of Air Entrainment on C 1260 Expansions of Aggregate B4-VA ................................................................................................276 11.41 Effect of Air Entrainment on C 1260 Expansions of Aggregate C2-SD ................................................................................................277 11.42 Effect of Air Entrainment on C 1260 Expansions of Aggregate E2-IA .................................................................................................277 11.43 Comparison of the 14-Day C 1260 Expansions for the Different Aggregates and Levels of Entrained Air Levels.......................................................................278 11.44 Effect of W/C on C 1260 Expansions of Aggregate A2-WY ...............................281 11.45 Effect of W/C on C 1260 Expansions of Aggregate A4-ID .................................281 11.46 Effect of W/C on C 1260 Expansions of Aggregate A6-NM ...............................282 11.47 Effect of W/C on C 1260 Expansions of Aggregate B4-VA ................................282 11.48 Effect of W/C on C 1260 Expansions of Aggregate C2-SD ................................283 11.49 Comparison of the 14-Day C 1260 Expansions for the Different Water-Cement Ratios ............................................................................................283 11.50 Effect of LiNO3 on C 1260 Expansions of Aggregate A2-WY ...........................287 11.51 Effect of LiNO3 on C 1260 Expansions of Aggregate A4-ID ..............................287 11.52 Effect of LiNO3 on C 1260 Expansions of Aggregate A6-NM ............................288 11.53 Effect of LiNO3 on C 1260 Expansions of Aggregate B4-VA .............................288 11.54 Effect of LiNO3 on C 1260 Expansions of Aggregate C2-SD .............................289 11.55 Effect of LiNO3 on C 1260 Expansions of Aggregate E2-IA ..............................289
xviii
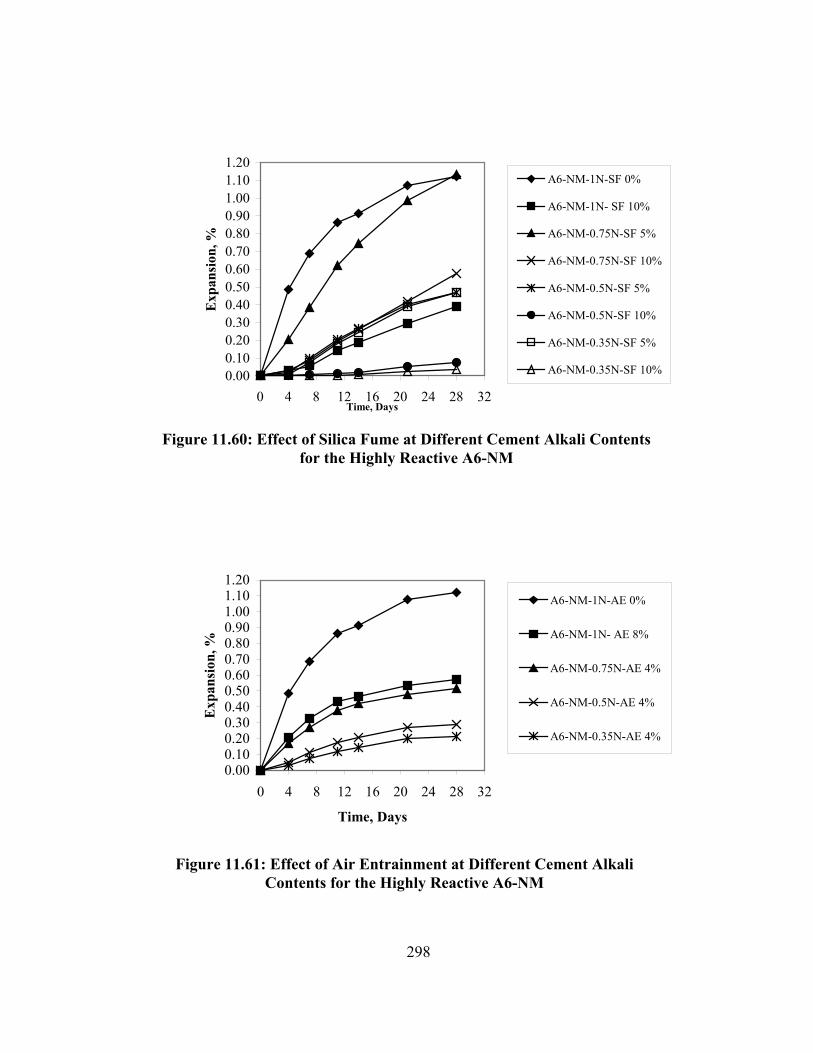
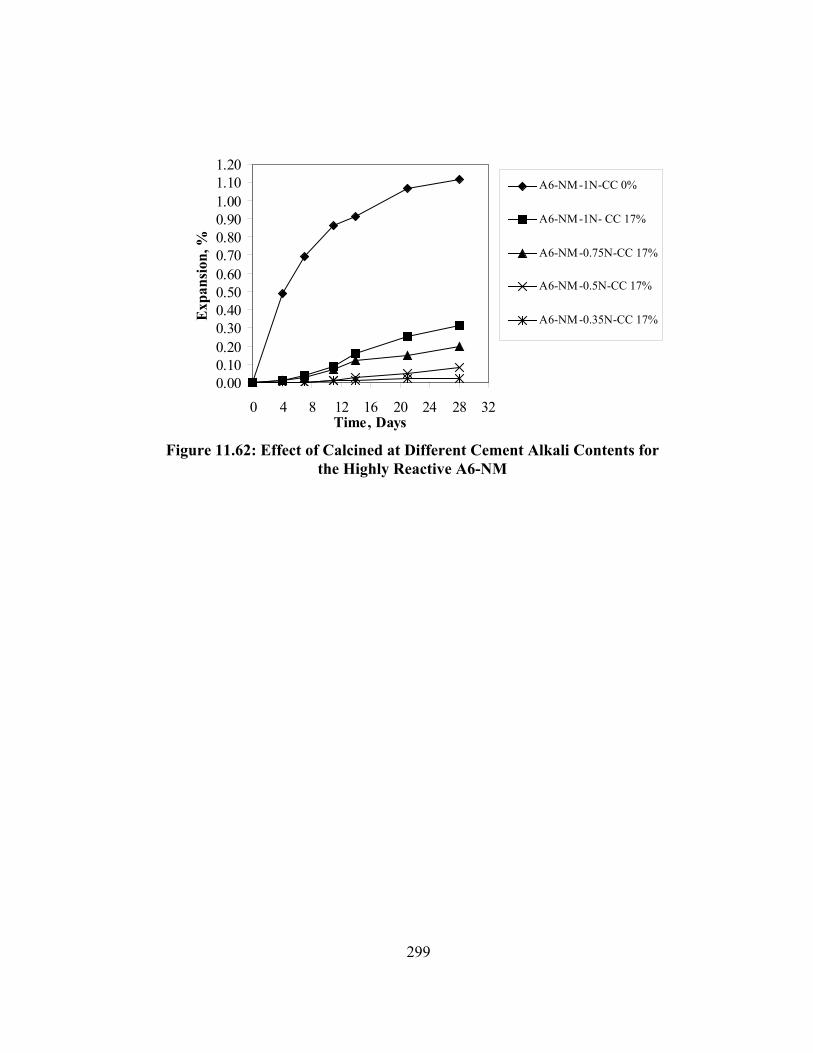
11.56 Comparison of the 14-Day C 1260 Expansions for the Different LiNO3 Dosages 290 11.57 Effect of Class C Fly Ash at Different Cement Alkali Contents for the Highly Reactive A6-NM ...................................................................................................296 11.58 Effect of Class F Fly Ash at Different Cement Alkali Contents for the Highly Reactive A6-NM ...................................................................................................297 11.59 Effect of granulated Slag at Different Cement Alkali Contents for the Highly Reactive A6-NM ...................................................................................................297 11.60 Effect of Silica Fume at Different Cement Alkali Contents for the Highly Reactive A6-NM ...................................................................................................298 11.61 Effect of Air Entrainment at Different Cement Alkali Contents for the Highly Reactive A6-NM ...................................................................................................298 11.62 Effect of Calcined Clay at Different Cement Alkali Contents for the Highly Reactive A6-NM ...................................................................................................299 11.63a Comparison of the 14-Day Expansions for the Combination of 35% Class C Fly Ash with Different Cement Alkali Contents ...................................................300 11.63b Comparison of the 14-Day Expansions for the Combination of 25% Class C Fly Ash with Different Cement Alkali Contents ...................................................300 11.64a Comparison of the 14-Day Expansions for the Combination of 20% Class F Fly Ash with Different Cement Alkali Contents ...................................................301 11.64b Comparison of the 14-Day Expansions for the Combination of 15% Class F Fly Ash with Different Cement Alkali Contents ...................................................301 11.65a Comparison of the 14-Day Expansions for the Combination of 50% Granulated Slag with Different Cement Alkali Contents......................................302 11.65b Comparison of the 14-Day Expansions for the Combination of 25% Granulated Slag with Different Cement Alkali Contents......................................302 11.66a Comparison of the 14-Day Expansions for the Combination of 10% Silica Fume with Different Cement Alkali Contents.............................................303 11.66b Comparison of the 14-Day Expansions for the Combination of 5% Silica Fume with Different Cement Alkali Contents.............................................303 11.67 Comparison of the 14-Day Expansions for the Combination of Air Entrainment with Different Cement Alkali Contents......................................304 11.68 Comparison of the 14-Day Expansions for the Combination of Calcined Clay with Different Cement Alkali Contents .........................................304 11.69 Ln (K) Values for Various Class C and Class F fly ash Replacement Levels Using 14-Day C 1260 Results ...............................................................................311 11.70 Ln (K) Values for Various Silica Fume and Granulated Slag Replacement Levels Using 14-Day C 1260 Results..............................................312 11.71 Ln (K) Values for Various Calcined Clay and Lithium Nitrate Replacement Levels Using 14-Day C 1260 Results..............................................312 11.72 M Values for Various Air Entrainment Levels and Various Water-Cement Ratios Using 14-Day C 1260 Results ...........................................313 11.73 M Values for Various Class C and Class F Fly Ash Replacement Levels Using 14-Day C 1260 Results ...............................................................................313 11.74 M Values for Various Silica Fume and Granulated Slag Replacement Levels Using 14-Day C 1260 Results..............................................314
xix
11.75 M Values for Various Calcined Clay and Lithium Nitrate Replacement Levels Using 14-Day C 1260 Results..............................................314 11.76 M Values for Various Air Entrainment Levels and Various Water-Cement Ratios Using 14-Day C 1260 Results ...........................................315 11.77 Ln (K) vs. M Plot for the Class C and Class F Fly Ash C 1260 Results .................................................................................................... 315 11.78 Ln (K) vs. M Plot for the Silica Fume and Granulated Slag C 1260 Results .................................................................................................... 316 11.79 Ln (K) vs. M Plot for the Calcined Clay and LiNO3 C 1260 Results .................................................................................................... 316 11.80 Ln (K) vs. M Plot for the Air Entrainment and Various W/C C 1260 Results .................................................................................................... 317 11.81 Effectiveness of K-M-A-J Model Predictions for Aggregate A2-WY................... 321 11.82 Effectiveness of K-M-A-J Model Predictions for Aggregate A4-ID ..................... 321 11.83 Effectiveness of K-M-A-J Model Predictions for Aggregate A6-NM ................... 322 11.84 Effectiveness of K-M-A-J Model Predictions for Aggregate B4-VA.................... 322 11.85 Effectiveness of K-M-A-J Model Predictions for Aggregate C2-SD..................... 323 11.86 Comparison Between the 14-Day C 1260 expansions of Aggregates with 0% Replacement and with Predicted Replacements .................................................... 323 11.87 Mitigation Alternatives Used with Aggregate A6-NM .......................................... 328 11.88 Mitigation Alternatives Used with Aggregate A4-ID ............................................ 328 11.89 Mitigation Alternatives Used with Aggregate A2-WY.......................................... 329 11.90 Mitigation Alternatives Used with Aggregate C2-SD............................................ 329 11.91 Mitigation Alternatives Used with Aggregate B4-VA........................................... 330 11.92 Mitigation Alternatives Used with Aggregate E2-IA............................................. 330 12.1 Summary of the Investigation of Mitigation Alternatives Using C 1293 and Accelerated C 1293 .................................................................332 12.2 Effect of Class C Fly Ash on C 1293 Expansions of Aggregate A4-ID .................................................................................................336 12.3 Effect of Class C Fly Ash on C 1293 Expansions of Aggregate A2-WY ..............................................................................................336 12.4 Effect of Class C Fly Ash on C 1293 Expansions of Aggregate C2-SD ................................................................................................337 12.5 Comparison Between the 52-week (One-year) Expansions of the Different Aggregates and Levels of Class C Fly Ash Replacement .....................................337 12.6 Effect of Class F Fly Ash on C 1293 Expansions of Aggregate A4-ID .................................................................................................339 12.7 Effect of Class F Fly Ash on C 1293 Expansions of Aggregate A2-WY ..............................................................................................339 12.8 Effect of Class F Fly Ash on C 1293 Expansions of Aggregate C2-SD ................................................................................................340 12.9 Comparison Between the 52-week (One-year) Expansions of the Different Aggregates and Levels of Class F Fly Ash Replacement......................................340 12.10 Effect of Silica Fume on C 1293 Expansions of Aggregate A4-ID .....................344 12.11 Effect of Silica Fume on C 1293 Expansions of Aggregate A2-WY ...................344 12.12 Effect of Silica Fume on C 1293 Expansions of Aggregate C2-SD .....................345
xx
12.13 Comparison Between the 52-week (One-year) Expansions of the Different Aggregates and Levels of Silica Fume Replacement ............................................345 12.14 Effect of Slag on C 1293 Expansions of Aggregate A4-ID .................................348 12.15 Effect of Slag on C 1293 Expansions of Aggregate A2-WY ...............................348 12.16 Effect of Slag on C 1293 Expansions of Aggregate C2-SD .................................349 12.17 Comparison Between the 52-week (One-year) Expansions of the Different Aggregates and Levels of Slag Replacement ........................................................349 12.18 Effect of Calcined Clay on C 1293 Expansions of Aggregate A4-ID ..................352 12.19 Effect of Calcined Clay on C 1293 Expansions of Aggregate A2-WY ...............352 12.20 Effect of Calcined Clay on C 1293 Expansions of Aggregate C2-SD .................353 12.21 Comparison Between the 52-week (One-year) Expansions of the Different Aggregates and Levels of Calcined Clay Replacement.........................................353 12.22 Effect of Lithium Nitrate on C 1293 Expansions of Aggregate A4-ID ................357 12.23 Effect of Lithium Nitrate on C 1293 Expansions of Aggregate A2-WY .............357 12.24 Effect of Lithium Nitrate on C 1293 Expansions of Aggregate C2-SD ...............358 12.25 Comparison Between the 52-week (One-year) Expansions of the Different Aggregates and Levels of Lithium Nitrate Replacement ......................................358 12.26 Effect of Air Entrainment on C 1293 Expansions of Aggregate A4-ID ..............360 12.27 Effect of Air Entrainment on C 1293 Expansions of Aggregate A2-WY ............361 12.28 Effect of Air Entrainment on C 1293 Expansions of Aggregate C2-SD ..............361 12.29 Comparison Between the 52-week (One-year) Expansions of the Different Aggregates and Air Entrainment Contents............................................................362 12.30 Comparison Between the 52-week (One-year) Expansions of the Different Aggregates and Air Entrainment Contents of Table 12.15 ...................................366 12.31 Comparison Between the Standard One-Year Expansions and the Accelerated 13-Week Expansions of the Various Mitigation Alternatives...............................367 12.32 Effect of Class C Fly Ash on the Accelerated C 1293 Expansions of Aggregate A4-ID .................................................................................................369 12.33 Effect of Class C Fly Ash on the Accelerated C 1293 Expansions of Aggregate A2-WY ..............................................................................................370 12.34 Effect of Class C Fly Ash on the Accelerated C 1293 Expansions of Aggregate C2-SD ................................................................................................370 12.35 Effect of Class C Fly Ash on the Accelerated C 1293 Expansions of Aggregate E2-IA .................................................................................................371 12.36 Comparison Between the 26-Week Expansions Generated Using Accelerated C 1293 Procedures and the Different Class C Fly Ash Replacement ...................371 12.37 Effect of Class F Fly Ash on the Accelerated C 1293 Expansions of Aggregate A4-ID .................................................................................................375 12.38 Effect of Class F Fly Ash on the Accelerated C 1293 Expansions of Aggregate A2-WY ..............................................................................................375 12.39 Effect of Class F Fly Ash on the Accelerated C 1293 Expansions of Aggregate C2-SD ................................................................................................376 12.40 Effect of Class F Fly Ash on the Accelerated C 1293 Expansions of Aggregate E2-IA .................................................................................................376 12.41 Comparison Between the 26-Week Expansions Generated Using Accelerated C 1293 Procedures and the Different Class F Fly Ash Replacement ....................377
xxi
12.42 Effect of Silica Fume on the Accelerated C 1293 Expansions of Aggregate A4-ID .................................................................................................380 12.43 Effect of Silica Fume on the Accelerated C 1293 Expansions of Aggregate A2-WY ..............................................................................................380 12.44 Effect of Silica Fume on the Accelerated C 1293 Expansions of Aggregate C2-SD ................................................................................................381 12.45 Effect of Silica Fume on the Accelerated C 1293 Expansions of Aggregate E2-IA .................................................................................................381 12.46 Comparison Between the 26-Week Expansions Generated Using Accelerated C 1293 Procedures and the Different Silica Fume Replacement ..........................382 12.47 Effect of Granulated Slag on the Accelerated C 1293 Expansions of Aggregate A4-ID .................................................................................................385 12.48 Effect of Granulated Slag on the Accelerated C 1293 Expansions of Aggregate A2-WY ..............................................................................................385 12.49 Effect of Granulated Slag on the Accelerated C 1293 Expansions of Aggregate C2-SD ................................................................................................386 12.50 Effect of Granulated Slag on the Accelerated C 1293 Expansions of Aggregate E2-IA .................................................................................................386 12.51 Comparison Between the 26-Week Expansions Generated Using Accelerated C 1293 Procedures and the Different Granulated Slag Replacement....................387 12.52 Effect of Calcined Clay on the Accelerated C 1293 Expansions of Aggregate A4-ID .................................................................................................390 12.53 Effect of Calcined Clay on the Accelerated C 1293 Expansions of Aggregate A2-WY ..............................................................................................390 12.54 Effect of Calcined Clay on the Accelerated C 1293 Expansions of Aggregate C2-SD ................................................................................................391 12.55 Effect of Calcined Clay on the Accelerated C 1293 Expansions of Aggregate E2-IA .................................................................................................391 12.56 Comparison Between the 26-Week Expansions Generated Using Accelerated C 1293 Procedures and the Different Calcined Clay Replacement.......................392 12.57 Effect of Lithium Nitarte on the Accelerated C 1293 Expansions of Aggregate A4-ID .................................................................................................395 12.58 Effect of Lithium Nitarte on the Accelerated C 1293 Expansions of Aggregate A2-WY ..............................................................................................395 12.59 Effect of Lithium Nitarte on the Accelerated C 1293 Expansions of Aggregate C2-SD ................................................................................................396 12.60 Effect of Lithium Nitarte on the Accelerated C 1293 Expansions of Aggregate E2-IA .................................................................................................396 12.61 Comparison Between the 26-Week Expansions Generated Using Accelerated C 1293 Procedures and the Different Lithium Nitarte Replacement.....................397 12.62 Effect of Air Entrainment on the Accelerated C 1293 Expansions of Aggregate A4-ID .................................................................................................400 12.63 Effect of Air Entrainment on the Accelerated C 1293 Expansions of Aggregate A2-WY ..............................................................................................400 12.64 Effect of Air Entrainment on the Accelerated C 1293 Expansions of Aggregate C2-SD ................................................................................................401
xxii
12.65 Effect of Air Entrainment on the Accelerated C 1293 Expansions of Aggregate E2-IA .................................................................................................401 12.66 Comparison Between the 26-Week Expansions Generated Using Accelerated C 1293 Procedures and the Different Air Entrainment Replacement....................402 12.67 Effect of Different Cement Alkali Contents on the Accelerated C 1293 Expansions of Aggregate A6-NM.........................................................................405 12.68 Effect of Different Cement Alkali Contents on the Accelerated C 1293 Expansions of Aggregate A4-ID ...........................................................................405 12.69 Effect of Different Cement Alkali Contents on the Accelerated C 1293 Expansions of Aggregate A2-WY.........................................................................406 12.70 Effect of Different Cement Alkali Contents on the Accelerated C 1293 Expansions of Aggregate C2-SD ..........................................................................406 12.71 Comparison Between the 13-Week Accelerated C 1293 Expansions of Concrete Prisms Made with Different Na2Oequiv. Contents....................................407 12.72 Comparison Between the Different Mitigation Alternatives Used With Aggregate A4-ID and the Accelerated C 1293......................................................409 12.73 Comparison Between the Different Mitigation Alternatives Used With Aggregate A2-WY and the Accelerated C 1293 ...................................................409 12.74 Comparison Between the Different Mitigation Alternatives Used With Aggregate C2-SD and the Accelerated C 1293.....................................................410 12.75 Comparison Between the Different Mitigation Alternatives Used With Aggregate E2-IA and the Accelerated C 1293 ......................................................410 12.76 Effect of Silica Fume, Granulated Slag, and Calcined Clay on the Accelerated C 1293 Expansions Aggregate A6-NM Using 0.80% Na2Oequiv. Cement .............415 12.77 Effect of Class C Fly Ash and Class F Fly Ash on the Accelerated C 1293 Expansions of Aggregate A6-NM Using a 0.80% Na2Oequiv. Cement...................415 12.78 Effect of Lithium Nitrate and Air Entrainment on the Accelerated C 1293 Expansions of Aggregate A6-NM Using a 0.80% Na2Oequiv. Cement...................416 13.1 C 1260 Results vs. C 1293 Results.........................................................................422 13.2a Characterization of Aggregate Potential Alkali-Silica Reactivity ..........................425 13.2b Summary Characterization of Aggregate Potential AS Reactivity.........................426 13.3a Different Replacement Levels of Class C Fly Ash, Class F Fly Ash, Silica Fume, Slag, and Calcined Clay, Evaluated Using ASTM C 1260 and the Accelerated C 1293 Procedures (600C).................................................................431 13.3b Trend line Illustrating the Relation Between ASTM C 1260 and Accelerated C 1293 in Evaluating the Use of Class C Fly Ash, Class F Fly Ash, Silica Fume, Slag, and Calcined Clay .............................................................................432 13.4 Different Dosages of Air Entrainment and Lithium Nitrate, Evaluated Using ASTM C 1260 and the Accelerated C 1293 Procedures (600C) ..............................432 13.5 Comparison of the 14-Day C 1260 Expansions for the Different Entrained Air Levels ................................................................................................434 13.6 Comparison Between the 52-week (One-year) Expansions of the Different Aggregates and Air Entrainment Contents of Table 12.15 ......................................434 13.7 Comparison Between the 13-Week Expansions Generated Using the Accelerated C 1293 Procedures and the Different Air Entrainment .........................435 14.1 Flow Chart I for Assessing Aggregate’s Potential Alkali-Silica Reactivity..............440
xxiii
14.2 ASTM C 1260 Expansion Criteria Using Different NaOH Solution Molarities to Investigate Effectiveness of Cement Alkali Content ...........................................446 14.3 Flow Chart II for Determining Effective Preventive Measures.................................447 15.1 Characterization of Aggregate Potential Alkali-Silica Reactivity.............................454
1
CHAPTER ONE
INTRODUCTION
1.1 GENERAL
Alkali-silica reaction (ASR) is one of the most recognized deleterious phenomena
in concrete. ASR is a chemical reaction between the reactive silica contained in the
aggregates and the alkalis (Na2O and K2O) within the cement paste. The result is an
alkali-silicate gel that absorbs water and increases in volume. If the gel is confined
by the cement paste, it builds up pressure as it grows, causing internal stresses that
eventually might crack the concrete.
Identifying the susceptibility of an aggregate to alkali-silica reaction (ASR) before
using it in concrete is one of the most efficient practices for preventing damage.
Several tests have been developed to identify aggregates subject to ASR, but each
has its limitations. A three-year research study was initiated on January 1, 1998 at
The University of Texas at Austin for investigating ASR in portland cement
concrete. The study was approved by the ICAR Advisory Board of Directors in
November of 1997. The scope of the study is essentially two fold: 1) develop more
accurate testing protocols for identifying aggregates which are subject to ASR and 2)
develop mitigation methods for preventing ASR damage in concrete if a reactive
aggregate is used.
1.2 BACKGROUND AND PROJECT JUSTIFICATION
1.2.1 ASR Survey
In an effort to determine the incidence of ASR in the United States of America
(USA), a survey was conducted to get input from departments of transportation
(DOT’s) across the country. Figure 1.1 shows a summary of the survey.
ASR Occurrence
No ASR Reported
No ASR Problems Because of Low-alkali cement
No Response
2
Figure 1.1: Results of the DOT Survey on ASR
3
The survey will be detailed in a later chapter. All DOT’s were contacted; 39 DOT’s
responded. It was concluded that 31 states (79.5%) out of the 39 have at some point
experienced damage due to ASR. Eight states (20.5%) reportedly had never
experienced damage due to ASR and this was attributed to either the use of
innocuous aggregates or the use of low-alkali cements. The survey highlighted ASR
as a national concern.
1.2.2 Testing Procedures
Over the years, several ASTM tests have been developed for the purpose of
identifying reactive aggregates. The most popular tests include:
ASTM C 295: “Guide for Petrographic Examination of Aggregates for Concrete” is
used to determine the physical and mineralogical characteristics of aggregates. The
test is used to describe and classify the constituents of an aggregate, to determine the
relative amounts of the constituent in the aggregate, and to compare samples of
aggregates from new sources to samples of aggregates from other well-established
sources. Petrographic examination also provides a means of identifying types of
potentially deleterious minerals present in aggregates. The test method allows the
identification of most types of reactive silica minerals. However, a petrographic
examination will not clearly identify materials such as microcrystalline, strained, or
microfractured quartz, which can be found in a wide variety of aggregates. These
materials are usually present in aggregates that are slowly reactive.
ASTM C 227: “Test Method for Potential Alkali Reactivity of Cement-Aggregate
Combinations (Mortar-Bar Method)” has been the most widely used test method
since the 1950’s. The test is used to determine the susceptibility of cement-aggregate
combinations to alkali-silica reaction by means of measuring the change in length of
mortar bars made using the proposed combinations of materials for a job. Large
4
amounts of literature exist reporting on the inadequacy of this test method. Some
papers mentioned that the use of wicks in the storage container lead to alkali leaching
and misleading results. Other research projects have documented that the C 227 test
is not suitable for identifying slowly reactive aggregates. Other researchers have
complained that the processing of aggregates is not realistic; the processed
aggregates have different surface areas, which leads to different ASR reactivity and
does not represent the actual reactivity of an aggregate.
ASTM C 1260: “Test Method for Potential Reactivity of Aggregates (Mortar-Bar-
Test)” is used to detect the potential of aggregates in mortar bars for exhibiting
alkali-silica reaction within sixteen days. It does not investigate combinations of
aggregates with cementitious materials nor does it represent the environments to
which aggregates will be subjected in the field. The alkali content of the cement
does not affect the expansion in this test method because the specimens are stored in
a 1N NaOH solution. If mortar bars exhibit high expansion, it is recommended that
more information be gathered about the aggregate using ASTM C 295 to determine
whether the expansion is due to alkali-silica reaction. C 1260 is capable of detecting
slowly reactive aggregates. Several researchers have reported that the test is very
severe and might identify an aggregate as potentially reactive even if it has a very
good long-term service record. The test has considerable value in providing a rapid
means of detecting potentially ASR aggregates. Recently, aggregates have been
identified as innocuous using C 1260 but have reacted deleteriously in the field with
low-alkali cements. There are also some aggregates that have been identified as
reactive using C 1260 but have had over 30 years of good service records. As a
result, it is recommended that aggregate expansion results from this test be combined
with the results of a service record investigation for the aggregate in question or a
long-term concrete testing program.
5
ASTM C 1293: “Test Method for Concrete Aggregates by Determination of Length
Change of Concrete Due to Alkali-Silica Reaction” is used to determine the alkali-
silica reactivity of coarse and fine aggregates by monitoring the length change of
concrete prisms over a period of one year. It is used to predict the reactivity of an
aggregate in an alkaline environment (1.25% Na2O or 5.25 kg/m3) under laboratory
conditions that will differ from field conditions. As a result, the test does not
duplicate actual field performance. Results of this test should be used to decide
whether precautions should be taken to prevent alkali-silica reaction expansions
before the tested aggregate is used in construction. When expansions from this test
method indicate that the aggregate is reactive (one-year expansions greater than
0.04%) petrographic examination (ASTM C 856) is required to confirm that the
expansion is due to alkali-silica reaction. Supplemental testing could also be
performed to confirm the test results. Such tests include ASTM C 277, C 1260, C
295, and C 289.
Clearly, an ideal test method for predicting the alkali-silica reactivity of
aggregates does not exist. A comprehensive evaluation of test methods is needed for
aggregates having known alkali-silica reactivity ranging from innocuous to highly
reactive.
1.2.3 Mitigation Alternatives
Soon after ASR was first identified as the cause of several concrete failures, it was
found that the use of mineral admixtures as a replacement of a portion of the cement
in concrete could reduce the ASR effects on concrete. The most commonly used
admixtures are fly ash, silica fume, and slag. Several natural pozzolans such as
calcined clay have also been reported effective in mitigating the ASR effects. The
use of air entrainment and lithium admixtures in concrete has been proven to
potentially mitigate the effects of ASR. Effective mitigation methods need to be
6
available for use with aggregates that are prone to ASR. In order to reduce the cost
of construction, it is important that reactive aggregate sources be used as effectively
as possible.
1.3 PROJECT OBJECTIVES
The overall objective of the project was to closely examine the alkali-silica
reaction expansion potential in portland cement concrete containing different
aggregate sources in the United States (U.S.) and then to relate the results of the
laboratory testing performed on these aggregates to their reported field performance.
Another objective of the study was to investigate ASR mitigation or prevention
methods using aggregates with established ASR performance. Specific objectives
were as follows:
1. Improve the Testing Program for ASR Evaluation of Aggregates: This includes
investigating, modifying, or developing better interpretation techniques for
ASTM C 227, ASTM C 1260, and ASTM C 1293. A combination of the
improved tests was assembled to generate a recommended protocol for a better
ASR evaluation procedure for aggregates.
2. Improve Mitigation Methods: Using mortar bars and concrete prisms,
respectively ASTM C 1260 and C 1293, mitigation alternatives were
investigated. These alternatives included the use of fly ash, silica fume, ground-
granulated slag, calcined clay, lithium nitrate, air entrainment, low-alkali content,
and low permeability.
3. Improve Field Performance Recording: A database containing physical,
chemical, mineralogical, ASR expansion test results, and field performance for
7
each aggregate was initiated. The database helps improve the correct use of
aggregates in order to prevent ASR damage in concrete.
4. Implement Latest Findings: Final outputs of the project were presented at a
demonstration seminar at industry-selected sites.
1.4 WORK PLAN
A technical project advisory panel (PAP) was established to monitor the progress
of the research, to ensure effective use of resources, to act as a liaison between
researchers and industry members, to secure test samples, and to facilitate the
transfer of technology and prompt implementation. Twelve members representing
different sectors of the aggregates industry were chosen and added to the committee
after consultation. A list of the committee members is included in Appendix A. In
order to meet all the objectives of the project, six tasks were developed and
implemented. The list of tasks was as follows:
1. Task #1: Determine State-of-the-Art: The purpose of determining the state-of-
the-art was to identify areas in which research will be needed to fill the existing
gaps in the available ASR technology. The state-of-the-art will be determined by:
Extensive literature search
Survey of industry representatives such as the National Aggregates Association-
National Stone Association (NAA-NSA), and others.
Survey of knowledgeable professionals such as researchers, petrographers, and
consultants specializing in aggregates and concrete.
Survey of DOT’s in the United States and other selected countries.
2. Task #2: Identify and Select Test Materials: Based on available information on
field performance, chemical composition, and mineralogical composition,
8
sources of aggregates representing the complete spectrum of ASR reactivity
were selected for testing in the laboratory. In addition, the aggregates will
represent the various climatic regions and geographic areas of the U.S. Various
types of portland cement and admixtures were also selected to result in a
comprehensive testing program.
3. Task #3: Laboratory Test Program for Evaluating and Modifying Test
Procedures: An extensive laboratory test program was conducted to address the
different objectives of the study. ASTM test methods available to determine the
ASR reactivity of a specific aggregate include ASTM C 227, C 1260, C 1293,
and C 295. The objectives of the testing program are:
Evaluate the efficiency and accuracy of currently available ASTM test
procedures and document their limitations, disadvantages, and potentially
misleading predictions.
Identify a correlation or document a lack of correlation between the results of the
different tests investigated.
Identify a correlation or a lack of correlation between the results of each
investigated test and the documented performance in service of the aggregates
being tested.
Develop modifications to available test procedures in order to improve their
efficiency, accuracy, and predictability of the performance of a given aggregate
when used in concrete.
Evaluate and develop mitigation methods capable of reducing or eliminating the
ASR-related damage of concrete when using a reactive aggregate source.
Mitigation alternatives include the use of fly ash, slag, silica fume, blended
cements, air entrainment, low permeability, and lithium nitrate.
9
4. Task #4: Document the Field Performance of Investigated Aggregates: In
order to define the relationship between the laboratory and field performance the
field performance of investigated aggregates was documented. Methodology
included contacting the aggregate producers, DOT’s, and other authorities that
have used the aggregates.
5. Task #5: Establish Aggregate Database: A database was established to correlate
the laboratory results performed on a specific aggregate source to its field
performance in concrete.
6. Task #6: Develop Recommended Guidelines: Upon completion of the work on
previous tasks, guidelines were developed for:
Test protocols capable of accurately assessing the potential for ASR damage of
aggregate sources.
Mitigation methods for ASR-reactive aggregates that will be used in concrete.
Procedures for establishing acceptance of an aggregate source on the basis of
laboratory evaluation or mitigating mix designs.
7. Task #7: Implementation: Recommendations from the research were presented
to agencies that might have an interest in adopting all or a portion of the results.
8. Task #8: Reports: Reports were generated as the research progressed in the form
of quarterly reports, task completions, and final reports.
1.5 BENEFITS
Accurate evaluation of the potential ASR of aggregates is essential for producing
durable concrete. In the industry today, there is a need for improved or modified
testing procedures capable of accurately predicting the susceptibility of aggregates to
10
ASR. These new procedures will permit the use of some aggregates that have
formerly been excluded on the basis of being classified as reactive. Effective
mitigation methods will permit the economic use of reactive aggregates that normally
would be excluded. In summary, the improved testing procedures and mitigation
methods will result in two major benefits to the industry and users: 1) aggregates
previously erroneously classified as reactive can be used and 2) many reactive
aggregates can be used by incorporating the appropriate mitigation methods.
Mitigation of ASR will extend the life of concrete structures and result in
substantial savings in repair and replacement costs. Based on estimates by the Bridge
Design Section in New Mexico, 20 bridges per year are built and 50 to 75 percent
replaced due to ASR-related distress. It is estimated that by reducing rehabilitation
and replacement of bridges, about $11 million to $15 million annual savings would
accrue (Mc Keen, 1998).
Results of this study will increase the aggregate sources that can be used in
concrete, resulting in increased sales for producers and reduced costs for users. No
accurate estimates exist of the annual tonnage of aggregates that has been rejected
because of alleged susceptibility to ASR, but if the results of this research would
enable even 25 percent of these materials to be used, the increased volume available
for use would increase substantially.
11
CHAPTER TWO
ALKALI-SILICA REACTION MECHANISMS
2.1 GENERAL DEFINITION
Alkali-silica reaction (ASR) is a reaction that takes place between the reactive
silica contained in aggregates and the alkalis in the cement paste. For the reaction to
take place in concrete, three conditions must exist: high pH, moisture, and reactive
silica. Various types of silica present in aggregates react with the hydroxyl ions
present in the pore solution in concrete. The silica, now in solution, reacts with the
sodium (Na+) and potassium (K+) alkalis to form a volumetrically unstable alkali-
silica gel. Once formed, the gel starts imbibing water and swelling to a greater
volume than that of the reacted materials. Water absorbed by the gel can be water
not used in the hydration reaction of the cement, free water from rain, melted snow,
tides, rivers, or water condensed from air moisture (ACI 221, 1998). In general, the
reaction can be viewed as a two-step process (Farny, 1996):
Step 1:
Silica + alkali alkali-silica gel (sodium silicate)
SiO2 + 2NaOH + H2O Na2SiO3.2H2O (2KOH can replace 2NaOH)
Step 2
Gel reaction product + water expansion
Since the gel is restrained by the surrounding mortar, an osmotic pressure is
generated by the swelling. Once that pressure is larger than the tensile strength of
the concrete, cracks occur, leading to additional water migration or absorption and
additional gel swelling (ACI 221, 1998).
12
2.2 CONTRIBUTION OF THE SILICA TO THE REACTION
Various forms of silica or silicon oxide tetrahedron may be found in natural
aggregates. The silicon tetrahedron is shown in Figure 2.1 where Si4+ occupies the
center of the structure and four oxygen ions (O--), bonded to Si4+, occupy the corners
(Leming, 1996). A crystalline silicate structure is formed by the repetition of the
silicon tetrahedron in an oriented three-dimensional space (Prezzi et al., 1997).
Quartz (SiO2) is an example of completely crystalline silica where the different
tetrahedra are linked by oxygen ions. Each oxygen ion is bonded to two silicon ions
in order to achieve electrical neutrality. Figure 2.2 shows the structure of quartz. A
complete tetrahedron cannot form on the surface of a crystalline structure. The
bonds between oxygen and silicon are broken on the surface resulting in negative
charges that are unsatisfied (Prezzi et al., 1997). Such structures are chemically and
mechanically stable, impermeable, and react only on the surface (Leming, 1996).
Amorphous silicates (non-crystalline) are also formed by a combination of the silicon
tetrahedron with the exception that the tetrahedra are arranged in a random three-
dimensional network without forming a regular structure (Prezzi et al., 1997). As a
result, amorphous silica is more porous, has a large surface area, and as a
consequence is very reactive. The more amorphous the silica is, the more reactive it
becomes. Certain volcanic aggregates, for example, contain glassy materials formed
by the rapid cooling of melted silica that prevents it from crystallizing and renders it
The water-cement ratio, which is not specified in the standard, was also found to
influence the expansion results as shown in Figure 3.2. Expansion increased with
decreasing water-cement ratio when the test was performed on typical reactive
aggregates from Quebec. This trend may be attributed to 1) a larger content of alkalis
caused by a lesser amount of pore solution or 2) a lower porosity, which leaves less
space for the reaction product to form (Bérubé and Fournier, 1993). On the other
hand, Kishitani et al. tested several Japanese aggregates and found that the C 227
expansions increased as the water-cement ratio increased (Kishitani et al., 1986).
Figure 3.1: Effect of alkali content (Percent Na2Oeq) in the ASTM C 227 mortar-bar method (Siliceous limestone from Ottawa, Ontario) (Bérubé and
Fournier, 1993)
20
When opal was tested using C 227, the effect of the water-cement ratio was also not
clearly defined (Grattan-Bellew, 1989).
0
0.02
0.04
0.06
0.08
0.1
0.12
0 2 4 6 8 10 12 14
Time, montths
AST
M C
227
Exp
ansi
ons,
%
W/C = 0.45W/C = 0.50W/C = 0.60
As a result of the survey, it was found that the storage condition, the water-cement
ratio, and the cement alkali content need to be controlled in order to produce more
reliable results. It was recommended to:
1. Use storage containers without wicks on the sides,
2. Increase the cement alkali content to 1.25% Na2Oeqiv.
3. Control the water-cement ratio to 0.50 by mass.
Figure 3.2: Effect of water-cement ratio in the ASTM C 227 mortar-bar method (Siliceous Limestone from Trois-Rivieres, Quebec) (Bérubé and
Fournier, 1993)
21
3.2.4 Accelerated Mortar-bar method: ASTM C 1260 (Bérubé and Fournier,
1993)
This test is being thoroughly investigated all over the world. In contrast to the
results of the C 227 test method, it was found that 14-day expansions decrease with
decreasing water-cement ratio. Since in this test mortar bars are immersed in a 1M
NaOH solution, the pore solution of the bars is controlled by the concentration of the
solution and the migration of the alkali ions in the bars is likely to decrease with
decreasing water-cement ratio.
It was also found that even though the test was capable of detecting numerous
aggregates, it was too severe for many aggregates that have performed well when
tested using the concrete prism method and that have performed well in the field. In
particular, these aggregates included greywackes, lithic gravels, some hornfelses,
gabbros, or andesites as shown in Figure 3.3.
Figure 3.3: Comparison Between ASTM C 1260 and ASTM C 1293 Results Illustrating the Severity of ASTM C 1260 (Bérubé and Fournier, 1993)
22
Several researchers including Grattan-Bellew and DeMerchant and Soles have
suggested using different expansion limits with varying aggregate types, namely,
0.10% for reactive siliceous limestone, 0.20% for greywackes, and 0.15% for the
other types of aggregates. These researchers have also called for performing a
petrographic examination before performing any accelerated testing in order to
determine which limit to use (Gratta-Bellew, 1990; DeMerchant and Soles, 1992).
ASTM C 1260 should not be used for rejecting aggregates. Negative results
should highlight the need for additional investigation. This test was found to be “very
useful, as it was capable of recognizing most deleterious aggregates within 2 weeks
only.” The test should be considered as a screening tool for aggregates. The reaction
products formed within tested mortar bars were exactly the same as those in field
concrete affected by the alkali-silica reaction (Shayan, 1989).
3.2.5 Autoclave Mortar-bar methods (Bérubé and Fournier, 1993)
The autoclave method that has been showing the most promising results consists
of forming mortar bars in accordance with ASTM C 227, but using a water-cement
ratio of 0.50 and an alkali content of 3.50 percent Na2Oequiv. The mortar bars are then
placed for 5 hours in an autoclave under 0.17 mPa (25 psi) at about 1300C.
When quarried silicate aggregates from Quebec were evaluated under the above
conditions, a proposed expansion limit of 0.10% expansion after 5 hours was found
to be acceptable, and the test was found to be more reliable than the accelerated
mortar bar test, ASTM C 1260. Limestones and dolostones have also been evaluated
using this test method. A proposed expansion limit of 0.15 percent after 5 hours
produced acceptable results that correlated to the field performance of aggregates.
Other aggregates were evaluated, and the results indicated that this autoclave method
23
is as reliable as C 1260. The only reactive aggregate that was not detected using the
autoclave was the same one that was not detected using the C 1260 procedures.
3.2.6 Concrete Prism Method CAN/CSA-A23.2-14A (ASTM C 1293) (Bérubé
and Fournier, 1993)
This test is recommended for all types of aggregates, and a limit of 0.040 percent
expansion after one year seems to be acceptable for all reactivity levels.
The expansion of concrete prisms under the environments of the test are affected by:
1. Water-cement ratio: For reactive limestone aggregates, the expansion decreases
as the water-cement ratio increases. Similar results were obtained when
greywackes and argillite aggregates were tested. This behavior was similar to the
one observed with the C 227 test, and the same reasoning can be applied to the
concrete test. Opposite results were observed when opaline aggregates were
tested. Other research studies have shown that by using 410 kg/m3 of cement to
make test prisms, the test was capable of predicting the potential reactivity of
aggregates to correspond to field-performance data (Grattan-Bellew, 1990).
2. Cement fineness: the finer the cement, the more rapidly the alkalis in the cement
are diluted, and the higher the expansions (Krell, 1986).
3. Storage conditions (temperature and humidity): The storage conditions have a
great deal of influence on the test results. Several research studies have
concluded that storing concrete prisms over water, in a sealed container with
wicks on the sides, at 100% R.H., and at 380C resulted in the most accurate
method for predicting potential reactivity of aggregates (Rogers and Hooton,
1989; Bérubé and Fournier, 1993, etc.)
24
3.2.7 Accelerated Concrete Prism Method (Used in Quebec) (Bérubé and
Fournier, 1993)
This test method consists of storing the concrete prisms in 1M NaOH solution at
800C. It was found that a limit of 0.04% after 24 days was adequate for identifying
most of the reactive aggregates but was too severe for several numbers of innocuous
aggregates. It was concluded that this test should only be used as a screening method
but not for rejecting aggregates. Testing cores taken from field structures under the
conditions of this test is a very useful method for rapidly identifying the reactivity of
the aggregates in the core.
3.2.8 The Duggan Test (Bérubé and Fournier, 1993)
Scott and Duggan proposed a testing procedure in which concrete prisms are cast
and submitted to accelerated curing. Small cores, 22-mm diameter by 50-mm length,
are taken from the prisms and subjected to cycles of immersion in distilled water at
210C. The cores are then heated in air at 820C after which the first reading is taken.
Subsequently the cores are stored in distilled water and periodic expansion readings
are taken. An expansion limit of 0.10% after 20 days of immersion is proposed as a
cut-off point between reactive and innocuous aggregates (Scott and Duggan, 1986).
The same researchers have proven in a later study that this test results in erroneous
aggregate characterization and is not adequate for alkali-silica reaction (Scott and
Duggan, 1990).
3.2.9 Conclusions of the Survey by Fournier and Bérubé
Table 3.1 includes a list of all testing procedures mentioned by Bérubé and
Fournier (1993). Three tests were recommended: 1) the petrographic examination, 2)
ASTM C 1260 because it was the only rapid method that is statistically dependable,
and 3) ASTM C 1293, which is required if the tested aggregate failed the
25
petrographic examination and caused excessive expansions using C 1260. A
summary of these tests is presented in Table 3.2 (Ativitavas, 1998).
Table 3.1: Testing Methods for Potential Aggregate Reactivity (Bérubé, 1993)
• Petrographic Method - ASTM C295 (≥ 1 day)
• Chemical Methods - ASTM C 289 Chemical Method (2-3 days) - Modified Chemical Method (ASTM C 289 on insoluble residues) (2-3
days) - German Dissolution Test (1 day) - Osmotic Cell Test (< 40 days) - Gel Pat Test (≥1 week) - Chemical Shrinkage Method (1 day)
• Mortar-Bar Methods - ASTM C 227 Method (6 months) -AFNOR P 18-585 Method (6 months) - CCA Method (6 months) - Danish Accelerated Method (5 months) - NBRI or ASTM C 1260 Accelerated Method (2 weeks) - Autoclave Methods (Chinese, Japanese, Canadian ) (≥ 3 days)
• Concrete-Prism Methods - CAN/CSA A 23.2-14A or ASTM C 1293 (1 year) - AFNOR P 18-587 Method (8 months) - South African Method (21-24 days) - BSI 812 Method (1 year) - CCA Method (6 months) - Accelerated Method (used in Quebec) (1 month) - Autoclave Methods
26
Table 3.2: Most Widely Used Aggregate Tests for Identifying ASR Reactivity (Ativitavas, 1998)
Test
Method
Procedure
Type of Sample
Criteria
Significant Points
ASTM C 227 Potential Alkali Reactivity of Cement-Aggregate Combinations (Mortar-Bar Method)
Mortar bars are stored over water at high relative humidity and 38ºC (100ºF). Expansions are measured at 14 days, 1, 2, 3, 4, 6, 8, and 12 months and every 6 months after that if necessary
At least 2 mortar bars with standard dimensions 25x25x285 mm (1x1x11-1/4 in)
- 1- year expansion > 0.10% = Reactive - 1-year expansion < 0.10% = Innocuous - 3-month expansion > 0.05% = Reactive - if 3-month expansion < 0.05% wait for the 1-year expansion
1. Low cost 2. Slow test (6-month) 3. Fails to detect slowly reactive
aggregates (expansion is too small). 4. Wicks create excessive leaching of
alkalis out of mortar resulting in expansion reduction
5. There is a reduction of aggregate size (not realistic)
6. Aggregate surface is not the same as that of aggregate in field structures
7. All papers concerning C 227 stated that it is too mild
8. Fournier, Bérubé (1992) modified the test by increasing alkali content to 1.25% Na2Oequiv. and using plastic pails instead of wicks
ASTM C 289 Potential Alkali-Silica Reactivity of Aggregates (Chemical method)
Crushed aggregates are reacted with alkaline solution at 80ºC (176ºF) during 24 hours. Amount of dissolved silica and reduction in alkalinity are measured
Three of 25-gr samples of crushed and sieved aggregate
Plot Sc and Rc on a graph and locate the aggregates in predetermined potentially deleterious or innocuous areas
1. Quick 2. Good for highly reactive aggregates 3. Fail for slowly reactive aggregates
such as gneiss, schist quartzite. 4. Complicated 5. Costs more than C 1293 and C 1260 6. Considerable amount of carbonate in
silicate aggregates could alter the results and underestimate Sc value
ASTM C 1260 Potential Alkali Reactivity of Aggregates (Accelerated mortar-bar method)
Mortar bars are immersed in 1N NaOH solution at 80ºC (176ºF) and expansions are measured at 4, 7, 11, and 14 days
At least 3 mortar bars with standard dimensions 25x25x285 mm (1x1x11-1/4 in)
1. Too severe; aggregates with good field performance may test reactive
2. Can detect slowly reactive aggregates 3. Fails to detect reactive granites,
gneisses which have microcrystalline quartz associated with strained quartz
4. Increase in alkali content of cement causes only small change
5. Reliable to evaluate the effectiveness of cementitious materials
6. If expansion > 0.10%, concrete prism test should be performed for confirmation
ASTM C 1293 Test Method for Concrete Aggregates by Determination of Length Change of Concrete Due to ASR
Concrete prisms are stored over water at 38ºC (100.4ºF). Expansions are measured at 7, 28, 56 days, and 3, 6, 9, 12 months and every 6 months after that if necessary
3 prisms per cement-aggregate combination with standard dimensions: 75x75x285 mm (3x3x11-1/4 in)
Expansion of 0.04% or more at one year indicates potentially deleteriously reactive
1. More realistic 2. Low cost 3. Slow test (1 year) 4. Is very much dependent on storage
conditions 5. The use of damp tissue to wrap each
prism placed in sealed plastic bags gave good results
6. Testing in 1M NaOH at 80ºC gave the most rapid expansion but is unreliable.
7. Testing in 1M NaCl caused a combination of at least two expansion mechanisms
8. Testing in 1M NaOH at 38ºC is recommended
ASTM C 295 Petrographic Examination of Aggregates for Concrete
Visual examination and analysis of the sample by microscopy or other methods such as X-ray diffraction, differential thermal analysis or electron microscopy
Core sample, thin sections, or pieces of aggregates
Appearance of dark rim at the surface of aggregate. Certain amount of reactive constituents
1. Reliability depends on the experience of petrographers
2. Analysis of aggregates before casting is useful
3. Performing additional tests is recommended
27
3.3 ASR MITIGATION MEASURES
Mitigating or preventing deleterious expansions caused by the alkali-silica
reaction can be achieved by:
1. Limiting moisture: The alkali-silica reaction will not take place in a concrete
structure if the internal relative humidity of the concrete is lower than 80%. As a
result, keeping the concrete dry will prevent the reaction from occurring.
However, this is practically impossible for exterior structures. Lowering the
permeability of concrete by reducing the water-cement ratio reduces the internal
moisture and delays the reaction. However, a low water-cement ratio results in a
higher cement content, higher alkali content, and a reduced pore space, which
could lead to higher expansions (ACI 221, 1998). Lowering the permeability of
concrete using mineral admixtures is a more viable approach to reducing the
deleterious effects of ASR (ACI 221, 1998). A protective coating for concrete is
a good solution provided that the coating is correctly applied. Because of the
high cost of concrete coatings, this method has been used on a limited basis.
2. Selecting Non-Reactive Aggregates: Using a non-reactive aggregate in concrete
and avoiding reactive aggregates will prevent ASR damage. This demands an
accurate testing protocol capable of correctly predicting the ASR reactivity of
aggregates. Such tests exist but need more refining and improvements (ACI 221,
1998). This is not economical in some regions where all locally available
aggregates are considered reactive.
3. Minimizing Alkalis: The most commonly used mitigation method is to control
the alkali content in the concrete for the purpose of reducing the hydroxyl ion
concentration and eventually the pH of the concrete. Cement is the major source
of alkali in the concrete. Alkalis are also provided, in smaller amounts, from fly
ash, mixing water, chemical admixtures, aggregates, and external sources such as
de-icing salts and seawater. Controlling the alkali content of the cement has been
proven to decrease the expansions caused by ASR. A proposed limit of 0.60%
28
has been recommended for the alkali content of cement to be used in concrete to
reduce ASR expansions (ACI 221, 1998).
4. Mineral Admixtures: Ever since the alkali-silica reaction was discovered,
researchers have reported on the effectiveness of mineral admixtures in reducing
its deleterious effects on concrete. Effective mineral admixtures include fly ash,
silica fume, ground granulated slag, and calcined clay. In addition, there exist
documents reporting structures over 25 years old containing reactive aggregates
and 20 to 30 percent fly ash. Mineral admixtures reduce ASR expansions by one
or more of the following mechanisms:
Reducing the alkali content of the concrete mix.
Reducing the pH of the concrete pore solution.
Consuming the calcium hydroxide, which might result in less swelling.
Reducing concrete permeability.
Testing for the effectiveness of mineral admixtures is a challenge. Researchers
have reported that ASTM C 441, Effectiveness of Fly Ash and Mineral Admixtures
in Reducing Deleterious ASR Expansions, is not a valid test for investigating the
effectiveness of mineral admixtures (ACI 221, 1998). ASTM C 1260 has been
successfully used for this purpose. If ASTM C 1293 is to be used, a two-year
period is recommended for obtaining the final expansion results (ACI 221, 1998).
5. Chemical Admixtures: Lithium salts have been used to prevent excessive ASR
expansions. Several salts have been tried, some of which have shown to be
effective. The best results were obtained using lithium nitrate (LiNO3) because
1) it is non-toxic and 2) minimal amounts were found to significantly reduce the
ASR expansions (ACI 221, 1998).
6. Air Entrainment: It was reported that adding 4% of entrained air to concrete
reduced the ASR expansions by 40%. It was also noticed that the expanding gel
had filled the air void system. However, this method has not yet been thoroughly
investigated nor has it been used in the field (ACI 221, 1998).
29
3.3.1 Minimizing Alkalis
The maximum limit of 0.60% Na2Oequivalent in cement was the result of a study
initiated in 1940 by Stanton of the California Division of Highways (Hill, 1996).
During the same period of time the Bureau of Reclamation imposed the same limit
on their “important” projects, basing their decision on the work conducted by Blanks
and Meissner in 1945. Although the Bureau of Reclamation concluded that a 0.50%
Na2O is a much safer limit, a 0.60% limit was considered adequately safe and more
economical. Several other research studies performed between 1941 and 1963,
namely, by Tremper (1941 and 1944), Kammer and Carlson (1941), Woolf (1952),
Bryant Mather (1952), and Oleson (1963), all concluded that cement with alkali
contents lower than 0.60% have shown very little to no ASR damaging effects (Hill,
1996).
Over the years, the 0.60% Na2Oequivalent limit in the cement has been proven to be
very effective in preventing concrete damage due to ASR. There are, however, some
instances where cements with Na2Oequivalent of less than 0.60% and even less than
0.40% have resulted in deleterious expansions due to ASR (Hill, 1996). In 1978,
Starks discovered concrete pavements in southeastern Wyoming and pavement
sidewalks in the Albuquerque, New Mexico area that had been deteriorated, in less
than 12 years, due to excessive ASR expansions. The alkali content of the cements
used for these projects was just under the 0.60% Na2Oequivalent limit. He also noticed
that some older structures in these areas constructed using cements with alkali
contents of about 0.48% have shown no ASR damage while some of them have
shown some map cracking. This fact was also noted by the first ASR researchers of
the 1940s who noticed that some aggregates might cause deleterious effects even
with very low-alkali-content cements (Hill, 1996).
30
While the emphasis in the United States was concentrated on limiting the alkali
content of the cement, some of the western European countries as well as Canada
were trying to limit the alkali content of the concrete including alkalis from the
cement, aggregates, mineral, and chemical admixtures (Hill, 1996).
Since there is a large diversity in natural aggregates, there is no magic number
that can be specified for the alkali limit of cement in order to prevent alkali-silica
reaction in concrete. A combination of measures might have to be employed to
prevent the reaction and that includes the use of low alkali cement in combination
with a mineral admixture (Hill, 1996).
3.3.2 Effectiveness of Supplementary Cementing Materials
The effectiveness of supplementary cementing materials (SCM) in suppressing
ASR in concrete has been a subject for extensive research for a long time. Various
researchers and authors have reported opposing results on their effectiveness mainly
because of the wide range of available fly ash types and the different properties and
reactivity of aggregates being investigated (Shayan et al., 1996).
To minimize the risk of damage due to alkali-aggregate reaction in concrete
containing reactive aggregates, current UK guidelines permit the use of fly ash.
However, definite advice on the use of fly ash in concrete and on percentages to use
is not included in the guidelines because there exists conflicting evidence regarding
the alkali content of the fly ash and whether these are available for reacting with the
aggregate causing additional ASR damage (Thomas, Blackwell, and Nixon; 1996).
This is especially a concern when the total alkali content of the concrete is being
controlled below a certain level in order to prevent ASR damage. Several
recommendations exist on how to deal with the alkali content of fly ash, including
(Thomas, Blackwell, and Nixon; 1996):
31
1. The Concrete Society (UK) recommends using the water-soluble alkali content of
the fly ash for determining the total alkali content of the concrete, and
2. The Building Research Establishment (UK), Department of Transport (UK),
French Guidelines, and Ireland guidelines recommend using one-sixth of the total
alkali content of the fly ash to calculate the total alkali content of the concrete.
This is a more conservative approach since 0.40% to 0.70% Na2Oequiv. is
equivalent to 0.10% water-soluble alkali content.
Evidence from the literature show that the use of sufficient levels of Class F fly
ash is effective in preventing ASR expansions in concretes containing natural
reactive aggregates even when the alkalis from sources other than the fly ash are
enough to cause deleterious expansions in concretes without any fly ash (Thomas et
al., 1996). In this case, the fly ash is considered to have a positive effect and to have
no reactive alkali contribution. However, when moderate levels of fly ash are used
in concrete containing very highly reactive aggregates with low alkali content
cements, then the fly ash will likely contribute alkalis to the reaction. In this case,
higher replacement levels may be required in order for the fly ash to completely
prevent the reaction from causing damage (Thomas, Blackwell, and Nixon; 1996).
In order to clarify these matters, Thomas, Blackwell, and Nixon (1996) reported
about a study where five reactive aggregate sources from the UK area were
investigated. Aggregates were used to make concrete specimens using one high-
alkali portland cement (1.15% Na2Oequiv.) and three Class F fly ashes with varying
total alkali content (2.98, 3.46, and 3.86% Na2Oequiv.). Fly ash was used at different
replacement levels and concrete prisms were stored in plastic containers at 200C and
100% relative humidity. At 7 days, initial length measurements of all prisms were
taken before wrapping them in moist toweling and polyethylene. Some of the
wrapped prisms were stored at 200C while some were stored at 380C all at 100%
32
humidity. For the particular materials used in this study (UK reactive aggregates and
UK Cement and Class F fly ash) it was determined that (Thomas, Blackwell, and
Nixon; 1996):
1. The effective alkali contribution of the ash depends upon the nature of the
reactive aggregate and the levels at which the weight of cement is replaced with
the fly ash (Figures 3.4 and 3.5).
2. The alkali content of concrete in the control specimens (neglecting the alkalis in
the fly ash) was enough to cause deleterious expansions and cracking of
specimens containing moderately reactive flint. Replacing the cement with 25%
fly ash was effective in reducing expansions. As a result, it was noted that the fly
ash has a positive effect in reducing damage due to AAR and does more then just
dilute the alkalis in the cement. Using the same reactive aggregate but replacing
6% of the cement with fly ash resulted in an increase in expansions for a given
cement alkali content. It was determined that 40% of the total alkalis in the fly
ash contributed to the expansions of concrete specimens. These matters are
illustrated in Figures 3.6 and 3.7.
3. Replacing 25% of the cement weight with fly ash was not effective in preventing
excessive expansions and cracking of specimens containing highly reactive
aggregates (e.g. aggregates that cause deleterious expansions with low-alkali-
content cement). These aggregates required using 35% fly ash by weight. The
contribution of the total alkalis in the fly ash to the expansions was estimated to
be 10%. This is illustrated in Figure 3.8.
4. It is inappropriate to use a single value (e.g. one-sixth of the total alkali content in
ash) to estimate the contribution of the alkalis of the fly ash to the rate of ASR. It
is dependent upon the aggregate nature and levels of replacements. In addition,
using this approach ignores mechanisms, other than the alkali availability, that
contributes to the efficiency of the fly ash in reducing ASR damage.
33
0
20
40
60
80
100
2 3 4 5 6
Threshold alkali content for expansion in OPC concrete: kg/m3 Na2Oequiv.
Eff
ectiv
e al
kali
cont
ribu
tion
from
fly
ash:
%to
tal a
lkal
i Cristobalite
Greywacke
Siltstone/Siliceous limestoneThames Valley Sand
6% fly ash
25% fly ash35-40% fly ash
Figure 3.4: Effect of Aggregate Reactivity and Percent Fly Ash Replacement on the Effective Alkali Contribution from Fly Ash
(Thomas, Blackwell, and Nixon; 1996) OPC = Portland Cement Concrete with No Additives
34
0
10
20
30
40
50
60
70
80
90
100
0 5 10 15 20 25 30 35 40
Replacement Level: %
Eff
ectiv
e al
kali
cont
ribu
tion
from
fly
ash:
% to
tal a
lka
CristobaliteSiltstone/ Siliceous Limestone
Thames Valley Sand
Moderately Reactive
Highly Reactive
Figure 3.5: Effect of Aggregate Reactivity on the Effective Alkali Contribution from Fly Ash (Thomas, Blackwell, and Nixon; 1996)
35
0
0.1
0.2
0.3
0.4
3 4 5 6 7
OPC alkali content: kg/m^3 Na2Oequiv.
Exp
ansi
on a
t 4 y
ears
: %
Control - (no fly ash)25% F125% F225% F3
0
0.1
0.2
0.3
0.4
3 4 5 6 7
OPC alkali content: kg/m^3 Na2Oequiv.
Exp
ansi
on a
t 3 to
4 y
ears
: %
Control - (no fly ash)
6% F1
Figure 3.6: Using 25% Class F Fly Ash to Prevent Cracking of Concrete Made with a Moderately Reactive Aggregate (Flint) (Thomas, et al.; 1996)
OPC = Portland Cement Concrete with No Additives
Figure 3.7: Effect of Using 6% Class F Fly Ash with a Moderately Reactive Aggregate (flint) (Thomas, Blackwell, and Nixon; 1996)
OPC = Portland Cement Concrete with No Additives
36
0
0.1
0.2
0.3
0.4
0 2 4 6 8
OPC alkali content: kg/m^3 Na2Oequiv.
Exp
ansi
on: %
Control - 3 years25% F3 - 4 years35% F3 - 4 years
Specifications for using fly ash as an ASR mitigation alternative should take into
consideration that highly reactive aggregates require higher amounts of fly ash in the
mixture. As the calcium content of the fly ash increases (Class C fly ash), the
amounts of the fly ash used in the concrete should also be increased.
Pepper and Mather (1952) found that any deleterious expansion caused by ASR
can be eliminated by the use of a range of fly ash and other mineral admixtures.
Nixon and Gaze (1983), Nixon et al. (1986), and Stark (1978) investigated the
effectiveness of fly ash with slowly reactive aggregates and concluded that when 20
or 30% of the weight of cement was replaced with Class F fly ash, deleterious ASR
expansions were eliminated.
Figure 3.8: Effect of Class F Fly Ash on Cracking of Concrete Made with a Highly Reactive Aggregate (Thomas, Blackwell, and Nixon; 1996)
OPC = Portland Cement Concrete with No Additives
37
Factors that influence the effectiveness of fly ash in mitigating ASR include the
composition of the cement and fly ash, levels of replacement and the fineness of the
admixture. Dunstan (1981) found that while 25% fly ash addition was effective in
reducing ASR expansion, 5 to10% addition resulted in increasing the expansions
depending on the alkali content of the cement. Thomas et al. (1991) found that when
high-alkali fly ash was used to replace 20% or more of the weight of cement in
concrete specimens containing a very reactive aggregate, ASR was greatly reduced
and very little evidence of the reaction was recorded. Blackwell et al. (1992) showed
that a Class F fly ash with 4.0% Na2Oequivalent was effective in preventing excessive
ASR expansions in concrete specimens made with a reactive greywacke and a high
alkali content concrete (7.0 kg Na2Oequivalent/m3). A 30-year testing program was
presented by Thomas et al. in 1992 which provided long-term evidence on the
effectiveness of 20% to 30% of a high alkali Class F fly ash in preventing ASR
cracking in a dam structure containing a reactive greywacke. Portions of the dam
that were constructed without the use of fly ash showed extensive ASR cracking.
To determine the effectiveness of fly ash, Hobbs (1994) conducted a study using a
very reactive synthetic cristobalite aggregate. He concluded that ASR expansion
depended upon 1) the alkali content of the cement (0.60-1.20% Na2Oequiv.), 2) the
alkali content of the fly ash (3.0-3.9% Na2Oequiv.), and 3) the level of replacement. He
found that the alkali contribution from Class F fly ash depended upon the level of
replacement as indicated in Table 3.3. The effect of Class F fly ash is illustrated in
Figure 3.9.
38
Table 3.3: Alkali Contribution from Fly Ash: Concrete with Cristobalite (Highly Reactive) (Hobbs, 1994)
Alkali Contribution from fly ash: % Total alkali content
Cement Alkali:% Na2Oequiv.
6% Ash Class F
25% Ash Class F
40% Ash Class F
0.6 100 16 9 0.9 100 11 3 1.2 60 0 0
Figure 3.9: Effect of Class F Fly Ash on Expansions of Concrete Containing a Highly Reactive Aggregate (Cristobalite) (Hobbs, 1994)
OPC = Portland Cement Concrete with No Fly Ash
39
The calcium content of fly ash (Class C fly ash) also plays a role in its
effectiveness in suppressing ASR. Lee (1989) suggested that ASR expansions are
dependent upon the specific Na2O/SiO2 ratio of the fly ash. Nagataki et al., 1991,
investigated eight different fly ashes using high alkali cement and pyrex glass as a
reactive aggregate. They concluded that the ASR expansions were related to the
amount of soluble alkali and amorphous SiO2 content of the fly ashes as well as their
fineness. The reaction can be controlled by using finer SiO2 ashes with higher
amount of amorphous SiO2, and higher replacement levels. This is illustrated in
Table 3.4 and Figures 3.10 through 3.12, where it can be seen that fly ash F was the
most effective and had the finest SiO2 and the highest amount of amorphous SiO2.
They also concluded that the total alkali content of the fly ashes did not have any
effect in controlling ASR expansions.
Table 3.4: Chemical Compositions of three Investigated Ashes (Nagataki et al., 1991)
Alasali and Malhotra (1991) evaluated the effectiveness of high volume Class F
fly ash in preventing ASR damage caused by excessive expansions. Concrete
specimens were made using Class F fly ash with 58% of the weight of cement
replaced and a water-cementitious materials ratio of 0.31. NaOH was added to the
mixing water in order to increase the alkali content of the concrete. Concrete
specimens were stored under different curing conditions, namely, moist room at 230C
dry and wet cycles at 380C, in water at 380C, in 5% NaCl solution at 380C, in 1M
NaOH solution at 380C, in 1M KOH solution at 380C, in 5% NaCl solution at 800C,
in 1M NaOH solution at 800C, and in 1M KOH solution at 800C. Expansion
measurements were carried out for 275 days. It was concluded that expansions of
concrete prisms made with 58% Class F fly ash were insignificant regardless of the
test method used and of the addition of NaOH to the mixing water. Figure 3.19 is an
Figure 3.18: Effect of Selective Natural Pozzolans on the 14-Day Expansions of Mortar Bars Made with a Highly Reactive Aggregates and Tested Using ASTM
C 1260 (Johnston et al., 1997)
50
example of the expansions generated when concrete prisms were stored in a 1M
NaOH solution at 380C.
-0.02
0
0.02
0.04
0.06
0.08
0.1
0.12
0.14
0 100 200 300
Age, Days
Exp
ansi
on, %
No Fly Ash
No Fly Ash + Alkali
Cement + Fly Ash
Cement + Fly Ash +Alkali
The Canada Center for Mineral and Energy Technology (CANMET), under
contract to Lafarge (Canada), investigated the effectiveness of 15 fly ashes, slags,
condensed silica fume, and natural pozzolans in reducing expansion of concrete and
mortar caused by alkali-aggregate reaction. Two reactive siliceous aggregates were
used in combination with the cementitious materials and high-alkali-content cement
and results were compared to expansion of specimens made with low-alkali-content
cement. Expansions were monitored over a five-year period. Properties of
investigated fly ashes are included in Table 3.8, and properties for investigated silica
fume, natural pozzolan, and slag are included in Table 3.9.
Figure 3.19: Expansions of Concrete Prisms Made Using a Cement with 1.13% Alkalis, a Reactive Aggregate (Spratt), and 58% Class F Fly Ash. Prisms were Stored in a 1M NaOH Solution at 380C (Alasali et al., 1991)
51
Table 3.8: Properties of Investigated Fly Ashes (Chen et al., 1993)
Table 3.9: Properties of Investigated Silica Fume, Natural Pozzolan, and Slag (Chen et al., 1993)
52
It was concluded that (Chen et al., 1993):
1. The desirable characteristics of a cementitious material for reducing ASR
expansions due to AAR are:
a) low-alkali content
b) high-45-µm fraction
c) high total acidic oxides (SiO2 + Al2O3 +Fe2O3).
2. ASTM C 441 and ASTM C 618 are not reliable in assessing the effectiveness of
cementitious materials in mitigating ASR.
3. From the materials listed in Tables 3.8 and 3.9, only several were effective in
decreasing expansions below testing limits. Findings for the effective materials
are summarized in Table 3.10. It should be noted that only Class F fly ashes were
effective in decreasing expansions below a safe limit and that none of the
investigated Class C ashes were effective in doing so.
Table 3.10: Effective Levels of Replacements for Materials Effective in Mitigating ASR Damage (Chen et al., 1993)
4. The effectiveness of the cementitious materials in reducing expansions was
coupled with a reduction of compressive strength of concrete. Fly ashes that were
effective in reducing ASR, especially at 50% cement replacement level, resulted
in lower compressive strengths. The reduction was greater in the 28-day strength
than the 84-day strength. Fly ashes that were not effective in reducing ASR
expansion either increased concrete strength or maintained the same strength of
the control concrete. Silica fume and natural pozzolans that were effective in
reducing ASR expansions resulted in a substantial increase in 28- and 84-day
strengths. When cement was replaced with 65% slag, the ASR expansions were
lower than testing limits; however, the concrete strength was decreased.
A study was conducted at King Fahd University of Petroleum and Minerals in
Dhahran, Saudi Arabia. Using ASTM C 441 and ASTM C 227 the following
conclusions were drawn (Rasheedbuzafar, 1991):
1. Replacing cement with 10 to 20% silica fume or 60 to 70% slag reduced the C
227 6-month expansions below the limit of 0.10% as seen in Figure 3.20.
2. There is a strong indication that the mechanism by which the silica fume and slag
reduce ASR expansion is through lowering the hydroxide ion concentration in the
pore solution. However, there are also some deviations that indicate that other
mechanisms are taking place.
3. When used with low-alkali cements, 60% of slag was found to be very effective
in removing alkalis from the pore solution and thus reducing ASR expansions.
When using comparable alkali contents of cements, 60% slag had similar effects
to 10% silica fume. As the alkali content of the cement increased, the
effectiveness of slag decreased.
4. Replacing cement with 10% silica fume was adequate in controlling ASR
expansions.
54
0.865
0.009
0.023
0.047
0.028
0 0.2 0.4 0.6 0.8 1
Plain Concrete
10% Silica Fume
20% Silica Fume
60% Slag
70% Slag
6-Month Expansion, %
In 1996, Thomas published a report in which he included a critical review of
published work up to May of 1994. The literature review concentrated on work
completed towards better understanding of the effects of fly ash and slag on ASR
expansions. More than 400 published references were examined and evaluated.
Particular attention was concentrated on work performed by the:
1. National Building Research Institute (NBRI) in the Republic of South Africa,
2. British Cement Association (BCA),
3. Building Research Establishment (BRE) in London,
4. CSIRO in Australia,
5. The University of Texas at Austin, and
6. Concrete Society Technical Sub-Committee on AAR.
Figure 3.20: C 227 Expansion after 6 Months for Specimens Made with Different Replacement Levels (Rasheedbuzafar, 1991)
55
Class F fly ash, Class C fly ash, and slag concrete structures from around the
world were reviewed. Most of the structures with the exception of two showed
adequate performance because of the use of Class F fly ash, Class C fly ash, and slag
(Thomas, 1996).
The following conclusions and recommendations were noted:
1. ASTM C 441 is not reliable for assessing the effectiveness of fly ash and slag in
mitigating ASR.
2. The satisfactory performance of Class F fly ash, Class C fly ash, and slag
concrete structures from around the world should confirm their ability to mitigate
damaging ASR. However, there are a few exceptions in which fly ash and slag
concrete performed poorly, which emphasizes that these materials do not
guarantee a cure.
On the Use of Fly Ash (Thomas, 1996)
3. Low calcium fly ash (Class F) is not very effective with highly reactive
aggregates that are reactive with low alkali cements (less than 0.50%), such as
cristobalite and silstone. However, low-calcium fly ash is highly effective with
the less reactive aggregates such as greywacke, argillite, quartzite, etc.
4. Limiting the alkali content of the concrete will not enhance the effectiveness of
low-calcium fly ash (Class F). “The expansion in fly ash concrete appears to be
somewhat independent of the concrete alkali content in many cases.”
5. As the calcium content of the fly ash increases, its effectiveness decreases and
the proportion needed for effective mitigation increases for the same aggregate.
6. High-calcium fly ash (Class C), as well as slag, is very sensitive to the alkali
content of the concrete.
7. It is very critical to be able to classify the reactivity of an aggregate before
attempting to specify an adequate level of fly ash or slag replacement. However,
56
such an aggregate classification did not exist at the time the report was
conducted.
8. Table 3.11 includes an example of specifying fly ash for effective use. The levels
in the table are approximations.
Table 3.11: Example for Specifying Fly Ash with Reactive Aggregates (Thomas,
1996) Minimum fly ash proportion (%)
Aggregate Reactivity CaO content of ash (%)
Low
Medium
High
Max. Total alkali level
in ash (Na2Oequiv.)
Max. OPC Total alkali in
concrete kg/m3 Na2O
< 10 (Class F) 20 30 40 5.0 5.0
10 – 20 25 40 50 4.5 4.0 > 20
(Class C) 35 50 60 4.5 3.0
OPC = Original Portland Cement with No Additives
On the Use of Slag (Thomas, 1996)
9. Slag is less effective with highly reactive aggregates that are reactive with low
alkali cements (less than 0.60%).
10. As the reactivity of aggregates decreases, the effectiveness of the slag increases
with increasing level of replacement (greater than 65% replacement). At this
stage, the contribution of the alkali content of the cement is less important.
11. The contribution of the alkali content of the cement becomes more significant at
lower levels of slag (less than 50% replacement).
12. When low levels of replacement are used with highly reactive aggregates, the
alkali content of the slag becomes very critical. The higher the alkali content of
the slag the less effective it is in reducing the ASR expansions below safe limits.
13. Slag is less effective than low-calcium fly ash (Class F). Slag is also more
influenced by its alkali content and the alkali content of the cement than low-
calcium fly ash.
57
14. An example of slag specification is included in Table 3.12.
Table 3.12: Slag Specification Example (Thomas, 1996) Maximum Slag Proportion (%)
Aggregate Reactivity Defined by ASTM C 1293 Total Alkali Level in
blended cement (OPC + slag)
(% Na2Oequiv.) Low Medium High < 0.8 35 50 65
0.8 –1.5 50 60 70 > 1.5 60 70 75
Max. OPC alkali level in concrete (kg/m3 Na2Oe)
3.5 3.0 2.5
OPC = Portland Cement with No Additives
On Rapid Testing Procedures for Supplementary Cementitious Materials (SCM)
(Thomas, 1996)
15. ASTM C 441 is unsatisfactory. There is a need for developing test methods that
will accurately determine the effect of SCM in a reasonable amount of time.
16. There is an increasing interest and success with the use of ASTM C 1260
procedures. However, this test method “requires a higher level of Class C fly ash,
Class F fly ash, and slag to control deleterious expansion compared to the
standard concrete test, ASTM C 1293.”
3.3.3 Control Mechanisms of Supplementary Cementitious Materials (SCM)
The various proposed mechanisms of control can be summarized as follows (Xu
et al., 1995):
1. The pozzolanic reaction between mineral admixtures and cement hydrates results
in a decrease in the permeability of the cement paste which in turn reduces the
mobility of ions in the concrete,
2. Mineral admixtures will result in higher strength that provides higher resistance
to the expansive stresses produced by ASR,
58
3. The alkalinity of the concrete pore solution is reduced by the use of mineral
admixtures,
4. Mineral admixtures deplete Ca(OH)2 in the cement paste,
5. The pozzolanic reaction produces a secondary hydrate that entraps alkali ions in
the cement.
The chemistry of pore solution of cement pastes incorporating different amounts
of two silica fumes, three pulverized fly ash, and one ground granulated blast furnace
slag was evaluated by Ducheness and Bérubé (1994) using the high-pressure
extraction method. Examinations were performed after curing the cement pastes for
7, 28, 84, 182, 364, and 545 days at 380C and 100% relative humidity. Results of the
pore solution examinations were related and compared to expansions obtained over a
two-year period using the Concrete Prism Test, ASTM C 1293 or CAN/CSAA23.2-
14A. Concrete specimens were made with two very reactive aggregates using the
same water-cementitious materials ratio. An expansion lower than 0.04% after two
years was considered to be innocuous. It was concluded that the effectiveness of
silica fume, fly ash, and slag was attributed to their ability for decreasing the alkali
concentration in the pore solution down to a safe level. An alkali concentration of
0.65M, NaOH + KOH, over a long period of time was recommended. No significant
expansions occurred in specimens made with very reactive aggregates which had
pore solutions with alkali concentrations below 0.65N. This level was more easily
reached when the alkali contents of the cementitious materials and the concrete were
the lowest and the cementitious materials content was the highest (Duchenesse and
Bérubé, 1994).
59
3.4 FINAL REMARKS
After reviewing the selected research discussed earlier, it was clear that even
though there exist conflicting results about the effectiveness of some of the
mitigation alternatives, it is possible to mitigate ASR in concrete. The effectiveness
of an alternative depended upon the degree of reactivity of aggregates, the type of
alternative used, and the dosages used. It was also noticed that there is a lack of
specifications for the use of mitigation alternatives, which is mainly caused by the
large variety of aggregate reactivity and by the lack of accurate testing procedures
capable of predicting the degree of aggregate reactivity and determining the
effectiveness of a proposed alternative. It is possible, however, to develop guidelines
and recommendations to be used for minimizing concrete damage due to ASR. These
guidelines and recommendations need to be formulized and proven.
60
CHAPTER FOUR
REVIEW OF INTERNATIONAL EXPERIENCE WITH ASR
4.1 INTRODUCTION
An international survey was conducted in order to determine the state-of-the-art of
alkali-silica reaction worldwide. The survey concentrated on two major areas:
1. testing methods used to predict aggregate reactivity, and
2. alternatives used for mitigating the reaction.
The following is a brief summary of the survey of practices worldwide for dealing
with alkali-silica reaction in concrete.
4.2 RILEM SURVEY (Nixon And Sims, 1996)
A RILEM technical committee, RILEM TC-106 (Alkali-Aggregate Reaction),
was formed in 1988 to develop internationally approved methods for identifying the
alkali-reactivity of aggregates. The committee conducted a survey of participating
countries and was regularly updated. The following section presents the findings of
the survey.
Results from the survey, summarized in Table 4.1, indicated that there exists a
general interest in each of the petrographical, chemical, and expansion tests
categories, with the most emphasis and recognition being concentrated on the most
accelerated expansion tests methods such as ASTM C 1260. However, different
countries preferred different tests, and it was not possible to find a single test or a
series of tests that has been adopted by most countries. In addition, it was not
possible to find a “strong relationship between the reactive aggregates identified and
the methods preferred for aggregate testing and assessment.” (Nixon and Sims, 1996)
It was also found that there is an increased interest in developing test methods
capable of producing reliable results in a short period of time. Although ASTM C
61
1260 is gaining acceptance in a number of countries, several other test methods are
being developed and investigated.
It was not clear from the survey if the acceptance of a certain test method in a
country was based on the ability of a test method to predict the behavior of
aggregates in actual structures or service records. The general impression was that
test methods have been adopted from elsewhere and the interpretative criteria of the
test have been modified based on local experiences.
Table 4.1: Survey Results (published by RILEM in 1996)
Country
Petro-graphy ASTM C 295
Chemical ASTM C 289
Expansion
Mortar ASTM C 227
Expansion Concrete ASTM C 1293
Expansion Ultra-
Accel’d ASTM C 1260
Other Australia Belgium Denmark France
Germany Hong Kong
Iceland Italy Japan
Netherlands N. Zealand
Norway Romania Russia
S. Africa UK
U.S.A. = Method sometimes used or being developed = Important method
All countries, with the exception of Germany, reported that no one test is capable
of providing a comprehensive assessment of aggregates for their alkali-aggregate
62
reactivity. Germany has required that all aggregates have a satisfactory performance
when tested with specified methods established for materials in a “closely defined
geographical region.” Finally, the survey indicated that there is no test method
universally accepted for assessing the susceptibility of aggregates to the AAR.
4.2.1 Specific RILEM Survey Conclusions Related to Testing Procedures
(Nixon and Sims, 1996)
1. Petrographical examination: Petrographic examination is universally considered
adequate for identifying potentially reactive constituents in the aggregates. Most
participating countries reported that petrographic examination is used to evaluate
aggregates for ASR, and over half of the countries classified the method as being
the best. The reported range of rock types susceptible to ASR was extremely
diverse. However, there seemed to be an agreement over the range of potentially
reactive constituents such as opal, microcrystalline quartz, etc, contained in the
aggregates.
2. Chemical testing methods: Most countries performed some type of chemical test.
There appeared to be a universal adoption of the ASTM C 289 test, often with
modified interpretation procedures. No country had reported that ASTM C 289
or similar test methods are the best methods to use. This situation suggests that
results of ASTM C 289 were best used to support results from other test methods.
In France new test procedures have been standardized under “The Kinetic
Method” and the test is being evaluated internationally.
3. Expansion Methods: With the exception of Germany and Belgium, all countries
reported the use of a form of mortar or concrete expansion tests. Methods used
worldwide shared many similarities and potential differences -- mainly different
storage conditions. A universally agreed upon expansion testing method was not
apparent and a method using concrete specimens was more likely to be
acceptable universally than one using mortar bars.
63
4. Ultra-Accelerated Expansion Methods: Most replies indicated that the ultra-
accelerated expansion methods are more concerned with determining the
presence of potentially reactive constituents in the aggregates rather than being
concerned with the likelihood of expansion. Replies also indicted that this could
only be achieved with the long-term expansion methods. In addition, most replies
indicated that the long-term expansion tests are not suitable for specification
purposes. As a result, there was a universal interest in the accelerated expansion
methods that are capable of producing adequate results in less than a month. A
universally acceptable ultra-accelerated method is also desirable. The method
should be able to predict the performance of the aggregates when tested with the
long-term concrete test. In particular, ASTM C 1260 was becoming widely used.
Denmark, the Netherlands, and Norway used a slightly different version of
ASTM C 1260, and France was investigating the Chinese microbar test.
5. Other Test Methods: Several other testing procedures are being developed and
investigated; however, none have gained international acceptance. At this stage,
efforts should be spent on improving the most established procedures.
6. Overall Survey Conclusion: The overall survey conclusion was that it seems
possible to reach an international agreement on a series of tests for assessing
aggregate reactivity. For example, the following test procedures can be used in a
sequential order: first a petrographic examination should be performed, supported
sometimes by a chemical analysis. If a potentially reactive aggregate is identified
then the concrete prism expansion test should be performed. An ultra-accelerated
mortar-bar test might be used to provide an early prediction of the performance
of the concrete prisms.
4.3 ASR IN AUSTRALIA
4.3.1. Evaluating the Reactivity of Aggregates
Alkali-silica reaction has been the topic of many research studies in Australia. The
original test method used to predict Australian aggregate reactivity consisted of
64
combining appropriately graded fine aggregate with various cements to form mortar
bars measuring 25 x 25x 285 mm. The cement-to-aggregate ratio was 0.50 and
water-cement ratio was 0.40 to 0.50. Specimens were then stored at 100% R.H. in
sealed containers at a temperature of 150C. Length change was monitored
periodically every two years. This test was shown to be very slow and not practical
(Shayan, Green, and Collins; 1996).
In addition, past experience showed that the quick chemical test, ASTM C 289
(AS 1141 section 39), and the long term mortar-bar test, ASTM C 227 (AS 1141
Section 38) were inadequate for predicting the ASR reactivity of most Australian
aggregates (Shayan, Green, and Collins; 1996).
Following current trends, investigations, and recommendations, several
accelerated testing procedures were investigated at CSIRO, which included storing
concrete prisms and mortar bars in saturated NaCl solutions and in 1M NaOH at 500
and 800C. Results obtained using concrete prisms were unsatisfactory, showing
erratic expansions. Results of the mortar bars in the 1M NaOH solutions were more
consistent and more reliable. When alkalis were added to the concrete prisms, more
consistent results were obtained, but a significant reduction in the concrete strength
was noticed (Shayan, Green, and Collins; 1996).
Based on the field performance of several Australian aggregates in concrete
structures and the results of the accelerated mortar-bar test (similar to ASTM C
1260) performed on these aggregates, evaluation criteria were established as follows:
10-day expansions of 0.10% or greater identifies reactive aggregates and 21-day
expansions of 0.10% or greater identifies slowly reactive aggregates. It was noted
that this accelerated mortar-bar test was found to be more reliable than the autoclave
test. Through a series of research studies, Shayan showed that the accelerated mortar
65
bar (or ASTM C 1260) could be used to evaluate the effectiveness of fly ash and
slag in mitigating ASR expansions (Shayan 1990, 1992).
Another test that was investigated in Australia is a concrete-prism test which
consists of steam curing the prisms and subsequently storing them at 500C and 100%
R.H. Limited data have been generated using these test conditions (Shayan, Green,
and Collins; 1996).
Several aggregates with different field performances were tested using the
chemical method (ASTM C 289), the standard mortar bar (ASTM C 227), the
concrete prism (similar to ASTM C 1293), and the accelerated mortar bar (similar to
ASTM C 1260). The results are shown in Table 4.2, where it can be seen that the
concrete-prism test and the accelerated mortar bar are the most reliable test methods
(Shayan, Green, and Collins; 1996).
Describing the trend of aggregate testing for ASR in Australia, Shayan mentioned
that it is likely that “new test methods including the accelerated mortar-bar test and
the concrete-prism test (both normal and steam-cured) will be introduced. The
petrographic analysis, ASTM C 295 is likely to remain as a useful tool for the
identification of possible reactivity.” (Shayan, 1996)
66
Table 4.2: Classification of Aggregates by Different Test Methods (Shayan, 1992)
Test Method
Aggregate Service Record
Chemical C 289
Standard mortar bara
C 227
Concrete prism
Similar to C 1293
Accelerated mortar barb
C 1260 1 --- NR NR PRc R 2 --- NR NR NR NRd 3 --- R NR NR Pessimum 4 --- Borderline NR R R 5 R R Re PRc R 6 R NR NR Rf R 7 R NR NR Rf R 8 R NR NR R R 9 --- NR NR NR NR
10 --- NR NR R R 11 --- Borderline NR R R 12 --- Borderline NR R R 13 --- NR NR R R 14 --- NR R R R 15 R R R R R
aCement alkali = 1.38% Na2Oe; bBased on criteria proposed by Shayan; cDepends on the level of alkali in concrete; dExcept for one batch;eExpansion exceeded 0.10% after one year, but not six months; fat high alkali content. R = Reactive; PR = Potentially Reactive; NR = Non-Reactive.
Shayan, Ivanusec, and Diggins (1994) investigated the reactivity of five sands
with different petrographic properties but mainly slowly reactive. The investigated
testing procedures included (Shayan, Ivanusec, and Diggins; 1994):
1. Mortar-bar test at 400C and 100% R.H.: Mortar bars were made in accordance
with ASTM C 227 except that the sand was used as received without any
processing. NaOH was added to the mixing water in order to increase the alkali
content of the bars to 1.38 and 1.8% Na2Oequiv. The W/C used was between 0.30
and 0.40. Mortar bars were cured in fog for one week while being covered with a
polythene sheet. Subsequent curing consisted of storing the bars at 400C and
100% R.H.
67
2. Accelerated mortar-bar test in NaOH solutions at 800C: Mortar bars were
made in accordance with ASTM C 227 and cured in fog at 230C for three days
before starting the accelerated procedures. Subsequently, one series of specimens
was stored in each of the 0.50, 0.75, and 1M NaOH solutions at 800C.
3. Accelerated mortar-bar testing using autoclave at 1270C: Specimens, 25 mm x
25 mm x 285 mm, were made using a sand/cement/water ratio of 2:1:0.5 and
increasing the alkali content of the specimen to 2.5 and 3.5% by addition of
NaOH to the mixing water. After 24 hours of curing, specimens were demolded,
covered with a protective cover, and stored for 24 hours in a fog room at 230C.
Subsequently, specimens were autoclaved for four or five hours at 1270C.
4. Concrete-prism test: Using a non-reactive basalt coarse aggregate, concrete
prisms were made using five sands and a concrete mixture consisting of 1 part
cement, 2.62 parts aggregate, 1.55 part sand, and a w/c of 0.46. The alkali content
of the cement was increased to 1.38 and 1.8%, and the cement content of the
concrete mixtures was set at 460 kg/m3. After 24 hours of curing, concrete prisms
were demolded, covered, cured in fog at 230C for one week, wrapped in a wet
cloth and plastic sheeting, and then stored at 400C and 100% R.H.
After gathering and analyzing all the data, the following conclusions were drawn
(Shayan, Ivanusec, and Diggins; 1994):
1. Results of the mortar-bar test at 400C and 100% R.H. indicated that all five sands
are non-reactive, which contradicted the results of ASTM C 1260.
2. An expansion limit of 0.20% at 14 days for the mortar bars stored in 1M NaOH
at 800C (ASTM C 1260) resulted in all aggregates being non-reactive and was
viewed as not effective. An expansion limit of 0.10% was found more effective.
3. ASTM C 1260 expansions of all sands exceeded 0.10% at ages 10 to 17 days but
were lower than 0.20%.
68
4. When evaluated using the proposed expansion limits for non-reactive aggregate
of 0.15, 0.33, and 0.48% at ages of 14, 28, and 56 days, respectively (Rogers,
1993), only one aggregate out of five was classified as reactive. These limits
were found to be not effective in identifying a number of known slowly reactive
aggregates (Shayan et. al., 1988).
5. Four out of the five aggregates were classified as slowly reactive using the
expansion results of the mortar bars stored in 0.75M NaOH at 800C.
6. Expansions of mortar bars in 0.50N NaOH at 800C classified all five aggregates
as non-reactive.
7. The testing conditions of the concrete-prism test did not result in considerable
expansions for all the sands but one and that was after 40 weeks of storage.
8. The autoclave testing procedures resulted in a non-reactive classification of the
aggregates except for one sand.
9. The autoclave test, with 3.5% alkali content mortar bar autoclaved at 1270C for 4
or 5 hours, were not suitable for detecting slowly reactive aggregates.
10. The ASTM C 1260 procedures were effective in predicting the potential alkali
reactivity of slowly reactive aggregates which showed 10- to 17-day expansions
between 0.10% and 0.20%; however, the relevance of this method to field
concrete needs to be determined
4.3.2. ASR Preventive Measures
Shayan, Diggins, and Ivanusec (1996) conducted a long-term, six-year study in
order to determine the effects of fly ash on ASR. They tested one innocuous
aggregate and six reactive aggregates. Two types of fly ashes with varying total
alkali content (0.01 and 6.30% Na2Oequiv.) and two types of cements were used. The
alkali content of the concrete was varied by adding NaOH to the mixing water.
Concrete specimens were formed and stored in a fog room at either 230C or 400C at
100% relative humidity. Expansions were monitored for nearly six years and several
69
mortar tests were performed. The results were as follows (Shayan, Diggins, and
Ivanusec; 1996):
1. The fly ashes tested were effective in preventing deleterious ASR expansions
when used in concretes with alkali contents as high as 7.0 kg Na2Oequivalent per m3
(1.4% Na2Oequivalent cement content); however, they only delayed damage in
concretes with alkali contents around 12 kg Na2Oequivalent per m3 (2.5%
Na2Oequivalent cement content). These alkali levels are outside the usual range of
concrete alkali levels in the field that vary between 0.60% to 1.20% Na2Oequivalent
cement content.
2. Long-term monitoring of concrete specimens is necessary to evaluate the
effectiveness of fly ash in reducing ASR damage.
3. The alkalinity of the pore solution of mortar cylinders was reduced significantly
by the use of fly ash. The reduction occurred faster for specimens stored at 400C
than those stored at 230C.
4. The accelerated mortar-bar test (ASTM C 1260) can be used to predict the long-
term effectiveness of fly ash in controlling ASR expansion in concretes having an
alkali contents resulting in pore solutions having approximately 1M NaOH
concentrations which corresponds to concrete specimens at 1.38% alkali levels.
4.4 ASR IN CHINA
Alkali-silica reactive aggregates exist in China. Portland cements with an alkali
content as high as 1.20% Na2Oequiv. are used in China. In addition, chemical
admixtures are widely used to improve workability, strength, or other properties.
These admixtures usually add about 0.30-1.30 kg/m3 Na2Oequiv. to the total alkali
content of concrete. In general, in North China, there are “absences of low alkali
portland cements and non-reactive aggregates (Tang et al., 1996).”
70
4.4.1. Evaluating the Reactivity of Aggregates (Tang et al., 1996)
Testing procedures used to evaluate aggregates’ reactivity include ASTM C 295,
C 227, C 289, and an accelerated autoclave method proposed by Tang et al.,1996.
The autoclave method is most widely used by engineers and researchers (Tang et al.,
1996).
4.4.2. Preventive Measures
In order to minimize the risk of deterioration due to ASR, the maximum alkali
contents of concrete listed in Table 4.3 were proposed (Tang et al., 1996).
Table 4.3: Maximum Alkali Content (Tang et al., 1996)
Maximum alkali content (kg/m3) in concrete Conditions of Circumstances Ordinary Structure Important Structure Special Structure
Dry No limit No limit 3.0 Wet 3.5 3.0 2.1
With alkali 3.0* Non-reactive aggregate Non-reactive aggregate * The structures should be effectively painted, otherwise non-reactive aggregates should be used
4.4.3. ASR in Beijing
The alkali-silica reaction in concrete is a concern to the Beijing area. As the
concrete structures become older, more damage due to ASR is expected to be
identified (Peixing et al., 1996). After conducting extensive field surveys and
laboratory testing, it was concluded that most sands available in the Beijing area are
non-reactive (only a few samples were found to be reactive) while several coarse
aggregates were found to be responsible for most of the alkali-silica reaction
problems.
Testing procedures used in Beijing included ASTM C 227, C 1260, C 289, and an
autoclave method. Preventive measures practiced included (Peixing et al., 1996):
71
Routinely evaluating the reactivity of aggregates used in important concrete
structures using the above listed tests.
1. Limiting the total alkali content in concrete to 3 kg/m3.
2. Using low-alkali mineral admixtures.
4.5. ASR IN CANADA
In Canada the alkali-silica reaction has been divided into two groups (CSA,
1994):
1. Alkali-silica reaction with chalcedony, opal, cristobalite, glass, etc., which can be
usually identified using ASTM C 227. Concrete prisms expansion tests at 380C
using high cement content and high alkali content cement (ASTM C 1293) can
also be used to evaluate this type of reaction. ASTM C 289 can also be used;
however, this test might give misleading results when carbonates are present
(Rogers, 1993).
2. Slow alkali-silica reaction associated with sandstones, granites containing
strained quartz, and metamorphosed sediments such as phyllite, argillite, and
greywacke. Conventional testing procedures such as ASTM C 227 and C 289 are
not suitable for evaluating this type of reaction. ASTM C 1293 is more
adequately used to identify these slow reactions (Rogers, 1993).
4.5.1 Evaluating the Reactivity of Aggregates
A large number of research studies have been completed in Canada for the
purpose of identifying and developing the ideal testing procedures for assessing
aggregates reactivity. The following is just a review of selective work conducted in
Canada.
4.5.1.1. “Testing Concrete for AAR in NaOH and NaCl Solutions at 380C and
800C (Berube and Frenette, 1994).
72
In order to minimize the effects of storage conditions used with CSA A23.2-14A
(ASTM C 1293) and to accelerate the procedures, concrete prisms were tested in
NaCl and NaOH solutions at different temperatures. Two very reactive Canadian
aggregates were used: 1) a very fine-grained rhyolitic tuff and 2) a fine-grained
siliceous limestone. Non-reactive sand satisfying the requirements of ASTM C 1260
was used for mixture proportioning. Two types of cements were also used: one
having a high alkali content of 0.85% Na2Oequiv. and the other having an alkali
content of 0.54%. Concrete prisms, 75 mm x 75 mm x 300 mm, were made using the
two reactive aggregates in combination with the non-reactive sand. The concrete
mixtures had a water-cement ratio of 0.55 and incorporated 310 kg/m3 of the high
alkali content cement. NaOH was added to the mixing water in order to increase the
alkali content of the cement mass to 1.25% Na2Oequiv. (equivalent to a concrete alkali
content of 3.9 kg of Na2O/m3). Several concrete specimens were made using the low
alkali content cement in order to determine the effect of the initial alkali content of
the cement on the expansions. These specimens had a total alkali content of 1.7
kg/m3. After fabrication, concrete prisms were stored, while still in molds, for 24
hours at 100% R.H. and 230C. Prisms were then demolded and cured for another 24
hours under the same conditions. Two concrete prisms were stored under each of the
following conditions (Berube and Frenette, 1994):
1. Tests in air at 100% RH and 380C: After curing was completed, concrete
specimens were immersed in water for 30 min., measured for the zero reading,
and then stored over water in sealed 22-liter plastic pails, with wicking, at 380C.
Before taking scheduled expansion readings, the sealed containers were stored
for sixteen hours at 230C after which the specimens were immersed in water for
30 minutes and then measured for expansion.
2. Tests in air at 100% RH and 800C: Specimens were stored over water in sealed
8-liter Rubbermaidcontainers (two specimens per container) in an oven at 800C.
73
The initial reading (zero reading) was taken after one day. All expansion
measurements were taken while specimens were still hot, as soon as they were
taken out of the oven.
3. Immersion tests in 1M NaCl solution at 38 or 800C: After curing, specimens
were immersed, in groups of two, in 1M NaCl solution (6% NaCl by mass), in
sealed 8-liter Rubbermaid containers. Each container had 4.4 liters of solution,
for a volumetric solution/concrete ratio of 1.3 (1 prism = 1.7 liter). The
containers were then immediately stored in an oven at 800C or in a temperature-
controlled room at 380C. The zero reading was recorded the following day.
Expansion measurements were taken while specimens were still hot, as soon as
they were taken out of the oven or the temperature-controlled room.
4. Immersion tests in 1M NaOH solution at 38 or 800C: The same procedures as
for immersion tests in 1M NaCl solution at 38 or 800C were used.
5. Immersion tests in water at 38 or 800C: The same procedures as for immersion
tests in 1M NaCl solution at 38 or 800C were used.
The following conclusions and recommendations were documented (Berube and
Frenette, 1994):
1. A relatively rapid ion migration exists, by diffusion, between the immersion
solution and the concrete pore solution.
2. Testing in 1M NaCl solution is not appropriate.
3. Testing in water resulted in a dilution of the alkalis in the pore solution of the
specimens and gave very low expansion results.
4. The initial concrete alkali content affected the rate of expansion of specimens
immersed in 1M NaOH solutions. Increasing the concrete alkali content to 1.25%
Na2Oequiv. of the cement mass was recommended.
5. While testing in 1M NaOH at 800C proved to be the most rapid concrete test
74
method, it was also proven that it is unreliable for determining the potential
alkali-reactivity of numerous aggregates.
6. The best concrete test method used 1M NaOH at 380C based on the following
reasons: a) it gave expansion results that are either similar or greater than the
results of the 100% RH test but in a significantly shorter term (about 6 months),
b) there was no alkali leaching from the concrete specimens, c) there was no
variation in the humidity conditions during one test and from one laboratory to
another, and d) since the chemistry of the concrete pore solution is controlled by
the curing solution, the effects of the water-cement ratio were minimized.
7. The recommended testing method to use for the evaluation of the potential alkali
reactivity of aggregate is the immersion of concrete prisms in 1M NaOH at 380C.
Prisms were made using a cement content of 310 kg/m3 and a water-cement ratio
between 0.50 and 0.55. The proposed criterion for identifying reactive aggregates
was 0.040% expansion or larger at 6 months.
4.5.1.2. “Effectiveness of High-Volume Fly Ash Concrete in Controlling
Expansion Due to Alkali-Silica Reaction (Fournier, Bilodeau, and Malhotra;
1994).
This study consisted of testing two alkali-silica reactive Canadian aggregates,
siliceous limestone (Sp) and metagreywacke (Con), in combination with a local non-
reactive fine aggregate from granite. Properties of the aggregates are included in
Table 4.4.
The two reactive aggregates were tested for ASR in concrete mixtures containing
high- and low-alkali Type I portland cements and incorporating 56% of six selected
Canadian fly ashes. All high-volume fly ash mixtures had a nominal cementitious
materials content of 375 ± 10 kg/m3and water-to-cementitious materials ratio of
0.31 ± 0.01.
75
Table 4.4: Properties of Aggregates Investigated (Fournier, Bilodeau, and Malhotra; 1994)
Expansion ASTM C 1260, %
Aggregates ID
Location
Type
Rock Type
Realtive Density (SSD), g/cm3
Absorption,
%
14 day
28 day
Sp
Ottawa
Quarried
Rock
Siliceous limestone and traces of chert
2.69
0.48
0.356
0.625
Con
Halifax
Quarried
Rock
Greywacke
2.71
0.80
0.362
0.590
Fine
Aggregate
Cantley
Natural Sand
Derived
from granite
2.70
0.81
0.032
0.085
Concrete prisms, 75 mm by 75 mm by 300 mm, were made using variable
proportions and subjected to the following conditions:
1. 380C and relative humidity greater than 95%. Prisms were wrapped individually
in two damp sheets, placed in a plastic sleeve, and then placed vertically over
water inside a 25-L plastic pail with wicking materials on the sides.
2. 1M NaOH solution at 380C
3. 5% NaCl solution at 380C
4. 1M NaOH solution at 800C
Prisms subjected to conditions 2, 3 and 4 were stored in large polyethelene tubes
containing 24 prisms and the appropriate solution. The tubes were then placed in a
large tank filled with water and constantly maintained at the needed temperature.
Mortar bars were formed and tested according to ASTM C 1260.
76
The results of that study were as follows (Fournier, Bilodeau, and Malhotra; 1994):
1. After evaluating the results and comparing expansions from the different storage
conditions investigated during this study, the following expansion limits in Table 4.5
were suggested.
Table 4.5: Proposed Limits for Different Testing Conditions (Fournier, Bilodeau, and Malhotra; 1994)
Storage/Testing Condition
Proposed Expansion Limit
380C and R.H. > 95%: (Concrete Prisms)
0.04% at 52 weeks (CSA proposed limit) 0.04% at 104 weeks (mixtures with fly ash)
380C in 1M NaOH Solution: (Concrete Prisms)
0.04% at 26 weeks (control mixtures) 0.04% at 52 weeks (mixtures with fly ash)
380C in 5% NaCl solution: (Concrete Prisms)
Not Recommended (control mixtures) Not Recommended (mixtures with fly ash)
800C in 1M NaOH solution: (Concrete Prisms)
0.04% at 4 weeks (control mixtures) 0.04% at 8 weeks (mixtures with fly ash
800C in 1M NaOH solution: (Mortar Bars)
0.15% at 14 days (CSA proposed limit) 0.10% at 14 days (mixtures with fly ash)
1. Using the above expansion limits, it was possible to reliably evaluate the
potential alkali-reactivity of the tested reactive aggregates. The accelerated
concrete tests represented substantial acceleration compared to the proposed
standards.
2. The accelerated mortar-bar test, ASTM C 1260, was successful in predicting the
effectiveness of the high volume fly ash replacement in controlling expansions
due to ASR. All the results generated using this accelerated mortar-bar test
correlated very well to expansion results obtained from the different concrete
prisms testing conditions.
77
3. In concretes incorporating high volumes of fly ash, control of the expansions
due to ASR is dependent upon the chemical composition of the fly ash, in
particular its calcium and alkali content.
4.5.1.3. Inter-laboratory Test Evaluation
4.5.1.3. 1.ASTM C 1260 Rogers (1996) reported a study with a purpose of developing a multi-laboratory
precision statement for the accelerated mortar-bar test (ASTM C 1260). A Spratt
siliceous limestone from a quarry in Ottawa (Ontario) was tested by 46 laboratories.
It was found that the coefficient of variation in the 14-day expansion was 13.3%
when all laboratories used the same cement and 14.9% when each laboratory used a
different cement. Precision was stated as follows: “For mortars giving average
expansions after 14 days in solution of more than 0.30%, the muti-laboratory
coefficient of variation has been found to be 14.9%. Therefore, the results of two
properly conducted tests in different laboratories on specimens of a sample of
aggregate should not differ by more than 42% of the mean expansion (Rogers,
1996).”
The CSA version of the test requires the use of a cement with a total alkali content
of 0.90 ± 0.10%. The ASTM version requires the use of a cement with an autoclave
expansion of less than 0.20%. The new recommended specification should be to use
any type of cement provided that when combined with the Spratt aggregate tested in
this study, it can produce 14-day expansions between 0.329% and 0.504% (Rogers,
1996).
4.5.1.3.2. ASTM C 1293 Fournier and Malhotra conducted a study in order to determine the inter-
laboratory variation of the concrete-prism test. The study consisted of testing two
reactive aggregates in combination with three non-reactive sands and Type 1
cements. The mixture designs were changed as well as the storage conditions of the
78
concrete prisms. A total of 27 laboratories, 24 from Canada, one from the U.S.A,
and two from France participated in the study. It was concluded that the between-
laboratory variability could be greatly reduced by using well-controlled testing
conditions or parameters such as “ a reference sand, a reference cement, a standard
storage container, and fixed concrete mixture proportioning.” It was also found that
the between-laboratory standard deviation and the coefficient of deviation of the test
prisms stored in 1M NaOH solution at 380C was significantly lower than the
coefficients of prisms under other storage conditions which included over water at
380C and 95% R.H (Fournier and Malhotra 1996).
4.5.2. ASR Preventive Measures
Thomas, Hooton, and Rogers (1997) outlined the guidelines recommended by the
Canadian Standards Association (CSA 1994) for preventing damage due to AAR in
new concrete construction. In order to minimize the risk of ASR in concrete, 1)
aggregates can be selected based on documented field performance, petrographic
examination, or satisfactory performance in a sequence of accelerated and long-term
expansion tests, namely, ASTM C 1260 (CSA A23.2-25A) and ASTM C 1293 (CSA
A23.2-14A) or 2) preventive measures can be adopted.
4.5.2.1. Field Performance (CSA, 1994)
The best method for determining whether an aggregate is potentially reactive is to
examine the history of its field performance. An aggregate can be used in concrete
without any additional precautions providing that satisfactory field performance can
be demonstrated as follows (CSA, 1994):
1. The cement content and the alkali content of the cement should be the same or
higher in the field concrete as is proposed in the new structure.
2. The concrete examined should be at least 10 years old.
3. The exposure conditions of the field concrete should be at least as severe as those
in the proposed structure.
79
4. A petrographic study should be conducted to demonstrate that the aggregate in
the structure is similar to that under investigation in the absence of conclusive
documentation.
5. The possibility of supplementary cementing materials having been used should
be considered.
6. The water-cement ratio of the concrete may affect performance.
4.5.2.2. Laboratory Studies (CSA, 1994)
The laboratory testing procedures recommended by the CSA are listed in the
following Table 4.6. Figure 4.1 shows a flow chart that was proposed by Berube
(1992) for using these three testing procedures.
Table 4.6: Recommended Procedures and Limits to Detect Alkali-Reactive Aggregates (Berube, 1992).
Designation
Name and Description
Recommended Limits
ASTM C 295
Petrographic examination of aggregates for concrete
No limits but regarded as essential in interpreting results of other observations
CSA A23.2-25A (ASTM C 1260)
“Detection of alkali-silica reactive aggregate by accelerated expansion of mortar bars.” Mortar bars stored in NaOH solution at 800C. Can be used for coarse and fine aggregate.
Maximum of 0.15% at 14 days in solution (0.10% for some siliceous limestones, granites, gneisses, and some sandstones). Aggregate may still be used if it meets CSA A23.2-14A.
CSA A23.2-14A (ASTM C 1293)
“Potential expansivity of aggregates (length change of concrete prisms).” Concrete is made with cement content of 420 kg/m3 and 1.25% alkalis, stored at 38oC. Can be used for testing coarse or fine aggregate.
Maximum of 0.04% at 1 year, less than this (no value given) for critical structures such as dams and nuclear containment where small strains can cause excessive damage.
80
4.5.2.3. Preventive Measures (CSA, 1994)
If an aggregate is classified as non-reactive using the above procedures then it can
be used in concrete without additional precautions. On the other hand, potentially
alkali-silica reactive aggregates should be used with appropriate preventive
measures. Recommended measures include:
1. Limiting the total alkali content of the concrete including alkalis from portland
cement and other sources to 3.0 kg/m3 Na2Oequivalent. Reducing the alkali content of
the concrete may be achieved by reducing the cement content, using a low-alkali
content cement, or replacing part of the cement with a supplementary cementitious
material.
1. Using supplementary cementitious materials such as fly ash with a minimum
replacement level between 20 and 30% depending on composition or slag with a
minimum replacement level of 50%. Effectiveness of these materials with
specific cements should be checked using the long-term concrete-prism test. The
total alkali content of the slag is limited to 1.0% while that of fly ash is limited to
4.5% Na2Oequiv. If these criteria are met, the contribution of the slag and fly ash to
the total alkali content of the concrete is considered to be zero.
2. Using silica fume, which is another potential cementitious material for reducing
the damage caused by potentially reactive aggregates. However, there is no
guidance for its use with reactive aggregates. Additional investigations are
needed to determine the ideal use of silica fume for controlling ASR damage.
81
4.6 ASR IN DENMARK (Chatterji et al., 1992)
Most of the aggregate sources available in Denmark contain some form of
reactive components. “There is always a risk of ASR (Chatterji et al., 1992).” As a
result, Denmark is very active and very strict in providing specifications for
preventing ASR damage in concrete. The following is a description of the practices
used to address ASR:
Figure 4.1: Decision Chart for Determining Potential ASR Reactivity of Concrete Aggregates (Berube, 1992).
82
There are three parameters used to minimize the risk of ASR in concrete:
1. Alkali content of the concrete
2. Reactivity of the aggregate
3. Environmental conditions
4.6.1 Alkali Content of the Concrete
The alkali content of the cement is added to alkalis from other sources such as
mineral and chemical admixtures used as mixture components to determine under
which group the cement falls. Table 4.7 includes the different cement groups. “The
assumption of a constant and uniform distribution of alkali in a concrete structure has
been dropped” (Chatterji et al., 1992).
Table 4.7: Alkali Content Groups (Chatterji et al., 1992) Group Label Description Details
EA Extra low Alkali ≤ 0.4% Na2Oequiv..
LA Low Alkali ≤ 0.6% Na2Oequiv..
MA Medium Alkali ≤ 0.8% Na2Oequiv..
HA High Alkali ≤ 0.4% Na2Oequiv..
4.6.2 Environmental Classification
Three environmental classes are defined as follows:
1. Aggressive Environmental Class: Includes concrete exposed to salt, flue gases,
seawater, or brackish water.
2. Moderate Environmental Class: Includes concrete exposed to moisture, non-
aggressive outdoor and indoor environment, and flowing or standing fresh water.
3. Passive Environmental Class: Includes concrete exposed to dry and non-
Note: the C 1260 Classification was changed from the original data to represent the new findings for the test interpretation. Basically 14-day expansions higher than 0.08% are considered reactive.
114
4.18.5 ASR in South Dakota (polynomial and Avrami) To improve the interpretation of the C 1260 results, two models were introduced
by Johnston of the South Dakota DOT (1994). The first model consisted of using a
polynomial fit procedure on the C 1260 expansions versus time for each of the tested
aggregates and then to plot the coefficients of these curves against each other. This
process was more detailed in Johnston’s paper published in 1994. The advantage of
this model was that it considered the expansion history over the full 14-day period
instead of just using the 14-day expansion reading. According to the findings of
previous researchers, the polynomial fit procedure should show a clear separation
between innocuous and reactive aggregates with the innocuous aggregates being
concentrated around one line and reactive aggregates being concentrated along
another, separate line (Johnston, 1994).
The second model consisted of applying Avrami’s equations to the C 1260
expansions. The model, presented in 1940, described the nucleation and growth
reaction using equation 4.5 (Johnston, 1994).
α = 1 + α0 − e (-k * (t-t0)^M) (Eq 4.5)
In that equation, α0 is the degree of expansion at time t0 representing the time at
which the nucleation and growth becomes dominant. In the case of C 1260, t0 is the
fourth day of curing. The constant k in equation 4.4 is a rate constant that reflects the
effects of nucleation, multidimensional growth, the geometry of reaction products,
and diffusion. The constant M is combining the effects of parameters P, Q, and S as
described in equation 4.6 (Johnston, 1994).
M = P/S + Q (Eq 4.6)
115
The parameter P describes the dimensionality of the product phase with P = 1, P =2,
and P = 3 respectively corresponding to needles, sheets, polygonal forms. S = 1
indicates a phase boundary growth while S = 2 indicates the diffusion of components
through the liquid phase. Q = 0 indicates no nucleation and Q = 1 indicates constant
nucleation. It is assumed that the characteristics of the alkali-silica reaction are (1)
sheet formation (P = 2), (2) diffusion through the liquid phase (S = 2), and (3) no
nucleation (Q = 0), which means that the value of M is almost 1 for ASR. Taking the
double natural log of both sides of Equation 1 results in equation 4.7 (Johnston,
1994):
ln ln (1 / 1+α+α0) = ln (t-t0)*M + ln(k) or Y = X*M + ln (k)
Plotting X versus Y for each aggregate will result in an intercept value for ln(k)
and a slope value for M. The validity of this model for ASR kinetics was evaluated
by Johnston in his 1998 paper. He concluded that using the model allows the correct
prediction of an aggregate reactivity with ln(k) equals to -6 being the separating
value between reactive and innocuous aggregates. Aggregates with ln(k) greater than
-6 are reactive and aggregates with ln(k) less than -6 are innocuous. He also
concluded that the model is very efficient in evaluating and predicting the
effectiveness of mitigation methods (Johnston, 1994).
In June of 1993, the Mid-Atlantic Regional Technical Committee published a
report titled “Guide Specifications for Concrete Subject to Alkali-Silica Reactions.”
Recommended practices are summarized in Tables 4.17 and 4.18.
(Eq 4.7)
116
Table 4.17: Recommended Testing Procedures and Limits (Mid-Atlantic RTC, 1993)
Testing Procedures Description Limits Optically strained, microfractured, or microcrystalline quartz (commonly found in granite and granite gneiss)
5.0 % (max.)
Chert or chalcedony 3.0 % (max.) Tridymite or cristobalite 1.0 % (max.) Opal 0.5 % (max.)
ASTM C 295 Petrographic Examination of Aggregates for Concrete
Natural volcanic glass 3.0 % (max.)
ASTM C 1260 Average mortar expansion after 14-day of curing in 1M NaOH at 800C 0.10 % (max.)
ASTM C 227 Average mortar expansion after 6 months 0.10 % (max.)
Aggregates containing reactive materials as determined by ASTM C 295, should
be tested using C 1260. If the aggregate still shows signs of reactivity, it should be
considered as potentially reactive unless additional testing results and service records
support its reclassification and are found to be acceptable to the specifier. C 227
might not be able to detect all reactive aggregates. However, aggregates that fail the
test should be considered potentially reactive.
Table 4.18: Recommended Mitigation Alternatives and Methods of Validation (Mid-Atlantic RTC, 1993)
Mitigation Alternative Recommended Percentage
Validation Method
Class F fly ash 15 % (min.) C 227, C 1260 Class C fly ash 25 % (min.) C 227, C 1260 Slag 25 % (min.) C 227, C 1260 Silica fume 5 % (min.) C 227, C 1260
117
4.18.7 AASHTO ASR Lead State Team (Lead State Team, 1999)
In 1999, the AASHTO ASR Lead State Team published a report similar to the
Mid-Atlantic Committee report. Major recommendations are summarized in Tables
4.19 and 4.20. One of the Lead State Team recommendations was to use the
procedures detailed in SHRP C-315, Handbook for the Identification of Alkali-Silica
Reactivity in Highway Structures, in order to determine whether a concrete structure
is affected by the alkali-reactivity of aggregates.
Table 4.19: Recommended Testing Procedures and Limits (Lead State Team, 1999)
Testing Procedures Description Limits Optically strained, microfractured, or microcrystalline quartz
5.0 % (max.)
Chert or chalcedony 3.0 % (max.) Tridymite or cristobalite 1.0 % (max.) Opal 0.5 % (max.)
ASTM C 295 Petrographic Examination of Aggregates for Concrete
Natural volcanic glass 3.0 % (max.)
Mean mortar bar expansion at 14 days
0.08 % (max.) metamorphic aggregates 0.10 % (max.) all other aggregates
AASHTO T 303 (ASTM C 1260) Accelerated Detection of Potentially Deleterious Expansion of Mortar Bars Due to Alkali-Silica Reaction
Perform a polynomial fit of data at 3, 7, 11, and 14 days to determine reliability of results
Repeat the AASHTO T 303 if r2 is less than 0.95.
ASTM C 1293 Concrete Aggregates by Determination of Length Change of Concrete Due to Alkali-Silica Reaction
Mean concrete prism expansion at one year 0.04 % (max.)
ASTM C 295 should be used as verification to either T 303 or C 1293. Using C
1293, some reactive aggregates might not develop expansions greater than 0.040%
after one year. However, these aggregates will result in extensive cracking of the
concrete prism surface.
118
Table 4.20: Recommended Mitigation Alternatives and Methods of Validation (Lead State Team, 1999)
Mitigation Alternative Recommended Percentage Validation Method Mineral Admixture Methods
Class F fly ash 15 % (min.) C 441, T 303, or C 1293 Class C fly ash 25 % (min.) C 441, T 303, or C 1293 Class N pozzolan Not specified C 441, T 303, or C 1293 GGBFS 25 % (min.) C 441, T 303, or C 1293 Silica fume 5 % (min.) C 441, T 303, or C 1293
Cement Methods Low-alkali cement 100 % C 441 Blended Cement 100 % T 303 or C 1293
Chemical Admixture Methods Use 4.6 liters or 5.5 kilograms (min.) per kilogram of Na2Oequiv.
C 441 or C 1293 LiNO3 Lithium Nitrate Deduct from the mix water
an equivalent volume of 85% of the LiNO3 solution.
4.18.8 Portland Cement Association (Farny and Kosmatka, 1997)
In 1997, the Portland Cement Association (PCA) published a report summarizing
the state-of-art of ASR research (Farny and Kosmatka, 1997). The flow chart shown
in Figure 4.4 summarizes the recommendation for best testing procedures.
4.18.9 The National Aggregates Association (NAA, 1999)
The National Aggregates Association (NAA) investigated the effectiveness of
ASTM C 1260 and C 1293 using aggregate samples obtained from about 150 sources
representing different regions of the United States (154 aggregates were tested).
Results of aggregates that were tested with both C 1260 and C 1293 are included in
Table 4.21.
119
Figure 4.4: Flow Chart Suggested by PCA (Farny and Kosmatka, 1997)
120
1. Results of C 1260 performed on fine and coarse aggregates from the same source
were not always comparable. In nearly two-third of the cases, the fine aggregates
showed higher expansions. This raises concern over the ability of C 1260 to
correctly evaluate the reactivity of coarse aggregates.
2. Eighty percent of the tested aggregates have been used in concrete for more than
ten years. Still, 73% of the aggregates showed 14-day expansions higher than
0.10% and 52% showed 14-day expansions higher than 0.20%
3. When comparing the results of C 1260 and C 1293 performed on the same
aggregates, it was observed that only two out of ten investigated aggregates were
classified as reactive using the two tests. The remaining eight aggregates were
classified as reactive when tested using C 1260 and non-reactive when tested
using C 1293.
4. Similarly, there was no correlation between the results of C 1260 and C 227.
Most aggregates classified as reactive with C 1260 were found to be non-reactive
with C 227.
5. Field service records reported by aggregates producers did not correlate with the
results of C 1260. Most aggregates classified as reactive did not cause deleterious
expansions in concrete.
6. When using C 1260, consideration should be given to the absorption of
aggregates in order to ensure a constant water-cement ratio.
7. Rejection of an aggregate for use in concrete should not be based solely on the
results of C 1260.
4.18.10 Lithium as A Preventive Measure
Recent work has been concentrated on determining the effects of lithium additives
on ASR. The use of lithium as an ASR mitigation alternative have been investigated
by several researchers including Stanton (1940), McCoy and Caldwell (1951),
Sakaguchi et al. (1989), Ong and Diamond (1993), Stark (1993), and Wang et al.
(1994). The aforementioned and other researchers have shown that lithium can be
121
used to mitigate damage due to ASR. The effective dosages varied depending on the
molar ratio Li:Na and varied between 0.6 and 0.9. ASTM C 1260 was found to be
not effective in evaluating the usefulness of lithium mainly due to the lithium
leaching out of the mortar bars and into the curing solution. It was recommended by
Starks to add lithium to the curing solution at the same rate as that used for the
mortar bars (1993).
Table 4.21: C 1260 and C 1293 Results of Testing Performed by NAA (NAA, 1999)
lot Comp F/C N/M Petro St
C126014-Day
% C 1260
Classification
C 1293 1-yr %
C 1293 Classification
004 2 C M LS OK 0.252 Reactive 0.083 Reactive 007 4 F N SI, DO WI 0.227 Reactive 0.009 Innocuous 008 4 C CG DO, SI WI 0.159 Slowly Reactive 0.020 Innocuous 017 9 F N LS ALB 0.285 Reactive 0.015 Innocuous 018 9 C CG LS ALB 0.335 Reactive 0.070 Reactive 023 12 C CG SI CO 1.061 Highly Reactive 0.196 Reactive 032 16 C M LS PA 0.041 Innocuous 0.016 Innocuous 043 21 F N SI NE 0.210 Reactive 0.012 Innocuous 049 22 F N SI CO 0.139 Slowly Reactive 0.018 Innocuous 052 23 F N SI SD 0.250 Reactive 0.012 Innocuous 055 25 F N SI CA 0.678 Highly Reactive 0.026 Innocuous 060 26 C N SI NV 1.072 Highly Reactive 0.016 Innocuous 064 28 F N SI CA 0.080 Innocuous 0.008 Innocuous 088 37 C CG DO, LS, SI NY 0.154 Slowly Reactive 0.038 Innocuous 129 48 F N SI IN 0.279 Reactive 0.007 Innocuous 139 49 F N SI MI 0.316 Reactive 0.005 Innocuous
Type: F = Fine agg., C = coarse agg. N/M: N = Natural, M = Manufactured, CG = Crushed Gravel Petro: SI = Siliceous, LS = Limestone, DO = Dolomite, U = Unknown
During the Strategic Highway Research Program, a field test was initiated to
investigate the effectiveness of lithium hydroxide monohydrate in several pavement
122
sections in Albuquerque, NM (Starks 1993). Reactive aggregates were used in the
pavements in combination with a cement having 0.55% alkali content. Long-term
monitoring of the pavement is an ongoing process.
4.19 FINAL REMARKS
After reviewing the literature and examining how different countries manage the
alkali-silica reactivity of aggregates, it was clear that there is a lack of unified
procedures and guidelines. Different countries have adopted different aggregate
testing procedures and different ASR mitigation measures that best fit their needs.
Notably, there is a great interest in reliable accelerated testing procedures capable of
predicting the potential reactivity of aggregates in a short period of time. It also
seemed that ASTM C 1260, ASTM C 1293, and modifications or combinations of
these procedures are becoming more and more popular and more trusted in giving
accurate results. Some guidelines are available to manage the alkali-silica reactivity
of aggregates.
123
CHAPTER FIVE
TESTING MATERIALS
5.1 AGGREGATE SELECTION
After reviewing the literature and contacting knowledgeable researchers and
industry representatives, a list of 200 aggregates was compiled from which the
selection was made for the testing program. The aggregates possessed different
physical and chemical properties, represented different regions of the USA, had
different field performances as far as ASR performance, and had different laboratory
performances when tested for ASR.
Aggregates for the testing program were acquired from fourteen different
aggregate producers providing a total of twenty-three aggregates of which ten were
coarse, twelve were fine, and one was mixed sand and gravel.
Aggregates were selected to cover the complete spectrum of ASR reactivity as
shown in Table 5.1. Aggregates were also representative of most regions of the USA
as shown in Figure 5.1. Table 5.2 contains a list of all chosen aggregates including
their types and sources.
Table 5.1: Aggregates Representing the Complete Spectrum of ASR Reactivity
Category Field Performance Laboratory Performance A Poor Reactive B Poor Inconclusive C Poor Non-Reactive D Good Non-Reactive E Good Reactive
124
Figure 5.1: Locations of the Selected Aggregate Sources
= NAA Aggregates
Aggregates Tested at
125
Table 5.2: Aggregates and Aggregate Sources Selected for the Study
Agg. Number
Aggregate I.D.
Agg. type
Aggregate Mineralogy
Aggregate Source
Category A: Poor field performance / tested reactive 1 A1-WY Coarse Rhyolite Wyoming 2 A2-WY Fine Rhyolite Wyoming
Na2Oequiv 1.76 Set Time (Hrs: Min) Compressive Strength, psi Gilmore Vicat
1 Day Initial Set --- 3:25** 3 Day 2950** Final Set --- 5:25** 7 Day 4110**
Air Content
Loss on Ignition 1.70 % H20 ---- Specific Gravity 2.40±0.05 % Flow ----
Normal Consistency 27.7%** % Air ---- **Indicates these tests were done using 20% replacement of cement
130
Table 5.7 Chemical and Physical Properties of the Class C Fly Ash Chemical Composition Physical Properties
Metal Oxide Element Percent
SiO2 34.99 Specific Gravity 2.63 Al2O3 20.25 Fe2O3 6.24 Retained on #325 16.57 % CaO 26.12 MgO 4.65 Water Requirement 94 % SO3 1.74
Autoclave Exp. 0.09 % Total Alkali
Na2Oequiv 1.18
Loss on Ignition 0.28 Moisture Content 0.06
Table 5.8 Chemical and Physical Properties of the Class F Fly Ash Chemical Composition Physical Properties
Metal Oxide Element Percent
SiO2 56.5 Specific Gravity 2.40 Al2O3 19.3 Fe2O3 4.7 Retained on #325 22.5 % CaO 12.3 MgO 2.3 Water Requirement 94.2% SO3 1.5
Autoclave Exp. 0.02% Total Alkali
Na2Oequiv 0.3
Loss on Ignition 0.3 Moisture Content 0.1
131
Table 5.9: Properties of Chemical Admixtures
Admixture Type Description
Conforms to
Air-Entrainment
Is a light-orange liquid product based on a high-grade saponified rosin formulation. It is chemically similar to vinsol-based products but with increased purity. Typical addition rates range from 50 to 200 mL/100 kg (3/4 to 3 fl oz/100 lbs) of cement to have 4 to 8% air.
ASTM C 260
Super-plasticizer
Is a high range water-reducing admixture that contains no added chloride. 1 liter weighs approximately 1.08 kg (9 lb/gal). It is a dispersing admixture having a capacity to disperse the cement agglomerates. Typical addition rates range from 195 to 650 mL/100 kg (3 to 10 fl oz/100 lb) of cement.
ASTM C 494
Type F
Lithium Nitrate Is a solution of LiNO3 diluted with water.
132
CHAPTER SIX
LABORATORY TESTING PROCEDURES
6.1 INTRODUCTION
The laboratory testing-program was divided into three stages:
1. Stage 1 consisted of testing each aggregate to determine the physical properties
required for concrete proportioning. Aggregates were also prepared for mortar
and concrete batching.
2. Stage 2 consisted of testing all aggregates listed in Table 5.2 using ASTM C 227,
C 1260, and C 1293. Modifications to these tests were also investigated during
this stage.
3. Stage 3 consisted of investigating ASR mitigation alternatives.
6.2 STAGE 1: AGGREGATE TESTING AND PREPARATION
Aggregate testing was divided into two phases: 1) fine aggregate testing and 2)
coarse aggregate testing. Table 6.1 shows a list of all aggregate tests performed on
both fine and coarse aggregates.
Table 6.1: Aggregate Testing Performed
Aggregate Test Fine Coarse ASTM C 29 : “Unit Weight and Voids in Aggregate” ASTM C 127:“Specific Gravity and Absorption of Coarse Aggregate” ASTM C 128: “Specific Gravity and Absorption of Fine Aggregate” ASTM C 136: “Sieve Analysis of Fine and Coarse Aggregates”
= Test performed for this aggregate type
ASTM C 227 and C 1260 require that all aggregates be graded as per Table 6.2.
As a result, all aggregates had to be separated into the required sieve sizes, washed
over a #100 sieve, and then combined using the specified quantities for each sieve.
ASTM C 1293 requires that the coarse aggregate be proportioned as described in
133
Table 6.3. Again all coarse aggregates were sieved and aggregate portions retained
on the specified sieves were separated into different containers. Before concrete
batching, the different sizes were combined in accordance with the requirements of
Table 6.3. Fine aggregates to be tested according to C 1293 did not require any
processing and were tested as supplied. Figures 6.1 and 6.2 illustrate the aggregate
preparation procedures.
Table 6.2: ASTM C 227 and C1260 Aggregate Grading Requirements
Sieve Size Passing Retained on Mass, %
4.75 mm (No. 4) 2.36 mm (No. 8) 10 2.36 mm (No. 8) 1.18 mm (No. 16) 25 1.18 mm (No. 16) 600 µm (No. 30) 25 600 µm (No. 30) 300 µm (No. 50) 25 300 µm (No. 50) 150 µm (No. 100) 15
Table 6.3: ASTM C 1293 Coarse Aggregate Grading Requirements
Sieve Size Passing Retained on Mass, %
19 mm (3/4-in) 12.5 mm (1/2-in) 33 12.5 mm (1/2-in) 9.5 mm (3/8-in) 33 9.5 mm (3/8-in) 4.75 mm (No. 4) 33
134
Figure 6.1: Aggregate Washing Over #100 Sieve
Figure 6.2: Sieve Sizes Required For C 227 and C 1260 Mortar Bars
135
6.3 STAGE 2: TESTING FOR THE POTENTIAL ALKALI-SILICA
REACTIVITY OF AGGREGATES
6.3.1 Aggregate Testing Using ASTM C 227
All the fine aggregates listed in Table 5.2 were sieved, washed over a #100 sieve,
and combined in accordance with Table 6.2 to cast 1-in. x 1-in. x 11-in. mortar bars.
A total of two bars per aggregate were made. A fixed water-cement ratio of 0.47 was
used for all the mixtures instead of the range of flow numbers (flow between 105 and
120) specified by the actual testing procedures. The flow of all mixtures was
determined in accordance with the procedures detailed in ASTM C 109,
“Compressive Strength of Hydraulic Cement Mortars,” and the unit and air content
in accordance with the requirements of ASTM C 138, “Weight per Cubic Foot, Yield,
and Air Content of Concrete.” After fabrication, the bars were stored for 24 hours,
while still in the forms, in a moisture room. All bars were then demolded and stored
in sealed containers over water in an environmental room at 100oF. Absorbent
material around the walls of the containers was not used. Expansion data were
recorded after 14 days of curing and then every 1, 2, 3, 4, 6, 9, and 12 months.
Aggregate-cement combinations showing 3-month expansions higher than 0.05% or
6-month expansions higher than 0.10% were considered ASR reactive. Aggregate-
cement combinations showing 3-month expansions higher than 0.05% but 6-month
expansions lower than 0.10% were considered innocuous. Procedures for this test are
summarized in Figures 6.5 and 6.6. Figures 6.3 and 6.4 show some of the mortar bar
mixing procedures.
6.3.2 Aggregate Testing Using ASTM C 1260
In a similar manner to the C 227 procedures, aggregates were also used to cast 1-
in. x 1-in. x 11-in. mortar bars. Three mortar bars were cast using each of the
aggregates. All mixtures were also tested for flow, unit weight, and air content in
accordance with the requirements of ASTM C 109 and C 138 respectively. After 24
136
hours of moist curing, bars were stored in water at 80oC for 24 hours after which the
initial readings were recorded. Subsequent measures consisted of storing the bars in
a 1N NaOH solution at 80oC and recording expansion readings at 4, 7, 11, 14, 21,
and 28 days. A 14-day expansion greater than 0.20% indicated a potentially reactive
aggregate in the field, while a 14-day expansion smaller than 0.10% indicated a non-
reactive (innocuous) aggregate. Recent specifications have mentioned that 14-day
expansions higher than 0.10% should be used to classify aggregates as reactive.
Figures 6.7 and 6.8 show the curing process while Figure 6.9 includes a summary of
the C 1260 procedures.
Figure 6.3: Mortar bars cured for 24 hours in a moisture room, immediately after being formed (C 227 and C 1260)
Figure 6.4: Mortar bars stored over water, in containers with no wicks, in an environmental room at 380C
Figure 6.5: First Step in Performing ASTM C 227
Either Use Emmediately orStore in Jars for Later Use
Weight 330-g of Cement
Pass Cement Through a No.20 Sieve
Select Cement Type
Cement Handling
Put Excess Materials in a Plastic Bagand Store it with the Original Aggregate
Move Weighted Sample to 70-deg Rm24-hrs Before Mixing
Weight 675-g Sample,Label, and Store
Sieve for 5-min. in 300-g incrementsStop Sieving When Required Amount
* = ASTM C 138 to measure unit weight, γ, yield, and total air content ** = ASTM C 143 to measure the Slump W/C = Water-to-Cement Ratio γ = Concrete Unit Weight Control Air = Total air of concrete with no admixture (Table 7.12)
Entrained air = Total Air obtained by adding Entraining Agent – Control Air
163
Table 7.14: Concrete Mixtures Used to Investigate the Effect of Silica Fume
* = ASTM C 138 to measure unit weight, γ, yield, and total air content ** = ASTM C 143 to measure the Slump
γ = Concrete Unit Weight W/CM = Water-to-Cementitious-Materials Ratio a = Slump after adding 20cc of Superplasticizer b = Slump after adding 60cc of Superplasticizer
164
Table 7.15: Concrete Mixtures Used to Investigate the Effect of Class C Fly Ash
Agg. = Aggregate; B.S.G. = Bulk specific gravity; Abs. = Absorption; γssd = SSD unit weight;
DRUW = Dry rodded unit weight = γd; N/A = Not applicable C.A. = Coarse aggregate; F.A. = Fine aggregate Note1: ASTM C 127 for coarse aggregates and ASTM C 128 for fine aggregates Note2: ASTM C 29 Note3: ASTM C 136
171
Table 8.2: Chemical Analysis of Aggregates Agg. CaO
Positive = percentage the NAA result is larger than the one generated in this study Negative = percentage the NAA result is smaller than the one generated in this study
An inter-laboratory study evaluating the variation of C 1260 resulted in the
following conclusion (section 4.5.1.3.1): “For mortars giving average expansions
after 14 days in solution of more than 0.30%, the muti-laboratory coefficient of
variation has been found to be 14.9%. Therefore, the results of two properly
conducted tests in different laboratories on specimens of a sample of aggregate
184
should not differ by more than 42% of the mean expansion.” (Rogers 1996) Table
12.2 shows the variation from the mean of all readings. It can be seen from that table
that the variations between the results of both labs are small and the results can be
considered accurate. This was done to measure the accuracy of the testing being
performed for this study and the results show that testing was conducted properly.
Table 9.4: Variations from the Mean of the NAA and the C 1260 Results
Generated Through this Study 4-Day 7-Day 11-Day 14-Day A2-WY
Corresponding Na2Oeqiv. Content 1.5% 1.15% 0.81% 0.6% Mitigation Alternative
Replacement Level Evaluation
15% Reactive Reactive Reactive Reactive Class F Fly Ash 20% Reactive Reactive Innocuous Innocuous
Reactive = Alternative exhibiting 14-day expansion higher than Table 11.19 limits Innocuous = Alternative exhibiting 14-day expansions lower than Table 11.19 limits 11.11.3 Effect of Granulated Slag Coupled with Various Cement Alkali Content
Using granulated slag to replace 70% of the cement weight was effective in
mitigating the deleterious expansions of the highly reactive aggregate A6-NM when
the combination was evaluated using the 1N NaOH solution (1.5% Na2Oequiv.). In
order to determine whether lower percentages of granulated slag can be used with
lower cement alkali contents, the solution normality was decreased. Figures 11.59
and 11.65 illustrate that using 25% slag was not effective in mitigating the
deleterious alkali-silica reaction even when a solution normality of 0.35N was used
(0.6% Na2Oequiv.). When the A6-NM and slag combination was investigated using the
0.75N (1.15% Na2Oequiv.) solution normality, 50% slag was found to be not effective
in lowering the 14-day expansions below safe limits. However, 50% slag was
effective when evaluated using the 0.50N (0.80% Na2Oequiv.) and 0.35N (0.60%
Na2Oequiv.) in decreasing the 14-day expansions below 0.02%. Thus, 70% slag can be
used in combination with any alkali cement content (as high as 1.5% Na2Oequiv.). If a
lower alkali content cement is used, then the required slag percentage might be
decreased to 50% since the cement alkali content is lower than 0.8% Na2Oequiv..
Table 11.22 includes a summary of these observations.
308
Table 11.22: Effectiveness of Granulated Slag at Different Cement Alkali Contents with the Highly Reactive Aggregate A6-NM (0.92% C1260, 14-Day)
11.13 PREDICTIONS OF EFFECTIVE LEVELS OF REPLACEMENT USING K-M-A-J’S MODEL
Since the investigated levels of cement replacement with Class C fly ash, Class F
fly ash and silica fume were found not effective in mitigating ASR when evaluated
using the K-M-A-J’s model, the model was used to predict effective levels of
replacement. Results are presented in Table 11.27 and Appendix C. The
effectiveness of some of the predictions is demonstrated in Figure 11.81 through
11.86. Results of the C 1260 investigation of some of the predicted levels are
presented in Table 11.28.
Table 11.27: Predicted Levels of Replacement Using the K-M-A-J’s Model A6-NM
H.R. A4-ID H.R.
A2-WY M.R.
C2-SD S.R.
B4-VA S.R.
Class C Fly Ash 50% 65% 80% 45% 50%
Class F Fly Ash 40% 30% 30% 15% 20%
Silica Fume 20% 15% 15% 8% 20%
H.R. = Highly Reactive M.R. = Moderately Reactive S.R. = Slowly Reactive Highlighted Box = Values that were Investigated Not Highlighted Box = Values that were effective before
320
Table 11.28: C 1260 Expansions of Some Predicted Values of the K-M-A-J’s Model
Figure 13.1: C 1260 Results vs. C 1293 Results Note on Figure 13.1: C 1293 one-year expansions plotted on the y-axis and C1260 14-day expansions plotted on the x-axis. The figure shows how the C1260 expansions are overestimating the reactivity of aggregates. Aggregatesclassified as slowly reactive using C 1293 are shown as highly reactive by theC 1260 criteria. In addition, E6-IN and E2-IA that are innocuous by C 1293are found highly reactive with C 1260.
423
3. Fourteen-day expansions higher than 0.20% correlated well with 52-week
expansions higher than 0.070%. Moderately and highly reactive aggregates were
correctly identified using both C 1260 (0.20% limit) and C 1293 (0.070% limit).
These aggregates were reactive in field applications and contained reactive
illustrates the use of these tests. Petrographic analysis performed in accordance to
ASTM C 295 could not be used to identify reactive materials in slowly reactive
aggregates. ASTM C 295 could be used to verify and confirm the results generated in
accordance to C 1260 and C 1293.
ASTM C 1260 is a mortar bar test that consists of testing aggregates using a
specified gradation. The aggregate being investigated is combined with a cement to
cast three 1-in. x 1-in. x 11-in. mortar bars that are moist cured for 24 hours while in
the molds. Bars are demolded and stored for another 24 hours in water maintained at
800C. Bars are then moved to a 1N NaOH solution maintained at 800C and kept in
this solution for 14 days. Length expansions of the bars are monitored periodically
over the 14-day period of testing.
ASTM C 1293 is a concrete prism test that consists of investigating the reactivity
of an aggregate while being used in a concrete mixture. The reactive aggregate
(coarse or fine) is combined with an innocuous aggregate (coarse or fine depending
on the reactive aggregates) and a cement with an alkali content of 0.9 ± 0.1% to cast
three 3-in. x 3-in. x 11-in. concrete prisms. The cement alkali content is increased to
443
1.25% Na2Oequiv. by adding NaOH to the mixing water. A cement content of 708 ±
17 lb/yd3, a coarse aggregate oven-dry-rodded unit volume of 0.70 ± 0.20%, and a
water-cement ratio between 0.42 and 0.45 are required for concrete proportioning.
Concrete prisms are moist cured for 24 hours while still in molds. Prisms are then
demolded, measured for their initial length, and stored over water, in a sealed 6-gal
bucket with wicks on the sides (100% R.H.). Buckets are then stored in an
environmental room maintaining a temperature of 38 ± 20C. Length expansions are
monitored periodically over a period of one year.
The accelerated C 1293 consists of performing the same exact procedure as the
standard C 1293 with the exception of storing the bucket in an environmental room
maintained at 60 ± 20C. These procedures generated identical results to the standard
C 1293 but in a 3-month (13-weeks) period of time.
Identifying the potential alkali-silica reactivity of aggregates using the above
testing procedures should be performed as indicated in Figure 14.1 and Table 14.1,
whereas determining the degree of alkali-silica reactivity of aggregates should be
completed as illustrated in Table 14.2.
444
Table 14.1: Expansion Limits for Identifying Potentially Alkali-Silica Reactive Aggregates
ASTM C 1260 Mortar Bar Test
ASTM C 1293 Concrete Prism Test
Accelerated C 1293 Concrete Prism Test
14-day Expansion > 0.10%a,b,c
one-year Expansion > 0.040%d
13-week Expansion > 0.040%d
a Several aggregates showing 14-day expansions higher than 0.10% have not caused ASR related damage in field application concretes and exhibited one-year expansions lower than 0.040% when tested in accordance to C 1293 and 13-week expansions lower than 0.040% when tested in accordance to the accelerated C 1293. C 1293 results should prevail. b In rare occasions, some aggregates known to be reactive in field applications might exhibit 14-day expansions lower than 0.10%. This is usually caused by the removal of part of the reactive constituents of the aggregate as a result of aggregate preparation. A petrographic analysis in accordance to ASTM C 295 can be used to identify these aggregates and prevent the negative results. c An expansion limit of 0.08% after 14-day should be used with metamorphic aggregates. d An expansion limit lower than 0.040% may be required if aggregate will be used in a critical structure such as a nuclear containment or large dams (CSA, 1994).
Table 14.2: Determination of the Degree of Alkali-Silica Reactivity of Aggregates
Innocuous < 0.10% < 0.040% < 0.040% a ASTM C 1293 and accelerated C 1293 give the degree of reactivity for the combination of coarse and fine aggregates intended for the proposed concrete. If information about the combination is not available, then the degree of alkali-silica reactivity of the most expansive of the aggregates should be used to characterize the combination (CSA 1994). b ASTM C 1260 could not be used to test coarse and fine aggregate combinations. Each aggregate is tested separately and the largest test value should be used to determine the degree of alkali-silica reactivity. c If results of ASTM C 1260 and ASTM C 1293 contradict, then the results obtained using C 1293 should prevail.
445
14.3 MINIMIZING POTENTIAL FOR ASR-RELATED DAMAGE
Minimizing the potential for ASR related damage in a proposed concrete could be
achieved using a number of alternative approaches that are mainly dependent upon
the degree of alkali-silica reactivity of aggregates specified for the job. Results
generated throughout this investigation are summarized in Figure 14.3, which shows
the alternatives that passed C 1260 and the accelerated C 1293 for aggregates
investigated.
Different degrees of alkali-silica reactivity required different mitigation measures.
Mitigation alternatives included the use of sufficient amounts of Class C fly ash,
Class F fly ash, silica fume, granulated slag, and calcined clay to replace cement by
mass. Additional alternatives included the use of low alkali cement and the use of
lithium nitrate to replace a portion of the mixing water.
Effectiveness of alternatives listed in Figure 14.3 or any additional alternative
being considered for ASR mitigation should be verified using either ASTM C 1260
(mortar-bar test at 800C), C 1293 (concrete-prism-test at 380C), or the accelerated C
1293 (concrete-prism test at 600C) with the appropriate expansion limits. These tests
are also listed in Figure14.3.
When using ASTM C 1260, an alternative is considered effective in mitigating
ASR if it exhibits 14-day expansions lower than 0.10%. ASTM C 1260 can also be
used to investigate the effectiveness of lowering the alkali content of cement by
performing the test procedures using a NaOH solution molarity that corresponds to
the alkali content being investigated as determined by equation 14.1. When changing
the solution molarity, the expansion criterion should also be changed as shown in
Figure 14.2. ASTM C 1260 should not be used to evaluate the effectiveness of
lithium nitrate in mitigating ASR. Using equation 14.1 and Figure 14.2, ASTM C
446
1260 can also be used to investigate the effectiveness of a mitigation method used
with different cement alkali contents. However, it should be noted that these
procedures are quite conservative.
LmolescmwONaOH /06.0022.0
/2339.0][ ±+=− (Eq 14.1)
0.00
0.02
0.04
0.06
0.08
0.10
0.12
0 0.2 0.4 0.6 0.8 1 1.2
NaOH Solution Molarity
Exp
ansi
on C
rite
rion
, %
Figure 14.2: ASTM C 1260 Expansion Criteria Using Different NaOH Solution Molarities to Investigate Effectiveness of Cement Alkali Content
0.39 0.67 0.95 1.22 1.50 Corresponding Cement Na2Oequiv. as Determined by Eq. 14.1
447
Figure 14.3: Flow Chart II for Determining Effective Preventive Measures
Standard ASTM C 1293 Over water, 100% R.H., wicks, at 380C Expansion limit: 0.040% after 2 years
Accelerated ASTM C 1293 Over water, 100% R.H., wicks, at 600C Expansion limit: 0.040% after 26 weeks
Standard ASTM C 1260 In 1N NaOH solution at 800C Expansion limit: 0.10% after 14 days
ASR Preventive MeasuresFlow Chart II
Is aggregate highly
reactive?
Yes
Cement Na 2O equiv. < 0.08% - 17% Calcined Clay (min.) - 50% Slag (min.) - 25% Class F Fly Ash (min.) - 10% Silica Fume (min.) - 35% Class C Fly Ash (min.) - 4.6L of LiNO3 per 1Kg of Na2Oequ.
Higher Na 2O equiv. Cement - 25% Calcined Clay (min.) - > 55% Slag - 30% Class F Fly Ash (min.) - 50% Class C Fly Ash (min.)
Yes
No
Yes
- 17% Calcined Clay (min.) - 55% Slag (min.) - 25% Class F Fly Ash (min.) - 35% Class C Fly Ash (min.) - 10% Silica Fume (min.) - 4.6L LiNO3 per 1Kg of Na2O (min.)- < 0.90% Na2Oequiv. Cement No Special Requirements
Is aggregate slowly
reactive?
Is aggregate innocuous?
No
Yes
Is cement Na2Oequiv. less than 0.08%?
No
Verify Effectiveness of Alternative
Fly Ash, Calcined Clay, Slag, Silica Fume, or any Pozzolan
Reducing Cement Alkali Content
Standard ASTM C 1293 Over water, 100% R.H., wicks, at 380C Expansion limit: 0.040% after one year
Accelerated ASTM C 1293 Over water, 100% R.H., wicks, at 600C Expansion limit: 0.040% after 13 weeks
C 1260 with Corresponding MolarityNaOH solution at 800C: Equation 14.1 Expansion limit: Figure 14.2
Lithium Nitrate: LiNO3
448
When using ASTM C 1293, an expansion limit of 0.040% after 2 years of testing
is required to evaluate the effectiveness of supplementary cementitious materials
(SCM) such as fly ash, silica fume, granulated slag, and calcined clay. An expansion
limit of 0.040% after one year of testing should be used to evaluate the effectiveness
of air entrainment, low cement alkali content, and lithium nitrate.
When using the accelerated C 1293, an expansion limit of 0.040% after 26 weeks
of testing is required to evaluate the effectiveness of supplementary cementitious
materials (SCM) such as fly ash, silica fume, granulated slag, and calcined clay. An
expansion limit of 0.040% after 13 weeks of testing should be used to evaluate the
effectiveness of air entrainment, low cement alkali content, and lithium nitrate.
14.4 COST OF USING THE DIFFERENT MITIGATION ALTERNATIVES
Alternatives effective in mitigating ASR are listed in Figure 14.3. In this section a
comparison between the costs of using these alternatives is detailed. Table 14.3
includes the average costs used for the comparison. Assumptions used for the
comparison were as follows:
1. The cement content of the mixtures is 710 lb/yd3 (used throughout this
investigation),
2. Na2Oequiv. content in the mixtures is 3.67 kg/yd3, and
3. Cost included only cementitious materials cost and additives.
Table 14.3: Price Cost of Materials Used In Investigation Alternative Cost
Cement $70/ton Class F Fly Ash $23/ton Class C Fly Ash $26/ton
EFFECTIVE LEVELS OF CEMENT REPLACEMENT WITH CLASS C FLY
ASH, CLASS F FLY ASH, AND SILICA FUME EVALUATED USING THE
K-M-A-J’S MODEL FOR A6-NM, A4-ID,
A2-WY, C2-SD, AND B4-VA
481
A6-NM, Highly Reactive Aggregate
-8
-7
-6
-5
-4
-3
-2
-1
0
0 20 40 60 80 100 120Percent Replacemnt of Cement by Weight
ln(k
)
Class C Fly AshClass F Fly AshSilica Fume
A4-ID, Highly Reactive Aggregate
-8
-7
-6
-5
-4
-3
-2
-1
0
0 20 40 60 80 100 120
Percent Replacement of Cement by Weight
ln(k
) Class C Fly AshClass F Fly AshSilica Fume
482
A2-WY, Highly Reactive Aggregate
-8
-7
-6
-5
-4
-3
-2
-1
0
0 20 40 60 80 100 120
Percent Replacement of Cement by Weight
ln(k
)
Class C Fly AshClass F Fly AshSilica Fume
B4-VA, Slowly Reactive Aggregate
-8
-7
-6
-5
-4
-3
-2
-1
0
0 20 40 60 80 100 120Percentage Replacemnt of Cement by
Weight
ln(k
) Class C Fly AshClass F Fly AshSilica Fume
483
C2-SD, Slowly Reactive Aggregate
-8
-7
-6
-5
-4
-3
-2
-1
0
0 20 40 60 80 100 120Percentage Replacemnt of Cement by
Weight
ln(k
) Class C Fly AshClass F Fly AshSilica Fume
484
Appendix D:
Petrographic Analysis and Field Performance Documentation of Aggregates Investigated
485
WYOMING AGGREGATES: A1-WY AND A2-WY The Wyoming DOT provided a coarse (A1-WY) and a fine aggregate (A2-WY) from the same source. The aggregate is a rhyolite and has been used extensively in the Wyoming area in structures varying from sidewalks to highway structures. It was reported that this aggregate is alkali-silica reactive. It was used in a section of Interstate 80 (I 80) and the section was heavily deteriorated due mainly to ASR. Since then, the deteriorated section was removed and replaced using non-reactive aggregates. It was also reported that signs of ASR, caused by the reactivity of this aggregate, can be seen all over the Wyoming area, namely, in sidewalks, poles, and driveways. IDAHO AGGREGATES: A3-ID AND A4-ID The Idaho DOT provided a coarse (A3-ID) and a fine (A4-ID) aggregate from the same source. The aggregate is a combination of quartzite, sandstone, limestone, andesite, and rhyolite. This aggregate is a Snake River deposit. Historically aggregates from that river were used in bridge deck sections of the US 26. The decks were heavily deteriorated due to ASR. Recent use of the aggregate is confined to asphalt hot mixes and chip seals. However, there are several occasions where the aggregate was used in portland cement concrete. “In 1993 aggregate from the source being investigated was used in two concrete bridge decks, the lower Payette Canal and Payette River Slough bridge decks. For the lower Payette Canal Deck, Type K cement was used to evaluate its effect on shrinkage cracking. No fly ash nor other ASR mitigation measures were used in either deck, except that low alkali cement was specified. Chip seals are present, so the full deck surface is not visible. According to the most recent maintenance inspection reports (in 1998), “the chip seals are worn away in some spots and there are narrow bare strips along the curbs. Some cracking is visible (more cracking on deck w/o type K), but at this point it appears to be shrinkage cracking rather than the more irregular map cracking. This leads us to believe that ASR, if present, isn’t very far advanced at this time (Stanley, A.F. 1999 Interview).” ASTM C 1260 results for both the coarse and fine aggregates were also reported. Mortar bars were not stored in hot water before storing them in the 1N NaOH solution. For the fine aggregate the 14-day expansions reported were 0.78% and 0.92%. The reported 14-day expansions for the coarse aggregates were 0.69% and 0.70%. NEW MEXICO AGGREGATES: A5-NM (PL), A6-NM (PL), E7-NM (SA),
AND E8-NM (SA) There were two aggregates that originated from New Mexico. Coarse and fine aggregate samples from each aggregate were made available for investigating. The following is a presentation of their reported properties.
486
Petrographic Analysis: A5-NM and A6-NM Petrographic examination of A5-NM (coarse) and A6-NM (fine) indicates a volcanic-and-metamorphic-rock suite of rocks in the coarse aggregate. The coarse-aggregate fractions are dominated by various tuffs, andesites, and basalts of volcanic origins, and gneisses and metaquartzites of metamorphic origin. Each sieve fraction contains potentially alkali-reactive constituents, mainly tuffs and andesites having a wide range in percentages of crystals, devitrified glass, and rock (lithic) fragments. Almost all of the tuffs are devitrified, that is, the glass that once comprised the volcanic ash shards has crystallized and compressed, forming unusually small crystals of cristoballite and other silica minerals, now making up a silica-rich matrix showing only hints of the previously particulate rock. Numerous potentially reactive andesitic rocks having an extremely finely microcrystalline matrix (in which the larger crystals are set), make up roughly 30% of the andesite-basalt category. Within the gneiss category are several varieties of finely crystalline, banded rocks in which the mineral constituents exhibit the effects of directed metamorphic stresses. These particular aggregates are also potentially reactive. Chert (microcrystalline and chalcedonic quartz) was noted in some of the sieve fractions. Its microcrystalline structure clearly suggests potential alkali reactivity.
Thus, in general, approximately 20 to 30% of the A5-NM and A6-NM materials in each of the sieve intervals are easily classified as potentially reactive. Approximately 99% of the aggregate particles are considered very hard and durable, showing little tendency to break apart. No caliche coatings were observed. The large majority of the particles are equidimensional to slightly elongated and flattened. Particle surfaces are generally smooth, except where the particle has been crushed. These morphologies typically produce concrete mixes having a normal water demand.
487
Percentages of Constituents in Each Sieve Fraction of A5-NM Retained on: 3/4 1/2 3/8 No. 4
Reported ASTM C 1260 Results A5-NM and A6-NM were reported as reactive aggregates with a 14-day expansion of 1.04% when tested using C 1260 procedures in 1997. E7-NM and E8-NM were reported as potentially reactive aggregates with a 14-day expansion of 0.34%. Field Performance A5-NM and A6-NM have been established as being reactive aggregates. As a result the aggregate is not used in portland cement concrete structures without an ASR mitigating method. E7-NM and E8-NM have been reported as having good field performance with mitigation alternatives. NORTH CAROLINA AGGREGATE: A7-NC A coarse aggregate from North Carolina was made available for the study. The following are some of the aggregate properties that were reported. Petrographic Analysis The following is a summary of a petrographic analysis report that was completed on the aggregate in question on February 2, 1993. The types of aggregate identified are described as follows: Slate Rock Type: Light to medium green-gray and medium to dark blue-gray, very fine to fine-grained slate (argillite) Mineralogy: The mineralogy is very hard to determine due to fine-grained particles; however, it is evident that some percentage of the rock is comprised of clay, chlorite, quartz, and feldspar with a trace to 2% sulphides. Particle Shape: Angular to subangular, triangular to tabular with occasional rectangular fragments Degree of Weathering: Fresh with some weathered fragments. Deleterious Materials: This slate most likely derived much of its materials from the surrounding volcanic rocks, and therefore, may contain volcanic glass. Other: Carbonate and sulphides are present on fracture surfaces and along bedding planes and foliation planes. Tuff Rock Type: Medium gray, aphanitic (very fine-grained) and fine to medium-grained tuff/tuffaceous sediment. Mineralogy: Mineralogy is hard to determine; however, some percentage of the rock is comprised of chlorite, feldspar, epidote, and carbonate. Particle Shape: Angular to subangular. Degree of Weathering: Fresh to slightly weathered.
489
Deleterious Materials: Volcanic Glass may be one of the constituents of this type of rock since it is of volcanic origin. In conclusion, the minerals present in the aggregate may have potential for alkali reactivity, pending the success of ASTM C 287 tests for aggregate. Field and Laboratory Performance In the spring of 1987, members of a Federal Highway inspection tour observed extensive pattern cracking in the wing walls of the James Garrison Bridge over the Tillery on NC 24-27-73. Constructed during 1977-78, this structure exhibited no noticeable cracking in the superstructure until 1982 when cracking in the end bents and wing walls was photographed. A 1984 inspection report noted cracking on the deck, abutment, and back walls of end bents, pier caps, and columns. Cracking has continued to progress and although the cracking is most extensive in the wing walls and caps, some cracking is present in all components of the bridge structure. It has been noted that presence and condition of these cracks is worse than some 50 year old bridges. A7-NC was the coarse aggregate used for that bridge in combination with a Type I cement, widely used sand, city water, and widely used chemical admixtures. A7-NC, which is reported as a meta-argillite, is used infrequently in concrete, but easily passes the standard quality tests for wear and soundness. Intact concrete cores were taken from the structure and examined. The cores showed a compressive strength in excess of 7000 psi and cracking that is best described as pattern or map cracking. Cracks on the surface typically extend only an inch or two in depth before disappearing into a myriad of many finer cracks. Concrete specimens obtained from cores are characterized by fractured aggregates with dark rims around the coarse aggregate portion. White deposits are present on the fractured faces of the coarse aggregate. Petrographic examinations confirmed alkali-silica reactivity. It was estimated that the alkali content of the cement is 0.70%.
A7-NC was also used in the construction of NC 138 over Long Creek between Oakboro and Aquadale. NC 138 was identified as exhibiting cracking due to the alkali-aggregate reactivity of A7-NC. Because the construction records for that bridge were destroyed, an extensive laboratory-testing program was conducted in order to verify the reactivity of the aggregate. The tests performed included:
1. Petrographic Examination, ASTM C 295 and C-856 2. Rock Cylinder Test, ASTM C-586 3. Quick Chemical Test, ASTM C 289 4. Mortar Bar Test, ASTM C 227 5. Testing of Concrete Prisms, ASTM C-157
The conclusion of the testing program was that A7-NC has a high reactivity potential and that its use should be restricted to concretes with cements having an alkali content of 0.4% or less.
490
Virginia Aggregates: A8-VA and B4-VA Coarse and a fine aggregate samples from a Virginia aggregate were made available for investigating. The following is a presentation of their reported properties. Petrographic Analysis: A8-VA “The sample generally consisted of particles of Quartz, Quartzite, Granitic rock fragments, Siltstone and Sandstone. A general description of the particles is as follows: 1. Quartz: The particles display a massive crystal structure with low porosity and
permeability. They were generally rounded aggregates with smooth surfaces. The aggregate was hard and dense. Some particles had fractures that did not penetrate completely through. Particle colors included milky white, smokey brown and clear (transparent).
2. Quartzite: This aggregate displayed a granoblastic (equigranular) texture. The particles were composed of medium to fine grain sand cemented tightly in a silica matrix. Particle colors were rose, light brown and reddish brown.
3. Granite Rock: Particle shapes range from angular to rounded. Mineral constituents included quartz, mica, hornblend, and feldspar. The aggregate has good intergranular bonds and is considered to be sound and durable. Only minor evidence of weathering was noted on the surface of some particles. Particle color was generally grey.
4. Sandstone: These aggregate particles were mainly composed of angular to subrounded quartz minerals along with other fine grain ferruginous minerals. The aggregate displayed good intergranular bonds and was generally free of fractures. Particle colors were predominately brown with some gray particles.
5. Siltstone: These aggregate particles display a compact crystal structure. The grain size is approximately 1/16 to 1/256 mm (medium to very fine silt). Particle colors were brown, black, and yellow. Intergranular bonds were considered to be good.
No external coatings were noted on the aggregate. The aggregate is considered to be sound and durable (Petrographic report supplied by aggregate producer, 1999).”
491
Composition of Aggregate Sample (A8-VA) In
whole sample
Constituents 1” ¾” ½” 3/8” #4 Cdt 1 Cdt 2 TotalsSandstone 25 42 22 28 40 31 - 31 Quartz Rock 44 43 49 52 39 45 - 45 Quartzite 25 12 16 11 13 14 - 14 Granite Rock Fragments 6 1 7 6 2 4 1 5 Siltstone 0 2 6 3 6 4 - 4 Totals 100 100 100 100 100 - - 99 Average (Cdt 1) 98 - Average (Cdt 2) - 1 Cdt 1: Rock particles considered to be fresh, dense, and in good physical condition. Cdt 2: Rock particles considered sound and durable with minor weathering. Petrographic Analysis: B4-VA The sample generally consisted of particles of quartz, quartzite, granitic rock fragments, siltstone, sandstone, and natural mineral fragments. A general description of the particles is as follows: 1. Quartz: The quartz is the most abundant of all constituents contained in this
sample. Particle shapes range from angular to sub-rounded. The particle colors were milky white, brick red, rose or pink, and clear.
2. Quartzite: This aggregate displayed a granoblastic (equigranular) texture. The aggregate was composed of tightly interlocked grains of quartz. In some particles, feldspar is evident in the matrix. The quartzite is of the sedimentary type of formation. Particle colors were white, grey, reddish, and clear.
3. Granite Rock: Particle shapes range from angular to rounded. Mineral constituents included quartz, mica, hornblende, and fine grained pink feldspar. The aggregate has good intergranular bonds. Particle colors were generally grey and shades of pink and red.
4. Sandstone: The sandstone particles were mainly composed of fine grained and well-sorted quartz. Particle shape ranged from sub-rounded to rounded which were cemented in a silica matrix. Particle colors were variable between red, brown, yellow, white, and grey.
5. Siltstone: Thee aggregate particles displayed a compact crystal structure. The grain size is approximately 1/16 to 1/256 mm (medium to very fine silt). Particle colors were brown, black, and yellow.
6. Minerals: These particles were composed of natural minerals which became detached from the parent rock. Components included hornblende, feldspar, and various other ferruginous minerals.
No external coatings were noted on the aggregate. The aggregate is considered to be sound and durable.
Siltstone 27 23 8 11 7 4 9 1 10 Mineral Fragments trace trace 2 3 3 8 3 - 3 Totals 100 100 100 100 100 100 - - 96 Average (Cdt 1) 94 - Average (Cdt 2) - 2 Cdt 1: Rock particles considered to be fresh, dense, and in good physical condition. Cdt 2: Rock particles considered sound and durable with minor weathering. Field Performance: A8-VA and B4-VA It was reported that these aggregates “have been on the list of approved materials for the Virginia Department of Transportation for many years.” Many fairly new concrete structures incorporate these aggregates. It was also reported that an ASR mitigation alternative is required in all used mixtures. About 10 to 15 years ago, the Virginia DOT has required the use of a pozzolan in all their portland cement concrete mixtures, namely, 20-25% Class F fly ash, 5% silica fume, and 35-50% slag. All these alternatives at these levels have been used to mitigate ASR. NEBRASKA AGGREGATES: A9-NE Samples of an aggregate composed of mixed sand and gravel and heavily used in the Nebraska area were made available for this ASR study. The following are some of the documentation that was provided with the aggregate. Petrographic Analysis: A9-NE The following is a summary of a petrographic analysis performed on A9-NE: 1. The aggregate sample is partially crushed natural gravel comprising primarily of
siliceous rocks and other fragments as indicated in the following table. 2. Major constituents of the aggregate sample include pink granite, orthoquartzite,
metaquartzite, chert, metachert and allogenic quartz. Allogenic indicates rock or mineral constituents were derived from pre-existing rocks (e.g. granite) and transported to their present depositional site. This allogenic quartz becomes the major constituents of the size fraction passing the No. 30 sieve (less than 0.6mm).
493
3. Minor constituents of the aggregate sample include sandstone, siltstone/claystone, and miscellaneous volcanic rocks, igneous rocks and metamorphic rocks.
4. The crypto-to-micro-crystalline textured silica as exhibited by orthoquartzite/metaquartzite and chert/metachert as well as the microgranular to fine granular silica as exhibited by the allogenic quartz are prone to be alkali-reactive when used in concrete containing high-alkali cement paste and in concrete exposed to very moist conditions.
5. Most aggregate partcles are hard, dense, free of coatings, and are sub-angular to well-rounded.They appear to be frost resistant and should bond well to cement paste.
6. Test methods and petrographic description of the aggregate sample are given in the following sections of this report.
Pink granite is the most abundant constituent of the sand-gravel aggregate sample
larger than the No.30 sieve (0.6mm). It is pink-colored, coarse-grained, hypidiomorphic-granular, plutonic rock, containing quartz as the most essential mineral. Accessory minerals include plagioclase feldspar and some mafic minerals such as hornblende, mica and little iron oxide.
Orthoquartize and metaquartizite are the second most abundant constituent of the aggregate sample particularly in the coarse size fractions (retained on No.16 mesh sieve). Orthoquartzite is a sandstone comprising primarily of quartz and minor amount of feldspar, limonite, and other mafic minerals. It exhibits crypto-crystalline to micro-crystalline texture, well-sorted, well-rounded to sub-rounded quartz sand grains cemented in a siliceous matrix. Metaquartzite is compositionally similar to orthoquartzite except that metaquartzite has undergone metamorphism resulting in strain of quartz sand grains and cement. Metamorphism has imparted the appearance of a mosaic of interlocking quartz sand grains in metaquartzite particles.
The stained quartz sand grains exhibit undulatory extinction in thin sections. The quartzites (ortho and meta) are fine-to-coarse-grained, hard and dense, tan to translucent to buff. Chert and metachert are also one of the major constituents of the sand-gravel aggregate sample. They are dull to semi-vitreous, microcrystalline sedimentary rock constitute dominantly of interlocking minute crystals of quartz. Impurities include small amount of chalcedony, mica, limonite, calcite and other minerals. The varieties of chert present in the sample are: (a) light-colored (light brown, tan, and buff) amorphous silica (opaline), (b) dark brown to black metachert, and (c) light to dark-colored porous chert.The chert/metachert are known to be alkali-reactive when used in concrete especially the crypto-and-micro-crystalline and porous varieties. Quartz (silica) is also a major constituent of the aggregate sample particularly those size fractions passing the No. 30 sieve (0.6mm). It is allogenic, indicating it was formed or generated elsewhere, usually at a distant place specifically from rock
494
constituents and minerals derived from pre-existing rocks (i.e granite) and transported to their present depositional site. They are microgranular to fine granular, crystalline to crypto-crystalline silica. They exhibit vitreous to greasy luster, conchoidal fracture and an absence of cleavage. The crypto-crystalline variety includes chalcedony, agate, and opal. These kinds of minerals when used in concrete containing high-alkali cement pastes are prone to be alkali-reactive. Sandstone is a minor constituent (less than 5%) of the aggregate sample. The sandstone particles are composed of fine to coarse sand grains of quartz, feldspar, calcite , ironstone and other dark-colored minerals. The sand grains are sub-angular to well rounded and cemented primarily by secondary quartz or detrital chert grains. Sandstone grades into siltstone and claystone as particle size of the sand grains decreases. Therefore, composition of the siltstones and claystones are similar to the sandstones. The sandstone, siltstone, and claystone particles are tan to brown, generally moderately hard to hard, frequently dense to less commonly porous. Other minor constituents of the aggregate sample include mica, volcanic and igneos rocks and metamorphic rocks, schist, phyllite, hornfels) categorized as miscellaneous group. These particles are generally dark-colored, moderately hard and dense except the lineated particles.
Petrographic Composition for A9-NE Composition of Fractions Retained on Sieves
Field Performance: A9-NE It was reported that A9-NE “is representative of that used in much of the pavement when Interstate I-80 was first constructed through Nebraska. The aggregate is still being used but limestone is added to mitigate reactivity. When I-80 was first constructed, about one-half was built with a mix that used only A9-NE.”
495
These sections of I-80 were heavily damaged due to ASR as can be seen in the following figures.
Alkali-Silica Reaction Damage in Sections of the I-80 in Nebraska
More Alkali-Silica Reaction Damage in Sections of I-80 in Nebraska
Laboratory Performance: A9-NE Available laboratory test results indicate that the sand-gravel aggregate A9-NE complies with the majority of requirements outlined in ASTM C 33. However, the aggregate exhibit signs of being reactive with alkali and can cause potentially harmful expansions. Reported results are as follows:
496
Reported ASTM C 227 Results for A9-NE Test Results ASTM C 33 Limits Comment Expansion at 1 month 0.005% Expansion at 2 months 0.016% Expansion at 3 months 0.021% 0.05% Expansion at 4 months 0.031% Expansion at 5 months 0.031% Expansion at 6 months 0.031% 0.10% Non-Reactive
Note 1: Alkali content of laboratory cement = 1.01% Na2Oequiv. Note 2: Expansion is generally considered to be excessive if it exceeds
0.05% at 3 months or 0.10 at 6 months. Expansions greater than 0.05% at 3 months should not be considered excessive where 6 month expansion remains below 0.10% (Appendix X1.1.3 ASTM C 33) Reported ASTM C 1260 Resultsfor A9-NE
Test Results Comment Coarse Aggregate Expansion at 10 days
0.058% Innocuous
Fine Aggregate Expansion at 10 days
0.290% Reactive
Aggregate Combination: 70% sand 30% Coarse Expansion at 10 days
0.174% Reactive
Note 1: W/C = 0.50 Note 2: Expansion greater than 0.10% at 10 days is considered reactive MARYLAND AGGREGATE: B1-MD AND B2-MD Coarse and fine aggregate samples from the Maryland area where made available for this ASR investigation. Properties of the aggregate are as follows. Petrographic Analysis: B1-MD AND B2-MD The following table includes a summary of a petrographic examination performed on the aggregate.
Results of Petrographic Analysis on B1-MD and B2-MD
Mineral Species Crystal/Grain Size % of Composition Comments Chlorite Feldspar Fine-Grained Together:
80 – 90 Finely Intergrown
Matted Groundmass Quartz Minor Chlorite 0.3 mm 10-20 Some “Floating
Crystals”
497
Field Performance: B1-MD and B2-MD The aggregate has been used extensively in Delaware. It is well known as a slowly reactive aggregate with ASTM C 1260 expansions between 0.10% and 0.15%. It has shown to be reactive in very old structures that do not have any pozzolan or any other ASR mitigating method. However, since its identification as a slowly reactive aggregate, it has been successfully used with appropriate ASR mitigating measures. Laboratory Performance: B1-MD and B2-MD Reported C 1260 date back to 1991. A type I cement was used in combination with a water-cement ratio of 0.50. Results are listed in the following able.
Reported ASTM C 1260 Results for B1-MD and B2-MD Bar No. 4-Days 7-Days 11-Days 14-Days
SOUTH DAKOTA AGGREGATES: C1-SD AND C2-SD Petrographic Analysis: C1-SD and C2-SD 1. The rock is a crushed, equi-dimentional, hand sample (2 to 3 inch) sized massive,
pink quartzite. 2. The material exhibits well-developed quartz overgrowths of the individual quartz
grains. The pink to purplish color is derived from finely disseminated iron oxide which coats the original, well-rounded quartz grains as a thin film.
Reported Optical Properties and Mineralogy: C1-SD
Minerals Vol. Color Relief Other Quartz 98% Colorless Low Quartz, quartzite sand, and cement;
undulatory extinction in most grains, unit extinction in few
Pyroxene <1 Green, yellow, Pink pleoch
m-high Diopside, pyroxene cleavage and parallel extinction
Iron Oxide <1 Red Medium Finely disseminated, coating on original sand grains
Heavy Minerals
<0.1 Browns, greens
Medium to high
Various, zircon, epidote and others
Sericite <0.1 Colorless m-low At some grain boundaries Clays <0.1 Colorless low Clay “books" 3. The aggregate has a lengthy service history of good performance as concrete
aggregate and in other construction applications.
498
Field Performance: C1-SD and C2-SD In old structures, namely dams, the aggregate was found to be alkali-silica
reactive. Its reactivity is attributed to the existence of strained quartz in the aggregate, which makes it a slowly reactive aggregate that cannot be detected using the existing C 227 procedures (Buck 1983). ILLINOIS AGGREGATE: D1-IL AND D2-IL
An innocuous fine and coarse aggregate form the same source and representative of aggregates used in the Illinois area were used throughout the study. Aggregate properties are as follows: Petrographic Analysis: D1-IL and D2-IL
The aggregate is hard, massive, structureless to highly coralliferous, finely crystalline dolomite. It contains numerous fossils (corals, trilobites, crinoids, cephalopods, brachiopods, gastropods, sponges). It also contains very minor amounts of clay minerals, detrial quartz, authigenic silica and traces of carbonaceous matter (tar-like hydrocarbons) and iron-oxide compounds. It does not contain mineral assemblages that are prone to alkali-aggregate reactions.
The quarried stones have been used for many years as good, chert-free concrete aggregates, excellent aggregate source for high strength concrete, raw materials for the manufacture of high-quality lime, source for ripraps, blacktop chips and mineral fillers. IOWA AGGREGATE: E2-IA Field Performance: E2-IA
The aggregate is a glacial deposit that is quite shaley and has been successfully used in concrete structures with no evidence of ASR damage. The sand aggregate was used on a 1961 paving project on U.S. Highway 18. The mix design used was an IDOT C-3 as follows for volume: 1. Cement 0.114172 2. Sand (E2-IA) 0.297395 3. Coarse 0.364593 4. Water 0.457 lb per lb 5. Cement alkali content > 0.9% Na2Oequiv. 6. Air 6.0%
The latest inspection showed that the pavement has small pop outs but no ASR evidence. Laboratory Performance: E2-IA
Reported C 1260 results show that E2-IA had a 14-day expansion of 0.33% and was classified as reactive. The average of three bars was used to get the final expansion result.
499
Reported C 1293 results are listed below. The test was performed by both the IaDOT and LaFarge Corporation. Both tests resulted in 1-year concrete-prism expansions lower than 0.04% (around 0.020%).
NEVADA AGGREGATES: E3-NV AND E4-NV Petrographic Information: E3-NV AND E4-NV
E3,E4-NV is a glassy rhyolite that comes from Rilite aggregates. The rhyolite is a young, volcanic rock. It is an amorphous siliceous rock with more than 65% SiO2. Physically, the rhyolite consists of 80 to 90% glass and 5 to 10% voids. The minerals present, which make up from 5 to 10% of the total aggregate, are phenocrysts within the glass matrix and consist of (in order of abundance) quartz, alkali-feldspar, plagioclase, and biotite. The rhyolite is light to dark grey in color and flow-banded. It is an angular aggregate with 100% fractured faces. The aggregate is considered to be potentially deleterious. Field and Laboratory Performance
Even though the aggregate is considered deleterious when examined petrographically, it has been used successfully in concrete structures. Petrographic examinations of cores taken from an 11-year-old concrete slab that utilized E4-NV, show no evidence of ASR. This is explained by the following points that are quoted from the petrographic examination report of the cores: 1. E3,4-NV is and always has been used only with a low alkali cement (<0.6% by
weight alkalis). 2. When Rilite is used in concrete, it composes both the coarse and fine fractions of
the aggregate. It has been shown that a deleterious degree of alkali-aggregate reaction will not occur if the reactive forms of siliceous material are sufficiently abundant in the concrete to consume available alkalies in production of alkali-silica combinations of very low alkali to silica, so that they lack the capacity to develop swelling or osmotic pressure by absorption of water.
INDIANA AGGREGATE: E6-IN This aggregate has only been used either with a low alkali cement or with an ASR
mitigating method. As a results, the aggregate has been successfully used for years.
500
There are no records of whether this aggregate can be used with high alkali cement and no ASR mitigating method and not show deleterious expansions. SUMMARY
The following table is a summary of the available documentation about the alkali-silica reactive of aggregates investigated in this study (Table 5.2).
fragments, siltstone, sandstone, and natural mineral fragments
A9-NE Reactive Reactive Pink granite, orthoquartzite, metaquartzite, chert, metachert and
allogenic quartz A10-PA Reactive N.R.
B(1,2)-MD Reactive Reactive Chlorite feldspar, quartz, and chlorite B4-VA Innocuous N.R. Quartz, quartzite, granitic rock
fragments, siltstone, sandstone, and natural mineral fragments
C(1,2)-SD Reactive Reactive Pink quartzite, pyroxene, iron oxide, sericite, Clay
D(1,2)-IL Innocuous Good with high-alkali
cement
Dolomite
E2-Ia Innocuous Good with high-alkali
cement
Glacial deposit, shale
E(3,4)-NV Reactive Good with mitigation
Glassy rhyolite
E6-IN Innocuous Good with high alkali
cement
N.R.
E(7,8)-NM Reactive Good with mitigation
Rhyolite, andesite
N.R. = No Record
Appendix E
Petrographic Examination of Mortar Bars After Being Tested In Accordance
with ASTM C 1260
Introduction Thin sections from six mortar bars tested according to ASTM C 1260 were
petrographically examined for signs of ASR. Two bars contained highly reactive aggregates from Category A (A4-ID and A2-WY), two contained slowly reactive aggregates (C2-SD and B4-VA), and two contained aggregates form Category E (E2-IA and E6-IN). The two category E aggregates were determined to be innocuous in the field and using C 1293; however, showed reactive C 1260 expansions. The following is a discussion of the findings. Category A Aggregates (A4-ID and A2-WY)
Representative pictures of damage found in mortar bars made with these aggregates are shown in Figures E.1 and E.2. Evidence of ASR was not easily detected. In a few locations aggregates had internal damage and had a thin rim around the outside of aggregate particle, as seen in Figure E.1. However, even in these instances the evidence did not overwhelmingly indicate the presence of ASR.
Figure E.1: A piece of aggregate showing internal cracking and a very thin
black rim around the outside of the aggregate
Figure E.2: Cracking propagating from a piece of aggregate into an air void
indicating that there might be distress caused by aggregate expansion
Slowly Reactive Aggregates (C2-SD and B4-VA)
Thin sections taken from mortar bars containing these aggregates did not show any signs of aggregate distress. All examined aggregate particles were sound with no internal cracking and no presence of the outside rim characterizing the ASR gel. Signs of ASR damage could not be identified from examining the thin sections taken. Category E Aggregates (E2-IA and E6-IN) As mentioned earlier these aggregates were determined to be innocuous in field applications and according to C 1293; however, they tested reactive using C 1260. Figures E.3 and E.4 show typical distress found in thin sections taken from mortar bars containing these aggregates. Figure E.3 indicates that the distress was located in the paste and cracks were propagating away from an aggregate particle. No rims were identified around aggregate particles. Figure E.4 might be representative of DEF; however, it is not very clear. Examining the thin sections obtained, it was not possible to determine the cause of the excessive expansion and damage caused to the mortar bars containing these aggregates.
Figure E.3: Cracks in the paste propagating away from an aggregate particle
Figure E.4: Possible presence of DEF
Final Remarks Examining the different thin sections, it was not possible to determine the definite cause of expansions in the mortar bars. Even though the highly reactive aggregates showed some signs of aggregate distress, the evidence was not very conclusive. No evidence of ASR was found in slowly reactive aggregates and in Category E aggregates.
501
References AASHTO T 299-93, Rapid Identification of Alkali Silica Reaction Products in Concrete, American Association of State Highway and Transportation Officials, Standard Specifications for Transportation Materials and Methods of Sampling and Testing, Washington D.C., pp. 829-831. ACI Committee 221, 1998, “State-of-the-Art Report on Alkali-Aggregate Reactivity,” ACI 221R.1-95, American Concrete Institute, Detroit, MI. AFNOR P 18-585, “Aggregates-Dimensional Stability Test in Alkali Medium - Mortar Test," December 1990, 13 pp. AFNOR P 18-587, “Aggregates Dimensional Stability in Alkali Medium - Concrete Test," December, 1990, 10 pp. AFNOR P 18-588, “Aggregates Dimensional Stability in Alkali Medium - Accelerated Mortar Microbar Test," December, 1991, 14 pp. AFNOR P 18-589, “Aggregate Potential Reactivity of Alkali-Silica and Alkali-Silicate Type - Kinetic Test; Chemical Method," December, 1992, 13 pp. AFNOR P 18-590, “Aggregates Dimensional Stability in Alkali Medium - Accelerated Mortar Autoclave Test," April, 1993, 7 pp. AFNOR P 18-542,”Granulats Courants pour Betons Hydrauliques - Les Criteres de Qualification des Granulats vis-a-vis de l’alcali-reaction (draft)," 1994, 16 pp. Alasali, M.M. and Malhotra, V.M. (1991), “Role of Concrete Incorporating High Volumes of Fly Ash in Controlling Expansion Due to Alkali-Aggregate Reaction," ACI Materials Journal Vol. 88, No. 2, March-April, pp. 159-163. ASTM C 1260-94, Potential Alkali Reactivity of Aggregate (Mortar-Bar Method), American Society for Testing Materials, Philadelphia, PA. USA, pp. 652-655. ASTM C 1293-95, Concrete Aggregates by Determination of Length Change of Concrete Due to Alkali-Silica Reaction, American Society for Testing Materials, Philadelphia, PA. USA, pp. 656-661. ASTM C 227-90, Potential Alkali Reactivity of Cement-Aggregate Combinations (Mortar-Bar Method), American Society for Testing and Materials, Philadelphia, PA. USA, pp. 129-133. ASTM C 289-94, Potential Alkali-Silica Reactivity of Aggregates (Chemical Method), American Society for Testing Materials, Philadelphia, PA. USA, pp. 159-165.
502
ASTM C 294-86, Standard Descriptive Nomenclature for Constituents of Natural Mineral Aggregates, American Society for Testing and Materials, Philadelphia, PA. USA, pp. 169-175. ASTM C 295-90, Petrographic Examination of Aggregates for Concrete, American Society for Testing and Materials, Philadelphia, PA. USA, pp. 176-183. ASTM C 33-93, Standard Specification for Concrete Aggregates, American Society for Testing and Materials, Philadelphia, PA. USA, pp. 10-16. ASTM C 342-90, Standard Test Method for Potential Volume Change of Cement-Aggregate Combinations, American Society for Testing and Materials, Philadelphia, PA. USA, pp. 207-209. Ativitavas, Nat. “ASR in Concrete: State-of-the-Art, Test Methods, and Selected Aggregates.” Masters Thesis, The University of Texas at Austin, 1998. Berard, J. and Roux, R. (1986), “La Validitée des Betons du Quebec: Le Role des Granulats," Canadian Journal of Civil Engineering, Vol. 13, No. 1, pp. 12-24. Berube, M.A. and Frenette, J. (1994), “Testing Concrete for AAR in NaOH and NaCl Solutions at 380C and 800C," Cement and Concrete Composites, Vol. 16, pp. 207-218. Berube, M.A. and Fournier, B. (1992), “Accelerated Test Methods for Alkali-Aggregate Reactivity," Advances in Concrete Technology, editor V.M. Malhotra, CANMET/EMR, Ottawa, Canada, pp. 583-627. Berube, M.A. and Fournier, B. (1993), “Canadian Experience with Testing for Alkali-Aggregate Reactivity in Concrete," Cement and Concrete Composites, Vol. 15, pp. 27-47. Berube, M.A. and Fournier, B. (1993), “Canadian Experience with Testing for Alkali-Aggregate Reactivity in Concrete," Cement and Concrete Composites, Vol. 15, pp. 27-47. Berra, M., Mangialardi, T., and Paolini, A.E. (1994), “Application of the NaOH Bath Test Method for Assessing the Effectiveness of Mineral Admixtures Against Reaction of Alkali with Artificial Siliceous Aggregate," Cement and Concrete Composites, Vol. 16, pp. 207-218. Berra, M., De Casa, G., and Mangialardi, T. (1996). “Evolution of Chemical and Physical Parameters of Blended Cement Mortars Subjected to the NaOH Bath Test," Proceedings of the 10th International Conference on Alkali-Aggregate Reaction in Concrete, Australia, pp. 483-491. Berra, M., Mangialardi, T., and Paolini, A.E. (1994), “Application of the NaOH Bath Test Method for Assessing the Effectiveness of Mineral Admixtures Against Reaction of Alkali
503
with Artificial Siliceous Aggregate," Cement and Concrete Composites, Vol. 16, pp. 207-218. Blackwell, B.Q., Thomas, M.D.A., Nixon, P.J., and Pettifer, K. (1992), “The Use of Fly Ash to Suppress Deleterious Expansion Due to AAR in Concrete Containing Greywacke Aggregates," Proceedings of the 9th International Conference on AAR in Concrete, London, UK, pp. 102-109. Blanks, R. F. And Meissner, H. S. (1945), “Deterioration of Concrete Dams Due to Alkali-Aggregate Reaction," Proceedings, American Society of Civil Engineers, Vol. 71, pp. 3-18.
Buck, A.D., (1983). “Alkali Reactivity of Strained Quartz As a Constituent of Concrete Aggregate.” Cement, Concrete, and Aggregates. Vol. 5, No. 2. pp. 131-133. Building Research Establishment (1988), “Alkali Aggregate Reactions in Concrete," BRE Digest 330, BRE, Gaston. Canadian Standards Association (1994), “Concrete Materials and Methods of Concrete Construction: Methods of Test for Concrete," Canadian Standards Association, Toronto, Canada. Canham, I. Page, C., and Nixon, P.J. (1987), “Aspects of the Pore Solution Chemistry of Blended Cements Related to the Control of Alkali Silica Reaction," Cement Concrete Research, Vol. 17, pp. 839-844. Canham, I., Page, C.L., and Nixon, P.J. (1987), “Aspects of the Pore Solution Chemistry of Blended Cements Related to the Control of Alkali Silica Reactions," Cement and Concrete Research, Vol. 17, pp. 839-844. Chatterjee, S., Fordos, Z., and Thaulow, N. (1992), “Alkali-Silica Reaction: Danish Experience.” The Alkali-Silica Reaction in Concrete. Edited by Swamy, R.N. Balkie and Van Nostrand Reinhold. Chen, H., Soles, J.A., and Malhotra, V.M. (1993), “Investigations of Supplementary Cementing Materials for Reducing Alkali-Aggregate Reactions," Cement and Concrete Composites, Vol. 15, pp. 75-85. Concrete Society (1992), “alkali Silica Reaction, Minimizing the Risk of Damage to Concrete," Concrete Society Technical Report No. 30, Concrete Society, London. Criaud, A, Defosse, C., Chabanis, B., Debray, L., Michel, B., Sorrentino, D., Gallias, M., Salomon, S., Guedon, S., and Le Roux A. (1994), “The French Standard Methods for Evaluating the Reactivity of Aggregates with Respect to AAR: Results of an Inter-Laboratory Program," Cement and Concrete Composites, Vol. 16, pp. 199-206
504
Davies, G. and Oberholster, R.E. (1986), “Use of the NBRI Accelerated Test to Evaluate the Effectiveness of Mineral Admixtures in Preventing Alkali-Silica Reaction," Cement and Concrete Research, Vol. 17, pp. 97-107. DeMerchant, D.P. and Soles, J.A. (1993), “CANMET Research on Alkali-Aggregate Reactivity in New Brunswick," International Workshop on Alkali-Aggregate Reactions in Concrete: Occurrences, Testing, and Control, CANMET-EMR, Ottawa, Canada, 35 p. Department of Transport, Specification for Highway Works Series 17000 Structural Concrete, In Manual of Contact Departments for Highway Works, 1992. Diamond, S. (1989), “ASR-Another Look at Mechanisms.” Proceedings 8th International Conference on Alkali-Aggregate Reaction, Japan. Dolar-Mantuani, L. (1983), “Handbook of Concrete Aggregates - A Petrographic and Technological Evaluation," Noyes, Park Ridge, NJ, USA. Donnell, M.D. and Higgins, D.D. (1992), “Effectiveness of GGBS in Preventing ASR”< 9th International Conference on Alkali-Aggregate Reaction in Concrete, Vol. 1, Concrete Society, Wexham Springs, pp. 175-183. Duchesne, J. And Berube, M.A. (1994), “The Effectiveness of Supplementary Cementing Materials in Suppressing Expansion Due to ASR: Another Look at the Reaction Mechanisms. Part 2: Pore Solution Chemistry," Cement and Concrete Research, Vol. 24, No. 2, pp. 221-230. Fournier, B., Berube, M.A., and Vezina, D. (1987), “Investigation of the Alkali-Reactivity Potential of Limestone Aggregates from the Quebec City Area (Canada)," Proceedings of the 7th International Conference on Alkali-Aggregate Reaction in Concrete, Ottawa, 1986, Noyes, Park Ridge, NJ, pp. 23-29. Fournier, B. and Berube, M.A. (1991), “Evaluation of a Modified Chemical Method to Determine the Alkali-Reactivity Potential of Siliceous Carbonate Aggregates. Canadian Developments in Testing Concrete Aggregates for Alkali-Aggregate Reactivity," Ministry of Transportation, Ontario, Research and Development Branch Rep. 92, pp. 118-135. Fournier, B., Bilodeau, A., and Malhotra, V.M. (1991), “Effectiveness of High-Volume Fly Ash Concrete in Controlling Expansion Due to Alkali-Silica Reaction," pp.721-756. Fournier, B. And Malhotra, V.M. (1996), “Inter-Laboratory Study on the CSA A23.2-14A Concrete Prism Test for Alkali-Silica Reactivity in Concrete," Proceedings of the 10th International Conference on Alkali-Aggregate Reaction in Concrete, Australia, pp. 302-310. Grattan-Bellew, P.E. (1989), “Test Methods and Criteria for Evaluation the Potential Reactivity of aggregates," Alkali-Aggregate Reaction - 8th International Conference, Society of Materials Science of Japan, Kyoto, Japan, pp. 279-294.
505
Grattan-Bellew, P.E. (1990), “Canadian Experience with Mortar Bar Rapid Tests for AAR," Canadian Developments in Testing Concrete Aggregates for Alkali-Aggregate Reaction, Ministry of Transportation of Ontario, Downsview, Canada, Report EM-92, pp. 17-34. Gudmundsson, G. and Olafsson H. (1996), “Silica Fume in Concrete – 16 Years of Experience in Iceland," Proceedings of the 10th International Conference on Alkali-Aggregate Reaction in Concrete, Australia, pp. 562-569. Gudmudsson, G. and Olafsson H. (1999), “Alkali-Silica Reactions and silica Fume: 20 years of Experience in Iceland," Cement and Concrete Research, Vol. 29, No. 8. p. 1289. Heijnen, W.M.M., Larbi, J.A., and Siemes, A.J.M. (1996), “Alkali-Silica Reaction in the Netherlands," Proceedings of the 10th International Conference on Alkali-Aggregate Reaction in Concrete, Australia, pp. 109-116. Helmuth, R. (1993), “Alkali-Silica Reactivity: An Overview of Research," Washington D.C.: National Research Council, Strategic Highway Research Program, SHRP-C-342, 1993. Hill, E.D. (1996), “Alkali Limits for Prevention of Alkali-Silica Reaction: A Brief Review of their Development,” Cement, Concrete, and Aggregates, Vol. 18, No. 1, June, pp.3-7. Hobbs, D. W. (1988), “Alkali-Silica Reaction in Concrete,” Thomas Telford, Ltd., London, pp. 183. Hobbs, D.W. (1994), “The effectiveness of PFA in Reducing the Risk of Cracking due to ASR in Concretes Containing Cristobalite," Magazine of Concrete Research, Vol. 46, pp. 167-175. Hobbs, D.W. (1987), “Alkali-Silica Reaction in Concrete," Thomas Telford, London, pp. 103-133. Hobbs, D.W. (1994), “The effectiveness of PFA in Reducing the Risk of Cracking due to ASR in Concretes Containing Cristobalite," Magazine of Concrete Research, Vol. 46, pp. 167-175. Hobbs, D.W. (1994), “The Effectiveness of PFA in Reducing the Risk of Cracking Due to ASR in Concretes Containing Cristobalite," Magazine of Concrete Research Vol. 46, No. 168, pp. 167-175. Hooton, R.D. (1991), “New Aggregate Alkali-Reactivity Test Methods," Ministry of Transportation, Ontario, Research and Development Branch Rep. MAT 91-14, 83 pp.
506
Hooton, R.D. (1996), “Recent Developments in Testing for ASR in North America," Proceedings of the 10th International Conference on Alkali-Aggregate Reaction in Concrete, Australia, pp. 280-287. Jensen, V. (1996), “Present Experience with Aggregate Testing in Norway," Proceedings of the 10th International Conference on Alkali-Aggregate Reaction in Concrete, Australia, pp. 133-141. Kakodkar, S. Ramakrishnan, V., and Zimmerman, L. (1997), “Addition of Class C Fly Ash to Control Expansions Due to Alkali-Silica Reaction," Transportation Research Record 1458, pp. 109-117. Kammer, H. A. And Carlson, R. W. (1941), “Investigation of Causes of Delayed Expansion of Concrete in Buck Hydroelectric Plant,” Journal of the American Concrete Institute, Proceedings, Vol. 37, June, pp. 665-671. Kawamura, M., Kayyali, O.A., and Hague, M.N. (1988), “Effects of Fly Ash on Pore Solution Compositions in Calcium and Sodium Chloride Bearing Mortars," Cement and Concrete Research, Vol. 18, pp. 763-773. Kehew, A.E. (1988), General Geology for Engineers, Prentice Hall, New Jersey. Kemp, J.F. (1958), A Handbook of Rocks, Grout, F.F., Lancaster Press. Kishitani, K., Kobayashi, M., and Tamura, H. (1994), “The Rapid Test JIS A 1804," Cement and Concrete Composites, Vo. 16, pp. 169-175. Kishitani, K., Nishibayashi, S., and Morinaga, S. (1986), “Response of JCI to Alkali-Aggregate Reaction Problem - Guideline for Determining Potential Alkali Reactivity," Concrete Alkali-Aggregate Reaction, Proceedings of the 7th International Conference on AAR, Ottawa, Canada, Noyes, Park Ridge, NJ, USA, 1987, pp. 264-268. Krell, J. (1987), “Influence of Mix Design on Alkali-Aggregate Reaction," 7th International Conference on AAR, Ottawa, Canada, 1986, Noyes, Park Ridge, NJ, USA, pp. 441-445.
Lane, D.S. (1994). “Alkali-Silica Reactivity in Virginia” Virginia Transportation Research Council. Final Report. No. VTRC 94-R17. Larbi, J.A. and Bijen, J.M. (1990), “Interaction of Polymers with Portland Cement During Hydration: A Study of the Chemistry of the Pore Solution of Polymer-Modified Cement Systems," Cement and Concrete Research, Vol. 20, pp. 139-147. Lee, C. (1989), “Effects of Alkalis in Class C Fly Ash on Alkali-Aggregate Reaction," Proceedings of the 3rd International Conference on Fly Ash, Silica Fume, Slag, and Natural Pozzolans in Concrete, Trondheim, Norway, Vol. 1, pp. 417-430.
507
Leming, M.L., Mitchell, J.F., Johnson, J.K., and Ahmad, S.H. (1996). “Investigation of Alkali-Silica Reactivity in North Carolina Highway Structures”. Department of Civil Engineering. North Carolina State University. Le Roux, A and Guedon-Dubied, J.S. (1996). “The French Preventative Approach to AAR Compared to Experience.” Proceedings of the 10th International Conference on Alkali-Aggregate Reaction in Concrete, Australia. pp. 202- 207. Mather, B. (1952), “Cracking of Concrete in the Tuscaloosa Lock,” Highway Research Board, Proceedings of the Thirty-First Annual Meeting, National Academy of Sciences-National Research Council Publication 238, pp. 218-233. McCoy, W.J. and Caldwell A.G. (1951). “New Approach to Inhibiting Alkali Aggregate Expansion.” Journal of the American Concrete Institute. Vol 22. Pp. 693-706 Mullings, G.M. and Lobo, C.L. (1999). “Evaluation of ASR Tests on a National Sampling of Aggregates” 7th Annual Symposium Proceedings. International Center for Aggregate Research. The University of Texas at Austin. April 19-21. Nagatagi, S., Ohga, H., and Inoue, T. (1991), “Evaluation of Fly Ash for Controlling Alkali-Aggregate Reaction," Proceedings of the 2nd International Conference on Durability of Concrete, Montreal, Canada, pp. 955-972. Nixon, P.J. and Gaze, M.E. (1983), “The Effectiveness of Fly Ashes and Granulated Blast-Furnace Slags in Preventing AAR," Proceedings of the 6th International Conference on Alkalies in Concrete, Copenhagen, 1983, pp. 61-68. Nixon, P.J., Page, C.L., Bollinghaus, R., and Canham, I. (1986), “The Effect of PFA with High Total Alkali Content on Pore Solution Composition and Alkali Silica Reaction," Magazine of Construction Research, Vol. 38, pp. 30-35. Nixon, P. and Sims, I. (1996), “Testing Aggregates for Alkali-Reactivity: Report of RILEM TC-106," Materials and Structures/Mateiaux et Construction, Vol. 29, July pp. 323-334. Nixon, P. and Page, C. (1987), “Pore Solution Chemistry and Alkali Aggregate Reaction," Concrete Durability, Proceedings of the Katherine and Bryant Mather Conference, SP-100, Detroit, American Concrete Institute. Oleson, C. C. (1963), “Abnormal Cracking in Highway Structures in Georgia and Alabama,” Journal of the American Concrete Institute, Proceedings, Vol. 60, March pp. 329-353. Ong, S. (1993). “Studies on Effects of Steam Curing and Alkali Hydroxide Additions on Pore Solution Chemistry, microstructure, and Alkali Silica Reactions.” Ph.D. Dissertation, Purdue University.
508
Peixing, F., Yaling, L., Huimin, F, and Qiang, H. (1996). “Alkali-Silica Reactive Aggregates in Beijing Area.” Proceedings of the 10th International Conference on Alkali-Aggregate Reaction in Concrete, Australia. pp. 578-581. Pepper, L. And Mather, B. (1959), “Effectiveness of Mineral Admixtures in Preventing Excessive Expansion of Concrete due to Alkali-Aggregate Reaction," ASTM Proceedings, Vol. 59, pp. 1178-1203. Johnston, D., Ramakrishnan, V., and Nunna, P. (1997), “Effect of Natural Pozzolan Addition on Expansions Caused by Alkali-Silica Reaction," Transportation Research Record 1458, pp. 118, 128. Ranc, R., Isabelle, H., Clement, J.Y., and Sorentino, D. (1994), “Limits of Application of the ASTM C 227 Mortar Bar test. Comparison with two Other Standards on Alkali-Aggregate Reactivity," Cement, Concrete, and Aggegates, Vol. 16, No. 1, June, pp. 63-72. Rasheeduzafar, Hussain, S.E. (1991), “Effect of Microsilica and Blast Furnace Slag on Pore Solution Composition and Alkali-Silica Reaction," Cement and Concrete Composites, Vol. 13, pp. 219-225. Rogers, C. A. (1993), “Canadian Standards Related to Alkali-Aggregate Reactivity,” Proposed 1994 Version of Appendix B of CSA A23.1 and Related Test Methods from CSA A23.2, Ministry of Transport, Downsville, ON, 86 pp. Rogers, C.A. (1993), “Alkali-Aggregate Reactivity in Canada," Cement and Concrete Composites, Vol. 15, pp. 13-19. Rogers, C.A. (1996). “Multi-Laboratory Study of the Accelerated Mortar Bar Test for Alkali-Silica Reaction.” Proceedings of the 10th International Conference on Alkali-Aggregate Reaction in Concrete, Australia. Pp. 362- 369. Sakagushi, Y., Takumara, M., Kitagawa, A., Hori, T., Tomosawa, F., and Abe, M. (1989). “The Inhibiting Effect of Lithium Compounds on Alkali-Silica Reaction”. Proceedings of the 8th International Conference on Alkali-Aggregate Reaction in Concrete, Kyoto, Japan. pp. 229-234. Scott, J., F. And Duggan, C.R. (1987), “Potential New Test for Alkali-Aggregate Reactivity," 7th International Conference on AAR, Ottawa, Canada, 1986, Noyes, Park Ridge, NJ, USA, pp. 319-323. Scott, J., F. And Duggan, C.R. (1990), “Mechanisms of Expansion in the Duggan Test for Alkali-Aggregate Reactions," Canadian Developments in Testing Concrete Aggregates for Alkali-Aggregate Reactivity, Ministry of Transportation of Ontario, Downsview, Ontario, Canada, Report EM-92, pp. 70-82.
509
Shayan, A., Ivanusec, I., and Diggins, R. (1994), “Suitability of Two Rapid Test Methods for Determining the Alkali Reactivity of Sands," Cement and Concrete Composites Vol. 16, pp. 177-188. Shayan, A., Diggins, R.G., Ivanusec, I., and Westgate, P.L. (1988), “Accelerated Testing of some Australian and Overseas Aggregates for Alkali-Aggregate Reactivity," Cement and Concrete Research, Vol. 18, pp. 843-851. Shayan, A. and Quick, G. (1989), “Microstructure and Composition of AAR Products in Conventional Standard and New Accelerated Testing," Alkali-Aggregate Reaction - 8th International Conference, Society of Materials Science of Japan, Kyoto, Japan, pp. 474-482. Shayan, A., Diggings R., and Ivanusec I (1996), “Effectiveness of Fly Ash in Preventing Deleterious Expansion Due to Alkali-Aggregate Reaction in Normal and Steam-Cured Concrete," Cement and Concrete Research, Vol. 26, No. 1, pp. 153-164. Shayan, A., Landon-Jones, I., Nelson, P. (1993), “Case Study of Fly Ash Concrete in Tallowa Dam Containing Alkali-Reactive Aggregate," Shayan, A., Green, W.K., and Collins, F.G. (1996). “Alkali-Aggregate Reaction in Australia.” Proceedings of the 10th International Conference on Alkali-Aggregate Reaction in Concrete, Australia. pp. 85, 92. Sibbick, R. G., and Page, C. L. (1992), “Threshold Alkali Contents for Expansion of Concretes Containing British Aggregates,” Cement and Concrete Research, Vol. 22, pp. 990-994. Silva, H.S., Braga Reis, M.O., and Silva, A.S. (1996). “Geologica Conditioning of ASR Development. A Brief Evaluation of Portuguese Mainland.” Proceedings of the 10th International Conference on Alkali-Aggregate Reaction in Concrete, Australia. pp. 142-149. Smith, M.A. and Halliwell, F. (1979), “The Application of the BS4550 Test for Pozzolanic Cements to Cements Containing Pulverized Fuel Ashes," Magazine of Concrete Research, Vol. 31, No. 108, pp. 159-170. Stanton, T. E., “Influence of Cement and Aggregate on Concrete Expansion,” Engineering News -Record, February 1, pp. 59-61. Stanton, T. E., “Expansion of Concrete Through Reaction Between Cement and Aggregate,” Transactions, American Society of Civil Engineers, Col. 107, pp. 54-126. Stark, D. (1989) “Alkali Silica Reactivity in the Rocky Mountain Region,” Proceedings, Fourth International Conference on the Effects of Alkalies in Cement and Concrete, Purdue University, West Lafayette, IN, pp. 235-243.
510
Stark D. (1978), “Alkali Silica Reactivity in Rocky Mountain Region," Proceedings of the 4th International Conference on the Effects of Alkalies in Cement and Concrete, Purdue University, pp. 235-243. Stark, D. (1993), “Eliminating or Minimizing Alkali-Silica Reactivity," Washington D.C.: National Research Council, Strategic Highway Research Program, SHRP-C-343. St John, D.A. and Freitag, S.A. (1996). “Fifty Years of Investigation and Control of AAR in New Zealand.” Proceedings of the 10th International Conference on Alkali-Aggregate Reaction in Concrete, Australia. pp. 150-157. Stokes, D.B. (1996). “Use of Lithium to Combat Alkali Silica Reactivity.” Proceedings of the 10th International Conference on Alkali-Aggregate Reaction in Concrete, Australia. pp. 862-867. Tang Mingshu, Deng Min, Xu Zhongzi, Lan Xianghui, and Han Sufen (1996). “Alkali-Aggregate Reaction In China.” Proceedings of the 10th International Conference on Alkali-Aggregate Reaction in Concrete, Australia. pp. 195-201. Thomas, M. D. A., Hooton, R. D., and Rogers, C. A. (1995), “Prevention of Damage Due to AAR in Concrete Construction-Canadian Approach,” Proceedings of Camnet/ACI Conference, Las Vegas, 12 pp. Thomas, M.D.A., Nixon, P.J., and Pettifer, K. (1991), “The Effects of Pulverized-Fuel Ash with a High Total Alkali Content on Alkli Silica Reaction in Concrete Containing Natural UK Aggregates," Proceedings of the 2nd International Conference on Durability of Concrete, Montreal, Canada, pp. 919-940. Thomas, M.D.A., Balckwell, B.Q., and Pettifer, K. (1992), “The Suppression of Damge from Alkali Silica Reaction by Fly Ash in Concrete Dams," Proceedings of the 9th International Conference on AAR in Concrete, London, UK, pp. 1059-1066. Thomas, M.D.A. (1996), “Field Studies of Fly Ash Concrete Structures Containing Reactive Aggregates," Magazine of Concrete Research, Vol. 48, No. 177, pp. 266-279. Thomas, M.D.A., Blackwell, B.Q., and Nixon, P.J. (1996), “Estimating the Alkali Contribution from Fly Ash to Expansion Due to Alkali-Aggregate Reaction in Concrete," Magazine of Concrete Research, Vol. 48, No. 177, pp. 252-263. Thomas, M.D.A., Hooton, R.D., and Rogers, C.A. (1997), “Prevention of Damage Due to Alkali-Aggregate (AAR) in Concrete Construction - Canadian Approach,” Cement, Concrete, and Aggregates, CCAGDP, Vol. 19, No. 1, pp. 26-30. Thomas, M.D.A (1996), “Review of the Effect of Fly Ash and Slag on Alkali-Aggregate Reaction in Concrete," Construction Research Communication Ltd, Building Research Establishment, London.
511
Tremper, B. (1941), “Evidence in Washington of Deterioration of Concrete Through Reactions Between Aggregates and High-Alkali Cements,” Journal of the American Concrete Institute, Proceedings, Vol. 37, June, pp. 673-686. Tremper, B. (1944), “The Effect of Alkalis in Portland Cement on the Durability of Concrete,” Journal of the American Concrete Institute, Proceedings, Vol. 41, November, pp. 89-104. Tse, W.L. and Gilbert, S.T. (1996). “A Case Study of the Investigation of AAR in Hong Kong.” Proceedings of the 10th International Conference on Alkali-Aggregate Reaction in Concrete, Australia. pp. 158-165. Wang, H., Tysl, S., and Gillot, J.E. (1994). “Practical Implications of Litium-based Chemicals and Admixtures in Controlling Alkali-Aggregate Reactions”. Proceedings of the 4th International Conference on Superplasticizers. Montreal, Canada. pp. 353-366. West, G. (1996), Alkali_Aggregate Reaction in Concrete Roads and Bridges. Thomas Telford Publications. London. Pp. 22-42. Woolf, D.O. (1952), “Reaction of Aggregate with Low-Alkali Cement,” Public Records, Vol. 27, No. 3, August 1952, pp 49-56. Yangsoo Lee, J.N., Chung, J., and Yoon, J. (1996). “Presence of Alkali-Silica Reaction Aggregates in Korea.” Proceedings of the 10th International Conference on Alkali-Aggregate Reaction in Concrete, Australia. pp. 117-122. Yen, T., Chu, B.L., Lu, C.K., and Liao, J.C. (1996). “Alkali-Aggregate Reactivity in Western Taiwan.” Proceedings of the 10th International Conference on Alkali-Aggregate Reaction in Concrete, Australia. pp. 166-173.
Additional References (Used for Extensive Literature Review)
Alasali, M.M., Malhotra, V.M., and Soles, J.A., 1991, “Performance of Various Test Methods for Assessing the Potential Alkali Reactivity of Some Canadian Aggregates,” ACI Materials Journal, Vol. 88, No. 6. Bamforth, P.B., Price, W.F., and Widdows, S.J., 1992, “Evaluation of the Susceptibility to ASR of Concrete Mixes Containing Marine Dreged Aggregates,” The 9th International Conference on Alkali-Aggregate Reaction in Concrete, Vol. I, Westminster, London. Barisone, G., Restivo, G., 1992, “Alkali-Silica Reactivity of Alluvial Deposits Evaluated Using Chemical and Psamographic Methods,” The 9th International Conference on Alkali-Aggregate Reaction in Concrete, Vol. I, Westminster, London.
512
Berra, M., Bertacchi, P., 1991, “Alkali-Aggregate Reaction in Concrete Dams,” Water Power and Dam Construction, Vol. 43, No. 4, pp. 12-16. Berube, M.A., Duchesne, J., and Chouinard, D., 1995, “Why the Accelerated Mortar Bar Method ASTM C 1260 is Reliable for Evaluating the Effectiveness of Supplementary Cementing Materials in Suppressing Expansion Due to Alkali-Silica Reactivity,” American Society for Testing and Materials, Vol. 17, No. 1, pp. 26-34. Berube, M.A., Fournier, B., Mongeau, P., Dupont, N., Quellet, C., and Frenette, J., 1992, “Effectiveness of the Accelerated Mortar Bar Method, ASTM C-9 Proposal P 214 or NBRI, for Assessing Potential AAR in Quebec (Canada),” The 9th International Conference on Alkali-Aggregate Reaction in Concrete, Vol. I, Westminster, London. Berube, M.A., Fournier, B., Mongeau, P., Dupont, N., Quellet, C., and Frenette, J., 1992, “A Simple Autoclave Method Mortar Bar Test Method for Assessing Potential Alkali-Aggregate Reactivity in Concrete,” The 9th International Conference on Alkali-Aggregate Reaction in Concrete, Vol. I, Westminster, London. Charlwood, R.G., 1994, “A review of Alkali-Aggregate Reactions in Hydroelectric Plants and Dams,” Hydropower and Dams, Vol. 1, No. 3, pp. 73-80. Chatterji, S., 1978, “An Accelerated Method for Detection of Alkali-Aggregate Reactivity of Aggregates,” Cement and Concrete Research, Vol. 8, No. 5, pp. 647-650. Chatterji, S., 1989, “Mechanism of Alkali-Silica Reaction and Expansion, Proceedings, 8th International Conference on Alkali-Aggregate Reaction in Concrete,” K. Okada, S. Nishibayashi, and M. Kawamura, Eds., 8th ICARR Local Organizing Committee, The Society of Material Science, Kyoto, Japan, pp. 101-105. Chatterji, S., Thaulow, N. and Jensen, A.D., 1987, “Studies of Alkali-Silica Reaction Part4 Effect of Different Alkali Salt Solutions on Expansion,” Cement and Concrete Research, Vol. 17, No. 5, pp. 777-783. Clark, L.A., 1991, “Modeling the Structural Effects of Alkali-Aggregate Reaction on Reinforced Concrete,” ACI Materials Journal, Vol. 88, No. 3, pp. 271-277. Clayton, N., 1989, “Structural Performance of ASR Affected Concrete,” Proceedings of the 8th International Conference on Alkali-Aggregate Reaction, K. Okada, S. Nishibayashi, and M. Kawamura, Eds., Society of Material Science, Kyoto, Japan, pp. 671-676. Collins, R.J., Bareham, P.D., 1987, “Alkali-Silica Reaction: Suppression of Expansion Using Porous Aggregate,” Cement and Concrete Research, Vol. 17, No. 1, pp. 89-96. Courtier, R.H., 1990, “The Assessment of ASR-Affected Structures,” Cement and Concrete Composites, Vol. 12, No. 3, pp. 191-201.
513
Criaud, A., Vernet, C., and Defosse, C., 1992, “A Rapid Test for Detecting the Reactivity of Aggregates: The Microbar Method,” The 9th International Conference on Alkali-Aggregate Reaction in Concrete, Vol. I, Westminster, London. Curtil, L., Habita, M.F., 1994, “Study of the Alkali-Aggregate Reaction on Concrete Prisms,” Cement and Concrete Research, Vol. 24, No. 3, pp. 473-478. Danay, A., 1994, “Structural Mechanics Methodology in Diagnosing and Assessing Long-Term Effects of Alkali-Aggregate Reactivity in Reinforced Concrete Structures,” ACI Materials Journal, Vol. 91, No. 1, pp. 54-62. Diamond, S., 1976, “A Review of Alkali-Silica Reaction and Expansion Mechanism,” Cement and Concrete Research, Vol. 6, P. 549. Diamond, S., Ong, S., 1992, “The Mechanisms of Lithium Effects on AAR,” Proceedings of the 9th International Conference of Alkali-Aggregate Reaction in Concrete, Vol. 1, Concrete Society, Slough, pp. 269-278. Dolar-Mantuani, L., 1975, “Petrographic Aspects of Siliceous Alkali Reaction Aggregates,” Proceedings, Symposium on Alkali-Aggregate Reaction, Reykjavik, Iceland, pp. 87-100. Duncan, M.A.G., Swenson, E.G. and Gillott, J.E., 1973, “Alkali-Aggregate Reaction in Nova Scotia III, Laboratory Studies of Volume Change,” Cement and Concrete Research, Vol. 3, No. 3, pp. 233-245. Duncan, M.A.G., Swenson, E.G. Gillott, J.E. and Foran, N.R., 1973, “Alkali-Aggregate Reaction in Nova Scotia I, Summary of a Five-Year Study,” Cement and Concrete Research, Vol. 3, No. 1, pp. 55-67. Emmons, P.H., 1993, Concrete repair and maintenance illustrated. RS Means Company, INC., MA. Farny, J.A., 1996, “Diagnosis and Control of Alkali-Aggregate Reactions in Concrete,” Portland Cement Association, American Concrete Pavement Association, Skokie, Illinois. Fournier, B., Berube, M.A. and Bergeron, G., 1991, “A rapid Autoclave Mortar Bar Method to Determine the Potential Alkali-Silica Reactivity of St. Lawrence Lowlands Carbonate Aggregates (Quebec, Canada),” Cement, Concrete and aggregates, Vol. 13, No. 1, pp. 58-71. Fournier, B., Berube, M.A., 1991, “Application of the NBRI Accelerated Mortar Bar Test to Siliceous Carbonate Aggregates Produced in the St. Lawrence Lowlands (Quebec, Canada),” Cement and Concrete Research, Vol. 21, No. 5, pp. 853-862. Fournier, B., Berube, M.A., 1992, “A Comparison of Laboratory Testing Methods for Evaluating Potential Alkali-Reactivity in the St-Lawrence Low Lands (Quebec, Canada),”
514
The 9th International Conference on Alkali-Aggregate Reaction in Concrete, Vol. I, Westminster, London. Fournier, B., Berube, M.A., 1993, “Recent Applications of a Modified Gel Pat Test to Determine the Potential Alkali-Silica Reactivity of Carbonate Aggregates,” Cement and Concrete Composites, Vol. 15, No. 1-2, pp. 49-73. Fowler, D.W., Zollinger, D.G., Carrasquillo, R.L. and Constantino, C.A., 1996, “Aggregate Tests Related to Performance of Portland Cement Concrete, Phase I: Interim Report," NCHRP Project 4-20, Transportation Research Board of the National Research, The University of Texas at Austin. French, W.J., 1992, “The Characterization of Potentially Reactive Aggregates,” The 9th International Conference on Alkali-Aggregate Reaction in Concrete, Vol. I, Westmister, London. Gifford, P. M., Gillott, J.E., 1996, “Alkali-Silica Reaction and Alkali-Carbonate Reaction in Activated Blast Furnace Slag Cement (ABFSC) Concrete,” Cement and Concrete Research, Vol. 26, No. 1, pp. 21-26. Gillott, J. E., 1995, “Review of Expansive Alkali-Silica Reactions in Concrete,” Journal of Materials in Civil Engineering, Vol. 7, No. 4, pp. 278-282. Gillott, J. E., Wang, H., July 1993, “Improved Control of Alkali-Silica Reaction by Combined Use of Admixtures,” Cement and Concrete Research, Vol. 23, No. 4, pp. 973-980. Goltermann, P., 1995, “Mechanical Predictions of Concrete Deterioration Part 2: Classification of Crack Patterns,” ACI Materials Journal, Vol. 92, No. 1, pp. 58-63. Grattan-Bellew, P.E., 1983, “Evaluation of Test Methods for Alkali-Aggregate Reactivity, “Proceedings of the 6th International Conference on Alkalis in Concrete, Copenhagen, Denmark, pp. 303-314. Grattan-Bellew, P.E., 1992, “Microcrystalline Quartz Undulatory Extinction and the Alkali-Silica Reaction,” Proceedings of the 9th International Conference on AAR in Concrete, London, pp. 383-394. Gratton-Bellew, P., 1978, Proceedings of the 4th International Conference on the Effects of Alkalies in Cement and Concrete, Padu, USA, pp. 113-140. Guthrie Jr., G.D., Carey, J.W., 1997, “A Simple Environmentally Friendly, and Chemically Specific Method For the Identification and Evaluation of the Alkali-Silica Reaction,” Cement and concrete Research, Vol. 27, No. 9, pp. 1407-1417. Haavik, D.J., Mielenz, Richard C., 1991, “Alkali-Silica Reaction Causes Concrete Pipe to Collapse,” Concrete International, Vol. 13, No. 5, pp. 54-57.
515
Hanks, D.L., Young, D.T., 1997, “Accelerated Testing and Mitigation of the Alkali-Silica Reaction Using Low-Calcium Fly Ash,” 4th CANMET/ACI International Conference on Durability of Concrete, Supplementary Papers, Sydney, Australia, pp.205-220. Hobbs, D.W., 1982, “Influence of Pulverised-Fuel Ash and granulated Blastfurnace Slag upon Expansion Caused by the Alkali Silica Reaction,” Magazine of Concrete Research, Vol. 34, No. 119, pp. 83-94. Hobbs, D.W., 1989, “Effect of Mineral and Chemical Admixtures on Alkali-Aggregate Reaction,” Proceedings, 8th International Conference on Alkali-Aggregate Reaction (Eds. K. Okada, S. Nishibayashi and M. Kawamura), Kyoto, pp. 173-186. Hobbs, D.W., 1990, “Cracking and Expansion due to the Alkali-Silica Reaction: Its Effect on Concrete,” Structural Engineering Review, Vol. 2, No. 2. Hooton, R.D., Rogers, C.A., 1992, “Development of the NBRI Rapid Mortar Test Leading to its Use in North America,” The 9th International Conference on Alkali-Aggregate Reaction in Concrete, Vol. I, Westminster, London. Iler, R.K., 1979, The Chemistry of Silica, John Wiley & Sons, New York. Imai, H., Ishioaka, Y., 1992, “Aggregate Inspection,” The 9th International Conference on Alkali-Aggregate Reaction in Concrete, Vol. I, Westminster, London. Ineson, P.R., 1990, “Siliceous Components in Aggregates,” Cement and Concrete Composites, Vol. 12, No. 3, pp. 185-190. Jensen, A.D., Chatterji, S., Christensen, P., Thaulow, N. and Gudmundsson, H., 1982, “Studies of Alkali-Silica Reaction-Part I, A Comparison of Two Accelerated Test Methods,” Cement and Concrete Research, Vol. 12, pp. 641-647. Jones, T.R., Walters, G.V. and Kostuch, J.A., 1992, “Role of Metakaolin in Suppressin ASR in Concrete Containing Reactive Aggregate and Exposed to Saturated NaCl Solution,” Proceedings of the 9th International Conference on Alkali-Aggregate Reaction in Concrete, London, Vol. 1, pp. 485-496. Keck, R.H., Riggs, Eugene H., 1997, “Specifying Fly Ash for Durable Concrete,” Concrete International, Vol. 19, No. 4, pp. 35-38. Kerr, P. F., 1959, Optical Mineralogy, McGraw-Hill Books, New York, NY, p. 442 Knudsen, T., 1992, “The Chemical Shrinkage Test; Some Corollaries,” The 9th International Conference on Alkali-Aggregate Reaction in Concrete, Vol. II, Westminster, London. Knudsen, T., Thaulow, N., 1975, “Quantitative Microanalyses of Alkali-Silica Gel in Concrete,” Cement and Concrete Research, Vol. 5, No. 5, pp. 443-454.
516
Koboyashi, K., Shiraki, R. and Kawai, K., 1989, “Influence of Alkali Concentration Distribution Occurring in Concrete Members on Expansion and Cracking Due to Alkali-Silica Reaction,” Proceedings, 8th International Conference on Alkali-Aggregate Reaction, Kyoto, pp. 641-646. Larbi, J.A., Hudec, P.P., 1989, “A Study of Alkali-Aggregate Reaction in Concrete: Measurements and Prevention (Part I),” Cement and Concrete Research, Vol. 19, No. 6, pp. 905-912. Larbi, J.A., Hudec, P.P., 1990, “A Study of Alkali-Aggregate Reaction in Concrete: Measurements and Prevention (Part II),” Cement and Concrete Research, Vol. 20, No. 1, pp. 73-78. Leger, P., Tinawi, R., 1995, “Numerical Simulation of Concrete Expansion in Concrete Dams Affected by Alkali-Aggregate Reaction: State of the Art,” Canadian Journal of Civil Engineering, Vol. 22, No. 4, pp. 692-713. Leming, M. L., 1996, “Alkali-Silica Reactivity: Mechanisms and Management,” Mining Engineering, Vol. 48, No. 12, pp. 61-64. Livessey, P., 1992, “Alkali Susceptibility of UK Aggregates,” The 9th International Conference on Alkali-Aggregate Reaction in Concrete, Vol. II, Westminster, London. Lobo, C., 1998, “Challenging ASR Predictive Testing,” Concrete Producer Magazine, March. Long, L.E., Sill, W.D. and O’Dunn, S., 1997, Exploring Geology: Introductory Laboratory Activities, Third Edition, Needham Heights, MA. Mather, B., 1948, “Petrographic Identification of Reactive Constituents in Concrete Aggregates,” Proceedings, ASTM, Vol. 48, pp. 1120-1127. Mather, B., 1993, “Use of Admixtures to Prevent Excessive Expansion of Concrete Due to Alkali-Silica Reaction,” U.S. Army Engineer Waterways Experiment Station, During the 72nd Annual Meeting of the Transportation Research Board, Washington, D.C. Mid Atlantic Regional Technical Committee, 1993, “Guide Specifications for Concrete Subject to Alkali-Silica Reactions,” Mid Atlantic Regional Technical Committee, Silver Springs. Mielenz, R.C., 1994, “Petrographic Evaluation of Concrete Aggregates, Significance of Tests and Properties of Concrete and Concrete Making Materials,” American Society of Testing Materials, STP 169C, Chapter 32, Philadelphia, PA.
517
Milanesi, C.A., Batic, O.R., 1997, “Comparative Study of Accelerated Test Methods for Evaluating Alkali-Aggregate Reactivity,” 4th CANMET/ACI International Conference on Durability of Concrete, Supplementary Papers, Sydney, Australia. Mindess, S., Young, J.F., 1981, Concrete, Prentice-Hall, Inc., Englewood Cliffs, NJ. Natesaiyer, K., Hover, K.C., 1988, “In-situ Identification of ASR Products in Concrete,” Cement and Concrete Research, Vol. 18, No. 3, pp. 455-463. Natesaiyer, K.C., Hover, K.C., 1989, “Further Study of an In-Situ Identification Method for Alkali-Silica Reaction Products in Concrete,” Cement and Concrete Research, Vol. 19, pp. 770-778. Nielsen, A., 1994, “Development of Alkali Silica Reactions in Concrete Structures with Time,” Cement and Concrete Research, Vol. 24, pp. 83-85. Nielsen, A., Gottfredsen, F. and Thogersen, F., 1993, “Development of Stresses in Concrete Structures with Alkali-Silica Reactions,” Materials and Structures, Vol. 26, No. 157, pp. 152-158. Nixon, P.J., Sims, I., 1992, “RILEM TC106 Alkali Aggregate Reaction: Accelerated Tests Interim Report and Summary of Survey of National Specifications,” The 9th International Conference on Alkali-Aggregate Reaction in Concrete, Vol. II, Westminster, London. Nunna, P., Ramakrishnan, V. and Johnston, D., 1993, “Effect of Natural Pozzolan Addition on the Expansions Due to Alkali-Silica Reaction, Presented at the Session No. 68, "Use of Admixtures to Inhibit Alkali-Silica Reactivity,"” During the 72nd Annual Meeting of the Transportation Research Board, Washington, D.C. Oberholster, R.E., Davies, G., 1986, “An Accelerated Method for Testing the Potential Alkali Reactivity of Siliceous Aggregates,” Cement and Concrete Research, Vol. 16, No. 2, pp. 181-189. Ono, K., 1990, “Strength and Stiffness of Alkali Silica Reaction Concrete and Concrete Members,” Structural Engineering Review, Vol. 2, No. 2, pp. 121-125. Pool, A.B., 1976, “Effect of Alkalies on Props. of Concr.,” Proc. Symp. London, Cement and Concr. Assoc., pp. 163. Powers, T.C., Steinour, H.H., 1955, “An Interpretation of Some Published Researches on the Alkali-Aggregate Reaction Part1 – The Chemical Reactions and Mechanism of Expansion,” Journal of the American Concrete Institute, Vol. 26, pp. 497-516. Powers, T.C., Steinour, H.H., 1955, “ An Interpretation of Some Published Researches on the Alkali-Aggregate Reaction Part2 – A Hypothesis Concerning Safe and Unsafe Reactions
518
with Reactive Silica in Concrete,” Journal of the American Concrete Institute, Vol. 26, pp. 785-812. Prezzi, M., Monteiro, Paulo J. M. and Sposito, Garrison, 1997, “The Alkali-Silica Reaction, Part I: Use of the Double-Layer Theory to Explain the Behavior of Reaction-Product Gels,” ACI Materials Journal, Vol. 94, No. 1, pp. 10-17. Prince, W., Perami, R., 1992, “A New Method for Quick Detection of Reactive Aggregate in Mortar and Concrete,” The 9th International Conference on Alkali-Aggregate Reaction in Concrete, Vol. II, Westminster, London. Qinghan, B., Nishibayashi, S., Wu, X., Yoshino, A., Zhu, H., Wang, T. And Tang, M., December 1995, “A Preliminary Study of Effect of LiNO2 on Expansion of Mortars Subjected to Alkali-Silica Reaction,” Cement and Concrete Research, Vol. 25, no. 8, pp. 1647-1654. Ramakrishnan, V., Johnston, D. and Nunna, P., 1994, “Effect of Natural Pozzolan Addition on Expansions Caused by Alkali-Silica Reaction,” Transportation Research Record 1458, No. 1458, pp. 118-128. Ranc, R., Isabell, Henri, Clement, J. Y., and Sorrentino, Daniel, 1994, “Limits of Application of the ASTM C 227 Mortar Bar Test: Comparison with Two Other Standards on Alkali-Aggregate Reactivity,” Cement, Concrete, and Aggregates, Vol. 16, No. 1, pp.63-72. Rasheeduzzafar, , Hussain, S.E., 1991, “Effect of Microsilica and Blast Furnace Slag on Pore Solution Composition and Alkali-Silica Reaction,” Cement and Concrete Composites, Vol. 13, No. 3, pp. 219-225. Rigden, S.R., Majlesi, Y. and Burley, E., 1995, “Investigation of Factors Influencing the Expansive Behaviour, Compressive Strength and Modulus of Rupture of Alkali-Silica Reactive Concrete Using Laboratory Concrete Mixes,” Magazine of Concrete Research, Vol. 47, No. 170, pp.11-21. Rogers, C. A., Hooton, R.D., 1991, “Reduction in Mortar and Concrete Expansion with Reactive Aggregates Due to Alkali Leaching,” Cement, Concrete, and Aggregates, Vol. 13, No. 1, pp. 42-49. Salomon, M., Gallias, J.L., 1992, “Rapid Test Method for Evaluating Potential Alkali Reactivity of Aggregates by Autoclaving Treatment,” The 9th International Conference on Alkali-Aggregate Reaction in Concrete, Vol. II, Westminster, London. Shayan, A., 1992, “Prediction of Alkali Reactivity Potential of Some Australian Aggregates and Correlation with Service Performance,” ACI Materials Journal, Vol. 89, No. 1, pp. 13-23.
519
Shayan, A., Ivanusec, I., and Diggins, R., 1992, “Comparison Between Two Accelerated Methods for Determining Alkali Reactivity Potential of Aggregates,” The 9th International Conference on Alkali-Aggregate Reaction in Concrete, Vol. II, Westminster, London. Shayan, A., Landon-Jones, I. And Nelson, P., 1997, “Case Study of Fly Ash Concrete in Tallowa Dam Containing Alkali-Reactive Aggregate,” 4th CANMET/ACI International Conference on durability of Concrete, Supplementary Papers, Sydney, Australia, pp. 281-293. Slater, R.E., 1992, Highway Statistics 1992, FHWA, Washington, DC. Spencer, T.E., Blaylock, Albert J., 1997, “Alkali-Silica Reaction in Marine Piles,” Concrete International, Vol. 19, No. 1, pp. 59-62. Stanton, T.E., 1942, “California Experience with the Expansion of Concrete Through Reaction Between Cement and Aggregate,” Journal of the American Concrete Institute, Vol. 38, pp. 209-236. Stark, D., 1991, Handbook For the Identification of Alkali-Silica Reactivity in Highway Structures, SHRP-C/FR-91-101, Strategic Highway Research Program, National Research Council, Washington, D.C. Stark, D., 1994, “Alkali-Silica Reactions in Concrete,” Significance of Tests and Properties of Concrete and Concrete Making Materials, American Society of Testing Materials, STP 169C, Chapter 32, Philadelphia, PA. Swamy, R.N., Al-Asali, M.M., 1986, “Influence of Alkali-Silica Reaction on the Engineering Properties of Concrete, Alkalis in Concrete (ed. V.H. Dodson),” STP 930, American Society for Testing and Materials, Philadelphia, PA, pp. 69-86. Tang, M., Han, S. and Zhen, S., 1983, “A Rapid Method For Identification of Alkali Reactivity of Aggregate,” Cement and Concrete Research, Vol. 13, No. 3, pp. 417-422. Tobin, R. E., 1995, “Reactive Aggregates and Popouts: Causes and Prevention,” Concrete International, Vol. 17, No. 1, pp. 52-54. U.S. Army Corps of Engineers, 1994, “Alkali-Silica Aggregate Reactions, Standard Practice for Concrete for Civil Works,” EM 1110-2-2000, Appendix D, U.S. Army Corps of Engineers Headquarters, Washington D.C. Wang, H., Gillott, J.E., 1991, “Mechanism of Alkali-Silica Reaction and the Significance of Calcium Hydroxide,” Cement and Concrete Research, Vol. 21, No. 4, pp.647-654. Wang, H., Gillott, J.E., 1993, “Effect of Three Zeolite-Containing Natural Pozzolanic Materials on Alkali-Silica Reaction,” Cement, Concrete, and Aggregates, Vol. 15, No. 1, pp. 24-30.
520
Williams, H., Turner, F.J. and Gilbert, C.M., 1954, Petrography: An Introduction to the Study of Rocks in Thin Sections, W.H. Freeman and Company, San Francisco, CA, pp. 406. Xu, G., Watt, Daniel F. and Hudec, Peter P., 1995, “Effectiveness of Mineral Admixtures in Reducing ASR Expansion,” Cement and Concrete Research, Vol. 25, No. 6, pp. 1225-1236.