Clemson UniversityTigerPrints
All Theses Theses
8-2010
Alkali Silica reaction under the influence of chloridebased deicersPurvi DesaiClemson University, [email protected]
Follow this and additional works at: https://tigerprints.clemson.edu/all_theses
Part of the Civil Engineering Commons
This Thesis is brought to you for free and open access by the Theses at TigerPrints. It has been accepted for inclusion in All Theses by an authorizedadministrator of TigerPrints. For more information, please contact [email protected].
Recommended CitationDesai, Purvi, "Alkali Silica reaction under the influence of chloride based deicers" (2010). All Theses. 944.https://tigerprints.clemson.edu/all_theses/944
ALKALI SILICA REACTION UNDER THE INFLUENCE OF CHLORIDE BASED DEICERS
A Thesis Presented to
the Graduate School of Clemson University
In Partial Fulfillment of the Requirements for the Degree
Master of Science Civil Engineering
by Purvi Desai August 2010
Accepted by: Dr. Prasad Rangaraju, Committee Chair
Dr. Brad Putman Dr. Leidy Klotz
i
ABSTRACT
Highways form the backbone of transportation in United States. As a result, issues
related to distress in pavements and use of chemicals on pavement forms one of the major
focus areas of highway agencies. One of the forms of distress in concrete pavements is
Alkali silica reaction (ASR). The principal objective of this research study is to
understand the role of chloride-based deicing chemical in causing or accelerating ASR
distress. Sodium chloride or rock salt is one of the oldest forms of deicers. Several
research studies have been done on ASR under the influence of sodium chloride and
calcium chloride. However, limited information is available on effects of potassium
chloride and magnesium chloride deicers. This research study is based on laboratory
evaluation to assess effects of chloride deicers on alkali silica reactivity. Variations in
exposure conditions, cement and aggregate are introduced to understand the effects of
deicer solutions on a wider spectrum. Mortar bar tests based on ASTM C 1260 tests were
conducted, in which reactive fused silica and non-reactive natural sand were used as
aggregates and two Type I cement with different alkali contents (low and high) were
used. Tests were carried out at two different storage temperatures, 38°C and 80°C.
Findings from these tests show that 3% wt. solutions of sodium chloride and
potassium chloride deicers can cause more expansion in mortar specimens containing
fused silica, than even the standard 1 normal sodium hydroxide solution. Calcium
chloride and magnesium chloride solutions have shown no effect on initiating or
accelerating ASR in the same test specimens. Higher temperature accelerated the ASR
distress, regardless of the source of alkali. The alkali content of cement itself did not have
ii
a major influence on mortar bar expansion, particularly in the presence of deicing
solutions. However, this is due to the ample supply of alkalis from the deicer soak
solution in the test method. Formation of chloroaluminates or Friedel’s salt has been
observed and is believed to be the principal mechanism through which the chlorides in
the deicer solutions are chemically bound. With removal of chlorides from the solution,
alkali hydroxides are formed, thus inducing the ASR distress and the accompanied
expansions in the test specimens. Even though such chloroaluminates were observed in
mortar specimens exposed to calcium and magnesium chloride solutions, no
accompanying expansion was observed in those test specimens.
iii
DEDICATION
This thesis is dedicated to my mother- Rekha Desai, my father- Rashes Desai, my
Late Mother-in-law- Vandana Rajani, my Father-in-law- Jairamdas Rajani and my
husband- Umesh Rajani. Their blessings and good wishes have always motivated me
through my research tenure.
iv
ACKNOWLEDGMENTS
I would like to thank my husband- Umesh Rajani for his constant support and
motivation. I would also like to thank my brother-in-law- Dr. Jigar Desai, a former
Clemson student, for motivating me to pursue Masters Program at Clemson University. I
appreciate their guidance for my Masters Program.
I would sincerely like to thank my advisor- Dr. Prasad Rao Rangaraju for
providing me valuable guidance in research. I admire his teaching which has helped
develop my interest in concrete. I would also like to thank Dr. Leidy Klotz and Dr. Brad
Putman for being on my research committee.
Also, I appreciate the help given by current PhD students - Sujay Math, Harish
Kizhakkumodom and David Wingard in getting conversant with the lab procedures and
equipment use. They were kind enough to lend me a helping hand in some of my research
work.
I also appreciate guidance provided by Ms. Monica Hughes and Ms. Karen
Lanning that made the work process easier.
Last but not the least, I would like to thank my former immediate supervisor,
Mr. R.Venkatraman, Head of Civil engineering department at L&T-Chiyoda Ltd., Baroda
for strengthening my roots in civil engineering both on the technical and practical front.
v
TABLE OF CONTENTS
Page
TITLE PAGE..................................................................................................................... ABSTRACT......................................................................................................................i DEDICATION................................................................................................................iii ACKNOWLEDGMENTS ..............................................................................................iv LIST OF TABLES........................................................................................................viii LIST OF FIGURES ........................................................................................................xi CHAPTER I. CHAPTER INTRODUCTION ......................................................................1 1.1 Need for Research..............................................................................1 1.2 Research objectives............................................................................2 1.3 Scope of the Research........................................................................2 1.4 Research approach .............................................................................4 II. CHAPTER LITERATURE REVIEW ...........................................................5 2.1 General...............................................................................................5 2.2 Alkali silica reaction ..........................................................................5 2.2.1 Environment causing alkali silica reaction 2.2.2 Understanding of Alkali silica reaction at a micro-level 2.3 Deicers ............................................................................................12 2.3.1 Introduction 2.3.2 Action of deicers 2.4 Commonly used deicers for highways.............................................13 2.4.1 Chloride based deicers 2.4.2 Acetate based deicers 2.4.3 Glycol based deicers 2.4.4 Urea 2.5 Effect of Chloride based deicers on Alkali silica reaction in concrete...............................................................14
vi
Table of Contents (Continued)
Page
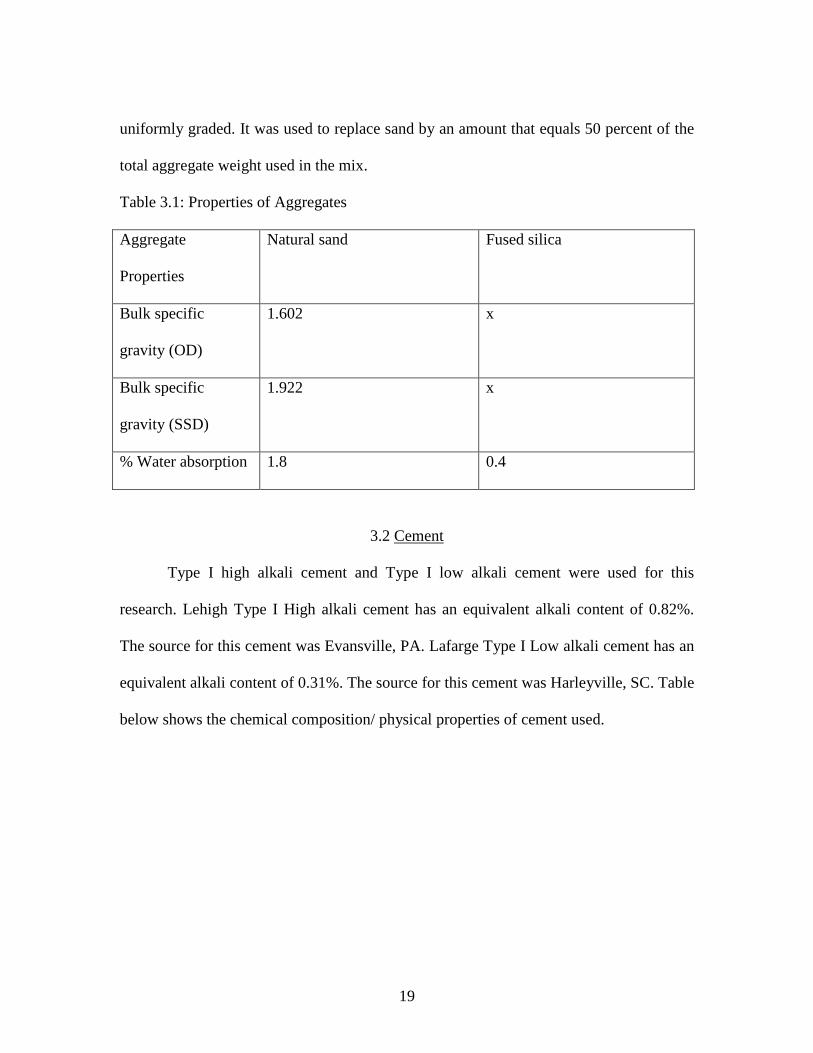
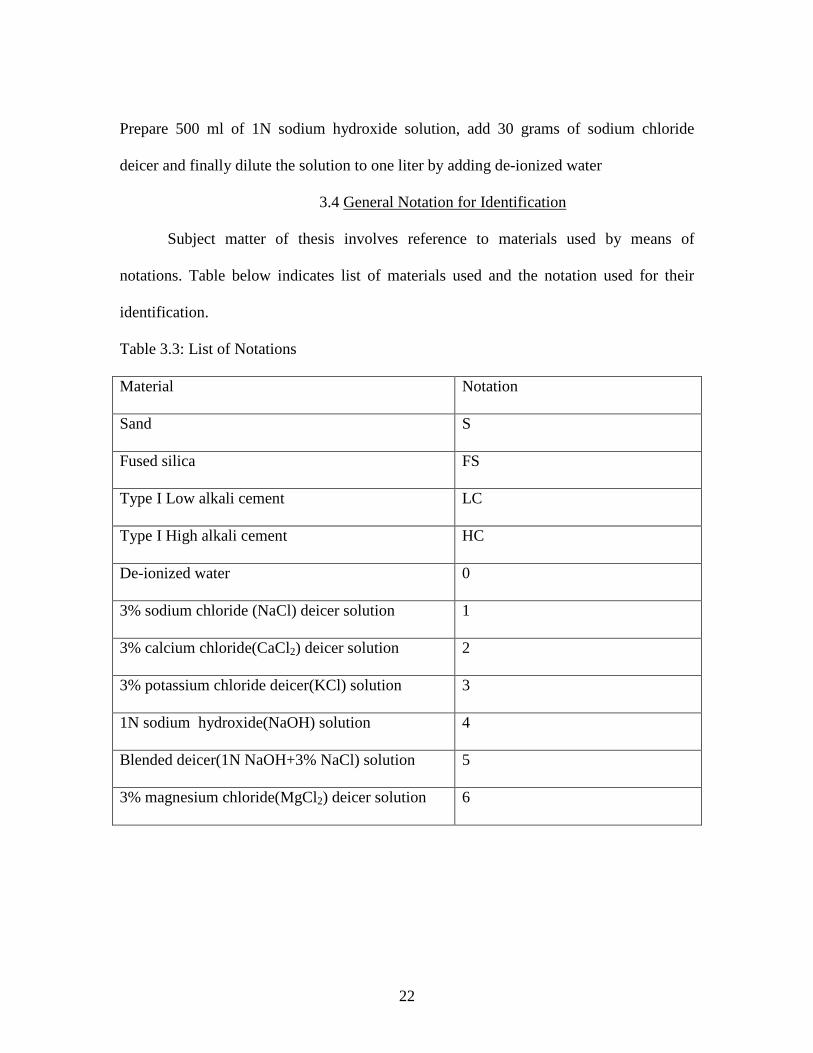
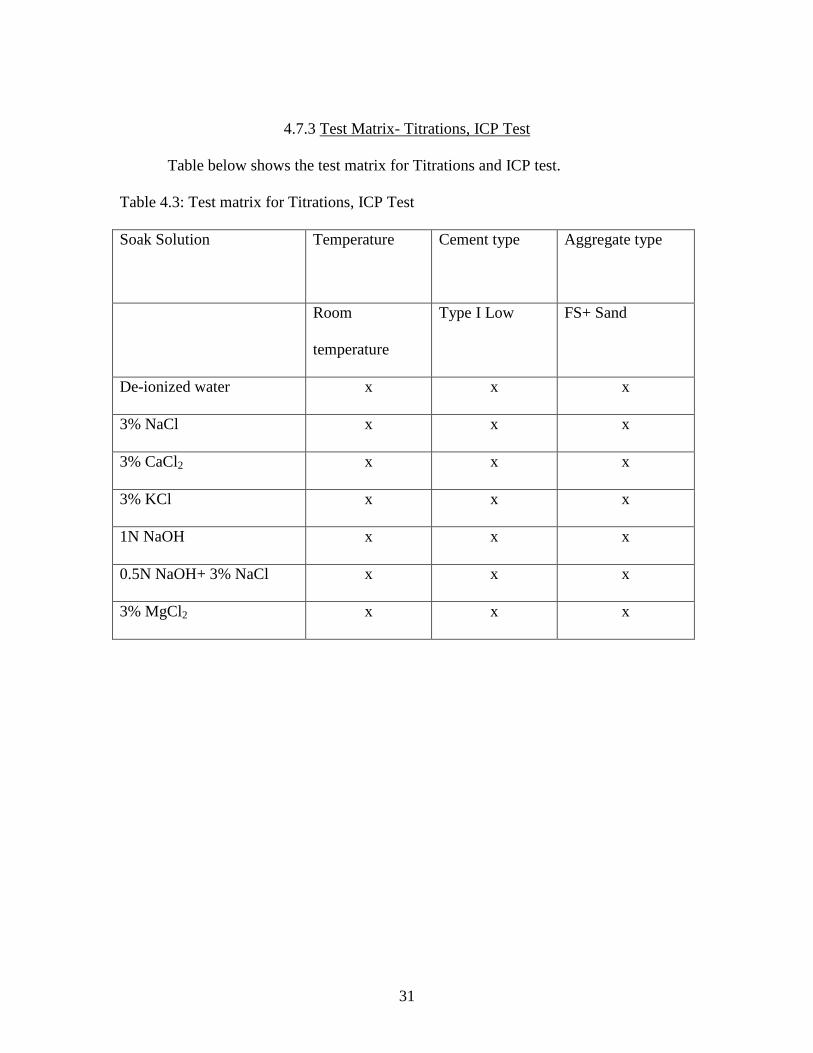
III. CHAPTER MATERIALS ..........................................................................18 3.1 Aggregates .......................................................................................18 3.2 Cement .............................................................................................19 3.3 Deicing/Reagent grade chemicals....................................................20 3.4 General notation for identification...................................................22 IV. CHAPTER TEST PROCEDURES..............................................................23 4.1 Standard ASTM C 1260 test ............................................................23 4.2 Mortar Bar test .................................................................................24 4.3 Titrations..........................................................................................25 4.4 Inductively Coupled Plasma (ICP) test............................................26 4.5 Scanning Electron Microscopy (SEM) and Energy Dispersive X-ray (EDX) analysis........................................26 . 4.6 X-ray diffraction (XRD) ..................................................................28 4.7 Experimental program ....................................................................29 4.7.1 Test matrix for Standard ASTM C 1260, Mortar Bar test 4.7.2 Test matrix for Titrations and ICP test 4.7.3 Test matrix for SEM/EDX analysis 4.7.4 Test matrix for X ray diffraction V. CHAPTER RESULTS AND DISCUSSION...............................................32 5.1 General.............................................................................................32 5.2 Preliminary investigation of Alkali silica reaction ..........................32 5.3 Results from Standard ASTM C 1260 test ......................................32 5.4 Results from Mortar Bar test............................................................33 5.4.1 De-ionized water as soak solution 5.4.2 3% Sodium Chloride as soak solution 5.4.3 3% Calcium Chloride as soak solution 5.4.4 3% Potassium chloride as soak solution 5.4.5 0.5N Sodium hydroxide and 3% Sodium chloride blended soak solution 5.4.6 3% Magnesium Chloride as soak solution 5.5 Results from Titrations ....................................................................42 5.6 Results from X-ray diffraction.........................................................43
vii
Table of Contents (Continued)
Page
5.7 Results from Visual, SEM/ EDX analysis .......................................46 5.8 Results from ICP Test......................................................................50 VI. CHAPTER SUMMARY AND CONCLUSIONS.......................................70 6.1 Summary..........................................................................................70 6.2 Standard ASTM C 1260, Mortar Bar test ........................................70 6.3 X-ray Diffraction .............................................................................71 6.4 Titrations..........................................................................................72 6.5 SEM-EDX analysis..........................................................................72 6.6 Influence of selected factors ............................................................73 6.7 Conclusion .......................................................................................73 6.8 Recommendations for Future work .................................................75 APPENDICES .................................................................................................................1 REFERENCES ................................................................................................................1
viii
LIST OF TABLES
Table Page
2.1 Potentially alkali-silica reactive mineral phases and rocks (from CSA 1994a)..........................................................................................8
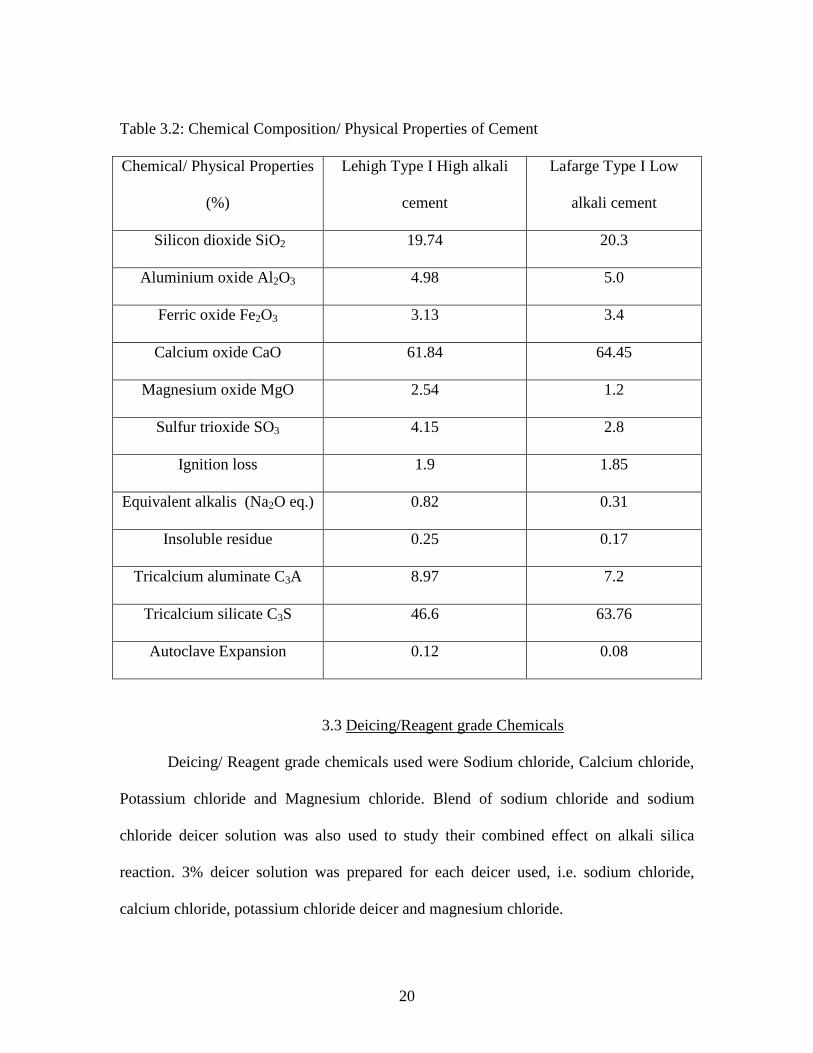
3.1 Properties of Aggregates..............................................................................19 3.2 Chemical composition/Physical properties of cement.................................20 3.3 List of Notations .........................................................................................22 4.1 Test matrix for Standard ASTM C 1260, Mortar Bar test ...............................................................................................................29 4.2 Test matrix for SEM/EDX analysis .............................................................30 4.3 Test matrix for Titrations, ICP test ..............................................................31 5.1 Details of X-ray Diffraction peaks...............................................................46 A.1 Expansion results of mortar bars using natural sand/ (50% fused silica+ 50% natural sand), Type I Low/ High alkali cement subjected to de-ionized water at 38°C .........................................................................2 A.2 Expansion results of mortar bars using natural sand/ (50% fused silica+ 50% natural sand), Type I Low/ High alkali cement subjected to 3% Sodium chloride solution at 38°C......................................................3 A.3 Expansion results of mortar bars using natural sand/ (50% fused silica+ 50% natural sand), Type I Low/ High alkali cement subjected to 3% Calcium chloride solution at 38°C ....................................................4 A.4 Expansion results of mortar bars using natural sand/ (50% fused silica+ 50% natural sand), Type I Low/ High alkali cement subjected to 3% Potassium chloride solution at 38°C .................................................5
ix
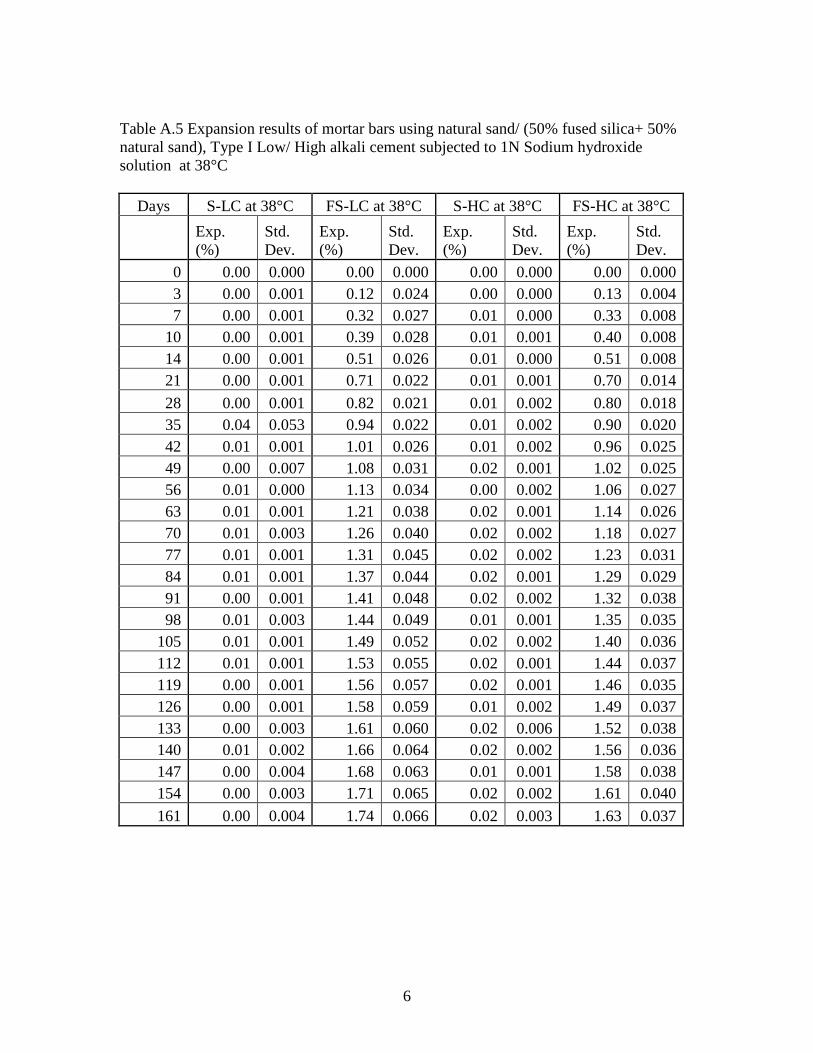
List of Tables (Continued) Table Page A.5 Expansion results of mortar bars using natural sand/ (50% fused silica+ 50% natural sand), Type I Low/ High alkali cement subjected to 1N Sodium hydroxide solution at 38°C ..................................................6 A.6 Expansion results of mortar bars using natural sand/ (50% fused silica+ 50% natural sand), Type I Low/ High alkali cement subjected to (1N Sodium hydroxide+3% Sodium chloride) solution at 38°C .....................................................................................7 A.7 Expansion results of mortar bars using natural sand/ (50% fused silica+ 50% natural sand), Type I Low/ High alkali cement subjected to 3% Magnesium chloride solution at 38°C ..............................................8 A.8 Expansion results of mortar bars using natural sand/ (50% fused silica+ 50% natural sand), Type I Low/ High alkali cement subjected to de-ionized water at 80°C .........................................................................9 A.9 Expansion results of mortar bars using natural sand/ (50% fused silica+ 50% natural sand), Type I Low/ High alkali cement subjected to 3% Sodium chloride solution at 80°C .....................................................9 A.10 Expansion results of mortar bars using natural sand/ (50% fused silica+ 50% natural sand), Type I Low/ High alkali cement subjected to 3% Calcium chloride solution at 80°C .................................................10 A.11 Expansion results of mortar bars using natural sand/ (50% fused silica+ 50% natural sand), Type I Low/ High alkali cement subjected to 3% Potassium chloride solution at 80°C ...............................................10
x
List of Tables (Continued) Table Page A.12 Expansion results of mortar bars using natural sand/ (50% fused silica+ 50% natural sand), Type I Low/ High alkali cement subjected to 1N Sodium hydroxide solution at 80°C ................................................11 A.13 Expansion results of mortar bars using natural sand/ (50% fused silica+ 50% natural sand), Type I Low/ High alkali cement subjected to 0.5N Sodium hydroxide and 3% Sodium chloride Blended solution at 80°C .....................................................................11 A.14 Expansion results of mortar bars using natural sand/ (50% fused silica+ 50% natural sand), Type I Low/ High alkali cement subjected to 3% Magnesium chloride solution at 38°C ............................................12 A.15 ICP Test Results ..........................................................................................13
xi
LIST OF FIGURES
Figure Page 2.1 Crystal structure of Quartz (left) and Opal(right) ........................................6 4.1 X ray Diffraction Patterns for Compounds of Interest ................................28 5.1 Expansion results of Mortar bars in Standard ASTM C 1260 subjected to different temperature, cement and aggregate as per test matrix ....................................................................................37 5.2 Expansion results of Mortar bars in water subjected to different temperature, cement and aggregate as per test matrix...............................................................................................37 5.3 Expansion results of Mortar bars in 3% sodium chloride Deicer solution subjected to different temperature, cement and aggregate as per test matrix ................................................38 5.4 Expansion results of Mortar bars in 3% calcium chloride Deicer solution subjected to different temperature, cement and aggregate as per test matrix ................................................38 5.5 Expansion results of Mortar bars in 3% potassium chloride Deicer solution subjected to different temperature, cement and aggregate as per test matrix ................................................39 5.6 Expansion results of Mortar bars in (sodium hydroxide+ Sodium chloride) deicer solution subjected to different temperature, cement and aggregate as per test matrix ...........................39 5.7 Expansion results of Mortar bars in 3% magnesium chloride Deicer solution subjected to different temperature, cement and aggregate as per test matrix ................................................40 5.8 Influence of alkali content of cement, alkali type on Expansion of (Fused silica+ Sand) mortar bars .....................................41 5.9 Influence of Storage temperature on expansion of (Fused silica+ Sand) mortar bars ...........................................................41
xii
List of Figures (Continued) Figure Page 5.10 OH- ion concentration in water soluble hydroxides of Mortar specimens using Type I Low alkali cement and (Fused silica+ sand) as aggregate subjected to different deicing solutions at 38°C temperature ..................................................43
5.11 X ray diffraction results for Mortar specimens using (Fused silica+sand) as aggregate, Type I Low alkali
Cement subjected to 38°C and De-ionized water ..................................44
5.12 X ray diffraction results for Mortar specimens using (Fused silica+sand) as aggregate, Type I Low alkali Cement subjected to 38°C and 3% Sodium chloride Deicer solution ......................................................................................44 5.13 X ray diffraction results for Mortar specimens using (Fused silica+sand) as aggregate, Type I Low alkali Cement subjected to 38°C and 3% Calcium chloride
Deicer solution ......................................................................................45
5.14 X ray diffraction results for Mortar specimens using (Fused silica+sand) as aggregate, Type I Low alkali Cement subjected to 38°C and 3% Potassium chloride
Deicer solution ......................................................................................45
5.15 SEM-EDX analysis results Mortar specimens subjected to De-ionized water..................................51 5.16 SEM-EDX analysis results Mortar specimens subjected to 3% Sodium chloride solution...................................................................................................52 5.17 SEM-EDX analysis results Mortar specimens subjected to 3% Calcium chloride solution...................................................................................................56 5.18 SEM-EDX analysis results Mortar specimens subjected to 3% Potassium chloride solution...................................................................................................57
xiii
List of Figures (Continued) Figure Page
5.19 SEM-EDX analysis results Mortar specimens subjected to 1N Sodium hydroxide solution...................................................................................................61 5.20 SEM-EDX analysis results Mortar specimens subjected to 0.5N Sodium hydroxide and 3% Sodium chloride blended solution ............................................65 5.21 SEM-EDX analysis results Mortar specimens subjected to 3% Magnesium chloride solution...................................................................................................69
1
CHAPTER ONE
INTRODUCTION
1.1 Need for the Research
Distress in concrete due to alkali silica reaction (ASR) is a well known problem in
more than 50 countries across the world [1]. It is commonly visible as map-cracking on
concrete surfaces. Cracks in concrete lead to loss of serviceability of the structure.
Fundamentally, the source of this problem is the dissolution of amorphous, poorly
crystalline silica in high pH solution.
A common environment formed by reactive aggregate, adequate alkalis and
sufficient moisture can trigger alkali silica reaction in concrete. Deicers are a potential
source of alkalis. There are several published research literature and case studies of alkali
silica distress in concrete due to deicing salts. These deicers can be chloride based or
acetate based.
One of the oldest and widely accepted deicer – Rock salt is a chloride based
deicer. Several researchers have studied the potential of sodium chloride (commonly
known as Rock salt) and calcium chloride to cause alkali silica reaction in concrete.
Limited research has been done on ASR in presence of potassium chloride and
magnesium chloride. Very few researchers have studied this effect in totality, i.e.
considering the influence of parameters like temperature, aggregate and alkalis (from
internal and external sources).
This research focuses on identifying the potential of chloride deicers to trigger
ASR in concrete. It is supported by the study of underlying reaction mechanism through
2
which these deicers cause ASR in concrete. Research matrix is further expanded to
understand the influence of temperature, type of cement (internal source of alkalis) and
aggregate on alkali silica reaction in the presence of chloride deicers (external source of
alkalis). The knowledge acquired by this research can help establish better and effective
conditions to form a more reliable and accelerated alternate test method.
1.2 Research Objectives
The key objectives focused in this research are:
1. To compare the effect of various commercially available chloride based deicers on
alkali silica reaction(ASR) in concrete
2. To study the potential chemical reactions by which chloride deicers cause ASR in
concrete
3. To study the effect of variables like temperature, type of cement and aggregate on
alkali silica reaction in mortar specimens subjected to different chloride based deicers
1.3 Scope of Research
Scope of this research study was limited by using selected materials, standard and
modified test methods, wet chemistry and microscopy to accomplish the research
objectives. Materials were selected with a view to introduce variables like type of cement
and type of aggregate in the tests.
A potentially non-reactive aggregate and a potentially reactive aggregate were
used. Aggregates used were Natural sand (non-reactive aggregate) and Fused silica
(reactive aggregate). The reactivity of aggregates was predicted based on their established
history and performance in previous research. Standard ASTM C 1260 test was
3
performed to confirm the potential reactivity of aggregates. ASR is caused by reactive
aggregates only. Thus, performance of deicers in presence of non-reactive aggregate
would serve as base line for estimating their potential to cause ASR while using reactive
aggregates. Cement used was Lehigh Type I High alkali cement and Lafarge Type I Low
alkali cement.
Titrations were performed using phenolphthalein as an indicator to estimate
concentration of hydroxyl ions in deicer solution exposed to crushed mortar for a defined
period. Inductively Coupled Plasma (ICP) test was done to estimate concentration of
cations and anions in the same solution. X-ray diffraction technique was used to identify
compounds formed as a result of interaction of deicers with cement hydration products.
Scanning Electron microscopy (SEM) and Energy Dispersive X-ray (EDX) analysis
techniques were used to carry out microstructure level study of the mortar specimens.
Specimens for SEM analysis were prepared by manual hand polishing. The
microstructure level study was to be executed at Clemson Electron Microscope facility
using Hitachi S-3400 SEM.
Reagent grade and commercially used chloride salts will be referred to as ‘Deicer’
in this research. Four different commonly used chloride based deicer were used for this
study. Three out of four deicers were reagent grade chemicals available in amorphous
state. The fourth deicer used for the test was commercially available. Water was used as a
soak solution to predict contribution of reactive aggregate and cement to cause alkali
silica reaction. 1N sodium hydroxide soak solution results would serve as base line for
4
comparative performance of the deicers. Test matrix also involved use of sodium chloride
and sodium hydroxide deicer in blended form.
1.4 Research Approach
This research was executed using following approach:
1. Perform literature review on previous research done in the area of alkali silica
reaction and effect of chloride deicers on alkali silica reaction
2. Select aggregates based on their established history and performance in previous
research in terms of reactivity to alkali silica reaction
3. Select concentration of deicer solution based on published literature
4. Prepare test matrix taking into account all the variables involved like type of
aggregate, cement, deicer solution and temperature. Plan and schedule casting of
mortar specimens based on the test matrix
5. Review of Standard ASTM C 1260 test, SEM/EDX analysis, titrations, ICP test and
X-ray diffraction procedures
6. Prepare, monitor and study the mortar specimens in line with the research objectives
5
CHAPTER TWO
LITERATURE REVIEW
2.1 General
This chapter incorporates information from published literature on alkali silica
reaction and deicers. It introduces alkali silica reaction distress in concrete, environment
causing the distress, basic reaction mechanism and deicers. It further deals with how
chloride based deicers cause alkali silica reaction in concrete.
2.2 Alkali silica reaction
Distress in concrete structures due to alkali aggregate reactions (AAR) was first
observed in California, United States during the 1940s [1]. One of the more widespread
forms of alkali aggregate reaction is alkali silica reaction. An alkali-silica reactive
aggregate reacts with alkali hydroxides in the system to form alkali-silicate gel at the
paste-aggregate interface. In the presence of moisture, the alkali silicate gel expands.
Micro-cracks develop due to the restraint offered by concrete to the expanding gel. This
expansive reaction is known as alkali silica reaction (ASR).
It is visually identified in concrete structures as random or map-cracking,
patterned cracking oriented in the direction of least restraint, gel lining the cracks,
spalling of joint, pop-outs over the reactive aggregates [3]. ASR in concrete is caused by
inherent properties of the paste and thus the distress is not localized.
6
2.2.1 Environment causing alkali silica reaction
Environment formed by reactive silica, adequate concentration of alkali
hydroxides (Na+, K+ and OH-) in pore solution and sufficient moisture is an ideal
environment for occurrence of alkali silica reaction.
1. Reactive silica
Reactivity of silica depends on aggregate mineralogy, degree of crystallinity and its
solubility in pore solution. Contribution of a reactive aggregate towards ASR effect
depends on:
a) Crystal structure of aggregate
In case of well crystallized and dense silica (like quartz) the attack by alkali and
hydroxyl ions mainly takes place on the surface. If the crystal structure of silica is
disordered then the number of reaction sites for alkali and hydroxyl ions to react with
silica are increased. As a result, silica with a disordered/ unstable crystal structure (like
opal) and increased solubility in highly alkaline solutions is most susceptible to alkali
silica reaction. This is illustrated in Figure below. [4].
Figure 2.1: Crystal structure of Quartz (left) and Opal (right)
7
b) Proportion of reactive aggregate
As per recent research by Ichikawa [5], use of reactive aggregate beyond the
pessimum proportion can reduce the ASR effect. This can be attributed to the decrease in
calcium hydroxide and alkali hydroxide available per aggregate particle.
c) Particle size of reactive aggregate
Research by Ichikawa [5] concludes that for a fixed volume of reactive aggregate in a
mix, increase in particle size increases ASR expansion but reduces the rate of ASR. Also,
very fine reactive aggregate sizes tend to mitigate ASR by pozzolanic effect.
8
Table below shows a list of potential reactive minerals and rocks.
Table 2.1: Potentially alkali-silica reactive mineral phases and rocks (from CSA 1994a)
[1]
A-1. Alkali-reactive, poorly crystalline, or metastable silica minerals and volcanic or
artificial glasses (classical alkali–silica reaction)
Reactants Opal, tridymite, cristobalite Acidic, intermediate, and basic volcanic glass Artificial glass (e.g., common glass, steel slag, pyrex), beekite
Rocks Sedimentary rocks containing opal, such as shale, sandstone, silicified rock, some chert and flint, and diatomite Glassy to vitrophyric volcanic rocks: acidic, intermediate, and basic, such as rhyolite, dacite, latite, andesite and their tuff, perlite, obsidian, all varieties with a glassy groundmass, some basalt
A-2. Alkali-reactive quartz-bearing rocks
Reactants Chalcedony, cryptocrystalline, microcrystalline quartz Macrogranular quartz With deformed crystal lattice Rich in inclusions Intensively fractured or granulated With microcrystalline quartz at grain boundaries
Rocks Chert, flint, quartz vein, quartzite, quartzarenite, quartzitic sandstone, siliceous limestone Volcanic rocks such as in A1, but with devitrified, cryptocrystalline to microcrystalline groundmass Microgranular to macrogranular rocks of various origins: contain microcrystalline to cryptocrystalline quartz, or significant amounts of moderately to highly strained quartz: Igneous: granite, granodiorite, charnockite Sedimentary: sandstone, greywacke, siltstone, shale, siliceous limestone, arenite, arkose Metamorphic: gneiss, quartz-mica schist, quartzite, hornfel, phyllite argillite, slate
9
2. Alkalis in Cement and in Concrete pore solution
Alkalis refer to the elements listed in the first column of the periodic table. Two
of the alkalis that occur commonly in cement are sodium and potassium. Sources of alkali
in concrete pore solution are alkali sulfates in cement, mix water, supplementary
cementitious materials and deicing salts. It is predicted based on experiments that alkalis
in the form of sodium and potassium are adsorbed and do not chemically form the
structure of alkali silica gel.[8]
Total alkali content is expressed as Na2O equivalent rather than the individual
concentrations of alkali oxides [6]
Equivalent Alkalies, Na2O = Na2O + 0.658 x K2O
Alkali silica reaction is caused by action of hydroxyl ions, and not alkalis, on
reactive aggregate [6]. This paper also refers to past literature which state that ASR and
physical characteristics of ASR products are affected by concentration of alkalis in the
paste although they are not the cause of the reaction. Recent research study by Leeman
and Lothenbach [7] conclude that ASR expansion is influenced by K/Na ratio. Pore
solution results in this study indicated that the difference in expansion was attributed to
composition of alkali cations in solution and not hydroxyl ion concentration.
3. Hydroxyl ion concentration
Alkali cations in cement will produce an equivalent number of hydroxide ions
only after the formation of ettringite. In case of specimens subjected to alkali salt
solution, alkali hydroxides formed as a result represent the external source of hydroxyl
ions.
10
4. Sufficient Moisture
Research findings show that alkali silica reaction in concrete occurs when relative
humidity is greater than 80-85% [1]. Moisture in the system facilitates the migration of
alkali ions to reaction sites and thus accelerates the alkali silica reaction. Alkali silica gel
swells by absorbing moisture. This results in micro-cracking due to expansive stresses on
concrete.
2.2.1 Understanding of Alkali Silica reaction at a micro-level
Previous research studies on alkali silica reaction conclude that the process of
alkali silica reaction involves alkali cations, calcium ions, hydroxyl ions and reactive
silica phases in aggregate [8-13].
The alkali silica reaction can be well understood based on reaction mechanism
proposed by Ichikawa [5,13] and source of expansive pressure exerted by ASR gel.[14]
a) Alkalis and hydroxyl ions break the siloxane networks in aggregate particle to form
alkali silicate gel.
≡ Si-O-Si ≡ + R+ + OH- → ≡ Si-O-R + H-O-Si ≡
R+ + OH- + H-O-Si ≡ → ≡ Si-O-R + H2O
In presence of moisture this gel forms hydrated alkali silicate gel. As reaction
progresses towards the center of aggregate particle, a highly hydrated mature alkali
silicate gel overlies a less hydrated immature alkali silicate gel. Part of the mature alkali
silicate gel migrates into pore solution.
11
b) Dissolution of calcium ions and formation of calcium alkali silicate gel
Calcium hydroxide, a cement hydration product, forms the primary source of Ca+2
and OH- ions. As hydroxyl ions are used in the reaction, calcium ions dissolve in the pore
solution. Mature alkali silicate gel in the pore solution and around the aggregate reacts
with Ca+2 ions to form fragmental calcium alkali silicate gel (high Ca/Si ratio).
≡ Si-O-R + Ca+2 + R-O-Si ≡ → ≡ Si-O- Ca+2-O- Si ≡ + 2R+
The inner immature less hydrated alkali silicate gel react with the slowly diffusing
Ca+2 ions to form a hard rim of calcium alkali silicate (low Ca/Si ratio). Released alkalis
further propagate the reaction. The newly formed rim allows flow of alkalis and hydroxyl
ions. It confines the alkali silicate gel within its boundary which results in build up of
expansive pressures. This ultimately results in cracking of aggregate.
Several other researches in this field also propose a similar mechanism for alkali
silica reaction. [9,11]
Diffusion of calcium ions to the reaction site is slow in comparison to the alkalis.
As per H. Wang [11], this can be due to the increased solubility of alkali hydroxides in
comparison to the calcium hydroxide. This makes them readily available at the reaction
sites. Also, smaller hydraulic radius of Na+ and K+ ions in comparison to Ca+2 ions
increases their rate of diffusion. Research studies have shown that Ca+2 ions are vital for
alkali silica reaction to initiate and propagate in concrete [8,10-12]. As per hypothesis by
Powers [9], calcium alkali silicate gel which has more Ca+2 ions adsorbed on reactive
silica compared to alkalis is non-expansive in nature.
12
c) Expansive pressure resulting exerted by ASR gel
As per research work done by Prezzi [14], expansion of alkali silica gel can be
well explained by the double layer theory. Double layer is composed of Na+, K+ and
Ca+2 ions. It balances the negative charge on silica grain. Reactions involved in the
formation of double layer are,
≡ Si-O-Si ≡ + R+ + OH- → ≡ Si-O-R + H-O-Si ≡
R+ + OH- + H-O-Si ≡ → ≡ Si-O-R + H2O
Thickness of double layer increases with the decrease in valence of ions and
concentration of electrolyte. In case of mortar specimens subjected to air, double layer
thickness reduces due to the increased concentration of ions. As a result, Van der Waals
force exceeds the repulsive force between ions and gel is formed. When mortar
specimens are subjected to water/solution, the gel absorbs water. With decrease in
concentration of solution at the reaction site the double layer thickness increases.
Repulsive forces between ions increases, gel expands and exerts pressure on concrete.
Cracks occur when expansive pressure exceeds the tensile capacity of concrete.[9,15]
2.3 Deicers
2.3.1 Introduction
Deicing chemicals have been extensively used since 1950s to clear highways of
snow/ice accumulation during winter. Increasing dependence on motor vehicles for
transportation makes these chemicals one of the major focus areas of highway agencies
transportation.
13
2.3.2 Action of Deicers
Deicers melt on coming in contact with ice and form brine (salty solution). Brine
has a freezing point below 32°F (0°C). As a result, brine penetrates and spreads through
the layer of ice thereby weakening the pavement-ice bond [16].
2.4 Commonly used deicers for highways [17,18]
2.4.1 Chloride based deicers
Commonly used chloride based deicers are sodium chloride (rock salt), calcium
chloride and magnesium chloride.
1. Sodium chloride (Rock salt)
It is the oldest and most commonly used highway deicer. Sodium chloride is
primarily used in solid form. At a concentration of 23.3%, sodium chloride freezes at a
minimum temperature of -5.8°F (-21°C).
2. Calcium chloride
This deicer can be used in the form of pellets, flake or liquid. The freezing point
of calcium chloride, -60°F (-51°C) at 29.8% concentration, is lower than that of sodium
chloride. This makes it more effective in extremely cold regions. Key aspects that limit
its use are high cost and high corrosivity. It is obtained from natural well brines through
Solvay process. Calcium chloride and Sodium carbonate are by-products of Solvay
process that involves blending sodium chloride and calcium carbonate.
3. Magnesium chloride
Magnesium chloride is derived from natural brines. It has a freezing point of
-28°F (-33°C) at 21.6% concentration.
14
2.4.2 Acetate based deicers
These deicers involve use of highly concentrated acetic acid as a reactant. Thus,
use of these deicers for large scale application may require attention.
1. Calcium magnesium acetate (CMA)
This deicer was developed during the 1970s with the support of FHWA. The
freezing point of CMA deicer is -17.5°F (-27.5°C) at 32.5% concentration. Some of the
properties that restrict its use as a deicer are slow action, less effective at lower
temperatures, low density and high volume requirement. CMA deicer is less corrosive to
reinforcing steel.
2. Potassium acetate
Potassium acetate is used in liquid form only. It has a freezing point of -76°F
(-60°C) at 49% concentration. It is a non-chloride deicer.
2.4.3 Glycol based deicers
Use of glycol based compounds like ethylene glycols and propylene glycols are
used as aircraft deicers. They have not been used as highway deicers.
2.4.4 Urea
Urea is a soluble nitrogenous compound and a weak base. It has low corrosion
potential. It has limited use due to its degradation to ammonia which is detrimental to
aquatic life in streams running near highways.
2.5 Effect of Chloride based deicers on Alkali silica reaction in concrete
It is well known that deicers involving chlorides can result in corrosion of
reinforcement in concrete. Chlorides in concrete can be found in free state or bound with
15
hydration products. Free chloride levels may be affected by type of cations and chloride
dosage [19]. Several research studies have shown that alkali chlorides seem to trigger the
alkali silica reaction in concrete. Mortar specimens have been subjected to alkali
chlorides by introducing them as additives in the mix or by using external alkali salt
solution.
Alkali salts seem to cause more expansion in concrete in comparison to alkali
hydroxides [2]. Monovalent cations (e.g. Na+, K+) have a higher expansion potential
compared to divalent or trivalent cations (e.g. Ca+2) [20]. Exposure to chloride solutions
leads to the formation of chloroaluminates [21].
Behavior of mortar specimens subjected to the chloride deicers depends on the
concentration of deicing solution and exposure to conditions like temperature.
1. Sodium chloride
Extensive research has been done on effect of sodium chloride on alkali silica
reaction. SO4-2 ions from ettringite are replaced by Cl- from the sodium chloride solution
leading to the formation of chloroaluminates.
2 NaCl + Ca(OH)2 → 2 NaOH + CaCl2
3CaO.Al2O3.3CaSO4.32H2O + CaCl2 → 3CaO.Al2O3.3CaCl2.32H2O + 3CaSO4
Sodium chloride tends to increase the hydroxyl ion concentration in pore solution
[22,23]. This may be due to the formation of chloride intruded ASR products.
Berube [24] suggests that in mortar specimens exposed to sodium chloride
deicing solution, soluble Cl- ions may be present as sodium chloride and total chlorides
16
may be present as calcium chloroaluminate. The paper also cites reference which states
that the transformation of soluble chloride ions to chloroaluminates is a timely process.
Pore solution of mortar samples involving reactive aggregate and sodium chloride
as additive showed slight decrease in OH- ion concentration and a drastic reduction in Cl-
ion concentration between the age of 12-24 hours. Pore solution of mortar samples
involving a non-reactive aggregate and sodium chloride as additive showed little drop in
the OH- ion concentration and Cl- ion concentration at the same age. Based on this study,
Kawamura [22] concluded that rapid expansion in early stage of the alkali silica reaction
can be due to chloride ions.
2. Calcium chloride
Presence of free calcium hydroxide and a high concentration of CaCl2 deicer can
cause failure of concrete [25]. Chloride concentration in mortar specimens may be due to
formation of chloroaluminates (3CaO.Al2O3.3CaCl2.32H2O), calcium chloride hydrates
(3CaO.CaCl2.12H2O, 3CaO.CaCl2.2H2O) or adsorption of Cl- by Calcium silicate hydrate
(CSH) [21,25].
Mortar specimens subjected to CaCl2 solution showed less expansion in
comparison to mortar specimens subjected to NaCl deicer solution [20,22]. Expansion in
such specimens may be attributed to Cl- ions. This is supported by the fact that the
hydroxyl ion concentration in pore solution involving a CaCl2 environment was less than
in pore solution involving a chloride free environment.
17
3. Potassium chloride
Potassium salt solutions seem to aggravate ASR more compared to sodium salt
solutions [2]. Reaction mechanism is similar to that of sodium chloride.
4. Magnesium chloride
Magnesium chloride as a deicer does not contribute to alkali silica reaction. It
causes distress in concrete by reaction with cementitious CSH to form non-cementitious
Magnesium silicate hydrate.
18
CHAPTER THREE
MATERIALS
Materials used were in line with the research objectives. Aggregates used were
Natural sand and Fused silica. Two different types of cement were used for preparing
mortar specimens - Type I high alkali cement and Type I low alkali cement. Four
different deicers were used for this study. The reagent grade chemicals used in
amorphous and pure state were Sodium chloride, Calcium chloride and Potassium
chloride. Commercially available and commonly used Magnesium chloride deicer was
also included in the study. Other soak solutions used were 1N sodium hydroxide solution,
de-ionized water and solution comprised of 0.5N Sodium hydroxide and 3% Sodium
chloride.
3.1 Aggregates
A reactive aggregate and a non-reactive aggregate were used for this study.
1. Sand
Non-reactive aggregate used was natural sand. Sand was thoroughly washed and
oven dried before use in the experiments. The sand was sieved and batched as per the
gradation requirements of Standard ASTM C 1260 procedure.
2. Fused silica
Reactive aggregate was included in the test matrix as it contributes towards the
environment required for ASR to occur. The aggregate, fused silica, used in the tests was
a high purity synthetic amorphous silicon dioxide aggregate. Fused silica used was
19
uniformly graded. It was used to replace sand by an amount that equals 50 percent of the
total aggregate weight used in the mix.
Table 3.1: Properties of Aggregates
Aggregate
Properties
Natural sand Fused silica
Bulk specific
gravity (OD)
1.602 x
Bulk specific
gravity (SSD)
1.922 x
% Water absorption 1.8 0.4
3.2 Cement
Type I high alkali cement and Type I low alkali cement were used for this
research. Lehigh Type I High alkali cement has an equivalent alkali content of 0.82%.
The source for this cement was Evansville, PA. Lafarge Type I Low alkali cement has an
equivalent alkali content of 0.31%. The source for this cement was Harleyville, SC. Table
below shows the chemical composition/ physical properties of cement used.
20
Table 3.2: Chemical Composition/ Physical Properties of Cement
Chemical/ Physical Properties
(%)
Lehigh Type I High alkali
cement
Lafarge Type I Low
alkali cement
Silicon dioxide SiO2 19.74 20.3
Aluminium oxide Al2O3 4.98 5.0
Ferric oxide Fe2O3 3.13 3.4
Calcium oxide CaO 61.84 64.45
Magnesium oxide MgO 2.54 1.2
Sulfur trioxide SO3 4.15 2.8
Ignition loss 1.9 1.85
Equivalent alkalis (Na2O eq.) 0.82 0.31
Insoluble residue 0.25 0.17
Tricalcium aluminate C3A 8.97 7.2
Tricalcium silicate C3S 46.6 63.76
Autoclave Expansion 0.12 0.08
3.3 Deicing/Reagent grade Chemicals
Deicing/ Reagent grade chemicals used were Sodium chloride, Calcium chloride,
Potassium chloride and Magnesium chloride. Blend of sodium chloride and sodium
chloride deicer solution was also used to study their combined effect on alkali silica
reaction. 3% deicer solution was prepared for each deicer used, i.e. sodium chloride,
calcium chloride, potassium chloride deicer and magnesium chloride.
21
A liter of 3% solution was prepared by mixing 30 gms of deicer in de-ionized water.
1. Sodium chloride
This reagent grade chemical was obtained in granular state from Fisher Scientific.
2. Calcium chloride
This reagent grade chemical was obtained in 96% extra pure, powder, anhydrous
form from ACROS Organics.
3. Potassium chloride
Potassium chloride was obtained in extra pure, powder form from ACROS
Organics as a reagent grade chemical.
4. Magnesium chloride
MAG (Nature’s Total Ice Controller) was used. This is a commercially available
and used deicer manufactured by Dead Sea Works Limited, Israel. This deicer is a blend
of magnesium chloride, calcium chloride, potassium chloride and sodium chloride.
Details of product contents are,
Calcium chloride (2-3%)
Potassium chloride (0.5-1%)
Sodium chloride (0.5-1%)
Magnesium chloride hexahydrate (Balance)
5. 0.5N sodium hydroxide and 3 % sodium chloride solution
The deicer solution involved blend of sodium chloride and sodium hydroxide. A
liter of this blended deicer solution was prepared using following procedure:
22
Prepare 500 ml of 1N sodium hydroxide solution, add 30 grams of sodium chloride
deicer and finally dilute the solution to one liter by adding de-ionized water
3.4 General Notation for Identification
Subject matter of thesis involves reference to materials used by means of
notations. Table below indicates list of materials used and the notation used for their
identification.
Table 3.3: List of Notations
Material Notation
Sand S
Fused silica FS
Type I Low alkali cement LC
Type I High alkali cement HC
De-ionized water 0
3% sodium chloride (NaCl) deicer solution 1
3% calcium chloride(CaCl2) deicer solution 2
3% potassium chloride deicer(KCl) solution 3
1N sodium hydroxide(NaOH) solution 4
Blended deicer(1N NaOH+3% NaCl) solution 5
3% magnesium chloride(MgCl2) deicer solution 6
23
CHAPTER FOUR
PROCEDURES
Standard ASTM C 1260 and Mortar bar Test methods were used to find
percentage expansion in mortar bars subjected to different deicing solutions. Titrations,
Inductively Coupled Plasma (ICP) test, Standard electron microscopy (SEM) and Energy
dispersive X-ray (EDX), X-ray diffraction techniques were used to study the environment
at microstructure level.
4.1 Standard ASTM C 1260
Standard ASTM C 1260 (also known as ‘Accelerated Mortar Bar Test (AMBT)’)
was used to determine the potential of an aggregate to cause alkali silica reaction.
Reactivity of aggregate was established by expansion greater than 0.1% after immersing
the mortar bars in soak solution for 14 days.
Mortar mix was prepared using aggregates and cement as per test matrix of this
research. Aggregates were graded as per the requirements mentioned in the procedure.
Cement used was sieved through 850 µm (No. 20) sieve to avoid any lumps. Mortar
specimens of the size (25 mm x 25 mm x 285 mm) were cast. Quantitative details of each
ingredient of mortar mix to be prepared per batch are as below:
Aggregate to cement ratio: 2.25
Water- cement ratio: 0.47 % by mass
Water-cement ratio was adjusted based on the % water absorption of the aggregate. The
mortar mix was prepared, mixed and cast into the moulds as per the requirements of the
Standard. Mortar specimens in moulds were allowed to cure for 24 hrs and then removed
24
from the moulds. Removed specimens were immersed in tap water and were placed in the
oven at 80°C for 24 hrs. Zero-day reading was noted at the end of 24 hrs and specimens
were subjected to 1N Sodium hydroxide solution at 80°C. Ratio of volume of solution to
volume of mortar specimens was considered as 4.0.
Each batch of mortar mix was used to prepare 3 mortar specimens. Expansion
results of mortar specimens subjected to 1N Sodium hydroxide solution were recorded
for 28 days at frequent intervals. Average % expansion results were used to interpret the
test results.
4.2 Mortar Bar Test
The Mortar bar test is similar in aspects like preparing mix, casting and recording
expansion results to the Standard ASTM C 1260 procedure. Temperature and deicing
solutions to which the mortar specimens were exposed differentiates the Mortar bar test
from the Standard ASTM C 1260 procedure. The following conditions were adopted in
this procedure,
1. Mortar specimens at 38°C were subjected to 1N Sodium hydroxide solution, de-
ionized water, 3 % Sodium chloride solution, 3 % Calcium chloride solution, 3%
Potassium chloride solution, 0.5N Sodium hydroxide and 3% Sodium chloride as
blended solution and 3% Magnesium chloride solution respectively.
2. Mortar specimens at 80°C were subjected to de-ionized water, 3 % Sodium chloride
solution, 3 % Calcium chloride solution, 3% Potassium chloride solution, 0.5N
Sodium hydroxide and 3% Sodium chloride as blended solution and 3% Magnesium
chloride solution respectively.
25
4.3 Titrations
Solutions in cement paste possess high ionic strength. This limits the mobility of
hydrogen ions and in turn results in a low activity coefficient. This results in increased
deviation from the actual value while calculating hydroxyl ion concentration using pH
measurements [6][26]. Based on this understanding, hydroxyl ion concentrations are
measured by titrations rather than pH measurement.
Mortar specimens were prepared using fused silica and sand as per Standard
ASTM C 1260 procedure. The ratio, (fused silica: sand) was kept same as that used in
preparing mortar specimens in Standard ASTM C 1260 and Mortar Bar test. The de-
moulded specimens were then placed in the curing room at 38°C in a container. The
container was filled with water such that it does not touch the mortar specimens. Mortar
specimens were cured for 14 days. After 14 days the mortar bars were crushed and passed
through #4 sieve. Aggregates retained on #8, #16, #30, #50 sieve were used for titrations.
Finer fraction of aggregates was avoided to prevent loss of aggregates. Aggregates
collected for titration were subjected to deicer solution for about 28 days. Concentration
of deicing solution was kept same as in Standard ASTM C 1260 and Mortar Bar test.
Ratio of volume of solution to volume of mortar specimens was considered as 4.0.
Solution was then filtered from the aggregate and diluted in the ratio 1:25. The diluted
solution was then titrated with 0.1N hydrochloric acid using phenolphthalein as an
indicator. 2-3 drops of phenolphthalein indicator were added. Titration involved a
stepwise addition of 0.1N hydrochloric acid until the solution became colorless.
26
Based on the titration results the molarity/ hydroxyl ion concentration in deicing
solution exposed to crushed mortar were predicted.
4.4 Inductively Coupled Plasma (ICP) Test
Filtered solution obtained for titrations was also used for the Inductively
Coupled Plasma (ICP) Test. The solution was stored in small plastic containers. The
solutions were diluted in the ratio of 1:100 and then given for the test. The ICP test were
conducted at Agricultural Service Laboratory, Clemson University. Also, ionic
concentration of this solution was compared to the ionic concentration of deicer solutions
used in the research program
4.5 Standard Electron Microscopy (SEM) and Energy Dispersive X- ray (EDX) analysis
Study of microstructure of mortar specimens using Standard electron microscope
and obtaining elemental composition of area of interest using Energy dispersive X- ray
analysis was executed at Clemson Electron Microscope facility using Hitachi S-3400
Scanning Electron microscope. The purpose of SEM/EDX study was to confirm that
expansion is due to alkali silica reaction.
Sample preparation for SEM/EDX analysis involved three distinct stages- Epoxy
encapsulation, Vacuum Impregnation and Preparation of polished specimens.
1. Epoxy Encapsulation
Specimens for SEM study were obtained from mortar bars using a mechanical
saw. The sample was cleaned in de-ionized water to remove debri from the surface of
sample caused as a result of sawing. Sample was allowed to dry completely. This is
important for effective polymerization and adhesion of the epoxy. Epoxy resin
27
encapsulation improves external and internal integrity of the sample. Allied EpoxySet kit
(a product of Allied High Tech Products, Inc.) was used for this process.
The set includes the resin and hardener. Resin and hardener were mixed in a ratio
of 100: 12 as per manufacturer’s specifications. Encapsulation involved the immersion
of sample in epoxy resin in a mould. All samples were identified by labels inserted during
the immersion.
2. Vacuum Impregnation
Mould with sample immersed in epoxy resin was then subjected to the Allied
Vacuum Impregnation chamber (a product of Allied High Tech Products, Inc.). The
vacuum forced the entrapped air out from within sample and caused the epoxy to fill the
voids, cracks or open spaces in matrix. Epoxy impregnated specimen was cured at room
temperature as per instructions given by Epoxy resin manufacturer.
3. Preparation of polished specimens
Once the epoxy resin was set, specimen was subjected to polishing. MD-System
by Struers A/S was used for grinding and polishing of specimens. MD-disc, MD-Piano,
MD-Dac, MD-Chem discs together form the MD-System. MD-Disc served as the
magnetic supporting disc for the MD-Piano series, MD-Dac and MD-Chem discs.
Process of polishing involved two distinct stages, i.e. grinding and polishing.
Grinding aims towards removal of initial surface defects. MD-Piano grades 80, 220, 600,
1200 producing a scratch pattern comparable to silicon carbide paper of corresponding
grit sizes were used for grinding. Mineral oil was used as lubricant during the grinding
process. Polishing aims towards a scratch free, mirror finished surface. Struers MD-DAC
28
and Struers MD-Chem polishing cloths were used for polishing. Propylene glycol was
used as lubricant during the polishing process. Specimen was cleaned with Isopropanol
after every grinding/polishing cycle to remove grit.
4.6 X-Ray Diffraction
Mortar specimens using Type I Low alkali cement, reactive aggregate subjected
to 38°C and solutions like de-ionized water, 3% Sodium chloride, 3% Calcium chloride
and 3% Potassium chloride solution were used for this test. Test samples were prepared
by crushing mortar specimens to a fine form. The test was executed using Rigaku Ultima
IV multipurpose X-ray diffraction system in Chemistry Department, Clemson University.
Figure shows X-ray diffraction patterns for compounds of interest.
Figure 4.1: X-ray Diffraction Patterns for Compounds of Interest
X ray diffraction- Ettringite
0
20
40
60
80
100
9.09 9.99 12.28 15.78 17.83 18.24 18.91
2Theta
Rel
ativ
e In
tens
ity
X ray diffraction- Friedel salt
0
20
40
60
80
100
11.19 16.39 18.09 18.35 18.96 19.48
2Theta
Rel
ativ
e In
tens
ity
X ray diffraction- Calcium hydroxide
0
20
40
60
80
100
18.07
2Theta
Rel
ativ
e In
tens
ity
29
4.7 Experimental Program
4.7.1 Test Matrix- Standard ASTM C 1260 and Mortar Bar Test
Table below shows the test matrix for Standard ASTM C 1260 and Mortar bar test
including variables like aggregate, cement, temperature and deicer solution.
Table 4.1: Test matrix for Standard ASTM C 1260, Mortar Bar test
Test Soak Solution Temperature Cement type Aggregate type
38°C 80°C Type I
High
Type I
Low
Sand FS +Sand
Mortar bar test De-ionized
water
x x x x x x
Mortar bar test 3% NaCl x x x x x x
Mortar bar test 3% CaCl2 x x x x x x
Mortar bar test 3% KCl x x x x x x
ASTM C 1260 1N NaOH x x x x x
Mortar bar test 1N NaOH x x x x x
Mortar bar test 0.5N NaOH+
3% NaCl
x x x x x x
Mortar bar test 3% MgCl2 x x x x x x
30
4.7.2 Test Matrix- SEM/EDX analysis
Table below shows the test matrix for SEM/EDX analysis including variables like
aggregate, cement, temperature and deicer solution.
Table 4.2: Test matrix for SEM/EDX analysis
Soak Solution Temperature Cement type Aggregate type
38°C 80°C Type I
High
Type I
Low
FS+ Sand
De-ionized water x x x x x
3% NaCl x x x x x
3% CaCl2 x x x x x
3% KCl x x x x x
1N NaOH x x x x x
0.5N NaOH+
3% NaCl
x x x x x
3% MgCl2 x x x x x
31
4.7.3 Test Matrix- Titrations, ICP Test
Table below shows the test matrix for Titrations and ICP test.
Table 4.3: Test matrix for Titrations, ICP Test
Soak Solution Temperature Cement type Aggregate type
Room
temperature
Type I Low FS+ Sand
De-ionized water x x x
3% NaCl x x x
3% CaCl2 x x x
3% KCl x x x
1N NaOH x x x
0.5N NaOH+ 3% NaCl x x x
3% MgCl2 x x x
32
CHAPTER FIVE
RESULTS AND DISCUSSION
5.1 General
This chapter discusses the results of various tests carried out to predict the effect
of chloride deicer. Further, it also looks into the results obtained from SEM/EDX
analysis, titrations, ICP test and X-ray diffraction. Results were analyzed to understand
the reaction mechanism at micro-structure level under the effect of external soak
solutions used in the research.
5.2 Preliminary Investigation of Alkali silica reaction
Fractured samples of mortar bars (subjected to sodium chloride, potassium
chloride, 1N Sodium hydroxide solution at 80°C) showed signs of ASR gel when viewed
under the optical microscope. There was no gel visible in specimens subjected to de-
ionized water at 80°C.
5.3 Results from Standard ASTM C 1260 test
Expansion (%) results for mortar specimens using reactive aggregate- fused silica
were compared with expansion (%) results for mortar specimens using non-reactive
aggregate- natural sand (Control). Figure (5.1) shows the expansion results of control
mortar bars and mortar bars involving fused silica. Mortar bars with fused silica
expanded more than mortar bars with natural sand. Mortar specimens using fused silica
expanded by about 1.6-1.7 % when stored in 1N NaOH solution at 38°C for 161 days.
The expansion results for similar specimens stored in soak solution of same concentration
at 80°C for a period of 28 days was found to be around 1.5%. Performance trend of
33
expansion in mortar bars using fused silica indicate that ASR under the influence of 1N
NaOH solution is unaffected by the type of cement. Also, at a given age of 28 days,
mortar bars at 80°C expanded more than those at 38°C. Expansion results were far
beyond the expansion limit of 0.1% (at 14 days) specified in the test method. This
confirms the potential of fused silica to cause alkali silica reaction in the presence of
external alkalis.
5.4 Results from Mortar Bar test
This section illustrates the expansion results for mortar specimens in the presence
of external alkalis. Expansion results for mortar specimens using non-reactive aggregate-
natural sand serve as the Control test results and are compared with performance of
mortar specimens using reactive aggregate- fused silica. Results discussed will be in
context of mortar bars using fused silica as aggregate.
5.4.1 De-ionized water as soak solution
Figure (5.2) shows the performance trend of mortar bars in terms of expansion
(%) versus age of exposure. Results show that mortar specimens using high alkali cement
expanded more than those using low alkali cement. It seems clear from the results that
alkalis in high alkali cement have the potential (expansion greater than 0.1% at 14 days in
Mortar Bar test) to cause alkali silica reaction in concrete at lower temperatures. At 28
days, mortar specimens at 80°C expanded less than those at 38°C. Mortar specimens
using fused silica showed a dramatic increase in expansion within 7 days after which
expansion slowed down. This may suggest that alkalis are no longer available for the
reaction after 7 days.
34
5.4.2 3% Sodium chloride as soak solution
Expansion (%) results of mortar specimens subjected to 3% sodium chloride soak
solution are shown in Figure (5.3). Mortar bars immersed in 3% sodium chloride solution
have expanded far beyond the 0.1 % limit. This clearly reflects the potential of sodium
chloride to cause alkali silica reaction in concrete. There is a constant increase in
expansion with age for all mortar specimens using fused silica at 38°C. This indicates
that enough alkalis and hydroxyl ions are available at reaction sites to progress the
reaction at a constant rate. At 38°C, maximum recorded expansion was 2.21% at 147
days age. At 80°C, maximum recorded expansion was 1.6-2.0 % at 28 days. This is
higher than the expansion observed in mortar bars subjected to 38°C at 28 days.
Performance of mortar bars using Type I low alkali cement and Type I high alkali cement
are comparable.
5.4.3 3% Calcium chloride as soak solution
Figure (5.4) shows results for expansion in mortar specimens exposed to 3%
calcium chloride soak solution. These results are comparable to expansion in mortar
specimens exposed to de-ionized water. It seems that expansion effect is caused by
alkalis present in the cement. Calcium chloride does not seem to cause alkali silica
reaction in mortar specimens at 38°C and 80°C. Mortar bars at 80°C expanded less than
mortar bars at 38°C
5.4.4 3% Potassium chloride as soak solution
Figure (5.5) shows the performance trend of mortar specimens, subjected to 3%
Potassium chloride solution, in terms of expansion (%) versus age of exposure.
35
Percentage expansion was recorded as about 2.70% (at 161 days) in mortar specimens at
38°C using fused silica. At 80°C the expansion in mortar bars was found to be 1.07% (at
28 days). Type of cement does not seem to influence the expansion results of mortar bars.
Higher expansion results are observed at higher temperature. Expansion greater than
0.1% at 14 days reflects the potential of potassium chloride to cause alkali silica reaction
in concrete. At a given age, potassium chloride exposed mortar bars seem to be
expanding more than sodium chloride exposed specimens when subjected to a lower
temperature (here, 38°C). Rate of expansion in mortar bars seems to be constant. This
implies a constant supply/availability of alkalis and hydroxyl ions at reaction sites.
5.4.5 0.5N Sodium hydroxide and 3% Sodium chloride blended soak solution
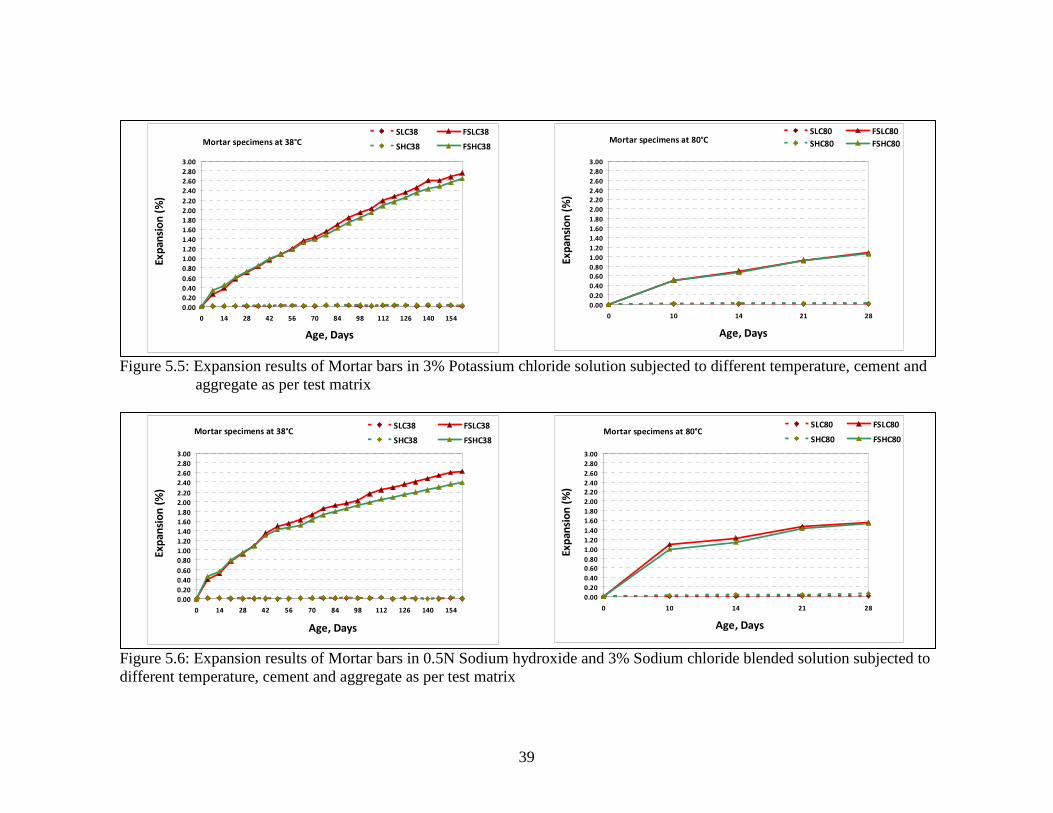
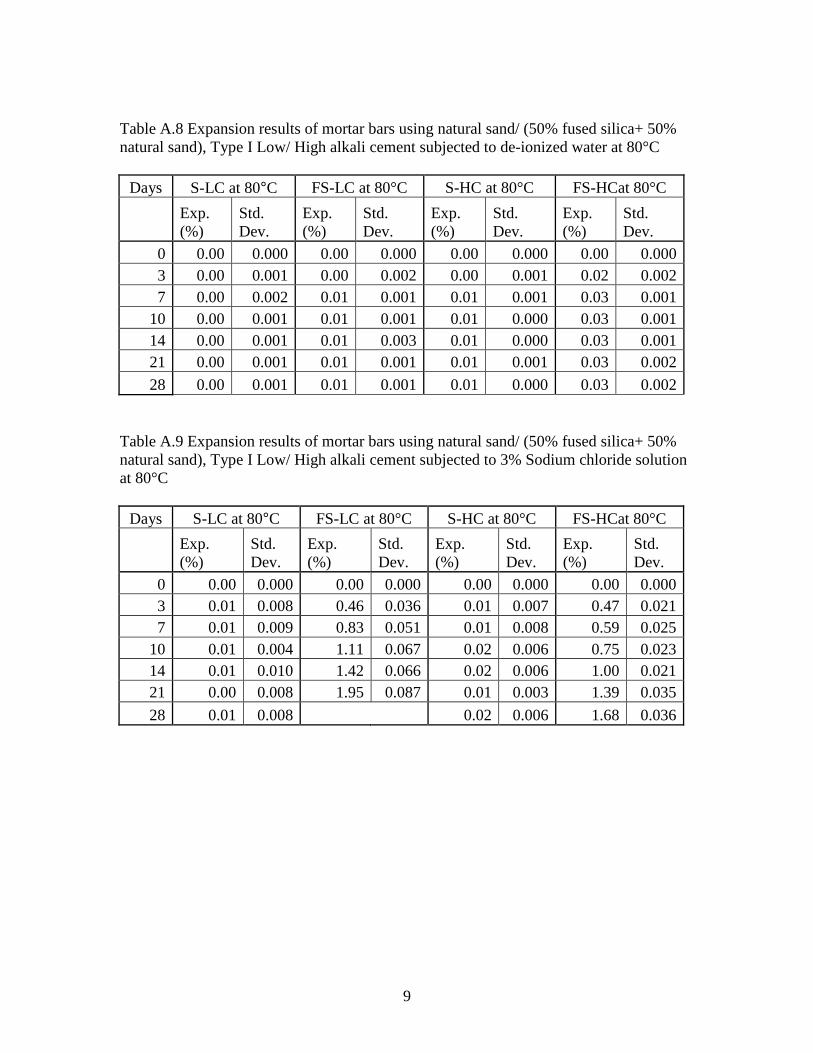
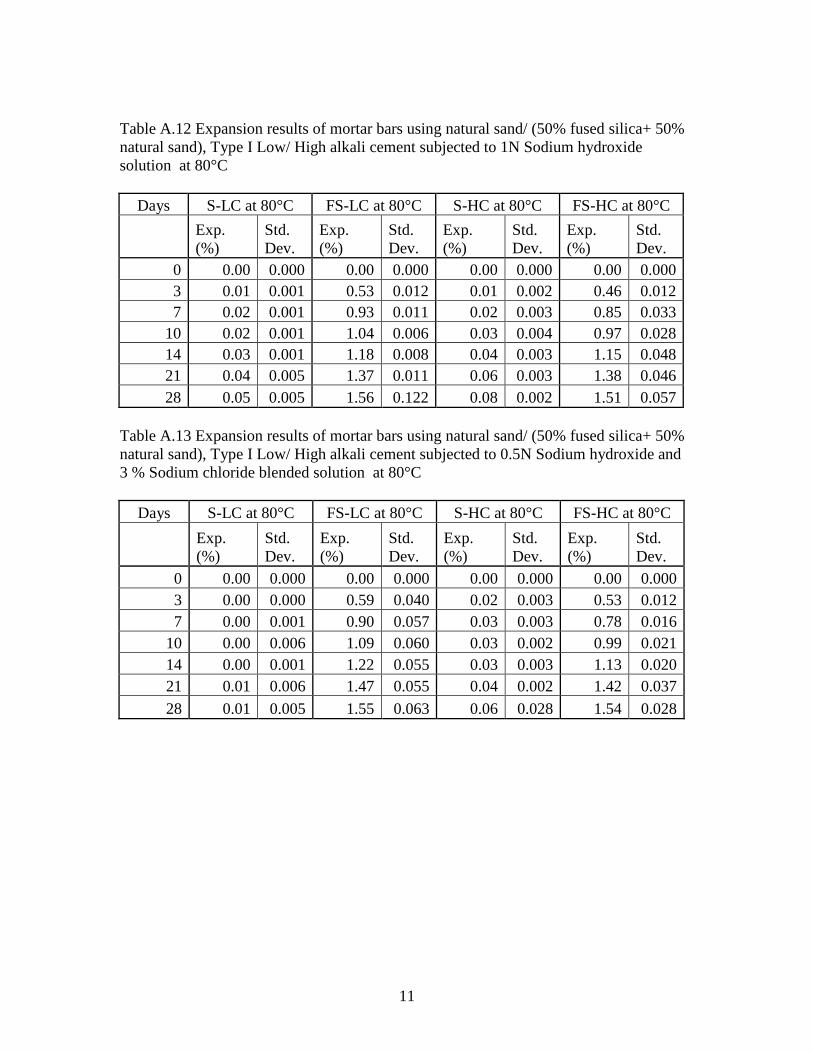
Figure (5.6) shows the expansion of mortar specimens subjected to above soak
solution under different conditions. At 38°C expansion in mortar bars was about 2.45%
(at 161 days). At 80°C mortar specimens expanded by about 1.5% (at 28 days).
Expansion in mortar bars was found to be more than expansion in mortar bars subjected
to 1N Sodium hydroxide solution. This implies that Cl- ions play an important role in the
alkali silica reaction process. Expansion results for specimens cast with Type I Low and
High alkali cement are comparable. Higher temperature seems to accelerate the
expansion reaction.
5.4.6 3% Magnesium Chloride as soak solution
Figure (5.6) shows the expansion of mortar specimens subject to 3% Magnesium
chloride soak solution under different conditions. Expansion results are comparable to
36
expansion in mortar specimens subjected to de-ionized water. This suggests that
magnesium chloride does not seem to have any effect on alkali silica reaction in concrete.
The expansive effect is due to alkalis in cement.
37
Figure 5.1: Expansion results of Mortar bars in Standard ASTM C 1260 subjected to different temperature, cement and aggregate as per test matrix
Figure 5.2: Expansion results of Mortar bars in De-ionized water subjected to different temperature, cement and aggregate as per test matrix
Mortar specimens at 38°C
0.00
0.20
0.40
0.60
0.80
1.00
1.20
1.40
1.60
1.80
2.00
2.20
2.40
2.60
2.80
3.00
0 14 28 42 56 70 84 98 112 126 140 154
Age, Days
Ex
pa
nsi
on
(%
)
SLC38 FSLC38
SHC38 FSHC38Mortar specimens at 80°C
0.00
0.20
0.40
0.60
0.80
1.00
1.20
1.40
1.60
1.80
2.00
2.20
2.40
2.60
2.80
3.00
0 10 14 21 28
Age, Days
Ex
pa
nsi
on
(%
)
SLC80 FSLC80
SHC80 FSHC80
Mortar specimens at 38°C
0.00
0.05
0.10
0.15
0.20
0.25
0.30
0 14 28 42 56 70 84 98 112 126 140 154
Age, Days
Ex
pa
nsi
on
(%
)
SLC38 FSLC38
SHC38 FSHC38Mortar specimens at 80°C
0.00
0.05
0.10
0.15
0.20
0.25
0.30
0 10 14 21 28
Age, Days
Ex
pa
nsi
on
(%
)
SLC80 FSLC80
SHC80 FSHC80
38
Figure 5.3: Expansion results of Mortar bars in 3% Sodium chloride solution subjected to different temperature, cement and aggregate as per test matrix
Figure 5.4: Expansion results of Mortar bars in 3% Calcium chloride solution subjected to different temperature, cement and aggregate as per test matrix
Mortar specimens at 38°C
0.00
0.05
0.10
0.15
0.20
0.25
0.30
0 14 28 42 56 70 84 98 112 126 140 154
Age, Days
Ex
pa
nsi
on
(%
)
SLC38 FSLC38
SHC38 FSHC38 Mortar specimens at 80°C
0.00
0.05
0.10
0.15
0.20
0.25
0.30
0 10 14 21 28
Age, Days
Exp
an
sio
n (
%)
SLC80 FSLC80
SHC80 FSHC80
Mortar specimens at 38°C
0.00
0.20
0.40
0.60
0.80
1.00
1.20
1.40
1.60
1.80
2.00
2.20
2.40
2.60
2.80
3.00
0 7 14 28 42 56 70 84 98 112 126 140 154
Age, Days
Ex
pa
nsi
on
(%
)
SLC38 FSLC38
SHC38 FSHC38 Mortar specimens at 80°C
0.00
0.20
0.40
0.60
0.80
1.00
1.20
1.40
1.60
1.80
2.00
2.20
2.40
2.60
2.80
3.00
0 3 7 10 14 21 28
Age, Days
Ex
pa
nsi
on
(%
)
SLC80 FSLC80
SHC80 FSHC80
39
Figure 5.5: Expansion results of Mortar bars in 3% Potassium chloride solution subjected to different temperature, cement and aggregate as per test matrix
Figure 5.6: Expansion results of Mortar bars in 0.5N Sodium hydroxide and 3% Sodium chloride blended solution subjected to different temperature, cement and aggregate as per test matrix
Mortar specimens at 38°C
0.00
0.20
0.40
0.60
0.80
1.00
1.20
1.40
1.60
1.80
2.00
2.20
2.40
2.60
2.80
3.00
0 14 28 42 56 70 84 98 112 126 140 154
Age, Days
Ex
pa
nsi
on
(%
)
SLC38 FSLC38
SHC38 FSHC38Mortar specimens at 80°C
0.00
0.20
0.40
0.60
0.80
1.00
1.20
1.40
1.60
1.80
2.00
2.20
2.40
2.60
2.80
3.00
0 10 14 21 28
Age, Days
Ex
pa
nsi
on
(%
)
SLC80 FSLC80
SHC80 FSHC80
40
Figure 5.7: Expansion results of Mortar bars in 3% Magnesium chloride solution subjected to different temperature, cement and aggregate as per test matrix
Mortar specimens at 38°C
0.00
0.05
0.10
0.15
0.20
0.25
0.30
0 14 28 42 56 70 84 98 112 126
Age, Days
Ex
pa
nsi
on
(%
)
SLC38 FSLC38
SHC38 FSHC38Mortar specimens at 80°C
0.00
0.05
0.10
0.15
0.20
0.25
0.30
0 10 14 21 28
Age, Days
Ex
pa
nsi
on
(%
)
SLC80 FSLC80
SHC80 FSHC80
41
Figure 5.8: Influence of alkali content of cement, alkali type on Expansion of (Fused silica+ Sand) mortar bars
Figure 5.9: Influence of Storage temperature on expansion of (Fused silica+ Sand) mortar bars
Mortar specimens using Type I Low alkali cement subject to 38°C
0.00
0.20
0.40
0.60
0.80
1.00
1.20
1.40
1.60
1.80
2.00
2.20
2.40
2.60
2.80
3.00
0 14 28 42 56 70 84 98 112 126 140 154
Age, Days
Expansion(%)
1 N NaOH solution 3% Sodium Chloride solution
3% Potassium Chloride solution 3% Calcium Chloride solution
3% Magnesium chloride De-ionized water
0.5N NaOH+ 3% NaCl solution
Mortar specimens using Type I High alkali cement subject to 38°C
0.00
0.20
0.40
0.60
0.80
1.00
1.20
1.40
1.60
1.80
2.00
2.20
2.40
2.60
2.80
3.00
0 14 28 42 56 70 84 98 112 126 140 154
Age, Days
Expansion(%)
1 N NaOH solution 3% Sodium Chloride solution
3% Potassium Chloride solution 3% Calcium Chloride solution
3% Magnesium chloride De-ionized water
0.5N NaOH+ 3% NaCl solution
Comparison of Expansion(%) of mortar bars subject t o different deicing solutions under different conditions
0
0.2
0.4
0.6
0.8
1
1.2
1.4
1.6
1.8
2
2.2
2.4
2.6
2.8
3
Type I Low alkali cement, 38°C Type I high alkali ce ment, 38°C
Cement type used, Temperature conditions
Exp
ansi
on (
%)
1N Sodium hydroxidesolution (at 161 days)
3% Sodium chloride solution(at 147 days)
3% Potassium chloridesolution (at 161 days)
De-ionized Water (at 161days)
3% Calcium chloride solution(at 161 days)
0.5N Sodium hydroxide +3 %Sodium chloride solution (at161 days)3% Magnesium chloride (at133 days)
Comparison of Expansion(%) of mortar bars subject t o different deicing solutions under different conditions
0
0.2
0.4
0.6
0.8
1
1.2
1.4
1.6
1.8
2
2.2
2.4
2.6
2.8
3
Type I Low alkali cement, 80°C Type I high alkali ce ment, 80°C
Cement type used, Temperature conditions
Exp
ansi
on (
%)
1N Sodium hydroxidesolution (at 161 days)
3% Sodium chloride solution(at 147 days)
3% Potassium chloridesolution (at 161 days)
De-ionized Water (at 161days)
3% Calcium chloride solution(at 161 days)
0.5N Sodium hydroxide +3 %Sodium chloride solution (at161 days)3% Magnesium chloride (at133 days)
42
5.6 Results from Titrations
Hydroxyl ion concentration is an important requirement for an alkali silica
reactive environment. Crushed mortar specimens were subjected to different soak
solutions as per the test matrix for a period of about 28 days at room temperature. Filtered
solution was diluted and used for titration experiments to find the hydroxyl ion
concentration in the water soluble hydroxides. Figure (5.10) shows the hydroxyl ion
concentration in water soluble hydroxides. It is observed that hydroxyl ion concentration
is very high in solution filtered from crushed mortar specimens subjected to 1N NaOH
solution and (0.5N NaOH+ 3% Sodium chloride) solution compared to other solutions.
Hydroxyl ion concentration in the solution filtered from crushed mortar specimens
subjected to chloride salt solutions and de-ionized water are comparable.
Low hydroxyl ion concentrations in solution filtered from crushed mortar samples
subjected to chloride salt solutions suggest the absence of ASR. Although, mortar bar test
results show that mortar bars subjected to alkali chloride solutions expand more than
those subjected to alkali hydroxide solutions. This implies that it is possible that
formation of chloroaluminates released the extra OH- ions in the pore solution. As a
result, we observed ASR effect in the mortar specimens. It also suggests that
transformation from ettringite to chloroaluminates is a timely process. These test results
are not conclusive and need further investigation.
43
Hydroxyl ion concentration in pore solution
00.10.2
0.30.40.50.6
0.70.8
1N S
odiu
mhy
drox
ide
(0.5
N S
odiu
mhy
drox
ide+
3%S
odiu
mch
lorid
e)
3% S
odiu
mch
lorid
e
3% C
alci
umch
lorid
e
3% P
otas
sium
chlo
ride
3%M
agne
sium
chlo
ride
De-
ioni
zed
wat
er
Soak solution
Hyd
roxy
l ion
con
cent
ratio
n (M
)
Figure 5.10: OH- ion concentration in water soluble hydroxides of mortar Specimens ... using Type I Low alkali cement and (Fused silica+ sand) as aggregate subjected to different deicing solutions at 38°C temperature
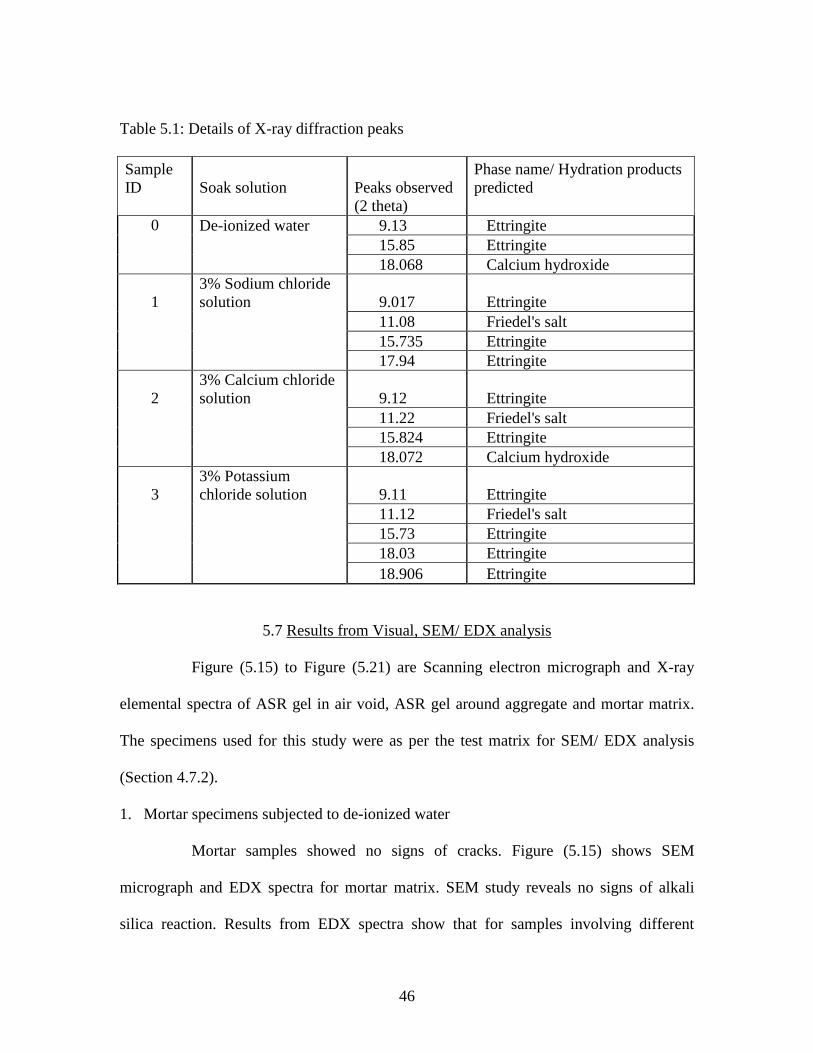
5.7 Results from X-ray Diffraction
X-ray diffraction was performed on finely powdered mortar specimens with
2-theta value from 3° to 20° and scan speed of 0.16 cps. Based on peaks observed and
study of standard X-ray diffraction patterns of compounds of interest, presence of
hydration products was predicted. Mortar samples subjected to 3% sodium chloride
(Figure 5.12), 3% potassium chloride (Figure 5.14) and 3% calcium chloride (Figure
5.13) showed low intensity distinct peaks of Friedel salt at about 11°. Distinct peaks of
ettringite are observed in all samples. Mortar samples subjected to de-ionized water
(Figure 5.11) and 3% calcium chloride showed distinct peak of calcium hydroxide at
about 18° which suggest absence of ASR. Table (5.1) gives details of peaks observed in
each sample.
44
Figure 5.11: X ray diffraction results for Mortar specimens using (Fused silica+ sand) as aggregate, Type I Low alkali Cement subjected to 38°C and De-ionized water
Figure 5.12: X ray diffraction results for Mortar specimens using (Fused silica+ sand) as
aggregate, Type I Low alkali Cement subjected to 38°C and 3% Sodium .. chloride solution
45
Figure 5.13: X ray diffraction results for Mortar specimens using (Fused silica+ sand) as
aggregate, Type I Low alkali Cement subjected to 38°C and 3% Calcium . chloride solution
Figure 5.14: X ray diffraction results for Mortar specimens using (Fused silica+ sand) as
aggregate, Type I Low alkali Cement subjected to 38°C and 3% Potassium chloride solution
46
Table 5.1: Details of X-ray diffraction peaks Sample ID
Soak solution
Peaks observed (2 theta)
Phase name/ Hydration products predicted
0 De-ionized water 9.13 Ettringite 15.85 Ettringite 18.068 Calcium hydroxide
1 3% Sodium chloride solution 9.017 Ettringite
11.08 Friedel's salt 15.735 Ettringite 17.94 Ettringite
2 3% Calcium chloride solution 9.12 Ettringite
11.22 Friedel's salt 15.824 Ettringite 18.072 Calcium hydroxide
3 3% Potassium chloride solution 9.11 Ettringite
11.12 Friedel's salt 15.73 Ettringite 18.03 Ettringite 18.906 Ettringite
5.7 Results from Visual, SEM/ EDX analysis
Figure (5.15) to Figure (5.21) are Scanning electron micrograph and X-ray
elemental spectra of ASR gel in air void, ASR gel around aggregate and mortar matrix.
The specimens used for this study were as per the test matrix for SEM/ EDX analysis
(Section 4.7.2).
1. Mortar specimens subjected to de-ionized water
Mortar samples showed no signs of cracks. Figure (5.15) shows SEM
micrograph and EDX spectra for mortar matrix. SEM study reveals no signs of alkali
silica reaction. Results from EDX spectra show that for samples involving different
47
cement and exposed to different temperature, the alkali/ silica ratio is comparable. Alkali/
silica ratio in different samples with variation in cement type and temperature appears to
be around 0.05.
2. Mortar specimens subjected to 3% Sodium chloride solution
Samples exposed to 38°C show visible continuous hair crack along the length
of the specimen. In case of samples subjected to 80°C, patterned cracks are observed with
major continuous crack being along the length of specimen. These cracks seem to be
wider and more intense than cracks developed in mortar bars at lower temperature.
Figure (5.16) shows the Scanning electron micrographs and EDX spectra for
mortar samples subjected to 3% Sodium chloride solution. SEM micrographs show the
presence of gel in cracked aggregate and in air voids in all specimens irrespective of
exposure temperature or type of cement used. EDX spectra of this gel show an alkali/
silica ratio of 0.1-0.4 (> 0.05, i.e. alkali/ silica ratio observed in mortar bars subjected to
de-ionized water). This confirms that the gel is ASR gel. EDX spectra results of mortar
matrix show alkali/ silica ratio greater than 0.05. Thus, it is likely that ASR gel had
migrated into the matrix where it became rich in calcium due to interaction with cement
paste (High Ca/ Si ratio in the paste). Alkalis migrate to other potential reaction sites
through the matrix. Micro-cracks found in the mortar matrix may be due to ASR or
shrinkage. The X-ray elemental spectra associated with the mortar matrix reflects the
presence of chlorides. It is possible that chlorides from the chloride salts have interacted
with hydration products to form chloroaluminates.
48
3. Mortar specimens subjected to 3% Calcium chloride solution
Visual inspection and SEM/ EDX analysis show no signs of ASR. Figure (5.17)
reflects SEM micrograph and EDX spectra for matrix. X-ray elemental spectra results for
mortar matrix of specimens studied indicate the presence of chlorides in the matrix. Thus,
it is likely that chloroaluminates have formed and so hydroxyl ions are available for the
reaction. The mix is rich in calcium, but not alkalis. Bringing all the facts together, it
seems that excess of calcium in the matrix has reduced ASR potential. This is in
agreement with many published literature which explains the formation of non-swelling
calcium silicate gel [9,13].
4. Mortar specimens subjected to 3% Potassium chloride solution
Cracks developed in mortar specimens subjected to this solution were more
intense and wider than cracks developed in specimens exposed to sodium chloride
solution.
Figure (5.18) shows the SEM micrograph and spectra results for mortar
specimens subjected to potassium chloride solution with varied temperature and cement.
Alkali silica gel is observed in cracked aggregates and also in air voids. The alkali/ silica
ratio varies from 0.2-0.6. EDX spectra results reveal the presence of alkalis and chloride
ions in the matrix. This suggests the presence of ASR gel and chloroaluminates in the
system. Matrix shows lot of micro-cracks which are probably associated with ASR or
shrinkage.
49
5. Mortar specimens subjected to 1N Sodium hydroxide solution
Visual inspection results of mortar bars show intense mapped cracking. Cracks
are wider and intense than specimens subjected to sodium chloride and potassium
chloride solutions.
SEM micrographs reflect ASR gel in aggregate and air void. Alkali/ silica ratio is
observed in the range of 0.2-0.4. Figure (5.19b) reflects an extended case of ASR distress
in a cracked aggregate where the alkali/ silica ratio is greater than 1.0. Alkali/ silica ratio
is comparable to that observed in sodium chloride and potassium chloride exposed mortar
bars. Low calcium/ silica gel is observed in the air void. The intensity and extent of
reaction can be attributed to the external source of hydroxyl ions. Mortar matrix spectra
results reflect a high alkali/ silica gel which indicate the presence of ASR gel. Calcium/
silica ratio is found to vary based on distance from aggregate.
6. Mortar specimens subjected to 0.5N Sodium hydroxide and 3% Sodium chloride
blended solution
Patterned cracking is found in mortar specimens subjected to this solution. Mortar
specimens at 80°C show more intense cracks in comparison to mortar specimens at 38°C.
SEM/ EDX analysis results as in Figure (5.20) show presence of alkali silica gel
in cracked aggregate, in air void and in matrix. Alkali/ silica ratio is within the range of
0.2-0.5. Calcium/ silica ratio varies based on distance from aggregate.
50
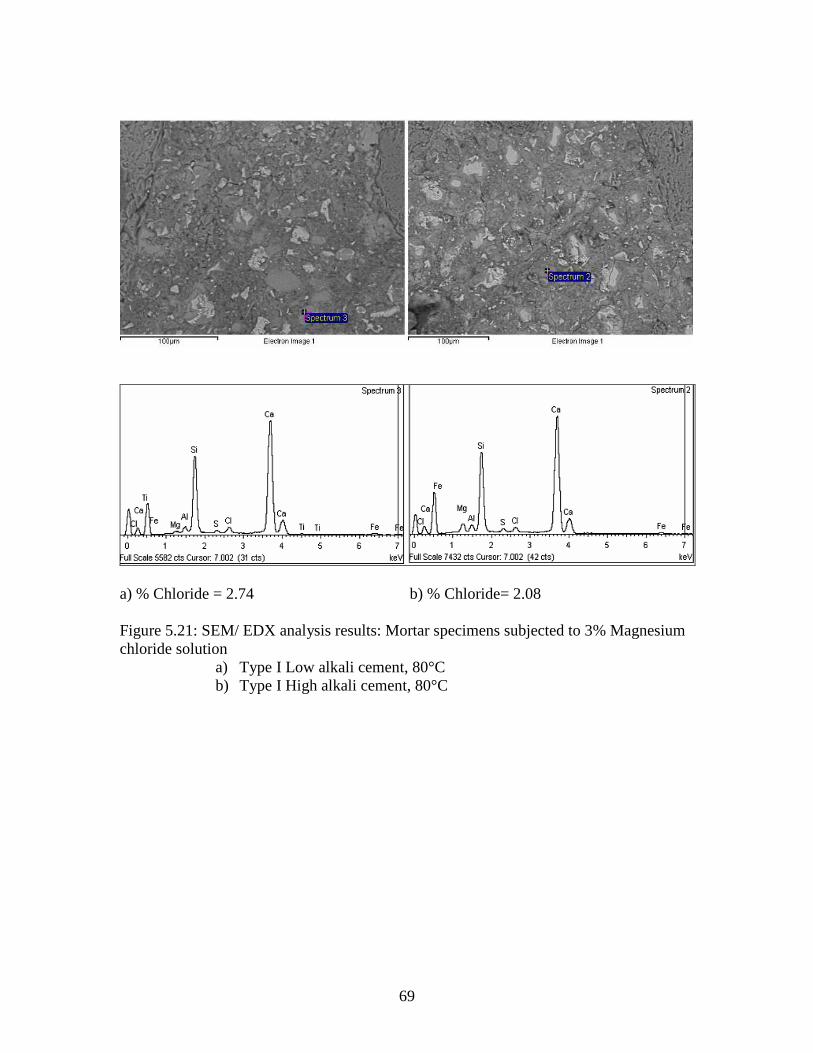
7. Mortar specimens subjected to 3% Magnesium chloride solution
Figure (5.21) shows SEM/EDX results for mortar specimens using Type I Low/
High alkali cement at 80°C. No signs of ASR are observed. High concentrations of
magnesium and chloride ions are found in the matrix.
5.8 Results from ICP Test
ICP Test results are not conclusive and needs further investigation. Table
(A.14) reflects the ICP test results.
51
a) Alkali/ Silica= - b) Alkali/ Silica= 0.03 c) Alkali/ Silica= 0.02 d) Alkali/ Silica= 0.06 Figure 5.15: SEM/ EDX analysis results: Mortar specimens subjected to De-ionized water
a) Type I Low alkali cement, 38°C b) Type I High alkali cement, 38°C c) Type I Low alkali cement, 80°C d) Type I High alkali cement, 80°C
52
Alkali/ Silica = 0.13 Alkali/ Silica = 0.37 Alkali/ Silica = 0.21 Calcium/ Silica = 0.19 Calcium/ Silica = 2.04 Calcium/ Silica = 2.38 % Chloride = 1.66 Figure 5.16: SEM/ EDX analysis results: Mortar specimens subjected to 3% Sodium chloride solution a) Type I Low alkali cement, 38°C
53
Alkali/ Silica = 0.21 Alkali/ Silica = 0.15 Alkali/ Silica = 0.17 Calcium/ Silica = 0.45 Calcium/ Silica = 1.09 Calcium/ Silica = 2.44 % Chloride = 1.29 Figure 5.16: SEM/ EDX analysis results: Mortar specimens subjected to 3% Sodium chloride solution b) Type I High alkali cement, 38°C
54
Alkali/ Silica = 0.16 Alkali/ Silica = 0.13 Alkali/ Silica = 0.07 Calcium/ Silica = 0.33 Calcium/ Silica = 1.73 Calcium/ Silica = 2.05 % Chloride = 4.18 Figure 5.16: SEM/ EDX analysis results: Mortar specimens subjected to 3% Sodium chloride solution c) Type I Low alkali cement, 80°C
55
Alkali/ Silica = 0.20 Alkali/ Silica = 0.19 Alkali/ Silica = Nil Calcium/ Silica = 0.47 Calcium/ Silica = 0.48 Calcium/ Silica = 1.86 % Chloride = 1.91 Figure 5.16: SEM/ EDX analysis results: Mortar specimens subjected to 3% Sodium chloride solution d) Type I High alkali cement, 80°C
56
a) % Chloride = 3.47 b) % Chloride= 2.49 c) % Chloride= 3.66 d) % Chloride= 1.71 Figure 5.17: SEM/ EDX analysis results: Mortar specimens subjected to 3% Calcium chloride solution
e) Type I Low alkali cement, 38°C f) Type I High alkali cement, 38°C g) Type I Low alkali cement, 80°C h) Type I High alkali cement, 80°C
57
Alkali/ Silica = 0.32 Alkali/ Silica = 0.22 Alkali/ Silica = 0.19 Calcium/ Silica = 0.38 Calcium/ Silica = 1.65 Calcium/ Silica = 2.60 % Chloride = 2.58 Figure 5.18: SEM/ EDX analysis results: Mortar specimens subjected to 3% Potassium chloride solution
a) Type I Low alkali cement, 38°C
58
Alkali/ Silica = 0.55 Alkali/ Silica = 0.41 Alkali/ Silica = 0.16 Calcium/ Silica = 0.62 Calcium/ Silica = 2.58 Calcium/ Silica = 2.10 % Chloride = 1.84 Figure 5.18: SEM/ EDX analysis results: Mortar specimens subjected to 3% Potassium chloride solution
b) Type I High alkali cement, 38°C
59
Alkali/ Silica = 0.27 Alkali/ Silica = 0.30 Alkali/ Silica = Nil Calcium/ Silica = 0.26 Calcium/ Silica = 1.03 Calcium/ Silica = 2.30 % Chloride = 1.94 Figure 5.18: SEM/ EDX analysis results: Mortar specimens subjected to 3% Potassium chloride solution
c) Type I Low alkali cement, 80°C
60
Alkali/ Silica = 0.23 Alkali/ Silica = 0.29 Alkali/ Silica = 0.15 Calcium/ Silica = 0.16 Calcium/ Silica = 0.58 Calcium/ Silica = 2.61 % Chloride = 1.44 Figure 5.18: SEM/ EDX analysis results: Mortar specimens subjected to 3% Potassium chloride solution
d) Type I High alkali cement, 80°C
61
Alkali/ Silica = 0.32 Alkali/ Silica = 0.37 Alkali/ Silica = 0.15 Calcium/ Silica = 0.40 Calcium/ Silica = 0.52 Calcium/ Silica = 2.60 Figure 5.19: SEM/ EDX analysis results: Mortar specimens subjected to 1N Sodium hydroxide solution
a) Type I Low alkali cement, 38°C
62
Alkali/ Silica = 1.83 Alkali/ Silica = 0.38 Alkali/ Silica = 0.60 Calcium/ Silica = 0.32 Calcium/ Silica = 0.23 Calcium/ Silica = 2.90 Figure 5.19: SEM/ EDX analysis results: Mortar specimens subjected to 1N Sodium hydroxide solution
b) Type I High alkali cement, 38°C
63
Alkali/ Silica = 0.25 Alkali/ Silica = 0.29 Alkali/ Silica = 0.26 Calcium/ Silica = 0.41 Calcium/ Silica = 0.41 Calcium/ Silica = 2.27 Figure 5.19: SEM/ EDX analysis results: Mortar specimens subjected to 1N Sodium hydroxide solution
c) Type I Low alkali cement, 80°C
64
Alkali/ Silica = 0.20 Alkali/ Silica = 0.44 Alkali/ Silica = 0.49 Calcium/ Silica = 0.75 Calcium/ Silica = 0.86 Calcium/ Silica = 2.32 Figure 5.19: SEM/ EDX analysis results: Mortar specimens subjected to 1N Sodium hydroxide solution
d) Type I High alkali cement, 80°C
65
Alkali/ Silica = 0.32 Alkali/ Silica = 0.39 Alkali/ Silica = 0.16 Calcium/ Silica = 0.29 Calcium/ Silica = 1.64 Calcium/ Silica = 2.33 % Chloride = 1.60 Figure 5.20: SEM/ EDX analysis results: Mortar specimens subjected to 0.5N Sodium hydroxide and 3% Sodium chloride blended solution
a) Type I Low alkali cement, 38°C
66
Alkali/ Silica = 0.45 Alkali/ Silica = 0.35 Alkali/ Silica = 0.52 Calcium/ Silica = 0.44 Calcium/ Silica = 1.53 Calcium/ Silica = 2.13 % Chloride = - Figure 5.20: SEM/ EDX analysis results: Mortar specimens subjected to 0.5N Sodium hydroxide and 3% Sodium chloride blended solution
b) Type I High alkali cement, 38°C
67
Alkali/ Silica = 0.29 Alkali/ Silica = 0.27 Alkali/ Silica = 0.33 Calcium/ Silica = 0.33 Calcium/ Silica = 0.68 Calcium/ Silica = 2.82 % Chloride = 1.43 Figure 5.20: SEM/ EDX analysis results: Mortar specimens subjected to 0.5N Sodium hydroxide and 3% Sodium chloride blended solution
c) Type I Low alkali cement, 80°C
68
Alkali/ Silica = 0.31 Alkali/ Silica = 0.28 Alkali/ Silica = 0.38 Calcium/ Silica = 0.42 Calcium/ Silica = 0.35 Calcium/ Silica = 2.40 % Chloride = 1.20 Figure 5.20: SEM/ EDX analysis results: Mortar specimens subjected to 0.5N Sodium hydroxide and 3% Sodium chloride blended solution
d) Type I Low alkali cement, 80°C
69
a) % Chloride = 2.74 b) % Chloride= 2.08 Figure 5.21: SEM/ EDX analysis results: Mortar specimens subjected to 3% Magnesium chloride solution
a) Type I Low alkali cement, 80°C b) Type I High alkali cement, 80°C
70
CHAPTER SIX
SUMMARY AND CONCLUSIONS 6.1 General
This chapter summarizes the results of Standard ASTM C 1260 tests, Mortar Bar
tests, Titrations, ICP tests, X-ray Diffraction studies and SEM/ EDX analyses. All the
results are correlated to conclude the research in line with the research objectives. Results
summarized here are in context of mortar bars using fused silica as reactive aggregate.
6.2 Standard ASTM C 1260, Mortar Bar test
These tests served as the stepping stone to determine potential of chloride deicers
to cause alkali silica reaction in concrete under the effect of variables like temperature
and cement. Findings of these tests can be summarized as follows,
1. Mortar bars using fused silica as aggregate expanded more than 0.1% at 14 days in
the standard ASTM C 1260 test
2. Mortar specimens subjected to alkali chloride solutions expanded more than those
subjected to 1N sodium hydroxide solution in the standard ASTM C 1260 test
3. Expansion in mortar bars exposed to blended solution of 0.5N sodium hydroxide and
3% Sodium chloride solution was more than mortar bars exposed to 1N sodium
hydroxide solution
4. Mortar bars in calcium chloride/ magnesium chloride solutions expanded less than
those in sodium- chloride/ potassium chloride solutions
71
5. Expansion in mortar bars exposed to calcium chloride solution and magnesium
chloride solution were comparable to the expansion observed in mortar bars exposed
to de-ionized water
6. Expansion of mortar bars was more in potassium chloride solution than in sodium
chloride solution at lower temperature. However, at high temperature sodium chloride
caused higher expansion than potassium chloride solution
7. Rate of expansion of mortar bars was fairly constant in the test duration in mortar
bars exposed to alkali-chloride solutions
8. Expansions in mortars bars subject to alkali chloride solution were comparable while
using cements of different alkali contents.
6.3 X-ray Diffraction
This test involved use of specimens prepared by 50% replacement of natural sand
with fused silica, Type I Low alkali cement. They were exposed to the solution at a
temperature of 38°C for a period of 160 days. Findings of this test can be summarized as
follows:
1. Chloroaluminate, also known as Friedel’s salt, was identified in mortar specimens
subjected to sodium chloride, calcium chloride and potassium chloride solution. They
were absent in specimens subjected to de-ionized water. X-ray diffraction diagram
also showed peaks of ettringite in all solutions
2. Distinct peaks of calcium hydroxide were observed in X-ray diffraction of specimens
subjected to de-ionized water and calcium chloride solutions. Alkali chlorides react
72
with calcium hydroxide to form alkalis, hydroxyl ions and calcium chloride. Calcium
chloride further reacts with ettringite to form chloroaluminates
3. Intensity of Friedel’s salt peaks was more intense in mortar specimens exposed to
potassium chloride solution compared to those exposed to sodium chloride solution.
6.4 Titrations
Findings of this test can be summarized as follows,
1. Hydroxyl ion concentration in solution filtered from crushed mortar subjected to
alkali chloride solutions was very low compared to solution filtered from crushed
mortar subjected to alkali hydroxide solution. This means that ASR effect should be
less in mortar bars exposed to alkali chlorides. This contradicts with findings of
Mortar Bar test
6.5 SEM/ EDX analysis
Findings of this test can be summarized as follows,
1. Mortar samples exposed to de-ionized water, calcium chloride and magnesium
chloride showed no signs of cracks irrespective of the temperature and type of cement
used
2. ASR gel was observed in and around fused silica aggregate, in air voids and in
surrounding matrix in case of mortar bars subjected to alkali chloride/ alkali
hydroxide solutions. Cement matrix showed significant number of micro-cracks
resulting from ASR damage and probably also shrinkage during sample preparation.
73
6.6 Influence of selected factors
1. Effect of Aggregate
Standard ASTM C 1260 results confirm that fused silica is a highly reactive
aggregate. This is supported by the fact that expansion produced by fused silica bearing
mortar bars is very high compared to expansion produced by natural sand bearing mortar
bars under all conditions
2. Effect of Temperature
Standard ASTM C 1260 and Mortar Bar test results show that mortar bars
exposed to alkali chloride/ alkali hydroxide solutions at 80°C expand more than those
exposed to similar solutions at 38°C
3. Effect of Type of Cement
Figure (5.9) shows that cement type seems to have little influence on expansion of
mortar specimens subjected to external alkali solutions
6.7 Conclusion
1. Effect of Chloride deicers on Alkali silica reaction
Sodium chloride and potassium chloride accelerate ASR in concrete. Calcium
chloride and magnesium chloride seem to cause minimal ASR effect. Typically alkali
silica gel is rich in alkalis and silica. Increase in calcium concentration in the gel leads to
the formation of a non-swelling gel. This is supported by findings from Standard ASTM
C 1260, Mortar bar test and SEM/EDX analysis results. Potassium ions accelerate the
ASR reaction in comparison to sodium ions at lower temperatures.
74
SEM/EDX results show that calcium concentration in ASR gel increases with
distance from aggregate. During the ASR reaction, some of the gel migrates to the matrix
surrounding the aggregate. This gel on coming in contact with cement hydration products
becomes rich in calcium. This gel further propagates the ASR reaction by increasing the
alkali availability to more reaction sites.
Expansion results imply that chlorides play an important role in accelerating the
ASR reaction. Chloride ions by itself do not contribute to the expansive effect. This can
be concluded based on the fact that sodium chloride causes more expansion than calcium
chloride solution.
2. Alkali silica reaction caused by chloride deicers
Mortar bar test results show that alkali chlorides cause ASR. SEM/EDX analysis
results of mortar specimens subject to alkali chloride solutions show chlorides dispersed
in the cement matrix. This suggests the interaction of chloride ions with cement hydration
products to form chloroaluminates. Presence of chloroaluminates in such specimens was
confirmed by X-ray diffraction results.
Alkali chlorides react with calcium hydroxide to form alkali hydroxides and
calcium chloride. Calcium chloride reacts with ettringite to form Friedel’s salt or
chloroaluminates where the sulfate ions are replaced by chloride ions. Thus, the
formation of Friedel’s salt releases the alkalis and hydroxyl ions into the system. They
further react with reactive silica to form alkali silica gel. Low intensity peaks of
chloroaluminates in X-ray diffraction results suggest that the transformation of ettringite
to Friedel’s salt is a timely process.
75
3. Effect of Temperature
ASR is accelerated at higher temperature in presence of alkali chlorides. The
effect is confirmed by expansion results and visual inspection
4. Effect of type of cement
Type of cement does not have much influence on expansion results, particularly
in case of presence of external alkalis. Although high-alkali cement based mortar bars
show higher alkali/silica ratio in ASR gel
5. Effect of type of aggregate
Mortar bars with fused silica (a reactive aggregate) expand more than mortar bars
with natural sand (a non-reactive aggregate).
The knowledge acquired by this research can help establish better and effective
conditions to form a more reliable and accelerated alternate test method.
6.8 Recommendations for future work
Expansion results for mortar specimens subjected to de-ionized water, calcium
chloride and magnesium chloride are more at 38°C than at 80°C. This contradicts with
expansive behavior in mortar specimens subject to alkali chloride solutions. It can be
hypothesized that the low expansion at 80°C is due to the reduced alkali/ silica ratio. At
higher temperature the calcium ions may have diffused faster to the reaction sites leading
to reduced expansion. This aspect needs further study to arrive at a conclusion.
ICP test and Titration results do not show any specific trend to arrive at a
conclusion. They are not conclusive enough and need further investigation.
Expansion tests need to be carried out using a real aggregate like Spratt.
2
Appendix A:
LENGTH CHANGE OF MORTAR BARS
Table A.1 Expansion results of mortar bars using natural sand/ (50% fused silica+ 50% natural sand), Type I Low/ High alkali cement subjected to de-ionized water at 38°C
Days S-LC at 38°C FS-LC at 38°C S-HC at 38°C FS-HC at 38°C
Exp. (%)
Std. Dev.
Exp. (%)
Std. Dev.
Exp. (%)
Std. Dev.
Exp. (%)
Std. Dev.
0 0.00 0.000 0.00 0.000 0.00 0.000 0.00 0.000 3 0.00 0.002 0.03 0.003 0.00 0.000 0.10 0.001 7 0.00 0.002 0.07 0.005 0.01 0.001 0.20 0.003
10 0.00 0.001 0.08 0.005 0.01 0.000 0.23 0.008 14 0.00 0.001 0.08 0.004 0.01 0.000 0.24 0.011 21 0.00 0.001 0.08 0.005 0.01 0.000 0.24 0.013
28 0.00 0.001 0.08 0.005 0.01 0.001 0.24 0.013 35 0.00 0.002 0.08 0.006 0.01 0.001 0.25 0.012 42 0.00 0.004 0.08 0.001 0.01 0.001 0.25 0.013 49 0.00 0.004 0.08 0.000 0.01 0.004 0.25 0.013 56 0.00 0.004 0.08 0.003 0.01 0.002 0.25 0.013 63 0.00 0.002 0.08 0.006 0.01 0.001 0.24 0.013 70 0.00 0.003 0.08 0.007 0.01 0.001 0.24 0.013 77 0.01 0.002 0.08 0.007 0.01 0.001 0.25 0.011 84 0.01 0.001 0.09 0.006 0.02 0.004 0.25 0.011 91 0.01 0.001 0.09 0.006 0.02 0.001 0.25 0.013 98 0.01 0.001 0.08 0.009 0.01 0.001 0.25 0.019
105 0.01 0.003 0.08 0.006 0.02 0.001 0.25 0.013 112 0.01 0.006 0.08 0.008 0.01 0.001 0.25 0.015 119 0.00 0.005 0.08 0.008 0.01 0.001 0.24 0.015 126 0.00 0.002 0.08 0.008 0.01 0.001 0.26 0.013 133 0.00 0.003 0.07 0.007 0.01 0.001 0.25 0.016 140 0.00 0.002 0.08 0.007 0.02 0.001 0.25 0.016 147 0.00 0.009 0.07 0.007 0.01 0.008 0.25 0.017 154 0.01 0.008 0.08 0.006 0.02 0.001 0.26 0.005
161 0.01 0.004 0.08 0.012 0.02 0.000 0.26 0.013
3
Table A.2 Expansion results of mortar bars using natural sand/ (50% fused silica+ 50% natural sand), Type I Low/ High alkali cement subjected to 3% Sodium chloride solution at 38°C
Days S-LC at 38°C FS-LC at 38°C S-HC at 38°C FS-HC at 38°C
Exp. (%)
Std. Dev.
Exp. (%)
Std. Dev.
Exp. (%)
Std. Dev.
Exp. (%)
Std. Dev.
0 0.00 0.000 0.00 0.000 0.00 0.000 0.00 0.000 3 0.01 0.001 0.05 0.004 0.01 0.002 0.12 0.004 7 0.01 0.006 0.12 0.004 0.01 0.002 0.31 0.008
10 0.01 0.006 0.20 0.007 0.01 0.002 0.31 0.008 14 0.01 0.004 0.23 0.007 0.02 0.005 0.39 0.021 21 0.00 0.005 0.39 0.014 0.00 0.003 0.50 0.010 28 0.04 0.060 0.50 0.013 0.02 0.002 0.61 0.010 35 0.01 0.005 0.64 0.029 0.02 0.004 0.74 0.021 42 0.01 0.006 0.76 0.017 0.02 0.002 0.85 0.013 49 0.01 0.006 0.86 0.032 0.02 0.003 0.94 0.005 56 0.01 0.005 1.00 0.022 0.02 0.001 1.10 0.019 63 0.01 0.006 1.10 0.039 0.03 0.001 1.18 0.020 70 0.01 0.005 1.20 0.031 0.03 0.002 1.26 0.018 77 0.01 0.007 1.30 0.036 0.03 0.001 1.36 0.019 84 0.01 0.007 1.38 0.043 0.03 0.002 1.45 0.019 91 0.01 0.006 1.48 0.044 0.03 0.002 1.54 0.018 98 0.01 0.015 1.58 0.042 0.03 0.000 1.63 0.021
105 0.02 0.015 1.68 0.045 0.03 0.000 1.72 0.023 112 0.01 0.015 1.78 0.042 0.03 0.001 1.82 0.025 119 0.00 0.013 1.89 0.043 0.03 0.000 1.92 0.030 126 0.01 0.008 1.98 0.059 0.03 0.003 1.97 0.074 133 0.01 0.006 2.04 0.037 0.03 0.002 2.03 0.032 140 0.01 0.006 2.13 0.046 0.03 0.001 2.13 0.039
147 0.01 0.008 2.21 0.074 0.04 0.004 2.21 0.069
4
Table A.3 Expansion results of mortar bars using natural sand/ (50% fused silica+ 50% natural sand), Type I Low/ High alkali cement subjected to 3% Calcium chloride solution at 38°C
Days S-LC at 38°C FS-LC at 38°C S-HC at 38°C FS-HC at 38°C
Exp. (%)
Std. Dev. Exp. (%)
Std. Dev.
Exp. (%)
Std. Dev.
Exp. (%)
Std. Dev.
0 0.00 0.000 0.00 0.000 0.00 0.000 0.00 0.000 3 0.01 0.004 0.04 0.003 0.01 0.001 0.08 0.023 7 0.01 0.004 0.06 0.004 0.01 0.001 0.17 0.005
10 0.01 0.002 0.06 0.004 0.02 0.000 0.18 0.005 14 0.01 0.002 0.05 0.006 0.01 0.001 0.18 0.005 21 0.01 0.006 0.06 0.003 0.02 0.001 0.19 0.004 28 0.01 0.006 0.06 0.003 0.02 0.001 0.19 0.004 35 0.01 0.006 0.06 0.003 0.02 0.001 0.19 0.004 42 0.02 0.005 0.07 0.003 0.03 0.001 0.20 0.005 49 0.01 0.005 0.06 0.003 0.03 0.001 0.20 0.004 56 0.02 0.006 0.06 0.003 0.03 0.001 0.20 0.004 63 0.01 0.006 0.06 0.003 0.03 0.000 0.20 0.004 70 0.01 0.003 0.07 0.003 0.03 0.000 0.20 0.005 77 0.01 0.002 0.07 0.004 0.03 0.001 0.20 0.006 84 0.01 0.059 0.06 0.004 0.03 0.001 0.20 0.007 91 0.01 0.011 0.07 0.004 0.03 0.001 0.20 0.000 98 0.01 0.002 0.07 0.004 0.03 0.001 0.20 0.006
105 0.02 0.002 0.07 0.003 0.04 0.000 0.21 0.008 112 0.02 0.012 0.06 0.004 0.04 0.002 0.20 0.001 119 0.01 0.000 0.06 0.003 0.03 0.001 0.20 0.023 126 0.01 0.001 0.07 0.001 0.04 0.002 0.20 0.006 133 0.01 0.003 0.07 0.004 0.04 0.001 0.21 0.004 140 0.02 0.000 0.07 0.003 0.04 0.001 0.21 0.004 147 0.01 0.006 0.07 0.001 0.04 0.003 0.20 0.004 154 0.02 0.002 0.07 0.059 0.04 0.004 0.21 0.006 161 0.02 0.000 0.07 0.001 0.04 0.003 0.21 0.004
5
Table A.4 Expansion results of mortar bars using natural sand/ (50% fused silica+ 50% natural sand), Type I Low/ High alkali cement subjected to 3% Potassium chloride solution at 38°C
Days S-LC at 38°C FS-LC at 38°C S-HC at 38°C FS-HC at 38°C
Exp. (%) Std. Dev. Exp. (%)
Std. Dev. Exp. (%)
Std. Dev. Exp. (%)
Std. Dev.
0 0.00 0.000 0.00 0.000 0.00 0.000 0.00 0.000 3 0.00 0.001 0.05 0.003 0.01 0.000 0.11 0.003 7 0.01 0.001 0.18 0.005 0.01 0.000 0.26 0.001
10 0.01 0.000 0.26 0.006 0.02 0.001 0.34 0.009 14 0.01 0.001 0.38 0.009 0.02 0.000 0.44 0.011 21 0.01 0.001 0.57 0.010 0.02 0.000 0.61 0.013
28 0.02 0.001 0.70 0.006 0.02 0.001 0.73 0.017 35 0.02 0.001 0.83 0.015 0.02 0.001 0.86 0.007 42 0.02 0.001 0.96 0.008 0.03 0.000 0.99 0.010 49 0.02 0.001 1.08 0.013 0.03 0.001 1.09 0.005 56 0.02 0.003 1.21 0.044 0.03 0.001 1.18 0.006 63 0.01 0.004 1.36 0.049 0.02 0.001 1.32 0.008 70 0.01 0.004 1.44 0.038 0.03 0.001 1.39 0.021 77 0.02 0.001 1.55 0.030 0.03 0.000 1.48 0.015 84 0.02 0.001 1.69 0.034 0.03 0.000 1.62 0.023 91 0.02 0.001 1.84 0.044 0.03 0.001 1.73 0.020 98 0.02 0.001 1.94 0.055 0.03 0.001 1.83 0.015
105 0.02 0.003 2.02 0.033 0.03 0.001 1.94 0.026 112 0.02 0.003 2.18 0.030 0.03 0.002 2.08 0.009 119 0.02 0.004 2.27 0.016 0.03 0.000 2.16 0.009 126 0.02 0.001 2.36 0.018 0.04 0.001 2.25 0.010 133 0.01 0.002 2.45 0.034 0.03 0.002 2.34 0.005 140 0.03 0.001 2.60 0.027 0.04 0.001 2.43 0.028 147 0.02 0.001 2.60 0.000 0.03 0.001 2.49 0.000 154 0.02 0.004 2.67 0.000 0.04 0.005 2.55 0.002
161 0.01 0.001 2.76 0.000 0.03 0.001 2.64 0.000
6
Table A.5 Expansion results of mortar bars using natural sand/ (50% fused silica+ 50% natural sand), Type I Low/ High alkali cement subjected to 1N Sodium hydroxide solution at 38°C
Days S-LC at 38°C FS-LC at 38°C S-HC at 38°C FS-HC at 38°C
Exp. (%)
Std. Dev.
Exp. (%)
Std. Dev.
Exp. (%)
Std. Dev.
Exp. (%)
Std. Dev.
0 0.00 0.000 0.00 0.000 0.00 0.000 0.00 0.000 3 0.00 0.001 0.12 0.024 0.00 0.000 0.13 0.004 7 0.00 0.001 0.32 0.027 0.01 0.000 0.33 0.008
10 0.00 0.001 0.39 0.028 0.01 0.001 0.40 0.008 14 0.00 0.001 0.51 0.026 0.01 0.000 0.51 0.008 21 0.00 0.001 0.71 0.022 0.01 0.001 0.70 0.014
28 0.00 0.001 0.82 0.021 0.01 0.002 0.80 0.018 35 0.04 0.053 0.94 0.022 0.01 0.002 0.90 0.020 42 0.01 0.001 1.01 0.026 0.01 0.002 0.96 0.025 49 0.00 0.007 1.08 0.031 0.02 0.001 1.02 0.025 56 0.01 0.000 1.13 0.034 0.00 0.002 1.06 0.027 63 0.01 0.001 1.21 0.038 0.02 0.001 1.14 0.026 70 0.01 0.003 1.26 0.040 0.02 0.002 1.18 0.027 77 0.01 0.001 1.31 0.045 0.02 0.002 1.23 0.031 84 0.01 0.001 1.37 0.044 0.02 0.001 1.29 0.029 91 0.00 0.001 1.41 0.048 0.02 0.002 1.32 0.038 98 0.01 0.003 1.44 0.049 0.01 0.001 1.35 0.035
105 0.01 0.001 1.49 0.052 0.02 0.002 1.40 0.036 112 0.01 0.001 1.53 0.055 0.02 0.001 1.44 0.037 119 0.00 0.001 1.56 0.057 0.02 0.001 1.46 0.035 126 0.00 0.001 1.58 0.059 0.01 0.002 1.49 0.037 133 0.00 0.003 1.61 0.060 0.02 0.006 1.52 0.038 140 0.01 0.002 1.66 0.064 0.02 0.002 1.56 0.036 147 0.00 0.004 1.68 0.063 0.01 0.001 1.58 0.038 154 0.00 0.003 1.71 0.065 0.02 0.002 1.61 0.040
161 0.00 0.004 1.74 0.066 0.02 0.003 1.63 0.037
7
Table A.6 Expansion results of mortar bars using natural sand/ (50% fused silica+ 50% natural sand), Type I Low/ High alkali cement subjected to 0.5N Sodium hydroxide and 3 % Sodium chloride blended solution at 38°C
Days S-LC at 38°C FS-LC at 38°C S-HC at 38°C FS-HC at 38°C
Exp. (%)
Std. Dev.
Exp. (%)
Std. Dev.
Exp. (%)
Std. Dev.
Exp. (%)
Std. Dev.
0 0.00 0.000 0.00 0.000 0.00 0.000 0.00 0.000 3 0.00 0.002 0.10 0.001 0.00 0.002 0.15 0.007 7 0.01 0.001 0.26 0.009 0.01 0.002 0.31 0.011
10 0.01 0.001 0.40 0.011 0.01 0.004 0.45 0.017 14 0.01 0.005 0.52 0.016 0.01 0.005 0.56 0.019 21 0.00 0.008 0.77 0.028 0.01 0.012 0.80 0.020 28 0.01 0.005 0.93 0.035 0.01 0.012 0.94 0.021 35 0.00 0.006 1.10 0.036 0.01 0.012 1.09 0.019 42 0.00 0.010 1.35 0.036 0.01 0.010 1.31 0.027 49 0.00 0.012 1.49 0.032 0.01 0.010 1.42 0.026 56 0.00 0.000 1.55 0.000 0.01 0.000 1.47 0.000 63 0.01 0.000 1.62 0.034 0.01 0.010 1.52 0.022 70 0.01 0.004 1.73 0.034 0.02 0.010 1.62 0.027 77 0.01 0.006 1.86 0.039 0.02 0.008 1.73 0.030 84 0.01 0.007 1.93 0.034 0.02 0.011 1.80 0.030 91 0.01 0.003 1.98 0.026 0.02 0.008 1.86 0.029 98 0.01 0.003 2.02 0.081 0.02 0.014 1.93 0.033
105 0.01 0.004 2.15 0.033 0.01 0.009 1.99 0.037 112 0.02 0.002 2.24 0.028 0.02 0.010 2.06 0.036 119 0.00 0.004 2.28 0.032 0.01 0.012 2.09 0.037 126 0.01 0.002 2.36 0.031 0.02 0.009 2.15 0.035 133 0.01 0.012 2.41 0.030 0.02 0.017 2.19 0.038 140 0.01 0.009 2.47 0.034 0.00 0.010 2.24 0.039 147 0.00 0.012 2.55 0.027 0.01 0.010 2.30 0.037 154 0.01 0.008 2.60 0.034 0.02 0.010 2.36 0.039 161 0.00 0.007 2.62 0.000 0.01 0.010 2.39 0.039
8
Table A.7 Expansion results of mortar bars using natural sand/ (50% fused silica+ 50% natural sand), Type I Low/ High alkali cement subjected to 3% Magnesium chloride solution at 38°C
Days S-LC at 38°C FS-LC at 38°C S-HC at 38°C FS-HC at 38°C
Exp. (%)
Std. Dev.
Exp. (%)
Std. Dev.
Exp. (%)
Std. Dev.
Exp. (%)
Std. Dev.
0 0.00 0.000 0.00 0.000 0.00 0.000 0.00 0.000 3 0.00 0.003 0.03 0.001 0.00 0.121 0.07 0.002 7 0.01 0.005 0.05 0.007 0.01 0.005 0.12 0.001
10 0.00 0.004 0.05 0.006 0.00 0.004 0.13 0.002 14 0.01 0.008 0.05 0.005 0.01 0.007 0.13 0.002 21 0.01 0.010 0.04 0.005 0.00 0.006 0.13 0.004
28 0.00 0.005 0.05 0.010 0.00 0.007 0.13 0.002 35 0.00 0.005 0.05 0.003 0.01 0.006 0.13 0.001 42 0.00 0.006 0.04 0.005 0.01 0.013 0.13 0.004 49 0.00 0.005 0.05 0.005 0.01 0.008 0.14 0.006 56 0.01 0.002 0.04 0.004 0.01 0.008 0.14 0.003 63 0.02 0.005 0.05 0.003 0.02 0.009 0.15 0.002 70 0.02 0.002 0.05 0.004 0.02 0.008 0.15 0.003 77 0.02 0.003 0.05 0.004 0.02 0.006 0.15 0.004 84 0.02 0.004 0.06 0.004 0.03 0.008 0.15 0.003 91 0.02 0.006 0.05 0.003 0.03 0.010 0.16 0.004 98 0.02 0.005 0.05 0.004 0.02 0.007 0.15 0.004
105 0.02 0.005 0.06 0.004 0.03 0.008 0.15 0.001 112 0.02 0.003 0.06 0.004 0.03 0.008 0.16 0.002 119 0.02 0.005 0.06 0.007 0.03 0.008 0.16 0.003
126 0.02 0.005 0.06 0.003 0.03 0.007 0.16 0.002
133 0.02 0.003 0.06 0.004 0.04 0.012 0.16 0.005
9
Table A.8 Expansion results of mortar bars using natural sand/ (50% fused silica+ 50% natural sand), Type I Low/ High alkali cement subjected to de-ionized water at 80°C
Days S-LC at 80°C FS-LC at 80°C S-HC at 80°C FS-HCat 80°C
Exp. (%)
Std. Dev.
Exp. (%)
Std. Dev.
Exp. (%)
Std. Dev.
Exp. (%)
Std. Dev.
0 0.00 0.000 0.00 0.000 0.00 0.000 0.00 0.000 3 0.00 0.001 0.00 0.002 0.00 0.001 0.02 0.002 7 0.00 0.002 0.01 0.001 0.01 0.001 0.03 0.001
10 0.00 0.001 0.01 0.001 0.01 0.000 0.03 0.001 14 0.00 0.001 0.01 0.003 0.01 0.000 0.03 0.001 21 0.00 0.001 0.01 0.001 0.01 0.001 0.03 0.002
28 0.00 0.001 0.01 0.001 0.01 0.000 0.03 0.002 Table A.9 Expansion results of mortar bars using natural sand/ (50% fused silica+ 50% natural sand), Type I Low/ High alkali cement subjected to 3% Sodium chloride solution at 80°C
Days S-LC at 80°C FS-LC at 80°C S-HC at 80°C FS-HCat 80°C
Exp. (%)
Std. Dev.
Exp. (%)
Std. Dev.
Exp. (%)
Std. Dev.
Exp. (%)
Std. Dev.
0 0.00 0.000 0.00 0.000 0.00 0.000 0.00 0.000 3 0.01 0.008 0.46 0.036 0.01 0.007 0.47 0.021 7 0.01 0.009 0.83 0.051 0.01 0.008 0.59 0.025
10 0.01 0.004 1.11 0.067 0.02 0.006 0.75 0.023 14 0.01 0.010 1.42 0.066 0.02 0.006 1.00 0.021 21 0.00 0.008 1.95 0.087 0.01 0.003 1.39 0.035
28 0.01 0.008 0.02 0.006 1.68 0.036
10
Table A.10 Expansion results of mortar bars using natural sand/ (50% fused silica+ 50% natural sand), Type I Low/ High alkali cement subjected to 3% Calcium chloride solution at 80°C
Days S-LC at 80°C FS-LC at 80°C S-HC at 80°C FS-HCat 80°C
Exp. (%)
Std. Dev. Exp. (%)
Std. Dev. Exp. (%)
Std. Dev.
Exp. (%)
Std. Dev.
0 0.00 0.000 0.00 0.000 0.00 0.000 0.00 0.000 3 0.02 0.002 0.02 0.005 0.01 0.002 0.03 0.002 7 0.01 0.002 0.01 0.002 0.01 0.006 0.03 0.002
10 0.02 0.001 0.02 0.001 0.01 0.007 0.04 0.001 14 0.02 0.005 0.02 0.001 0.01 0.005 0.04 0.004 21 0.02 0.001 0.02 0.003 0.02 0.006 0.04 0.002 28 0.02 0.001 0.02 0.002 0.02 0.006 0.04 0.001
Table A.11 Expansion results of mortar bars using natural sand/ (50% fused silica+ 50% natural sand), Type I Low/ High alkali cement subjected to 3% Potassium chloride solution at 80°C
Days S-LC at 80°C FS-LC at 80°C S-HC at 80°C FS-HCat 80°C
Exp. (%) Std. Dev. Exp. (%)
Std. Dev. Exp. (%)
Std. Dev. Exp. (%)
Std. Dev.
0 0.00 0.000 0.00 0.000 0.00 0.000 0.00 0.000 3 0.01 0.001 0.17 0.004 0.01 0.003 0.24 0.013 7 0.02 0.002 0.39 0.012 0.02 0.002 0.41 0.018
10 0.02 0.001 0.51 0.015 0.02 0.006 0.51 0.018 14 0.02 0.001 0.70 0.007 0.02 0.002 0.67 0.034 21 0.02 0.001 0.93 0.007 0.02 0.008 0.91 0.022
28 0.02 0.001 1.08 0.020 0.03 0.008 1.06 0.021
11
Table A.12 Expansion results of mortar bars using natural sand/ (50% fused silica+ 50% natural sand), Type I Low/ High alkali cement subjected to 1N Sodium hydroxide solution at 80°C
Days S-LC at 80°C FS-LC at 80°C S-HC at 80°C FS-HC at 80°C
Exp. (%)
Std. Dev.
Exp. (%)
Std. Dev.
Exp. (%)
Std. Dev.
Exp. (%)
Std. Dev.
0 0.00 0.000 0.00 0.000 0.00 0.000 0.00 0.000 3 0.01 0.001 0.53 0.012 0.01 0.002 0.46 0.012 7 0.02 0.001 0.93 0.011 0.02 0.003 0.85 0.033
10 0.02 0.001 1.04 0.006 0.03 0.004 0.97 0.028 14 0.03 0.001 1.18 0.008 0.04 0.003 1.15 0.048 21 0.04 0.005 1.37 0.011 0.06 0.003 1.38 0.046 28 0.05 0.005 1.56 0.122 0.08 0.002 1.51 0.057
Table A.13 Expansion results of mortar bars using natural sand/ (50% fused silica+ 50% natural sand), Type I Low/ High alkali cement subjected to 0.5N Sodium hydroxide and 3 % Sodium chloride blended solution at 80°C
Days S-LC at 80°C FS-LC at 80°C S-HC at 80°C FS-HC at 80°C
Exp. (%)
Std. Dev.
Exp. (%)
Std. Dev.
Exp. (%)
Std. Dev.
Exp. (%)
Std. Dev.
0 0.00 0.000 0.00 0.000 0.00 0.000 0.00 0.000 3 0.00 0.000 0.59 0.040 0.02 0.003 0.53 0.012 7 0.00 0.001 0.90 0.057 0.03 0.003 0.78 0.016
10 0.00 0.006 1.09 0.060 0.03 0.002 0.99 0.021 14 0.00 0.001 1.22 0.055 0.03 0.003 1.13 0.020 21 0.01 0.006 1.47 0.055 0.04 0.002 1.42 0.037
28 0.01 0.005 1.55 0.063 0.06 0.028 1.54 0.028
12
Table A.14 Expansion results of mortar bars using natural sand/ (50% fused silica+ 50% natural sand), Type I Low/ High alkali cement subjected to 3% Magnesium chloride solution at 80°C
Days S-LC at 80°C FS-LC at 80°C S-HC at 80°C FS-HC at 80°C
Exp. (%)
Std. Dev.
Exp. (%)
Std. Dev.
Exp. (%)
Std. Dev.
Exp. (%)
Std. Dev.
0 0.00 0.000 0.00 0.000 0.00 0.000 0.00 0.000 3 0.02 0.007 0.02 0.009 0.01 0.002 0.04 0.001 7 0.02 0.002 0.02 0.008 0.02 0.002 0.05 0.004
10 0.02 0.004 0.02 0.008 0.02 0.001 0.05 0.001 14 0.03 0.003 0.02 0.006 0.02 0.001 0.04 0.002 21 0.02 0.002 0.01 0.004 0.02 0.002 0.04 0.002 28 0.02 0.004 0.01 0.006 0.02 0.001 0.04 0.002
13
Table A.15 ICP Test Results De-ionized water 3% NaCl 3% CaCl2 3% KCl
Std. solution
Water soluble hydroxides Std. solution
Water soluble hydroxides
Na 62.04 67.83 548.04 557.14 68.56 68.99 67.43 68.46 K 10.21 16.61 11.01 17.35 11.68 16.99 426.79 418.67 Ca 0.00 16.28 0.00 19.59 267.33 260.65 0.00 19.60 Mg 0.00 0.06 0.00 0.00 1.08 0.12 0.00 0.01 SO4 3.067 3.416 3.105 3.727 3.486 3.438 3.401 3.662 Cl 23.05 25.69 521.41 528.08 549.03 517.26 426.42 416.42
1N NaOH 0.5N NaOH+ 3% NaCl 3% MgCl2
Std. solution
Water soluble hydroxides Std. solution
Water soluble hydroxides
Na 965.09 707.70 981.59 979.48 67.54 71.19 K 10.75 17.46 10.81 17.76 11.92 17.92 Ca 0.00 0.43 0.00 0.68 5.01 147.97 Mg 0.00 0.00 0.13 0.03 143.83 0.01 SO4 2.964 5.348 2.907 5.556 3.142 3.340 Cl 24.52 26.91 513.43 527.17 321.37 301.71
Note: Concentration of solution is in millimoles/lit
1
Reference List
[1] B. Fournier, M. Berube, Alkali-aggregate reaction in concrete: A review of basic concepts and engineering implications, Canadian Journal of Civil Engineering. 27 (2000) 167-191.
[2] S. Chatterji, N. Thaulow, A.D. Jensen, Studies of alkali-silica reaction. Part 4. Effect of different alkali salt solutions on expansion, Cem. Concr. Res. 17 (1987) 777- 783.
[3] Chapter 3, The Use of Lithium to Prevent or Mitigate Alkali-Silica Reaction in Concrete Pavements and Structures (FHWA-HRT-06-133) - Concrete - Pavements - FHWA, 2010.
[4] L.S. Dent Glasser, N. Kataoka, The chemistry of ‘alkali-aggregate’ reaction, Cem. Concr. Res. 11 (1981) 1-9.
[5] T. Ichikawa, Alkali–silica reaction, pessimum effects and pozzolanic effect, Cem. Concr. Res. 39 (2009) 716-726.
[6] S. Diamond, A review of alkali-silica reaction and expansion mechanisms 1. Alkalies in cements and in concrete pore solutions, Cem. Concr. Res. 5 (1975) 329-345.
[7] A. Leemann, B. Lothenbach, The influence of potassium–sodium ratio in cement on concrete expansion due to alkali-aggregate reaction, Cem. Concr. Res. 38 (2008) 1162-1168.
[8] G. Davies, R.E. Oberholster, Alkali-silica reaction products and their development, Cem. Concr. Res. 18 (1988) 621-635.
[9] T.C. Powers, H.H. Steinour, Interpretation of some published researches on alkali- aggregate reaction, American Concrete Institute -- Journal. 26 (1955) 785-812.
[10] L.S. Dent Glasser, N. Kataoka, On the role of calcium in the alkali-aggregate reaction, Cem. Concr. Res. 12 (1982) 321-331.
[11] H. Wang, J.E. Gillott, Mechanism of alkali-silica reaction and the significance of calcium hydroxide, Cem. Concr. Res. 21 (1991) 647-654.
[12] X. Hou, L.J. Struble, R.J. Kirkpatrick, Formation of ASR gel and the roles of C-S-H and portlandite, Cem. Concr. Res. 34 (2004) 1683-1696.
2
[13] T. Ichikawa, M. Miura, Modified model of alkali-silica reaction, Cem. Concr. Res. 37 (2007) 1291-1297.
[14] M. Prezzi, P.J.M. Monteiro, G. Sposito, Alkali-silica reaction, Part I: use of the double-layer theory to explain the behavior of reaction-product gels, ACI Mater. J. 94 (1997) 10-17.
[15] T. Knudsen, N. Thaulow, Quantitative microanalyses of alkali-silica gel in concrete, Cem. Concr. Res. 5 (1975) 443-454.
[16] P.R. Rangaraju, J. Olek, Potential for Acceleration of ASR in the Presence of Pavement Deicing Chemicals, IPRF. (2007).
[17] Guidelines for the Selection of Snow and Ice Control Materials to Mitigate Environmental Impacts, (2007).
[18] D.A. Kuemmel, Managing Roadway Snow and Ice Control Operations National Academy Press, Washington, D.C., 1994.
[19] M.J. Al-Hussaini, C.M. Sangha, B.A. Plunkett, P.J. Walden, The effect of chloride ion source on the free chloride ion percentages in OPC mortars, Cem. Concr. Res. 20 (1990) 739-745.
[20] M. Prezzi, P.J.M. Monteiro, G. Sposito, Alkali-silica reaction - Part 2: The effect of chemical admixtures, ACI Mater. J. 95 (1998) 3-10.
[21] H. Lee, R.D. Cody, A.M. Cody, P.G. Spry, Effect of various deicing chemicals on pavement concrete deterioration, Mid-Continent Transportation Symposium Proceedings.
[22] M. Kawamura, M. Ichise, Characteristics of alkali-silica reaction in the presence of sodium and calcium chloride, Cem. Concr. Res. 20 (1990) 757-766.
[23] M. Kawamura, S. Komatsu, Behavior of various ions in pore solution in NaCl- bearing mortar with and without reactive aggregate at early ages, Cem. Concr. Res. 27 (1997) 29-36.
[24] M.A. Bérubé, J.F. Dorion, J. Duchesne, B. Fournier, D. Vézina, Laboratory and field investigations of the influence of sodium chloride on alkali–silica reactivity, Cem. Concr. Res. 33 (2003) 77-84.
[25] S. Chatterji, Mechanism of the CaCl2 attack on portland cement concrete, Cem. Concr. Res. 8 (1978) 461-467.