58
All aboard! Insights into India's maritime community
| Date post: | 09-May-2015 |
| Category: |
Education |
| Upload: | kpmg-india |
| View: | 1,012 times |
| Download: | 4 times |
All aboard!
Insights into India's maritime community
TRANSPORT AND LOGISTICS
Water Transportation
in India
kpmg.com/in
Introduction
Water is a critical mode of transportation for any economy. Although it is a cost-effective and environment-friendly mode of transport, its share in the modal mix in India is significantly less than that in developed countries. Domestic shipping provides significant fuel and cost savings over road and rail transport and, thus, offers several opportunities to meet the demand for bulk transportation to nearby areas and along the coast, which is highly relevant for India. However, its low penetration in the country is a result of the long period it takes to transport goods, the unavailability of return cargo, lack of awareness of its benefits and various regulatory policies.
This document highlights the opportunities for water as a mode of transportation in India as well as its challenges, with an emphasis on coastal shipping and the inland water transport system.


Coastal shippingCoastal shipping plays a significant role in the development of domestic industry and trade due to its environment-friendly, cost-effective and fuel-efficient services. It is highly relevant for India, since the country has a long peninsular coastline. In recent years rising delays and costs due to high road and rail congestion has been driving companies to considered coastal shipping to transport their goods. However, India’s coastal shipping potential continous to be significantly underutilised when compared with other emerging and developed countries.
At 7 percent, the share of coastal shipping in India in overall cargo movement is low compared to that of the United States and some European and Asian countries. This can be largely attributed to insufficient infrastructure and the absence of favourable policies in India, which are driving the sector in developed countries. For instance, the European Union introduced the Marco Polo scheme, which is aimed at decongesting roads to incentivise shippers who shift cargo from roads to rail, short-sea shipping routes or inland waterways. The first phase of this initiative lasted from 2003–2007, and it is currently in its second phase.1
1 KPMG in India analysis

State governments in India are introducing schemes to promote coastal shipping. For instance, the Kerala Government has initiated a scheme to promote coastal shipping for cargo generated out of the
state. This is a step in the right direction and is likely to influence national policy on coastal shipping, which may lead to coastal shipping becoming an alternative transport mode in the long run.
Source: EXIM India, Marco Polo, CII Logistics, Reuters, KPMG in India Analysis
Comparison of coastal shipping penetration in the movement of domestic cargo (2012)

Coastal shipping case study : Kerala
Incentives
• Incentive of INR1 per tonne per km will be provided.
For example, if 1 tonne cargo is transported from the Jawaharlal Nehru Port Trust (JNPT) to Vizhinjam and the distance is 1,085 km, the incentive provided will be at the rate of INR1 per tonne per km moved along the coast of Kerala. In this case, this amount will be about INR540 per tonne.
• The state government has currently allocated INR0.03 billion toward the Coastal Shipping Promotion Fund (CSPF), which, when fully grown, will have a corpus of INR3 billion. Coastal vessels will enjoy discounts in port charges.
• Soft loans will be provided to purchase vessels at an interest rate of 2 percent for up to 40 percent of the vessel’s cost and at a rate of 10 percent for up to 80 percent of the vessel’s cost.
Proposed activities include the development of infrastructure at minor ports.
Objective
• The government has identified four types of cargo for coastal shipping — construction materials, food grains, LPG and vehicles. Kerala receives these from other states by road or rail. The government prefers to receive them via ships.
• The target is to divert at least 20 percent of the cargo currently moved by road to coastal shipping by 2015 and 40 percent by 2020.
• The operationalisation of CSPF depends on the constitution of the Kerala Maritime Board, which will be the implementing agency of the fund.
Beneficiaries
Service providers who operate ships.
Status
The scheme has been operational since March 2013.
Source : KPMG in India analysis
Source: CRISIL, Primary discussions, KPMG in India Analysis
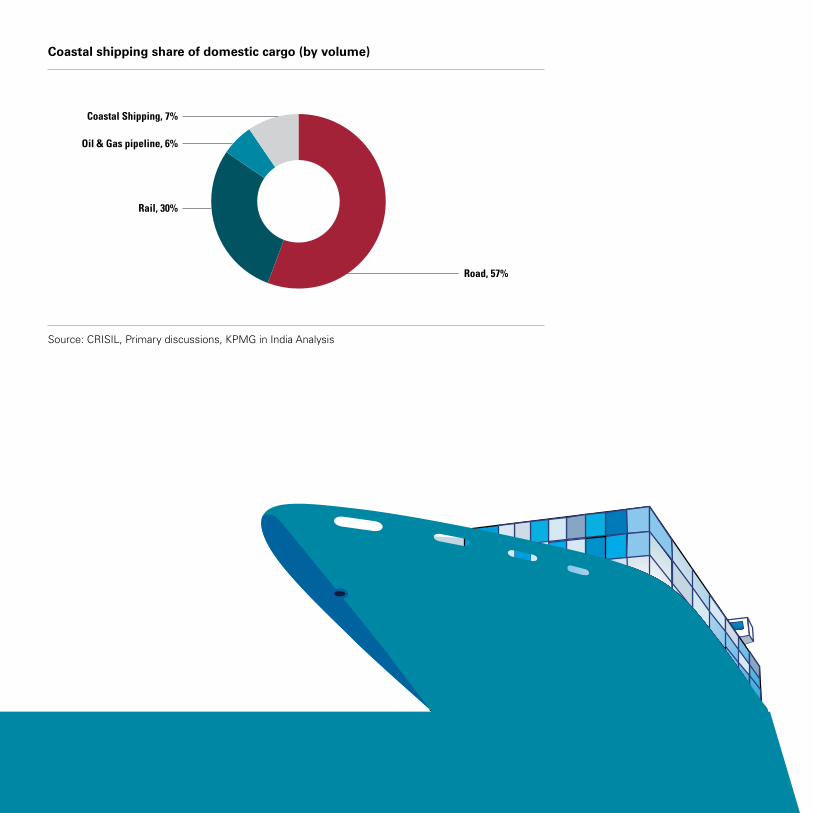
Coastal shipping share of domestic cargo (by volume)

The share of coastal shipping in the overall domestic cargo movement is significantly lower than that in road (57 percent) and rail (30 percent) due to the following reasons:
Source: KPMG in India analysis
Low cost of movement by rail and road
• The concessional freight that the railways provide on transporting large volumes of commodities to long distances gives tough competition to coastal shipping.
• Further, the subsidy provided on diesel reduces the overall cost of transporting goods by road. However, the government has recently decided to gradually revoke subsidy and raise diesel prices to actual market rates.
Absence of concessional finance for the acquisition of coastal vessels
• The absence of concessional and long-duration finance creates significant debt servicing burden on ship owners. This makes coastal freight uncompetitive vis-à-vis road and rail freight.
• The typical interest rate charged to coastal ship owners is between 12–14 percent annually for an average period of seven years. This financing structure mandates ship owners to pass on the effects of high financing cost to end-shippers.
High operating costs in coastal shipping
• High duties/taxes on bunker fuel increases operating costs, which, in turn, can potentially drive up freight costs and render coastal shipping uncompetitive vis-à-vis road and rail transportation.
• Further, the manning scale for coastal vessels is as high as it is for ocean vessels. This has a direct bearing on operating costs for coastal ship owners.
Inadequate facilities at ports for coastal vessels
• Long waiting times at major ports and the absence of dedicated berths for coastal shipping increase the cost of coastal vessels. Waiting time at major ports such as JNPT has been observed to be significantly high, which results in increased working capital requirement for coastal ship owners.
• Additionally, the absence of quality handling facilities at minor ports creates challenges for coastal vessel operators. Moreover, connectivity between the hinterland and minor ports is not as strong as it is for major ports.
The commodities that coastal shipping currently handles largely includes bulk and break bulk cargo. Transporting general cargo, which falls under the ‘others’ category, takes a long time through coastal shipping as compared to other modes. Moreover, limited awareness of return cargo and movement through containers and coastal shipping has contributed to low penetration levels.
However, there has been a marginal increase in this category in the last five years due to growth in containerised cargo — especially cargo such as marble, tiles, bentonite and soda ash — and an increase in the movement of project cargo through coastal shipping.

Coastal shipping is most suitable for bulk-solid and container cargo. However, their current movement through the coastal route is low. The following table illustrates the ideal mode of transportation for different types of cargo.
Note: Others include automobile, steel, containerized cargo, project logistics, and foodgrains
Source: CII Logistics, Primary discussions, KPMG in India analysis
Cargo mix on coastal shipping (by volume)
Source: Primary discussions, KPMG in India analysis
Cargo category and ideal mode of transportation

Economical modeThe cost of coast-to-coast transportation of goods by coastal shipping is about 21 percent of that of road transport and 42 percent of that of rail transport.
Lower fuel consumption per tonne of cargo
Fuel consumption by coastal shipping is 4.83gms/tkm, which is 15 percent of consumption by road and 54 percent of that by rail.
Significantly more envi-ronment-friendly
Carbon dioxide emission from rail transport is twice that from coastal shipping and six times that from road transport.
Low rate of fatalitiesRoad and rail movement result in a significant loss of lives in India. It is estimated that one life is lost in a road accident every 3.7 minutes in India.
Source: KPMG in India analysis
The development of coastal industries is expected to facilitate access to ports, which would, in turn, lead to the optimum utilisation of coastal shipping to transport raw material and finished goods. The following table presents potential routes to transport cargo through coastal shipping:
Commodity Key routes
Cement
Mundra – Cochin
Cuddapah - Krishnapatnam - Haldia- Burdwan
Cuddapah - Krishnapatnam - Cochin
Fertilisers
Kandla to Mangalore
Haldia to Vizag
Paradip to Chennai
It is important to promote coastal shipping as a preferred mode of transport over road or rail, especially along specific routes, because of its various advantages. The key benefits of transporting goods via coastal shipping vis-à-vis road and rail transportation include:

Commodity Key routes
Food grains
Panipat – Kandla – Mangalore
Panipat – Kandla – Kochi
Panipat – Kandla – Chennai
Guntur – Vizag - Haldia
SteelJamshedpur - Chennai
Rourkela - Chennai
MarbleUdaipur – Kochi
Udaipur – Chennai
Salt
Gandhidham – Kandla – Mangalore
Gandhidham – Kandla - Kochi
Tuticorin - Haldia
Tuticorin - Paradip
Sugar
Vellore – Chennai – Paradip – Bhubaneswar
Vellore – Chennai – Haldia – Kolkata
Belgaum - Mangalore – Kandla - Ahmedabad
Automobiles (# of cars)
Pune - Chennai
Pune – Kochi
Gurgaon - Kochi
TilesMorbi – Mundra - Chennai
Morbi – Mundra – Mangalore - Bangalore
Source: KPMG in India analysis
While coastal shipping of containerized cargo plays a relatively small role and is restricted to the transportation of tiles, marble, white goods and chemicals, there is an opportunity to transport agricultural goods — currently transported through bulk, break bulk or rail modes — through coastal shipping, especially along the west coast.
Coastal shipping seems to be an effective option to transport goods from the majority of ports on the west and east coasts. Some prominent coastal shipping routes include Chennai to Chittagong/ Yangon through Haldia/Kolkata, southbound cargo from Pipavav/Mundra to Kochi and other ports, and inland and coastal movement in and around Goa.

Inland water transportThe share of India’s inland water transport (IWT) cargo traffic to the logistics market is significantly lower at 0.5 as compared to China at 8.7 percent, the US at 8.3 percent and Europe at 7 percent. However, the Indian IWT landscape holds immense potential due to its characteristic advantages over other modes of transportation, especially for bulk movement.
India has about 14,500 km of navigable inland waterways, of which 5,200 km (36 percent) of major rivers and 485 km (3 percent) of canals are conducive to the movement of mechanised vessels. Among these navigable waterways, five National Waterways (NWs) — NWs 1, 2, 3, 4 and 5, spanning ap-proximately 4,400 km — have been outlined as potential inland waterways at the Ganges and Brahmaputra rivers, the West Coast Canal, the Godavari and Krishna rivers, and the East Coast Canal, respectively. NW 6, which stretches across 121 km, has been proposed on the Barak River.
Note : the aobve image is for indicative pupose only
Source: Inland Waterways Authority of India (IWAI), ‘Inland Water Transport – Potential for use in
movement of fertilizers’ report, 28 January 2010, http://iwai.gov.in/misc/PPTtoMinofFertilizers28110.pdf;
KPMG in India analysis
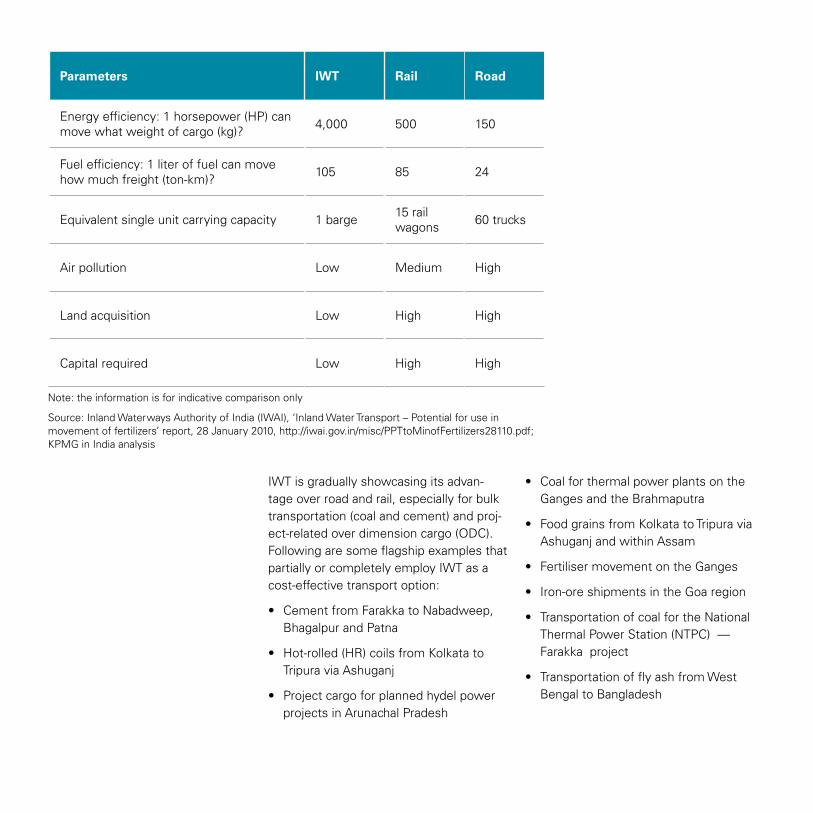
Parameters IWT Rail Road
Energy efficiency: 1 horsepower (HP) can move what weight of cargo (kg)? 4,000 500 150
Fuel efficiency: 1 liter of fuel can move how much freight (ton-km)? 105 85 24
Equivalent single unit carrying capacity 1 barge 15 rail wagons 60 trucks
Air pollution Low Medium High
Land acquisition Low High High
Capital required Low High High
Note: the information is for indicative comparison only
Source: Inland Waterways Authority of India (IWAI), ‘Inland Water Transport – Potential for use in movement of fertilizers’ report, 28 January 2010, http://iwai.gov.in/misc/PPTtoMinofFertilizers28110.pdf; KPMG in India analysis
IWT is gradually showcasing its advan-tage over road and rail, especially for bulk transportation (coal and cement) and proj-ect-related over dimension cargo (ODC). Following are some flagship examples that partially or completely employ IWT as a cost-effective transport option:
• Cement from Farakka to Nabadweep, Bhagalpur and Patna
• Hot-rolled (HR) coils from Kolkata to Tripura via Ashuganj
• Project cargo for planned hydel power projects in Arunachal Pradesh
• Coal for thermal power plants on the Ganges and the Brahmaputra
• Food grains from Kolkata to Tripura via Ashuganj and within Assam
• Fertiliser movement on the Ganges
• Iron-ore shipments in the Goa region
• Transportation of coal for the National Thermal Power Station (NTPC) — Farakka project
• Transportation of fly ash from West Bengal to Bangladesh

OutlookIndia’s water transportation remains largely untapped and underutilised despite its high-growth potential. However, this is likely to change as policymakers have recently shifted their focus toward developing infrastructure for this segment. For coastal shipping to realise its full potential, it is important that issues, such as the development of routes, capacity addition by port operators, and shipping lines and incentives for shippers and ship owners, are addressed. The Ministry of Shipping can foster the growth of the coast-al shipping segment by reducing port duties and developing coastal-specific non-major ports and supporting infrastructure.


TRANSPORT AND LOGISTICS
Container Freight Station and
Inland Container Depots
kpmg.com/in

Introduction
India’s GDP has grown progressively over the past two decades due to a combination of factors, including the export-import (EXIM) trade volume, which has been increasing at a higher rate than the GDP. This has driven growth in container traffic, as shippers are increasingly digressing from general or bulk shipping to container transport. Rising containerisation levels for erstwhile break-bulk commodities have increased India’s share in global container traffic.
Growth in containerised cargo traffic has facilitated the development of container freight stations (CFS) and inland container depots (ICDs), which have emerged as important components of the EXIM value chain. The CFS phenomenon, which is largely unique to India, plays an important role in decongesting container traffic at ports, adding value to container trade and enhancing ports’ operating efficiency. ICDs cater to the hinterland cargo traffic from
various clusters due to increased industrial growth over the past few years. Strong growth prospects and healthy profit margins continue to drive investments in the CFS and ICD segments.
This document aims to provide a comprehensive analysis of the container infrastructure market in India.


Container market in IndiaThe growth of Indian container traffic has outpaced global growth rates, thus increasing India’s share in global container trade. Container traffic in the country has grown at a CAGR of 15 per cent as compared to eight per cent globally, driving its share of global container traffic from 0.6 per cent in 1991 to 1.8 per cent in 2012.
At USD 8.3 trillion, China’s GDP is approximately 4.5
times that of India’s (by value). In comparison,
China’s container traffic is estimated at 140 million TEUs while that of India
is estimated at 10 million TEUs, reflecting a 14
times rise in container volumes
India: Container Traffic
Note: ‘Year’ stands for the financial year ending March
Source: Indiastat, IPA, KPMG Analysis

Containerisation levels in India have risen in the past due to the increased containerisation of commodities, such as electronics, textiles and automobiles. While there is significant potential to further increase overall containerisation in the country by strengthening presence in
agricultural commodities — such as rice, maize, and sugar, which are still transported in bulk — it is expected to grow further on the back of enhanced infrastructure in the form of ports, CFS and ICDs.
Source: IPA, Drewy, KPMG analysis
Global benchmarking of containerisation levels
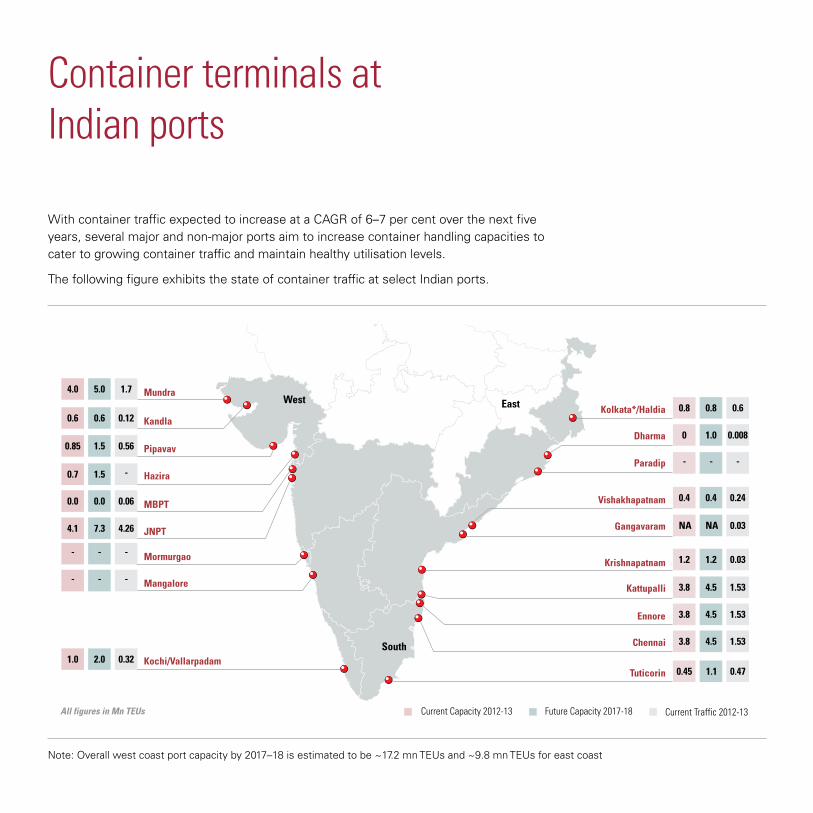
Container terminals at Indian ports
With container traffic expected to increase at a CAGR of 6–7 per cent over the next five years, several major and non-major ports aim to increase container handling capacities to cater to growing container traffic and maintain healthy utilisation levels.
The following figure exhibits the state of container traffic at select Indian ports.
Note: Overall west coast port capacity by 2017–18 is estimated to be ~17.2 mn TEUs and ~9.8 mn TEUs for east coast

Capacity utilisation at ports along the west coast is higher than the pan-India average. A comparison of utilisation across coast lines suggests that ports along the west coast are utilised more (~64 per cent) than
those along the south and east coasts (~44 per cent). Going forward, capacity addition and growth in traffic across ports are expected to translate into increased growth.
2012-13 2017-18
West 10.3 15.9
South 6.5 9.9
East 1.2 2.2
Total 18 28.0
Source: KPMG in India analysis

EXIM container supply chain in India
CFS and ICDs continue to be attractive segments and constitute a growing assets category in the EXIM supply chain due to heightened trade with emerging countries, improved technological capabilities, favourable policies and high profitability. Though CFS and ICDs collectively represent 13 per cent of the total market size, they account for about 26 per cent of total profitability.
Source: KPMG in India analysis
EXIM supply chain

Container freight station and inland container depot
The CFS/ICD market is integral to logistics sector infrastructure. ICDs are also known as dry ports, as they cater to hinterland container traffic. Estimated at INR45 billion in FY13, CFSs and ICDs generate about two-thirds of their revenues from ground
handling and transportation activities, while ground rent accounts for the rest. Imports contribute as much as 72 per cent of the total CFS/ICD market, with CFS accounting for about 67 per cent of import revenues.
Decreasing container volumes and dwell time, as well as rising competition, are expected to lead to a decline in the CFS/ICD market in FY14. However, the industry is projected to grow by 5–6 per cent (in
terms of value) and 9–10 per cent (in terms of volume) over the next five years, as the economy is expected to recover after FY14.
Figures for FY13; H&T refers to handling and transportation; rent is ground rent
Source: CRISIL Research
Total CFS/ISD Market (INR Billion)

Source: KPMG in India analysis
Traffic at CFS/ICDs
The following table provides a comparison between the CFS and ICD segments in terms of profitability and regulatory tailwind.
CFS ICD
Profitability • EBITDA margins: 25–50%• RoCE: ~20–30%• Average realisation per
TEU: INR5,500
• EBITDA: 20–40%• ROCE: 20–25%• Realisation per TEU:
INR4,500–8,000
Regulatory tailwind • Government intends to introduce direct port delivery, but there are some infrastructural constraints.
• CFS are currently not treated as an ‘infrastructure play’ — there are limited benefits for developers.
• Presently, CTO haulage charges are severely affecting domestic (DRH) volumes.
• Customs clearance efficiency is a key differentiator, which can be limiting at times.
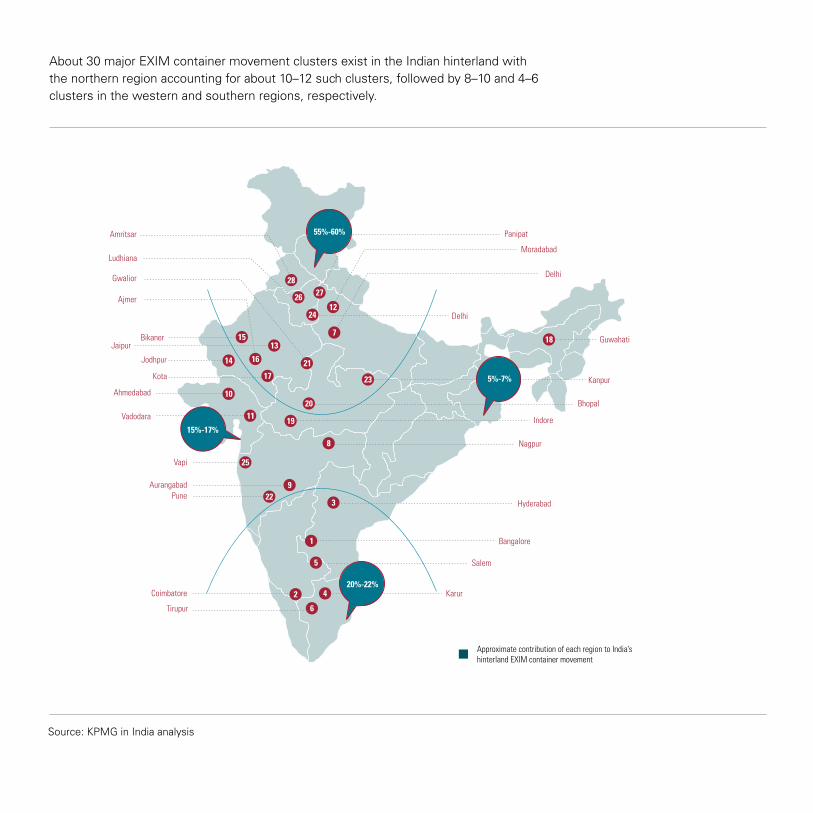
About 30 major EXIM container movement clusters exist in the Indian hinterland with the northern region accounting for about 10–12 such clusters, followed by 8–10 and 4–6 clusters in the western and southern regions, respectively.
Source: KPMG in India analysis

Mega trends• Growth: A strong correlation exists
between economic growth and the trade and logistics sector, which fosters port volume, including container volume.
• Dispersal: Warehousing facilities, which are closer to production, consumption and multi-modal hubs, are expected to increase. This is because traditional warehouses could face competition from modern warehousing assets and eventual extinction following the implementation of the new taxation regime Goods and Services Tax (GST).
• Scale: Container-oriented assets (ICDs, FTWZs) are expected to improve and increase with new planned assets of more than 50 acres in size unlike traditional players, which have a typical size of 20–30 acres. These operations are expected to receive further impetus following the heightened demand for low-cost superior services.
• Service reorientation: Next-generation assets will likely be accompanied by improved transportation, storage and value-added services (VAS). Shifts in container rail movement, road transportation, warehousing and value-added services are likely to accelerate further as container assets become increasingly complex.

Critical success factors
Source: KPMG in India analysis

Outlook
Growth of the container traffic movement in India largely depends on global economic conditions and rising containerisation. This association is likely to continue driving investment opportunities in the CFS/ICD segments. To sustain their growth, it is important for all CFS/ICD operators to enhance integration with other stakeholders within the EXIM supply chain for the seamless movement of container traffic, thereby enabling Indian ports to achieve superior operating standards. Moreover, increased investments from private players, along with intensified competition, is expected to encourage operators to develop innovative and customised solutions.


TRANSPORT AND LOGISTICS
Freight Forwarding
in India
kpmg.com/in

Introduction
India’s foreign trade, which grew at 18 percent from USD 86 billion in FY 2000 to USD 791 billion in FY13, has created growth opportunities in a variety of fields. Some of the trends that have emerged due to high growth in foreign trade include the emergence of Export-Import (EX-IM)-focused manufacturing and consumption locations within India, a shift in global trade patterns in Asia’s favour, and rapid change in the commodity mix. In addition to contributing to India’s economic growth, these trends have facilitated the evolution of the logistics sector. As a result of this increased international trade, freight forwarding has become an increasingly important component of the supply chain.
Freight forwarding companies in India have traditionally focused on activities such as freight arbitrage and customs house brokerage. However, the evolving requirements of end users, the enhanced use of technology, growth across key segments and the growing need for integrated services has driven this community to expand its services to end-to-end logistics solutions, including warehousing, distribution and other value-added services.
This report considers freight forwarding as ocean and air transportation and provides in-depth analysis of the sector in India.


Market sizeAt INR 494 billion (gross revenue basis), freight forwarding contributes eight percent to the total logistics revenues in India, as compared to other logistics services such as transportation (62 per cent) and warehousing (26 per cent). While the freight forwarding market in the Asia-Pacific region is expected to grow at a CAGR of 12 percent, it is expected to grow at 14 percent in India to reach INR741 billion by 2016.
Source: Ministry of Commerce, EIU, World Bank, KPMG in India analysis
Note: For FFW market, no custom house agent (CHA) revenues have been considered. Further, the import cargo market, where the business is controlled by a foreign agent, has not been considered
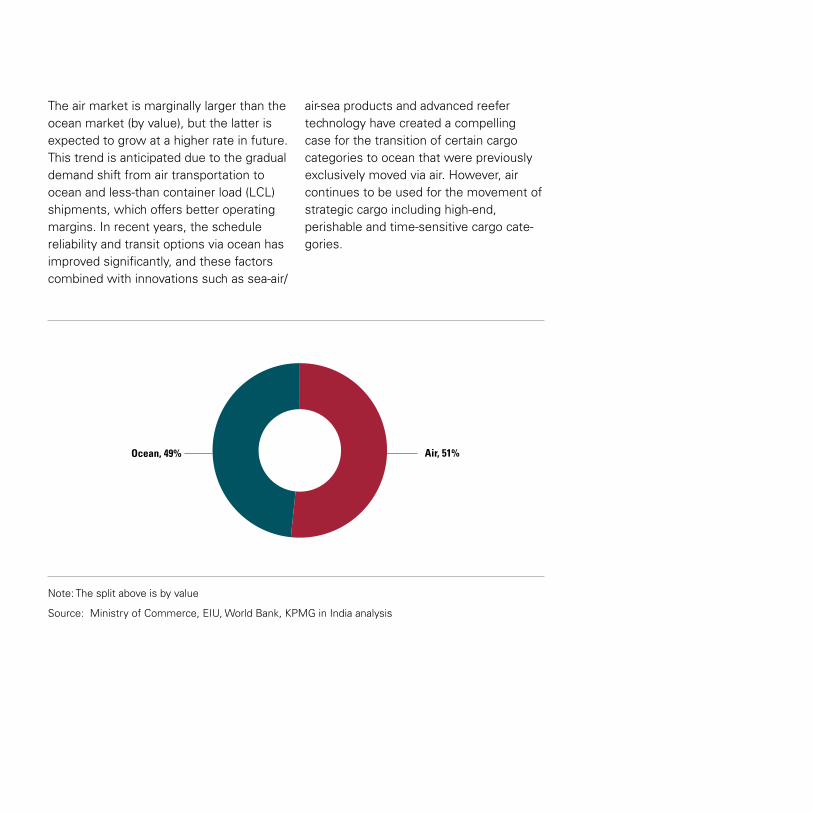
Note: The split above is by value
Source: Ministry of Commerce, EIU, World Bank, KPMG in India analysis
The air market is marginally larger than the ocean market (by value), but the latter is expected to grow at a higher rate in future. This trend is anticipated due to the gradual demand shift from air transportation to ocean and less-than container load (LCL) shipments, which offers better operating margins. In recent years, the schedule reliability and transit options via ocean has improved significantly, and these factors combined with innovations such as sea-air/
air-sea products and advanced reefer technology have created a compelling case for the transition of certain cargo categories to ocean that were previously exclusively moved via air. However, air continues to be used for the movement of strategic cargo including high-end, perishable and time-sensitive cargo cate-gories.
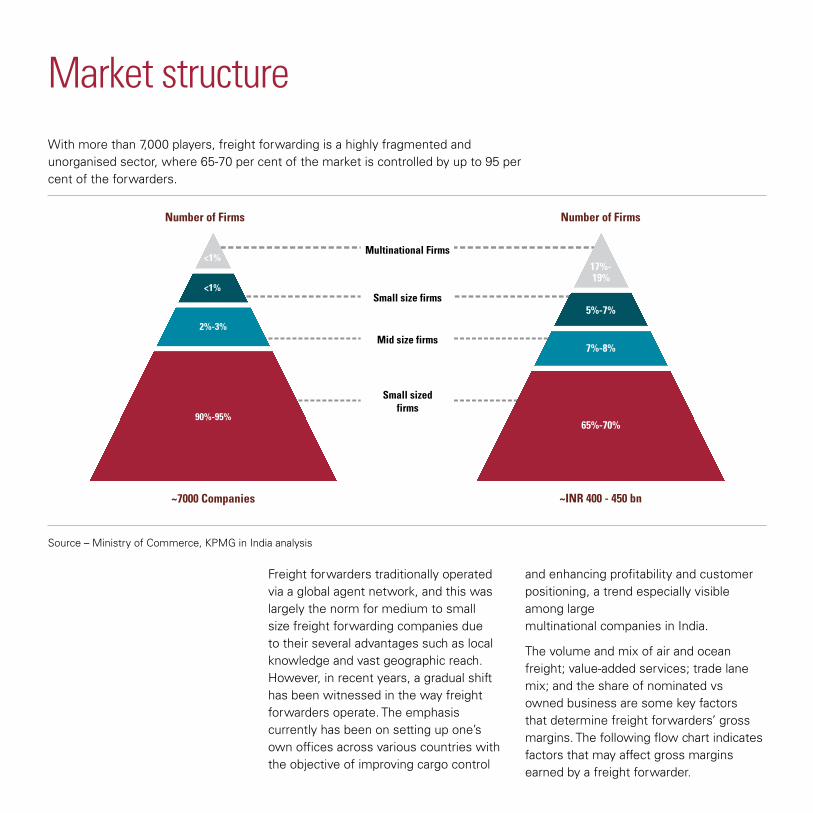
Market structureWith more than 7,000 players, freight forwarding is a highly fragmented and unorganised sector, where 65-70 per cent of the market is controlled by up to 95 per cent of the forwarders.
Source – Ministry of Commerce, KPMG in India analysis
Freight forwarders traditionally operated via a global agent network, and this was largely the norm for medium to small size freight forwarding companies due to their several advantages such as local knowledge and vast geographic reach. However, in recent years, a gradual shift has been witnessed in the way freight forwarders operate. The emphasis currently has been on setting up one’s own offices across various countries with the objective of improving cargo control
and enhancing profitability and customer positioning, a trend especially visible among large multinational companies in India.
The volume and mix of air and ocean freight; value-added services; trade lane mix; and the share of nominated vs owned business are some key factors that determine freight forwarders’ gross margins. The following flow chart indicates factors that may affect gross margins earned by a freight forwarder.

Source: Ministry of Commerce, KPMG in India analysis
Factors that affect gross margins

Trade lanes
In terms of future opportunity, Western Europe, the Middle East, North America and intra-Asia (including China) are high-potential markets, while Africa and Latin America are key emerging markets in terms of growth. Leading commodities traded with high potential markets include technology, chemicals and auto components, while commodities traded with high-growth markets primarily include medical aid products.
Source: Ministry of Commerce, KPMG in India analysis
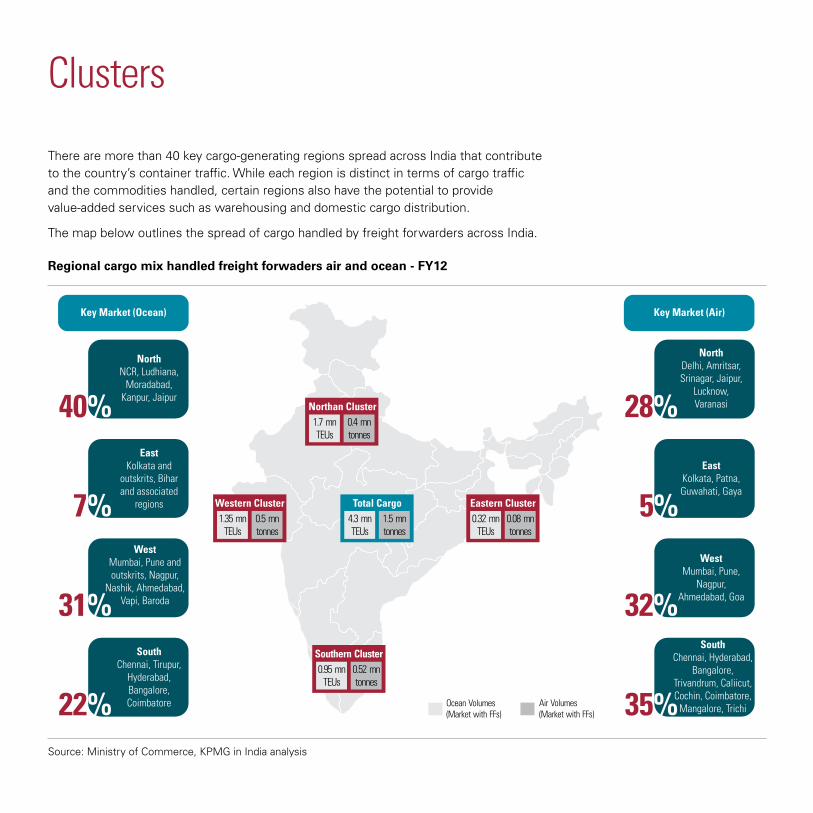
Clusters
There are more than 40 key cargo-generating regions spread across India that contribute to the country’s container traffic. While each region is distinct in terms of cargo traffic and the commodities handled, certain regions also have the potential to provide value-added services such as warehousing and domestic cargo distribution.
The map below outlines the spread of cargo handled by freight forwarders across India.
Source: Ministry of Commerce, KPMG in India analysis
Regional cargo mix handled freight forwaders air and ocean - FY12
Outlook
The growing demand for end-to-end logistics services has, over time, driven the freight forwarding community to evolve and expand into other segments such as value-added services and offer ancillary infrastructure services in container freight stations/inland container depots and warehouses. Players in this segment have seen considerable change in their operating models, gross margin pressures, a shift in global trade patterns and uncertainty around long-term freight rates; however, this segment has also seen significant innovation in product mix, an expansion of service offerings and overall volume growth, which present new avenues of growth to companies in this space.
In this context, IT is also expected to play an important role in the dynamic freight for-warding business, as it can be expected to facilitate the management of complex end-to-end services and cargo planning, as well as create a common platform to integrate all relevant stakeholders.

TRANSPORT AND LOGISTICS
Ports in
India
kpmg.com/in


Introduction
Ports serve as a country’s gateway to international trade, as they facilitate complex logistics activities centred on import-export activities as well as the domestic movement of cargo. Ports provide physical infrastructure not only for the storage and movement of industrial and agricultural cargo (including coal, ores, bulk, dry bulk and fertilizers), but also for various other activities such as the loading and unloading of cargo and obtaining clearances from authorities. To effectively manage certain evolving port activities — which involve optimum resource utilisation supported by accurate information — progressive technological practices are being deployed at the port and ccommunity-level.
Cargo handling at Indian ports has matured with time, with ports that were once designed to manage bulk and break bulk cargo now handle specialised cargo such as liquefied natural gas (LNG) and crude oil. A rise in India’s domestic consumption is expected to increase the number of high-capacity vessels at Indian ports, which would require deeper draft levels and mechanised cargo movement.
This paper aims to highlight the performance of cargo traffic at Indian ports and associated issues and opportunities.

OverviewIndian ports have witnessed considerable progress over the last decade, growing at a CAGR of 8.4 per cent from 384 MMT in FY02 to 934 MMT in FY13. Due to the global economic slowdown between FY08 and FY13, cargo traffic witnessed a temporary deceleration; however, cargo traffic across Indian ports is expected to register 1,212 MMT by FY17 at a CAGR of six per cent, with major and non-major ports expected to grow at CAGRs of five and nine per cent, respectively.1
Source: Indian Ports Association
1 KPMG in India analysis
Traffic handled by major and non-major ports

Share of major vs non-major ports
Source: KPMG in India analysis
The development of non-major ports due to growing private-sector participation has led to a shift of cargo traffic from major ports, that operate at above-optimum capacity, to non-major ports. Consequently, in FY13, the contribution of non-major ports to total cargo traffic increased from 28 per cent in FY08 to 42 per cent it is expected to further increase to 45 per cent in FY17.
Traditionally, major Indian ports have operated at above-optimum utilisation levels due to the uneven development of port infrastructure across the country. However, as the addition of handling capacity has gradually outpaced cargo traffic at ports, capacity utilisation at major ports has decreased; it declined from 98 per cent in FY08 to 73 per cent in FY13; this trend is expected to continue on the back of a ban on iron ore and global economic uncertainty.

Source: Ministry of Shipping, IBEF
Note: capacity as on 31 March 2013; traffic for FY13
Source: Indian Ports Association, CRISIL, KPMG in India analysis
Capacity utilisation at major ports
Utilisation at major ports, by commodity

The high rate of capacity addition due to private sector investments and moderate traffic growth due to a ban on iron ore adversely affected the capacity utilisation of non-major ports in FY13. Capacity utilisation in FY14 is expected to decline, but it is likely to recover to optimum levels in three to four years due to an increase in coal imports and container trade.
Capacity utilisation at non-major ports
Source: KPMG in India analysis, CRISIL, Indian Ports Association

State of Indian ports
Above-optimum capacity utilisation at Indian ports can be partly attributed to inefficient operational performance and resource utilisation (including equipment and labour handling). The following table provides a succinct comparison of Indian and international ports, highlighting significant scope of improvement in the country.
Parameters Indian ports International ports
Turnaround time at ports (hours)
84 Hong Kong and Singapore: 7
Average number of containers handled per ship per hour
15–23• Colombo: 25
• Singapore: 30
Draft depth (meters) 9–14 12–23
Annual container throughput capacity
JNPT: 4.3 million TEUs
• Singapore: 35 million TEUs
• Hong Kong: 23 million TEUs
Throughput density (maximum)
45,000 TEUs per hectare
170,000–220,000 TEUs per hectare
Maximum crane productivity – per quay crane per annum
NSICT: 188,000 TEUs• Hong Kong terminal:
272,700 TEUs
• Hamburg: 252,200 TEUs
Maximum quay productivity
JNPT: 2,000 TEUs per meter
Hong Kong terminal: 3,050 TEUs per meter
Source: KPMG in India analysis

Port operations in the Indian scenario
Ports operations in India lag behind international standards, especially in terms of adopting new technologies and practices, cargo handling, cargo evacuation, customs clearance, tracking, hinterland connectivity or innovative logistics practices. Some operational bottlenecks at Indian ports are highlighted below:
Source: KPMG in India analysis

Global ports benchmarking
Leading global ports largely conduct business electronically, with minimal manual intervention. Due to the dynamic nature of international trade, these ports have continuously evolved their processes and successfully simplified complex and cumbersome import procedures to meet evolving demand. Globalization and a highly competitive environment encourage international ports to ensure that their core function of seaport operations is productive and cost-effective and that the turnaround time of ships is short.
The following table provides a comparative analysis of the technological capabilities of Indian and some global ports:
Parameters Indian ports Rotterdam port Singapore port
Electronic data interface (EDI)
MinimalMature (including the payment process)
Mature (using Portnet)
Enterprise re-source planning (ERP) system
PartialMature (use an integrated ERP system, along with port community systems such as Portnet, Port Infolink, etc.)
Business rule and workflow processes
Manual Mechanised Mechanised
*The Rotterdam and Singapore ports have been considered for benchmarking with the world’s most advanced ports.
Source: KPMG in India analysis

Vision 2020
Under the Maritime Agenda 2020, public-private partnership (PPP) is expected to play an important role in the ports sector, particularly in the development of non-major ports — private investment is expected to contribute 66 per cent and 98 per cent of total investments in major and non-major ports, respectively. The development of new major ports on the east and west coast are expected to reduce the above-optimum capacity levels at existing ports.
Source: Maritime Agenda 2010–2020
The contribution of private sector
investments is expected to increase
significantly.
Sources of income for ports

Opportunities at ports along the east coast
Historically, ports along the west coast have dominated cargo traffic due to their proximity to India’s major consumption centres and the industrial belt of northwest India. China’s emergence as India’s leading trade partner, India’s ‘Look East’ policy and overcapacity at the west coast ports provide east coast ports with significant development opportunities.
As the contribution of east coast ports to India’s total trade is expected to increase from 23 per cent in 2010 to 34 per cent in 2014, the 50 ports along this coast are expected to drive the sector’s overall growth. The Government of India (GoI) aims to leverage the Maritime Agenda 2010–20 to create additional port capacity of 900 MMT and invest INR1,126 billion to boost cargo-handling
capacity at these ports. Non-major ports are expected to contribute 57 per cent of total investments in east coast ports and 46 per cent to total capacity addition.2
Source: Maritime Agenda 2010–20; KPMG in India analysis
Capacity and investment scenario at ports along the east coast
2 KPMG in India analysis

Ports along the east coast, which are closer to the iron ore/coal deposits and power, steel or fertilizer plants, have traditionally handled bulk commodities, as opposed to west coast ports, which mainly handle Petroleum, Oil and Lubricant (POL) and container cargo. Container handling capacity along the east coast ports in India is expected to increase from 2 million TEUs in 2009 (20 per cent of India’s total container-handling capacity) to 10.8 million TEU by 2020 (33 per cent of India’s total container-handling capacity).

Outlook
High investments, increased private-sector participation and stringent regulations are likely to drive the development of superior ports in India. Similarly, the development of hinterland connectivity options, enhanced IT support, improved manpower training and the introduction of advanced online transaction systems can be expected to drive operational efficiency at Indian ports.
The introduction of a single-window clearance mechanism at central and state-government levels can encourage greenfield projects, thereby reducing long gestation periods.
Thus, innovative solutions and a proactive approach are crucial if the Indian ports sector is to gain a competitive edge, especially as it is more vulnerable to competition from global players than from other infrastructure sub-sectors. With the GoI striving to eliminate infrastructural constraints, financial bottlenecks and administrative hurdles and implement positive measures, the outlook for the ports sector is seemingly positive.


TRANSPORT AND LOGISTICS
Ports in
India
kpmg.com/in
The information contained herein is of a general nature and is not intended to address the circumstances of any particular individual or entity. Although we endeavour to provide accurate and timely information, there can be no guarantee that such information is accurate as of the date it is received or that it will continue to be accurate in the future. No one should act on such information without appro-priate professional advice after a thorough examination of the particular situation. The views and opinions expressed herein as a part of the Survey are those of the survey respondents and do not necessarily represent the views and opinions of KPMG in India.
© 2014 KPMG, an Indian Registered Partnership and a member firm of the KPMG network of independent member firms affiliated with KPMG International Cooperative (“KPMG International”), a Swiss entity. All rights reserved.
The KPMG name, logo and “cutting through complexity“ are registered trademarks or trademarks of KPMG International.
Printed in India.
Latest insights and updates are now available on the KPMG India app. Scan the QR code below to download the app on your smart device.
Google Play | App Store
Contact us:
Dinesh KanabarDeputy CEO andChairman – Sales and Markets T: +91 22 3090 1661 E: [email protected]
Follow us on:
Twitter - @KPMGIndia
kpmg.com/in
Arvind MahajanHeadInfrastructure and Government Services T: +91 22 3090 1740 E: [email protected]
Prahlad TanwarAssociate DirectorTransport and Logistics T: +91 22 3091 3417 E: [email protected]


