Page 1
All About the Money:All About the Money:The State BudgetThe State Budget
One Voice: One Voice: A Collaborative for Health and Human ServicesA Collaborative for Health and Human Services
September 30, 2004September 30, 2004
Eva De Luna Castro, Budget Analyst Eva De Luna Castro, Budget Analyst ([email protected] )([email protected] )
900 Lydia Street - Austin, Texas 78702Phone (512) 320-0222 – fax (512) 320-0227 - www.cppp.org
Page 2
PRESENTATION OUTLINE:
What happened in 2003? Why it matters What lies ahead
Page 3
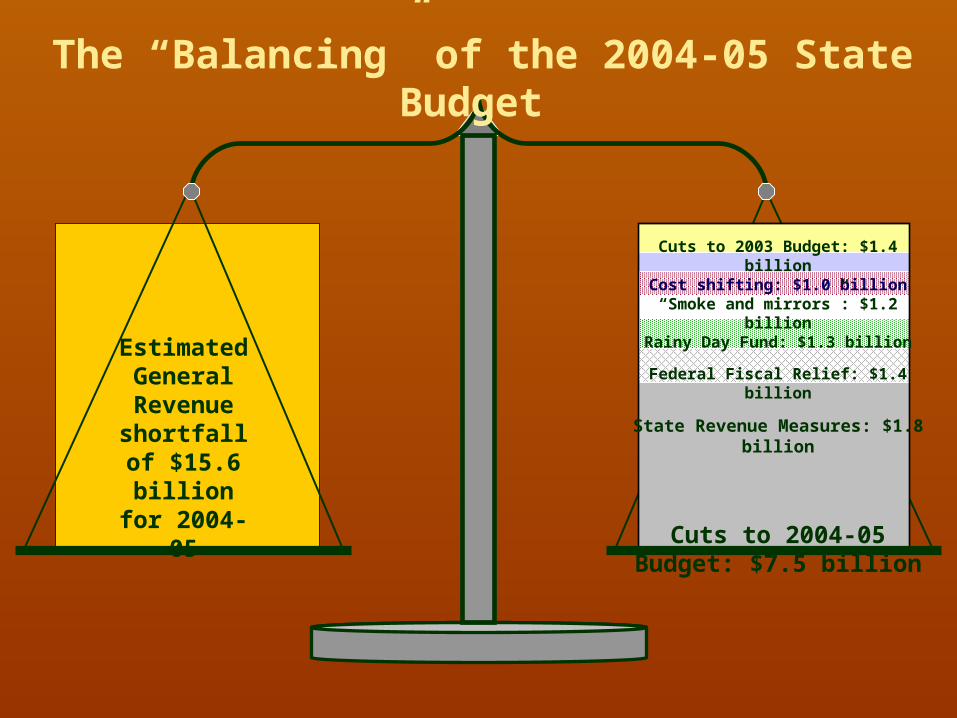
Estimated General Revenue
shortfall of $15.6 billion for 2004-05
The “Balancing” of the 2004-05 State Budget
Cuts to 2003 Budget: $1.4 billionCost shifting: $1.0 billion
“Smoke and mirrors”: $1.2 billionRainy Day Fund: $1.3 billion
Federal Fiscal Relief: $1.4 billion
State Revenue Measures: $1.8 billion
Cuts to 2004-05 Budget: $7.5 billion
Page 4
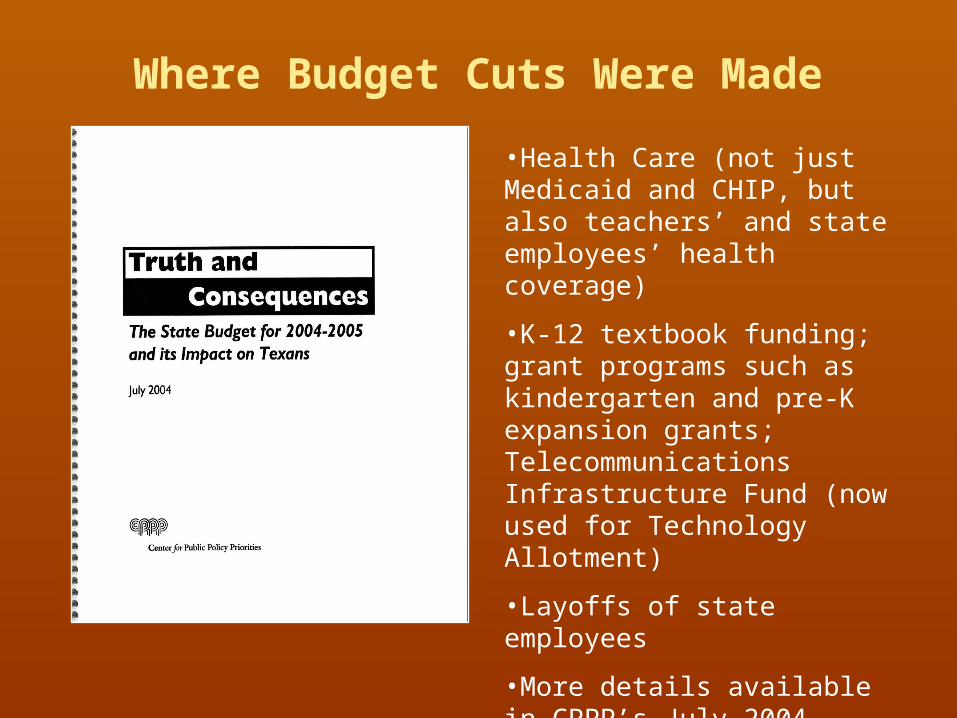
Where Budget Cuts Were Made
•Health Care (not just Medicaid and CHIP, but also teachers’ and state employees’ health coverage)
•K-12 textbook funding; grant programs such as kindergarten and pre-K expansion grants; Telecommunications Infrastructure Fund (now used for Technology Allotment)
•Layoffs of state employees
•More details available in CPPP’s July 2004 report, at http://www.cppp.org/products/reports/budget-impact04/index.html
Page 5
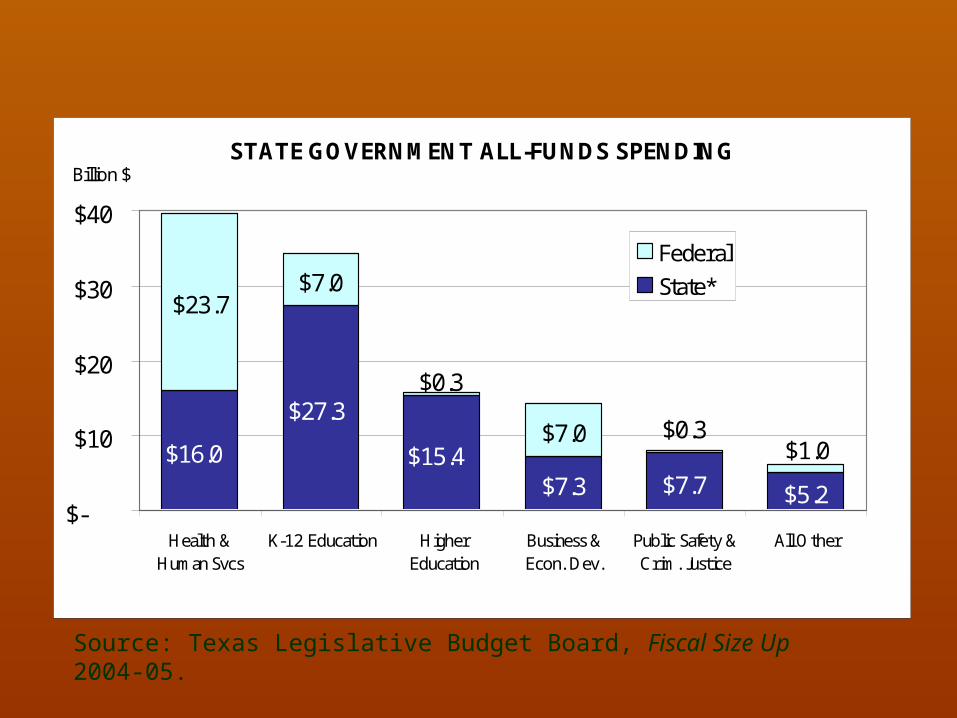
Source: Texas Legislative Budget Board, Fiscal Size Up 2004-05.
STATE GOVERNMENT ALL-FUNDS SPENDING
$7.3 $7.7 $5.2
$23.7$7.0
$7.0$27.3
$16.0 $15.4 $1.0$0.3
$0.3
$-
$10
$20
$30
$40
Health &Human Svcs
K-12 Education HigherEducation
Business &Econ. Dev.
Public Safety &Crim. Justice
All Other
Billion $
FederalState*
2004-2005 total: $118.2 billion
*"State" is General Revenue, General Revenue-dedicated, and Other Funds.
Page 6
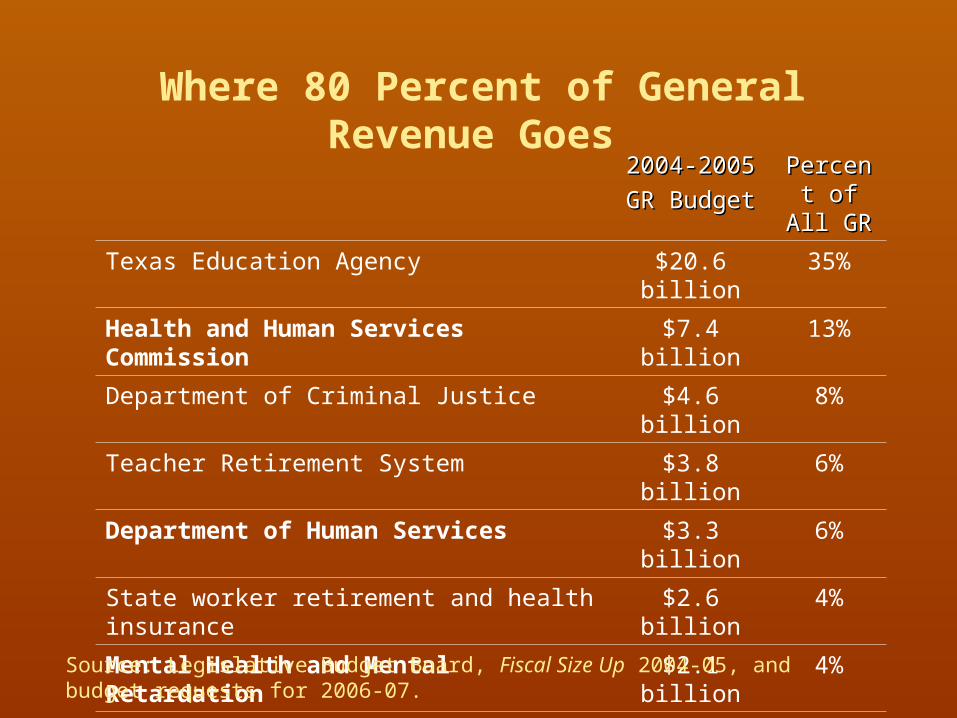
2004-2005 2004-2005
GR BudgetGR BudgetPercent Percent
of All of All GRGR
Texas Education Agency $20.6 billion
35%
Health and Human Services Commission
$7.4 billion 13%
Department of Criminal Justice $4.6 billion 8%
Teacher Retirement System $3.8 billion 6%
Department of Human Services $3.3 billion 6%
State worker retirement and health insurance
$2.6 billion 4%
Mental Health and Mental Retardation
$2.1 billion 4%
Higher Education Coordinating Board $667 million
1.1%
Family & Protective Services $478 million
0.8%
University of Texas at Austin $483 million
0.8%
Source: Legislative Budget Board, Fiscal Size Up 2004-05, and budget requests for 2006-07.
Where 80 Percent of General Revenue Goes
Page 7
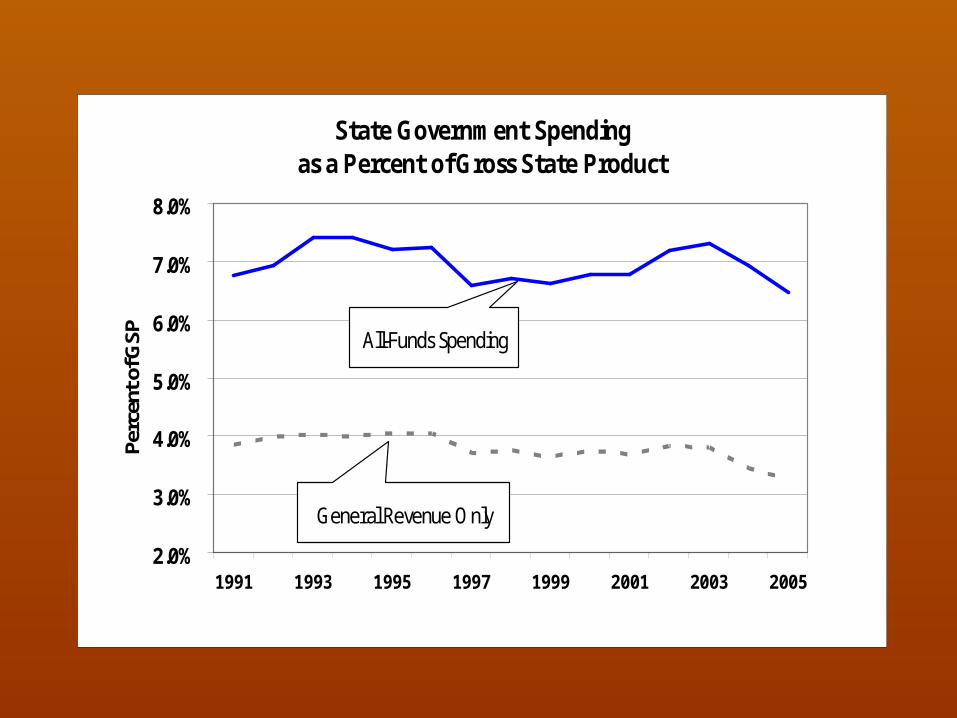
State Government Spending as a Percent of Gross State Product
2.0%
3.0%
4.0%
5.0%
6.0%
7.0%
8.0%
1991 1993 1995 1997 1999 2001 2003 2005
Perc
ent o
f GSP All-Funds Spending
General Revenue Only
Sources: Legislative Budget Board; Comptroller of Public Accounts; US Bureau of Economic Analysis
Page 8
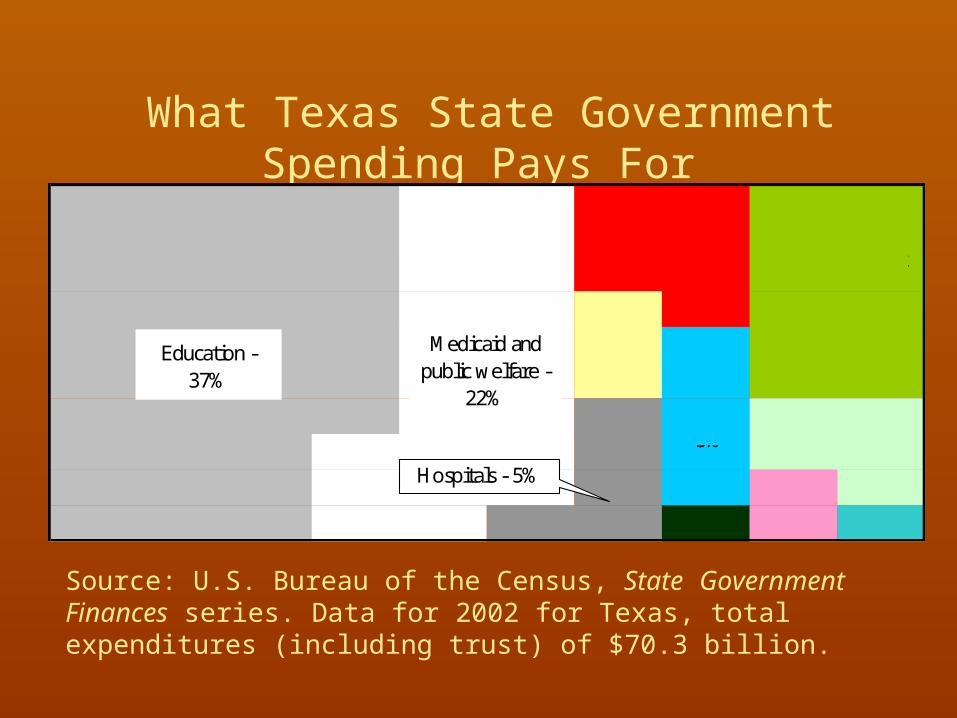
What Texas State Government Spending Pays For
Source: U.S. Bureau of the Census, State Government Finances series. Data for 2002 for Texas, total expenditures (including trust) of $70.3 billion.
Education - 37%
Medicaid and public welfare -
22%Police &
Corrections5%
Other/ inallocable - 5%
Gov. Admin.
2%Debt Svc. -
1%
Health-3%
Highways - 7%
Insurance Trust (Pensions, UI) -
12%
Natural Resources & Parks 1%
Hospitals - 5%
Page 9
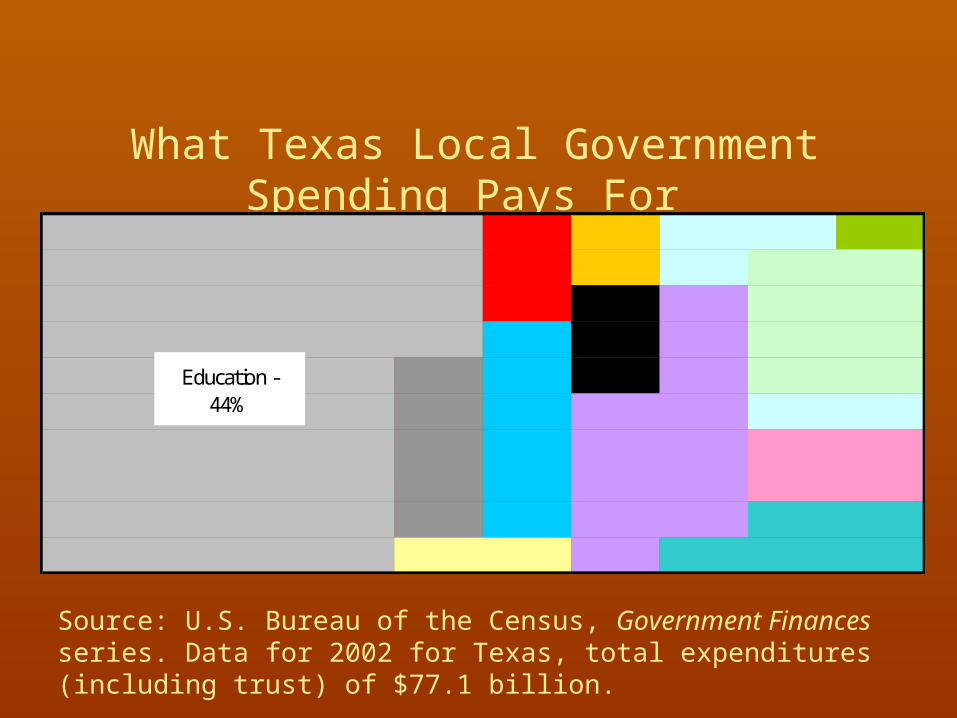
What Texas Local Government Spending Pays For
Source: U.S. Bureau of the Census, Government Finances series. Data for 2002 for Texas, total expenditures (including trust) of $77.1 billion.
Education - 44%
Other/ inallocable - 8%
Debt Svc. - 5%
Gov. Admin. - 4%
Utilities - 12%
Health - 2%
Hospitals - 5%
Streets & Hwys. 3%
Fire - 2%Insurance
Trust - 1%
Police & Corrections - 6%
Natural Resources & Parks 3%
Housing & Comm. Dev. - 2%
Sewerage & Solid Waste 3%
Page 10
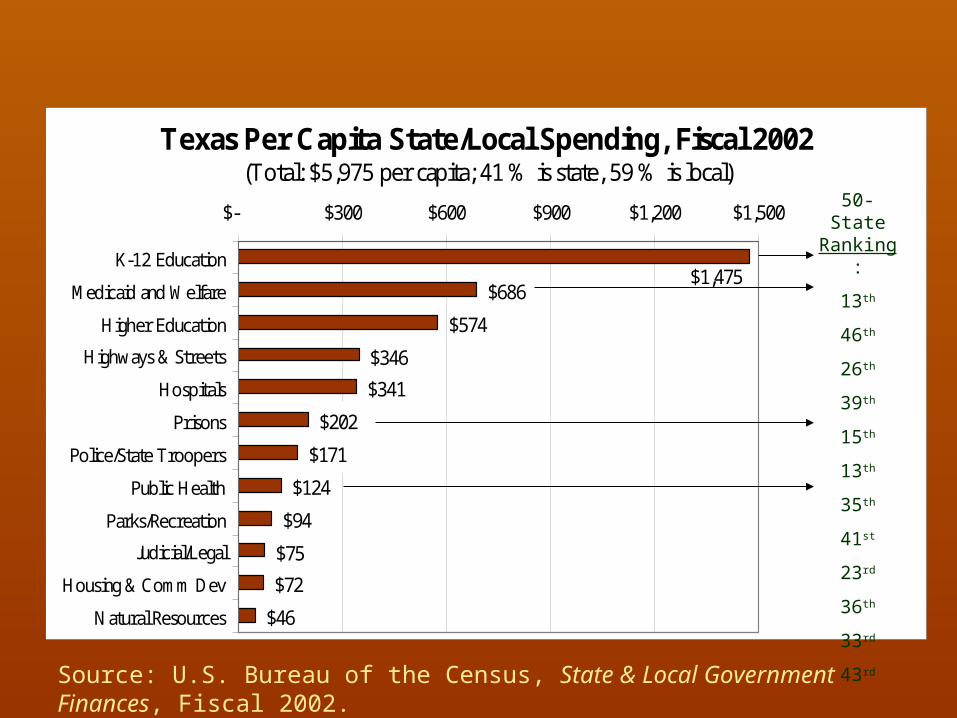
Texas Per Capita State/Local Spending, Fiscal 2002(Total: $5,975 per capita; 41 % is state, 59 % is local)
$686
$574
$346
$341
$124
$94
$75
$72
$46
$202
$171
$1,475
$- $300 $600 $900 $1,200 $1,500
K-12 Education
Medicaid and Welfare
Higher Education
Highways & Streets
Hospitals
Prisons
Police/State Troopers
Public Health
Parks/Recreation
Judicial/Legal
Housing & Comm Dev
Natural Resources
Source: U.S. Bureau of the Census, State & Local Government Finances, Fiscal 2002.
50-State Ranking:
13th
46th
26th
39th
15th
13th
35th
41st
23rd
36th
33rd
43rd
Page 11
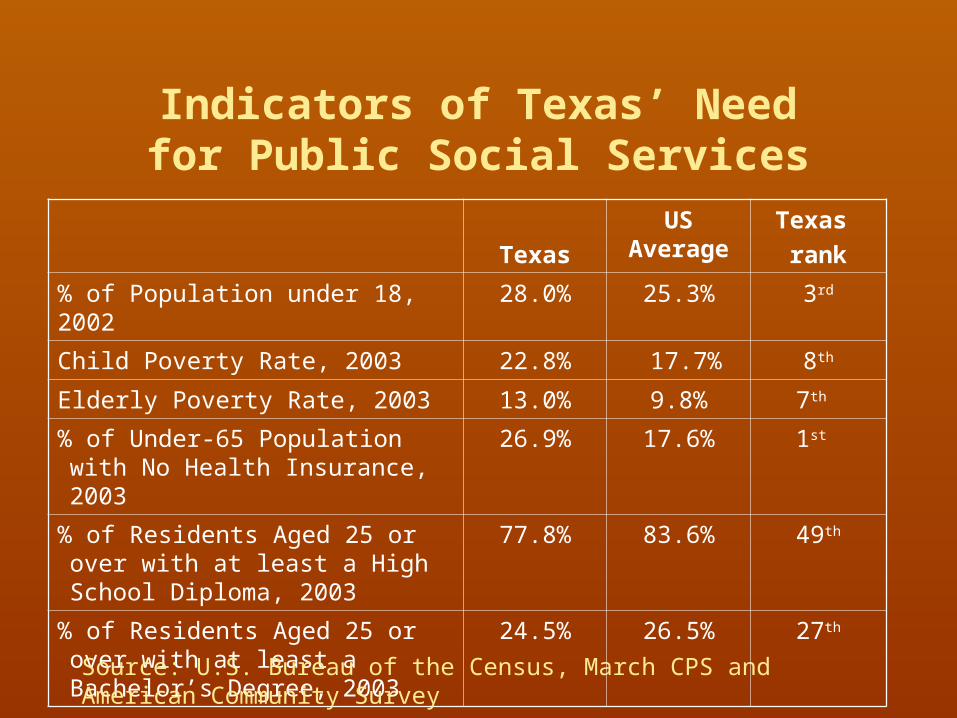
Indicators of Texas’ Need for Public Social Services
TexasUS
AverageTexas rank
% of Population under 18, 2002 28.0% 25.3% 3rd
Child Poverty Rate, 2003 22.8% 17.7% 8th
Elderly Poverty Rate, 2003 13.0% 9.8% 7th
% of Under-65 Population with No Health Insurance, 2003
26.9% 17.6% 1st
% of Residents Aged 25 or over with at least a High School Diploma, 2003
77.8% 83.6% 49th
% of Residents Aged 25 or over with at least a Bachelor’s Degree, 2003
24.5% 26.5% 27th
Source: U.S. Bureau of the Census, March CPS and American Community Survey
Page 12
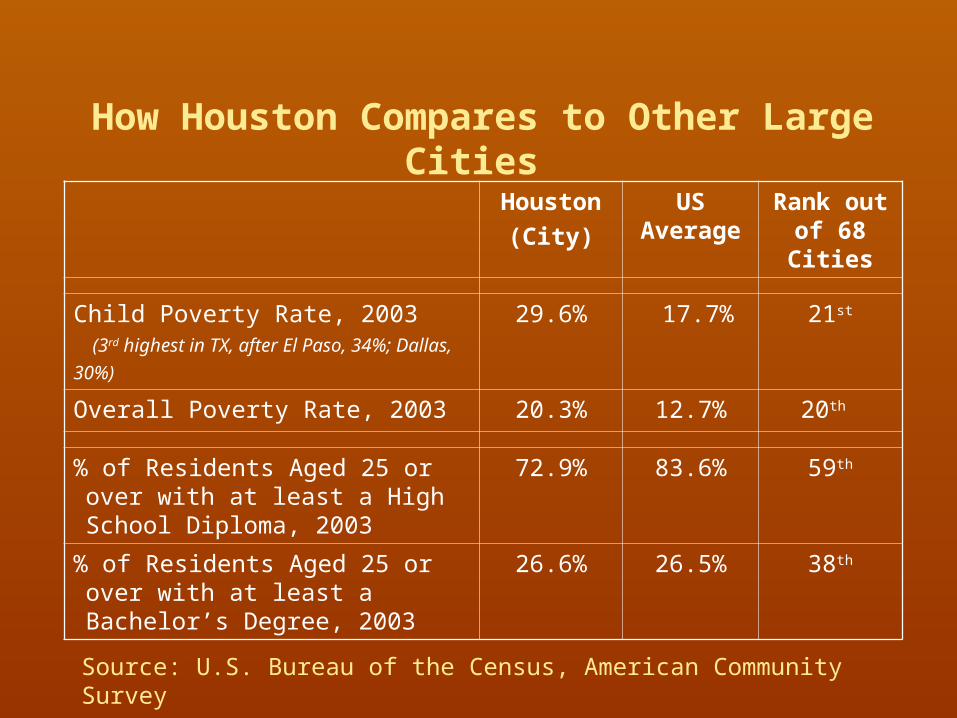
How Houston Compares to Other Large Cities
Houston(City)
US Average
Rank out of 68 Cities
Child Poverty Rate, 2003 (3rd highest in TX, after El Paso, 34%;
Dallas, 30%)
29.6% 17.7% 21st
Overall Poverty Rate, 2003 20.3% 12.7% 20th
% of Residents Aged 25 or over with at least a High School Diploma, 2003
72.9% 83.6% 59th
% of Residents Aged 25 or over with at least a Bachelor’s Degree, 2003
26.6% 26.5% 38th
Source: U.S. Bureau of the Census, American Community Survey
Page 13
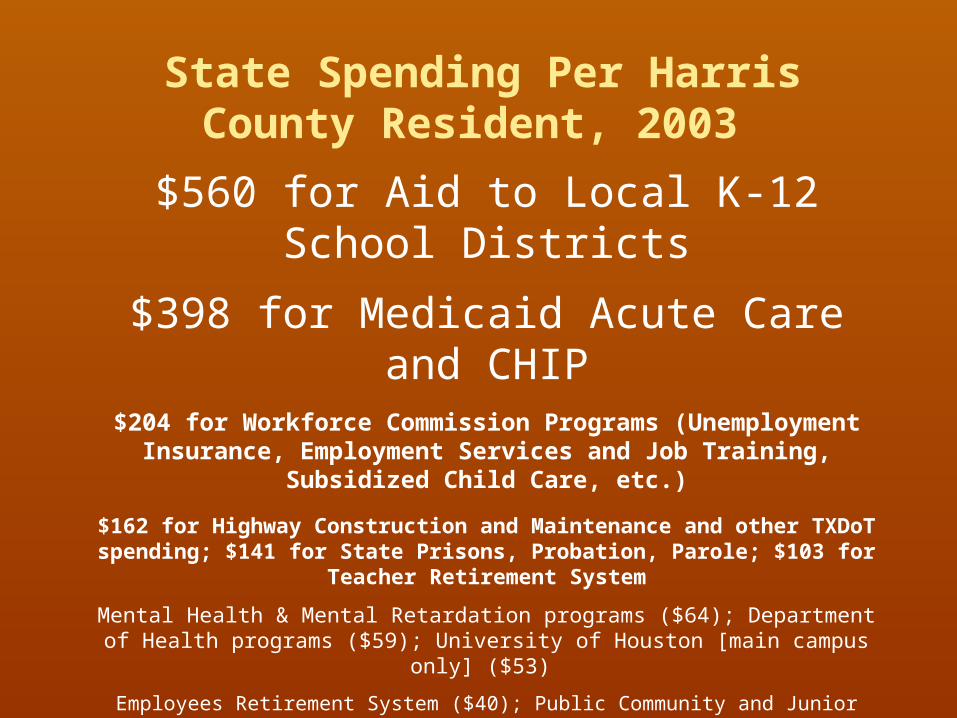
$560 for Aid to Local K-12 School Districts
$398 for Medicaid Acute Care and CHIP
$204 for Workforce Commission Programs (Unemployment Insurance, Employment Services and Job Training,
Subsidized Child Care, etc.)
$162 for Highway Construction and Maintenance and other TXDoT spending; $141 for State Prisons, Probation, Parole; $103
for Teacher Retirement System
Mental Health & Mental Retardation programs ($64); Department of Health programs ($59); University of Houston [main campus only] ($53)
Employees Retirement System ($40); Public Community and Junior Colleges ($39); Payments to Nursing Homes ($37); M.D. Anderson Cancer Center ($34);
Protective & Regulatory Services ($32); University of Texas Health Science Center at Houston ($32)
DHS Community Care programs ($18); Cash Assistance [TANF] ($10); Alcohol and Drug Abuse Commission ($7): Department on Aging ($3)
State Spending Per Harris County Resident, 2003
Page 14
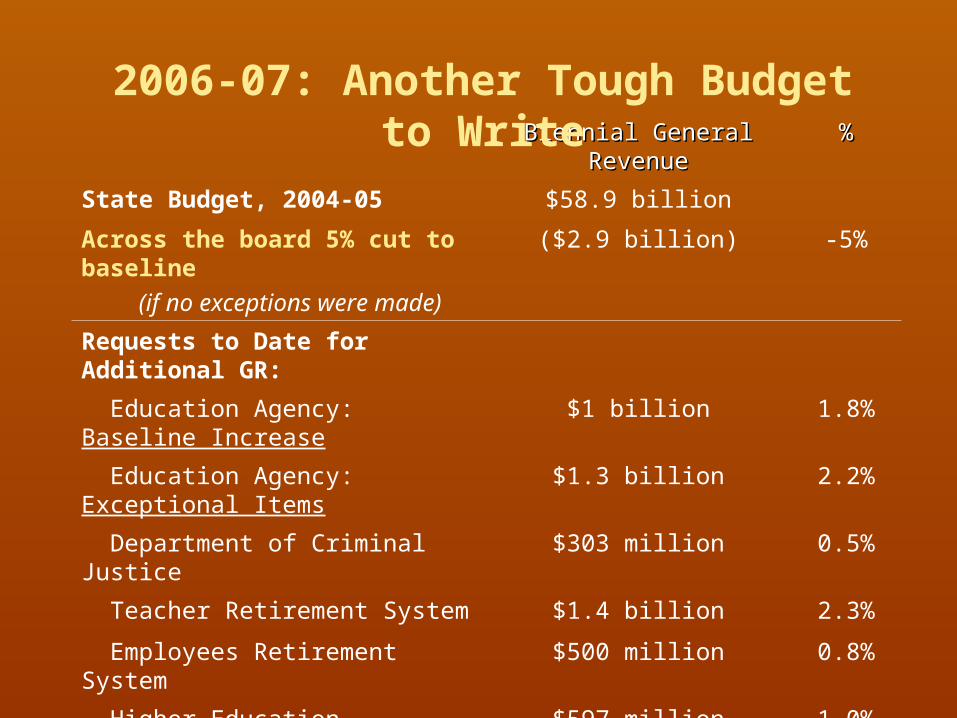
Biennial General Biennial General RevenueRevenue
%%
State Budget, 2004-05 $58.9 billion
Across the board 5% cut to baseline (if no exceptions were made)
($2.9 billion) -5%
Requests to Date for Additional GR:
Education Agency: Baseline Increase
$1 billion 1.8%
Education Agency: Exceptional Items
$1.3 billion 2.2%
Department of Criminal Justice $303 million 0.5%
Teacher Retirement System $1.4 billion 2.3%
Employees Retirement System $500 million 0.8%
Higher Education Coordinating Board
$597 million 1.0%
Family & Protective Services $200 million 0.3%
CHIP/Medicaid Shortfall for 2005
$320 million 0.5%
New GR Needed so far: $5.6 billion 9.5%
2006-07: Another Tough Budget to Write
Page 15
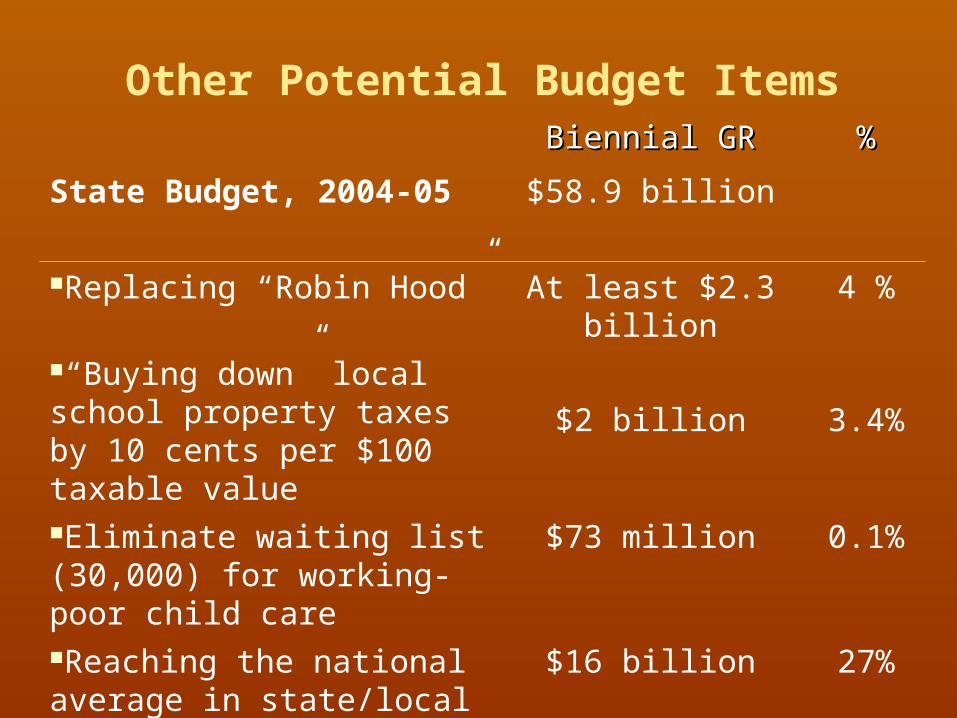
Biennial GRBiennial GR %%
State Budget, 2004-05 $58.9 billion
Replacing “Robin Hood” At least $2.3 billion
4 %
“Buying down” local school property taxes by 10 cents per $100 taxable value
$2 billion 3.4%
Eliminate waiting list (30,000) for working-poor child care
$73 million 0.1%
Reaching the national average in state/local spending from taxes
$16 billion 27%
Other Potential Budget Items
Page 16
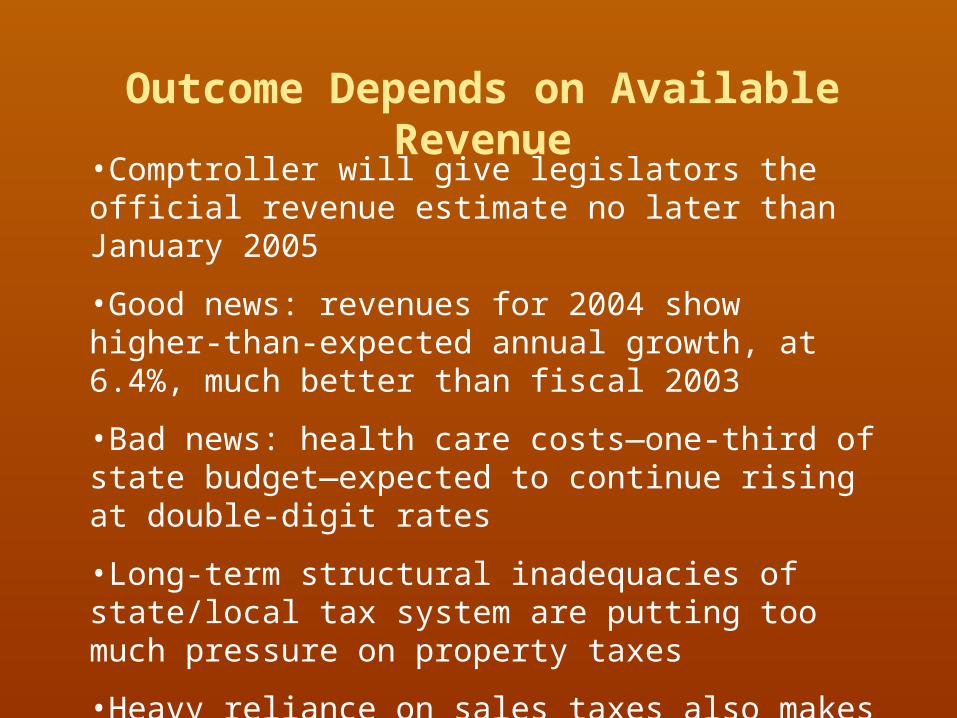
Outcome Depends on Available Revenue
•Comptroller will give legislators the official revenue estimate no later than January 2005
•Good news: revenues for 2004 show higher-than-expected annual growth, at 6.4%, much better than fiscal 2003
•Bad news: health care costs—one-third of state budget—expected to continue rising at double-digit rates
•Long-term structural inadequacies of state/local tax system are putting too much pressure on property taxes
•Heavy reliance on sales taxes also makes Texas tax system very regressive (taking more from families with the lowest incomes)
Page 17
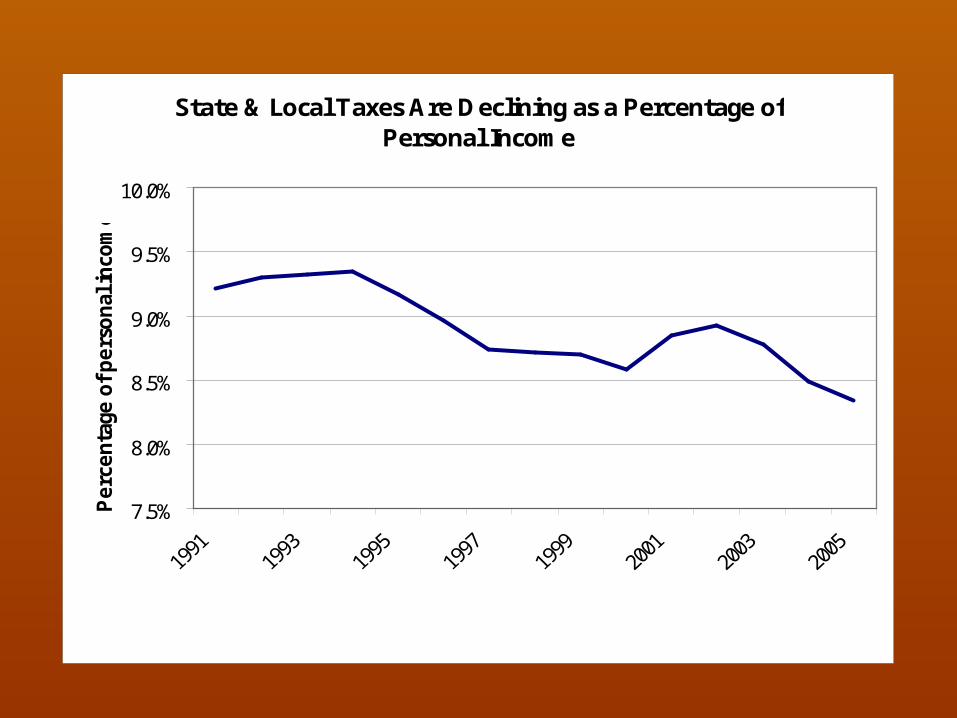
State & Local Taxes Are Declining as a Percentage of Personal Income
7.5%
8.0%
8.5%
9.0%
9.5%
10.0%
Perc
enta
ge o
f pers
onal
inco
me
Sources: Tax data from Comptroller's Office; Personal income data from Bureau of Economic Analysis
Page 18
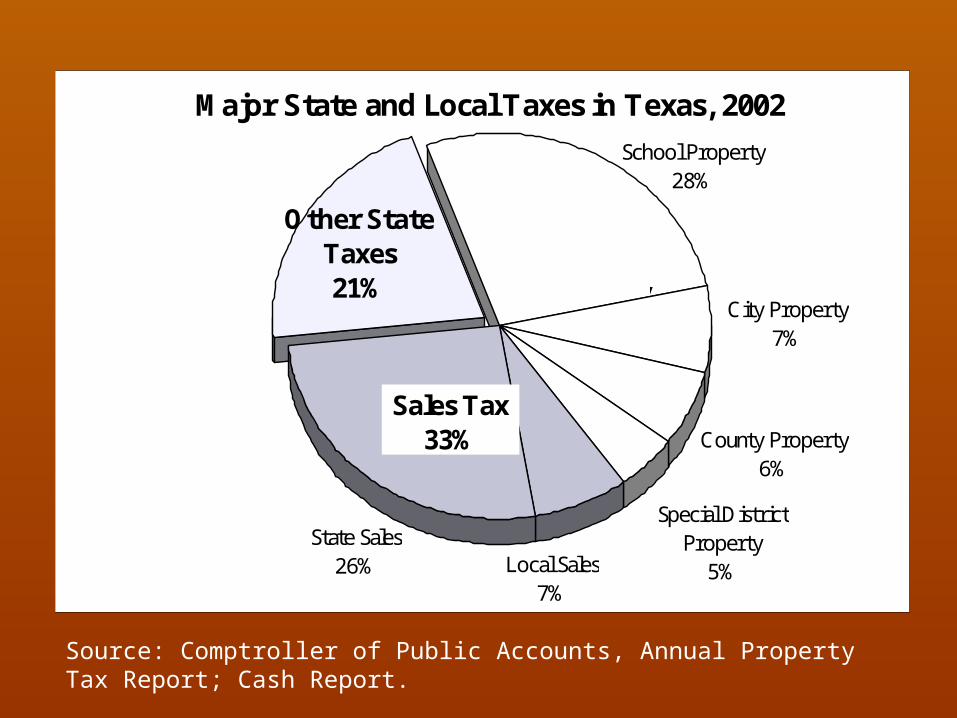
Major State and Local Taxes in Texas, 2002
County Property6%
Special District Property
5%
School Property28%
Other State Taxes21%
State Sales26%
City Property7%
Local Sales7%
Sales Tax 33%
Property Tax 46%
Source: Comptroller of Public Accounts, Annual Property Tax Report; Cash Report.
Page 19
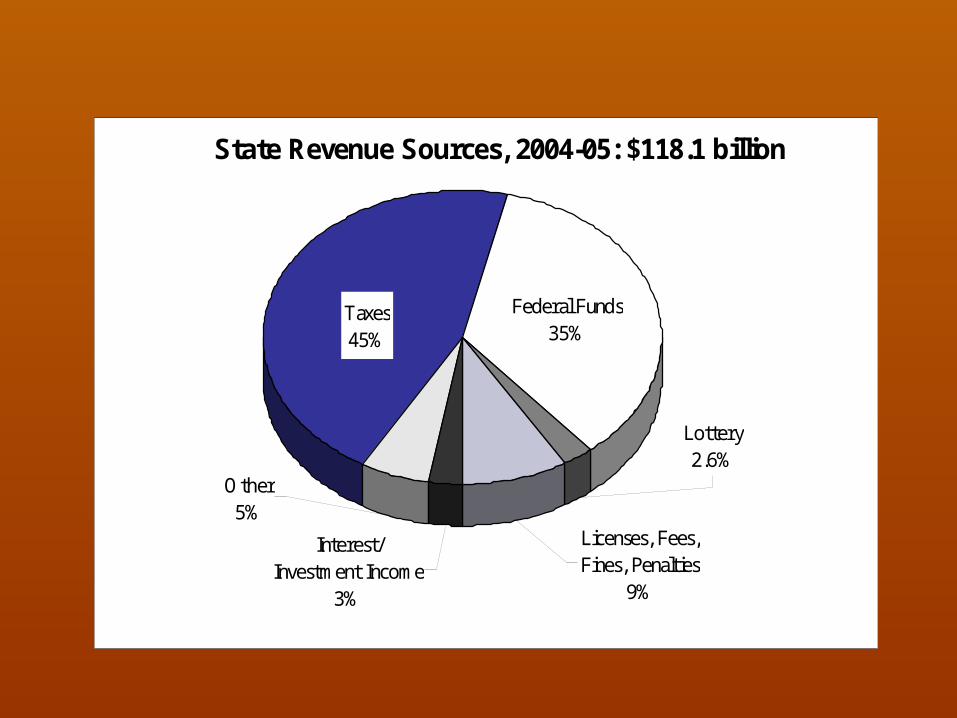
State Revenue Sources, 2004-05: $118.1 billion
Federal Funds35%
Other5%
Lottery2.6%
Taxes45%
Interest/Investment Income
3%
Licenses, Fees, Fines, Penalties
9%
SOURCE: Certification Revenue Estimate, December 2003
Page 20
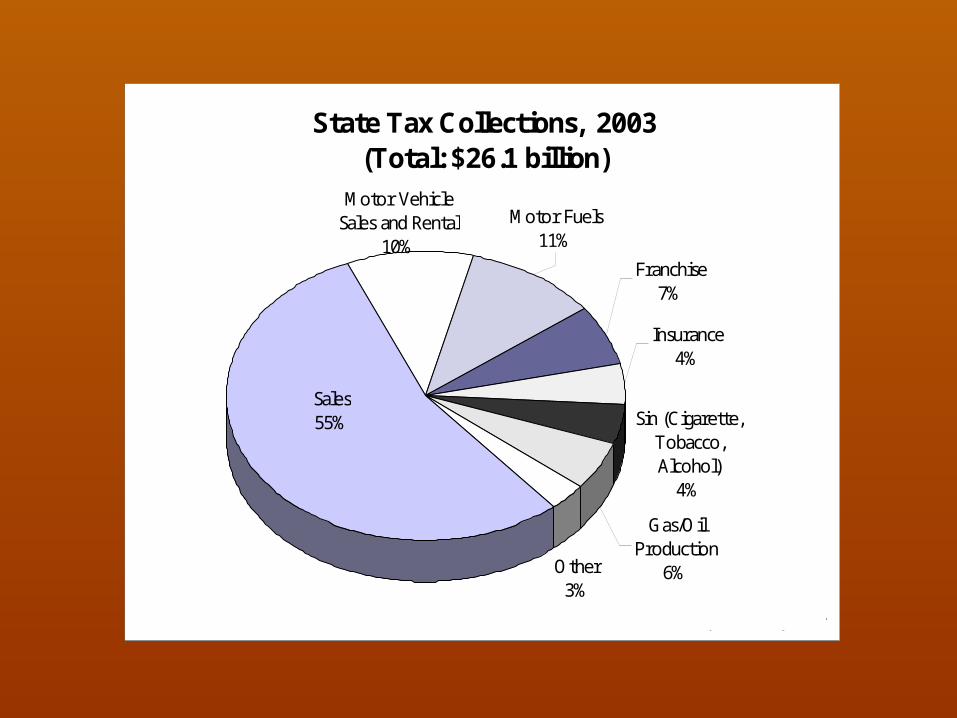
State Tax Collections, 2003(Total: $26.1 billion)
Gas/Oil Production
6%Other3%
Sin (Cigarette, Tobacco,Alcohol)
4%
Insurance4%
Franchise7%
Sales55%
Motor Vehicle Sales and Rental
10%
Motor Fuels11%
Source: 2003 Annual Cash Report, State of Texas
Page 21
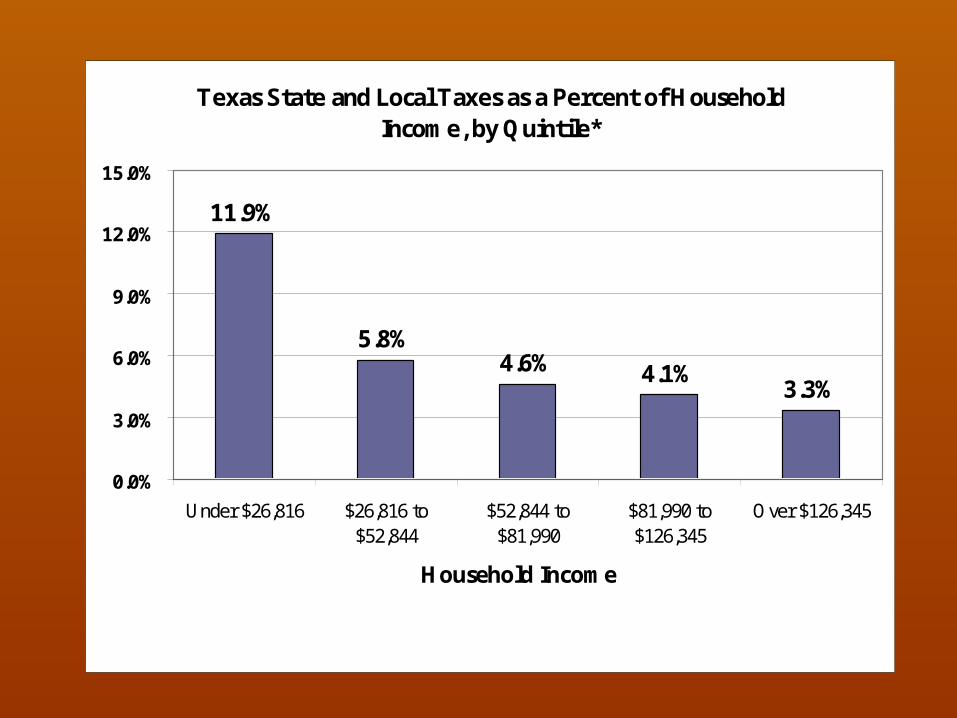
Texas State and Local Taxes as a Percent of Household Income, by Quintile*
11.9%
5.8%4.6% 4.1%
3.3%
0.0%
3.0%
6.0%
9.0%
12.0%
15.0%
Under $26,816 $26,816 to$52,844
$52,844 to$81,990
$81,990 to$126,345
Over $126,345
Household Income
* Each bar represents approximately 1.6 million households.Source: Comptroller of Public Accounts, Tax Exemptions and Tax Incidence