All models are wrong: reflections on becoming a systems scientist † John D. Sterman* Jay Wright Forrester Prize Lecture, 2002 John D. Sterman is the J. Spencer Standish Professor of Management and Director of the System Dynamics Group at the MIT Sloan School of Management. Abstract Thoughtful leaders increasingly recognize that we are not only failing to solve the persistent problems we face, but are in fact causing them. System dynamics is designed to help avoid such policy resistance and identify high-leverage policies for sustained improvement. What does it take to be an effective systems thinker, and to teach system dynamics fruitfully? Understanding complex systems requires mastery of concepts such as feedback, stocks and flows, time delays, and nonlinearity. Research shows that these concepts are highly counterintuitive and poorly understood. It also shows how they can be taught and learned. Doing so requires the use of formal models and simulations to test our mental models and develop our intuition about complex systems. Yet, though essential, these concepts and tools are not sufficient. Becoming an effective systems thinker also requires the rigorous and disciplined use of scientific inquiry skills so that we can uncover our hidden assumptions and biases. It requires respect and empathy for others and other viewpoints. Most important, and most difficult to learn, systems thinking requires understanding that all models are wrong and humility about the limitations of our knowledge. Such humility is essential in creating an environment in which we can learn about the complex systems in which we are embedded and work effectively to create the world we truly desire. The paper is based on the talk the author delivered at the 2002 International System Dynamics Conference upon presentation of the Jay W. Forrester Award. Copyright 2002 John Wiley & Sons, Ltd. Syst. Dyn. Rev. 18, 501–531, (2002) It’s humbling to be honored by one’s colleagues with the Jay W. Forrester Award. Thank you. I’m deeply appreciative. When John Morecroft called to tell me about the award, he reminded me that one of my responsibilities was to give a talk here at the conference. Then he said, ‘‘But please, you have to make it shorter than the book.’’ 1 This talk provides an opportunity to share some personal reflections on what I learned from the process of writing Business Dynamics, and from teaching system dynamics. Writing the book helped me become a better teacher, but I am keenly aware of how far short of my goals I fall in helping the students develop their systems thinking skills. And the students let me know it—one once told me I was a model professor. I thought this was high praise until I realized that a model is a small imitation of the real thing. Ł John D. Sterman, MIT Sloan School of Management, Room E53-351, 30 Wadsworth Street, Cambridge MA 02142, U.S.A; E-mail: [email protected]† I thank Brian Dangerfield, Tom Fiddaman and my colleagues at MIT, including Jim Hines, Nelson Repenning, Anjali Sastry, and Peter Senge, for comments and assistance; all opinions and errors are mine. System Dynamics Review Vol. 18, No. 4, (Winter 2002): 501–531 Received October 2002 DOI: 10.1002/sdr.261 Accepted October 2002 Copyright 2002 John Wiley & Sons, Ltd. 501
Transcript
All models are wrong: reflections onbecoming a systems scientist†
John D. Sterman*Jay Wright Forrester Prize Lecture, 2002
John D. Sterman isthe J. SpencerStandish Professor ofManagement andDirector of the SystemDynamics Group atthe MIT Sloan Schoolof Management.
Abstract
Thoughtful leaders increasingly recognize that we are not only failing to solve the persistentproblems we face, but are in fact causing them. System dynamics is designed to help avoid suchpolicy resistance and identify high-leverage policies for sustained improvement. What does ittake to be an effective systems thinker, and to teach system dynamics fruitfully? Understandingcomplex systems requires mastery of concepts such as feedback, stocks and flows, time delays,and nonlinearity. Research shows that these concepts are highly counterintuitive and poorlyunderstood. It also shows how they can be taught and learned. Doing so requires the use offormal models and simulations to test our mental models and develop our intuition about complexsystems. Yet, though essential, these concepts and tools are not sufficient. Becoming an effectivesystems thinker also requires the rigorous and disciplined use of scientific inquiry skills so thatwe can uncover our hidden assumptions and biases. It requires respect and empathy for othersand other viewpoints. Most important, and most difficult to learn, systems thinking requiresunderstanding that all models are wrong and humility about the limitations of our knowledge.Such humility is essential in creating an environment in which we can learn about the complexsystems in which we are embedded and work effectively to create the world we truly desire.The paper is based on the talk the author delivered at the 2002 International System DynamicsConference upon presentation of the Jay W. Forrester Award. Copyright 2002 John Wiley & Sons,Ltd.
Syst. Dyn. Rev. 18, 501–531, (2002)
It’s humbling to be honored by one’s colleagues with the Jay W. ForresterAward. Thank you. I’m deeply appreciative.
When John Morecroft called to tell me about the award, he reminded methat one of my responsibilities was to give a talk here at the conference.Then he said, ‘‘But please, you have to make it shorter than the book.’’1
This talk provides an opportunity to share some personal reflections onwhat I learned from the process of writing Business Dynamics, and fromteaching system dynamics. Writing the book helped me become a betterteacher, but I am keenly aware of how far short of my goals I fall in helpingthe students develop their systems thinking skills. And the students let meknow it—one once told me I was a model professor. I thought this washigh praise until I realized that a model is a small imitation of the realthing.
Ł John D. Sterman, MIT Sloan School of Management, Room E53-351, 30 Wadsworth Street, Cambridge MA02142, U.S.A; E-mail: [email protected]† I thank Brian Dangerfield, Tom Fiddaman and my colleagues at MIT, including Jim Hines, Nelson Repenning,Anjali Sastry, and Peter Senge, for comments and assistance; all opinions and errors are mine.
System Dynamics Review Vol. 18, No. 4, (Winter 2002): 501–531 Received October 2002DOI: 10.1002/sdr.261 Accepted October 2002Copyright 2002 John Wiley & Sons, Ltd.
501
502 System Dynamics Review Volume 18 Number 4 Winter 2002
It takes a village
They say it takes a village to raise a child (a systems perspective if ever therewas one). Well, it takes a worldwide community of systems thinkers to write atextbook. Business Dynamics benefited immensely from the advice, criticism,and encouragement of dozens of colleagues, students, and friends, many ofwhom are here today. It wouldn’t have been possible to write the book atall without being able to draw on the great work and report the successfulapplications of system dynamics you all have done. You may find it hard tobelieve, but it was a struggle to keep the book as short as it is. It’s a wonderfulsign of the breadth and vitality of our field that one can write a thousand-pagetextbook and still only scratch the surface.
I am especially grateful to my colleagues at MIT and in the system dynamicscommunity around the world who helped by providing data and examples,reviewing drafts, testing early versions in their courses, and in countless otherways. That list includes a great many of the people here today and many otherswho are not. So please excuse me if I can’t name you all individually.
Still, a few words of thanks are needed. Business Dynamics would notbe nearly as useful without the disc containing the more than 60 modelsdeveloped in the book, and the software to run them. All the models areincluded in iThink, Powersim, and Vensim formats. This was possible onlybecause High Performance Systems, Powersim Solutions, and Ventana Systemsgenerously provided versions of their wonderful software for free. I’m mostgrateful to these companies and their hardworking people. My editor, ScottIsenberg, and the other terrific people at McGraw-Hill were enthusiastic and,above all, understanding, as the number of pages kept growing. I also want torecognize the vital help of my students, who constantly challenge me to makethe discipline of system dynamics relevant, useful, and exciting. I can onlyhope they’ve learned as much from me as I’ve learned from them.
I owe an immeasurable debt of gratitude to my first system dynamics teachers,Dennis Meadows, the late Dana Meadows, and Jay Forrester. Besides the bestsystem dynamics training I can imagine, they led by example, with highstandards, integrity, and their passionate commitment. I feel blessed to havehad the opportunity to learn from them. Finally, and most importantly, I thankmy family. Though they couldn’t be here today, I wouldn’t be here without thelove and support of my wife Cindy and my children David and Sarah.
Systems thinking and modeling for a complex world
Let me turn now to some reflections on the experience of writing BusinessDynamics, of learning and teaching system dynamics for what is now 30 years.I’m sure I don’t know the best way. I’m still learning and hope I’m stillgetting better at it. Of course, there isn’t any one right or best way to teach
John D. Sterman: Reflections on becoming a systems scientist 503
system dynamics. There are many paths up the mountain. But not all pathsare equal—many lead not to the summit but straight into the swamp. I’ve beendown many of those.
Despite all these years of teaching and applying system dynamics, I stillhave trouble explaining it to people who ask me what I do. Is system dynamicsscience, engineering, or applied mathematics? Is it social science? Is it aphilosophy? Is it a form of consulting, a theory of action? Is it hard or soft?The difficulty in answering the question ‘‘what is system dynamics’’ arises notbecause we don’t know which of these things it is, but because it is all thesethings and more. The subtitle of Business Dynamics is Systems Thinking andModeling for a Complex World. The word ‘‘and’’ here is important. Systemdynamics is grounded in control theory and the modern theory of nonlineardynamics. There is an elegant and rigorous mathematical foundation for thetheory and models we develop. System dynamics is also a practical tool policymakers can use to help solve important problems. And system dynamics isalso a worldview, a paradigm in the sense of Thomas Kuhn. Like all powerfulparadigms, it shapes every aspect of the way I experience the world.
Such breadth creates a tension. Many scientists and academics are deeplyimmersed in their specialties and skeptical of vague claims about ‘‘complexity’’and ‘‘systems’’ studies that, they fear, lack rigor. Most managers have neverstudied science, nonlinear differential equations, or even calculus, or haveforgotten it if they did. And most people, regardless of their background,are comfortable with their current philosophy, if they give such matters anythought at all. To be useful, system dynamics must be accessible to the widestrange of scholars, students and policy makers, but without becoming a vagueset of qualitative tools and unreliable generalizations. To be effective, it isoften necessary to challenge some of our most deeply held beliefs, beliefs weoften don’t explicitly recognize. The resulting tension, the tension betweenqualitative systems thinking and formal modeling, between scientific rigor andthe need to make decisions today, between gaining acceptance by clients andchallenging dearly held beliefs, is compounded by the diversity of backgroundswithin the community of managers, students and scholars interested in systemdynamics, backgrounds ranging from people with no mathematics training tothose with doctorates in physics.
The obvious strategy to deal with these tensions is to segment the market:Write a technical book on modeling for those with technical backgrounds,and a more popular book stressing the systems worldview for those withnone; a treatise for the academic audience and a how-to book for practitioners.I rejected this strategy for several reasons. First, it has already been donevery well. On the systems thinking side, Peter Senge’s (1990) Fifth Disciplinepresents the concepts of system dynamics wonderfully, and places them in thecontext of learning and organizational change, all without any mathematics.On the technical side, there are many excellent treatises on the mathematics
504 System Dynamics Review Volume 18 Number 4 Winter 2002
of complex nonlinear systems, though most focus on physical and biologicalexamples (see, for example, Bar-Yam 1997, Mosekilde 1996, and Strogatz 1994).
But there is a more fundamental reason I rejected the segmentation strategy.The gulf between C.P. Snow’s famous ‘‘two cultures’’ is unfortunately widerthan when he first described it in 1959, while at the same time the need forbasic numeracy and scientific literacy has never been greater (Snow 1959/1993;see also Paulos 2001). As systems thinkers, we must constantly strive to breakdown the false barriers that divide us, whether they rise up between thefunctional silos in a corporation, between scientific specialties, between thesciences and the humanities, or between the scholar’s world of ideas and thepolicy maker’s world of action. I believe a book focusing only on the technicalside of system dynamics, or only on the qualitative, systems thinking side, onlyon theory or only on practice, only on business examples or only on publicpolicy examples, would be inconsistent with the spirit and goals of systemdynamics, would underestimate people’s interests and capabilities, and wouldnot provide readers with the resources they need to succeed in a world ofgrowing dynamism and interconnection.
Policy resistance
While it’s hard to define what system dynamics is, I don’t have any troubleanswering why it is valuable. As the world changes ever faster, thoughtfulleaders increasingly recognize that we are not only failing to solve thepersistent problems we face, but are in fact causing them. All too often,well-intentioned efforts to solve pressing problems create unanticipated ‘‘sideeffects.’’ Our decisions provoke reactions we did not foresee. Today’s solutionsbecome tomorrow’s problems. The result is policy resistance, the tendencyfor interventions to be defeated by the response of the system to theintervention itself. From California’s failed electricity reforms, to road buildingprograms that create suburban sprawl and actually increase traffic congestion,to pathogens that evolve resistance to antibiotics, our best efforts to solveproblems often make them worse.
At the root of this phenomenon lies the narrow, event-oriented, reductionistworldview most people live by. We have been trained to see the world as aseries of events, to view our situation as the result of forces outside ourselves,forces largely unpredictable and uncontrollable. The concept of unanticipatedevents and ‘‘side effects’’ I just mentioned provides a good illustration. Peoplefrequently talk about unexpected surprises and side effects as if they werea feature of reality. A doctor may say, ‘‘The patient was responding well totreatment, but died from unanticipated side effects.’’ Our political leadersblame recession on unanticipated shocks such as corporate fraud or terrorism.Managers blame any difficulty on events outside their firms and (they want usto believe) outside their control, as for example when Cisco Systems blamed
John D. Sterman: Reflections on becoming a systems scientist 505
their record $2.2 billion inventory writeoff and massive layoffs on ‘‘reducedcapital spending and the global macroeconomic environment, which resultedin the reduction in our workforce and inventory charges we announced.’’(Cisco Systems 2001 Annual Report). In fact, there is compelling evidencethat, like other firms in the high-tech/telecommunications sector, Cisco’s ownpolicies—from the design of its supply chain to pricing, production planning,and even the credit terms it offered customers—were central to the inflationand implosion of the great demand bubble (Goncalves 2002; Shi 2002).
There are no side effects—only effects. Those we thought of in advance,the ones we like, we call the main, or intended, effects, and take credit forthem. The ones we didn’t anticipate, the ones that came around and bit us inthe rear—those are the ‘‘side effects’’. When we point to outside shocks andside effects to excuse the failure of our policies, we think we are describing acapricious and unpredictable reality. In fact, we are highlighting the limitationsof our mental models. System dynamics helps us expand the boundaries ofour mental models so that we become aware of and take responsibility for thefeedbacks created by our decisions.
(Almost) nothing is exogenous
It is hard to underestimate the power of the feedback view. Indeed, almostnothing is exogenous. If you ask people to name processes that strongly affecthuman welfare but over which we have no control, many people name theweather, echoing Mark Twain’s famous quip that ‘‘Everybody talks about theweather, but nobody does anything about it.’’ But today even the weather isendogenous. We shape the weather around the globe, from global warming tourban heat islands, the Antarctic ozone hole to the ‘‘Asian brown cloud.’’2 Forthose who feel that global warming, ozone holes, and the brown cloud are toodistant to worry about, consider this: Human influence over the weather is nowso great that it extends even to the chance of rain on the weekend. Cerveny andBalling (1998) showed that there is a seven-day cycle in the concentration ofaerosol pollutants around the eastern seaboard of the United States. Pollutionfrom autos and industry builds up throughout the workweek, and dissipatesover the weekend. They further show that the probability of tropical cyclonesaround the eastern seaboard also varies with a seven-day cycle. Since there areno natural seven-day cycles, they suggest that the weekly forcing by pollutantaerosols affects cloud formation and hence the probability of rain. Their datashow that the chance of rain is highest on the weekend, while on average thenicest day is Monday, when few are free to enjoy the out of doors. Few peopleunderstand that driving that SUV to work helps spoil their weekend plans.
In similar fashion, we are unaware of the majority of the feedback effectsof our actions. Instead, we see most of our experience as a kind of weather:something that happens to us but over which we have no control. Failure to
506 System Dynamics Review Volume 18 Number 4 Winter 2002
recognize the feedbacks in which we are embedded, the way in which weshape the situation in which we find ourselves, leads to policy resistance aswe persistently react to the symptoms of difficulty, intervening at low leveragepoints and triggering delayed and distant, but powerful feedbacks. The problemintensifies, and we react by pulling those same policy levers with renewedvigor, at the least wasting our talents and energy, and all too often, triggeringan unrecognized vicious cycle that carries us farther and farther from ourgoals. Policy resistance breeds a sense of futility about our ability to make adifference, a creeping cynicism about the possibility of changing our world forthe better. One of the main challenges in teaching system dynamics is helpingpeople to see themselves as part of a larger system, one in which their actionsfeed back to shape the world in ways large and small, desired and undesired.The greater challenge is to do so in a way that empowers people rather thanreinforcing the belief that we are helpless, mere leaves tossed uncontrollablyby storm systems of inscrutable complexity and scope.
Bathtub dynamics
As important as feedback is, it is only one of the basic building blocks ofcomplex systems. Enhancing our capability to understand counterintuitivedynamics also requires understanding stocks and flows, time delays, andnonlinearities. Consider one of the most basic of these concepts: stocksand flows.
In Business Dynamics I devote two full chapters (6 and 7) to the conceptof stocks and flows, providing extensive examples and challenges designed tohelp people learn how to identify stocks and flows, map them, and understandtheir dynamics. Several reviewers of the manuscript complained that readersdid not need such a remedial treatment of elementary calculus. Many ofmy students at MIT similarly complain that the class time I devote to thismaterial is review. After all, they’ve all had calculus. Most have backgroundsin engineering, the sciences, economics, or mathematics, and many have priorgraduate degrees in these disciplines.
Why then include two chapters on stocks and flows, on graphical integration?Experimental studies show that most people do not have a good grasp of theseconcepts. Linda Booth Sweeney and I presented the students in my classeswith simple stock–flow structures and asked them to infer the behavior ofthe stock from information on the flows (Booth Sweeney and Sterman 2000;Sterman and Booth Sweeney 2002). Figure 1 shows an example in which youare shown simple patterns for the inflow and outflow to a single stock andasked to sketch the path for the quantity of water in the bathtub. The taskis among the simplest possible examples of stock-and-flow thinking. Thereare no feedback processes, no time delays, no nonlinearities. There is onlyone stock. The outflow is constant, and the inflow follows a simple pattern.
John D. Sterman: Reflections on becoming a systems scientist 507
Unfortunately, only 36 percent of the MIT graduate students given this taskanswered correctly, even with generous coding criteria. Many appear to use a‘‘pattern matching’’ heuristic, that is, assuming that the output of the system(the level of water in the tub) should follow the input (the sawtooth patternof the net flow), as the erroneous responses in Figure 2 illustrate. Patternmatching often leads to wildly erroneous inferences about system behavior,causes people to dramatically underestimate the inertia of systems, and leadsto incorrect policy conclusions. For example, a stock can rise even if theinflow is falling (obviously, when the inflow, though falling, remains above theoutflow). A nation’s debt grows even as it reduces its deficits. Of course, youmay say. Yet many people find such behavior highly counterintuitive. Whenasked, for example, about global climate change, most people don’t understandthat atmospheric concentrations of greenhouse gases, already higher than atany time in the past 400,000 years, would continue to rise even if emissionsfell to the rates called for in the Kyoto protocol—because current emissionrates are roughly double the rate at which greenhouse gases are removed fromthe atmosphere by natural processes, while Kyoto calls for much smaller cuts.Most people believe that stabilizing emissions near current rates will stabilizethe climate, when in fact stable emissions would guarantee continued increasesin atmospheric greenhouse gas concentrations and a further increase in netradiative forcing, leading to still more warming. These errors are widespreadeven when people are explicitly told that current emissions are roughly doublethe natural uptake rate (Sterman and Booth Sweeney 2002).
These dismal results have now been replicated with diverse populations,from Austrian university students (Kainz and Ossimitz 2002; Ossimitz 2002)to MBAs at the University of Chicago (Sterman and Booth Sweeney 2002) tosophomores at the California Institute of Technology.3 But are the results reallya failure of systems thinking? Perhaps the reason people do poorly on thesebathtub problems is not that they don’t understand stocks and flows, but thatthey can’t read graphs, or can’t do the arithmetic, or aren’t given enough time.So, inspired by a task developed by Gunther Ossimitz (2002), I developed aneven simpler challenge (Figure 3).
The task presents you with a graph showing, over 30 minutes, the rate atwhich people enter and leave a department store. You are asked four questions.The first two (when did the most people enter/leave the store?) test whetheryou can read the graph and know the difference between the number enteringand the number leaving.
The figures in italics show the correct answer and the fraction of 172 subjectsat the MIT Sloan School of Management responding correctly, along with thefraction who selected ‘‘Can’t be determined.’’ Answers were considered correctif they were within š1 of the correct response (e.g., 3, 4, or 5 for question 1).Half the subjects received the questions in the order shown; half received thetwo stock and flow questions (3 & 4) first. There were no significant differences
508 System Dynamics Review Volume 18 Number 4 Winter 2002
Fig. 1. A simple‘bathtub’ task (BoothSweeney andSterman 2000)
Consider the bathtub shown below. Water flows in at a certain rate, and exits through the drain atanother rate:
The graph below shows the hypothetical behavior of the inflow and outflow rates for thebathtub. From that information, draw the behavior of the quantity of water in the tub on thesecond graph below.
Assume the initial quantity in the tub (at time zero) is 100 liters.
0
25
50
75
100
0 2 4 6 8 10 12 14 16
Flo
ws
(lite
rs/m
inut
e)
Time (minutes)
0 2 4 6 8 10 12 14 16
Time (minutes)
Inflow
Outflow
0
50
100
150
200
Qua
ntity
in B
atht
ub(L
iters
)
in responses by question order; the results above aggregate the results of thetwo question order treatments.
Ninety-four percent of the MIT graduate students doing this task correctlyanswered these two questions.4 The third and fourth questions (when were themost/fewest people in the store?) test your understanding of stocks and flows.To determine when the most people were in the store one need only recognizethat the number in the store accumulates the flow of people entering less theflow of people leaving. Until minute 13 the number entering always exceeds
John D. Sterman: Reflections on becoming a systems scientist 509
the number leaving, so the number in the store grows, while from minute 14on, the number leaving exceeds the number entering, so the number of peoplein the store falls. The most people are in the store where the two curves cross.Only 42 percent correctly answered this question, and 17 percent indicated thatthe answer could not be determined from the information provided. Becausethe number in the store rises through minute 13 and falls thereafter, the fewestpeople are in the store either at the beginning or at the end. To determinewhich, you must judge whether more people enter up to minute 13 than leaveafterwards, that is, whether the area between the rate of entering and rate ofleaving up to minute 13 is greater or smaller than the area between the twocurves from minute 14 on. Inspection of the graph readily reveals that the areabetween the curves from minute 14 on is larger than the area between thecurves through minute 13 (in fact it is twice as large). More people left afterminute 13 than were added up to that point. The fewest people are thereforein the store at minute 30. Only 30 percent correctly answered this question.
510 System Dynamics Review Volume 18 Number 4 Winter 2002
Fig. 3. The departmentstore task The graph below shows the number of people entering and leaving a department store
over a 30 minute period.
0
5
10
15
20
25
30
35
40
0 2 4 6 8 10 12 14 16 18 20 22 24 26 28 30
Peo
ple
/Min
ute
Minute
Entering Leaving
Please answer the following questions.
Check the box if the answer cannot be determined from the information provided.
1. During which minute did the most people enter the store?
Minute _______4 (94%) Can’t be determined (0%))
2. During which minute did the most people leave the store?
Minute _______21 (94%) Can’t be determined (0%)
3. During which minute were the most people in the store?
Minute _______13 (42%) Can’t be determined (17%)
4. During which minute were the fewest people in the store?
Minute _______30 (30%) Can’t be determined (28%)
Fully 28 percent indicated that the question could not be answered, includingone subject who wrote:
Can’t be determined^ by me.
Note that determining when the most people are in the store does not requireany calculation—one need only understand that a stock rises when its inflowexceeds its outflow and falls when outflow exceeds inflow, then note wherethe two curves cross. Determining when the fewest are in the store does requirea qualitative judgment of whether the area between the curves is largest beforeor after minute 13, but people have no trouble determining which area is largerwhen asked. The problem, at least among these highly educated subjects, is notthe inability to read graphs, but difficulty with the concept of accumulation,with stocks and flows.
I now ask students to try these simple bathtub tasks before we introduce theconcept of stocks and flows. The purpose is not to embarrass, but rather to
John D. Sterman: Reflections on becoming a systems scientist 511
motivate them to build their intuitive understanding of these critical concepts.Most see that, far from being a waste of time, they can gain significant insightinto dynamics by developing their ability to identify, map, and understand thebehavior of stocks and flows, even if they have a strong technical background.
Yet people should learn how stocks and flows are related before they reachgraduate school. The concepts can and ought to be taught early in grade school.Calculus is not necessary. Students usually wonder why they were nevertaught these skills, and we have had some wonderful conversations about thefractionation of knowledge in the K-12 grades (ages 5–18), the drive to learnformulae and do well on standardized tests rather than build intuition, thelack of real-world relevance in the curriculum, and other pressures that maycontribute to this deficit in our reasoning skills. We also talk about the excitingwork being done by the growing stock of teachers who successfully incorporatesystem dynamics concepts into their teaching.5 It’s gratifying to see so manybusiness students engage in such a spirited way with questions of social policy.
These basics (feedback, stocks and flows, time delays, nonlinearities) areessential foundations for effective systems thinking and modeling. It is clearthat people have poor understanding of these concepts. At the same time,we know that people can learn to think in feedback terms, to recognize andunderstand stocks and flows, time delays, and nonlinearities. It takes trainingand practice, and must be supported by tools such as management flightsimulators. But it can be done. More difficult for people to learn, and perhapseven more important, are other core concepts of systems thinking and systemdynamics. Failure to appreciate and live by these concepts hurts us more thanfailing to understand feedback and time delays.
Model boundary: Invisible fences in the mind
The first system dynamics article I ever read was Jay Forrester’s (1971a)Counterintuitive Behavior of Social Systems. Jay argues that most peoplebelieve cause and effect are closely related in time and space, while in complexdynamic systems cause and effect are often distant in time and space. Oneof the goals of system dynamics is to expand the boundaries of our mentalmodels, to lengthen the time horizon we consider so we can see the patternsof behavior created by the underlying feedback structure, not only the mostrecent events. I found and still find his argument compelling.
But expanding the boundaries of our mental models is much more than justrecognizing the delayed and distant effects of our decisions. It requires crossingdisciplinary boundaries, boundaries between departments and functions in acompany, between specialties in the academy. It requires breaching barrierserected by culture and class, by race and religion.
In affluent suburbs of the United States many dog owners now use invisiblefences. The invisible fence folks bury a cable around the perimeter of your
512 System Dynamics Review Volume 18 Number 4 Winter 2002
yard. They put a special collar on your dog. Whenever the dog gets too closeto edge of the yard, the collar detects a radio signal from the buried cable andgives the dog a shock. Dogs quickly learn where the boundary is and refuse tocross it. After a short training period, you can turn off the collar. The dog willstill not cross the invisible fence.
We are just the same. We live in a society that trains us to stay withinartificial and damaging boundaries far more effectively than any invisible fencetrains a dog. Much of our education consists of getting punished for crossingboundaries. School teaches us that every subject is different, and knowledge isfragmented (math is completely separate from social studies, which is differentfrom literature). You learn that there are jocks and nerds, our team and theirteam, good guys and bad guys; that you are either ‘‘with us or against us.’’These invisible lines in the mind are the boundaries of our mental models(Meadows 1991: 281–283). Like dogs, we waste a lot of time barking uselesslyat people who get too close to our territory. Academics too often look down onthose outside their own specialties, which are defined ever more narrowly. Orconsider discussions of the economy. We hear pundits pontificate about howeconomic events will affect workers, consumers, taxpayers, and investors, as ifthese were separate species competing for survival in a zero-sum world, wheneach of us is all of the above: we work, we consume, we pay taxes, we benefitfrom government services, and we invest our savings for retirement. We are toldlogging old-growth forests is another case of jobs versus the environment, as ifthe economy could exist without a healthy environment, or the environmentremain healthy if people have no jobs. Or perhaps you pursue a business career.What do you hear? That’s a marketing problem. That’s an operations problem.That’s a human resources problem. And whatever you do, don’t bring yourpersonal problems to work.6
But we do not face marketing problems, operations problems, financialproblems, and people problems; we don’t have workplace issues, personalproblems, and family problems. We don’t have problems as workers,consumers, taxpayers, or investors. We just have problems. We createthese boundaries and impose these categories on the world to simplify itsoverwhelming complexity. Some boundaries are necessary and inevitable. Butall too often, the invisible fences in our minds cut critical feedbacks, deny usthe insights of people with different experience and perspectives, and breedarrogance about our ability to control nature and other people—and then ourproblems grow worse.
In system dynamics we’ve developed tools and processes to help expand theboundaries of our mental and formal models. We build model boundary charts,listing the variables that are endogenous, exogenous, and, as best we can,excluded. We have sophisticated protocols for group modeling. We are trainedto be suspicious of exogenous variables. Perhaps, we say to an innocent-lookingcoefficient in an equation, you are not really constant, but part of the feedbackstructure of the system. As the late Barry Richmond urged, we ‘‘challenge
John D. Sterman: Reflections on becoming a systems scientist 513
the clouds’’ in our stock and flow networks. Sources and sinks are modelingabstractions—is it really acceptable to assume there is an unlimited source andinfinite absorption capacity for the material flowing through the stocks in yourmodel? Is there an infinite pool of customers to buy your product? Is there aninfinite sink to absorb the wastes we spew into the environment?
Yet we and other modelers use these simple disciplines too little. Narrowmodel boundaries are all too common, from the mental models of the person onthe street to the formal models published in the most highly respected scientificjournals. By model boundary I mean not only substantive assumptions such aswhether the interest rate is endogenous or exogenous or whether the productionfunction assumes constant returns to scale, but also the more subtle boundariesimposed by all modeling methodologies, such as the assumption that dataare numbers, or that human beings make decisions to maximize expectedutility. Most of the critical assumptions in any model, mental or formal, arethe implicit ones, the ones buried so deep that the modelers themselves areunaware of them (Meadows 1980; Meadows and Robinson 1985; 2002). Themost important assumptions of a model are not in the equations, but what’snot in them; not in the documentation, but unstated; not in the variables onthe computer screen, but in the blank spaces around them.
Let me illustrate with two examples, both drawn from resource economics.First, consider the debate over the future supply of energy and mineralresources. Here’s what Morris Adelman, a leading energy economist, hadto say in 1993:
Minerals are inexhaustible and will never be depleted. A stream of investment createsadditions to proved reserves, a very large in-ground inventory, constantly renewed asit is extracted. . .. How much was in the ground at the start and how much will be leftat the end are unknown and irrelevant. (p. xi)The fixed stock does not exist. (p. xiii)What exists, and can be observed and measured, is not a stock but a flow. (p. xiv)
Figure 4 shows the stock and flow structure corresponding to Adelman’sstatements. The only stock is the stock of proven reserves, increased by aflow of investment, and drained by extraction. Adelman’s assertion that ‘‘Themuch larger amount in the ground is unknowable and irrelevant, a nonbindingconstraint’’ (p. xiii) means additions to proven reserves, in his view, are bestmodeled as flowing from an infinite source.
Adelman’s statements violate conservation of matter. Every ton of titaniumand every barrel of oil added to the stock of proven reserves reduces thestock of titanium and oil remaining to be found in the future. Every ton andbarrel extracted reduces the quantity remaining in the ground. As explorationadds to the stock of proven reserves, the stock of undiscovered resourcefalls. Ceteris paribus, the smaller the stock of resources remaining to bediscovered, the lower the productivity of exploration activity must be (on
514 System Dynamics Review Volume 18 Number 4 Winter 2002
Fig. 4. Simplisticeconomic model ofmineral resources.Investment includesimprovements intechnology
Additions toReserves
ResourceExtraction
PriceSubstitute(Backstop)
Price
–
+
+
–
+
B1
Substitution
B2
Exploration
ProvenReserves
Investment inExploration and
Recovery
average), and the smaller the rate of addition to proven reserves will be forany investment rate. In the limit, if the stock of undiscovered resource fellto zero, the rate of additions to proven reserves would necessarily fall tozero.
Economists argue that a drop in proven reserves will raise prices, leadingthrough the familiar feedbacks of the free market to substitution of otherresources (the Substitution loop B1 in Figure 4) and inducing additionalexploration activity and improvements in technology that can increaseexploration and recovery (the Exploration loop B2). And they are right. Butadditional exploration only drains the stock of undiscovered resource faster.Depletion must continue—the stock of resources in the ground must fall—aslong as there is any extraction. Only if there is a ‘‘backstop’’ technology thatcan fully substitute for all uses of the nonrenewable resource at a finite price,in finite time, will demand fall to zero and halt depletion. How large theresource base is, what the costs of backstop technologies are, and whether abackstop technology can be developed before depletion constrains extractionand reduces economic welfare are empirical questions, not matters of faith.The very possibility that depletion might matter cannot be assumed away,to be made untestable with models in which resources are assumed infinite,the price system always functions perfectly, delays are short and technologyprovides backstops at low cost.
Turnabout is fair play. Narrow model boundaries are not restricted toeconomic models. Models that focus only on geological factors and calculatethe lifetime of the resource remaining by assuming exogenous technology andextraction rates make the equally serious error of omitting the possibility thatprices can alter incentives for innovation, exploration, and substitution. I amnot arguing against economic models, or against geological models, but against
John D. Sterman: Reflections on becoming a systems scientist 515
narrow model boundaries. Models that consider only the price system or onlygeological factors omit important feedbacks, provide a poor guide to the future,and offer harmful policy advice.
A better model is shown in Figure 5. Here the total stock of resourceremaining is the sum of proven reserves and the stock of undiscoveredresources. For clarity the diagram omits many relevant feedbacks and aggregatesresources into the two stocks shown. (See Davidsen, Sterman, and Richardson1990 for a model in which the resource base is disaggregated into thestandard categories used by the USGS, and with a full range of economic,technological, and geological feedbacks.) The total stock of resource in placefalls with extraction.7 Falling reserves raise prices, leading to substitutionand boosting exploration, as in the simplistic economic model (though withdelays). However, as exploration activity identifies more of the resource, theproductivity of current exploration activity falls (the Depletion loop B3). Thelower the productivity of exploration activity, the lower the expected returnto exploration will be at any given price, so future investment in explorationdrops (the Cost Escalation loop B4).
System dynamics models that integrate these geological, economic, andtechnological feedbacks date at least to the early 1970s (see Behrens 1973and other models in Meadows and Meadows 1973); Sterman and Richardson(1985), Sterman, Richardson, and Davidsen (1988), and Davidsen, Sterman,and Richardson (1990) develop models for US and world petroleum resourcesintegrating depletion and market forces with explicit, endogenous technologyfor exploration and recovery. These models show that extraction often growsrapidly and real prices often fall in the first part of the resource lifecycle asnew discoveries and improving technology build proven reserves and lowerexploration and extraction costs. As production grows, however, the stock of
Fig. 5. Improvedmodel of mineralresources, integratingeconomic andgeological feedbacks
ProvenReserves
Additions toReserves
ResourceExtraction
Effective Investmentin Exploration and
Recovery Price Substitute(Backstop)
Price
Cost ofExploration
Productivity ofExploration
Investment inExploration and
Recovery
–
+
++
–
+
+
+
–
–
B1
Substitution
B2
Exploration
B3
Depletion
B4
Cost Escalation
Resource Remaining
To Economy,Wastes, Biosphere
UndiscoveredResource
DELAY
DELAYDELAY
516 System Dynamics Review Volume 18 Number 4 Winter 2002
resource remaining falls. Unless and until a backstop technology completelysubstitutes for the resource, the quantity of resource remaining continues todrop, triggering the inevitable shift in feedback loop dominance from theproduction-enhancing feedbacks of technology and price to the production-limiting depletion and cost-escalation loops. To illustrate, Figure 6 showsproduction and consumption of petroleum in the Unites States from roughly1859, when Col. Drake drilled the first modern well in Titusville, Pennsylvania.For about a century, exploration and innovation in exploration and recoverytechnology allowed production to keep pace with the extraordinary exponentialgrowth of the rapidly industrializing economy. Estimates of the ultimaterecoverable resource base rose dramatically, from less than 20 billion barrelsfor the lower 48 states in 1910 to as high as 600 billion barrels by 1960 (Stermanand Richardson 1985). Exploration and extraction were so successful, however,that by the 1950s new discoveries slowed and the yield to exploration effortfell. Production peaked in 1970 and has fallen ever since. Production fromthe lower 48 states and adjacent offshore areas is now less than half its peakvalue and continues to sink, while imports have grown to more than half oftotal consumption. Estimates of the ultimate recoverable resource fell by morethan half. All this despite dramatic improvements in exploration and recoverytechnology and extended periods in which real oil prices and drilling activityreached all-time highs.
Yet the narrow boundaries in resource models persist. In the early 1990sWilliam Nordhaus developed the DICE (Dynamic Integrated Climate Economy)model. One of the first and most influential of the so-called ‘‘Integrated Climate-Economy Models,’’ DICE has many features system dynamics modelers shouldview with approval. It links the climate and global warming with the dynamicsof the economy. Until the integrated models were developed, research programsin climate change were fragmented. On the one hand were models of thebiogeochemical processes governing the climate, such as the detailed GCMs
Fig. 6. US petroleumproduction andconsumption
0
5
10
15
20
1880 1900 1920 1940 1960 1980 2000
Mill
ion
Bar
rels
/Day
Alaska
Production,Lower 48 States
Consumption
Imports
John D. Sterman: Reflections on becoming a systems scientist 517
(general circulation models) that simulate global climate by tracking insolation,heat transport in the atmosphere and oceans, etc. in a spatially disaggregatedframework. The concentration of greenhouse gases (GHGs) in these models isexogenous. Likewise carbon cycle models, which generate GHG concentrations,take emissions as exogenous. On the other hand were traditional economicgrowth models in which climate had no role whatever. Integrated models likeDICE close an important feedback: the economy generates GHGs, which alterthe climate, which feeds back to reduce economic growth and emissions.
Despite its virtues, the DICE are loaded. Consider its carbon cycle (Eq. 8 inNordhaus 1992):
M�t� D ˇE�t� C �1–υM �M�t � 1� �1�
‘‘where M�t� is CO2 concentrations relative to preindustrial times, ˇ is themarginal atmospheric retention ratio, and υM is the rate of transfer from therapidly mixing reservoirs to the deep ocean’’ (p. 1316). Figure 7 shows thestock and flow structure for the model’s carbon cycle. First note that the carbonsinks that remove CO2 from the atmosphere (as it is taken up by biomassand dissolves in the ocean) are assumed to have infinite absorption capacity.Carbon, once removed from the atmosphere, disappears forever. In fact, thesecarbon sinks are finite. The carbon taken up by the land and oceans reducesnet transfer (for example as the concentration of carbon in the ocean increases)and eventually makes its way back into the atmosphere. Further, the transferrate is assumed to be a linear, first-order process (the removal time constant1/υM is constant and set to 120 years). However, there are important nonlinearconstraints on carbon uptake by biomass as primary production is increasinglyconstrained by other nutrients; similarly ocean uptake is sharply constrainedby the rise in the partial pressure of CO2 as oceanic carbon concentrations grow(Oeschger et al. 1975). Carbon cycle models show that these feedbacks causethe fractional removal rate υM to decline as atmospheric CO2 concentrationsrise, as terrestrial and oceanic carbon sinks saturate, and as global meantemperatures increase (e.g., Sarmiento et al. 1995).
On the emissions front, Nordhaus estimated the ‘‘atmospheric retentionratio’’ ˇ by regression, finding it to be 0.64. More than one-third of all CO2
generated by the economy never enters the atmosphere. Where does it go? Thevalue of ˇ was estimated with annual data from the following equation:
M�t� � 0.9917 M�t � 1� D ˇE�t� �2�
where 0.9917 D 1–υM D �1–1/120�. The left side is the net change inatmospheric CO2, assuming removal is governed by a linear, first-order removalprocess with a 120-year time constant. A charitable interpretation is that 36percent of total emissions is quickly absorbed out of the atmosphere (within ayear), with the rest requiring an average of 120 years to be removed. However,the emissions that leave the atmosphere quickly are presumably absorbedby biomass or by the mixed, surface layer of the ocean. As these stocks
518 System Dynamics Review Volume 18 Number 4 Winter 2002
Fig. 7. Carbon cycle inthe DICE model(Nordhaus 1992).Atmospheric CO2 isdefined as the excessabove thepreindustrial level
AtmosphericCO2
NetEmissions
CO2 Removalfrom Atmosphere
+Fractional CO2Removal Rate
(δM)
+
AtmosphericRetention
(β)
Gross WorldProduct
CO2 Intensity ofEconomic Activity Time
(exogenousreduction)
Policy Response(chosen to optimizediscounted utility)
– –
+
CO2Emissions
(E)++
+
fill, additional removal from the atmosphere is constrained. And the carbonabsorbed into these stocks either cycles back to the atmosphere, reducing nettransfer, or is transferred to longer-lived carbon sinks such as the deep ocean,contributing to their saturation and reducing net transfer out of the atmosphere.Since none of these carbon reservoirs are represented, however, Nordhaus hasnot only assumed that much of the carbon quickly leaves the atmosphere, butthat 36 percent of total emissions disappear forever, without a trace.
The DICE model violates conservation of matter, and the violation matters.Even a basic relaxation of these limiting assumptions, to account for sinkcapacities and conserve carbon, increases the warming generated by a givenrate of CO2 emissions, thus working against Nordhaus’ conclusion that optimalcarbon taxes are low (Fiddaman 2002).
Professor Nordhaus later developed the DICE model into RICE, the RegionalIntegrated Climate Economy model (Nordhaus and Boyer 2000, Nordhaus20018). RICE is similar to DICE, but disaggregated to represent eight regions sothat carbon permit trading and other policies such as the Kyoto–Bonn accordcan be represented. The climate sector now conserves carbon, and includesthree compartments for carbon (atmosphere, ocean surface/biosphere, anddeep ocean), but is still linear and remains overoptimistic. The other coreassumptions of the original DICE model have been retained. Nordhaus (2001)describes the model, then comments on its limitations:
Economic models, whether of the economics of global warming or of other phenomenasuch as business cycles, have great difficulty incorporating the many ‘‘frictions’’ thatarise in real-world markets. In the present case, frictions are likely to plague the
John D. Sterman: Reflections on becoming a systems scientist 519
emissions market and to prevent equalization of carbon prices (that is, the pricesof permits to emit carbon dioxide) in all participating countries and industries.Important frictions include impediments to trade, . . .; the inability of countries to getfull credit for ‘‘forestry’’ options if regulations are tightly written; limits on the saleof permits by countries to ensure that ‘‘overbooking’’ of allowances does not occur;and a host of features such as transactions costs, regulatory and tax differences, riskand uncertainty, and unfamiliarity. Such frictions will force carbon prices to divergein different regions or industries and thereby lead to higher costs of attaining theaccord’s emissions reductions targets.
These are indeed important issues that may affect the design and impact ofpolicies to mitigate warming. But the next sentence is:
Notwithstanding their importance, frictions are omitted from the present simulations.
There is something fundamentally wrong with a modeling process and peerreview system that encourages modelers to build and allows the publication ofmodels in which many of the factors the modelers themselves view as importantare omitted. Now, we should commend Professor Nordhaus for listing someof the heroic boundary assumptions of his model. Many modelers are not soforthcoming, and the audience and client are left to discover the limitations ofthe models on their own, something most are ill-equipped to do, even in thetoo-rare circumstance that the model is available and properly documented.
Yet several serious problems remain. The omissions cited above constituteonly a subset of the important boundary and methodological assumptions in theupdated DICE and RICE models. As in many of the integrated climate–economymodels, Professor Nordhaus makes many other assumptions, assumptions thatwork against his conclusions, assumptions that are not questioned or tested.These include:
ž Consumers and producers make decisions that are consistent with global,intertemporal optimization under full information. (We never make mistakesin economic decisions; the distant and delayed effects of our decisions, eventhose occurring over centuries, are fully internalized.)
ž Instant or rapid equilibration of factor inputs to prices. (The economy andenergy demand respond to prices very quickly; there are no significant lagsin the turnover of carbon energy consuming capital stocks, the developmentof new technologies, changes in settlement patterns or transportationinfrastructure, and so on.)
ž Energy efficiency improves and the carbon intensity of the economy fallsexogenously. (Technology improves automatically and without costs, delays,or ‘‘side effects’’.)
ž All non-energy resources are excluded. (Interactions between climate changeand other issues are unimportant.)
520 System Dynamics Review Volume 18 Number 4 Winter 2002
ž World population stabilizes early in the next century. (All regions of theworld quickly move through a demographic transition similar to but fasterthan the transition in the industrialized world.)9
ž Future potential economic output per person declines exogenously, limitingeconomic growth, carbon emissions, and the demand on the world’s climateand other resources. (The end of greed: the people of the world stop seekingeconomic growth and higher incomes.)
ž Nature and other species only matter insofar as they contribute to economicoutput and to the extent that their contribution might be compromisedby warming. (The potential extinction of the Orangutan or polar bear isirrelevant unless their loss reduces gross world product.)
ž Utility is determined by economic output per capita and is discounted overtime. (Your children are less important than you.)10
As Tom Fiddaman (1997; 2002) shows, these assumptions bias the resultsof integrated models towards the conclusion that significant reductions inemissions are economically suboptimal. I submit that these assumptions rangefrom the debatable (world population growth will stabilize rapidly, at about11.3 billion) to the counterfactual (consumers and producers are intertemporaloptimizers; there are no market failures; the economy equilibrates quickly;technology improves automatically and without cost or delays) to the immoral(the objective of policy is to maximize discounted utility with a utility functionin which our children are much less important than we are and in whichnature’s only role is to promote production—indeed, if the extinction of thepolar bear increased the availability of fish for humans it would be counted asa benefit of warming).
The assumption that growth in economic output per capita (or, equivalently,in the growth of factor productivity) declines autonomously so that grossworld product eventually stabilizes, even absent any climate pressures, isparticularly ironic, coming as it does from a critic of studies such as WorldDynamics (Forrester 1971b) and The Limits to Growth (Meadows et al. 1972,1974). The assumed exogenous reduction in growth can result only fromMalthusian pressures other than climate change—which Nordhaus and Boyer(1999: 3–15) explicitly rule out—or from the utopian assumption that thepeople of the world are spontaneously becoming content with their materialstandard of living, even though large income gaps between rich and poorregions remain in the RICE projections. Assuming instead that people willcontinue to strive for higher incomes leads to such high emissions and suchlarge climate changes that optimal policy would call for significant carbontaxes and deep emissions cuts today. The conclusions of the DICE and RICEmodels are not robust to correction of their errors and alternative plausibleassumptions.
John D. Sterman: Reflections on becoming a systems scientist 521
Model testing
The importance and difficulty of uncovering hidden assumptions requiresa far greater role for model testing than is common in the social sciences.System dynamics has long had a sophisticated, flexible approach to testing.We stress multiple tests, from dimensional consistency to extreme conditionstests to tests of sensitivity to structural assumptions and aggregation. Weemphasize the use of all types of data, not only statistical tests on numericaldata. Because all models are wrong, we reject the notion that models canbe validated in the dictionary definition sense of ‘establishing truthfulness’,instead focusing on creating models that are useful, on the process of testing,on the ongoing comparison of the model against all data of all types, and on thecontinual iteration between experiments with the virtual world of the modeland experiments in the real world. We argue that focusing on the process ofmodeling rather than on the results of any particular model speeds learning andleads to better models, better policies, and a greater chance of implementationand system improvement (Forrester 1971/1985).
When Jay Forrester first articulated these views he was a lone voice inthe modeling and social science community, which was dominated by thelogical positivism imported to economics by Milton Friedman (1953). Today,more and more social scientists recognize the impossibility of validation, theprovisional character of all models, and the need for a more eclectic anddiverse set of tests (see Oreskes et al. 1994, Sterman 1994, and Chapter 21in Business Dynamics); see also Herbert Simon’s (1963, 1979) and PaulSameulson’s (1963) critiques of Friedman’s positivism). But we have a longway to go. Many important tests are simply never done. Many modelersfocus excessively on replication of historical data without regard to theappropriateness of underlying assumptions, robustness, and the sensitivityof results to assumptions about model boundary and feedback structure.Modelers often fail to document their work, preventing others from replicatingand extending it (see Business Dynamics, Chapter 21). Modelers and clientsoften suffer from confirmation bias, selectively presenting data favorable totheir preconceptions. Such behavior only succeeds in generating mistrust ofthe model and suspicion about the intentions of the modelers, counter to themodeler’s goals (a fine example of policy resistance).
If modeling is to fulfill its promise, a different approach is needed. Modelsrarely fail because we used the wrong regression technique or because themodel didn’t fit the historical data well enough. Models fail because morebasic questions about the suitability of the model to the purpose weren’tasked, because a narrow boundary cut critical feedbacks, because we kept theassumptions hidden from the clients, or because we failed to include importantstakeholders in the process (Meadows and Robinson 1985, 2002).
To avoid such problems, whether as modeler or client, we must recognizethat no one test is adequate. We must strive to use all types of data, both
522 System Dynamics Review Volume 18 Number 4 Winter 2002
numerical and qualitative. We must do a better job of testing the robustness ofour conclusions to uncertainty in our assumptions. Such testing requires farmore than merely assessing parametric sensitivity, though we should encouragegreater use of Monte-Carlo and other multiparameter tests in our work. Modelresults are usually far more sensitive to assumptions about the model boundary,level of aggregation, and representation of decision-making than to variationsin parameters, yet sensitivity to these issues is only rarely assessed.11
We must insist on the highest standards of documentation. Models must befully replicable and available for critical review. Build into the budget andtime line sufficient resources to assess the impact of the work and document itfully so others can help you improve it. We must open the modeling processto the widest range of people we can, including our critics. We must designassessment into our work from the start so we can discover errors more quickly,measure the extent to which we meet our goals, and learn how to work moreeffectively in the future.
Unfortunately, all too often testing is inadequate, documentation isincomplete, important critics and stakeholders are excluded, and assessmentis never undertaken. Worse, model testing is often designed to ‘‘prove’’ themodel is ‘‘right’’ and model tests are presented as evidence designed to promoteclient acceptance. We are continually pressured by our clients, our students,our colleagues, and our own egos to slip out of the role of questioner andlearner into the role of expert and teacher. Doing so often fails, by generatingdefensiveness and resistance. The phrase ‘‘getting client buy-in’’ should bebanned from our lexicon. Taking the perspective that we are selling a ‘‘product’’to the client is antithetical to a genuine inquiry process. Such an approachis designed to deflect criticism and promote the status and authority of themodeler. Instead, it makes learning difficult and ultimately erodes the impactof the model and the credibility of the modeler—and of all modelers.
Not surprisingly, the highest leverage point to enhance the impact of ourmodeling work is counterintuitive. Implementation success requires changingthe clients’ mental models. To do so the clients must become partners withus in the modeling process. Ultimately, our chances of success are greatestwhen we work with our clients to find the flaws in our models, mental andformal, then work together to improve them. In this fashion we all—modelersand clients—gradually develop a deeper understanding of the system and theconfidence to use that understanding to take action. Paradoxically, a testingprocess designed to highlight the shortcomings of our models increases thechances of implementation and sustained success.
A hard look at soft variables
Another source of puzzlement for students of system dynamics relates toso-called soft variables and the role of numerical data. Jay Forrester argued
John D. Sterman: Reflections on becoming a systems scientist 523
early and, I believe correctly, that data are not only numerical data, that ‘soft’(unmeasured) variables should be included in our models if they are importantto the purpose. Despite the critical importance of qualitative information somemodelers restrict the constructs and variables in their models to those for whichnumerical data are available, and include only those parameters that can beestimated statistically. These modelers defend the rejection of soft variablesas being more scientific than ‘‘making up’’ the values of parameters andrelationships. How, they ask, can the accuracy of estimates for soft variablesbe tested? How can statistical tests be performed without numerical data?
Omitting structures or variables known to be important because numericaldata are unavailable is actually less scientific and less accurate than using yourbest judgment to estimate their values. ‘‘To omit such variables is equivalentto saying they have zero effect—probably the only value that is known to bewrong!’’ Forrester (1961, p. 57).
We should never compromise this principle. Omitting concepts because wehave no numerical data is a sure route to narrow model boundaries, biasedresults, and policy resistance. Of course, we must evaluate the sensitivity of ourresults to uncertainty in assumptions—whether we estimated the parametersjudgmentally or by statistical means. Modelers who follow these principles formodeling and testing developed owe no apology to those who would judgemodel ‘‘validity’’ by historical fit and statistical tests alone.
That said, it is important to use proper statistical methods to estimateparameters and assess the ability of the model to replicate historical datawhen numerical data are available. Unfortunately, some advocates of systemsthinking go to the extreme of discounting the role of statistical parameterestimation and numerical data in general. They argue that qualitative insightsare more important than numerical precision and that model behavior isinsensitive to variations in most parameter values. They say that building amodel for insight means they don’t have to assess the behavior of the modelagainst the historical data. These are serious errors, even when the purposeof a model is insight. Rigorously defining constructs, attempting to measurethem, and using the most appropriate methods to estimate their magnitudesare important antidotes to casual empiricism, muddled formulations, andthe erroneous conclusions we often draw from our mental models (Homer1996; 1997). Ignoring numerical data or failing to use statistical tools whenappropriate is sloppy and lazy. In my experience, many who avoid the properuse of numerical data do so not because they believe it is the best way tohelp people learn or solve important problems but because they don’t want totake the time or don’t have the skills to do it. No excuse. Failing to use thesetools increases the chance that the insights you derive from your model will bewrong or harmful to the client.
Most important, we should not accept the availability of data as given, asoutside the boundaries of our project or research. We must ask why conceptsour modeling suggests are important have not been measured. Frequently, it
524 System Dynamics Review Volume 18 Number 4 Winter 2002
is because no one thought these concepts were important. That perception, inturn, most often stems from the narrow boundaries of our understanding. Thereis a strong feedback: we measure what we care about, and those measurementsalter what we believe is important. Because we tend to have short-term, event-oriented mental models, with narrow boundaries, with few feedbacks, and withweak understanding of the systems in which we are embedded, we tend tothink what’s important is what’s salient, tangible, and familiar. As we measurethese things they become even more real, while the delayed and distant effectsof our decisions, the unfamiliar, and the intangible fade like wraiths. Thuswe confuse the net income of the firm with the health of the enterprise, theamount we spend on training with the skills and knowledge of our employees,GDP per capita with happiness, and the size of our houses with the quality ofour home life.
Human creativity is great: once we recognize the importance of a concept,we can almost always find ways to measure it. Within living memory therewere no national income accounts, no survey methodologies to assess politicalsentiments, no psychological inventories for depression or subjective well-being, no protocols for semi-structured interviews or coding criteria forethnographic data. Today, many apparently soft variables such as customerperceptions of quality, employee morale, investor optimism, and politicalvalues are routinely quantified with tools such as content analysis, surveys,and conjoint analysis. Of course, all measurements are imperfect. Metrics forso-called soft variables continue to be refined, just as metrics for so-called hardvariables are. Quantification often yields important insights into the structureand dynamics of a problem. Often the greatest benefit of a modeling project isto help the client see the importance of and begin to measure and account forsoft variables and concepts previously ignored.12
Why simulation is essential
Some advocates of systems thinking go even further, arguing that it is notnecessary to build a formal, working simulation at all—that causal maps orother purely conceptual models are sufficient. They are mistaken. Simulationis essential for effective systems thinking, even when the purpose is insight,even when we are faced with a ‘‘mess’’ rather than a well-structured problem.
I am not opposed to all qualitative modeling. I do it myself. Building aformal model takes time. The data you need to build and test your modelare rarely available without significant cost and effort. We must constantlymake judgments about whether the time and cost of additional modelingand data collection are justified. A good qualitative mapping process willsurface the mental models of the client. Often these have narrow boundariesand are dynamically impoverished. There is no doubt that many students,senior executives, and policy makers derive enormous value from expanding
John D. Sterman: Reflections on becoming a systems scientist 525
their mental models to include previously unrecognized feedbacks. But wemust recognize that such qualitative modeling exposes us to one of the mostfundamental bounds on human cognition: our inability to simulate mentallythe dynamics of complex nonlinear systems. Indeed, our experimental studiesshow that people are unable to accurately infer the behavior of even thesimplest systems, systems far simpler than those emerging from qualitativemodeling work. Formal models, grounded in data and subjected to a widerange of tests, lead to more reliable inferences about dynamics and uncovererrors in our mental simulations.13
Most importantly, computer simulations help build our intuition andimprove our mental simulation capability. It is no accident that the mosteffective practitioners of qualitative modeling have extensive backgrounds informal modeling. Their ability to identify the important feedbacks in a messysituation and draw useful and compelling inferences from them developedfrom their years of experience with formal modeling and simulation.
There is an even more fundamental reason why simulation is essential. Thereis no learning without feedback, without knowledge of the results of our actions.Traditionally, scientists generated that feedback through experimentation. Butexperiments are impossible in many of the most important systems. Whenexperimentation is too slow, too costly, unethical, or just plain impossible,when the consequences of our decisions take months, years, or centuries tomanifest, that is, for most of the important issues we face, simulation becomesthe main—perhaps the only—way we can discover for ourselves how complexsystems work, where the high leverage points may lie. The alternative is rotelearning based on the authority of a consultant, teacher, or textbook, a methodthat dulls creativity, stunts the very systems thinking and scientific reasoningskills we hope to develop, and thwarts implementation.
All decisions are based on models . . . and all models arewrong
The concepts of system dynamics people find most difficult to grasp are these:All decisions are based on models, and all models are wrong. These statementsare deeply counterintuitive. Few people actually believe them. Yet acceptingthem is central to effective systems thinking.
Most people are what philosophers call ‘‘naıve realists’’: they believe whatthey see is, that some things are just plain True—and that they know whatthey are. Instead, we stress that human perception and knowledge are limited,that we operate from the basis of mental models, that we can never placeour mental models on a solid foundation of Truth because a model is asimplification, an abstraction, a selection, because our models are inevitablyincomplete, incorrect—wrong. Many systems thinkers illustrate this withthe famous story of the ancient astronomer who taught that the world is
526 System Dynamics Review Volume 18 Number 4 Winter 2002
supported on the shoulders of a giant. ‘‘But where does the giant stand?’’asks a student. ‘‘On an immense turtle,’’ the master replies. ‘‘But on whatdoes the turtle stand’’ persists the student. ‘‘Another turtle.’’ This goes ona while, until the exasperated master shouts out ‘‘It’s turtles all the waydown!’’
Recognizing the limitations of our knowledge, the ‘‘inevitable a priori’’assumptions at the root of everything we think we know, is deeply threatening(Meadows 1980). It’s one thing to point out that someone else’s opinions are‘just a model’—it’s quite something else to recognize the limitations of ourown beliefs. And how are we to make decisions if all models are wrong? Theconcept that it’s turtles all the way down, that there is no ultimate, absolutefoundation for our beliefs, is so deeply counterintuitive, so threatening, thatmost people reject it as ‘‘obviously false’’ or become so dizzy with doubt thatthey run screaming as fast as they can to someone who claims to offer the Truth.Much of the misery people inflict on others arises from the arrogant belief thatonly we know the True Path, and the resulting intolerance and fear of anywho profess beliefs different than ours. Fundamentalism, whether religiousor secular, whether the unquestioning belief in an all-powerful deity, theall-powerful state or the all-powerful free market, breeds persecution, hatredand war.
To help people open up to a new perspective, a new model, and changedeeply entrenched behaviors, we must often first help them see the limitationsof their current beliefs. Doing so is difficult. But even when we succeed, itis only part of the challenge. Yes, we might solve an important problem ifwe can help people see through a new lens, improve their mental models,and thus make better decisions. But in a deeper sense, we fail our clientsand students when all we do is facilitate the old organizational changerecipe of ‘‘unfreeze, change, refreeze.’’ We may only succeed in replacingone dogma with another, while strengthening people’s belief that the scaleshave now fallen away from their eyes, that now they have the Truth. Wemust strive for more: helping people develop the critical thinking skills andconfidence to continually challenge their own models, to uncover their ownbiases.
Yet we must recognize the inherent tension between being humble aboutthe limitations of our knowledge on the one hand, and being able to arguefor our views, respond to criticism, and make decisions on the other.Developing the capacity to see the world through multiple lenses and torespect differences cannot become an excuse for indecision, for a retreat toimpotent scholasticism. We have to act. We must make the best decisions wecan despite the inevitable limitations of our knowledge and models, then takepersonal responsibility for them. Mastering this tension is an exceptionallydifficult discipline, but one essential for effective systems thinking andlearning.
John D. Sterman: Reflections on becoming a systems scientist 527
Too many ‘‘Why’’ questions?
Every semester I solicit midterm feedback from the students to help meimprove my teaching. A student once commented that Business Dynamics andthe homework assignments in my course were too difficult, writing ‘‘Too many‘why’ questions.’’ Reading this I knew I had failed that student. It’s by askingthose ‘‘why’’ questions that we come to understand that we are all embeddedin systems, some natural, like the global climate, and some of our own making,like our schools, businesses, communities, and economies. It’s by asking those‘why’ questions that we gain insight into how we are both shaped by andshape the world, where we can act most effectively, where we can make adifference—and what we are striving for.
When human beings evolved, the challenge was survival in a worlddominated by systems we could barely influence but that determined howwe lived and died. Today the challenges we face are the result of systems wehave created. The hurricane or earthquake do not pose the greatest danger. It isthe unanticipated ‘‘side effects’’ of our own actions, side effects created by ourinability to understand and act in consonance with our long-term goals anddeepest aspirations.
What prevents us from overcoming policy resistance is not a lack of resources,technical knowledge, or a genuine commitment to change. What thwarts us isour lack of a meaningful systems thinking capability. That capability requires,but is much more than, the ability to understand complexity, to understandstocks and flows, feedback, and time delays. It requires, but is much morethan, the use of formal models and simulations. It requires an unswervingcommitment to the highest standards, the rigorous application of the scientificmethod, and the inquiry skills we need to expose our hidden assumptionsand biases. It requires that we listen with respect and empathy to others. Itrequires the curiosity to keep asking those ‘‘why’’ questions. It requires thehumility we need to learn and the courage we need to lead, though all ourmaps are wrong. That is the real purpose of system dynamics: To create thefuture we truly desire—not just in the here and now, but globally and for thelong term. Not just for us, but for our children. Not just for our children, butfor all the children.
It’s demanding work. But it’s also a joy. As Gauss said, ‘‘It is not knowledge,but the act of learning, not possession but the act of getting there, which grantsthe greatest enjoyment.’’14
Notes
1. Actually, Business Dynamics is even longer than it appears. Besidesthe text itself, there is a 500-page instructor’s manual, available on-line
528 System Dynamics Review Volume 18 Number 4 Winter 2002
and on paper to anyone who teaches system dynamics. The manualcontains suggested solutions to every one of the more than seventy Chal-lenges—modeling exercises—in the book, from the frequency response ofdelays to policy responses to the HIV/AIDS pandemic.
2. The Asian brown cloud is a thick haze of pollution, three-quartersanthropogenic in origin, that causes drought in parts of Asia while floodingothers, lowers agricultural productivity by reducing ground-level sunlight,and causes respiratory illness and death (see http://www.eapap.unep.org/issues/air/impactstudy/index.cfm).
3. Colin Camerer (personal communication).4. In coding the responses I considered a response correct if it was within š1
minute of the correct answer, so subjects were not penalized for incorrectlyreading the x-axis values.
5. The Creative Learning Exchange serves as a clearinghouse and source forsystem dynamics materials and tools for K-12 grades. See http://www.clex-change.org.
6. Or, in Tom Lehrer’s (1965) immortal lyric, ‘‘‘Once the rockets are up whocares where they come down. That’s not my department’ says Wernhervon Braun.’’ This gives an entirely new meaning to the concept of ‘‘silothinking.’’
7. A good modeler should consider the possibility that new high-graderesources may be formed by biological or geological processes. Forresources such as metals and fossil fuels the scientific consensus isthat formation of new resources takes place over geological time scalesand is negligible within the time horizon of concern in policy models.Good modeling practice also requires considering the fate of the resourceafter extraction, possibly including the stocks of resources in use, theirdisposal or consumption, waste generation, and, if possible, the potentialfor recycling. Note further that while the total stock of, say, petroleum orTi in the earth may be enormous (and resources such as Ti, as elements,are conserved), there is a distribution of grades and extraction costs,with most of the total stock consisting of low-concentration, deep, orremote deposits with high extraction costs. Rational extractors developand deplete the lowest-cost resources first, while lower-grade deposits inmore costly locales remain uneconomic and unexploited until prices riseor technology improves. The depletion feedback in Figure 5 captures thelong-run supply curve relating the yield of discovery and extraction effortto the distribution of the quantity remaining and the level of technology.That is, the productivity of exploration (measured in, say, tons of Tior barrels of oil per $ of exploration effort� D f �R, T� where R is thestock of resource remaining and T is the state of exploration technology,with ∂f �R, T�/∂R ½ 0 and ∂f �R, T�/∂T ½ 0. The function depends on thedistribution of resources in the earth, but must satisfy f (0, T� D 0.
John D. Sterman: Reflections on becoming a systems scientist 529
8. The DICE and RICE models are available at http://www.econ.yale.edu/¾nordhaus/homepage/dicemodels.htm.
9. World population in RICE stabilizes at about 11.3 billion and reachesalmost 95 percent of this final value by 2100. These estimates assumerapid demographic transition in the developing world and continued lowfertility in developed nations (see file <Rice99 web version.xls> at the sitein note 8).
10. The social discount rate in the RICE model is an exogenous variableassumed to decline modestly over time. Nevertheless, the welfare of thosealive in 2025 is weighted only 42 percent as much as the welfare of those in1995. The weight falls to just 15 percent by 2065, when the grandchildrenof today’s undergraduates may themselves be in college. After 2155 theweight given our descendants is less than 2 percent of the 1995 value(see file <Rice99 web version.xls> at the site in note 8, row 37 on theWorld worksheet).
11. For a good example of testing robustness against deep methodologicalassumptions, see Repenning (2000; 2002), in which the dynamics ofprocess improvement programs are modeled using both a rational actorgame-theoretic framework and a behavioral, disequilibrium framework.Repenning shows that the impact of job security on employee participationin improvement programs is robust to assumptions about the degree ofrationality of workers and managers.
12. For one of many examples, see Business Dynamics, Section 2.2, wheresystem dynamics modeling of the auto leasing market led General Motorsto create new market research instruments to assess how people tradeoff new versus high-quality off-lease used vehicles, an area the firm hadpreviously ignored because under prevailing mental models the used andnew vehicle markets were separate.
13. Sastry (1997) provides one of many examples.14. As cited in http://www-gap.dcs.st-and.ac.uk/¾history/Quotations/Gauss.
html.
References
Adelman MA. 1993. The Economics of Petroleum Supply. MIT Press: Cambridge, MA.Bar-Yam Y. 1997. Dynamics of Complex Systems. Addison-Wesley: Reading, MA.Behrens W. 1973. The dynamics of natural resource utilization. In Toward Global
Booth Sweeney L, Sterman JD. 2000. Bathtub dynamics: initial results of a systemsthinking inventory. System Dynamics Review 16(4): 249–294.
Cerveny R, Balling R. 1998. Weekly cycles of air pollutants, precipitation, and tropicalcyclones in the coastal NW Atlantic region. Nature 394(6 August): 561–563.
530 System Dynamics Review Volume 18 Number 4 Winter 2002
Davidsen P, Sterman J, Richardson G. 1990. A petroleum life cycle model for the UnitedStates with endogenous technology, exploration, recovery, and demand. SystemDynamics Review 6(1): 66–93.
Fiddaman T. 1997. Feedback Complexity in Integrated Climate–Economy Models.Ph.D. thesis, MIT Sloan School of Management, Cambridge, MA 02142; available athttp://home.earthlink.net/¾tomfid/ (accessed December 2002).
. (2002). Exploring policy options with a behavioral climate–economy model.System Dynamics Review 18(2): 243–267.
Friedman M. 1953. Essays in Positive Economics. University of Chicago Press: Chicago.Forrester JW. 1961. Industrial Dynamics. Pegasus Communications: Waltham, MA.
. 1971a. Counterintuitive behavior of social systems. Technology Review 73(3):52–68.
. 1971b. World Dynamics. Pegasus Communications: Waltham, MA.
. 1971/1985. The model versus a modeling process. System Dynamics Review1(1): 133–134.
Goncalves P. 2002. When do minor shortages inflate to great bubbles? Proceedings of the2002 International System Dynamics Conference. System Dynamics Society: Albany,NY.
Homer J. 1996. Why we iterate: scientific modeling in theory and practice. SystemDynamics Review 12(1): 1–19.
. 1997. Structure, data and compelling conclusions: notes from the field (1997 JayWright Forrester Award Lecture). System Dynamics Review 13(4): 293–309.
Kainz D, Ossimitz G. 2002. Can students learn stock–flow thinking? an empiricalinvestigation. Proceedings of the 2002 International System Dynamics Conference.System Dynamics Society: Albany, NY.
Lehrer T. 1965. Wernher von Braun, That was the year that was. Reprise Records.Meadows DH. 1991. The Global Citizen. Island Press: Washington, DC.
. 1980. The unavoidable a priori. In Elements of the System Dynamics Method,Randers J (ed.). Pegasus Communications: Waltham, MA.
Meadows DH, Robinson J. 1985. The Electronic Oracle: Computer Models and SocialDecisions. Wiley: Chichester.
, . 2002. The Electronic Oracle: Computer Models and Social Decisions(excerpt). System Dynamics Review. 18(2): 271–308.
Meadows DH, Meadows DL, Randers J, Behrens W. 1972. The Limits to Growth.Universe Books: New York.
Meadows DL, et al. 1974. Dynamics of Growth in a Finite World. Pegasus Communica-tions: Waltham, MA.
Mosekilde E. 1996. Topics in Nonlinear Dynamics: Applications to Physics, Biology,and Economic Systems. World Scientific: River Edge, NJ.
Nordhaus W. 1992. An optimal transition path for controlling greenhouse gases. Science258(20 November): 1315–1319.
. 2001. Global Warming Economics. Science 299(9 November): 1283–1284.Nordhaus W, Boyer J. 2000. Warming the World: Economic Models of Global
Warming. MIT Press: Cambridge, MA. Web version dated 1999 available athttp://www.econ.yale.edu/¾nordhaus/homepage/dicemodels.htm (accessed Decem-ber 2002).
John D. Sterman: Reflections on becoming a systems scientist 531
Oeschger H, Siegenthaler U, Schotterer U, Gugelmann A. 1975. A box diffusion modelto study the carbon dioxide exchange in nature. Tellus 27: 168–192.
Oreskes N, Shrader-Frechette K, Belitz K. 1994. Verification, validation, and confirma-tion of numerical models in the earth sciences. Science 263(4 February): 641–646.
Ossimitz G. 2002. Stock–Flow Thinking and Reading stock–flow-related graphs: Anempirical investigation in dynamic thinking abilities. Proceedings of the 2002International System Dynamics Conference. System Dynamics Society: Albany, NY.
Paulos JA. 2001. Innumeracy: Mathematical Illiteracy and Its Consequences. Hill &Wang: New York.
Repenning N. 2000. Drive out fear (unless you can drive it in): the role of agency and jobsecurity in process improvement efforts. Management Science 46(11): 1385–1396.
. 2002. A simulation-based approach to understanding the dynamics of innovationimplementation. Organization Science 13(2): 109–127.
Samuelson P. 1963. Discussion: problems of methodology. American Economic Review,Proceedings 53(May): 231–236.
Sastry M. 1997. Problems and paradoxes in a model of punctuated organizationalchange. Administrative Science Quarterly 42(2): 237–275.
Senge P. 1990. The Fifth Discipline: The Art and Practice of the Learning Organization.Doubleday: New York.
Shi S. 2002. Phantom Orders Roil Cisco’s Supply Chain–A System Dynamics Study ofNetworking Equipment Industry’s Supply Chain. Unpublished master’s thesis, MIT,Cambridge, MA.
Simon H. 1963. Discussion: problems of methodology. American Economic Review,Proceedings 53(May): 229–231.
. 1979. Rational decision-making in business organizations. American EconomicReview 69: 493–513.
Snow CP. 1959/1993. The Two Cultures. Cambridge University Press: New York.Sterman JD. 1994. Learning in and about complex systems. System Dynamics Review
10(2–3): 291–330.. 2000. Business Dynamics: Systems Thinking and Modeling for a Complex World.
Irwin/McGraw-Hill: New York.Sterman JD, Booth Sweeney L. 2002. Cloudy skies: assessing public understanding of
global warming. System Dynamics Review 18(4): 207–240.Sterman JD, Richardson GP. 1985. An experiment to evaluate methods for estimating
fossil fuel resources. Journal of Forecasting 4(2): 197–226.Sterman J, Richardson G, Davidsen P. 1988. Modeling the estimation of petroleum
resources in the United States. Technological Forecasting and Social Change 33(3):219–249.
Strogatz S. 1994. Nonlinear Dynamics and Chaos, With Applications to Physics, Biology,Chemistry, and Engineering. Addison-Wesley: Reading, MA.


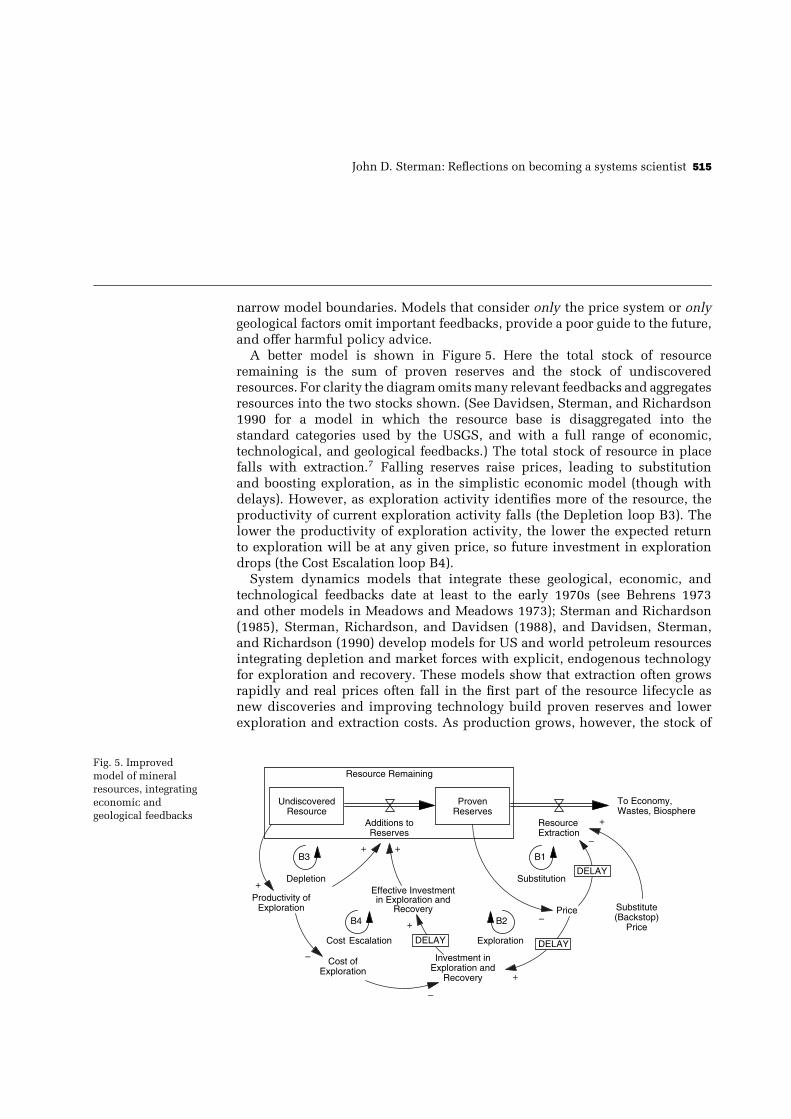


![Theoretische Teilchenphysik I - fredstober.de · theory, Addison-Wesley [2] Bailin, David and Love, Alexander: Introduction to gauge field ... [Sterman] Sterman, George: An Introduction](https://static.documents.pub/doc/80x56/5b77edfd7f8b9ad3338e3109/theoretische-teilchenphysik-i-theory-addison-wesley-2-bailin-david-and.jpg)


