All-sky Monitoring of Variable Sources with Fermi GBM Colleen A. Wilson-Hodge * NASA/MSFC E-mail: [email protected]Michael L. Cherry 1 , Gary L. Case 1 , Ascension Camero-Arranz 2 , Vandiver Chaplin 3 , Valerie Connaughton 3 , Mark H. Finger 2 , Peter Jenke 4 , James C. Rodi 1 , Wayne H. Baumgartner 5 , Elif Beklen 6 , P. Narayana Bhat 4 , Michael S. Briggs 4 , Neil Gehrels 7 , Jochen Greiner 8 , Keith Jahoda 7 , R. Marc Kippen 9 , Chryssa Kouveliotou 4 , Hans A. Krimm 5 Erik Kuulkers 11 , Niels Lund 12 , Charles A. Meegan 2 , Lorenzo Natalucci 13 , William S. Paciesas 3 , Robert Preece 3 , Nikolai Shaposhnikov 10 , Gerald K. Skinner 10 , Doug Swartz 2 , Andreas von Kienlin 8 , Roland Diehl 8 , Xiao-Ling Zhang 8 1 LSU; 2 USRA/NSSTC; 3 UAH 4 NASA/MSFC; 5 USRA/CRESST/NASA/GSFC; 6 METU/SDU; 7 NASA/GSFC; 8 MPE; 9 LANL; 10 UMD/CRESST/NASA/GSFC; 11 ISOC/ESA/ESAC; 12 Danish National Space Center; 13 INAF-IASF Using the Gamma ray Burst Monitor (GBM) on Fermi, we monitor the transient hard X-ray/soft gamma ray sky. The twelve GBM NaI detectors span 8 keV to 1 MeV, while the two BGO detectors span 150 keV to 40 MeV. We use the Earth occultation technique to monitor a number of sources, including X-ray binaries, AGN, and solar flaring activity. Our monitoring reveals predictable and unpredictable phenomena such as transient outbursts and state changes. With GBM we also track the pulsed flux and spin frequency of accretion powered pulsars using epoch- folding techniques. Highlights from the Earth Occultation and Pulsar projects will be presented including our recent surprising discovery of variations in the total flux from the Crab. Searches for quasi-periodic oscillations and X-ray bursts are also possible with GBM all-sky monitoring capabilities. With these results we show how crucial an all-sky monitor is for any future X-ray timing mission. Fast X-ray timing and spectroscopy at extreme count rates February 7-11, 2011 Champery, Switzerland * Speaker. http://pos.sissa.it/ https://ntrs.nasa.gov/search.jsp?R=20110010223 2018-05-29T17:58:11+00:00Z
Transcript
All-sky Monitoring of Variable Sources with FermiGBM
Michael L. Cherry1, Gary L. Case1, Ascension Camero-Arranz2, Vandiver Chaplin3,Valerie Connaughton3, Mark H. Finger2, Peter Jenke4, James C. Rodi1, Wayne H.Baumgartner5, Elif Beklen6, P. Narayana Bhat4, Michael S. Briggs4, Neil Gehrels7,Jochen Greiner8, Keith Jahoda7, R. Marc Kippen9, Chryssa Kouveliotou4, Hans A.Krimm5 Erik Kuulkers11, Niels Lund12, Charles A. Meegan2, Lorenzo Natalucci13,William S. Paciesas3, Robert Preece3, Nikolai Shaposhnikov10, Gerald K. Skinner10,Doug Swartz2, Andreas von Kienlin8, Roland Diehl8, Xiao-Ling Zhang8
Variable Sources with Fermi GBM Colleen A. Wilson-Hodge
1. Introduction
All-sky monitors are typcially responsible for triggeringobservations with a main instrument,workhorse science such as monitoring source states and fluxes, and serendipitous science resultingfrom watching large fractions of the sky nearly all of the time. In this paper, we describe highlightsof all-sky monitoring science with the Gamma ray Burst Monitor (GBM) on Fermi, includingthe discovery of variations in the Crab Nebula flux in hard X-rays and results from monitoringaccretion-powered pulsars.
2. Observations & Results
The Fermi satellite was launched on June 11, 2008. It consists of two instruments, the LargeArea Telescope [1], sensitive to gamma rays from 20 MeV to more than 300 GeV and the GammaRay Burst Monitor [2], sensitive to gamma rays from 8 keV to 40MeV. The GBM consists of 12NaI detectors (8-1000 keV) and two BGO detectors (150 keV - 40MeV). The results described inthis paper are from the GBM NaI detectors.
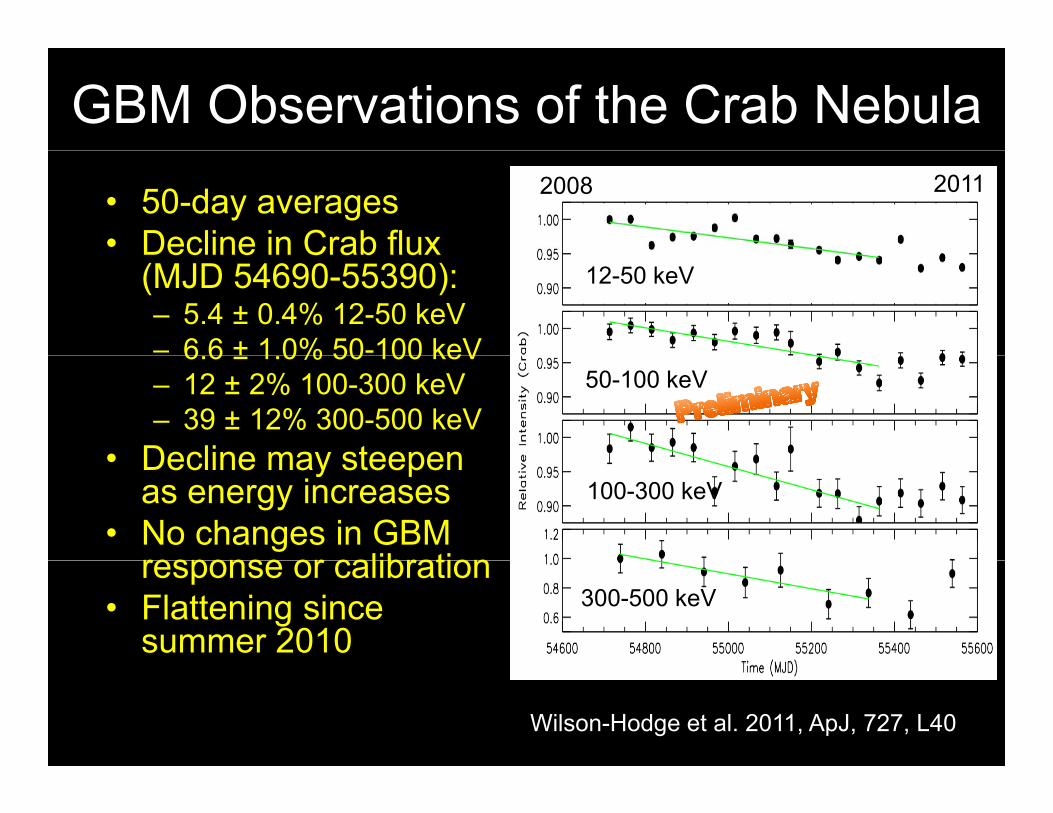
2.1 Discovery of decline in Crab Nebula flux using the Earth occultation technique
The GBM instrument is not a pointed or focusing instrument. To measure fluxes from indi-vidual sources on the sky, we use the Earth occultation technique [3, 4], measuring the changein count rate as a source enters or exits Earth occultation. Our application of this technique usesa catalog of known source locations, for which Earth occultation times are calculated and a win-dow of data containing the occultation time is extracted. These data from GBM detectors viewingthe source within 60 degrees of the detector normal are fittedwith a quadratic background plus amodel resulting from an assumed source spectrum convolved with the changing detector responseas GBM scans the sky, and the energy dependent atmospheric transmission function describing theEarth occultation. Other bright sources within the window are fit simultaneously. For the sourceof interest, the flux is computed by first computing the best scale factor in each energy band forall detectors in the fit, and then applying this scale factor to the reference flux, computed from theassumed model in each energy band. GBM’s CTIME (0.256-s, 8 energy bands from 8-1000 keV)and CSPEC (4.096-s, 128 energy bands from 8-1000 keV) data for the NaI detectors were usedin the analysis described here. The Earth occultation technique is also applicable to the the GBMBGO detectors.
As of 2011 May, GBM is monitoring a catalog of 107 sources using Earth occultation. Mostof these sources were recently active X-ray binaries, plus the Crab, ten active galactic nuclei, twosoft-gamma repeaters, and the Sun. In the first two years of Earth occultation monitoring withGBM, six persistent and two transient sources were detectedabove 100 keV[4]. More than 80sources have been detected below 100 keV. Preliminary monitoring results can be found on ourwebsite1.
The most remarkable result from GBM Earth occultation monitoring was the discovery thatthe hard X-ray flux from the Crab nebula is not constant, and infact, it declined by about 7%
1http://gammaray.nasa.gov/gbm/science/occultation
2
Variable Sources with Fermi GBM Colleen A. Wilson-Hodge
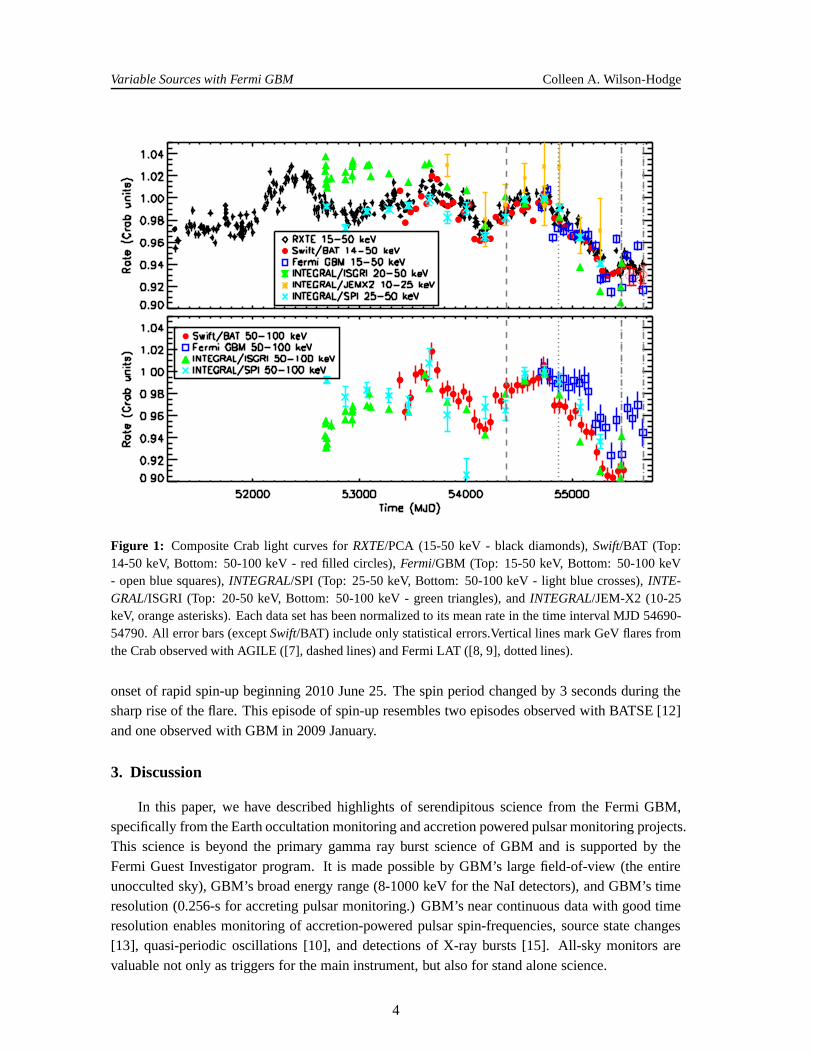
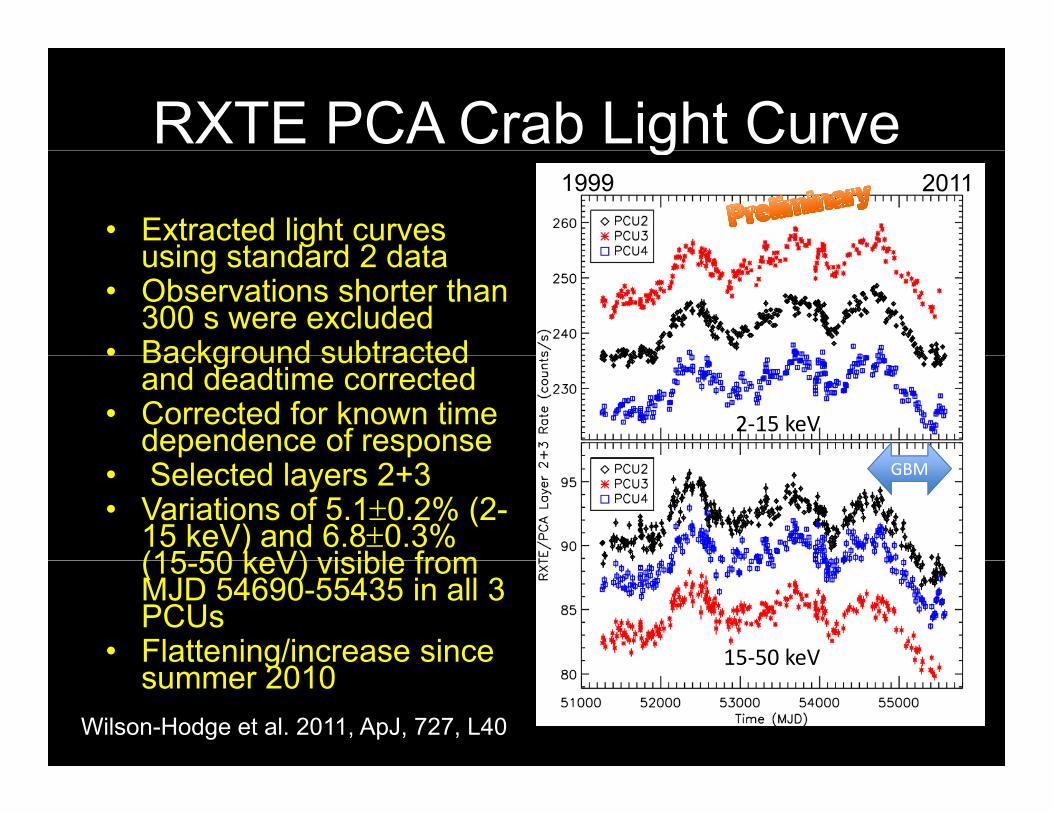
from 2008-2010 in the 15-50 keV band [5]. Figure 1 shows composite light curves combiningoverlapping measurements of the Crab pulsar + nebula flux from the Rossi X-ray Timing Explorer(RXTE), INTEGRAL’s hard X-ray instruments ISGRI, SPI, and JEM-X, Swift, and Fermi/GBM.With this suite of instruments, we cover a broad range in hard-X/soft gamma-rays (∼ 10 keVto > 100 keV) and simultaneously address systematic uncertainties using very different types ofinstrumentation to demonstrate overall consistency of ourCrab results. Six instruments on foursatellites agree well from 2008 to 2010, with all instruments registering a∼ 7% decline in the 15-50keV Crab nebula + pulsar flux over two years, starting at MJD 54690, and with a similar decline inthe 50-100 keV band. Details of the analysis for each instrument are given in [5]. INTEGRAL/SPIdata [6] are compared with the other 5 instruments for the first time in this paper. Prior to the launchof Fermi in 2008, increases and decreases in flux at a level of about 3.5% per year were seen inthe 15-50 and 50-100 keV bands, back to 1999. In more recent data, since August 2010, all of theinstruments show that the Crab has stopped fading and may be beginning to brighten again.
From 1999 to 2010, the pulsed flux measured with RXTE showed only a steady decrease at∼ 0.2% yr−1, consistent with pulsar spin-down. The larger∼ 3.5% yr−1 variations are not seen inthe pulsed emission, indicating that the variations are nebular in origin [5].
In summary, the Crab is variable in hard X-rays and should notbe assumed as a constant sourcesuitable for normalizing instrument response functions orcalibrating hard X-ray instruments. Thevariations are seen in the nebular emission, apparently resulting from changes in the shock accel-eration or in the nebular magnetic field. Longer baselines and multi-wavelength observations areneeded to understand the origin of these variations.
2.2 Monitoring accreting pulsars with GBM
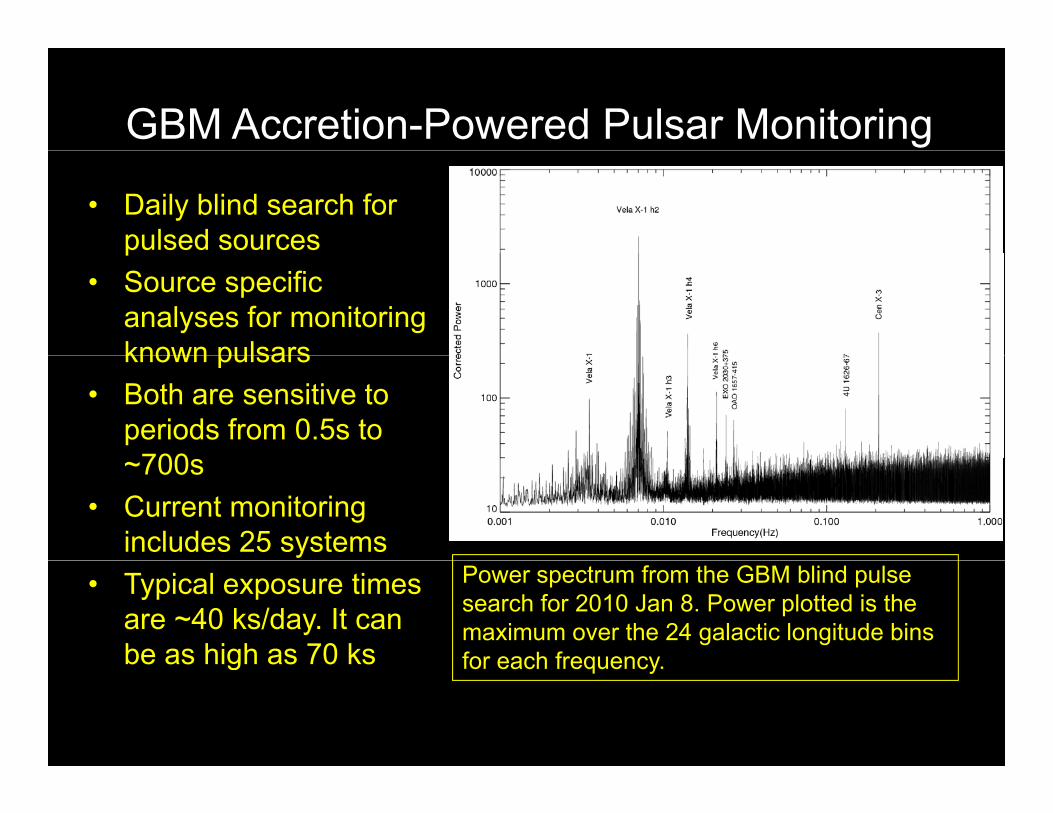
As of May 2011, the GBM accreting pulsar team is currently monitoring 29 accreting pulsarsand is performing daily blind searches for new accreting pulsars [10]. For both techniques, GBMdata with 0.256-s time resolution for the 8-12, 12-25, and 25-50 keV bands are used. First thebackground data are fitted with a spline model that accounts for Earth occultation steps from brightsources. Data including solar flares, gamma ray bursts, solar panel occultations and any otherproblems are excluded from fitting. The remaining data result in typical exposure times of 40ks per day, although for some sources the exposure time can reach 70 ks per day. For the blindsearch, power spectra are generated for each of 24 galactic longitude bins plus separate bins forthe Small and Large Magenllanic Clouds. The algorithm reports peak powers with frequenciesand the galactic longitude to find new accreting pulsars and new outbursts of known pulsars thatare not currently being monitored. Source specific searchesare being performed for 29 sources2,searching over a relatively narrow range of frequencies (and frequency derivative for some sources).Orbital parameters are accounted for if known. GBM has the advantage of long observing timesand continuous monitoring for these sources.
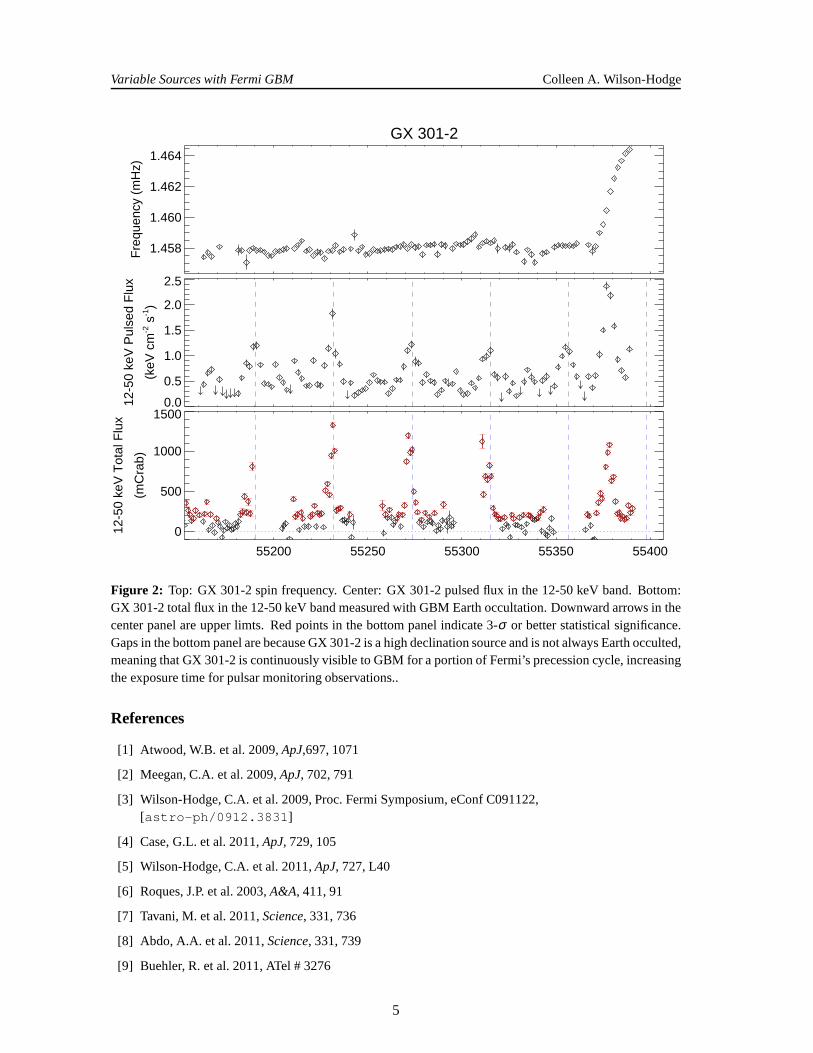
A recent highlight from GBM pulsar monitoring is the detection of an unusually bright flarenear apastron in the∼ 41.5 day orbit of GX 301-2 [11], shown in Figure 2. GX 301-2 comprises anearly B-type companion and a 680-s pulsar. Typically, GX 301-2 has a bright flare near periastronand a weak flare near apastron. The bright apastron flare detected with GBM coincides with the
2http://gammaray.nasa.gov/gbm/science/pulsar
3
Variable Sources with Fermi GBM Colleen A. Wilson-Hodge
Figure 1: Composite Crab light curves forRXTE/PCA (15-50 keV - black diamonds),Swift/BAT (Top:14-50 keV, Bottom: 50-100 keV - red filled circles),Fermi/GBM (Top: 15-50 keV, Bottom: 50-100 keV- open blue squares),INTEGRAL/SPI (Top: 25-50 keV, Bottom: 50-100 keV - light blue crosses), INTE-GRAL/ISGRI (Top: 20-50 keV, Bottom: 50-100 keV - green triangles), andINTEGRAL/JEM-X2 (10-25keV, orange asterisks). Each data set has been normalized toits mean rate in the time interval MJD 54690-54790. All error bars (exceptSwift/BAT) include only statistical errors.Vertical lines markGeV flares fromthe Crab observed with AGILE ([7], dashed lines) and Fermi LAT ([8, 9], dotted lines).
onset of rapid spin-up beginning 2010 June 25. The spin period changed by 3 seconds during thesharp rise of the flare. This episode of spin-up resembles twoepisodes observed with BATSE [12]and one observed with GBM in 2009 January.
3. Discussion
In this paper, we have described highlights of serendipitous science from the Fermi GBM,specifically from the Earth occultation monitoring and accretion powered pulsar monitoring projects.This science is beyond the primary gamma ray burst science ofGBM and is supported by theFermi Guest Investigator program. It is made possible by GBM’s large field-of-view (the entireunocculted sky), GBM’s broad energy range (8-1000 keV for the NaI detectors), and GBM’s timeresolution (0.256-s for accreting pulsar monitoring.) GBM’s near continuous data with good timeresolution enables monitoring of accretion-powered pulsar spin-frequencies, source state changes[13], quasi-periodic oscillations [10], and detections ofX-ray bursts [15]. All-sky monitors arevaluable not only as triggers for the main instrument, but also for stand alone science.
4
Variable Sources with Fermi GBM Colleen A. Wilson-Hodge
GX 301-2
1.458
1.460
1.462
1.464
Fre
quen
cy (
mH
z)
0.0
0.5
1.0
1.5
2.0
2.5
12-5
0 ke
V P
ulse
d F
lux
(keV
cm
-2 s
-1)
55200 55250 55300 55350 55400
0
500
1000
1500
12-5
0 ke
V T
otal
Flu
x
(mC
rab)
Figure 2: Top: GX 301-2 spin frequency. Center: GX 301-2 pulsed flux in the 12-50 keV band. Bottom:GX 301-2 total flux in the 12-50 keV band measured with GBM Earth occultation. Downward arrows in thecenter panel are upper limts. Red points in the bottom panel indicate 3-σ or better statistical significance.Gaps in the bottom panel are because GX 301-2 is a high declination source and is not always Earth occulted,meaning that GX 301-2 is continuously visible to GBM for a portion of Fermi’s precession cycle, increasingthe exposure time for pulsar monitoring observations..
References
[1] Atwood, W.B. et al. 2009,ApJ,697, 1071
[2] Meegan, C.A. et al. 2009,ApJ, 702, 791
[3] Wilson-Hodge, C.A. et al. 2009, Proc. Fermi Symposium, eConf C091122,[astro-ph/0912.3831]
[4] Case, G.L. et al. 2011,ApJ, 729, 105
[5] Wilson-Hodge, C.A. et al. 2011,ApJ, 727, L40
[6] Roques, J.P. et al. 2003,A&A, 411, 91
[7] Tavani, M. et al. 2011,Science, 331, 736
[8] Abdo, A.A. et al. 2011,Science, 331, 739
[9] Buehler, R. et al. 2011, ATel # 3276
5
Variable Sources with Fermi GBM Colleen A. Wilson-Hodge
[10] Finger, M.H. et al. 2009, Proc. Fermi Symposium, eConf C091122, [astro-ph/0912.3847]
[11] Finger, M.H. et al. 2010, ATel # 2712
[12] Koh, D.T. et al. 1997,ApJ, 479, 933
[13] Wilson-Hodge, C.A. & Case, G. 2010, ATel #2721
[14] Finger, M.H., Wilson-Hodge, C.A., Camero-Arranz, A. 2009, ATel #2346
[15] Linares, M. 2011, in Proceedings of The First Year of MAXI: Monitoring Variable X-ray Sources
6
All-Sky Monitoring of Variable S ith F i GBMSources with Fermi GBM
Colleen A. Wilson-Hodge (NASA/MSFC)
Co-authorsM.L. Cherry, G.L. Case (LSU), W.H. Baumgartner (NASA/CRESST), E. Beklen (METU/SDU) P N Bhat M S Briggs (UAH) A Camero-Arranz
Co authors
Beklen (METU/SDU), P.N Bhat, M.S. Briggs (UAH), A. Camero-Arranz (NSSTC), V. Chaplin, V. Connaughton (UAH), M.H. Finger (USRA), N. Gehrels (NASA/GSFC), J. Greiner (MPE), K. Jahoda (NASA/GSFC), P.
Jenke (NPP/NASA/MSFC), R.M. Kippen (LANL), C. KouveliotouJenke (NPP/NASA/MSFC), R.M. Kippen (LANL), C. Kouveliotou (NASA/MSFC), H. A. Krimm (CRESST/NASA/GSFC/USRA), E.
Kuulkers (ESA/ESAC), Niels Lund (DNSC), C.A. Meegan (USRA), L. Natalucci (INAF-IASF), W.S. Paciesas, R. Preece (UAH), J.C. Rodi
(LSU), N. Shaposhnikov, G.K. Skinner (UMD/CRESST/NASA/GSFC), D. Swartz (USRA), A. von Kienlin, R. Diehl, X-L. Zhang (MPE)
OutlineOutline
• GBM and Earth OccultationGBM and Earth Occultation• Surprising results for the Crab
GBM ti l it i• GBM accreting pulsar monitoring• Summary & Conclusions
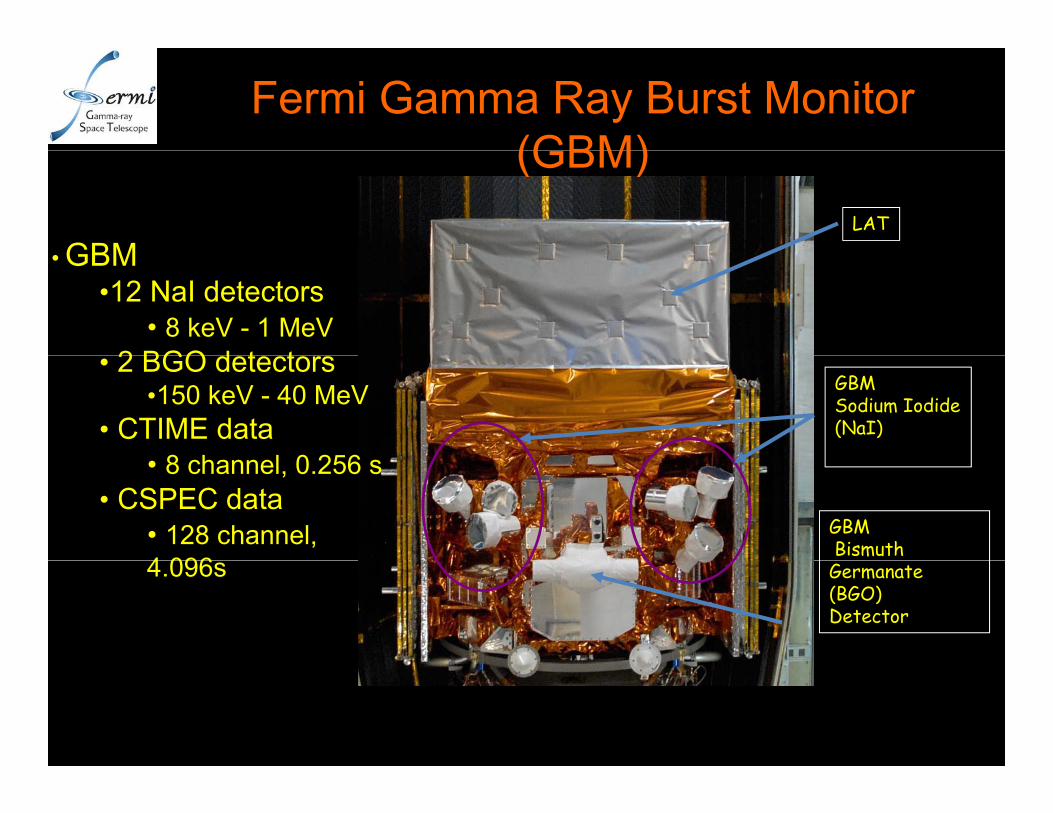
Fermi Gamma Ray Burst Monitor (GBM)
LAT
GBM
(GBM)
• GBM •12 NaI detectors
• 8 keV - 1 MeV2 BGO d t t
GBM Sodium Iodide(NaI)Detector
• 2 BGO detectors•150 keV - 40 MeV
• CTIME data8 h l 0 256
GBMBismuth
• 8 channel, 0.256 s• CSPEC data
• 128 channel, 4 096 Germanate
(BGO)Detector
4.096s
GBM Earth Occultation Techniqueq• Current catalog includes 96
sources, primarily recently active X-ray binaries the Crabactive X-ray binaries, the Crab, 5 AGN, 2 SGRs, and the Sun
• Fluxes for cataloged sources measured by fitting the change in count rate due to Earthin count rate due to Earth occultation
• Source model: assumed spectrum convolved with h i d t tchanging detector response
and atmospheric transmission• 8 energy bands in NaI or BGO
detectors• 6 persistent and 2 transient
sources detected above 100 keV; 50+ sources detected <100 keV (Case et al 2011
• Over 85% of sky viewed every orbit• Entire sky viewed every ~26 days• Sensitivity exceeds CGRO/BATSE
below 25 keV and above ~1 MeV<100 keV. (Case et al. 2011, ApJ accepted)
below 25 keV and above 1 MeV• No solar constraints
decrease at 0.2% per year consistent withyear – consistent with pulsar spin down.
• The larger ~3.5% per i ti i t
Total Flux
year variation is not seen in pulsed emission
• Likely has nebular originWilson-Hodge et al. 2011, ApJ, 727, L40
y g
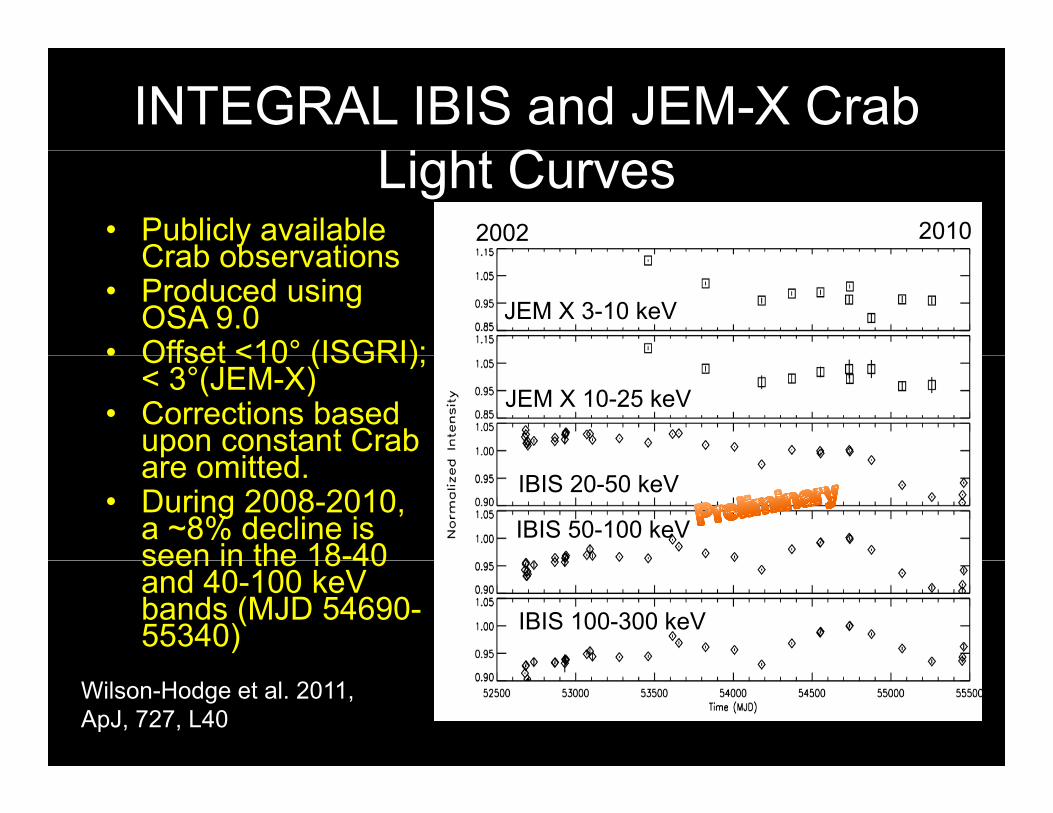
INTEGRAL IBIS and JEM-X Crab Li h CLight Curves
• Publicly available Crab observations
2002 2010Crab observations
• Produced using OSA 9.0
• Offset <10° (ISGRI);JEM X 3-10 keV
• Offset <10 (ISGRI); < 3°(JEM-X)
• Corrections based upon constant Crab
itt d
JEM X 10-25 keV
are omitted.• During 2008-2010,
a ~8% decline is seen in the 18-40
IBIS 20-50 keV
IBIS 50-100 keVseen in the 18 40 and 40-100 keV bands (MJD 54690-55340) IBIS 100-300 keV
Wilson-Hodge et al. 2011, ApJ, 727, L40
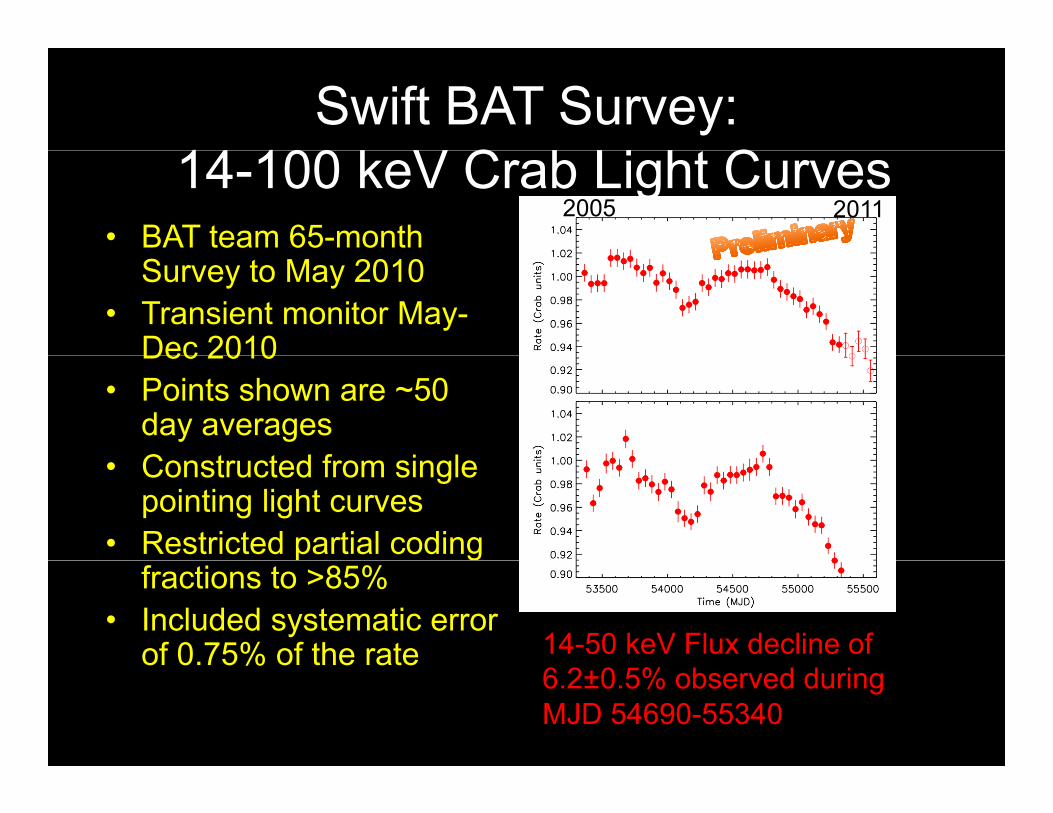
Swift BAT Survey:14 100 k V C b Li h C14-100 keV Crab Light Curves
• BAT team 65-month 2005 2011
Survey to May 2010• Transient monitor May-
Dec 2010Dec 2010• Points shown are ~50
day averagesC t t d f i l• Constructed from single pointing light curves
• Restricted partial coding gfractions to >85%
• Included systematic error of 0.75% of the rate 14-50 keV Flux decline of of 0.75% of the rate
6.2±0.5% observed during MJD 54690-55340
Comparing InstrumentsComparing Instruments• Light curves for each
instrument are normalizedGBM1999 2011
instrument are normalized to its average rate from MJD 54690-54790.
• RXTE/PCU2 - Black Di d )Diamonds)
• BAT - Red Circles• IBIS/ISGRI - Green triangles• JEM X2 Pink asterisks• JEM X2 - Pink asterisks• GBM - Blue squares• Instruments on four
separate spacecraft showseparate spacecraft show ~7% decline in Crab flux from summer 2008 to summer 2010.
Recent data since summer 2010 suggest the decline has flattened or h ibl b thas possibly begun to recover.
GBM Accretion-Powered Pulsar Monitoring
• Daily blind search for pulsed sourcesp
• Source specific analyses for monitoring known pulsarsknown pulsars
• Both are sensitive to periods from 0.5s to
700~700s• Current monitoring
includes 25 systems• Typical exposure times
are ~40 ks/day. It can be as high as 70 ks
Power spectrum from the GBM blind pulse search for 2010 Jan 8. Power plotted is the maximum over the 24 galactic longitude bins for each frequencybe as high as 70 ks for each frequency.
GX 301-2 Rapid Spin-up StateSpin Frequency
p p p• GX301-2 comprises an early B-type companion and a 680 s pulsar
12-50 keV Pulsed Flux
• GX301-2 typically has a bright flare near periastron and a weak flare near apastron.• GBM detected an unusually bright
12-50 keV Total Flux
• GBM detected an unusually bright flare near apastron in ~41.5 day orbit (Atel # 2712)• This flare coincides with the onset of rapid spin-up beginning 2010 June 25• The spin period has changed by 3 seconds during the sharp rise
seconds during the sharp rise. • This episode of spin-up resembles two episodes observed with BATSE (Koh et al. 1997) and
ith GBM i 2009 JDashed vertical lines: periastron passage one with GBM in 2009 January.
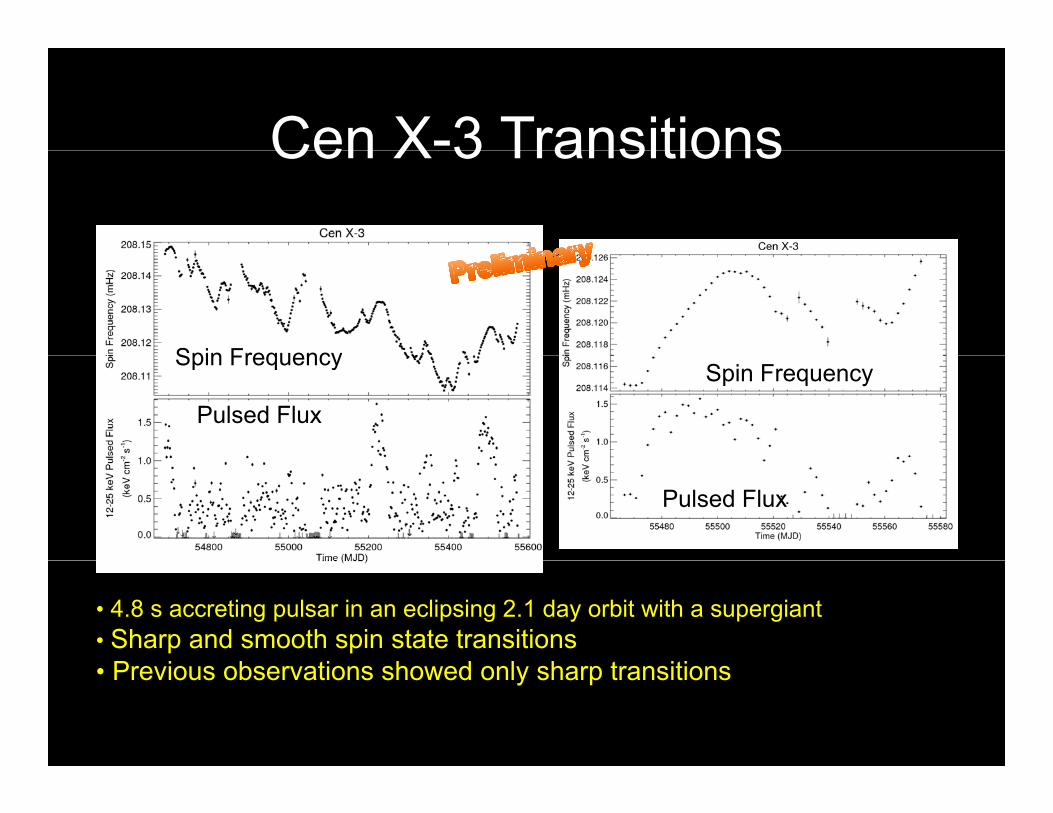
Cen X-3 TransitionsCen X 3 Transitions
Spin FrequencySpin Frequency
Pulsed Flux
Spin Frequency
Pulsed Flux
• 4.8 s accreting pulsar in an eclipsing 2.1 day orbit with a supergiant • Sharp and smooth spin state transitions
P i b ti h d l h t iti• Previous observations showed only sharp transitions
Summary & Conclusions• Four instruments (Fermi/GBM, RXTE/PCA,
Swift/BAT, INTEGRAL/ISGRI) show a ~7% (70 mCrab) decline in the Crab from 2008-2010mCrab) decline in the Crab from 2008-2010. Recent data suggest a flattening or recovery.
• This decline is not present in the pulsed flux, p pimplying changes in the shock acceleration, electron population or magnetic field structure in the nebulathe nebula.
• The Crab flickering must be considered when calibrating future X-ray timing instruments.
• Accreting pulsars remain an interesting target for secondary science with X-ray timing instruments.