All-Star Ballpark Heaven Economic and Fiscal Impact Study A Two-Phased Development Plan By Mike Lipsman Harvey Siegelman With the assistance of Wendol Jarvis Strategic Economics Group Des Moines, Iowa February 2012 www.economicsgroup.com
Transcript
All-Star Ballpark Heaven Economic and Fiscal Impact Study
A Two-Phased Development Plan
By
Mike Lipsman Harvey Siegelman
With the assistance of
Wendol Jarvis
Strategic Economics Group Des Moines, Iowa
February 2012
www.economicsgroup.com
2
Table of Contents
Executive Summary 3
Introduction 4
Purpose and Scope of the Study 4
Background 5
Description of the Area 5
All-Star Ballpark Heaven Proposal 7
Development Plan 7
Tournament and Training Program 8
Marketing, Operations and Staffing 9
Youth Baseball-Softball Training and Tournament Facility Market Analysis 10
Team Baseball and Softball Markets 10
Cooperstown Dreams Park 12
Ripken Baseball Group 13
Economic Impact 14
Local Area Demographic and Economic Profile 14
Economic Impact Estimates 18
Supply and Demand for Local Lodging 24
Area Lodging Supply 25
Fiscal Impact Estimates 28
Study Area and State Fiscal Trends 28
Individual Income Tax and Surtax 28
State and Local Option Sales Taxes 29
Hotel-Motel Taxes 31
Property Tax 31
Fiscal Impact Estimates 33
Individual Income Tax and Surtax 33
State and Local Option Sales Taxes 34
Hotel-Motel Taxes 36
Property Taxes 36
Fiscal Impact Estimates Summary 38
Appendix A - Input-Output Methodology 39
Appendix B - Statewide Input-Output Tables for All-Star Ballpark Heaven 41
Appendix C - Regional Input-Output Tables for All-Star Ballpark Heaven 45
Appendix D - Input-Output Model Assumptions 49
Appendix E - Visitor Attractions in the Surrounding Area 50
Appendix F - Go the Distance Baseball Projected Income and Expenses 53
Appendix G - Build Out Schedule - Completed Capital Development 54
3
All-Star Ballpark Heaven: Economic and Fiscal Impact Study Executive Summary
Youth sports activity is big business and getting bigger. American families spent $7 billion traveling to youth sports tournaments during 2010. According to Sports Events Magazine, over 2.2 million youth participate in Little League Baseball and over 1.2 million females ages 8 to 18 play softball.
Dyersville, Iowa has become identified with baseball. Twenty-two years after release of the film “Field of Dreams” the movie site in Dyersville continues to attract tens of thousands of tourists per year.
Go the Distance Baseball, LLC has prepared a comprehensive development and marketing plan for a youth baseball tournament and training facility for the Field of Dreams site east of Dyersville. The plan is summarized in this report.
Three facilities similar to the proposed All-Star Ballpark Heaven exist, but they are located on the East Coast and they are currently running at or near capacity. Within the Midwest there are about 750 day and weekend camps training intermediate and advanced level players that may serve as an immediate market for a top level Midwest tournament facility.
The economic impact of this proposed tournament and training facility will be considerable both to the surrounding six-county region (Buchanan, Clayton, Delaware, Dubuque, Jackson, and Jones Counties) and to the state. By the fourth year of operation, the project will result in a growth of nearly 1,200 full-time equivalent jobs. Of course most of the jobs will be part-time and concentrated in the summer months. Therefore, the number of part-time job-holders could be 3-4 times the 1,200 number.
The proposed development will involve an investment of $38 million over two phases. In the first phase, 189 construction workers will impact 306 jobs in the economy. In phase II, 156 construction jobs impact a total of 253 jobs in the state economy.
The project will add about $25 million to the labor income of the region by the eighth year of its operation. The food services and hotel and motel sectors in the six-county region will see an increase of nearly 500 jobs; retail stores and recreation, another 400 jobs each year.
The demand for hotel and motel rooms will likely significantly exceed what is currently available. When fully built out, the project will bring about 1,500 families to the area each week. The shortfall of more than a thousand rooms will likely prompt a growth in both hotel and restaurant construction in the area.
By 2017, this project is expected to result in an annual increase of $4.2 million in total state and $2.2 million in local tax receipts.
4
All-Star Ballpark Heaven: Economic and Fiscal Impact Study By Mike Lipsman and Harvey Siegelman
Strategic Economics Group January 2012
Introduction
According to the National Association of Sports Commissions (NASC), American families spent $7 billion traveling to youth sports tournaments during 2010. That amounts to about 10 percent of national leisure travel industry expenditures and spending on attending such tournaments is growing at a rate of 4 percent annually.1 Also, during 2010, according to the National Sporting Goods Association (NSGA), 280 million children between 7-18 years of age participated at least twice in one or more of 17 sports activities. The NSGA survey reports that over 26.9 million children participated in baseball and 10.8 million participated in softball. The same survey found that the central part of the United States had the highest softball participation rates.2 The proposed development by Go the Distance Baseball, LLC of a youth baseball and softball training and tournament complex at the “Field of Dreams” film site east of Dyersville will place Iowa in the forefront of the youth sports industry. This company will operate the site under the name All-Star Ballpark Heaven. This development will further enhance Iowa’s reputation as a venue for sports and recreation complementing events such as RAGBRAI, the Drake Relays, the Iowa Olympics and the Hy-Vee Triathlon, as well as local school, park and club sports programs throughout the state.
Purpose and Scope of the Study
This study analyzes the potential economic and fiscal impacts of the proposed youth baseball and softball training and tournament complex. The analysis starts with a brief history of the Field of Dreams site followed by a demographic and economic profile of the six counties surrounding this location. The counties included in the primary impact area are Buchanan, Clayton, Delaware, Dubuque, Jackson and Jones. The analysis consists of three major parts. First, the analysis presents data on baseball and softball tournaments throughout the United States. In addition, this part of the analysis provides detailed descriptions of the three facilities and programs most similar to what is proposed for the All-Star Ballpark Heaven complex. Second, the economic impact of the proposal is estimated using input-output analysis. Third, estimates are made of the revenue impacts attributable to the proposed development for individual income, sales, hotel-motel and property taxes.
1 Terry Johnson, “Youth Sports Score Big as Economic Boost,” Smiley Pete Publications
2 National Sporting Goods Association (www.nsga.org)
5
Background
In 1982 William Patrick (Ray) Kinsella, who earned a Master of Fine Arts degree in English through the Iowa Writers' Workshop, wrote the novelized biography “Shoeless Joe”, which was adapted into the movie “Field of Dreams” in 1989. In 1987, Universal Pictures began work on the film “Shoeless Joe” that would later be retitled “Field of Dreams.” In early 1988, the director selected a farm just outside of Dyersville, Iowa, perhaps fulfilling the vision of author Kinsella, and the rest is history. “Field of Dreams” is a magical film about an Iowa corn farmer, Ray Kinsella, who hears a voice telling him: "If you build it, he will come." He interprets this as an instruction to build a baseball diamond in his corn field from which will emerge the ghosts of Shoeless Joe Jackson and the other seven Chicago Black Sox players banned from baseball for throwing the 1919 World Series. The movie was nominated for three Academy Awards including Best Picture. In 2008, the American Film Institute added this film to its list of best ten classic American films in the fantasy genre. To date the film has grossed $84.4 million, and the rentals have added $30.5 million. And, people keep coming to this site. For the most recent four-year period, an estimated 65,000 visitors per year have traveled from around the world to visit the “Field of Dreams” site. It has not been uncommon on any day of the week any time of the day, to meet other travelers who had made the pilgrimage to Dyersville and joined a baseball game made up of international visitors.
Description of the Area
The site of the proposed All-Star Ballpark Heaven complex is about 26 miles west of Dubuque and 4.4 miles east of Dyersville, Iowa, a few miles north of U.S. Highway 20. Other expressway level highways that serve the area are U.S. 61, which extends south through the Iowa-Illinois Quad-Cities to St. Louis, and U.S. 151, which extends from Interstate 380 at Cedar Rapids and progresses northeast through Dubuque into Wisconsin where it connects with Interstates 39, 90, and 94 near Madison. In most cases, air travel connections would be served through the Eastern Iowa Airport at Cedar Rapids, which is located 72 miles south of Dyersville. Major carriers serving this airport include American, Delta, and United. Although there is no railroad passenger service in the area currently, plans are being developed to bring AMTRAK service from Chicago to Iowa City and possibly extend on to Omaha. Also, there have been discussions regarding the possible reestablishment of AMTRAK service from Chicago to Dubuque. The area surrounding the proposed All-Star Ballpark Heaven site contains a number of recreation, tourism and vacation attractions. The City of Dubuque has been going through a major revival over the past decade. This city, which was first settled in 1785, includes a mix of French, German, and Irish cultures. In addition, the city boasts a rich transportation history, having at one time been regional hubs for the Milwaukee and Illinois Central Railroads, been home to the world’s largest wagon manufacturer, and served as a very active Mississippi River port. Much of this heritage has been preserved through a very rich fabric of historic architecture. Much of the historic architecture is now being restored.
6
Ice Harbor looking toward the Julien Dubuque Hotel Among the major attractions in Dubuque are the National Mississippi River Museum and Aquarium, Five Flags Civic Center, the Grand Opera House, the Grand Harbor Resort and Water Park and the 4th Street (Fenelon Place) Elevator.
Five Flags Center
4th
Street Elevator
7
Currently, within a 50 mile radius of the All-Star Ballpark Heaven site, are located 81 hotels and motels, 32 bed and breakfast inns and 47 campgrounds. A list of these locations is provided in an appendix to this report. Also, within about an hour’s drive from the proposed development is the City of Galena, Illinois, which is known for its historic architecture, restaurants, specialty stores and golf and ski resorts. Another nationally known tourist attraction about an hour drive from Dubuque is Taliesin East, one of architect Frank Lloyd Wright’s studio complexes located in Spring Green, Wisconsin. The Amish Community in Hazleton about 50 miles west of Dyersville and the Czech Village and Museum in Cedar Rapids, as well as many other sites, offer opportunities to learn about the diverse populations that settled northeast Iowa. Other attractions include state, county and city parks, ethnically diverse churches and monasteries, wineries, sports facilities, art museums and galleries, rivers for fishing and canoeing and many small towns with unique Main Streets and Courthouse Squares. All of these attractions within close proximity to the proposed All-Star Ballpark Heaven site should enhance the marketability of the training and tournament programs. Conversely, the development of All-Star Ballpark Heaven should make the area more attractive for tourism and bring added economic vitality to the area’s other attractions.
All-Star Ballpark Heaven Proposal
Development Plan Description
All-Star Ballpark Heaven will be developed in two phases. The first phase will consist of 12 ball fields and stadia, an indoor training facility and clubhouse lodging accommodations for players and coaches. The baseball fields will include dugouts, spectator seating, scoreboards and lighting. The 88,000 square foot indoor training facility will include a turf infield, batting and pitching cages, speed and agility training facilities, educational classrooms, a banquet facility, a community indoor pool and a theater.
Phase I All-Star Ballpark Heaven
8
The lodging facilities will feature a clubhouse theme for each team, complete with game rooms, individual lockers, sports TV and more. Other improvements that will be added during Phase I include concessions and catering facilities, parking for spectators and improvements to the Field of Dreams field and house. Work on Phase II of the development is expected to commence about three years following completion of Phase I. During the second phase, 12 additional ball fields will be added along with additional clubhouse team lodging facilities. Other improvements that may be made to the site include an RV park and campground and recreational facilities, including a splash pad, ropes or canopy course, zip lines, arcades and a playground for younger siblings of the players. The total estimated cost of building the entire complex is $38 million.
Phase II All-Star Ballpark Heaven complete
Tournaments and Training Programs
All-Star Ballpark Heaven will offer 13 weeks of tournament play and training for boys and girls ages 8 through 14. Both baseball and softball programs will be provided. Tournament play will extend from April through November each year. Teams will be guaranteed seven games of play (weather permitting). A typical week’s schedule is as follows:
Sunday afternoon: Team registration and check-in
Sunday evening: Welcome and Opening Ceremonies
Monday: Seeding rounds begin, skills competitions in the evening
9
Tuesday: Seeding games, athletes rotate through sports leadership training
Wednesday: Seeding games conclude, special family activity night
Thursday: Tournament games begin
Friday: Tournament games conclude and Closing Ceremonies
Saturday morning: Check-out
The anticipated charges for the week long programs will be $770 per person. In addition to the week long program there will be offered 16 weeks of weekend only baseball and softball tournaments. The charges for these tournaments will be about $33 per participant. The indoor training facility and programs will be available year-round. In addition, facilities will be available for lease for other uses outside of the tournament season. Marketing, Operations and Staffing
All-Star Ballpark Heaven will be marketed nationally both as a baseball and softball training and tournament facility and as a family vacation destination. Most of the clientele for this development will come from outside Iowa. As discussed below, youth sports is a growth market and although there are many baseball and softball day camps and local tournaments, there are only a few dozen overnight programs. Only three facilities nationally provide a high-level training and tournament experience comparable to what will be offered by All-Star Ballpark Heaven. The three other comparable facilities are all located on the East Coast. Marketing All-Star Ballpark Heaven will involve a multi-track strategy. Building of the full-time marketing staff will begin in January 2013. Major features of the marketing plan include:
Establish an inbound and outbound call center database with CRM (customer relations management) capabilities to manage sales calls and capture leads and data for marketing purposes
Create a web site to handle tournament registrations and to view all family-friendly activities at the All-Star Ballpark Heaven site as well as surrounding attractions
Development of a nationwide email campaign aimed at current youth baseball and softball coaches through lists that target this audience
Print advertising placed in select journals and magazines targeted to youth baseball and softball participants and coaches
Place advertising on selected youth baseball and softball web sites
Enhance current social media and list-building efforts on Facebook and Twitter
Improve and expand the Field of Dreams e-commerce web site
Attend and sponsor a booth at national baseball coach conventions When at full capacity, the facility will be able to serve 120 teams per week. At full capacity, All-Star Baseball Heaven will employ 86 people, with 24 people employed the entire year. In addition to services
10
provided by company employees, many support services will be obtained from local contractors. For example, when at full capacity, an estimated 6,000 meals will be served daily, prepared in an on-site industrial style kitchen by a locally contracted caterer. The full-time staff will include a general manager and a three person marketing staff. Other key full-time staff will include a training director, tournament director, groundskeeper/facilities supervisor, accounting director and tourism director. Nine other full-time staff will support the training facility. One full-time and three part-time employees will maintain and staff the Field of Dreams site.
Youth Baseball-Softball Training and Tournament Facility Market Analysis Team Baseball and Softball Markets
United States Specialty Sports Association (USSSA) Baseball says its team roster has grown from 1,000 in 1997 to over 40,000 by 2007.3 According to SportsEvents Magazine, “Tournament play is a major growth area for baseball and softball organizations.” Statistics from a 2008 USA Sports Participation Survey, conducted by the Sporting Goods Manufacturers Association (SGMA), indicate that more than 16 million people in the United States play baseball, more than 2.3 million play fastpitch softball and nearly 9.5 million play slowpitch softball. According to Mike May, director of communications for SGMA, “Baseball and softball have more organizations than any other sport.”4 Focusing in on the youth sports markets, an estimated 2.2 million players on 7,000 plus teams play Little League Baseball and 60,000 players participate in AAU Baseball. The Amateur Softball Association estimates over 1.2 million girls ages 8 through 18 play softball with approximately 83,000 playing fastpitch softball.5 The iSport website currently documents nearly 1,800 youth baseball training camps across the United States.6 In addition, there are several youth baseball tournament organizations that have established playoffs, including Nike Sports Camps, US Sports Camps, Florida Coast Baseball Camps, ABC Baseball Camps and NBC Baseball Camps. As an indicator of the prevalence of these camps and tournaments, InfoSports.com has already listed four baseball tournaments scheduled in Iowa communities this summer.7 They are:
Table 1 shows how many youth baseball camps are located in Iowa and the surrounding states. Most of these are full or half-day camps or summer camps. Only 41 across the nation and two in our region are listed as overnight camps (one in Cedar Rapids). These camps attract players whose skills range from beginners to advanced.
Table 1. Baseball Camps for Beginners through Advanced Players
State Half-Day Full Day Overnight Summer Other Total
Illinois 27 11 0 5 0 61
Iowa 3 0 1 0 0 7
Kansas 2 1 1 1 0 16
Minnesota 9 16 0 5 0 63
Missouri 3 7 0 3 1 27
Nebraska 0 3 0 0 2 11
North Dakota 1 0 0 0 0 5
South Dakota 1 0 0 0 2 5
Wisconsin 11 3 0 1 0 45
Total Region 57 41 2 15 5 240
Total US 306 345 41 789 5 1,793
Table 2 shows only camps that seek to attract those individuals who are identified as intermediate or advanced players. Nationally and regionally, the numbers now drop by about half. Only one camp in our region (the Cedar Rapids camp) and only 12 across the nation provide an overnight week-long experience. These are listed in Table 3. Only one of these 12 camps provides their services to girls as well as boys.
Table 2. Baseball Camps for Intermediate or Advanced Players
State Half-Day Full Day Overnight Summer Other Total
Illinois 27 9 0 5 0 41
Iowa 3 0 1 0 0 4
Kansas 2 0 0 1 0 3
Minnesota 5 11 0 5 0 21
Missouri 3 5 0 3 1 12
Nebraska 0 2 0 0 2 4
North Dakota 1 0 0 0 0 1
South Dakota 1 0 0 0 2 3
Wisconsin 11 0 0 1 0 12
Total Region 53 27 1 15 5 101
Total US 214 249 12 252 5 756
12
Table 3. Overnight Camps for intermediate or Advanced Players
State City Gender Age Fee
California Redlands Male 7-18 $495
Colorado Denver Male 7-18 $395
DC Male 7-18 $495
Florida Lakeland Male 12-18 $699-$899
Iowa Cedar Rapids Male 7-18 $395
Maryland Bel Air Male 7-18 $395
Michigan Spring Arbor Male 7-18 $395
New Jersey Atlantic City Male 7-20 $175-$250
New York Milford Male 5-18 $795
North Carolina Rocky Mount Male 7-19 $395
Rhode Island Smithfield Coed 13-18
Washington Sammamish Male 5-19 $379-$499
Source: iSport.com and US Sports Camps
In addition to these camps, three facilities provide a first-class experience of training and tournaments for youth baseball enthusiasts. They are Cooperstown Dreams Park, home of the American Youth Baseball Hall of Fame and two sites run by the Ripken brothers, Cal, Jr. and Bill. These three facilities are most like what the developers of the proposed All Star Ballpark Heaven have in mind for the Dyersville site. The intermediate and advanced players in the surrounding states are most likely to be the potential immediate market for the new facility. As the developers build out to Phase II of their plan, their market will likely match that of the three high-end facilities. For that reason, we examined each of those three.
Cooperstown Dreams Park
The Cooperstown facility was built in 1996 and consists of 22 ball fields about four miles south of Cooperstown, NY. It hosts more than 1,200 teams and a total of more than 14,000 players each year (http://www.cooperstowndreamspark.com/thedream.html). The cost to participate is currently $795 per player and/or coach (minimum of 11 players and 2 coaches). That provides a total team cost of at least $10,348. This includes meals and accommodations, player uniforms and warm up clothes, insurance, laundry service and a DVD of their team performance. In addition to the registration fees, the operation is also partially supported by a host of corporate sponsors including:
In addition to the permanent staff, Cooperstown provides more than 400 summer jobs.
Ripken Baseball Group
The Ripken sites are located in Myrtle Beach, SC and Aberdeen, MD.
The Aberdeen facility is home of the Single A affiliate Aberdeen IronBirds. Ripken Stadium opened in 2002 with a capacity of 6,300. “The idea of The Aberdeen Project probably started on September 6, 1995, the night that Cal Ripken, Jr. became baseball's all-time "Ironman" when he played in his 2,131st consecutive game. That evening Cal received a $75,000 gift from the Major League Baseball Player's Association to build a "Field of Dreams" in the Ripken hometown of Aberdeen, MD. ”8 Ripken Baseball uses West Nottingham Academy to house overnight campers. West Nottingham Academy is the country's oldest boarding school, and the picturesque campus gives campers the look and feel of a college campus. West Nottingham Academy features:
Air-conditioned dorms or bunk houses Large cafeterias TV lounges and game rooms
“Week-long day and overnight camps are available throughout the summer months at Ripken Academy. In 2010, we had over 1,500 softball and baseball campers come through the complex!”9 Amenities include Orioles games at Camden Yards, Iron Birds games, mini golf, swimming, jerseys and caps. Typically, the camp sessions consist of between 200-250 players each week. The Aberdeen tournaments are held at the Ripken Baseball Academy in Aberdeen, MD. It consists of a youth-sized version of Oriole Park at Camden Yards, known as Cal Sr.'s Yard and youth-sized replicas of Wrigley Field, Fenway Park, Memorial Stadium and four skinned softball fields. The fall 2012 week long tournaments cost $995-$1,045 per team. As of January 21, all but 19 of the 66 scheduled tournament sessions from March through August had been sold out. The Myrtle Beach tournament facilities opened in June 2006. Phase 1 of the complex consists of 7 fields: 2 regulation-sized diamonds and 5 youth diamonds constructed with a synthetic turf infield and outfield. Teams are provided two or three (depending on team size) luxury condominiums at Myrtlewood Villas. However, they also offer a non-accommodations package at about $525 for teams that prefer to make separate arrangements for staying in the Myrtle Beach area.
The 2012 tournaments cost from $550-$705 per team. So far, 15 of the 65 scheduled sessions between February and November are sold out. In addition to the registration fees, the operations at the two sites are also partially supported by a host of corporate sponsors, including:
Rawlings
Eastbay
Lowes Foods
Cooperstown Bat Company
League Athletics.com
Gatorade
All American Imaging
Best Golf Cars
Dick’s Sporting Goods
Turface Athletics
Cages Plus
Baseball America
Wendy’s
PitchingMachinesNow.com
Under Armour
Coca Cola Zero
Myrtle Beach Pelicans Baseball
MagnaCoach
New Era
Union Memorial/MedStar Health Family and fan accommodations in Aberdeen include Courtyard, Springhill Suites and Fairfield Suites, Fairfield Inn by Marriott, Wingate by Wyndham and Candlewood Suites. Hotel accommodations in Myrtle Beach include Myrtlewood Villas, Courtyard by Marriott, Myrtle Beach Seaside Resorts, Caravelle Resort, Ripken Hotels, Sheraton Myrtle Beach Convention Center Hotel, Ocean Dunes Resort and Villas, Myrtle Beach Comfort Suites, Hampton Inn, Dayton House Resort, Holiday Inn Express and Kingston Plantation Villas.
Economic Impact Analysis
Local Area Demographic and Economic Profile
According to the 2010 Census, the six counties (Buchanan, Clayton, Delaware, Dubuque, Jackson and Jones) that are the focus of this study had a population of 190,990, which equaled 6.27 percent of the State’s total population. As shown in Table 4, the population of this area has remained relatively flat over the past four decades declining by 1,464 (0.76%) over that period. During the past decade and over the past four decades only Dubuque and Jackson Counties experienced population increases. Dubuque County’s population increased by 4,510 (5.06%) between 2000 and 2010 and by 3,044 (3.36%) over the past four decades. Jackson County’s population increased by 417 (2.06%) between 2000 and 2010 and by 770 (2.88%) over the past four decades. Population increased statewide over the past decade and over the past four decades by 220,987 (4.10%) and by 120,031 (7.82%), respectively. Thus, the region surrounding the Field of Dreams site has significantly trailed the state in population growth both over the past decade and the past four decades. However, Dubuque County has exhibited renewed vitality over the past decade as evidenced by the development of its Ice Harbor area, the restoration of numerous historical buildings and the attraction of new employers such as IBM. Table 5 shows that employment growth in the study area has also trailed the state’s growth. While total jobs statewide increased by 50.31 percent during the past four decades, job growth within the study
15
area increased by 41.30 percent. But again, two of the six counties did exceed the state growth rate over the past decade. Job growth between 2000 and 2009 in Delaware County equaled 232 (2.20%) and job growth in Dubuque County equaled 2,916 (4.68%).
Table 4. Decennial Population, 1970 - 2010
Co No County
Decennial Population Counts
1970 1980 1990 2000 2010
10 Buchanan 21,762 22,900 20,844 21,093 20,958
22 Clayton 20,606 21,098 19,054 18,678 18,129
28 Delaware 18,770 18,933 18,035 18,404 17,764
31 Dubuque 90,609 93,745 86,403 89,143 93,653
49 Jackson 20,839 22,503 19,950 20,296 19,848
53 Jones 19,868 20,401 19,444 20,221 20,638
Region 192,454 199,580 183,730 187,835 190,990
State 2,825,368 2,913,808 2,776,755 2,926,324 3,046,355
Region Share 6.81% 6.85% 6.62% 6.42% 6.27%
Co No County
Population Change
1970 - 80 1980 - 90 1990 - 00 2000 - 10 1970 - 10
10 Buchanan 1,138 -2,056 249 -135 -804
22 Clayton 492 -2,044 -376 -549 -2,477
28 Delaware 163 -898 369 -640 -1,006
31 Dubuque 3,136 -7,342 2,740 4,510 3,044
49 Jackson 1,664 -2,553 346 -448 -991
53 Jones 533 -957 777 417 770
Region 7,126 -15,850 4,105 3,155 -1,464
State 88,440 -137,053 149,569 120,031 220,987
Region Share 8.06% 11.56% 2.74% 2.63% -0.66%
Co No County
Population Percent Change
1970 - 80 1980 - 90 1990 - 00 2000 - 10 1970 - 10
10 Buchanan 5.23% -8.98% 1.19% -0.64% -3.69%
22 Clayton 2.39% -9.69% -1.97% -2.94% -12.02%
28 Delaware 0.87% -4.74% 2.05% -3.48% -5.36%
31 Dubuque 3.46% -7.83% 3.17% 5.06% 3.36%
49 Jackson 7.99% -11.35% 1.73% -2.21% -4.76%
53 Jones 2.68% -4.69% 4.00% 2.06% 3.88%
Region 3.70% -7.94% 2.23% 1.68% -0.76%
State 3.13% -4.70% 5.39% 4.10% 7.82%
16
Table 5. Total Employment, 1970 - 2009
Co No County
Total Employment
1970 1980 1990 2000 2009
10 Buchanan 7,585 8,515 8,579 9,938 9,836
22 Clayton 8,593 10,000 9,961 11,844 10,971
28 Delaware 6,752 8,148 8,532 10,537 10,769
31 Dubuque 43,244 52,948 55,086 62,370 65,286
49 Jackson 8,254 9,345 9,848 10,700 9,917
53 Jones 7,827 8,742 8,502 9,546 9,451
Region 82,255 97,698 100,508 114,935 116,230
State 1,294,601 1,536,822 1,634,995 1,920,708 1,945,942
Region Share 6.35% 6.36% 6.15% 5.98% 5.97%
Co No County
Total Employment Change
1970 - 80 1980 - 90 1990 -00 2000 - 09 1970 - 09
10 Buchanan 930 64 1,359 -102 2,251
22 Clayton 1,407 -39 1,883 -873 2,378
28 Delaware 1,396 384 2,005 232 4,017
31 Dubuque 9,704 2,138 7,284 2,916 22,042
49 Jackson 1,091 503 852 -783 1,663
53 Jones 915 -240 1,044 -95 1,624
Region 15,443 2,810 14,427 1,295 33,975
State 242,221 98,173 285,713 25,234 651,341
Region Share 6.38% 2.86% 5.05% 5.13% 5.22%
Co No County
Total Employment Percent Change
1970 - 80 1980 - 90 1990 -00 2000 - 09 1970 - 09
10 Buchanan 12.26% 0.75% 15.84% -1.03% 29.68%
22 Clayton 16.37% -0.39% 18.90% -7.37% 27.67%
28 Delaware 20.68% 4.71% 23.50% 2.20% 59.49%
31 Dubuque 22.44% 4.04% 13.22% 4.68% 50.97%
49 Jackson 13.22% 5.38% 8.65% -7.32% 20.15%
53 Jones 11.69% -2.75% 12.28% -1.00% 20.75%
Region 18.77% 2.88% 14.35% 1.13% 41.30%
State 18.71% 6.39% 17.47% 1.31% 50.31%
Source: Bureau of Economic Analysis (BEA)
Notes: (1) Total employment is defined as the number of jobs. One person may hold more than one job.
So, total employment reported by BEA does not equal total employment reported by the Bureau of Labor Statistics (BLS).
(2) 2010 employment numbers will be released April 25, 2012.
Region 1,079,758 1,018,677 1,791,412 1,728,628 5,618,475
State 17,431,581 18,575,084 31,733,387 30,610,777 98,350,829
Region Share 6.19% 5.48% 5.65% 5.65% 5.71%
Co No County
Non-Farm Personal Income Percent Change
1970 - 80 1980 - 90 1990 -00 2000 - 09 1970 - 09
10 Buchanan 218.71% 53.23% 68.66% 32.35% 990.08%
22 Clayton 178.46% 58.89% 76.76% 28.66% 906.23%
28 Delaware 219.36% 74.54% 72.46% 37.60% 1222.79%
31 Dubuque 171.54% 62.48% 63.27% 43.19% 931.47%
49 Jackson 190.05% 50.42% 64.83% 39.51% 903.32%
53 Jones 173.37% 63.74% 69.55% 30.34% 889.21%
Region 182.31% 60.92% 66.58% 38.57% 948.62%
State 178.69% 68.32% 69.34% 39.50% 1008.19%
Notes:
(1) Source: Bureau of Economic Analysis (BEA)
(2) 2010 personal income data will be released April 25, 2012.
18
Table 6 shows that the study area’s share of state non-farm personal income has been in decline since 1980. In 1970, the study area accounted for 6.07 percent of the state’s non-farm personal income. The share increased slightly to 6.15 percent in 1980, but then over the next three decades the share dropped to 5.75 percent. The decrease may seem small, but if the 6-county study area had maintained the same share as in 1980, non-farm personal income in the area during 2009 would have been $43.2 million higher. These statistics provide baselines for the comparison of economic impacts resulting from the development of the All-Star Ballpark Heaven complex. These estimates are derived using an Iowa input-output (IMPLAN) model.
Economic Impact Estimates
This study is primarily concerned with analyzing the demand-side effects of the All-Star Ballpark Heaven project on the state economy and it also looks at the impact on a local six-county region (Buchanan, Clayton, Delaware, Dubuque, Jackson and Jones). It investigates the effects on the state and regional economies based on the various goods and services that the project, its employees, vendors, participants and visitors purchase. These effects are quantifiable. Supply-side effects, or the indirect effects that the project would have on the area, are also important to evaluate, although more difficult to quantify. For example, the presence of this high-end recreation complex can help the near-by communities attract new businesses. This study does not attempt to estimate the value of this indirect benefit even though it may become a substantial asset to business recruiters. By providing access to the tournaments, the training facility and the swimming pool, the project will enhance the quality of life for the citizens of the region. The methodology employed in this study involved examining data for four types of the activities of the project:
For each of these components and for the total, the study examined the impact on the area economies using four metrics or indicators:
1. Jobs: the estimate of annual full-time person-years of job growth that this activity generated.
2. Labor Income: the measure of increased personal income as a result of this economic activity.
This consists of employee compensation and proprietary income, which includes payments
received by self-employed individuals as income.
19
3. Output Production: a measure of the increased value of all goods, services and labor within the
service area because of this economic activity. At the state level, it represents the growth that
occurred in the State Gross Domestic Product.
4. Value Added consists of four components: employee compensation, proprietors’ income, other
property income, and indirect business taxes.
In each case – output, income and jobs – the total impact is the sum of the following factors:
1. Direct Effect: the initial economic activity of the project that drives the subsequent effect on
other sectors of the economy.
2. Indirect Effects: inter-industry transactions that will result from purchases made from project
suppliers. Supplier employment loss or gain as a result of the direct effects would be the
indirect effects.
3. Induced Effects: the effects of the changes in household income as a result of employees hired
or laid-off by the company and its suppliers. These changes affect the related industries.
Figure 1 depicts the two construction phases and the eight years of operational activity. The economic impact was estimated for each of these periods using an Iowa IMPLAN Input-Output Model (See Appendix A for a detailed description of the IMPLAN model).
Figure 1. Structure of the Analysis
Data Input
Impact Outputs
Direct Effect
Indirect Effects
Construction
Direct
Phase I
Indirect Jobs
Year 0
Induced
Operations
Direct Labor
Income Year 1-3
Indirect
Construction
Induced
Phase II
Direct
Value Added
Year 3
Indirect
Operations
Induced
Years 4-8
Direct
Indirect Output
Induced
Table 7 shows that in year 0, the economic impact of the construction activity on Iowa would be an increase of $37.1 million in output, $13.2 million increase in labor income and an additional 306 full-time equivalent jobs. In each instance, the largest portion of that benefit was concentrated in the six-
20
county region around the Dubuque-Dyersville site. 10 In the first year of operations, the job growth would be 350, increasing to 1,422 by the eighth year. The additional labor income would be $8.3 million, growing to $34.1 million by year eight. Again, in each year and for each measure, between 70% and 90% of the benefit would be concentrated in the six-county region.
Table 7. Economic Impact of All Star Ballpark Heaven - Selected Years
Area Impacted
Year 0 Year 1 Year 3 Year 4 Year 8
Construction Operation Const &
Operation Operation Operation
Statewide Economic Impact
Jobs 306 350 906 1,161 1,422
Labor Income ($1,000s) $13,181 $8,383 $26,533 $27,836 $34,101
Value Added ($1,000s) $17,402 $14,424 $41,292 $48,022 $58,829
Tables 8 through 11 show the year-by-year pattern of economic growth that the IMPLAN model projects. In year three, the developer plans to begin construction of the second phase (an additional 12 ball fields, additional lodging facilities and additional parking. Thus, in that year we see both the construction impact and the impact of operations.
10
Throughout this report, numbers in tables and charts may not add up to the totals because of individual rounding of the components.
21
Table 8. Statewide Economic Impact - Phase I
Measure Year 0 Year 1 Year 2 Year 3
Construction
Jobs 306 253
Labor Income ($1,000s) $13,181 $10,894
Value Added ($1,000s) $17,402 $14,383
Output ($1,000s) $37,046 $30,618
Operation
Jobs 350 507 653
Labor Income ($1,000s) $8,383 $12,149 $15,639
Value Added ($1,000s) $14,424 $20,904 $26,909
Output ($1,000s) $25,746 $37,311 $48,030
Total Impact
Jobs 306 350 507 906
Labor Income ($1,000s) $13,181 $8,383 $12,149 $26,533
Value Added ($1,000s) $17,402 $14,424 $20,904 $41,292
Output ($1,000s) $37,046 $25,746 $37,311 $78,648
Table 9. Six-County Economic Impact - Phase I
Measure Year 0 Year 1 Year 2 Year 3
Construction
Jobs 293 242
Labor Income ($1,000s) $12,400 $10,249
Value Added ($1,000s) $15,969 $13,199
Output ($1,000s) $34,169 $28,241
Operation
Jobs 289 419 540
Labor Income ($1,000s) $6,194 $8,976 $11,555
Value Added ($1,000s) $10,068 $14,590 $18,782
Output ($1,000s) $23,203 $33,626 $43,286
Total Impact
Jobs 293 289 419 782
Labor Income ($1,000s) $12,400 $6,194 $8,976 $21,804
Value Added ($1,000s) $15,969 $10,068 $14,590 $31,980
Output ($1,000s) $34,169 $23,203 $33,626 $71,527
22
Table 10. Statewide Economic Impact - Phase II
Measure Year 4 Year 5 Year 6 Year 7 Year 8
Construction
Jobs
Labor Income ($1,000s)
Value Added ($1,000s)
Output ($1,000s)
Operation
Jobs 1,161 1,239 1,302 1,362 1,422
Labor Income ($1,000s) $27,836 $29,708 $31,213 $32,656 $34,101
Value Added ($1,000s) $48,022 $51,251 $53,847 $56,337 $58,829
Charts 1 and 2 display the year-to-year pattern of projected growth in jobs and labor income that would be generated by this project.
0
200
400
600
800
1,000
1,200
1,400
1,600
Year 0 Year 1 Year 2 Year 3 Year 4 Year 5 Year 6 Year 7 Year 8
Chart 1. Economic Impact - Jobs
Statewide
Region
$0
$5,000
$10,000
$15,000
$20,000
$25,000
$30,000
$35,000
$40,000
Year 0 Year 1 Year 2 Year 3 Year 4 Year 5 Year 6 Year 7 Year 8
Chart 2. Economic Impact - Labor Income ($1,000s)
Statewide
Region
24
Table 12 shows the types of full-time equivalent annual jobs that would be created by year four of operations. The table is also included in Appendix B and C along with comparable tables for both the statewide and regional analysis for each component of the project.
Services to buildings and dwellings 9 $192 $263 $536
Offices of physicians, dentists and other health practitioners 8 $634 $676 $1,120
All Others 187 $7,814 $13,586 $25,709
Total 1,161 $27,836 $48,022 $83,658
To summarize, by the eighth year of operation this project should generate about 1,400 new jobs, about 1,200 of them in the six-county region. It should add about $34.1 million in payrolls, about $25 million within the region. And, it should increase the value of goods and services produced by about $102 million for the state and about $92 million for the region.
Supply and Demand for Local Lodging The developer’s pro forma income statement shows a projected pattern of growth assuming 40% of full capacity utilization of the 12-field operation in year one to 92% of the 24-field operation in year eight. Full capacity is defined as 16 persons per team (including two coaches and 2 umpires), two teams per game, 60 games per day or 960 persons for Phase I (years one through three). In Phase 2, the numbers would double to 1,920 participants with 24 fields and 60 games per day.
25
Table 13. Pro Forma Tournament Assumptions
Measure Phase 1 Phase 2
Fields (including indoor) 12 24
Weeks 13 13
Weekends 16 16
Days per Week long Events 65 65
Days per Weekend Events 32 32
Games per Day 60 120
People per Team 16 16
Total number of Teams 60 120
People-Days per Week long Events 62,400 124,800
People-Days per Weekend Events 30,720 61,440
Number of Participants (at capacity) 960 1,920
Using the growth factor and the participation rates in the pro forma documents prepared by the developer, we analyzed whether or not the local lodging market would be able to accommodate the families and fans of the program participants.
Area Lodging Supply Table 14 lists the 26 hotels and motels (2,176 rooms) within the market area of the project. Most likely families of the tournament and training participants will stay at one of these facilities. There are a handful of bed and breakfast facilities in the area but they are not likely to fill much of the lodging needs. There are twelve state and county campsites11 in the two-county area but their spots are often filled before the summer season begins. Table 15 shows average monthly occupancy rates for hotel and motel rooms available in the City of Dubuque according to reports gathered by the Dubuque Convention & Visitors Bureau Welcome Center in 2011. The average occupancy rate for the year was 58.5%, but the seasonal variance was great. We have identified two groups of months that appear to be relevant to this project: the summer (June-August), which would include the 13-week tournament period and the off-season (all other months) in which the 16-weekend training sessions would be scheduled.
11
These campgrounds have a combined 632 RV sites available.
26
Table 14. Lodging Available Near the Project Site
Name City Zip code Rooms
Baymont Inn & Suites Dubuque 52003 85
Best Western Plus Dubuque Hotel & Conference Center
Dubuque 52003 151
Canfield Hotel Dubuque 52001 60
Comfort Inn Dubuque 52003 52
Country Inn & Suites Dubuque 52003 69
Days Inn Dubuque Dubuque 52003 161
Econo Lodge Inn & Suites Dubuque 52003 58
Fairfield Inn Dubuque 52003 56
Glenview Motel Dubuque 52003 30
Grand Harbor Resort and Waterpark Dubuque 52001 193
Hampton Inn Dubuque Dubuque 52003 97
Hilton Garden Inn Dubuque Downtown
Dubuque 52001 116
Holiday Inn Dubuque/Galena Dubuque 52001 193
Holiday Inn Express Dubuque 52002 87
Hotel Julien Dubuque Dubuque 52001 133
MainStay Suites Dubuque 52002 75
Motel 6 Dubuque 52003 97
Super 8 Motel Dubuque 52003 67
Terrace Motel & Suites Dubuque 52002 87
Timmerman's Hotel Resort East Dubuque 61025 74
Comfort Inn Dyersville Dyersville 52040 50
Dyersville Super 8 Motel Dyersville 52040 45
Days Inn Manchester 52057 43
Super 8 Motel Manchester 52057 49
AmericInn Motel Peosta 52068 48
Total 2,176
The average hotel occupancy rate during the summer season in 2011 was 70.4%. Assuming similar rates for future years in the absence of this project, on average 643 hotel and motel rooms would be available on any given day. Similarly, during the off-season the average occupancy rate was 54.6%, leaving 989 rooms available. These numbers represent our measure of available supply.
27
Table 15. Area Lodging Rooms Available
Month Occupancy Rate
Available Capacity
January 42.2% 1,258
February 46.3% 1,169
March 53.0% 1,023
April 57.0% 936
May 61.0% 849
June 69.0% 675
July 71.4% 622
August 70.9% 633
September 71.7% 616
October 70.6% 640
November 49.7% 1,095
December 39.5% 1,316
Average Summer 70.4% 643
Average Off-Season 54.6% 989
Now, let’s look at the demand for lodging that will be added as a result of this project. In Table 13, we identify the capacity of participants that the developers planned for in Phases I and II and also what the developers budgeted for an increasing attendance rate from 40% in the first year. Table 16 shows those numbers where 40% of 960 equals 384 in year 1 and 92% of 1,920 equals 1,766 in year 8.
Table 16. Family Lodging Availability Near the Project Site - Week long Occupants
Year Attendance Percentage Participants
80% Family Attendance
Lodging Rooms Needed
Lodging Rooms
Available Shortfall of
Rooms
1 40% 384 307 461 643 -182
2 60% 576 461 691 643 48
3 80% 768 614 922 643 279
4 84% 1,613 1,290 1,935 643 1,292
5 86% 1,651 1,321 1,981 643 1,338
6 88% 1,690 1,352 2,028 643 1,385
7 90% 1,728 1,382 2,074 643 1,431
8 92% 1,766 1,413 2,120 643 1,477
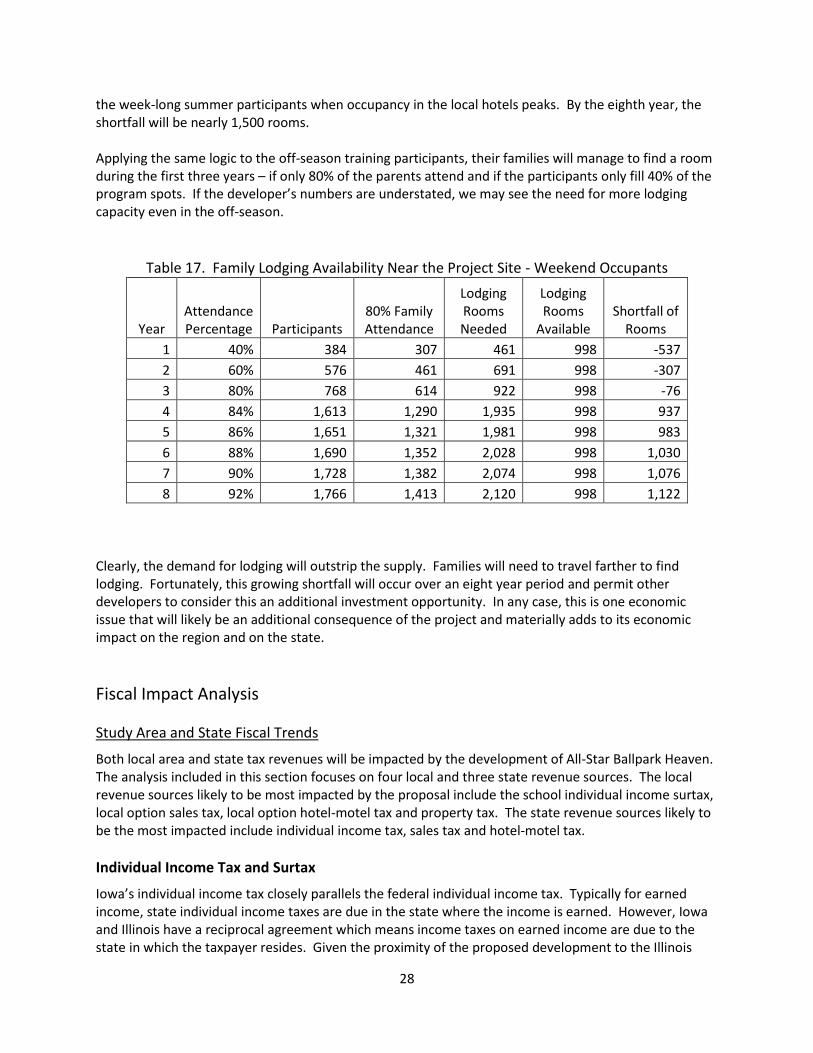
If we assume that 80% of the participants are accompanied by their families, and if the average family requires 1.5 hotel rooms, then we will see a shortfall of 48 rooms by the second year. This will be for
28
the week-long summer participants when occupancy in the local hotels peaks. By the eighth year, the shortfall will be nearly 1,500 rooms. Applying the same logic to the off-season training participants, their families will manage to find a room during the first three years – if only 80% of the parents attend and if the participants only fill 40% of the program spots. If the developer’s numbers are understated, we may see the need for more lodging capacity even in the off-season.
Table 17. Family Lodging Availability Near the Project Site - Weekend Occupants
Year Attendance Percentage Participants
80% Family Attendance
Lodging Rooms Needed
Lodging Rooms
Available Shortfall of
Rooms
1 40% 384 307 461 998 -537
2 60% 576 461 691 998 -307
3 80% 768 614 922 998 -76
4 84% 1,613 1,290 1,935 998 937
5 86% 1,651 1,321 1,981 998 983
6 88% 1,690 1,352 2,028 998 1,030
7 90% 1,728 1,382 2,074 998 1,076
8 92% 1,766 1,413 2,120 998 1,122
Clearly, the demand for lodging will outstrip the supply. Families will need to travel farther to find lodging. Fortunately, this growing shortfall will occur over an eight year period and permit other developers to consider this an additional investment opportunity. In any case, this is one economic issue that will likely be an additional consequence of the project and materially adds to its economic impact on the region and on the state.
Fiscal Impact Analysis
Study Area and State Fiscal Trends
Both local area and state tax revenues will be impacted by the development of All-Star Ballpark Heaven. The analysis included in this section focuses on four local and three state revenue sources. The local revenue sources likely to be most impacted by the proposal include the school individual income surtax, local option sales tax, local option hotel-motel tax and property tax. The state revenue sources likely to be the most impacted include individual income tax, sales tax and hotel-motel tax.
Individual Income Tax and Surtax
Iowa’s individual income tax closely parallels the federal individual income tax. Typically for earned income, state individual income taxes are due in the state where the income is earned. However, Iowa and Illinois have a reciprocal agreement which means income taxes on earned income are due to the state in which the taxpayer resides. Given the proximity of the proposed development to the Illinois
29
border, this feature of the income tax system may have a minor impact on additional individual income taxes attributable to the development. Iowa allows school districts to impose a surtax on the amount of state individual income tax owed by taxpayers. The surtax may be imposed at rates up to 20 percent. Additional income resulting directly and indirectly from the proposed development may be expected to increase these local revenues. Table 18 shows statewide and the 6-county study area state individual income tax and school district surtax payments over the past decade.
Table 18. Individual Income Taxes
Year
State Individual Income Tax School Income Surtax
Statewide ($1,000,000s)
6-County ($1,000,000s) Share
Statewide ($1,000,000s)
6-County ($1,000,000s) Share
2000 1,791.2 101.5 5.67% 44.5 1.9 4.34%
2001 1,701.5 96.4 5.67% 46.8 1.9 3.98%
2002 1,732.9 99.6 5.75% 52.2 2.7 5.24%
2003 1,855.0 105.8 5.70% 58.8 3.2 5.38%
2004 2,035.4 115.1 5.65% 69.2 3.5 5.13%
2005 2,151.7 123.3 5.73% 75.8 3.7 4.87%
2006 2,314.9 131.0 5.66% 83.5 4.1 4.90%
2007 2,543.0 139.7 5.49% 94.6 4.5 4.77%
2008 2,481.3 139.5 5.62% 96.5 4.9 5.07%
2009 2,438.0 136.4 5.59% 92.1 4.7 5.08%
Avg. Annual Growth Rate 3.48% 3.34% 8.43% 10.35%
Over this period the study area has accounted for between 5.49 percent and 5.75 percent of total of state individual income tax payments and for between 3.98 percent and 5.38 percent of local school district surtax payments. Consistent with the population, employment and personal income data presented above, the average annual growth rate of state individual income tax payments for the study area (3.34%) have been slightly below the overall growth rate for the state (3.48%). On the other hand, the school district surtax payments growth rate for the study area (10.35%) has outpaced the statewide surtax payments growth rate (8.43%). The main reason for the growth in surtax payments has been the implementation of surtaxes by three additional school districts within the study area.
State and Local Option Sales Taxes
The state imposes sales tax at a rate of 6 percent on purchases of tangible personal property unless specifically exempted by statute and on 84 enumerated services. Local governments upon receiving voter approval may impose up to a 1 percent local option sales and services tax (LOST). Within the 6-county study area all, jurisdictions have a 1 percent local option tax except for the City of Durango in
30
Dubuque County. Durango only accounted for 0.2 percent of taxable sales in Dubuque County during fiscal year 2011. Generally, the tax bases for state sales tax and for the local option sales and services tax are the same. However, there are two major differences. First, electricity, natural gas and other heating fuels purchased for residential use are subject to the local option tax, but not to the state tax. Second, the local option tax applies based on the point of delivery rather than the point of sale. For example, an item of furniture sold by a store located in Dubuque but delivered by the seller to a customer in East Dubuque, Illinois or to a customer residing in the City of Durango would not result in any local option sales tax being collected. Table 19 presents taxable sales for traditional retail businesses, bars and restaurants, and specialty stores for the State and for the 6-county study area for the past decade.
Table 19. Taxable Retail Sales
Year
Statewide Taxable Sales ($1,000,000s)
6-County Taxable Sales ($1,000,000s)
Traditional Bars & Specialty Traditional Bars & Specialty
Traditional retail includes department and discount stores, apparel and other specialty retailers; food, drug, and liquor stores, furniture, appliance, home furnishings, building materials, and hardware stores, bars and restaurants. Examples of specialty retailers are art, book, crafts, gift, hobby, jewelry, sporting goods and toy stores. When compared to the population, economic and individual income tax statistics presented previously, which show the 6-county study area lagging behind the state as a whole, the growth in consumer spending in the area has slightly outpaced the state. For all types of traditional retailers, taxable purchases within the study area increased at an average annual rate of 2.79 percent compared to an average annual growth rate of 2.35 percent statewide.
31
Hotel-Motel Taxes
When the state sales tax rate increased from 5 percent to 6 percent on July 1, 2008, the state hotel-motel tax was changed to a separate excise tax with a rate of 5 percent. In addition to the state tax, local governments may impose up to a 7 percent local option hotel-motel tax. Both hotel-motel taxes apply to proceeds from the lease of sleeping rooms for less than 31 consecutive days. Table 20 presents both state and local option hotel-motel tax receipts for the years 2000 through 2010.
Table 20. Hotel-Motel Taxes
Year
State Hotel-Motel Tax Local Option Hotel-Motel Tax
Statewide ($1,000s)
6-County ($1,000s) Share
Statewide ($1,000s)
6-County ($1,000s) Share
2000 23,906 1,183 4.95% 23,402 1,118 4.78%
2001 23,706 1,143 4.82% 24,199 1,108 4.58%
2002 23,957 1,141 4.76% 24,391 1,098 4.50%
2003 23,949 1,377 5.75% 26,408 1,439 5.45%
2004 25,459 1,511 5.94% 27,947 1,613 5.77%
2005 26,759 1,542 5.76% 29,861 1,656 5.55%
2006 28,717 1,808 6.30% 33,031 1,837 5.56%
2007 30,905 1,772 5.73% 36,415 1,926 5.29%
2008 33,629 1,756 5.22% 28,012 1,998 7.13%
2009 31,011 1,899 6.13% 35,990 2,018 5.61%
2010 33,195 2,098 6.32% 38,949 2,151 5.52%
Avg. Annual
3.34% 5.90% 5.23% 6.76% Growth Rate
The growth rates for both the state and local option hotel-motel tax receipts within the 6-county study area have exceeded the growth rates statewide over the past decade. The state excise tax hotel-motel tax revenues for the study area have increased at an average annual rate of 5.90 percent compared to a statewide growth rate of 3.34 percent. Similarly, the average annual growth rate for local option hotel-motel tax revenues within the study area over the past decade has equaled 6.76 percent compared to a statewide rate of 5.23 percent.
Property Tax
In Iowa property taxes are the primary source of revenue for local government services, and in addition, they provide about half the funding for public elementary and secondary schools. The tax levy for a given parcel of property is determined based on the valuation of the property determined by the city or the county assessor for the jurisdiction in which it is located. The Iowa Legislature and the Iowa Department of Revenue set the rules followed in determining property valuations and in determining the shares of the valuations subject to tax. Local government jurisdictions and school districts set the
32
property tax levy rates that, when applied to the taxable portion of a property’s valuation, determines the amount of tax due. The Iowa property tax system consists of seven primary classifications (i.e., agricultural buildings, agricultural land, commercial, industrial, railroad, residential and utility). Recreational property falls under the commercial classification. Assessors have the option of using one or all of three methods to set the valuation for such property. The three valuation methodologies include:
Using sales price data from sales of comparable property
Estimating the depreciated cost for the property
Determining the present value of the net revenue generated from use of the property Statewide during fiscal year 2010 residential property accounted for the largest share of gross property tax collections at 48.32 percent. The shares of tax collections accounted for by agricultural, commercial, and industrial property equaled 14.96 percent, 29.28 percent, and 4.61 percent, respectively. Table 21 shows the statewide amounts of property taxes levied against residential and commercial property, as well as the total property tax levy amount each year from 2000 through 2010. In addition, the table presents the same information for the 6-county study area.
Residential Commercial Total Residential Commercial Total
2000 1,130.2 568.3 2,655.7 64.6 23.9 122.3
2001 1,202.5 607.0 2,707.3 66.8 25.9 128.9
2002 1,288.4 648.0 2,869.4 71.2 28.1 137.0
2003 1,370.7 707.8 3,066.9 73.3 30.6 145.3
2004 1,417.8 757.4 3,096.3 76.1 33.4 151.7
2005 1,558.4 954.2 3,305.6 83.7 40.8 164.9
2006 1,625.6 995.0 3,429.5 88.4 42.0 171.4
2007 1,733.6 1,076.8 3,649.9 93.3 47.0 181.9
2008 1,804.5 1,138.0 3,793.1 97.0 50.2 189.3
2009 1,927.5 1,213.2 4,032.7 107.2 54.1 201.9
2010 2,052.8 1,243.9 4,235.8 114.3 57.1 214.6
Avg. Annual
6.15% 8.15% 4.78% 5.87% 9.08% 5.79% Growth Rate
As shown in the table, statewide property taxes grew at an average annual rate of 4.78 percent during the past decade. Within the 6-county study area, property tax revenues grew at a somewhat faster rate of 5.79 percent. The proposed development will mostly impact the residential and commercial property classifications. The tax levies and annualized growth rates for these two property classifications are also shown in the above table.
33
Fiscal Impact Estimates
Individual Income Tax and Surtax Construction of the All-Star Ballpark Heaven facilities will occur during two phases. The first construction phase will occur during 2013, and the second phase will occur during 2016. Operation of the facility will begin during the spring of 2014. The proposed development will impact state individual income tax and local school district surtax revenues in four ways. First, the wages of workers employed during the construction phases for the project will be subject to taxes. Second, workers that work for All-Star Ballpark Heaven beginning 2014 will pay income taxes on their earnings. Third, additional workers hired by support businesses during both the construction phases and after the development begins operations will pay income taxes on their earnings. Fourth, school districts with surtaxes will benefit from increased revenues. The tax revenue impacts presented in this analysis cover the years 2013 through 2021, the eighth year of the facility’s operation. Estimates of the increased income tax revenues reflect the pro forma payroll information provided for employees of the All-Star Ballpark Heaven development and the labor income estimates derived using the IMPLAN model for the two construction periods and for the off-site businesses that will be impacted during the first eight years of the development’s operations. The major assumptions used in making the estimates include:
State income taxes will be paid at rates consistent with the effective tax rates of Iowa residents at different income levels as presented in the Iowa Department of Revenue Individual Income Tax Annual Report for tax year 2009, which is the most recent year of available data.
The tax brackets for state income tax will be adjusted for inflation at a rate of 2 percent per year through 2021.
The wages and salaries of employees of All-Star Ballpark Heaven and off-site employees will increase at a rate of 3 percent per year through 2021.
The full contingent of staff for All-Star Ballpark Heaven will be hired during 2014 and this level of employment will remain constant throughout the first eight years of operations.
Employees of All Star-Ballpark Heaven will have no other employment and as such will be subject to effective income tax rates commensurate with wages and salary income for that employment alone.
School district surtaxes will be collected at a weighted average rate for the 6-county study area equal to 3.29 percent as determined from the tax year 2009 Iowa Department of Revenue Income Surtax Report.
As shown in Table 22, state individual income taxes during the two construction years will equal just under a half million dollars for 2013 and about $450 thousand dollars for 2016. State income taxes that will be paid by employees of All-Star Ballpark Heaven rise from $53 thousand the first year of operations to just under $70 thousand by the eighth year. During the eight years of operations, employees of other businesses that provide contract services to All-Star Ballpark Heaven or to the families of tournament participants and to other tourists attracted by this new development will generate between $179 thousand and $701 thousand in additional state tax revenue per year. School districts in the 6-county study area will receive an estimated $7 thousand to $30 thousand per year in additional surtax revenues.
34
Table 22. State Individual Income Tax and School Surtax ($1,000s)
Year Construction
Operations State Tax
School Surtax Total Ballpark Off-Site
2013 494.5 0.0 0.0 494.5 16.3 510.8
2014 0.0 53.1 178.7 231.8 7.6 239.4
2015 0.0 56.3 269.4 325.7 10.7 336.4
2016 447.2 57.9 383.4 888.5 29.2 917.7
2017 0.0 59.7 673.2 732.9 24.1 757.0
2018 0.0 63.2 701.3 764.5 25.2 789.7
2019 0.0 66.1 653.0 719.1 23.7 742.8
2020 0.0 67.1 669.6 736.7 24.2 760.9
2021 0.0 69.1 682.7 751.8 24.7 776.5
State and Local Option Sales Taxes Similar to the analysis for individual income tax, state sales tax impacts are estimated separately for the two construction phases of the development, for taxable services that will be provided by All-Star Ballpark Heaven and for other area businesses that will benefit from the development. Also, additional local option sales and services tax revenues are estimated. Two sources of information provide the basis for these estimates. Sales tax revenue estimates for All-Star Ballpark Heaven are based on the pro forma income statement provided by the project’s developer. The other tax revenue estimates reflect the estimates derived from the IMPLAN economic impact analysis for the project. Investment for the first construction phase will equal $23.24 million and for the second construction phase, the investment will equal $19.21 million. The materials used in the construction and the furnishings and equipment for the clubhouses and the training facility are subject to sales tax. Since this will be new construction, the labor is not subject to sales tax. Thus, for the two construction phases, the share of the investment subject to tax was assumed to be 57.06 percent for Phase I and 56.83 percent for Phase II. Many of the indirect and induced expenditures associated with the construction phases will also be subject to sales tax. The IMPLAN model explicitly identifies the top nine categories of other purchases that will result during the construction phases, plus another residual category of all other purchases. The shares of these other expenditures subject to sales tax were determined based on information, memoranda and statistics obtained from the Iowa Department of Revenue web site. Other statistical information obtained from the U.S. Census Bureau web site was also used to determine the share of different purchases subject to sales tax. For example, product line statistics from the 2007 Economic Census indicate that only 6 percent of grocery store purchases would be subject to sales tax because most food and pharmacy purchases are exempt from sales tax in Iowa. The pro forma income statement for All-Star Ballpark Heaven identifies twelve sources of revenue. These are:
35
Movie site shop and e-commerce sales
Commemorative framed pictures
Video club movie clips
Tourism site concessions
Tournament concessions
Tournament merchandise sales
Tournament team fees
Tournament advertising and sponsorships
Training fees and group programming
Memberships
Facility rentals
Training facility advertising and sponsorships
All of these revenues are assumed to be fully subject to sales tax, except for the two advertising and sponsorship categories, which account for a small share of anticipated revenues. Other taxable purchases attributable to the operation of the All-Star Ballpark Heaven complex were determined based on the IMPLAN model economic impact estimates. Table 23 presents the state and local option sales tax estimates for the years 2013 through 2021.
Table 23. State and Local Option Sales Taxes ($1,000s)
Year Construction
Operations State Tax
Local Option Tax Total Ballpark Off-Site
2013 1,046.3 0.0 0.0 1,046.3 174.4 1,220.7
2014 0.0 463.0 302.2 765.2 127.5 892.7
2015 0.0 670.7 445.9 1,116.6 186.1 1,302.7
2016 862.1 862.6 574.7 2,299.4 383.2 2,682.6
2017 0.0 1,570.1 1,023.2 2,593.3 432.2 3,025.5
2018 0.0 1,675.4 1,034.8 2,710.2 451.7 3,161.9
2019 0.0 1,760.1 1,028.5 2,788.6 464.8 3,253.4
2020 0.0 1,841.5 1,019.4 2,860.9 476.8 3,337.7
2021 0.0 1,922.9 1,010.4 2,933.3 488.9 3,422.2
Most of the sales tax revenues from off-site purchases would come from bars, restaurants, other recreation, entertainment and tourism venues, and from various types of retail stores. Within the 6-county study area, only the City of Durango in Dubuque County does not impose a local option tax, so all taxable purchases are assumed to be subject to a 1 percent local option sales and services tax. It is anticipated that only about 5 percent of program participants will come from Iowa. Therefore, most of the sales tax revenues resulting from the development will be net gains to Iowa and the region.
36
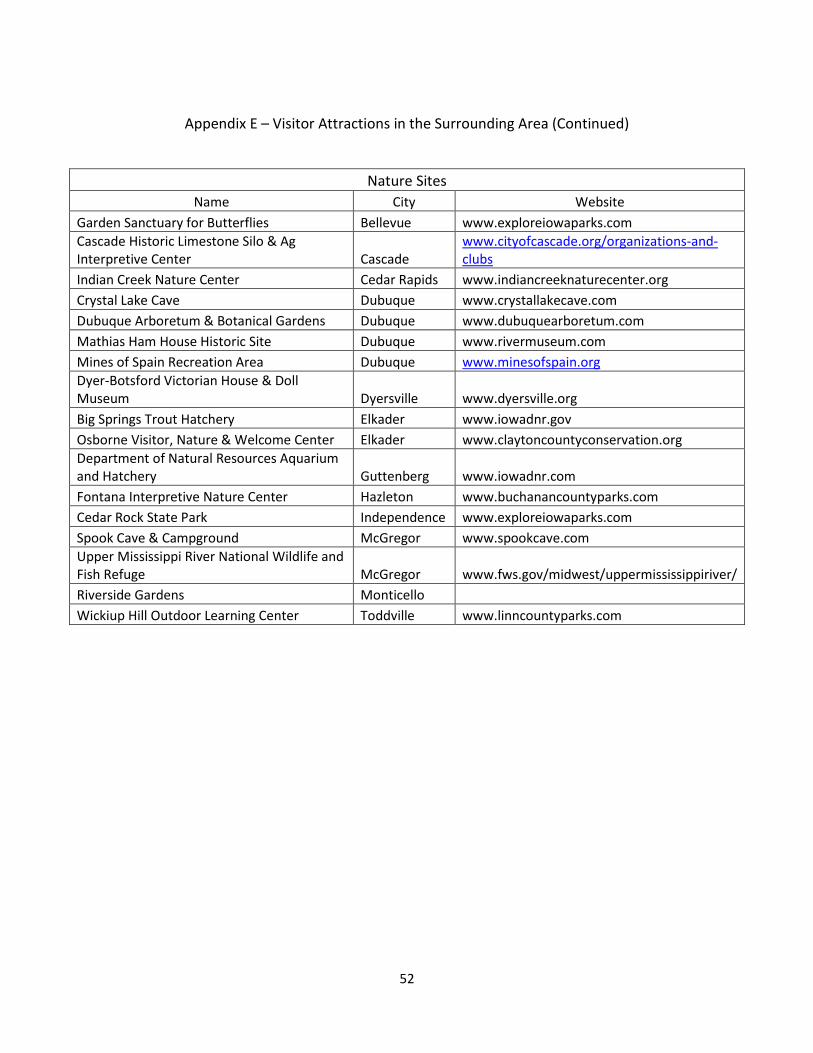
Hotel-Motel Taxes Estimates of taxable lodging expenditures are based on estimates derived from the IMPLAN economic impact model. Although lodging will be provided at All-Star Ballpark Heaven for team members, the families of team members will have to find lodging in local hotels and motels or at campgrounds. Based on the experiences of other facilities similar to the proposed development, it is estimated that about 80 percent of team members will be accompanied by family members. The developers of All-Star Ballpark Heaven plan to include a number of amenities to encourage families to make their children’s participation in the baseball and softball programs and tournaments a family experience. The large number of other attractions in the surrounding area listed in Appendix E should encourage such family vacations as well. Table 24 presents estimates of additional state and local option hotel-motel tax revenues expected to result from the development of All-Star Ballpark Heaven. The local option hotel-motel tax estimates reflect the existing weighted average hotel-motel tax rates for the 6-county study area which equals 5.13 percent.
Table 24. Hotel-Motel Taxes ($1,000s)
Year State Tax
Local Option Tax Total
2014 290.8 298.1 588.9
2015 424.3 434.9 859.2
2016 546.2 559.9 1,106.1
2017 850.0 871.2 1,721.2
2018 888.3 910.5 1,798.8
2019 914.0 936.8 1,850.8
2020 937.7 961.2 1,898.9
2021 961.4 985.5 1,946.9
Property Taxes As stated previously, All-Star Ballpark Heaven will be developed in two phases. The first phase is expected to be completed for the 2014 season and the second phase improvements for the 2017 season. Under current law, only the investment that constitutes real property will be subject to property tax. Equipment and furnishings that will constitute part of the investment for each phase will not be subject to property tax because personal property is no longer subject to property tax in Iowa. The different types of investment that will be made during each phase of the site’s development and the division of investment amounts between real and personal property are shown in Table 28. Based on information obtained from the developer, 92 percent of the training facility will constitute real property and only 8 percent equipment and other furnishings. For the clubhouses, the split between real property and furnishings is 65 percent and 35 percent. Although some aspects of the ball field
37
improvements, stadium seating, scoreboards and lighting may be classified as personal property, the divisions between real and personal property for these investments cannot be determined at this time. Therefore, the estimates of property taxes assume all of the value of these improvements constitutes real property.
The valuations for real property are determined as of January 1st each year. For this analysis it is assumed all of the improvements for phase I will be completed by January 1, 2014, and that all the improvements for phase II will be completed by January 1, 2017. This means the first installment of property taxes for the phase I investments will not be due until September 2015, and the first property taxes will not be due for the phase II investments until September 2018. Furthermore, the property tax estimates reflect the assumption that, due to the depressed real estate market, commercial property valuations will remain constant through assessment year 2016 and then increase at a rate of only 2 percent per year through 2021. The tax rate applied in estimating the tax levy amounts equals $31.21 per $1,000 of taxable valuation. This factor equals the consolidated tax rate for the City of Dyersville for 2010. Table 26 shows the estimated property taxes due for each of the two phases by year through 2021. These estimates may be somewhat on the high side, particularly for the years 2014 through 2018. This is because during the first several years of operations, net profits are projected to be modest. Only after the full development is complete and utilization grows to near capacity, will profit margin increase significantly.
38
Table 26. Property Taxes ($1,000)
Year Phase I Taxes
Phase II Taxes Total Taxes
2014 0.0 0.0 0.0
2015 425.1 0.0 425.1
2016 850.2 0.0 850.2
2017 850.2 0.0 850.2
2018 858.7 300.0 1,158.7
2019 875.8 606.0 1,481.8
2020 893.4 618.1 1,511.5
2021 911.2 630.4 1,541.6
Beyond the improvements proposed for the All-Star Ballpark Heaven complex, additional off-site investment in lodging facilities, bars and restaurants, retail space and recreation venues may be expected to occur. However, the property tax impacts for these likely investments are not provided in this report.
Fiscal Impact Estimates Summary Table 27 summarizes the fiscal impact estimates by tax type and year. The impact estimates reflect the business projections prepared by Go the Distance Baseball, LLC, for the All-Star Ballpark Heaven development and the economic impact estimates prepared by Strategic Economics Group using an Iowa IMPLAN Model.
Table 27. Total Fiscal Impact - All Taxes ($1,000s)
The traditional indicators which economists use for measuring the economic importance of an activity include the size of its workforce and payroll, its capital investment and its local purchase of goods and services. Economists call these the ’direct expenditures’ or ‘direct effects’. Direct effects refer to the operational characteristics (employment, payroll, sales) of the activities that we studied. The secondary effects include two components: indirect effects and induced effects. Indirect effects measure the value of supplies and services that were purchased as inputs by the project from businesses and firms within the region and the state. Induced effects occurred when workers in the direct and indirect industries spent their earnings on goods and services from other vendors and businesses within the region and the state. Induced effects are also often called ‘household effects’. The total economic impact is the aggregate of the direct, indirect and induced effects. It is the total effect on the economy of transactions that are attributable to the initial direct economic activity of the All Star Ballpark Heaven project. But the workers and the vendors who receive those indirect and induced expenditures don’t bury them in a mattress. They will spend some of the money, save some of it and thus begins the journey by which the dollars travel through many hands before they finally leave the economic region being studied. Economists call this phenomenon the ‘multiplier effect’. The multiplier factor is calculated by dividing the sum of the direct, indirect and induced effects by the direct effect. The multiplier effect for any economy or industry is examined using an ‘input-output analysis’. The tool was devised by the 1973 Nobel Prize winning economist Wassily Leontief. It uses a matrix that measures inter-industry relations in an economy and shows how the output (sales) of one industry becomes the input (purchases) for another. The most widely used regional input-output economic impact tool is the IMPLAN model developed and distributed by Minnesota IMPLAN Group, Inc. (MIG). According to MIG, the model is currently in use by more than 1,000 public and private institutions. The project staff for this study employed the latest version 3.0 of the IMPLAN model to determine the total impact of the direct expenditures made by the project in the two construction phases and the operations years through year 8. The total impact includes the direct, indirect and induced economic effects.
The project team developed the spending profile of the project in the six-county region of northeast Iowa. The team used the revenue projections and capital expenditure estimates prepared by Go the Distance Baseball, LLC as the direct effect variables for modeling output, employment and payroll as the direct effects of the proposed All-Star Ballpark Heaven development. In addition to the direct employment and payroll effects, the overall operations of the project will generate secondary impacts within the state and region as services and supplies are purchased, and payroll dollars get spent in local businesses. The project staff applied the IMPLAN statewide regional economic input-output model, modified by staff at Iowa State University to determine the magnitude of these secondary impacts. The following economic terms are used in the report and they have a specific meaning when used in the context of input-output modeling:
40
Multipliers: "Multipliers are a numeric way of describing the secondary impacts stemming from a change. For example, an employment multiplier of 1.8 would suggest that for every 10 employees hired in the given industry, 8 additional jobs would be created in other industries, such that 18 total jobs would be added to the given economic region."12
Direct effects take place only in the industries immediately affected.
Indirect effects concern inter-industry transactions that will affect all of their suppliers. Supplier employment loss or gain as a result of the direct effects would be the indirect effects.
Induced effects measure the effects of the changes in household income as a result of employees hired or laid-off by the company and its suppliers. These changes affect the related industries.
Total Impacts are the total changes to the original economy as the result of a defined event. (i.e., direct effects + indirect effects + induced effects = total impacts)
Jobs refer to the employment expressed as full-time worker years of employment. Labor Income consists of employee compensation and proprietary income which includes payments received by self-employed individuals as income. Total Value-Added consists of four components.
1. Employee Compensation 2. Proprietors Income 3. Other Property Income 4. Indirect Business Tax
Output is a measure of the value of goods and services produced in the project. Appendix B displays the detailed Input-Output Tables.
12
McIntosh, Chris. The Regional Economy. pg 15.
41
Appendix B – Statewide Input-Output Tables for All-Star Ballpark Heaven
I-O Table 1a Impact Summary - Statewide Construction Phase I (Year 0)
Impact Type Jobs
Labor Income
($1,000s)
Value Added
($1,000s) Output
($1,000s)
Direct Effect 189 $8,494 $9,650 $23,240
Indirect Effect 46 $2,227 $3,322 $6,130
Induced Effect 71 $2,460 $4,430 $7,676
Total Effect 306 $13,181 $17,402 $37,046
I-O Table 1b Top 10 Effected Sectors - Statewide Construction Phase I (Year 0)
Sector Jobs
Labor Income
($1,000s)
Value Added
($1,000s) Output
($1,000s)
Construction of other new nonresidential structures 189 $8,494 $9,650 $23,240
Food services and drinking places 10 $165 $233 $505
Architectural, engineering and related services 10 $638 $674 $1,198
Wholesale trade businesses 6 $381 $653 $898
Real estate establishments 4 $37 $269 $371
Retail Stores - Food and beverage 4 $97 $158 $180
Offices of physicians, dentists and other health practitioners 4 $301 $322 $533
Retail Stores - General merchandise 4 $96 $157 $178
Private hospitals 4 $208 $222 $496
Automotive repair and maintenance except car washes 3 $110 $132 $204
All Others 70 $2,654 $4,932 $9,241
Total 306 $13,181 $17,402 $37,046
42
Appendix B – Statewide Input-Output Tables for All-Star Ballpark Heaven