22
Alliance Aviation Services Limited Results Presentation FY2021 11 August 2021

Alliance Aviation Services Limited Results PresentationFY202111 August 2021

2Alliance Aviation Services Limited FY2021 Results Presentation
KEY MESSAGES
INDUSTRY LEADING COVID-19 RESPONSE
FIVE REVENUE STREAMS
FINANCIAL SUMMARY
DEPLOYING THE E190’s
OUTLOOK
STABLE CONTRACT CLIENT BASE
COMMODITY EXPOSURE
FOOTPRINT
OPERATIONAL PERFORMANCE
DISCLAIMER
ACKNOWLEDGEMENTS
03.
04.
05.
06.
14.
15.
17.
18.
19.
20.
21.
22.
Contents

3Alliance Aviation Services Limited FY2021 Results Presentation
Key Messages
Underlying profit before tax1 of $51m, up 25%
Alliance Aviation Services Limited announces a full year result which includes:
• Another record profit whilst investing for growth;
• Record underlying operating cash flows;
• Stable flight hours, with increases in contract and charter;
• Payment for 26 of the 32 E190 aircraft;
• Significant growth capacity funded and immediately available; and
• Subject to COVID impacts, a strong growth outlook for FY22 and beyond.
Revenue from operations of $308.7m, up 3%
5 x E190 aircraft added to the fleet – Fleet total, 48
Flight hours stable- 37,913 Anticipated growth of up
to 3 times annualised
Corporate Debt renewed, including long term debt
matched to growth
Underlying operating cash flow1 of $75.9m, up
73%
CASH
1. Underlying PBT and underlying cash flow are a non-statutory measures and used for the purpose of assessing the performance of Alliance during the year against comparable measures in the previous year.
DEBTGROWTH

4Alliance Aviation Services Limited FY2021 Results Presentation
Industry Leading COVID-19 ResponseAlliance was initially negatively impacted byCOVID-19 through a reduction in wet leaseactivity.
The response to COVID-19 has been consistent,industry leading and placed the business in anenviable position to capitalise on growthopportunities.
This next stage of this leading response ismandated vaccinations.
Lead the way with pre-flight temperature andCOVID testing.
Responded to changing market conditions togrow contract and charter business.
Capitalised on market disruption withpurchase of E190 fleet at historically lowprices.
Secured new contracted wet lease business toguarantee deployment of newly acquired E190s.
Introduced compulsory COVID-19 vaccinationsfor all staff and contractors.

5Alliance Aviation Services Limited FY2021 Results Presentation
Contract and charter continue to experience revenue growth. Wet lease activity reduced as a result of COVID-19 however is expected to rebound strongly in FY22.
• Charter revenue up by 66% on the prior year.
• Charters were operated for sporting clubs, government agencies and resource sector clients.
• A notable increase in domestic tourism demand came through in the second half, however less sporting and government work in the second half.
4
Charter RevenueShort-term income from
ad-hoc requests
• Wet lease revenue lower but increasing.
• Alliance resumed services on behalf of Virgin and activity levels grew during the second half.
• Wet lease services for Qantas commenced late in the second half and are poised to grow.
2
Wet LeaseOperating Alliance aircraft
for other carriers
• Revenue for the year was stable when compared to FY20 and consistent with the mid-term run rate.
• Unity Aviation Maintenance joined the group from December 2020.
• Aerodrome management and other engineering services continued to contribute positively in the during the year.
5
Aviation ServicesAllied aviation
services
• RPT revenue decreased by 3% on the prior year as a result of COVID-19.
• Ongoing lockdowns and border restrictions resulted in reductions in services in the second half.
• Alliance’s RPT footprint is not expected to expand.
3
RPT Revenue Regular public transport services to regional ports
• Growth in hours compared to FY20 and revenue up by 6% on the prior year.
• Driven by sustained activity in the resources sector.
• Contract schedules have normalised and 2HFY21 was not impacted by COVID-19.
• Contracts with four key clients were renewed/extended during the year and four new contracts added.
1
Contract RevenueLong-term contract
flying
Contract Revenue
WetLease
RPT Revenue
Charter Revenue
AviationServices
Five Revenue Streams

FINANCIAL SUMMARYFor the year ended 30 June 2021
6
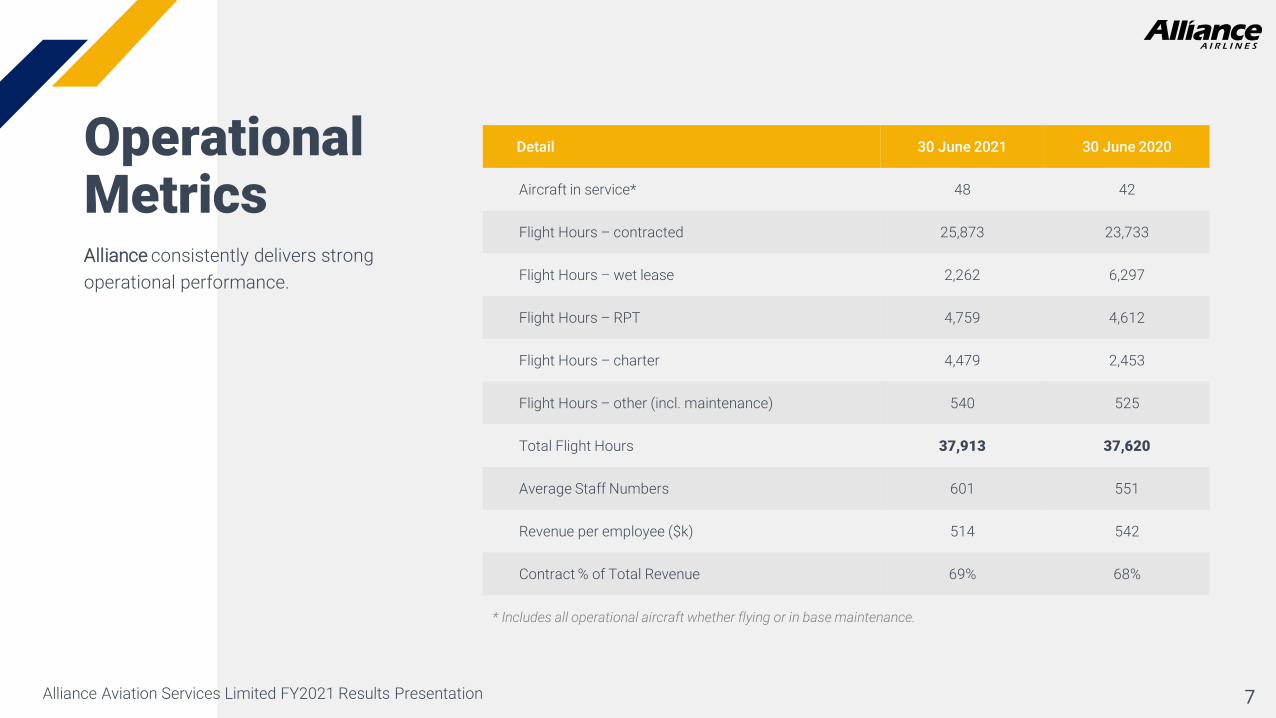
7Alliance Aviation Services Limited FY2021 Results Presentation
Detail 30 June 2021 30 June 2020
Aircraft in service* 48 42
Flight Hours – contracted 25,873 23,733
Flight Hours – wet lease 2,262 6,297
Flight Hours – RPT 4,759 4,612
Flight Hours – charter 4,479 2,453
Flight Hours – other (incl. maintenance) 540 525
Total Flight Hours 37,913 37,620
Average Staff Numbers 601 551
Revenue per employee ($k) 514 542
Contract % of Total Revenue 69% 68%
Alliance consistently delivers strong operational performance.
* Includes all operational aircraft whether flying or in base maintenance.
OperationalMetrics
8Alliance Aviation Services Limited FY2021 Results Presentation
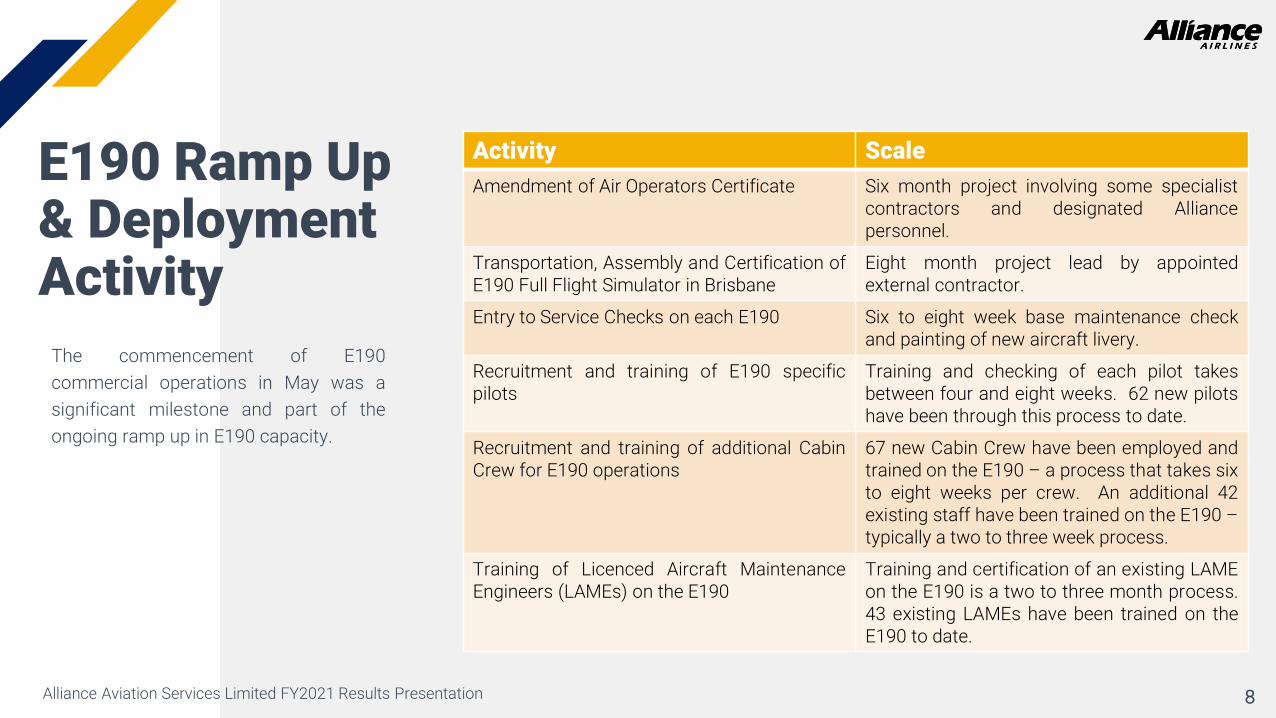
E190 Ramp Up & Deployment Activity
The commencement of E190commercial operations in May was asignificant milestone and part of theongoing ramp up in E190 capacity.
Activity ScaleAmendment of Air Operators Certificate Six month project involving some specialist
contractors and designated Alliancepersonnel.
Transportation, Assembly and Certification ofE190 Full Flight Simulator in Brisbane
Eight month project lead by appointedexternal contractor.
Entry to Service Checks on each E190 Six to eight week base maintenance checkand painting of new aircraft livery.
Recruitment and training of E190 specificpilots
Training and checking of each pilot takesbetween four and eight weeks. 62 new pilotshave been through this process to date.
Recruitment and training of additional CabinCrew for E190 operations
67 new Cabin Crew have been employed andtrained on the E190 – a process that takes sixto eight weeks per crew. An additional 42existing staff have been trained on the E190 –typically a two to three week process.
Training of Licenced Aircraft MaintenanceEngineers (LAMEs) on the E190
Training and certification of an existing LAMEon the E190 is a two to three month process.43 existing LAMEs have been trained on theE190 to date.

9Alliance Aviation Services Limited FY2021 Results Presentation
Statutory to Underlying PBT BridgeE190 expansion programme

10Alliance Aviation Services Limited FY2021 Results Presentation
($ in millions) FY2021Actual
FY2020Actual
% PCP Change
Revenue
Contract revenue 214.2 202.5 6%
Wet lease revenue 7.8 24.4 (68%)
Charter revenue 43.7 26.4 66%
RPT revenue 33.6 34.6 (3%)
Aviation services 8.0 10.0 (20%)
Other (Incl. FX) (0.8) 0.3 (366%)
Total revenue 306.6 298.2 3%
Operating expenses (218.8) (219.7) -
EBITDA 87.8 78.5 12%
Depreciation and amortisation (36.9) (35.1) (5%)
EBIT 50.9 43.4 16%
Finance costs (2.6) (2.7) -
PBT 48.3 40.7 19%
Income tax expense (14.6) (13.7) (6%)
NPAT 33.7 27.0 25%
Basic EPS (cents) 21.00 21.09 -
Observations:
• Sustained activity in FIFO. Added four new clients during the year;
• Charter revenue performed strongly in the year with a varied mix of clients contributing to the growth;
• RPT revenue was impacted by COVID-19 travel restrictions. The revenue has stabilised in the 2nd half of FY2021;
• Aviation services performed well despite the negative impacts of COVID-19 on Alliance’s airline client base;
• Operating expenses are consistent with the prior year with no material change in the unit costs associated with operations;
• Depreciation has increased in line increased fleet numbers; and
• Alliance has moved into an income tax payable position in FY21.
Income Statement

11Alliance Aviation Services Limited FY2021 Results Presentation
($ in millions) 30 June 2021Actual
30 June 2020Actual % PCP Change
Cash 36.2 98.8 (63%)
Receivables 50.9 54.4 (6%)
Inventory 86.5 57.4 (51%)
Total current assets 173.6 210.6 (18%)
PP&E & Intangibles 407.1 217.3 87%
Right of use assets 28.0 8.0 250%
Total non-current assets 435.1 225.3 93%
Total assets 608.7 435.9 40%
Trade & other payables 44.2 48.5 9%
Borrowings 4.8 12.0 60%
Current tax liabilities 3.5 0.0 (100%)
Lease liabilities 2.2 1.4 (57%)
Provisions / other 11.8 8.9 (33%)
Total current liabilities 66.5 70.8 6%
Borrowings 151.5 42.4 (257%)
Deferred tax liability 42.2 32.1 (31%)
Lease liabilities 27.0 7.0 (286%)
Provisions / other 1.3 1.5 13%
Total non-current liabilities 222.0 83.0 (167%)
Total liabilities 288.5 153.8 (88%)
Net assets 320.2 282.1 14%
Observations:
• Cash utilised throughout the year to pay for E190 acquisitions (aircraft and associated parts, SIM, tooling and GSE);
• Inventory includes $33 million of Embraer spare parts acquired throughout the year;
• Right of use assets and lease liabilities have increased due to the inclusion of the Unity Aviation Maintenance hangar land lease, renewal of the Brisbane hangar and office lease and the Adelaide hangar lease;
• Debt increased by $119.4 million to fund E190 acquisitions. Net debt $120.1 million at year end; and
• Current tax liabilities reflect Alliance moving to a cash tax payable position due to increased profits and fully utilised tax losses.
Statement of Financial Position

12Alliance Aviation Services Limited FY2021 Results Presentation
($ in millions)30 June
2021Actual
30 June 2020
Actual
Receipts from customers (inclusive of GST) 336.9 315.9
Payments to suppliers (inclusive of GST) (294.7) (269.5)
Net interest (paid)/received (1.4) (2.4)
Income tax paid (1.0) -
Net cash inflow from operating activities 39.8 44.0
Net payments for aircraft, property, plant & equipment (205.7) (30.8)
Free cash flow (165.9) 13.2
Proceeds from share issue 3.4 90.5
Proceeds from borrowings 146.5 18.0
Repayment of borrowings (44.6) (23,7)
Principal elements of lease payments (2.0) (1.6)
Dividends paid - (7.3)
Net cash outflow from financing activities 103.3 75.9
Net increase in cash and cash equivalents (62.6) 89.1
Effects of currency translation on cash and cash equivalents - 0.1
Cash & cash equivalents at the beginning of period 98.8 9.6
Cash & cash equivalents at the end of period 36.2 98.8
Observations:
• Strong Fokker operating cash flow continues;
• Operating cash flows also included $8.8 million of government rebates and $33.4 million of E190 inventory purchases, and $11.5m of E190 setup costs;
• Payments for PP&E consisted of $20.6 million on Fokker fleet capex and $175.9 million on the Embraer fleet program (incl. aircraft, entry into service maintenance, ferry flights, paint and the E190 simulator);
• Payments for PP&E also included the Unity Aviation Maintenance Pty Ltd acquisition; and
• Debt increased to fund capital expansion.
Cash Flow Statement

13Alliance Aviation Services Limited FY2021 Results Presentation
Capital Expenditure
($ in millions) FY2021Actual
FY2022Forecast
Existing fleet maintenance
Cash outflows
Base maintenance (Fokker) 5.6 6.5
Engine care program (Fokker and E190) 14.3 20.0
Other miscellaneous 2.6 4.0
Operating costs capitalised 2.4 2.5
Total cash outflows 24.9 33.0
Non-cash
Parts from inventory used in base maintenance 10.8 12.5
Total existing fleet maintenance 35.7 45.5
Growth capital expenditure
Cash outflows
E190 program 182.5 56.4
Entry into service (Fokker) 0.6 0.0
Operating costs capitalised (Fokker FY21 –E190 FY22) 1.6 2.5
Total cash outflows 184.7 58.9
Non-cash
Parts from inventory used in base maintenance (Fokker FY21 – E190 FY22) 4.2 3.0
Total growth capital expenditure 188.9 61.9
Total capital expenditure 1 224.6 107.41 – Equates to movement in PP&E plus depreciation (adjusted for Right of Use Depreciation)
Observations:
• Fokker fleet maintenance is below forecast due to the usage of inventory on hand and less hours required for the checks;
• Other miscellaneous expenditure is higher in the year due to the purchase of equipment and tooling required for E190’s;
• Two E190 settlements were brought forward from the initial settlement schedule into FY2021; and
• The purchase of Unity Aviation Maintenance Pty Ltd is also reflected in the E190 programme in FY2021.
• FY2022 forecast includes the remaining purchases of 6 E190 aircraft and maintenance check costs on the balance of acquired E190’s;
• Provisional sum for E190 engine maintenance requirements whilst maintenance program is being established; and
• Provision for IT system upgrade in FY2022.

14Alliance Aviation Services Limited FY2021 Results Presentation
Deploying the E190’s26 of the 32 E190s have been funded and deployment is ahead of schedule
30 June 21 Q1 FY22 Q2 FY22 Q3 FY22 Q4 FY22
Number of Aircraft Acquired
26 5 1 - -
Number of Aircraft in Service*
5 16 20 26 32
Number of Aircraft fully deployed^
4 11 14 22 29
Annualised Hours Generated
~12,000 ~30,000 ~35,000 ~60,000 ~80,000
*Includes all aircraft approved for use on the Company’s Air Operator Certificate and available to be operated^includes only aircraft that have been contracted for use by customers
01515Alliance Aviation Services Limited FY2021 Results Presentation
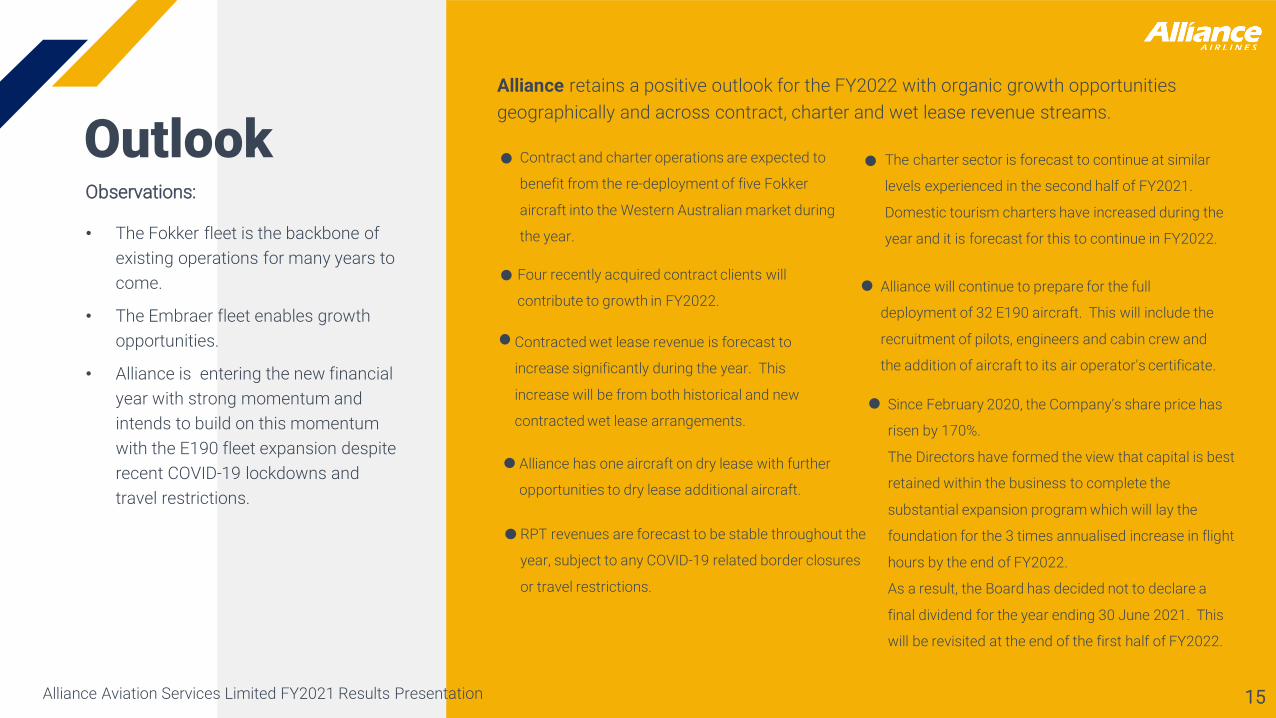
Contract and charter operations are expected to
benefit from the re-deployment of five Fokker
aircraft into the Western Australian market during
the year.
Contracted wet lease revenue is forecast to
increase significantly during the year. This
increase will be from both historical and new
contracted wet lease arrangements.
Alliance retains a positive outlook for the FY2022 with organic growth opportunities geographically and across contract, charter and wet lease revenue streams.
Four recently acquired contract clients will
contribute to growth in FY2022.
Outlook
RPT revenues are forecast to be stable throughout the
year, subject to any COVID-19 related border closures
or travel restrictions.
The charter sector is forecast to continue at similar
levels experienced in the second half of FY2021.
Domestic tourism charters have increased during the
year and it is forecast for this to continue in FY2022.
Since February 2020, the Company’s share price has
risen by 170%.
The Directors have formed the view that capital is best
retained within the business to complete the
substantial expansion program which will lay the
foundation for the 3 times annualised increase in flight
hours by the end of FY2022.
As a result, the Board has decided not to declare a
final dividend for the year ending 30 June 2021. This
will be revisited at the end of the first half of FY2022.
Observations:
• The Fokker fleet is the backbone of existing operations for many years to come.
• The Embraer fleet enables growth opportunities.
• Alliance is entering the new financial year with strong momentum and intends to build on this momentum with the E190 fleet expansion despite recent COVID-19 lockdowns and travel restrictions.
Alliance has one aircraft on dry lease with further
opportunities to dry lease additional aircraft.
Alliance will continue to prepare for the full
deployment of 32 E190 aircraft. This will include the
recruitment of pilots, engineers and cabin crew and
the addition of aircraft to its air operator's certificate.

OTHER INFORMATIONFor the year ended 30 June 2021
16
17Alliance Aviation Services Limited FY2021 Results Presentation
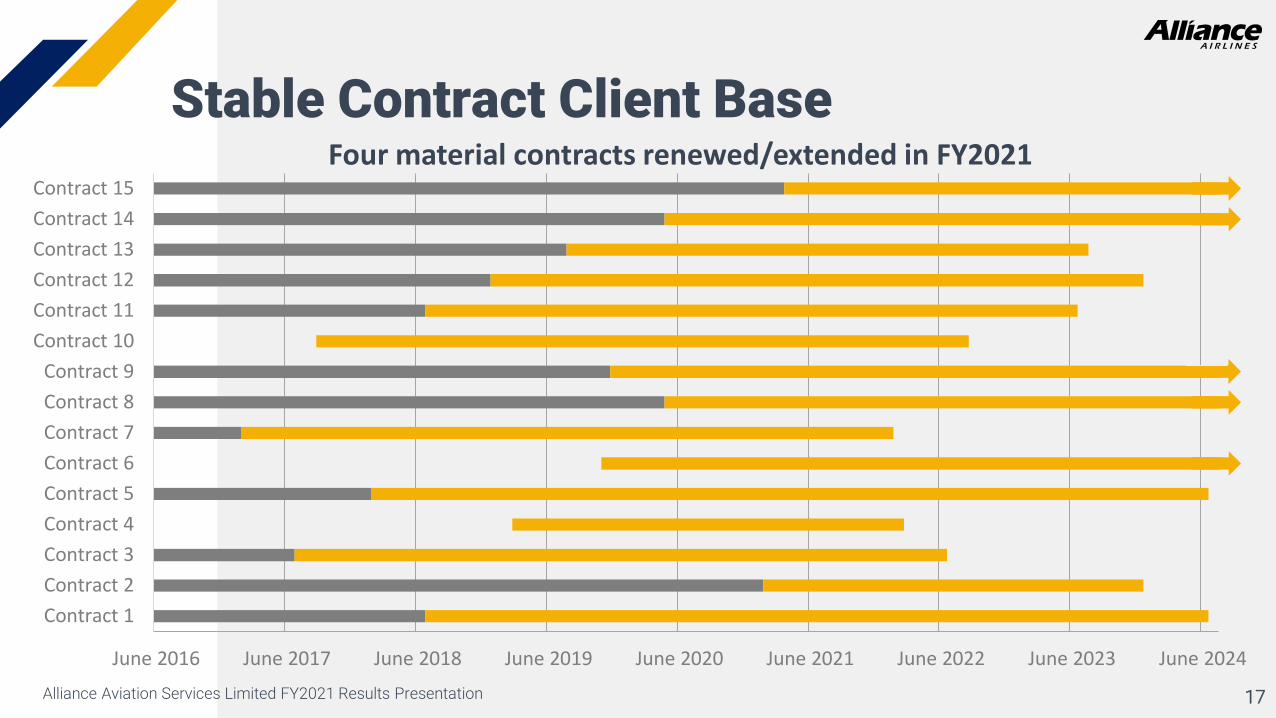
Stable Contract Client Base
June 2016 June 2017 June 2018 June 2019 June 2020 June 2021 June 2022 June 2023 June 2024
Contract 1Contract 2Contract 3Contract 4Contract 5Contract 6Contract 7Contract 8Contract 9
Contract 10Contract 11Contract 12Contract 13Contract 14Contract 15
Four material contracts renewed/extended in FY2021

18Alliance Aviation Services Limited FY2021 Results Presentation
Commodity ExposureMajor commodity exposure as a percentage of FY2021 revenue by the top 15 contracted clients.
Bauxite2% Copper/ Gold
3%
Iron Ore 29%
Phosphate2%Copper/ Gold /Uranium
15%Manganese 9%
Zinc2%
Oil / Gas6%
Nickel8%
Silver / Lead / Zinc 5%
Gold19%
Bauxite
Copper/ Gold
Iron Ore
Phosphate
Copper/ Gold /Uranium
Manganese
Zinc
Oil / Gas
Nickel
Silver / Lead / Zinc
Gold

19Alliance Aviation Services Limited FY2021 Results Presentation
- Crew- Line Maintenance - Operational base- Offices
- Crew- Line Maintenance - Operational base- Offices
- Hangar- Crew- Line Maintenance - Operational base- Offices
- Operational base- Offices
- Hangar- Major crew base- Line Maintenance - Operational base- Offices
- Hangar - Major crew base- Line Maintenance - Operational base- Offices - Spares inventory- Alliance T2 Facility - FIFO Lounge
- Hangar- Major crew base - Line Maintenance - Operational base- Offices - Spares inventory
Perth
Melbourne
Brisbane
Cairns
Townsville
Darwin
Footprint
Adelaide
- Crew- Line Maintenance - Operational base- Offices
Rockhampton

20Alliance Aviation Services Limited FY2021 Results Presentation
93%Alliance Airlines delivered
a 93% on time performance figure for the last 12
months. This was below our usual standard and is a key focus for improvement
OTP
OperationalPerformance
Forecast Fokker FleetFY 2022
F100 – 100 Seat Jet AircraftNo. in fleet – 24
F70 – 80 Seat Jet AircraftNo. in fleet - 14
F50 – 50 Seat Turbo-Prop Aircraft
No. in fleet - 5
Renewed IOSA certification in FY20
BARS Gold standard maintained
Safety Certifications
1
1. Including one leased aircraft
Forecast E190 FleetFY 2022
E190 – 94-114 Seat Jet AircraftNo. in operating fleet – 5
No. settled & not in service - 21Remaining to be settled – 6
839 kph
4,445 km
Two GE CF34-10E5
(18,500 lb) turbo fans
Cruising speed
Maximum range
Engine

21
Reliance on third party informationThis presentation was prepared by Alliance Aviation Services Limited (ACN 153 361 525) (“Alliance”). Certain market and industry data used in this presentation may have been obtained from research, surveys or studies conducted by third parties, including industry or general publications. Neither Alliance nor its representatives have independently verified any such market or industry data provided by third parties or industry or general publications.
Presentation is summary onlyThis presentation is for information purposes only and is a summary only. It should be read in conjunction with Alliance’s Annual Report for the year ended 30 June 2021 and Alliance’s other periodic and continuous disclosure information lodged with the Australian Securities Exchange (ASX), which is available at www.asx.com.au. The content of this presentation is provided as at the date of this presentation (unless otherwise stated). Reliance should not be placed on information or opinions contained in this presentation and, subject only to any legal obligation to do so, Alliance does not have any obligation to correct or update the content of this presentation.
Not investment adviceThis presentation does not and does not purport to contain all information necessary to make an investment decision, is not intended as investment or financial advice (nor tax, accounting or legal advice), must not be relied upon as such and does not and will not form any part of any contract or commitment for the acquisition of shares in Alliance. Any decision to buy or sell securities or other products should be made only after seeking appropriate financial advice. This presentation is of a general nature and does not take into consideration the investment objectives, financial situation or particular needs of any particular investor. Alliance is not licensed to provide financial product advice in respect of its shares.
No offer of securitiesThis presentation is for information purposes only and is not a prospectus, product disclosure statement or other offering document under Australian law or any other law (and will not be lodged with the Australian Securities and Investments Commission (ASIC) or any other foreign regulator). This presentation is not, and does not constitute, an invitation or offer of securities for subscription, purchase or sale in any jurisdiction.
Past PerformancePast performance, including past share price performance of Alliance and pro forma financial information given in this Presentation, is given for illustrative purposes only and should not be relied upon as (and is not) an indication of Alliance’s views on its future financial performance or condition. Past performance of Alliance cannot be relied upon as an indicator of (and provides no guidance as to) the future performance of Alliance. Nothing contained in this Presentation nor any information made available to you is, or shall be relied upon as, a promise, representation, warranty or guarantee, whether as to the past, present or future.
Disclaimer

22
Future performance and forward-looking statementsThis Presentation contains certain “forward-looking statements”. The words “expect”, “anticipate”, “estimate”, “intend”, “believe”, “guidance”, “should”, “could”, “may”, “will”, “predict”, “plan” and other similar expressions are intended to identify forward-looking statements. Indications of, and guidance on, future earnings and financial position and performance are also forward-looking statements. Forward-looking statements, opinions and estimates provided in this Presentation are based on assumptions and contingencies that are subject to change without notice and involve known and unknown risks and uncertainties and other factors that are beyond the control of Alliance, its directors and management. This includes statements about market and industry trends, which are based on interpretations of current market conditions.
No LiabilityTo the maximum extent permitted by law, neither Alliance or any of its shareholders, directors, officers, agents, employees or advisers accepts, and each expressly disclaims, any liability, including without limitation any liability arising from fault or negligence, for any errors or misstatements in, or omissions from, this presentation or any direct, indirect or consequential loss arising from the use of this presentation or its contents or otherwise arising in connection with it.
Disclaimer (cont.)
Our thanks to the following for the images used in the presentation:
Front Cover – VH-UYZ on approach to Alice Spring Airport – Image by Rob Finlayson (https://pbase.com/aviationimagesrf/alliance).
Page 6 – VH-UQW Departing from Cairns Airport – Image by Alliance staff member Grant Jones.
Page 16 – VH-UYB Departing Wellcamp Airport – Image by Garry Wilkinson (https://www.facebook.com/garrywilkinsonphotography/).
Acknowledgments


