146
Allianz Capital Markets Day Renewal Agenda – bringing skills to scale Munich, November 24, 2015
Allianz Capital
Markets Day
Renewal Agenda –
bringing skills to scale
Munich, November 24, 2015

©
Alli
anz S
E 2
015
A Renewal Agenda – bringing skills to scale Oliver Bäte
B True Customer Centricity Sergio Balbinot
C PIMCO update Douglas Hodge
D Technical Excellence in P/C Axel Theis
E Life business in low yield environment Maximilian Zimmerer
F Value creation Dieter Wemmer
Disclaimer
Investor Relations contacts
Agenda

Renewal Agenda –
bringing skills
to scale
Munich, November 24, 2015
Oliver Bäte
CEO Allianz SE

©
Alli
anz S
E 2
015
Framing today’s discussion
A. Renewal Agenda – bringing skills to scale
Allianz acts from a position of strength: strong stakeholder trust, brand and culture, superior financial strength and resilience, leading positions in all our segments and especially outstanding people
Our world and our industry are changing fast and fundamentally, creating challenges but also huge opportunities for tomorrow‘s winners
Allianz has built strong foundations to reinforce its leadership position – but we need to act decisively now
Our Renewal Agenda amplifies our energy towards even higher value creation, especially by leveraging our superior skills into scale advantages
Customer Centricity stands at the core of our agenda. Digital and technical excellence, stronger growth and employee motivation will only translate into success if our clients trust us fully
As competition and investment requirements increase, we will address our productivity reserves with rigor. While we aim to deliver visible results in due course, our Renewal Agenda is designed to reinforce Allianz’s leadership position for years to come
4 A 2

©
Alli
anz S
E 2
015
Sequence of
record profits
World’s No1 insurer and
Top 5 asset manager
Solid TRS performance
despite shocks
A trusted partner
building on
Integrity
Competence
Resilience
Performance Health Trust
One of the world’s
strongest brands
Leading insurance &
asset mgmt. skills
Loyal, motivated staff
Strengthened
business models
© A
llia
nz S
E 2
015
We act from a position of strength
A. Renewal Agenda – bringing skills to scale
5 A 3

©
Alli
anz S
E 2
015
Disciplined thought, disciplined action
6
Environmental trends & scenarios
Requirements for tomorrow’s winners
Competitive
context 1
Taking
stock
Where we lead, where we lag
What to re-inforce, what to change 2
Ambitions
for 2018
Renewal Agenda impact
Achieving stronger performance & health 4
Renewal
Agenda
Pillars of continued industry leadership
Ensuring successful execution 3
A. Renewal Agenda – bringing skills to scale
A 4

©
Alli
anz S
E 2
015
Disciplined thought, disciplined action
7
Environmental trends & scenarios
Requirements for tomorrow’s winners
Competitive
context 1
2
4
3
A. Renewal Agenda – bringing skills to scale
Renewal
Agenda
Taking
stock
Ambitions
for 2018
A 5

©
Alli
anz S
E 2
015
Requirements for tomorrow’s winners
Shock resilience of utmost importance – carefully balanced with capital efficiency
Demonstrate benefits from scale on key value drivers: margins, cost of capital and growth
Build commanding market positions and leverage digital to become customer-centric and agile
Relentlessly lift productivity reserves in capital, cost and revenue base
Environmental trends & scenarios
Global society and economy very fragile and highly interdependent
Digitalization transforming economies and economics, polarizing winners and losers
Financial services challenged on margins and growth – however, strong value creation is clearly possible for leaders
Competitive context
A. Renewal Agenda – bringing skills to scale
8 A 6

©
Alli
anz S
E 2
015
Emerging
markets, local
currencies
Global society and economy very fragile
Financial markets more correlated
Increase in correlation between asset classes, in %
2
43
2006-08 2011-15
Euro corporate
bonds1
37
17
Emerging
markets, USD,
hedged
17
35
Corporates
high yield,
EUR
Euro treasuries
-16
30 23
-13
3
-18
Severe challenges to society and economy
Geo-political instability
Threat from terror attacks, unresolved South China
Sea dispute, Ukraine/Russia conflict, potential third
intifada, EU/Euro instability (e.g., BREXIT, GREXIT)
Demographic and societal shifts
Record arrival of migrants and refugees to Europe,
ageing, political polarization
Economic slowdown
Sluggish growth outlooks for BRIC and other
emerging markets (LatAm, Asia, Africa),
infrastructure weakness
A. Renewal Agenda – bringing skills to scale
1) Ex financials
Source: Datastream
9 A 7

©
Alli
anz S
E 2
015
Digitalization transforming economies and economics,
polarizing winners and losers
A. Renewal Agenda – bringing skills to scale
Telephone Television Mobile Facebook Internet Smartphone
Years to reach 1bn
users after innovation
Innovation cycles reach scale much faster
110
49
22
14 8 8
ILLUSTRATIVE
700,000 rooms
… Airbnb within
6 years 1,000,000 rooms
New, winning businesses emerge within short time frames
In ~100 years, Hilton has built
less room capacity than …
10 A 8

©
Alli
anz S
E 2
015
130 120 110 100 90 80
2.5
2.0
1.0
0.5
0.0
200 10 0
4.0
3.5
1.5
3.0
70 60 50 40 30 20 190 180 170 160 150 140
61
Financial services challenged, however, strong
value creation is clearly possible for leaders
P/B1
Book value1, in EUR bn
25 50 100 75
Source: Bloomberg
Market cap isoquant, in EUR bn
Bubble size indicates market cap
1) As of October 31, 2015; Book value refers to common shareholder's equity as last reported; Ace/Chubb: estimated pro-forma
Discount to
Book Value
1.2
A. Renewal Agenda – bringing skills to scale
11 A 9

©
Alli
anz S
E 2
015
Tomorrow’s winners demonstrate clear benefits from global scale
and superior value to local communities
Offering global solutions for global partners
Superior global network
Scale even harder to replicate
Leveraging global assets
in local markets
Superior value through
combination of global &
local scale
Customization of global
solutions Securing impact through
commanding market positions
Local scale matters
Prerequisite for global scale
Scaling up innovation across
the entire organization
Services, products,
technology
Leadership & culture
A. Renewal Agenda – bringing skills to scale
12 A 10

©
Alli
anz S
E 2
015
The future of automotive insurance – both, superior skills and scale required
Today
Personally owned car
Local/regional expertise
Focus on retail
Little innovation
Stand-alone business model
Focus on isolated damage risk
Strong product-orientation
Restricted data availability
A. Renewal Agenda – bringing skills to scale
Predominantly local & retail competition
Tomorrow
Shared cars
Global reach to mirror setup of OEMs and fleets
Focus on institutions/systems
Continuing necessity to invest and evolve
Business model fully integrated in institutional value chains
Focus on cumulative liability risk
Fully integrated assistance/service model
Big data as commodity
Global scale & skill game
13 A 11

©
Alli
anz S
E 2
015
Disciplined thought, disciplined action
Competitive
context
Renewal
Agenda
1
Ambitions
for 2018 4
3
A. Renewal Agenda – bringing skills to scale
14 A 12
2 Taking
stock
Taking
stock 2
Where we lead, where we lag
What to re-inforce, what to change

©
Alli
anz S
E 2
015
Taking stock – strong starting position with upside
Leading
Trust and resilience
Profitability
Global scale
Skills
Re-inforce
A. Renewal Agenda – bringing skills to scale
Lagging
Capital efficiency
Growth ambition
Productivity
Customer centricity
Change
15 A 13

©
Alli
anz S
E 2
015
Bring RoE of all OEs ≥10% in 2018 with largest
impact on L/H, but additional margin upside in
P/C and AM
What to re-inforce, what to change
Re-inforce focus on organizational health –
esp. customer satisfaction and leadership
Maintain shock resistant balance sheet and
strengthen capital productivity
Further reduce volatility of solvency
potential to free up EUR 3bn capital
Grow EPS at average of 5% p.a. until 2018 with
healthy mix of growth and efficiency measures
Taking stock – decisiveness needed
Where we lead, where we lag
A. Renewal Agenda – bringing skills to scale
Margins High margins in AM and P/C, but need for
improvement in L/H outside of Germany
Organizational strength
Strong financial performance, reputation
as trusted partner based on high integrity,
competence and resilience (esp. due to
strong balance sheet)
Cost of capital Very strong credit standing,
but CoE still high
Growth Solid track record in earnings and
dividends, but impact of low rates and
past AM outflows to be addressed
16 A 14

©
Alli
anz S
E 2
015
Continuous strengthening of employee engagement
and customer satisfaction
1) Allianz Engagement Survey measures the engagement of our people and allows to define measures for improvement
Rising loyalty leadership Rising employee engagement
AES1: employee engagement AZ Group, in % NPS2: share of businesses
outperforming the market, in %
2010 2011 2012 2013 2014 2015
75
72
73
70
67
66
21
32
25
15
2010
46
+52%
47
2014
Above market
Loyalty leadership
A. Renewal Agenda – bringing skills to scale
17 A 15 2) Net Promoter Score

© A
llia
nz S
E 2
015
7.5
-2.2
15.4
7.2
4.4
9.9
7.5
Sound margins – but to be strengthened in Life excl. Germany
Return on equity 20141
in %
8.3 L/H
(excl. Germany)
Life Germany 24.3
P/C 11.1
AM 16.6
Ambition 2018:
RoE ≥10%
Key markets by capital consumption Width of column = total equity capital in EUR bn1
1) Excl. URGL on bonds; RoE for AM, P/C, L/H segment based on equity incl. goodwill, for individual OEs excl. goodwill
A. Renewal Agenda – bringing skills to scale
18 A 16

© A
llia
nz S
E 2
015
Decisive action on Life/Health new business mix
L/H new business mix – new LoB reporting1 % of PVNBP
Protection & health
Traditional guaranteed
savings & annuities
Unit-linked w/o guarantee
Capital-light products
1) New reporting for lines of business starts 1Q 2016; values for 2013-2015 approximated
52%45%
36%
14% 25%
27%
17%16%
23%
17% 14% 14%
3Q 20152014 2013
A. Renewal Agenda – bringing skills to scale
Approximation1
Ambition 2018
19 A 17

© A
llia
nz S
E 2
015
8.1%
10.8%
8.0%
Strong operating profit development – subdued growth expectations
CAGR 2009 – 2014
Actuals
CAGR 2015 – 2017
Consensus estimates
A. Renewal Agenda – bringing skills to scale
Source: Bloomberg consensus estimates as of 20 November 2015
Track record Market outlook
Operating profit
Earnings per share
Dividend per share
vs.
1.2%
0.8%
1.9%
20 A 18

©
Alli
anz S
E 2
015
Disciplined thought, disciplined action
Competitive
context
Taking
stock
1
2
Ambitions
for 2018 4
A. Renewal Agenda – bringing skills to scale
21 A 19
3 Renewal
Agenda
Renewal
Agenda 3
Pillars of continued industry leadership
Ensuring successful execution

©
Alli
anz S
E 2
015
Ensuring successful execution
Renewal Agenda builds on strong foundations for every lever, esp. global reach and
business lines, business model and technology convergence, strong culture and values
New horizontal change process mobilizing leaders and employees
Governance, processes & incentives redesigned to facilitate capturing skill and scale benefits
Stronger agility and market focus of corporate center
Pillars of continued industry leadership
Capital allocation discipline to free up significant resources for stronger value creation
Recalibration of portfolio strategy with aim to create more and larger “at scale” businesses
with commanding market positions
Execution of Renewal Agenda with five levers: 1. True Customer Centricity, 2. Digital by Default,
3. Technical Excellence, 4. Growth Engines, 5. Inclusive Meritocracy
The Renewal Agenda
A. Renewal Agenda – bringing skills to scale
22 A 20

©
Alli
anz S
E 2
015
Earnings, capital allocation, and cash management discipline for
stronger value creation by 2018
5% EPS CAGR Increase earnings Growth
Remittance ratio >80% Enhance liquidity Cash
Dieter
Wemmer
to present more
details today
13% RoE
Sensitivity reduction of Solvency II ratio,
potential to free up EUR ~3bn
At least EUR 4bn upstream opportunities
… capital productivity
… capital intensity
… capital fungibility
Capital Improve …
A. Renewal Agenda – bringing skills to scale
23 A 21

©
Alli
anz S
E 2
015
2
2 Scale up smaller, but high-performing OEs Leverage true benefits from scale, incl. digital platforms Create regional platforms (e.g., CEE, LatAm, AZAP, MENA/Africa) Achieve Top 3 market positions, >10% market share
Create more and larger “at scale” businesses with commanding
market positions
1) Annual operating profit by OE, average 2012-14
Operating profit (EUR bn)1
1
Four strategic levers based on relative size
and competitiveness
Fortify large and competitive OEs Create more “Earnings Engines” with > EUR 1bn operating profit and commanding market positions
1
A. Renewal Agenda – bringing skills to scale
2.4
2.0
2.8
0.8
1.2
0
0.4
1.6
PIM
CO
Germ
any
Italy
Fra
nce
AZ
Life
AG
CS
Eule
r H
erm
es
Spain
Austr
alia
Alli
anz G
I
Sw
itzerland
Benelu
x
. . .
. . .
Small OEs
EUR 1 billion
Inorganic growth: continue to seize attractive
opportunities with discipline
24 A 22
3
3 Restructure large, but less profitable OEs Focus on productivity and efficiency, release capital
4 4 Reposition uncompetitive businesses
Improve productivity, take decisive portfolio actions

©
Alli
anz S
E 2
015
A. Renewal Agenda – bringing skills to scale
Streamlined
governance
Shared expertise
Joint business model,
with integrated product
architecture
Common processes,
IT platforms and tools
Rationale Benefits1
Better customer service
and growth
Higher efficiency
Scaling-up best-practice
Technical capabilities
Faster digital
transformation
Compliance ensured
Benelux Iberia LatAm
In execution
Asia-Pacific
Under redesign
To be set up
CEE MENA/Africa
1) Not all benefits realized in all regional platforms yet
Recalibration of portfolio strength: scale up smaller, but
high-performing businesses through regional platforms
25 A 23

©
Alli
anz S
E 2
015
Capture capital synergies
Our M&A focus criteria
Cash generating business
Strong presence in
region/synergies
Core market
Emerging market
Distribution capacity
Product capabilities
Key transactions 2012-2014 2012 2014 2014 2013 2012
A. Renewal Agenda – bringing skills to scale
Continue to seize attractive M&A opportunities with discipline
26 A 24

©
Alli
anz S
E 2
015
Execution of Renewal Agenda with five levers:
further strengthening of our competitive advantages
True Customer
Centricity
Make superior customer experience the top
priority for all our actions 1 Digital by
Default
Move from selected leading assets to become
“Digital by Default” everywhere 2
Growth
Engines
Systematically exploit new sources for
profitable growth 4 Inclusive
Meritocracy
Re-inforce a culture where both people
and performance matter 5
Technical
Excellence
Create superior margins, innovation, and growth
through best talents and state-of-the-art skills 3
A. Renewal Agenda – bringing skills to scale
True Customer Centricity
Digital by Default
Growth Engines
Technical Excellence
True Customer Centricity
Digital by Default
Growth Engines
Inclusive Meritocracy
Technical Excellence
27 A 25

©
Alli
anz S
E 2
015
True Customer Centricity:
superior customer experience is the top priority
1
A. Renewal Agenda – bringing skills to scale
From NPS measurement to superior
management of customer journeys
Deliver superior value to our clients with a
distinctive and caring customer experience
Outperform on essential customer needs: ease &
convenience and consistency & trust – focus on
“what matters for the customer”
Set clear customer-oriented targets hardwired
into our culture, planning process and incentives Sergio
Balbinot
to present more
details today
75% of our businesses Loyalty Leader
or NPS above market – up from 47%
Flagships1 at 80% – up from 45%
Translating into at least additional 5mn
customers and EUR 6.5bn revenues
Ambition 2018
1) Germany, Italy, France, Switzerland, Austria, Benelux, Turkey, Spain, UK, US, Australia
28 A 26

©
Alli
anz S
E 2
015
True Customer Centricity is the core of the Renewal Agenda
True Customer Centricity
Digital by Default
Growth Engines
Inclusive Meritocracy
Technical Excellence Basis for strong profitable
global growth
Defines design principles for digitalization
Determines standards for Technical Excellence
Customer needs as reference point for innovations
Tailored processes for higher efficiency and
effectiveness
Focus on customer needs to reduce product
complexity without jeopardizing skill advantages Deep understanding of client segments/needs required
to capture growth
High customer satisfaction as key enabler for increased cross-/
up-selling, higher retention, and new business generation
Key driver for employee engagement
Customer satisfaction and employee
engagement mutually reinforcing
1
A. Renewal Agenda – bringing skills to scale
29 A 27

© A
llian
z S
E 2
015
NPS vs. AES/EEI1 results – core Europe
Customer satisfaction as basis for growth and driver of employee engagement
1) Employee Engagement Index
1 A. Renewal Agenda – bringing skills to scale
50% 40%
-20%
-30%
90% 80% 70% 60%
0%
40%
30%
20%
10%
-10%
Policyholder NPS Intermediary NPS
Strong correlation of customer satisfaction and employee engagement
NPS
EEI1
3-4%
1-1.5%At/below market
3x
Loyalty Leader/ above market
YOY growth, straight avg. of OEs by NPS category
Customer satisfaction leads to higher growth
Increased cross-selling, loyalty, retention, and lower costs (via decreased queries/complaints)
50%
Reverse also true! Employee engagement also drives customer satisfaction
1 A 28

©
Alli
anz S
E 2
015
2
A. Renewal Agenda – bringing skills to scale
Simple digital product design
to reduce overall complexity,
esp. for the customer
Digital communication by
default, paper as exception
Significant productivity gains
by digitalization of our major
processes
Unlocking the digital dividend
Decisive action along two major levers –
unlocking the digital dividend and building new digital value
Building new digital value
New digital products and
services to serve emerging
needs of our clients and
partners, e.g., protection
against cyber risks, solutions
for sharing economy
Digital ventures to capture
new business model
innovations (esp. FinTechs)
and to scale them up rapidly
within Allianz
Expand big data and
analytics capabilities, e.g.,
for robo advice, connected
homes
Increase our paperless/digital
communication to > 50%
Extend our digital offering of retail
products to close to 100%
Reinvest recurring productivity
gains of EUR 1bn into our customer
centric digital transformation
More details at
Capital Markets
Day mid 2016
Ambition 2018
31 A 29
©
Alli
anz S
E 2
015
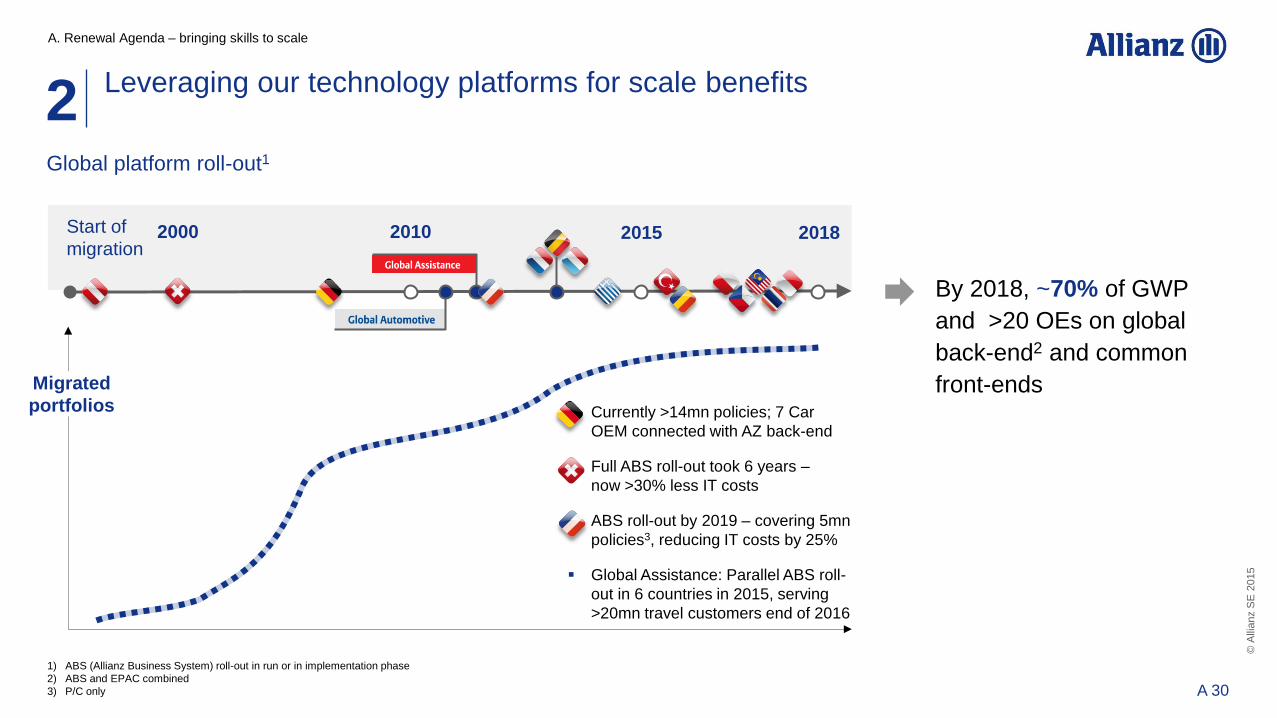
Leveraging our technology platforms for scale benefits
2 Global platform roll-out1
1) ABS (Allianz Business System) roll-out in run or in implementation phase
2) ABS and EPAC combined
3) P/C only
A. Renewal Agenda – bringing skills to scale
2018 Start of
migration 2015 2000 2010
Migrated
portfolios Currently >14mn policies; 7 Car
OEM connected with AZ back-end
Full ABS roll-out took 6 years –
now >30% less IT costs
ABS roll-out by 2019 – covering 5mn
policies3, reducing IT costs by 25%
Global Assistance: Parallel ABS roll-
out in 6 countries in 2015, serving
>20mn travel customers end of 2016
By 2018, ~70% of GWP
and >20 OEs on global
back-end2 and common
front-ends
32 A 30
©
Alli
anz S
E 2
015
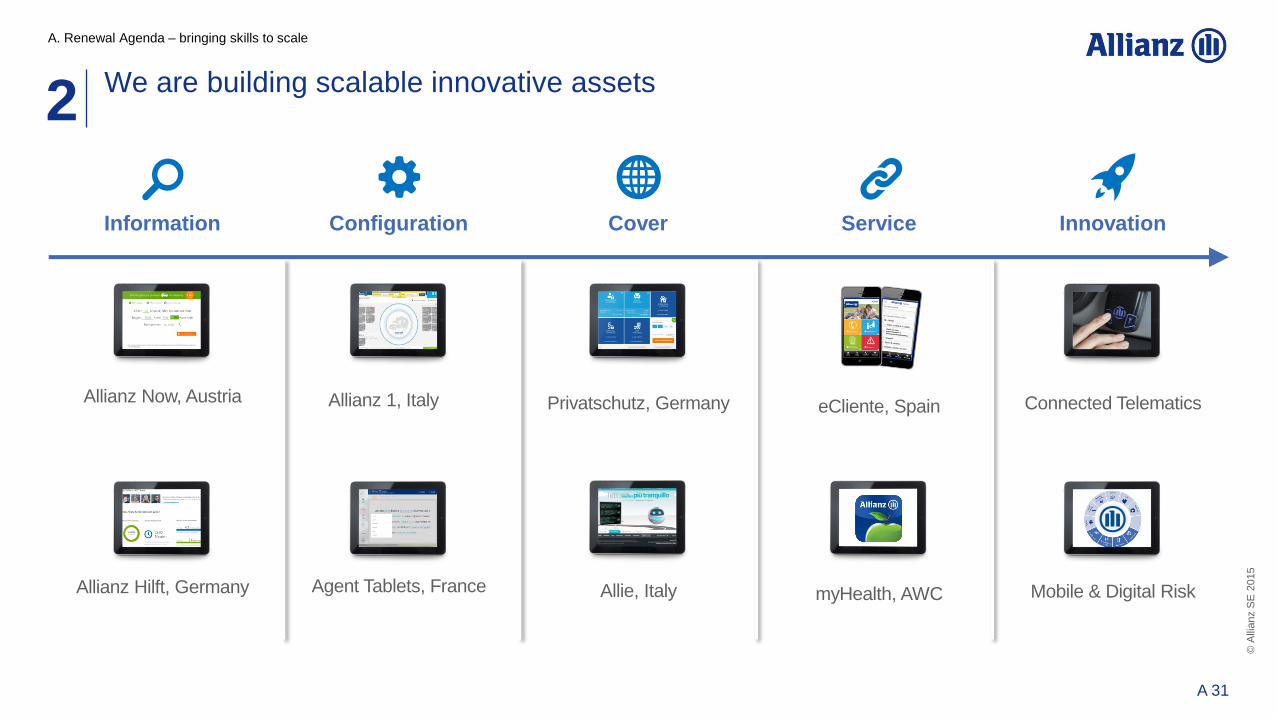
Information Configuration Cover Service Innovation
Allianz 1, Italy eCliente, Spain Connected Telematics
Mobile & Digital Risk
Allianz Now, Austria
Allianz Hilft, Germany Agent Tablets, France
Privatschutz, Germany
Allie, Italy myHealth, AWC
We are building scalable innovative assets 2
A. Renewal Agenda – bringing skills to scale
33 A 31
©
Alli
anz S
E 2
015
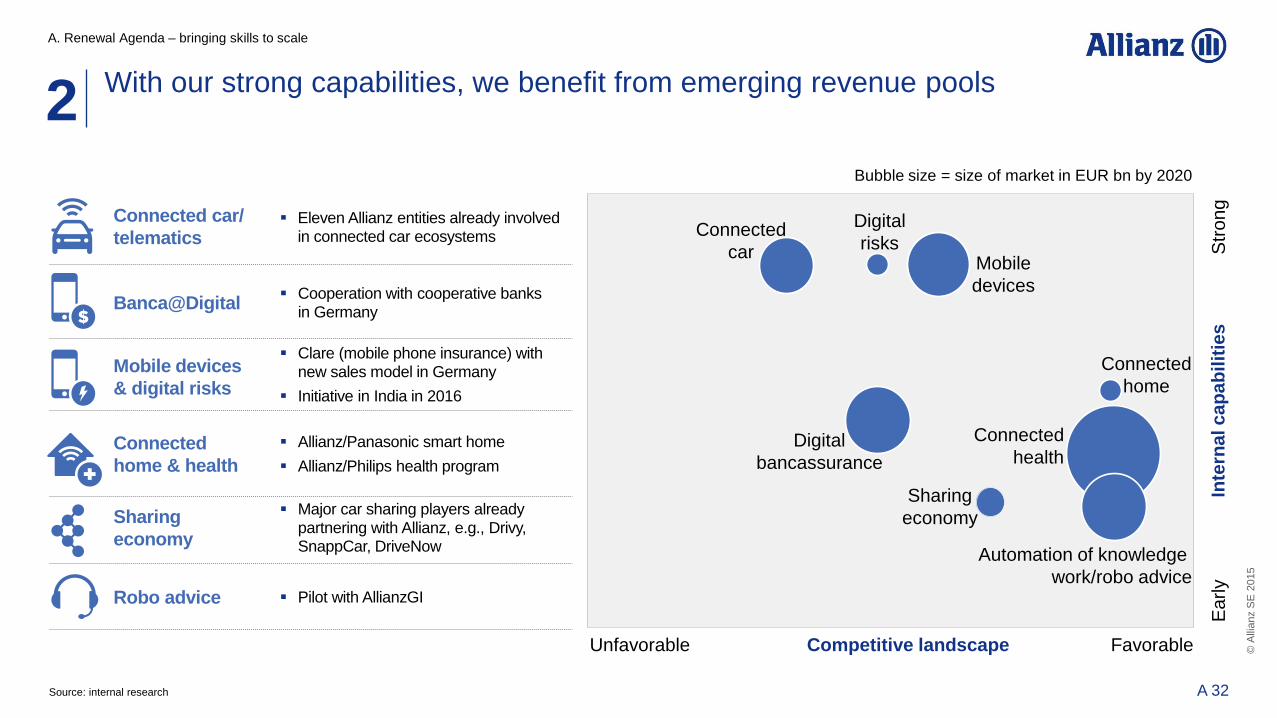
With our strong capabilities, we benefit from emerging revenue pools
Sharing
economy
Connected
home & health
Mobile devices
& digital risks
Banca@Digital
Robo advice
Connected car/
telematics
Major car sharing players already partnering with Allianz, e.g., Drivy, SnappCar, DriveNow
Allianz/Panasonic smart home
Allianz/Philips health program
Clare (mobile phone insurance) with new sales model in Germany
Initiative in India in 2016
Cooperation with cooperative banks in Germany
Pilot with AllianzGI
Eleven Allianz entities already involved in connected car ecosystems
Early
Str
on
g
Inte
rna
l c
ap
ab
ilit
ies
Bubble size = size of market in EUR bn by 2020
Unfavorable Favorable Competitive landscape
Connected
car
Digital
risks Mobile
devices
Connected
home
Connected
health
Sharing
economy
Automation of knowledge
work/robo advice
Digital
bancassurance
2
Source: internal research
A. Renewal Agenda – bringing skills to scale
34 A 32

©
Alli
anz S
E 2
015
Leverage digital and big data for better pricing,
u/w & claims management through advanced
analytics
Foster SME and mid-corp excellence & growth
Improve broker productivity and quality
management, both at global and local level
Attract and develop the best technical talent and
push cross-functional collaboration
(e.g., smart circle)
Technical Excellence – P/C: create superior margins and
growth through best talents and state-of-the-art skills 3
Axel Theis
to present more
details today
CR ≤ 94%
Highest satisfaction scores from
intermediaries and clients for
competence, service and
integrity
Ambition 2018
A. Renewal Agenda – bringing skills to scale
35 A 33

©
Alli
anz S
E 2
015
Advanced risk &
credit modeling
Micro-zoning,
geo-localization
Price to market
execution
Data based fraud
management
“Real time” loss
trend analytics
Retail
SME
Mid-corp
Large-corp and specialties
Sample applications
Sub-industry
scoring
Superior event
modeling
Accumulation
control
AP/TP1
management
Retention/
margin
optimization
Digital fraud
detection tool
Claims
Underwriting
Reflects impact of
technology and
technical trends
1) Actual price/technical price
≙ relevance
(–) done
3 Pulling further levers for P/C Technical Excellence
A. Renewal Agenda – bringing skills to scale
36 A 34

©
Alli
anz S
E 2
015
Technical excellence – Life/Health: achieve superior margins through
changing our new business mix and actively managing our in-force business 3
A. Renewal Agenda – bringing skills to scale
Hedgeable
guarantees
Rapidly move into
truly capital efficient
products with
alternative
guarantees
New business
In-force management
Repricing
Active use of existing
management levers
to adjust profitability
Capital-light products
Strongly grow in retail and
wholesale with modern
capital-light products
Protection & health
Improve margin
through change
in business mix
Back books
Actively manage
in-force business
and back-books
Crediting
Conscious discipline on recurring
vs. terminal bonus and crediting
levels
ALM
Outperform in risk-
adjusted investment
management
Increase NBM from 1.9%1 to ≥ 3%
Each OE ≥ 10% RoE
Significant reduction of interest
sensitivity and capital intensity
Accelerate growth and value creation
from capital efficient products as well
as protection & health
Maximilian
Zimmerer
to present more
details today
1) 12M 2014 based on year-end assumptions
Ambition 2018
37 A 35

©
Alli
anz S
E 2
015
Systematically exploit sources of profitable growth across regions,
business segments and channels 4
A. Renewal Agenda – bringing skills to scale
Europe
US
Asia-Pacific &
LatAM/Africa
Global lines
P/C L/H AM Services/
health
Focus on strong
specialty positions
Scale up disruptive digital models
Build regional platforms & partnerships
Reinforce strong
collaboration to
provide joint solutions
Focus on capital light products
Develop Bancassurance partnerships
Expand in retirement
opportunity
Focus on capital- light products
Develop new distribution partnerships
Roll-out global key
product innovations
Achieve synergies
with Life
Grow alternatives,
income
Scale up strong
foundations
(e.g., Greater China)
Leverage global AM
expertise into local
markets
Expand footprint
in services
Bundle insurance
products and
assistance services
Capture growth
opportunities in
Health
Consolidate for leadership and scale
Regional platform in CEE
Grow Direct
Ambition
2018
EPS CAGR 5%
38 A 36

©
Alli
anz S
E 2
015
Allianz in Asia: New joint venture with Baidu and Hillhouse well
positioned to capture opportunities in Chinese digital insurance market 4
Access to >90% of China’s
internet users
▪ Application for nation-wide digital
insurance license coverage
▪ Focus on P/C protection
▪ Insurance product innovation and
modular architecture
▪ First-in-class insurance-related
analytics (e.g., pricing, risk)
and customer insights based
on big data
Annual digital insurance GWP (2020)
> EUR 100bn Projected growth for digital insurance
in next 5 years
~ 40% CAGR
Digital insurance in China is a large opportunity
Joint
Venture
No.1 in insurance
No.1 in assistance services
Top 5 in asset management
125 years of track record
Portfolio covers 10+ industries
Leading PE firm in Asia with
EUR ~16bn AUM
Investments in multiple
digital platforms
Insights in Chinese market
and local regulation
Covers >90%
Chinese web users
>600mn mobile
Baidu users
8.2bn searches per day
8.2mn post bars w/
1.5bn accounts
A. Renewal Agenda – bringing skills to scale
Ambition: Expansion of further
partnerships in South-East Asia
39 A 37
©
Alli
anz S
E 2
015
Inclusive Meritocracy:
reinforce a culture where both people and performance matter
5
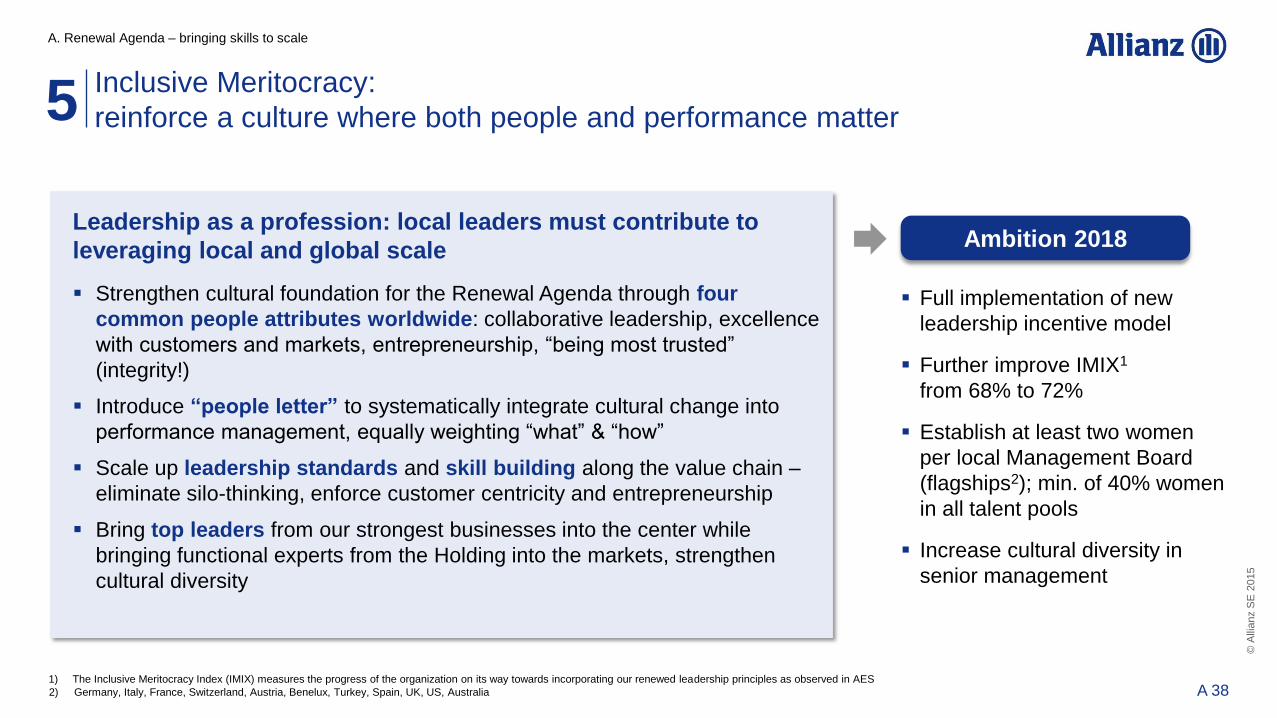
Leadership as a profession: local leaders must contribute to
leveraging local and global scale
Strengthen cultural foundation for the Renewal Agenda through four
common people attributes worldwide: collaborative leadership, excellence
with customers and markets, entrepreneurship, “being most trusted”
(integrity!)
Introduce “people letter” to systematically integrate cultural change into
performance management, equally weighting “what” & “how”
Scale up leadership standards and skill building along the value chain –
eliminate silo-thinking, enforce customer centricity and entrepreneurship
Bring top leaders from our strongest businesses into the center while
bringing functional experts from the Holding into the markets, strengthen
cultural diversity
A. Renewal Agenda – bringing skills to scale
Full implementation of new
leadership incentive model
Further improve IMIX1
from 68% to 72%
Establish at least two women
per local Management Board
(flagships2); min. of 40% women
in all talent pools
Increase cultural diversity in
senior management
1) The Inclusive Meritocracy Index (IMIX) measures the progress of the organization on its way towards incorporating our renewed leadership principles as observed in AES
Ambition 2018
2) Germany, Italy, France, Switzerland, Austria, Benelux, Turkey, Spain, UK, US, Australia
40 A 38

©
Alli
anz S
E 2
015
The Renewal Agenda implies
significant change for our people
Reinforcing the motivation and productivity of our people 5
Focus on customer centricity
Embrace digital opportunities
Higher agility & flexibility
Real productivity gains – continuously
A. Renewal Agenda – bringing skills to scale
We will support our staff
systematically to master the journey
Strengthened internal communication:
clear, direct, consistent and modern
Frontline empowerment: reduced layers
and co-creation of services, processes
and technology, esp. with client facing staff
Strategic workforce planning: resource
evolution to be transparent and detailed
for midterm implementation
Investment in skills & motivation
41 A 39

©
Alli
anz S
E 2
015
Successful execution supported by three pillars
New “horizontal“ change process
Mobilization of entire global senior
leadership team
Team at the top: each Board Member
sponsor of one Renewal Agenda lever
Solution development by “tribes”
of CEOs and experts in agile process
Intensive dialogues in multiple-
stakeholder approach
Outward orientation: market experts
and practitioners in driving seat,
focus on relentless benchmarking,
beating competition – not plans
1 Organizational model redesigned to capture benefits of skill and scale
Push for strong convergence of business
models and execution globally
- Core skills
- Products/services
- Tools & technology
- Leadership quality
Aligned incentives: delivering Group
value beyond local business
requirement for career success
People letter: “What” & “How” both as
key steering component, full reflection
of Renewal Agenda
2 Strengthen agility of corporate center
Increase share of leaders with proven
local business track record as Group
Center heads
Streamlining of Holding functions,
focus on Renewal Agenda
implementation
Focus on customer and market
success, not just controlling –
incentives adjusted
3
A. Renewal Agenda – bringing skills to scale
42 A 40

©
Alli
anz S
E 2
015
New “horizontal” change process mobilizing leaders and employees
(Top ~250 managers, average, scale: 1=worst; 10=best)
Evaluation of Allianz global executive event AES: strategic orientation (Allianz SE), in %
Stronger strategy focus
8.5
10.0
9.5
0
Max = 10
March
2015
Sept
2015
March
2014
March
2013
March
2012
Strong
endorsement
& intensive
discussion
of Renewal
Agenda
65
70
75
0
2014
74
2013
77
2015 2012
66
2011
75
62
9.0
9.6
8.9 8.9
8.7
8.4
A. Renewal Agenda – bringing skills to scale
43 A 41

©
Alli
anz S
E 2
015
Competitive
context
Taking
stock
1
2
A. Renewal Agenda – bringing skills to scale
Disciplined thought, disciplined action
44 A 42
Renewal
Agenda 3
Ambitions
for 2018 4
Renewal Agenda impact
Achieving stronger performance & health
Ambitions
for 2018 4

©
Alli
anz S
E 2
015
Ambitious and balanced aspirations for 2018 (in %)
Performance Health
1) Excluding unrealized gains/losses on bonds
RoE1 13
IMIX 72
NPS 75 better than market
EPS 5 CAGR 2016-2018
A. Renewal Agenda – bringing skills to scale
45 A 43

©
Alli
anz S
E 2
015
Our Renewal Agenda will reinforce Allianz leadership position
True Customer
Centricity
Superior
customer
experience
75% of our
businesses aim to
be Loyalty Leader
or above market
Digital
by Default
Expand our
common group
platforms
Achieve
productivity
gains to finance
our digital
transformation
Technical
Excellence
Rigorous
management of
underperforming
portfolios
In-force
management and
a strong move
into capital-light
products
Growth
Engines
Consolidate
leadership in
mature markets
Reinforce our
presence in
growth markets
Inclusive
Meritocracy
Reinforce a
culture where
people and
performance
matter
Strengthen
leadership bench
and employee
engagement
Accelerated
customer retention,
growth and
margins
Globalization of
new digital
products and
processes
EUR 1bn of
recurring
productivity gains
by 2018
Ambitious financial
targets:
- P/C CR ≤ 94%
- L/H RoE ≥ 10%
for each OE;
NBM ≥ 3%
Improve margins
and scale
Fortify growth
Secure our future
potential
Faster, more
successful change
execution
Content
Impact
A. Renewal Agenda – bringing skills to scale
46 A 44

©
Alli
anz S
E 2
015
Today’s presentations
True Customer
Centricity
PIMCO update
Technical
Excellence
in P/C
Life business
in low yield
environment
Value creation
Digital by
Default
Key topic at
CMD mid 2016
Sergio Balbinot Douglas Hodge Axel Theis Maximilian Zimmerer Dieter Wemmer
A. Renewal Agenda – bringing skills to scale
47 A 45

True Customer
Centricity
Sergio Balbinot
Member of the Board of Management
Allianz SE
Munich, November 24, 2015

©
Alli
anz S
E 2
015
True Customer Centricity (TCC) means …
B. True Customer Centricity
…to delight our customers by delivering
superior value
with an excellent and caring
customer experience.
49 B 2

©
Alli
anz S
E 2
015
How will the customer experience at Allianz look like?
Easy & convenient
Relevant
Trustworthy
B. True Customer Centricity
50 B 3
©
Alli
anz S
E 2
015
3 - 4%
1 - 1.5%
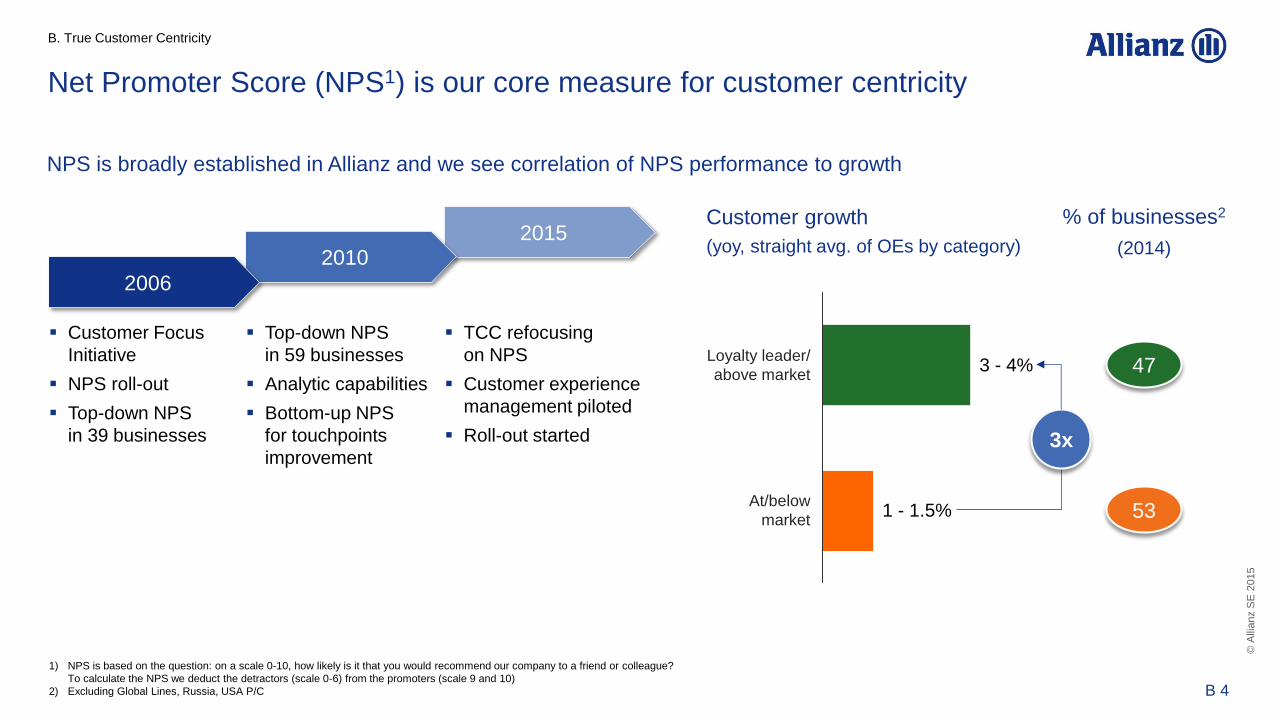
Net Promoter Score (NPS1) is our core measure for customer centricity
1) NPS is based on the question: on a scale 0-10, how likely is it that you would recommend our company to a friend or colleague?
To calculate the NPS we deduct the detractors (scale 0-6) from the promoters (scale 9 and 10)
2) Excluding Global Lines, Russia, USA P/C
NPS is broadly established in Allianz and we see correlation of NPS performance to growth
2015 2010
2006
Customer Focus
Initiative
NPS roll-out
Top-down NPS
in 39 businesses
Top-down NPS
in 59 businesses
Analytic capabilities
Bottom-up NPS
for touchpoints
improvement
TCC refocusing
on NPS
Customer experience
management piloted
Roll-out started
At/below
market
1.1%
Customer growth
(yoy, straight avg. of OEs by category)
3x
% of businesses2
(2014)
47
53
Loyalty leader/
above market
B. True Customer Centricity
51 B 4

©
Alli
anz S
E 2
015
… to
NPS as broadly established target with
economic impact and bonus relevance
From …
NPS as occasional target with
low bonus relevance
We learned from our successful entities
Modular, digital products
Sales focus Customer needs focus
Complex, paper based products
Touchpoint focus and process improvement
Incremental change
Customer journey focus and
culture transformation
Reengineered business models with
fully embedded assistance services
1
2
3
4
5
Local solutions and fragmented brands Global scale up under strong Allianz brand 6
B. True Customer Centricity
52 B 5

©
Alli
anz S
E 2
015
NPS as broadly established target with
economic impact and bonus relevance 1
Operating entities: plans on implementing
True Customer Centricity & NPS development
Mid-term bonus letters: OE plans anchored in
individual target letters and cascaded down
Group NPS target/regional
NPS targets Holding board
Local business
NPS targets Local CEOs
Contribution to local
business NPS target
Local boards
& management
Further cascading via annual target letters
B. True Customer Centricity
53 B 6

©
Alli
anz S
E 2
015
45 66
Target CX measurement system
Top-down NPS
Allianz Health
Allianz Motor
Allianz Property
Allianz Life
Top
business drivers
Brand Product Price Service
experience
Operational KPIs
1st response
quality
1st response wait time
…
Customer journeys experience
Sales & onboarding
Claims Renewal Issue
resolution
Customer experience (CX) management improves customer
satisfaction along customer journeys - not just individual touchpoints
From …
Customers reaching out
Multiple sources
Inconsistent information
… to
Allianz proactively reaching out
Single source
Consistent information
Implementing customer centric solutions
Example: motor MOD claims journey Understanding NPS drivers
Bottom-up claims NPS: control group vs. pilot
Control group Pilot
2
B. True Customer Centricity
+47%
54 B 7

© A
llia
nz S
E 2
015
+100%
30 60
First improvements
of digital channels and
phone services
already launched
Over 400 improvement
measuresdeveloped and 50already implemented
Over 22mn out of
82mn customer experiences
addressed
More than 33 out of
150 customer journeysre-engineered
end to end
Scaling up of customer experience management under way 2
Example: P/C claims After nine months: momentum established
and solid foundation built
55
Outlook:
2 journeys
optimized
per OE by
2016
B. True Customer Centricity
Control group Pilot
Bottom-up claims NPS: control group vs. pilot
From … Limited transparency
on next steps
Letter as primary channel
Status inquiries via phone
… to Expectation management
e.g. SMS status info
Phone as primary channel
Explain decisions upfront via phone
55 B 8

©
Alli
anz S
E 2
015
38 57
Fast Quote solutions simplify the information and purchase process
leading to better sales NPS and higher sales conversion
3
Easy, convenient and transparent solutions
56
B. True Customer Centricity
2012
+51%
2014
Bottom-up sales NPS motor Fast Quote 2012 vs. 2014
Highlights motor Fast Quote
2 basic customer data points only
Max. 10 seconds to quote
Conversion via agents
Impact 2015 YTD
1.5mn online quotes
500k convertible1
54k policies sold
1) Existing policies expiring within 60 days
56 B 9
©
Alli
anz S
E 2
015
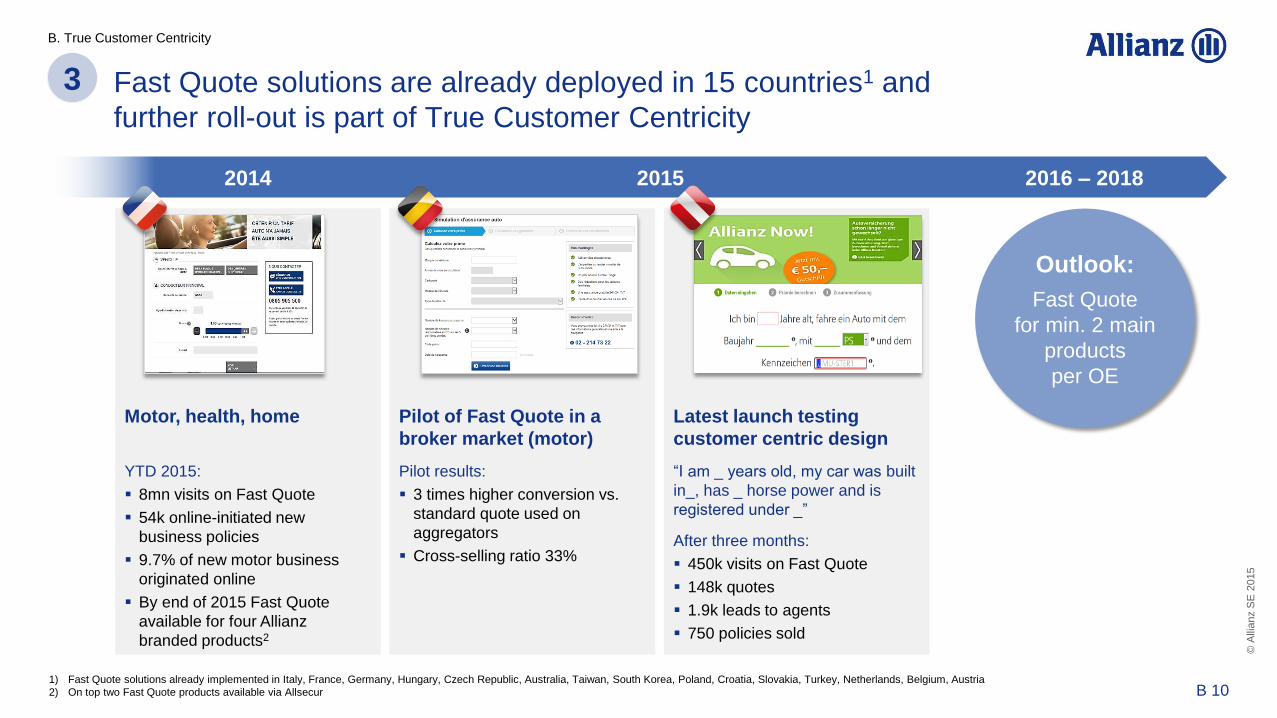
1) Fast Quote solutions already implemented in Italy, France, Germany, Hungary, Czech Republic, Australia, Taiwan, South Korea, Poland, Croatia, Slovakia, Turkey, Netherlands, Belgium, Austria
2) On top two Fast Quote products available via Allsecur
Fast Quote solutions are already deployed in 15 countries1 and
further roll-out is part of True Customer Centricity
3
B. True Customer Centricity
Motor, health, home
YTD 2015:
8mn visits on Fast Quote
54k online-initiated new
business policies
9.7% of new motor business
originated online
By end of 2015 Fast Quote
available for four Allianz
branded products2
Pilot of Fast Quote in a
broker market (motor)
Pilot results:
3 times higher conversion vs.
standard quote used on
aggregators
Cross-selling ratio 33%
Latest launch testing
customer centric design
“I am _ years old, my car was built
in_, has _ horse power and is
registered under _”
After three months:
450k visits on Fast Quote
148k quotes
1.9k leads to agents
750 policies sold
Outlook:
Fast Quote
for min. 2 main
products
per OE
2015 2014 2016 – 2018
57 B 10

©
Alli
anz S
E 2
015
The next evolution will be Fast Quote combined with modular offers 4
B. True Customer Centricity
2015 2014 2016 – 2018
Protect your family
Three basic customer data points only
Max. 30 seconds to quote
13 cross-LoB modules available
Impact 2015 YTD
1.1mn quotes
26k units sold
60% of Allianz1 new business originated online
Bottom-up NPS: 55%
Protect your business
Launched in November
Three basic customer data points only
Fast quotation in less than 10 seconds
From 80 covers to 9 modules
Outlook:
local adaptation
of solution and
pilot in 2-4
additional
countries
Note: Allianz Germany also offers modular offer with immediate price indication (Privatschutz); modules cover household, accident, liability, legal protection and residential building insurance
58 B 11

©
Alli
anz S
E 2
015
Allianz global service entities as differentiator, creating value for customers 5
B. True Customer Centricity
Note: data as per year end 2014
Claims
w/o assistance
+20%
Claims
incl. assistance
Bottom-up claims NPS: regular claims vs. claims
with assistance service in %-p
Outlook:
assistance services
included for all major
product lines
by 2018
Stand-alone
assistance offers
Assistance included
in insurance offer
Travel & leisure
43%
Home
8%
Automobile
37%
Health
12%
Assistance market leader
EUR 2.65bn turnover
Global presence
66 countries, 58 languages, 5,519 medical
providers
B2B & partner-
ships
Car manufacturers
insurers/banks, travel agents,
etc.
Helping 67mn
people
3 calls per second + 1 case every
2 seconds
59 B 12
©
Alli
anz S
E 2
015
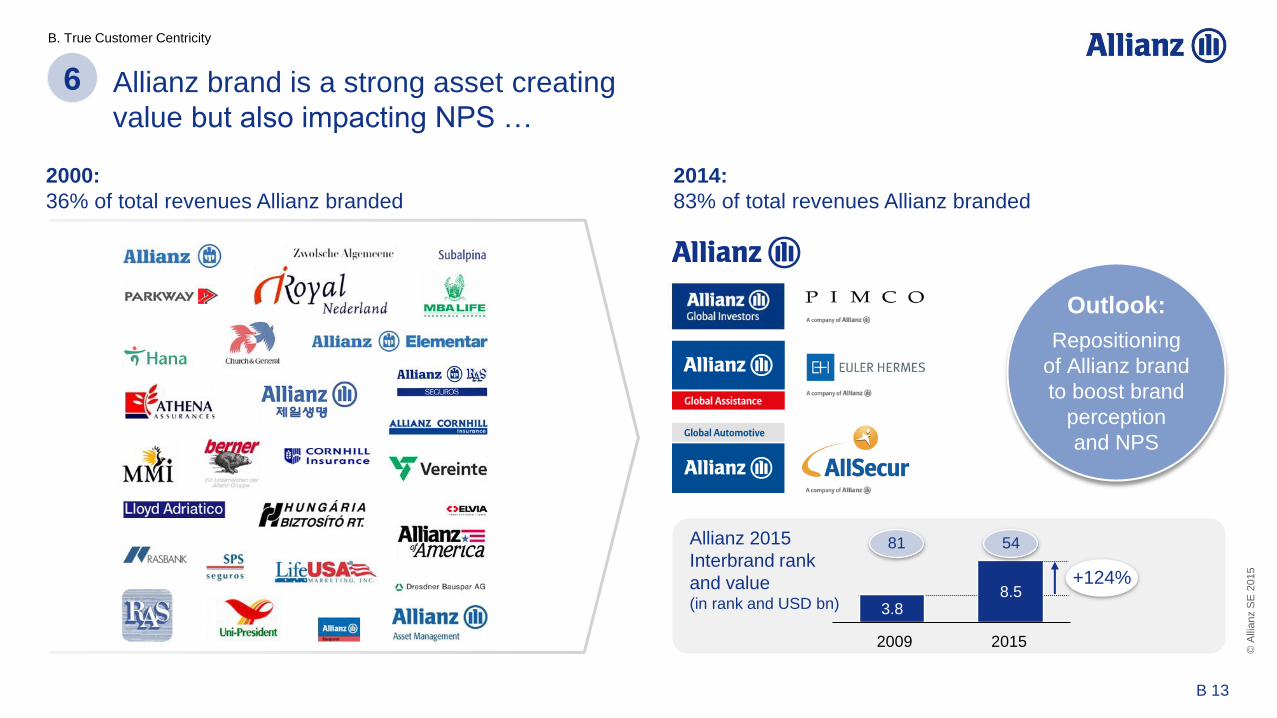
Allianz brand is a strong asset creating
value but also impacting NPS …
2000:
36% of total revenues Allianz branded
Allianz 2015
Interbrand rank
and value (in rank and USD bn) 3.8
8.5
2009 2015
6
B. True Customer Centricity
+124%
2014:
83% of total revenues Allianz branded
54 81
Outlook:
Repositioning
of Allianz brand
to boost brand
perception
and NPS
60 B 13

©
Alli
anz S
E 2
015
… and new positioning of brand will further boost impact
Local adaptation of “Dare
to” concept (AZ Belgium):
Impact on sympathy
(scores 1-5 with 1 low
and 5 high sympathy)
3.8 4.5
Financial service
benchmark New Allianz
campaign
B. True Customer Centricity
+18%
61 B 14

©
Alli
anz S
E 2
015
This translates
into an ambition of
5mn additional
customers
and
EUR 6.5bn
additional total
revenues
True Customer Centricity ambition 2018:
step up NPS performance of each OE
B. True Customer Centricity
Stretching each OE’s NPS level increases customer growth
Ambition 2018
Step-change global NPS performance
by 2018 with 75% of our businesses
above market or at loyalty leadership
(+28%-p from 2014)
Our flagships2 will improve even more
(+35%-p from 2014). Business plans
confirm that 80% of flagship
businesses will be above market
or at loyalty leadership by 2018
1) Allianz branded business excluding Global Lines, Russia, USA P/C
2) Germany, Italy, France, Switzerland, Austria, Benelux, UK, Turkey, Spain, USA, Australia
In % of businesses1
2018 2014
47%
53%
75%
25%
Loyalty leader/
above market
At market/
below market
62 B 15

©
Alli
anz S
E 2
015
Glossary
NPS: Net Promoter Score Measurement of customer loyalty based on the question:
“On a scale from 0 to 10, how likely is it that you would recommend our company to a friend or colleague?”
NPS = (% of promoters) – (% of detractors)
whereby promoters scored 9 or 10 and detractors scored 0 to 6
Top-down Net Promoter Score Annual measurement on company level in comparison to competitors
Bottom-up Net Promoter Score Measured directly after customer interaction at pre-defined touchpoints
Businesses Operating entities at segment level (Life, Health, P/C), unweighted, excluding Global Lines, Russia and
USA P/C for monoliners second level segment considered (e.g. UK personal, commercial)
Fast Quote Initial price point given via any online medium for an offer that is calculated based on a limited number
of customer data inputs. The number of data points requested is often significantly lower than for
competitor offers (typically between 2 and 7) or quote can be obtained in less than 60 seconds
B. True Customer Centricity
63 B 16

PIMCO update
Douglas Hodge
CEO PIMCO
Munich, November 24, 2015

©
Alli
anz S
E 2
015
1 PIMCO – a strong platform
2 Strategic priorities C
65 C 2

©
Alli
anz S
E 2
015
PIMCO at a glance
Key characteristics
Mission: “To preserve and enhance our clients’ assets with the highest-quality investment management service”
Client interests always come first
Focus on excellent risk-adjusted performance
Seek to provide the highest quality client service in the industry
Strong and truly global platform with performance and growth oriented culture
Focus on active and smart-passive strategies
Investment professionals by region2
Third-party AuM by region2
1) As of 31 October 2015
2) End of 3Q 2015
C. PIMCO update
Asia-Pacific
12%
Americas
65%
Europe
23%
Key data 3Q 2015
Total AuM (EUR bn): 1,319
3rd party AuM (EUR bn): 985
Operating profit 3Q 2015 (EUR mn): 500
CIR: 58.6%
3 yr investment outperformance1: 77%
Investment professionals: 750+
Europe
27%
Americas
64%
Asia-Pacific
10%
66 C 3

©
Alli
anz S
E 2
015
The global asset management market
Key industry data
Global AuM expected to reach over EUR 75trn by 20201
Market and industry trends
Growth primarily driven by individual retirement plans
and increase of mass affluent and HNW individuals in
emerging markets
Rapidly growing pensioner and baby boomer numbers
will continue to fuel demand for fixed income assets
driven by their need for income and capital preservation
Continued low interest rate environment fueling interest
in higher-return seeking strategies
Evolving client segments and needs
Ongoing changes in distribution models
Increasingly global business models
Evolving digital capabilities
Changes in regulatory landscape
Global AuM1 (EUR trn)
AuM (EUR bn) and CIR (%) 20152
27.4
40.3 48.3
77.0
58.0 58.6 61.7 56.3 76.0 CIR (%)
2004 2007 2012 2020e
4,095
1,319
701 679 672
Passive
Active
Blackrock PIMCO Franklin T. Rowe Legg Mason
C. PIMCO update
1) Source: PWC; numbers FX adjusted using year end exchange rates
(2012 year end USD/EUR exchange rate applied to 2020 estimates)
2) As of 3Q 2015; sources: company reports
67 C 4

©
Alli
anz S
E 2
015
Governance structure has been fully institutionalized
C. PIMCO update
Portfolio management
24 years
Group CIO
Dan Ivascyn
17 years
CIO – Global Fixed Income
Andrew Balls
23 years
CIO – Global Credit
Mark Kiesel
21 years
CIO – U.S. Core Strategies
Scott Mather
28 years
CIO – Non-Traditional Strategies
Marc Seidner
14 years
CIO – Real Return & Asset Allocation
Mihir Worah
Business management
Marketing
Chief Executive Officer
Douglas Hodge
President
Jay Jacobs
Morningstar 2013 Fixed-Income
Fund Manager of the Year
Morningstar 2012 Fixed-Income
Fund Manager of the Year
As of 31 October 2015
Investment experience
Americas
EMEA
Asia-Pacific
Product management
Business management functions,
e.g. enterprise risk management
68 C 5

©
Alli
anz S
E 2
015
PIMCO
Benchmark
Other
Allianz and PIMCO form a mutually beneficial partnership
1) Shares in AuM; as of end of 3Q 2015
2) As of end of 3Q 2015
3) Mandates referring to investments from Allianz Lebensversicherung, Allianz Pensionskasse, Deutsche Lebensversicherung, Allianz Private Krankenversicherung, AGCS, Allianz Versorgungskasse, Allianz Versicherung
C. PIMCO update
Allianz: allocates majority of assets to PIMCO1 PIMCO: delivers superior investment return2
PIMCO
AllianzGI
23%
53%
24%
3 yr investment performance net of fees allocated to policyholders
Scope: German mandates, in total representing > EUR 200bn AuM3
+33 bps
5.91%
5.58%
Scope: Allianz Life U.S., in total representing > EUR 60bn AuM
PIMCO
Benchmark
+15 bps
2.18%
2.03%
EUR 631bn
69 C 6

©
Alli
anz S
E 2
015
Structured investment process
C. PIMCO update
PIMCO Secular Forum 2015
Investment Committee
Secular Forum: 3 to 5 year outlook
Cyclical Forum
6 to 12 month outlook
Portfolio manager
1) External advisors include:
Ben Bernanke, Senior Advisor; former Chairman of the Federal Reserve 2006 – 2014
Gene Sperling, Global Economic Advisor; former Director of the National Economic Council and assistant to two Presidents for economic policy
Michael Spence, consultant on macroeconomic and global policy issues; laureate of the 2001 Nobel Memorial Prize in economic sciences
Portfolios
70 C 7

©
Alli
anz S
E 2
015
Lipper Best Group over 3 years Large Equity 2010, 2011, 2012, 2013
Excellent investment performance
1) Preliminary figures as of 31 October 2015; percentage of 3rd party AuM beating its benchmark on a trailing 3 year / 5 year basis before fees
C. PIMCO update
77%
85%
3 year 5 year
Investment outperformance through October 20151 Lipper Best-In-Class Fund Awards 2013 & 2014
Lipper best fund over 3 and 5 year Award Income Fund, 2015
Morningstar F/I Manager of the Year Dan Ivascyn & Alfred Murata, 2013
Fund Manager of the Year Australian Morningstar Award
Fixed Interest Category 2015
Morningstar F/I Manager of the Year Mark Kiesel, 2012
Best Large F/I House Award Morningstar, 5 European countries
and Singapore & Hong Kong, 2015
71 C 8

©
Alli
anz S
E 2
015
Ongoing stabilization and substantial reduction in 3rd party net outflows …
C. PIMCO update
-68.3
-29.3
-16.0
+0.4
1Q 2015 2Q 2015 3Q 2015 October 2015
PIMCO 3rd party net flows (EUR bn) Recent trends
Significant reduction of outflows over the last quarters,
with 3Q 2015 posting the lowest quarterly outflows
since taper tantrum in May 2013
Outflows predominantly focused in the U.S.
within traditional fixed income products
Net inflows in October 2015 show further
signs of stabilization
7 offices saw positive YTD flows including
Asia-Pacific, Canada and Latin America businesses
Income fund reached USD 51bn in AuM in October
and posted 2nd highest YTD flows among its
active U.S. peers
72 C 9

©
Alli
anz S
E 2
015
… with growth in key geographies and product categories
1) As of 31 October 2015; preliminary figures based on 3rd party net flows
C. PIMCO update
4.2
2.0
0.3
Top YTD net inflows by strategy1
(USD bn)
Top YTD net inflows by region1
(USD bn)
Asia-Pacific LatAm Canada
15.8
9.6
5.3
2.0
Income IG credit Enhancedequity
High yield/bank loans
73 C 10

©
Alli
anz S
E 2
015
1 PIMCO – a strong platform
2 Strategic priorities C
74 C 11

©
Alli
anz S
E 2
015
PIMCO’s business is more diversified
1) As of 3Q 2015 based on 3rd party AuM; strategy classification might have changed over time
2) Based on 2015 year end estimates and total AuM; 2008 revenue split: asset allocation included in other fixed income
C. PIMCO update
3rd party AuM1 Revenue split2
Asset allocation
Alternatives
Credit
Equities
Income
Other fixed income
Traditional fixed income
2008 2015e
50%
23%
40%
39%
1%
10%
3%
2%
5%
19%
2% 5%
2008 3Q 2015
1%
45%
18%
40%
29%
3%
10%
2%
3%
6%
15%
4%
14%
11%
75 C 12
©
Alli
anz S
E 2
015
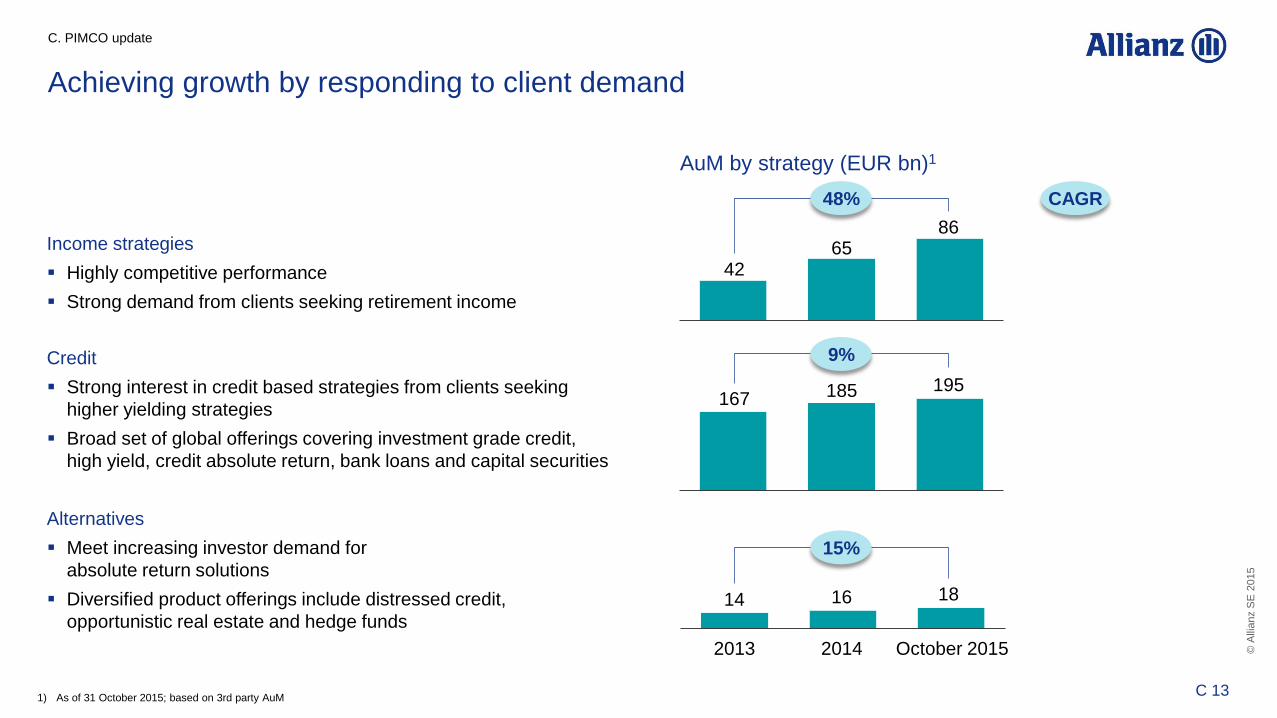
Achieving growth by responding to client demand
Income strategies
Highly competitive performance
Strong demand from clients seeking retirement income
C. PIMCO update
Credit
Strong interest in credit based strategies from clients seeking
higher yielding strategies
Broad set of global offerings covering investment grade credit,
high yield, credit absolute return, bank loans and capital securities
Alternatives
Meet increasing investor demand for
absolute return solutions
Diversified product offerings include distressed credit,
opportunistic real estate and hedge funds
2014 October 2015
14 18
167 195
42 65
1) As of 31 October 2015; based on 3rd party AuM
AuM by strategy (EUR bn)1
185
16
2013
86
48% CAGR
9%
15%
76 C 13

©
Alli
anz S
E 2
015
Attractive growth opportunities
C. PIMCO update
Theme PIMCO focus
Income, credit
Global distribution
Asset allocation / solutions
Enhanced equity
Retirement demographics and generally low yields support
secular demand for income-solutions
Emerging middle class in developing countries and increasing
importance of the individual investor in developed markets will lead to
wealth management opportunities
Embedded advice and outcome-oriented strategies continue as
themes for individual investors seeking simplification
Desire to outperform traditional betas continues to
fuel “smart beta” strategies
Alternatives Extended period of low yields and elevated valuations
drive continued interest in alternatives
77 C 14

©
Alli
anz S
E 2
015
Attractive growth opportunities – regional examples
Build upon strong momentum in Canadian market and launch dedicated products
Continued investment in and support for retail and institutional client relationship coverage
Position alternative strategies with institutional client base
Increase coverage of private wealth channels in Asia ex-Japan
Focus on transitioning Japanese investors from bank deposits to investment solutions
Execute on China growth opportunity
Position alternatives
Strengthen presence in Brazil and Miami to better service clients and increase business development
Focus on official institutions, pension funds and family offices to expand institutional business
Capture opportunities from ongoing de-regulation allowing institutions and individuals to invest abroad
Canada
Latin America
Asia-Pacific
AuM per region (EUR bn)1
2013 2014 October
2015
12 16 16
8 9 12
125 138
129
5.7%
22.0%
18.4% CAGR
CAGR
CAGR
1) As of 31 October 2015, includes 3rd party and Allianz assets
C. PIMCO update
78 C 15

©
Alli
anz S
E 2
015
PIMCO: strong position in Asia to capitalize on secular growth opportunity
1) As of 31 December 2010 and 31 October 2015
2) GWM = global wealth management
3) Source: BCG; numbers FX adjusted using year end figures (2014 year end FX applied to 2019 estimates)
Current AuM snapshot
(EUR bn) Projection for Asia-Pacific
(ex-Japan) private financial wealth3
(EUR trn)
Historical Asia (ex-Japan)
AuM growth1
(EUR bn)
21
13
7
21.8 26.4
38.9
61.7
2012 2013 2014 2019e
27
41
2010 2015
CAGR CAGR
GWM2
Other institutional
Official institutions
41
9% 10%
C. PIMCO update
79 C 16

©
Alli
anz S
E 2
015
Global distribution infrastructure
Brand
Culture and talent management
Tilting resources towards
- global markets
- broadening set of
investment solutions
- serving the individual investor
Executing on revised equity strategy
Actively managing CIR
Renewed focus and realignment of resources to enable growth
C. PIMCO update
Investing in enablers of growth … … and realigning resources to execute on opportunities
80 C 17

©
Alli
anz S
E 2
015
CIO
transition Today
The multi-year transition to a stronger firm and future
12 months 12 months 12 months
Succession and
leadership transition
External / internal
stability
Realignment / renewal
and growth
It is not the strongest or the most intelligent
who will survive, but those who can best
manage change.
Charles Darwin
C. PIMCO update
81 C 18

Technical
Excellence
in P/C
Munich, November 24, 2015
Axel Theis
Member of the Board of Management
Allianz SE

©
Alli
anz S
E 2
015
… replace shrinking investment results
by stronger u/w results
… expand other offerings (e.g. commercial
book) to compensate for the shrinking
motor book
… invest into the right technology and
capabilities to improve u/w and pricing
capabilities and customer experience
External changes require focus on P/C excellence
Environmental change and challenges for P/C business …
Financial environment
Underlying market shifts
Customer behavior & technology
… require Allianz to take actions to …
D. Technical Excellence in P/C
83 D 2

©
Alli
anz S
E 2
015
To keep our promise to shareholders, growth and underwriting result
need to compensate for falling investment income in P/C1
D. Technical Excellence in P/C
Operating profit (EUR bn) 5.4
Underwriting and other 2.3
Investment result 3.1
2014 2018
1) Illustrative only
84 D 3
©
Alli
anz S
E 2
015
Technical
foundation
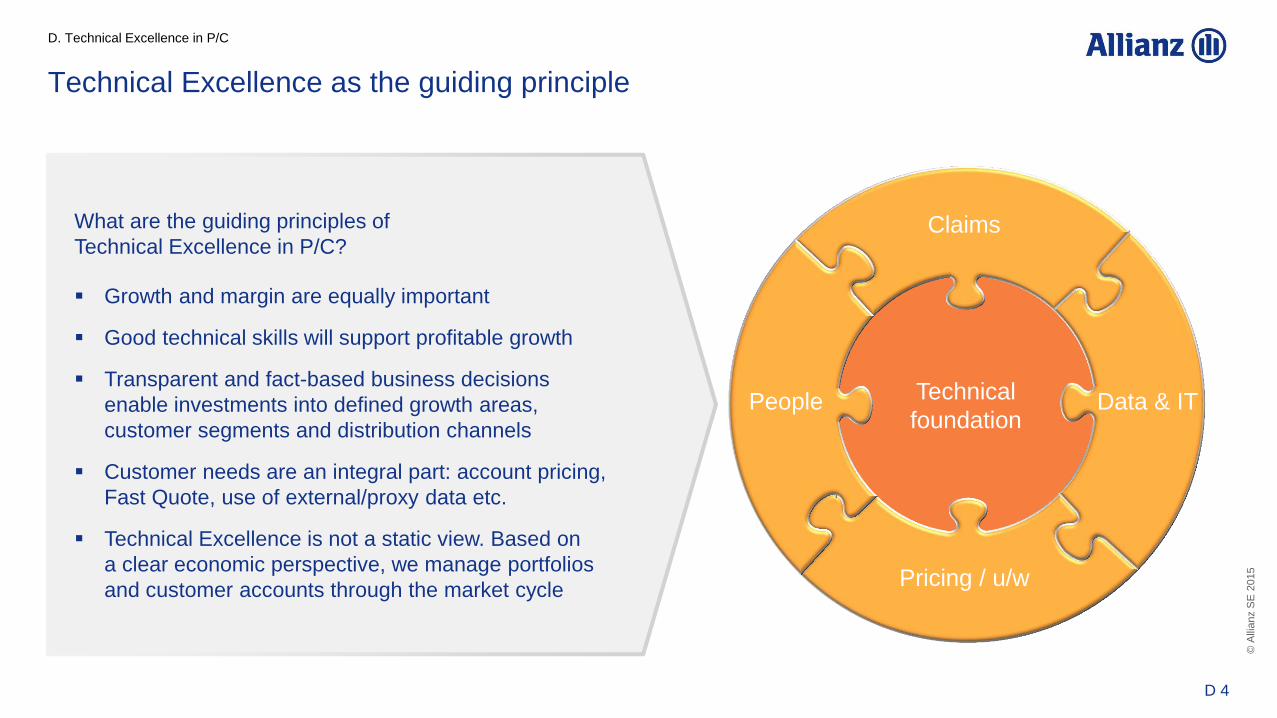
Technical Excellence as the guiding principle
D. Technical Excellence in P/C
What are the guiding principles of
Technical Excellence in P/C?
Growth and margin are equally important
Good technical skills will support profitable growth
Transparent and fact-based business decisions
enable investments into defined growth areas,
customer segments and distribution channels
Customer needs are an integral part: account pricing,
Fast Quote, use of external/proxy data etc.
Technical Excellence is not a static view. Based on
a clear economic perspective, we manage portfolios
and customer accounts through the market cycle
Claims
Pricing / u/w
Data & IT People
85 D 4
©
Alli
anz S
E 2
015
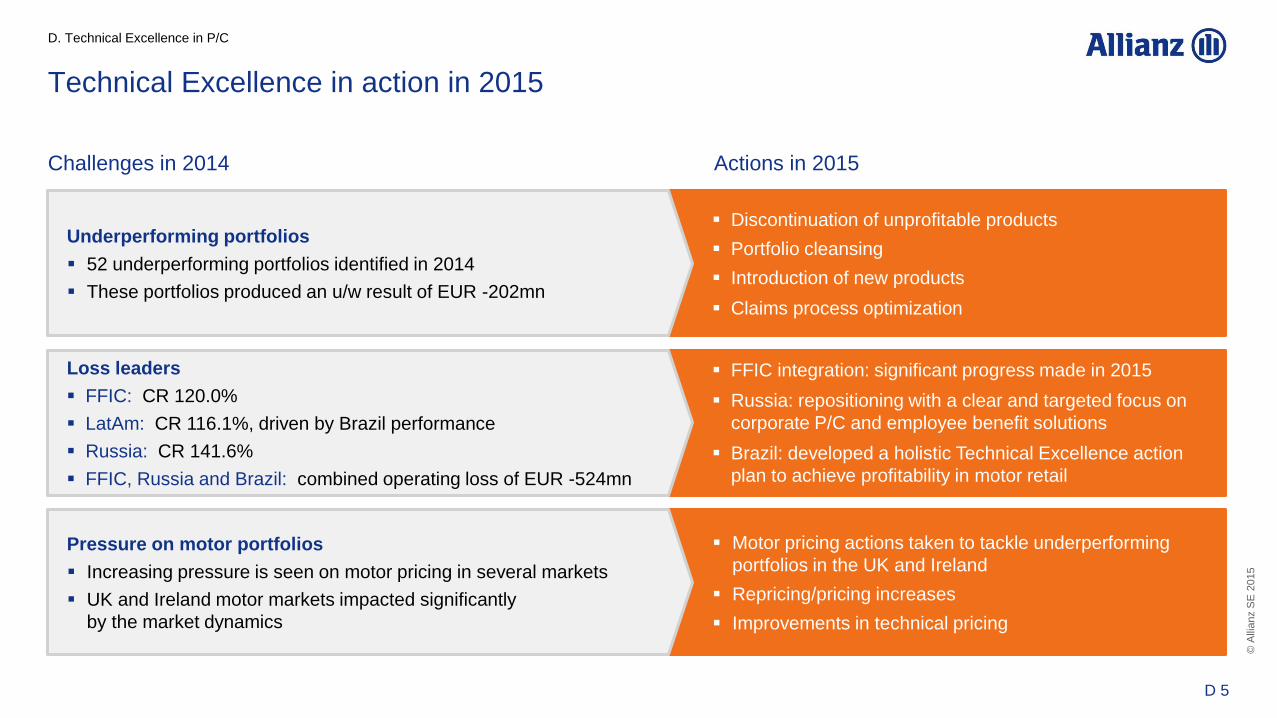
Technical Excellence in action in 2015
Challenges in 2014 Actions in 2015
D. Technical Excellence in P/C
Discontinuation of unprofitable products
Portfolio cleansing
Introduction of new products
Claims process optimization
Underperforming portfolios
52 underperforming portfolios identified in 2014
These portfolios produced an u/w result of EUR -202mn
FFIC integration: significant progress made in 2015
Russia: repositioning with a clear and targeted focus on
corporate P/C and employee benefit solutions
Brazil: developed a holistic Technical Excellence action
plan to achieve profitability in motor retail
Loss leaders
FFIC: CR 120.0%
LatAm: CR 116.1%, driven by Brazil performance
Russia: CR 141.6%
FFIC, Russia and Brazil: combined operating loss of EUR -524mn
Motor pricing actions taken to tackle underperforming
portfolios in the UK and Ireland
Repricing/pricing increases
Improvements in technical pricing
Pressure on motor portfolios
Increasing pressure is seen on motor pricing in several markets
UK and Ireland motor markets impacted significantly
by the market dynamics
86 D 5

©
Alli
anz S
E 2
015
Technical Excellence: “Must have” initiatives for 2016 (Wave 1)
D. Technical Excellence in P/C
Additional Wave 2 initiatives identified focusing on mid-corp, claims and advanced retail pricing
KPI examples OEs in scope
Smart Circle 2 Implemented in all in-scope OEs by
the end of 2016
Technical Price System 1 Certified Technical Price > 80% GPW by 2018
Gross u/w culture 4 No proportional cessions for volatility protection
(exceptions for e.g. special areas might apply)
Enhanced u/w portfolio management 3 Implemented for 5 mature OEs by
the end of 2016
Decoupled pricing engines 5 Decoupled pricing engines in place
for selected countries by 2017
Strategic people plans 6 Plans in place for key positions for
100% of OEs by 2018
87 D 6

© A
llia
nz S
E 2
015
D. Technical Excellence in P/C
Example: AGCS North America –
FFIC integration shows strong turn-around potential
2015FC 2018P
Loss ratio
Expense ratio
109.4%
99%
75.3%
68%
34.2% 31%
-10.4%-p
…
Integration well on track
YTD results show acceleration of
net synergies
79% FTE synergies achieved as of
August 2015
Full year impact of FTE synergies
first to be realized in 2016
IT costs reduced by both synergies
and savings
Real estate synergy to be reflected
starting from 2016
88 D 7

©
Alli
anz S
E 2
015
Key targets
Finalize consolidation of U.S. run-off portfolios
(AGCS US and former FFIC)
Implement efficiency measures (IT, relocations, …)
Start consolidation of non-U.S. portfolios
San Francisco Re mandated
to be carrier for U.S. based
run-off business of Allianz Group
as part of ARM
Operational set-up established
1st run-off portfolios transferred
Part of Allianz Re from a management point of view
FTEs: ~150
Total reserves USD 2.2bn1
>
Example: San Francisco Re is a key part of newly established Allianz
Resolution Management (ARM)
2014 2015 2016
>
>
>
>
>
>
>
>
Asbestos, pollution
and other health
hazards
Workers’
compensation
Construction defects
43%
10%
47%
1) 9M 2015
D. Technical Excellence in P/C
89 D 8
©
Alli
anz S
E 2
015
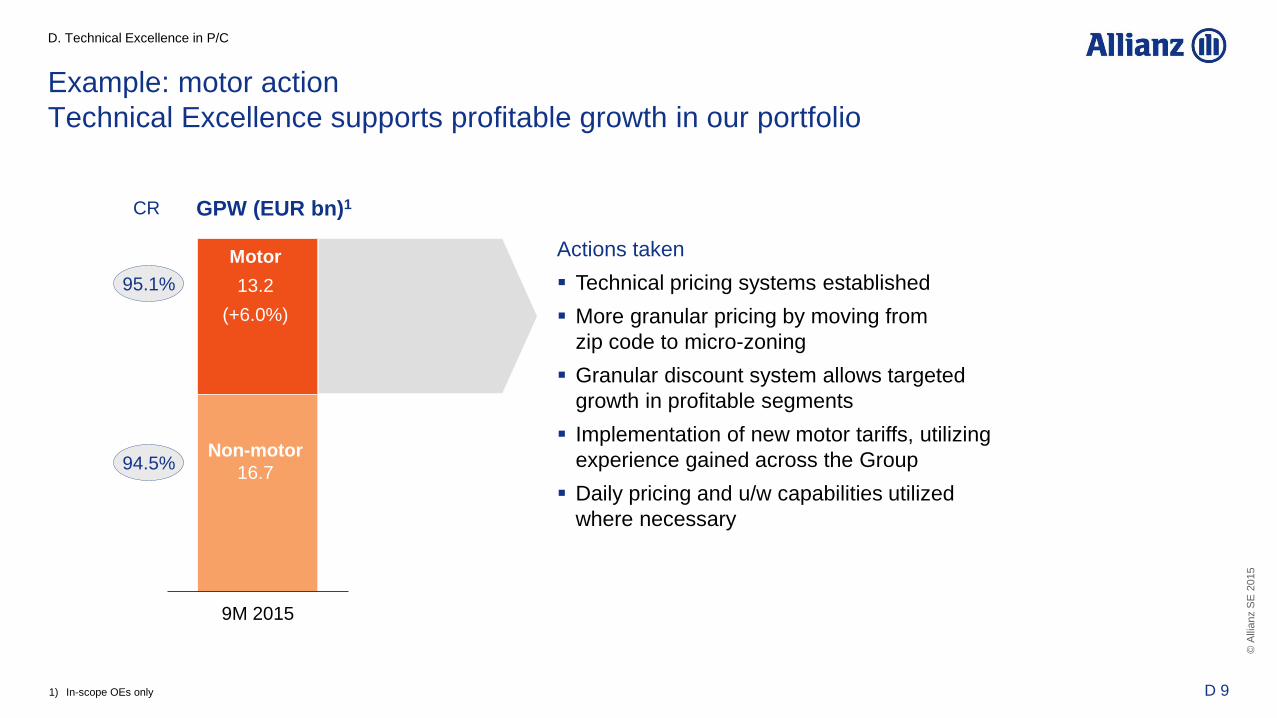
D. Technical Excellence in P/C
Example: motor action
Technical Excellence supports profitable growth in our portfolio
Actions taken
Technical pricing systems established
More granular pricing by moving from
zip code to micro-zoning
Granular discount system allows targeted
growth in profitable segments
Implementation of new motor tariffs, utilizing
experience gained across the Group
Daily pricing and u/w capabilities utilized
where necessary
9M 2015
95.1%
94.5% Non-motor
16.7
Motor
13.2
(+6.0%)
CR GPW (EUR bn)1
1) In-scope OEs only
90 D 9

©
Alli
anz S
E 2
015
Example: Allianz Spain - motor retail
… leads to price optimization
Price differentiation between
new business and renewal
Tailored market campaigns
by customer segment
Real-time pricing possible
Price optimization project
in 2015
… lowers the expense ratio
Low administration cost
Efficient and easier
claims handling
Simple product design …
One motor product offering
Customer can then select from 6
different product packages
Advanced underlying technique …
Superb risk selection
- Granular segmentation
for new business
- Elasticity analysis on price
sensitivity for renewals
Advanced IT system
- Pricing engine
decoupled completely
Allianz Spain with consistently better performance than market
Source Allianz Spain
D. Technical Excellence in P/C
11.8% 12.0% 12.2% 12.6% 12.9%
2010 2011 2012 2013 2014
Market share
CR
97% 97% 98% 99% 98%
93%
86%
92% 95%
91%
2010 2011 2012 2013 2014
Market Allianz Spain
91 D 10

©
Alli
anz S
E 2
015
0.5
0.9
1.4
2.4
92%
105%
97%
90%
100%
110%
120%
130%
140%
150%
160%
0
0.5
1
1.5
2
2.5
3
2005A 2011A 2014A 2018P
Example: Direct is one of the innovative growth engines in retail
D. Technical Excellence in P/C
1) Except UK
2) In selected key markets (DE, IT, ES, FR, UK, AU, NL)
13%
14%
15% More than 5mn policies
CR < 100%1
24% of new motor policies in 2014
are Direct underwritten2
Action to achieve ambition
Enhanced technical pricing to
support profitable growth
New and innovative products,
e.g. telematics
Geographic expansion
Leverage digitalization with analytical
skills to optimize customer experience
CAGR GPW
(EUR bn)
Combined
ratio
92 D 11

©
Alli
anz S
E 2
015
RoRC: almost 60% of our NPE are in the right corner1 …
RoRC NB P/C
NPE
1
Present value of risk capital
4 3
ultimate claims
2
- expenses
Combined ratio AY
Totals
> 98% 98% - 95% < 95%
Ro
RC
> 20%
0% (-7%-p)
6% (-6%-p)
56% (+13%-p)
63% (+-0%-p)
10% - 20%
11% (+10%-p)
0% (-11%-p)
4% (+-0%-p)
15% (-1%-p)
< 10% 23% (+2%-p)
0% (+-0%-p)
0% (+-0%-p)
23% (+3%-p)
=
risk free return - + x 1 - tax rate
5
Expenses, including commissions and fixed expenses, net of reinsurance (undiscounted)
Expenses 2
Earned premium is net of reinsurance and premium tax
NPE 1
Incurred claims (accident year), net of reinsurance (undiscounted)
Ultimate claims
3
Discounting effect on claims and expenses plus investment return on risk capital
Risk free return
4
Present value of all insurance related risk capital on an accident year basis
PV risk capital
5
… but significant improvement potential with more than 1/5 of NPE generating a RoRC <10% and a CR >98%
% NPE; 6M
change yoy
D. Technical Excellence in P/C
1) ‘Absolute’ % values in each matrix component represent the 6M NPE share of each profitability bucket, estimated based on the size of each business as per 12M (based on NPE of in-scope OEs). The %-p changes represent
the change in the share of each profitability bucket compared to 12M 2014
23% (+3%-p)
56% (+13%-p)
93 D 12

©
Alli
anz S
E 2
015
Our ambition
Negative market1 Positive market1
16%
D. Technical Excellence in P/C
<
Result2
Share of loss
MS3
>
Result2
Share of profit
MS3
>
Result2
Share of loss
MS3
<
Result2
Share of profit
MS3
10% 51%
23%
Our ambition 2018
We aim to achieve a CR ≤ 94%
Key levers
Improvements from portfolio
cleansing and loss leading
portfolios
Strict implementation of Wave 1
“must-have” initiatives in 2016
Start further development
and implementation of
Wave 2 initiatives
Our share of profits exceeds our market share of premiums
1) Market is making an underwriting profit/loss
2) OE is making an underwriting profit/loss
3) Market share
Note: Data available for 32 OEs in 2013 and 17 OEs in 2014
Source: GPC Market Database, Global P/C
94 D 13

Life business
in low yield
environment
Munich, November 24, 2015
Maximilian Zimmerer
Member of the Board of Management
Allianz SE

©
Alli
anz S
E 2
015
1 Solid starting position
2 Ambitious targets and levers
a) New business management
b) In-force management
3 Summary
E
96 E 2

©
Alli
anz S
E 2
015
Win-win situation
Policyholders
Participation in
rising yields and
equity markets
Higher expected
returns
Shareholders
Lower capital
costs
Improved RoE
Demographic trends
Life remains a growth market
Social security systems Interest yields
Life opportunities
are plenty,
demand new
“smart growth”
paradigm
New product generation
Reduction of guarantees
(level and duration)
Low costs
Additional biometric risk covers
Ageing population Declining state pensions Lower yields worldwide
E. Life business in low yield environment
97 E 3

©
Alli
anz S
E 2
015
Allianz L/H: performance continuously improved (EUR bn)
Revenues
48 46
53
67
2005 2008 2011 2014
Operating profit MCEV
2.1
1.3
2.4
3.3
2005 2008 2011 2014
15
13
21
27
2005 2008 2011 2014
CAGR 5% CAGR 7% CAGR 4%
E. Life business in low yield environment
1) European Embedded Value
1
98 E 4

©
Alli
anz S
E 2
015
Strong buffers and resilient margins
Business in-force Allianz Group L/H
1) IFRS current interest and similar income (net of interest expenses) relative to average asset base (IFRS) which excludes unit-linked, FVO and trading
2) IFRS current interest and similar income (net of interest expenses) relative to average aggregate policy reserves
3) IFRS current interest and similar income (net of interest expenses) + net harvesting and other (operating) relative to average aggregate policy reserves
4) Weighted by aggregate policy reserves
New business
2.4%
Current yield (assets)
3.9%1
Current yield (reserves)
4.6%2 230bp
Total yield
2014
Ø min.
guarantee4
2014
150bp
Ø guarantee
new business4
2015e
Reinvestment
yield
F/I 9M 2015
0.8%
~2.5% 170bp
E. Life business in low yield environment
Additional information on
Allianz Leben Germany
0.8% break-even
reinvestment yield
2Q 2015
~300% SII ratio without
transitional rules
3Q 2015
4.7%3
99 E 5

©
Alli
anz S
E 2
015
Reduced duration mismatch leads to improved risk profile …
Asset duration L/H
5.6
7.6
8.3 8.9
2008 2013 2014 3Q 2015 2014 3Q 2015
SII ratio sensitivity to
interest rates -50bps
-12%-p
-2.6 -0.3 -0.6 -0.5
-21%-p
2013 2014 3Q 2015
Required capital L/H bef. tax
(EUR bn)
24.3
21.6
14.3
Duration
mismatch
E. Life business in low yield environment
100 E 6

©
Alli
anz S
E 2
015
… but RoE and NBM under pressure
24.3%
7.5%
4.4%
9.9%
7.2% 7.5%
15.4%
-2.2% -0.5%
NBM
L/H RoE
2007 2014
13.4%1
10.1%
3.0%
1.9%2
In-f
orc
e b
usin
ess
New
busin
ess
Reasons for lower RoE
Net income rather stable
Shareholders’ equity
significantly up
RoE %, 2014
1) Approximation
2) Based on year-end assumptions
E. Life business in low yield environment
37%
32% 31%
≤1.5% 1.5 - 2.5% >2.5% NBM
PVNBP by NBM, 9M 2015
101 E 7

©
Alli
anz S
E 2
015
1 Solid starting position
2 Ambitious targets and levers
a) New business management
b) In-force management
3 Summary
E
102 E 8

©
Alli
anz S
E 2
015
Ambition 2018: significant improvement of RoE and NBM
RoE ≥10%
for each OE
Significant reduction
of interest
sensitivity
Ambition 2018
NBM ≥3% or
RoRC ≥15%
with min. NBM
≥0.75%
per product
10%
E. Life business in low yield environment
24.3%
7.5%
4.4%
9.9%
7.2% 7.5%
15.4%
-2.2% -0.5%
NBM
L/H RoE
2007 2014
13.4%1
10.1%
3.0%
1.9%2
In-f
orc
e b
usin
ess
New
busin
ess
Reasons for lower RoE
Net income rather stable
Shareholders’ equity
significantly up
RoE %, 2014
1) Approximation
2) Based on year-end assumptions
37%
32% 31%
≤1.5% 1.5 - 2.5% >2.5%
PVNBP by NBM, 9M 2015
NBM
103 E 9

©
Alli
anz S
E 2
015
New LoB-reporting enables efficient new business management
New business (PVNBP)
Product shift
under way …
… but more will
be done!
E. Life business in low yield environment
45% 41% 36%
25% 22% 27%
16% 22% 23%
14% 15% 14%
2014 9M 2015 3Q 2015
Approximation1
Protection & health
Traditional guaranteed
savings & annuities
Unit-linked w/o guarantee
Capital-light products
1) New reporting for lines of business starts 1Q 2016
USA:
High FIA sales, i.e. BUDBI
NBM
3.0%
104 E 10
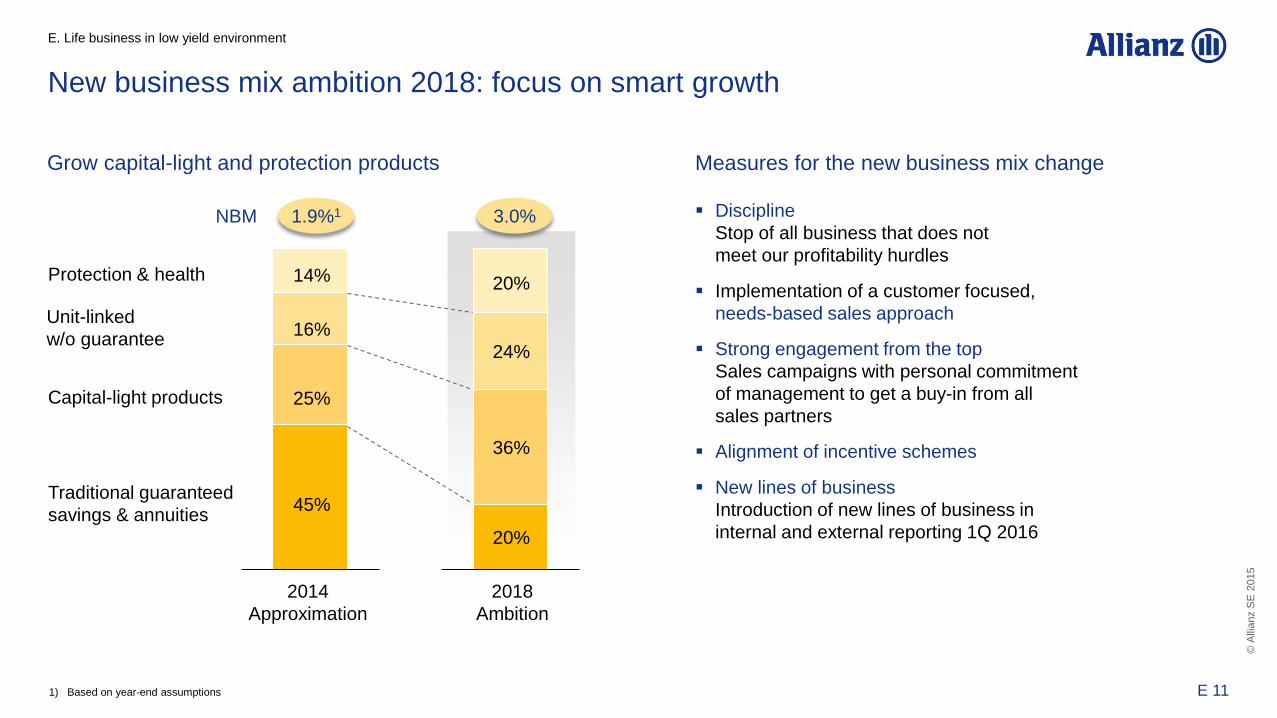
©
Alli
anz S
E 2
015
Grow capital-light and protection products
14%
16%
2014
Approximation
45%
25%
2018
Ambition
20%
36%
20%
24%
Capital-light products
Protection & health
Traditional guaranteed
savings & annuities
Measures for the new business mix change
Discipline
Stop of all business that does not
meet our profitability hurdles
Implementation of a customer focused,
needs-based sales approach
Strong engagement from the top
Sales campaigns with personal commitment
of management to get a buy-in from all
sales partners
Alignment of incentive schemes
New lines of business
Introduction of new lines of business in
internal and external reporting 1Q 2016
NBM 1.9%1 3.0%
New business mix ambition 2018: focus on smart growth
E. Life business in low yield environment
Unit-linked
w/o guarantee
1) Based on year-end assumptions
105 E 11

©
Alli
anz S
E 2
015
Two levers to lift RoE: new business and in-force management
Net income
IFRS equity
Hedgeable guarantees
Shift from traditional to
capital-light and UL products
Management of back-books
ALM
Expand protection business Crediting
Asset mix, expense management
E. Life business in low yield environment
New business In-force management
106 E 12

©
Alli
anz S
E 2
015
1 Solid starting position
2 Ambitious targets and levers
a) New business management
b) In-force management
3 Summary
E
107 E 13
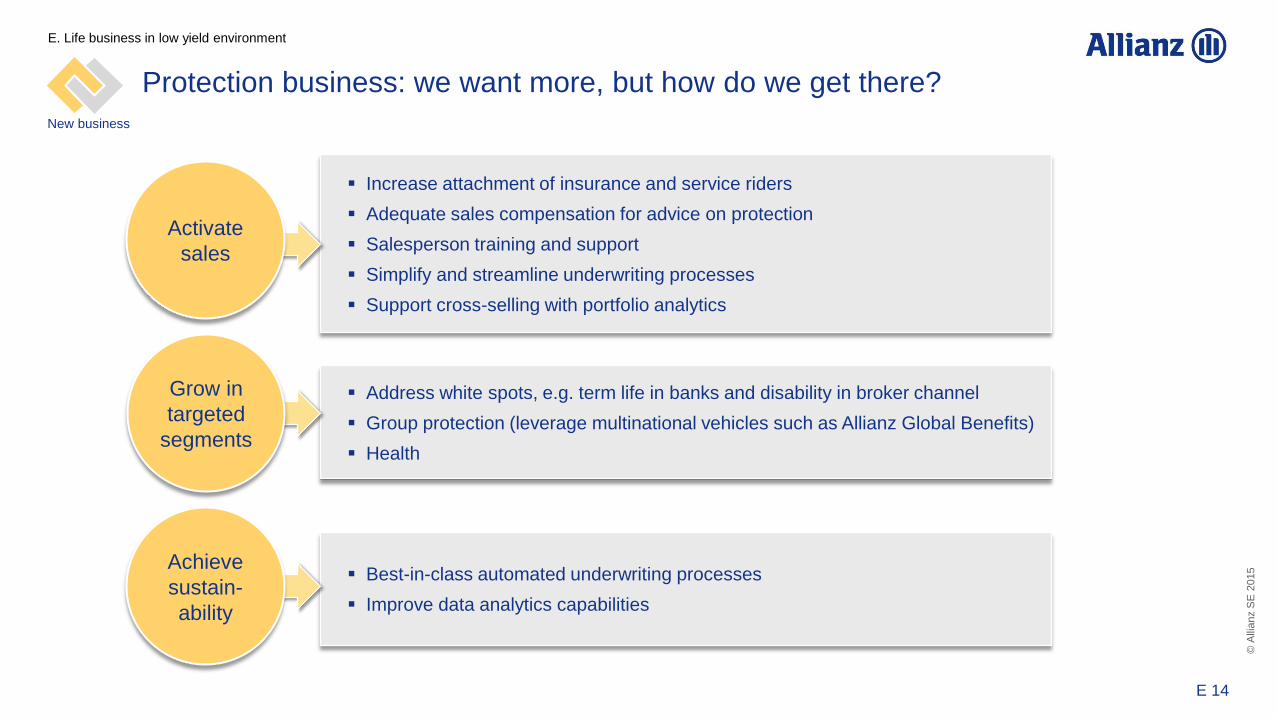
©
Alli
anz S
E 2
015
Protection business: we want more, but how do we get there?
Address white spots, e.g. term life in banks and disability in broker channel
Group protection (leverage multinational vehicles such as Allianz Global Benefits)
Health
Grow in
targeted
segments
Increase attachment of insurance and service riders
Adequate sales compensation for advice on protection
Salesperson training and support
Simplify and streamline underwriting processes
Support cross-selling with portfolio analytics
Activate
sales
Best-in-class automated underwriting processes
Improve data analytics capabilities
Achieve
sustain-
ability
E. Life business in low yield environment
New business
108 E 14

©
Alli
anz S
E 2
015
Examples Switzerland and France: combination with risk coverage
New business profitability
Increase number of products with biometric risk coverage
Mandatory rider
Accidental death benefit
Optional riders
Return of premium
Long-term care
Accidental disability benefit
Additional accidental death benefit
Kick-off in November 2015
Example Allianz Switzerland (Individual Life)
Profitability driven by riders
Total Riders Base Total Riders Base
PVNBP NBV
~4%NBM
Example Allianz France
Launch of new product range with
mandatory and optional riders
E. Life business in low yield environment
New business
109 E 15

©
Alli
anz S
E 2
015
Hedgeable guarantees only
Guarantees have to be adjusted to low interest rates i.e. Perspektive (Allianz Leben)
Guarantee below reinvestment yield for product term
(including expenses)
Guaranteed premium
refund at maturity
Reset points for guarantee level reduce risk and allow
customer to benefit from improved market conditions
Annuitization based on
latest conditions
Lower guarantees allow more upside potential
(e.g., hybrids) Higher crediting rate
Flexibility for repricing to adjust to market
conditions Terminal bonus
E. Life business in low yield environment
New business
110 E 16

©
Alli
anz S
E 2
015
Hedgeable guarantees only: example Allianz Life (USA)
New business at point of sale Active management of in-force portfolio
New business pricing as frequent as
necessary, e.g. bi-weekly
Use management levers to align profitability
with target IRR
Example FIA, 2014 Example FIA (business written in 2006)
Jan Feb Mar Apr May Jun Jul Aug Sep Oct Nov Dec
Product
feature
changes $
Cap rate
changes $ $ $ $ $ $ $
IRR 12% 12% 12% 12%
IRR without
manage-
ment action
9.4% 4.0% 3.2% -0.4%
10%
11%
12%
13%
14%
15%
16%
17%
18%
19%
20%
Year 1
1st
renewal
Year 2
2nd
renewal
Year 3
3rd
renewal
Year4
4th
renewal
Year 5
5th
renewal
Year 6
6th
renewal
Renewal
crediting
rate # $ $ # $
IRR
Target
IRR
E. Life business in low yield environment
New business
111 E 17

©
Alli
anz S
E 2
015
Safety-oriented
(guarantee) Return-oriented
(upside potential)
Risk capital requirement High Low
Traditional Capital-light Hybrid/UL+ guarantees UL w/o guarantees
Product example
Traditional savings & annuities
Insurance rationale
Standard offering
Product example
Perspektive
Insurance rationale
Lower guarantees allow for additional upside potential for customers
Product example
KomfortDynamik
Fixed index annuities
Insurance rationale
Exposure to unit-linked or equity index
Product example
Pure unit-linked
Life cycle unit-linked offerings
Insurance rationale
Exposure to potential market upside
Shift to capital-light products in interest of customers and shareholders
Customer view
S/H view
1 2 3 4
Tailor-made products with improved risk return profile for customers
E. Life business in low yield environment
New business
112 E 18

©
Alli
anz S
E 2
015
Reduced capital consumption allows higher return for customers
Example Allianz Leben (1): balance of interests
Risk covers
Death cover
Disability
Functional-impairment
Long-term care 01/2001 01/2009 07/2007
3 Saving period Pay-out period Total premium refund
guarantee at maturity
Saving period
Annuity calculation based on new business
conditions at time of annuitization
Pay-out period
E. Life business in low yield environment
07/2015 07/2013
New business
113 E 19

©
Alli
anz S
E 2
015
Example Allianz Leben (2): improved risk profile
Allianz Leben
Illustrative example1 of interest rate sensitivity
New products reduce capital consumption in the long run
O&G (% PV premiums)
Resilient new business margin
Allianz Leben
NBM with risk free rate -100bps
NBM
3Q 2015
2.9%
1.9%
Klassik Perspektive
IR shock Base Δ IR
shock
IR shock Base Δ IR
shock
KomfortDynamik
-0.9%
E. Life business in low yield environment
50% reduction
IR sensitivity
30-40% reduction
1) Illustrative example, interest-rate sensitivities of products might differ in some market environments
NBM
after shock
Δ IR
shock
New business
114 E 20

©
Alli
anz S
E 2
015
Retail – new business1 Corporate – new business1
Others
Example Allianz Leben (3): increase share of protection and
reduce weight of capital-intensive products
23% 32%
37%
7%
31%
10%
2012 2013 2014 9M 2015
Traditional savings & annuities;
market standard
Savings & annuities with reduced guarantees
Capital-light and UL with guarantees
50% 57%
70%
18%
53%
9%
2012 2013 2014 9M 2015
Protection
81%
+31%-p
47%
+24%-p
E. Life business in low yield environment
New business
1) Based on weighted premium sum (BWS); split in lines of business for 9M 2015 approximated
115 E 21

©
Alli
anz S
E 2
015
0%
5%
10%
15%
20%
25%
30%
2008 2009 2010 2011 2012 2013 2014 2Q 2015
Market shares of Allianz Leben in risk cover business based on
new business premiums
Example Allianz Leben (4): higher market share in protection
29.2%
12.6%
19.0%
4.7%
2Q 2015
49%
51%
Stand-alone risk cover
Risk riders
E. Life business in low yield environment
New business
New business premiums of Allianz Leben
116 E 22

©
Alli
anz S
E 2
015
Based on PVNBP
forecast 2015 vs.
12M 2014
NBM
<1.5% 1.5% - 2.5% >2.5%
RoRC
>20% 0% 0% 24%-p (-2%-p)
10%-20% 26% (+23%-p)
5% (+2%-p)
<10% 0% (-4%-p)
0%
New business management shows progress already
Value of options and guarantees embedded in new business, valued under matching adjustment
O&GMA
Present value of future profits for new business, after tax, valued under matching adjustment
PVFPMA
Investment return on risk capital, after tax
Risk-free
return
Present value of risk capital for new business, including market and non-market risks
PV of RC
RoRCNB L/H = PVFPMA
1
Present value of risk capital
4
3
+ Risk-free return
2
- O&GMA
2
1
3
4
with
22% (-20%-p)
49% (+46%-p)
0% (-22%-p)
E. Life business in low yield environment
New business
117 E 23

©
Alli
anz S
E 2
015
1 Solid starting position
2 Ambitious targets and levers
a) New business management
b) In-force management
3 Summary
E
118 E 24

©
Alli
anz S
E 2
015
In-force management: several levers to be pulled
Enabled by strong governance Nomination of local
in-force manager
Internal or external risk transfers
Restructuring, reinsurance or sale
Global taskforce
has been set up
for execution support
Back-books:
unfreeze locked-in capital
Recurring vs terminal bonus
Crediting levels
Crediting:
flexibility and optimization
ALM and duration management
Customer management
Expense reductions
Other
E. Life business in low yield environment
In-force
119 E 25

©
Alli
anz S
E 2
015
Surplus allocation
Company may have discretion in allocating
current surplus to policyholders
as immediate bonus or
as terminal bonus
Reduce risk/increase RoRC
Terminal bonus as an available financial resource (SII)
- in emergency buffer for s/h
- going-concern p/h profit
Terminal bonus replaces expensive s/h capital and
safeguards p/h attractiveness
Customer value proposition
Customer return upon maturity reduced only in extreme scenarios
Reduction in risk budget helps to finance higher yielding
investments in alternative assets
Crediting: terminal bonus key to achieve sustainable returns
Utilization of bonus flexibility key to achieve sustainable returns
Reduce policyholder arbitrage
Use terminal bonus to reduce arbitrage risk
(e.g. single premium)
Limit payment on surrender; link to capital market changes Surplus
to be
allocated
Annual
bonus
Terminal
bonus
Shareholder
E. Life business in low yield environment
In-force
120 E 26

©
Alli
anz S
E 2
015
Example Allianz Leben: successful in-force management
Extension of asset duration Dynamic ALM1
Crediting
Minimum guarantees matched for the next 30yrs Duration significantly increased and above market
Increasing absolute and relative weight of terminal bonus Single premium contracts with special crediting for the first 4 years
4.0%
2.1%
7.1
10.1
2010 3Q 2015
2015 10/2015 (yrs 1-4)
Terminal bonus
Technical interest
and lock-in bonus
Regular premium Single premium Crediting
0.4%
2003 2015
Terminal bonus
Technical interest
and lock-in bonus
5.7%
0.6%
4.0% 0.8%
Traditional
5.3%
3.4%
Traditional
3.4%
0.6%
1.05%
1.05%
E. Life business in low yield environment
1%
2%
3%
4%
5%
1 2 3 4 5 6 7 8 9 10 11 12 13 14 15 16 17 18 19 20 21 22 23 24 25 26 27 28 29 30
Exp. technical income Exp. investment income Ø minimum guarantee
1) Run-off simulation per 3Q 2015
In-force
yrs
121 E 27

©
Alli
anz S
E 2
015
Allianz with superior investment management vs. peers
9.7%
4.7%
11.8%
5.2%
2014 2007-2014
Top IFRS investment performance1
amongst core peers 2014 and
2007-14 p.a.
Allianz
Core peers average (Generali, AXA, Zurich)
Allianz with high credit
quality and low expected
loss compared to peers
Current yield of Allianz
above all core peers
Professional in-house asset
management with continuous
outperformance
Strict focus on diversification:
best diversified sovereign
portfolio vs. core peers
5.4
(68%)
6.2
(65%)
Allianz Group operating profit
and thereof investment result2
(EUR bn)
5.4 6.1 5.4 6.0
7.8
2011 2014 2013 2012
10.4
9.3 10.1
(69%) (66%) (54%) (58%)
3
E. Life business in low yield environment
1) IFRS investment performance: including current income, realized gains and losses (net), impairments (net), trading/FX result, fair value option, investment expenses, and change in unrealized gains and losses
2) Insurance business only (P/C + L/H)
3) L/H investment margin in 2011 is restated for the new reporting format of operating profit sources introduced in 2012
In-force
122 E 28

©
Alli
anz S
E 2
015
Allianz has invested 14% in alternative assets
Group investment portfolio: EUR 630.8bn Alternative investment portfolio 3Q 2015: EUR 86bn Mid-term target: EUR 110bn
1) Book value except real estate (incl. own use properties) which is based on market value
Alternative equity1
6%
Alternative debt
8%
EUR 37bn
EUR 49bn
Alternative equity Return expectations
Real estate 74% 4-6%
Infrastructure equity 7% 5-8%
Renewable energy 6% 5-6%
Private equity 13% 10-12%
Alternative debt Return expectations
Residential mortgages 41% 1.5-2%
Commercial mortgages 29% 1.5-2%
Infrastructure debt 7% 3%
Private placements 22% 2-4%
Planned: private finance investments
Project finance
Mid-cap corporates
Re-capitalizations
E. Life business in low yield environment
In-force
123 E 29

©
Alli
anz S
E 2
015
1 Solid starting position
2 Ambitious targets and levers
a) New business management
b) In-force management
3 Summary
E
124 E 30

©
Alli
anz S
E 2
015
Accelerating momentum: from aspiration to execution throughout the Group
Mid of February 2015 Mid of September 2015
Modify/reprice products, e.g.,
1. Adjust guarantees & crediting rates
2. Optimize surrender values
3. Work on unprofitable features
4. Adjust profit participation
5. Pricing/underwriting review
6. Optimize fees
7. Reduce longevity exposure and liability duration
1
Introduce new products, e.g.,
1. New hybrids
2. New protection
3. New unit-linked
2
Shift business mix, e.g., 1. Adequate sales compensation
2. Discontinue unprofitable products
3. Review single premiums
4. Reduce share in co-insurance
5. Review partnership agreements
3
Expenses & other, e.g., 1. Improve ALM
2. Reduce expenses
3. Renegotiate AM rebates
4. Digitalization
4
Modify/reprice products, e.g.,
1. Adjust guarantees & crediting rates
2. Optimize surrender values
3. Work on unprofitable features
1
Introduce new products, e.g.,
1. New hybrids
2. New protection
2
Shift business mix, e.g., 1. Adequate sales compensation
2. Discontinue unprofitable products
3
Expenses & other, e.g., 1. Improve ALM
4
Additional # of OEs: 5 Additional # of OEs: 11
E. Life business in low yield environment
125 E 31

©
Alli
anz S
E 2
015
Summary
E. Life business in low yield environment
Life remains growth market
Ambition 2018 with focus on
New business
In-force management
Win-win situation
Customers: needs-based products with
higher expected performance
Shareholders: higher RoE
Allianz in solid position to face challenges
In-force business
RoE ≥10% for each OE
Significant reduction
of interest sensitivity
New business
NBM ≥3% or RoRC ≥15%
with min. NBM ≥0.75%
per product
Ambition 2018
126 E 32

©
Alli
anz S
E 2
015
Appendix
127 E 33

©
Alli
anz S
E 2
015
L/H: overview of reserves and operating profit 31.12.2014 (EUR bn)
Germany Life 164bn 42% 5.2bn 5% 1.1bn 32%
USA 67bn 17% 25.4bn 27% 0.7bn 20%
France 55bn 14% 17.4bn 18% 0.5bn 14%
Italy 30bn 8% 26.2bn 28% 0.2bn 5%
Germany Health 19bn 5% 0.0bn 0% 0.2bn 6%
Belgium 9bn 2% 0.4bn 0% 0.1bn 2%
Taiwan 1bn 0% 4.5bn 5% 0.0bn 0%
Switzerland 10bn 3% 0.7bn 1% 0.1bn 3%
Korea 10bn 3% 1.2bn 1% -0.1bn n.m.
Spain 6bn 2% 0.2bn 0% 0.2bn 6%
Other 16bn 4% 13.8bn 15% 0.3bn n.m.
Total 387bn 100% 95bn 100% 3.3bn 100%
Aggregate policy reserves Unit-linked reserves
E. Life business in low yield environment
Operating profit
128 E 34

Value creation
Munich, November 24, 2015
Dieter Wemmer
CFO Allianz SE

©
Alli
anz S
E 2
015
Pay-out
Unchanged attractive dividend policy1
Investments
50%
20%
10%
20%
Allocation of
s/h net income
Internal growth
Supports growth, if not needed for ratchet
External growth
Supports ratchet, if necessary
Pay-out of unused external growth
budget every three years
Regular dividend … with ratchet: absolute
dividend per share at least
at previous
year’s level
F. Value creation
1) This dividend policy may be revised in the future. Also, the decision regarding dividend payments in any given year is subject to specific dividend proposals by the management and supervisory boards, each of which may elect
to deviate from this dividend policy if appropriate under the then prevailing circumstances, as well as to the approval of the annual general meeting. The entire dividend policy is subject to a sustainable SII ratio > 160%
2) As of 18.11.2015
130 F 2

©
Alli
anz S
E 2
015
AA AA AA AA AA AA
2010 2011 2012 2013 2014 9M 2015
Strong and stable capital position
Solvency II ratio
202% 191%
199% 194% 191% 200%
2010 2011 2012 2013 2014 9M 2015
S&P financial strength rating
F. Value creation
131 F 3
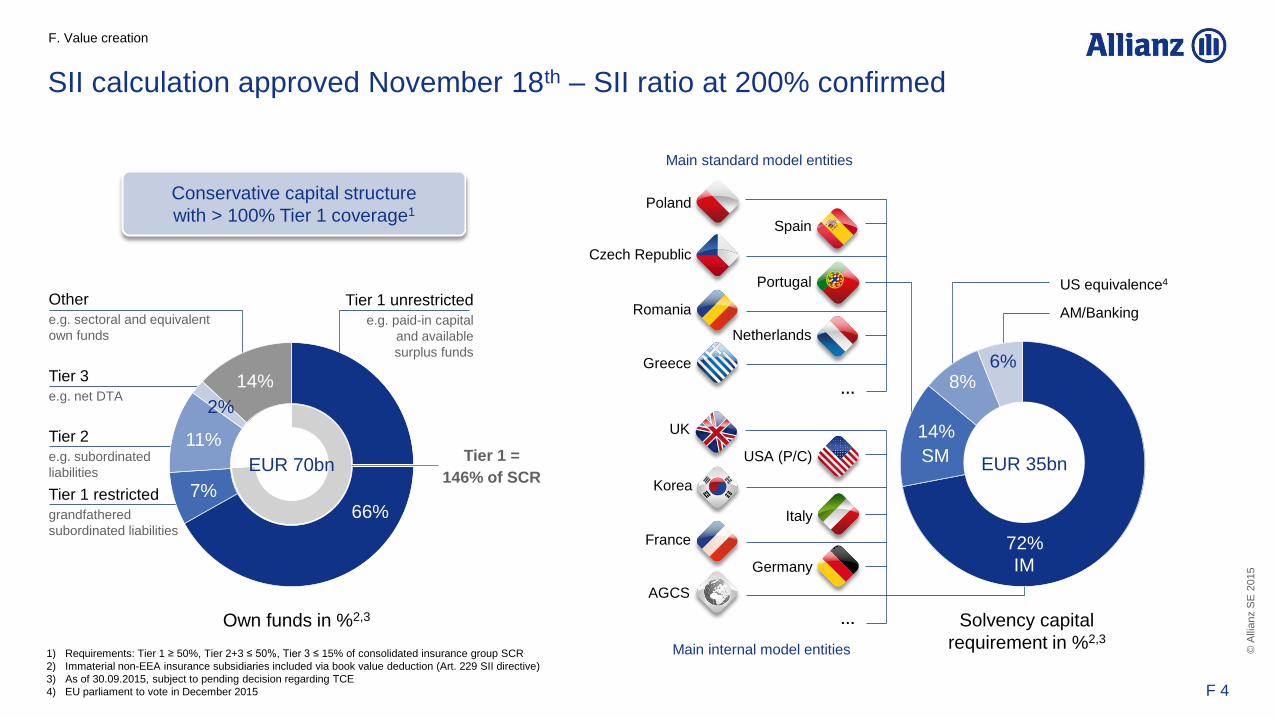
©
Alli
anz S
E 2
015
UK
…
USA (P/C)
Korea
Italy
France
Germany
AGCS
SII calculation approved November 18th – SII ratio at 200% confirmed
F. Value creation
Main standard model entities
Solvency capital
requirement in %2,3 1) Requirements: Tier 1 ≥ 50%, Tier 2+3 ≤ 50%, Tier 3 ≤ 15% of consolidated insurance group SCR
2) Immaterial non-EEA insurance subsidiaries included via book value deduction (Art. 229 SII directive)
3) As of 30.09.2015, subject to pending decision regarding TCE
4) EU parliament to vote in December 2015
Tier 1 unrestricted
e.g. paid-in capital
and available
surplus funds
Other
e.g. sectoral and equivalent
own funds
Tier 2
e.g. subordinated
liabilities
Tier 3
e.g. net DTA
Tier 1 restricted
grandfathered
subordinated liabilities
66% 7%
11%
2%
14%
Own funds in %2,3
EUR 70bn Tier 1 =
146% of SCR
US equivalence4
AM/Banking
Main internal model entities
Portugal
Spain
Poland
Netherlands
Czech Republic
Romania
Greece
…
72%
14%
8% 6%
SM
IM
EUR 35bn
Conservative capital structure
with > 100% Tier 1 coverage1
132 F 4

©
Alli
anz S
E 2
015
Segment Relative impact of 50bps IR drop
on SII ratio by segment1 Impact on distributable earnings
AM ~0% de minimis
P/C ~0% small
Life
Asia 8% small (not material / different regime)
US 17% small (different basis)
Germany 42% none (buffered by non-s/h own funds)
Europe w/o
Germany 25% high (but local buffer stabilizes)
Group (SII ratio -12%-p) 100% small
SII interest rate sensitivity with small impact on distributable earnings
F. Value creation
1) Based on 200% SII capitalization as of 30.09.2015, corporate segment not shown
133 F 5

©
Alli
anz S
E 2
015
-21
-12 -9
-12
Renewal Agenda to further reduce SII interest rate volatility
F. Value creation
IR
-50bps
Equities
-30%
-12 -7 -8 -8
Corporate
bond spreads
+100bps -13
-8 -6 -9
4Q14 1Q15 2Q15 3Q15
Stress impact on SII capitalization reduced (%-p)
4Q14 1Q15 2Q15 3Q15
Government
bond spreads
+100bps
-17 -11
-8 -13
-9%-p
-4%-p
-4%-p
-4%-p
25-50%
reduction
targeted by
2018
134 F 6

©
Alli
anz S
E 2
015
SII ratio within today’s target range
Operating entity
Group SII ratio
100% SCR
Upstream capital
Increase capital
100% SCR
145% Minimum target
after stress
160%
Dividend policy
threshold
200% 3Q 2015 actual Target range before stress
180% – 220%
Re-risk
De-risk
Group
F. Value creation
Target range after stress
100 – 130%
Group
cash
buffer local buffer
Solo SII ratio
135 F 7

©
Alli
anz S
E 2
015
Stringent framework to optimize value creation
Steering framework
P/C
Overall CR ≤ 94%
New business RoRC ≥ 15%
Ambition 2018
External
growth EPS accretive
Group EPS CAGR 5%
RoE 13%
F. Value creation
L/H
Overall IFRS RoE ≥ 10% for each OE
New business NBM ≥ 3.0% or
RoRC ≥ 15%
AM Overall
No capital constraints
New business
SII
Rating
IFRS RoE
RoRC
NBM
136 F 8
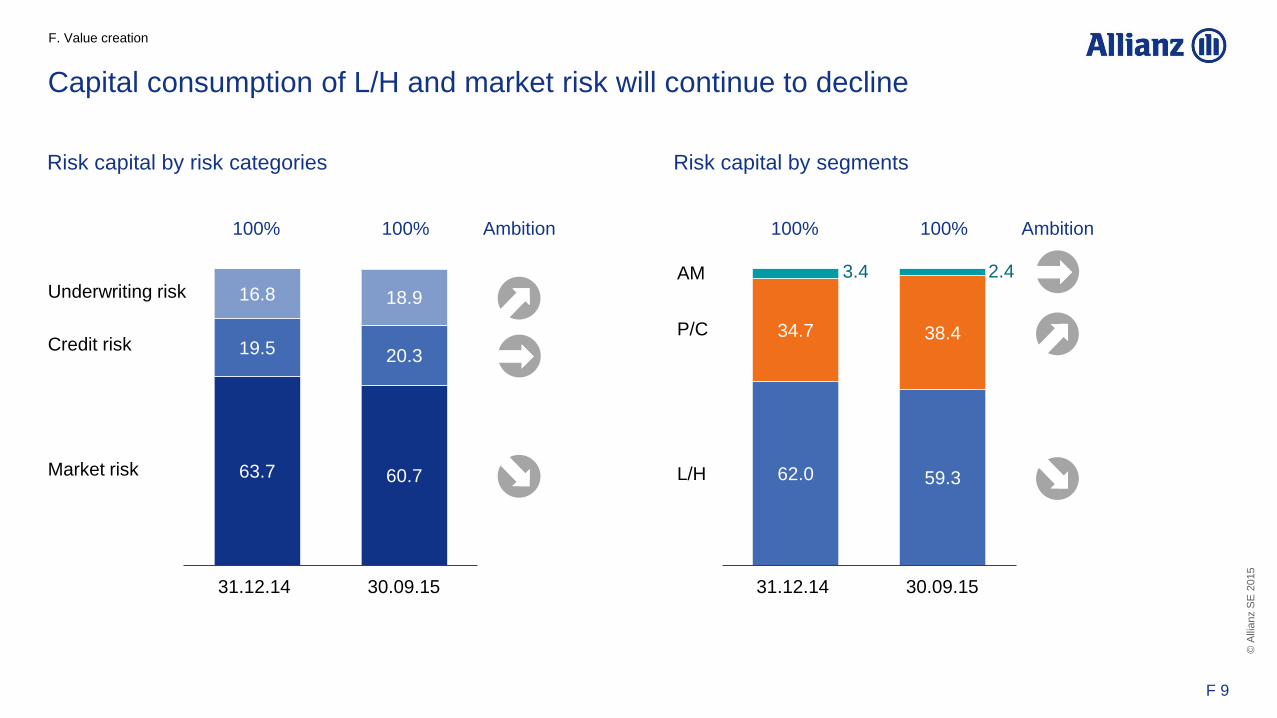
©
Alli
anz S
E 2
015
63.7 60.7
19.5 20.3
16.8 18.9
Capital consumption of L/H and market risk will continue to decline
Risk capital by risk categories Risk capital by segments
Underwriting risk
Credit risk
Market risk
100%
31.12.14 30.09.15
100% Ambition
62.0 59.3
34.7 38.4
3.4 2.4 AM
L/H
P/C
100%
31.12.14 30.09.15
100% Ambition
F. Value creation
137 F 9
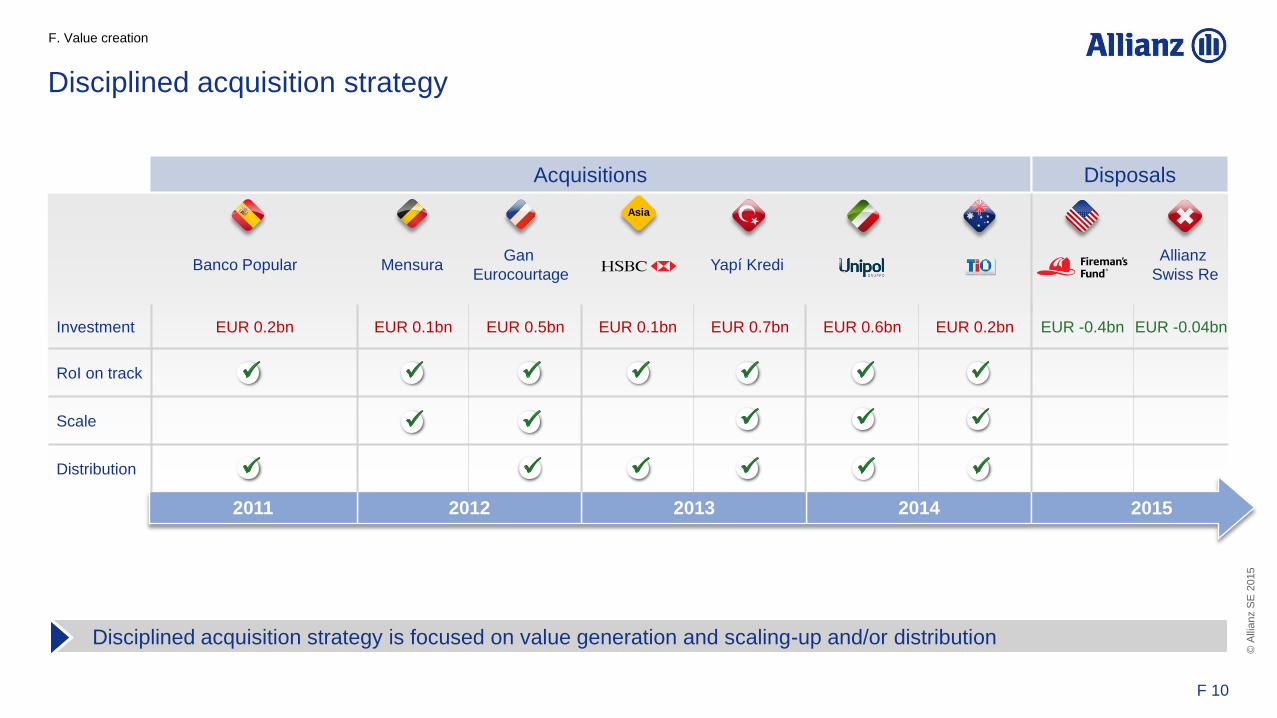
©
Alli
anz S
E 2
015
Disciplined acquisition strategy
2014 2013 2012 2011 2015
Investment EUR 0.2bn EUR 0.1bn EUR 0.5bn EUR 0.1bn EUR 0.7bn EUR 0.6bn EUR 0.2bn EUR -0.4bn EUR -0.04bn
RoI on track
Scale
Distribution
Banco Popular Mensura Gan
Eurocourtage Yapí Kredi
Asia
Allianz
Swiss Re
F. Value creation
Disciplined acquisition strategy is focused on value generation and scaling-up and/or distribution
Acquisitions Disposals
138 F 10
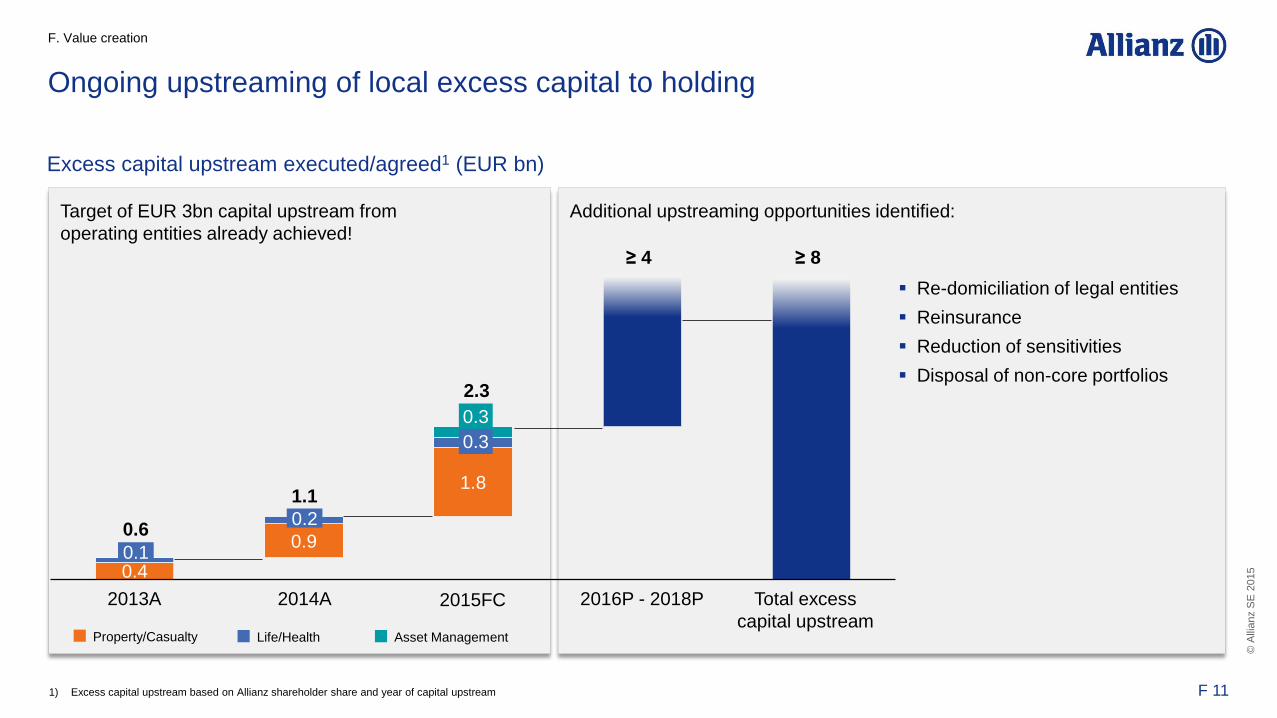
©
Alli
anz S
E 2
015
Target of EUR 3bn capital upstream from
operating entities already achieved!
Additional upstreaming opportunities identified:
Ongoing upstreaming of local excess capital to holding
1) Excess capital upstream based on Allianz shareholder share and year of capital upstream
Excess capital upstream executed/agreed1 (EUR bn)
F. Value creation
0.4
0.9
1.8
0.3
0.3
Total excess
capital upstream
2016P - 2018P
Asset Management Life/Health Property/Casualty
≥ 8 ≥ 4
Re-domiciliation of legal entities
Reinsurance
Reduction of sensitivities
Disposal of non-core portfolios
2015FC 2014A 2013A
2.3
1.1
0.6
0.1
0.2
139 F 11

©
Alli
anz S
E 2
015
Net income s/h
x
~ 71%
Net income s/h
x
~ 61%
Net income s/h
x
~ 105%
remittance ratio 76%2
Net income s/h
x
~ 85%
Net income s/h
x
~ 75%
Net income s/h
x
~ 100%
Net income s/h
Net income s/h
High remittance ratio
P/C L/H AM Corporate/Other
~ EUR -1.2bn1
Ø remittance ratio > 80%
~ EUR -1.0bn
2014
Ambition
2018
Renewal Agenda
1) Excluding one-off effect from pension revaluation
2) Excluding excess capital upstream from operating entities
F. Value creation
Simplification of
legal entity structure
Re-domiciliation
of legal entities
Reduction of
working capital
140 F 12

©
Alli
anz S
E 2
015
EUR bn
Strong free cash flow generation
Strategic IT
investments
Operating
profit
Non-cash
items,
retained
earnings
2015 Forecast
Corporate
segment
(excl. IT)
Taxes
F. Value creation
Free cash flow
(before M&A investments
and dividends)
2014 2013 2015 FC
5
4
5
141 F 13

©
Alli
anz S
E 2
015
Dividend policy
5% EPS CAGR ambition based on solid track record …
2009 - 2014
EPS (EUR)
DPS (EUR)
9.33
13.71
2009 2014
CAGR +8%
4.10
6.85
2009 2014
CAGR +11%
EPS CAGR
5% p.a.
Net income
# shares
DPS CAGR
5% p.a.
2016 - 2018
F. Value creation
EUR ~ 5bn free cash flow after tax 2015e
Upstreaming of EUR ≥ 4bn local excess capital Healthy
cash flows 2
Potential to free up EUR ~3bn from L/H back-books
Shift to capital-light products in new L/H business Capital
efficiency 1
13% IFRS RoE 2018e Attractive
RoE 3
Renewal
Agenda
plus …
142 F 14

©
Alli
anz S
E 2
015
… and capital position tending to improve further
F. Value creation
Renewal
Agenda
1 Higher SII ratio as we produce
earnings and increase capital
efficiency
2 Reduced target range as we
gain experience using SII
3 Reduced target range as
sensitivity goes down
1
Group SII ratio
100% SCR
145% Minimum target
after stress
160%
Dividend policy
threshold
200% 3Q 2015 actual
Illustrative!
Group SII ratio 2018
Target range before stress
180% – 220%
2 3
143 F 15

©
Alli
anz S
E 2
015
Glossary
RoE
RoRC
RoRCNB L/H = PVFPMA
1
Present value of risk capital 4
3
+ Risk-free return
2
- O&GMA
Value of options and guarantees embedded in new business, valued under matching adjustment. O&GMA 2
Present value of future profits for new business, after tax, valued under matching adjustment. PVFPMA 1
Investment return on risk capital, after tax. Risk-free
return 3
Present value of risk capital for new business, including market and non-market risks. PV RC 4
1
6
5 2 3 4
RoRCNB P/C = (NPE
Present value of risk capital
* (1 - Tax rate) - Expenses - Ultimate claims + Risk-free return)
Expenses, including commissions and fixed expenses, net of reinsurance (undiscounted). Expenses 2
Earned premium is net of reinsurance and premium tax. NEP 1
Incurred claims (accident year), incl. allocated and unallocated expenses, net of reinsurance (undiscounted).
Ultimate
claims 3
Corporate tax rate. Same rate used for risk capital tax relief and tax on return. Tax rate 5
Discounting effect on claims and expenses plus investment return on risk capital.
Risk-free
return 4
Present value of all insurance related risk capital on an accident year basis. PV RC 6
RoE Group
Represents net income attributable to shareholders
divided by the average shareholders’ equity excluding
unrealized gains/losses on bonds (net of shadow DAC)
at begin of the period and at end of the period.
RoE L/H OEs
Represents net income divided by the average total
equity excluding unrealized gains/losses on bonds
(net of shadow DAC) and excluding goodwill at begin
of the period and at end of the period.
F. Value creation
NBM Value of new business divided by present
value of new business premiums.
144 F 16

©
Alli
anz S
E 2
015
Disclaimer
These assessments are, as always, subject to the disclaimer provided below.
Forward-looking statements
The statements contained herein may include prospects, statements of
future expectations and other forward-looking statements that are based
on management's current views and assumptions and involve known and
unknown risks and uncertainties. Actual results, performance or events
may differ materially from those expressed or implied in such forward-
looking statements.
Such deviations may arise due to, without limitation, (i) changes of the
general economic conditions and competitive situation, particularly in the
Allianz Group's core business and core markets, (ii) performance of financial
markets (particularly market volatility, liquidity and credit events) (iii) frequen-
cy and severity of insured loss events, including from natural catastrophes,
and the development of loss expenses, (iv) mortality and morbidity levels and
trends, (v) persistency levels, (vi) particularly in the banking business, the
extent of credit defaults, (vii) interest rate levels, (viii) currency exchange
rates including the Euro/U.S. Dollar exchange rate, (ix) changes in laws and
regulations, including tax regulations, (x) the impact of acquisitions, including
related integration issues, and reorganization measures, and (xi) general
competitive factors, in each case on a local, regional, national and/or global
basis. Many of these factors may be more likely to occur, or more
pronounced, as a result of terrorist activities and their consequences.
No duty to update
The company assumes no obligation to update any information or forward-
looking statement contained herein, save for any information required
to be disclosed by law.

©
Alli
anz S
E 2
015
Investor Relations contacts
Oliver Schmidt +49 89 3800-3963
Head of
Investor Relations
E-mail:
Christian
Lamprecht
+49 89 3800-3892
E-mail:
Investor
Relations E-mail:
Reinhard
Lahusen
+49 89 3800-17224
E-mail:
Frank Stoffel +49 89 3800-18124
E-mail:
Peter Hardy
E-mail:
+49 89 3800-18180
Internet
English: www.allianz.com/investor-relations
German: www.allianz.com/ir
Stephanie Aldag +49 89 3800-17975
E-mail:
IR Events


