ALPHA EFFECTIVENESS MODELING CURRENT AND FUTURE LIGHT - DUTY VEHICLE & POWERTRAIN TECHNOLOGIES Daniel Barba, Director National Center for Advanced Technology Office of Transportation and Air Quality Office of Air and Radiation U.S. Environmental Protection Agency January 20, 2016 2016 SAE Government - Industry Meeting
Transcript
ALPHA EFFECTIVENESS MODELING CURRENT AND FUTURE LIGHT-DUTY VEHICLE & POWERTRAIN TECHNOLOGIES
Daniel Barba, DirectorNational Center for Advanced Technology
Office of Transportation and Air QualityOffice of Air and Radiation
U.S. Environmental Protection Agency
January 20, 2016
2016 SAE Government-Industry Meeting
SAE INTERNATIONAL 2016 GOVERNMENT-INDUSTRY MEETING
SAE INTERNATIONAL 2016 GOVERNMENT-INDUSTRY MEETING
• The 2017-2025 Light-Duty Greenhouse Gas rule requires EPA to conduct a Midterm Evaluation (MTE), in coordination with NHTSA and CARB, to assess the appropriateness of the MY 2022-2025 standards
• As part of this assessment, EPA will review the costs and effectiveness of technologies available to automobile manufacturers to meet the emission standards in MY 2022-2025
• To assess the synergistic effects of vehicle technologies, EPA has enhanced its ALPHA model with more detailed and recent vehicle and component level benchmarking data to better simulate operation of current and future vehicles
• ALPHA is EPA’s tool for understanding vehicle behavior, effectiveness of various powertrain technologies and their greenhouse gas emissions
Background
3US ENVIRONMENTAL PROTECTION AGENCY
NOTE: This presentation focuses on the scientific development behind EPA’s vehicle simulation and modeling, which is one tool we plan to use during the MTE.
**Data presented in this briefing are NOT MTE RESULTS.
SAE INTERNATIONAL 2016 GOVERNMENT-INDUSTRY MEETING
Technology Assessment Based onMultiple Sources of Information
4
Information/data from Stakeholders(MFRs, suppliers, etc.)
Information/data from conferences, general research, & contracted studies
SAE INTERNATIONAL 2016 GOVERNMENT-INDUSTRY MEETING
• ALPHA is an Advanced Light-Duty Powertrain and Hybrid Analysis tool created by EPA to estimate greenhouse gas (GHG) emissions from current and future light-duty vehicles.
• ALPHA is a physics-based, forward-looking, full vehicle computer simulation capable of analyzing various vehicle types combined with different powertrain technologies.
• ALPHA is not a commercial product (e.g. there are no user manuals, tech support hotlines, graphical user interfaces, or full libraries of components).
Why was ALPHA developed?• EPA’s objective in its rulemaking processes is to achieve the highest level of
transparency and openness possible.• ALPHA is EPA’s engineering tool to explore the impacts of current & emerging
low-GHG technologies.• EPA needed a model for HD Compliance anyway (GEM), so adding a LD
model (ALPHA) could be done cost-effectively.
What is ALPHA?
5US ENVIRONMENTAL PROTECTION AGENCY
SAE INTERNATIONAL 2016 GOVERNMENT-INDUSTRY MEETING
ALPHA’s Role in the Overall Modeling of Potential Compliance Pathways
US ENVIRONMENTAL PROTECTION AGENCY
Focus of this presentation
SAE INTERNATIONAL 2016 GOVERNMENT-INDUSTRY MEETING
ALPHA inputs fall into one of four categories:
1. Test Cycleo Drive cycle speed (e.g., FTP, HWFET, US06)
2. Vehicle Parameterso Weight / inertia, road load, driveline type or vehicle class
SAE Figure 6. Transmission efficiency data at 93 C and 10 bar line pressure
2.5L I4 GDI, Non-Hybrid22 City / 34 Highway / 26 CombChosen as representative of an average midsize car
SAE INTERNATIONAL 2016 GOVERNMENT-INDUSTRY MEETING
Bridging the Gap Between a Simulation and a Real Vehicle Accounting for All the Fuel Consumed
9
• Vehicle simulation models tend to under-predict fuel consumption (over-predict fuel economy) because they often overlook fuel used to manage a vehicle’s “overhead” functions, including extra fuel required for:
o heavy transient operationo accessory loads (power steering, A/C, electronics, etc.)o torque transitions related to performance and drivability o special controls for emissionso NVH considerations
• One of the primary goals of EPA’s extensive engine and vehicle benchmarking program is to identify appropriate modeling “rules” that can account for these vehicle operating requirements.
SAE INTERNATIONAL 2016 GOVERNMENT-INDUSTRY MEETING
Technology Packaging Matrix“Putting It All Together”
13
3 Engines: Baseline - Camry 2.4L I4 engine from the 2010 Ricardo
analysis for LD GHG Federal Rulemaking (FRM)
2014 NA - Mazda SkyActiv 2.0L I4 13:1 compression-ratio engine
Future TDS – 24 bar down-sized turbo with cooled EGR from the 2010 Ricardo analysis for LD GHG Federal Rulemaking (FRM)
5 Transmissions: 2008 AT5 – parameters from vehicle testing
2013 AT6 – GM6T40, parameters from vehicle testing
2014 AT8 – FCA845RE, parameters from EPA trans stand testing
Future AT8 gen3 – constructed using paper published by ZF
Future damp DCT8 – constructed using DCT7 data provided by a supplier
4 reductions of Mass: Base (0% reduction) 5% reduction 10% reduction 15% reduction
3 reductions of Aerodynamic resistance (Cd): Base (0% reduction) 10% reduction 20% reduction
3 reductions of Rolling Resistance (Crr): Base (0% reduction) 10% reduction 20% reduction
2 modes of 12 volt Start-Stop technology: Base (0% start-stop) 100% start-stop
US ENVIRONMENTAL PROTECTION AGENCY
StdCAR Matrix 1080 Vehicle Packages
SAE INTERNATIONAL 2016 GOVERNMENT-INDUSTRY MEETING
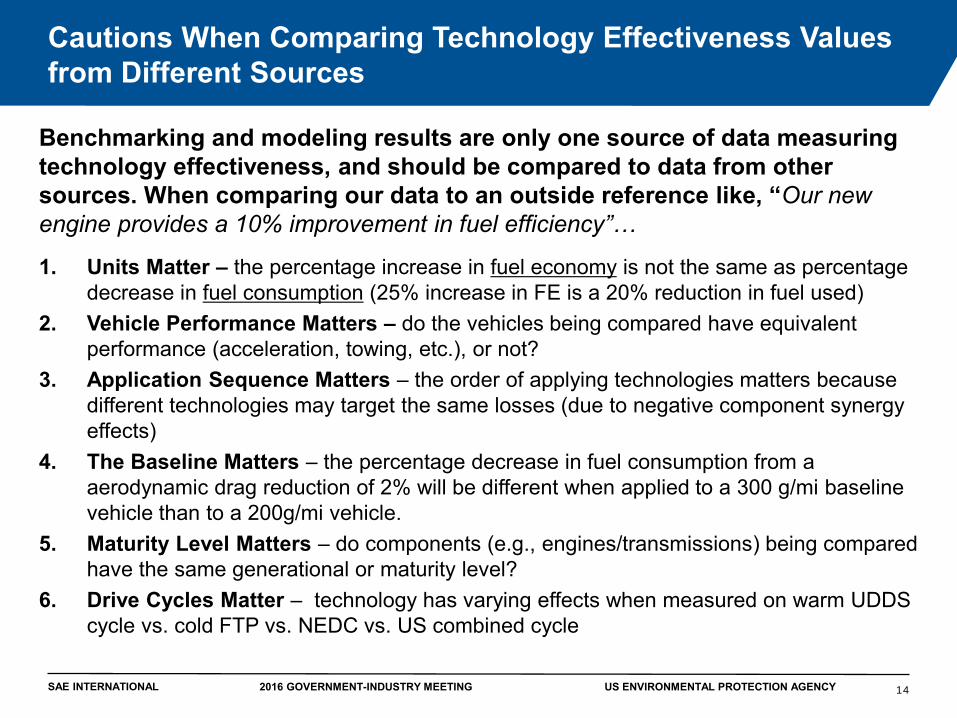
Benchmarking and modeling results are only one source of data measuring technology effectiveness, and should be compared to data from other sources. When comparing our data to an outside reference like, “Our new engine provides a 10% improvement in fuel efficiency”…
1. Units Matter – the percentage increase in fuel economy is not the same as percentage decrease in fuel consumption (25% increase in FE is a 20% reduction in fuel used)
2. Vehicle Performance Matters – do the vehicles being compared have equivalent performance (acceleration, towing, etc.), or not?
3. Application Sequence Matters – the order of applying technologies matters because different technologies may target the same losses (due to negative component synergy effects)
4. The Baseline Matters – the percentage decrease in fuel consumption from a aerodynamic drag reduction of 2% will be different when applied to a 300 g/mi baseline vehicle than to a 200g/mi vehicle.
5. Maturity Level Matters – do components (e.g., engines/transmissions) being compared have the same generational or maturity level?
6. Drive Cycles Matter – technology has varying effects when measured on warm UDDS cycle vs. cold FTP vs. NEDC vs. US combined cycle
Cautions When Comparing Technology Effectiveness Values from Different Sources
14US ENVIRONMENTAL PROTECTION AGENCY
SAE INTERNATIONAL 2016 GOVERNMENT-INDUSTRY MEETING
Problem Statement:• Many fuel consumption reduction technologies
decrease required wheel power, increase available engine power, or deliver power to wheels more efficiently
• If applied blindly, these technologies will reduce fuel consumption while also improving acceleration performance
• How do we “fairly compare” technologies that affect both fuel consumption and acceleration performance?
ALPHA’s Current Approach:• Reduce engine size to attain equivalent acceleration
performance
Technology Effectiveness:Fuel Consumption and Performance
15US ENVIRONMENTAL PROTECTION AGENCY
How do these two technologies
compare?
Comparing “equivalent acceleration”
NAS 2011: “Objective comparisons of the cost-effectiveness of different technologies for reducing FC can be made only when vehicle performance remains equivalent.”
SAE INTERNATIONAL 2016 GOVERNMENT-INDUSTRY MEETING
Technology Packaging MatrixPreliminary results
16US ENVIRONMENTAL PROTECTION AGENCY
Preliminary data for illustrative purposes only to explain the analysis methodology
StdCAR Matrix: 1080 Vehicle Packages
Case study on next slide
SAE INTERNATIONAL 2016 GOVERNMENT-INDUSTRY MEETING
Validated baseline test results with certification results & chassis test data for 2014 Mazda3HIL w/ALPHA allows evaluation with different powertrains and/or road load conditions
What if…We replicate a modeling run in the test cell?
17
Simulate a hypothetical mid-size vehicle with 2.0L SkyActiv-G in the test cell• Simulated chassis drive cycles using an engine dyno w/ Hardware-in-Loop
(HIL) version of ALPHA
CycleTotal
Fuel (g)
IdleFuel (g)
AdjustedFuel (g)
FE(mpg)
g/miCO2
HIL L1FTP (total) 257.9 12.8 245.1 43.0 206.7
HWFE 64.5 137.7
Combined 50.6 175.6
HIL L2FTP (total) 247.6 12.2 235.4 44.3 200.8
HWFE 67.1 132.4
Combined 52.3 170.0
• Applied Adv. ZF 8HP50 8-sp AT and 12V start/stop
The HIL test results suggest that this hypothetical vehicle has potential to reach these
levels with the existing 2.0L Skyactiv engine.
US ENVIRONMENTAL PROTECTION AGENCY
SAE INTERNATIONAL 2016 GOVERNMENT-INDUSTRY MEETING
Lumped Parameter
Model (LPM)Vehicle Technology
Packages
ALPHA
OMEGA
Efficiency Projections for Future Vehicles
Lab & other data from MY2013-16 veh’s
used to validate ALPHA
Model a future fleet‘scompliance with light-
duty GHG standards
Other information sources
Wrap UpALPHA Process Summary
18US ENVIRONMENTAL PROTECTION AGENCY
• Data is obtained from multiple sources, including benchmarking lab data• Data is used to calibrate and validate ALPHA modeling• ALPHA can look at multiple packages and multiple case studies simultaneously• Combinations of the best available technologies can be used to make efficiency
projections for future vehicles• Going forward, test data and modeling results will be used to update LPM
Focus of this presentation
SAE INTERNATIONAL 2016 GOVERNMENT-INDUSTRY MEETING