+ All Categories
Home > Documents > Alternate Path Method in Progressive Collapse Analysis - Variation of Dynamic and Non-Linear Load...

Alternate Path Method in Progressive Collapse Analysis - Variation of Dynamic and Non-Linear Load...

Date post: 24-Oct-2015
Category:
Upload: malvin-ndoci
View: 301 times
Download: 31 times
Share this document with a friend
Description:
Alternate Path Method in Progressive Collapse Analysis - Variation of Dynamic and Non-Linear Load Increase Factors
Popular Tags:
84
ALTERNATE PATH METHOD IN PROGRESSIVE COLLAPSE ANALYSIS: VARIATION OF DYNAMIC AND NON-LINEAR LOAD INCREASE FACTORS APPROVED BY SUPERVISING COMMITTEE: ________________________________________ Manuel Diaz, Ph.D., P.E Chair ________________________________________ Jose Weissmann, Ph.D. ________________________________________ Mijia Yang, Ph.D. Accepted: _________________________________________ Dean, Graduate School
Transcript

ALTERNATE PATH METHOD IN PROGRESSIVE COLLAPSE ANALYSIS:

VARIATION OF DYNAMIC AND NON-LINEAR LOAD INCREASE FACTORS

APPROVED BY SUPERVISING COMMITTEE:

________________________________________ Manuel Diaz, Ph.D., P.E Chair

________________________________________

Jose Weissmann, Ph.D.

________________________________________ Mijia Yang, Ph.D.

Accepted: _________________________________________

Dean, Graduate School

DEDICATION

This Thesis is dedicated to God, without him in my life, nothing is possible. I also want to dedicate this to my dear Mother and Father, who have given me more than I ever needed and have always supported me in all my endeavors.

ALTERNATE PATH METHOD IN PROGRESSIVE COLLAPSE ANALYSIS:

VARIATION OF DYNAMIC AND NON-LINEAR LOAD INCREASE FACTORS

by

ALDO E. MCKAY, B.E.

THESIS Presented to the Graduate Faculty of

The University of Texas at San Antonio In partial Fulfillment Of the Requirements

For the Degree of

MASTER OF SCIENCE IN CIVIL ENGINEERING

THE UNIVERSITY OF TEXAS AT SAN ANTONIO College of Engineering

Department of Civil and Environmental Engineering August, 2008

1454510

1454510 2008

iii

ACKNOWLEDGEMENTS

I would like to thank Dr. David Stevens and Mr. Kirk Marchand from Protection Engineering

Consultants for their support and guidance during this research. The input provided by them

helped greatly in the completion of this study. I also would like to thank Dr. Eric Williamson

and Daniel Williams (PhD candidate) at the University of Texas in Austin for their contributions

to this effort.

August, 2008

iv

ALTERNATE PATH METHOD IN PROGRESSIVE COLLAPSE ANALYSIS:

VARIATION OF DYNAMIC AND NON-LINEAR LOAD INCREASE FACTORS

Aldo E. McKay, M.S

The University of Texas at San Antonio, 2008

Supervising Professor: Manuel Diaz, Ph.D.

As a result of the increasing number of terrorist attacks registered against American

facilities in the United States or abroad, United States government agencies continue to improve

the design of their buildings to make them safer and less vulnerable to terrorist attacks. One of

the factors typically considered in designing safer buildings and structures, is their ability to

prevent total collapse after the loss of load-carrying components (Progressive Collapse) resulting

from a terrorist attack. The consequences of not having a building capable of reducing the

potential for progressive collapse could be catastrophic, as it was the case of the Oklahoma City

bombing in 1995 where 42% of the Alfred P. Murrah Federal Building was destroyed by

progressive collapse and only 4% by the explosion or blast. This attack claimed 168 lives and

left over 800 injured.

Over the last 10 years, two United States government agencies have developed guidelines

for the design of their structures to resist progressive collapse: 1. The General Services

Administration, “Progressive Collapse Analysis and Design Guidelines,” (GSA Guidelines) and

2. The Department of Defense Unified Facilities Criteria 4-023-03 “Design of Buildings to

Resist Progressive Collapse” (UFC 4-023-03). Within both approaches, the main direct design

procedure is the Alternate Path (AP) method, in which a structure is analyzed for collapse

potential after the removal of a column or section of wall. Different analytical procedures may

be used, including Linear Static (LS), Nonlinear Static (NLS), and Nonlinear Dynamic (NLD).

v

Typically, NLD procedures give better and more accurate results, but are more

complicated and expensive. As a result, designers often choose static procedures, which tend to

be simpler, requiring less labor. As progressive collapse is a dynamic and nonlinear event, the

load cases for the static procedures require the use of factors to account for inertial and nonlinear

effects, similar to the approach used in ASCE Standard 41 “Seismic Rehabilitation of Existing

Buildings” (ASCE 41).

A number of inconsistencies have been indentified in the way the existing guidelines

applied dynamic and non-linear load factors to their static approaches. As part of an existing

effort to update the existing guidelines, this study used SAP2000 to perform several AP analyses

on a variety of Reinforced Concrete and Steel Moment Frame buildings to investigate the

magnitude and variation of the dynamic and non-linear load increase factors. The study

concluded that the factors in the existing guidelines tend to yield overly conservative results,

which often translate into expensive design and retrofits. This study indentified new load

increase factors and proposes a new approach to utilize these factors when performing AP

analyses for Progressive Collapse.

vi

TABLE OF CONTENTS

Acknowledgements........................................................................................................................ iii

List of Tables ............................................................................................................................... viii

List of Figures ................................................................................................................................ ix

CHAPTER 1: Introduction ........................................................................................................... 11

CHAPTER 2: Progressive Collapse............................................................................................. 13

U.S. Existing Guidelines for Design against Progressive Collapse.................................. 14

Design Approaches to Resist Progressive Collapse.......................................................... 15

Overview of GSA Guidelines ........................................................................................... 15

Overview of DoD Guidelines UFC 4-023-03................................................................... 16

CHAPTER 3: Procedures for the Alternate Path Method ............................................................ 18

CHAPTER 4: Inconsistencies of Existing Factors ....................................................................... 20

CHAPTER 5: Variation of Load and Dynamic Increase Factors Research Procedure ................ 23

3- Dimensional Analytical Models ................................................................................... 25

3-Dimmensinal Building Designs..................................................................................... 33

2-Dimmensional Models................................................................................................... 35

CHAPTER 6: Analysis Results and Data Analysis ...................................................................... 38

Analysis of Data from Linear Static AP Analyses (LIF).................................................. 39

Analysis of Data from Nonlinear Static Analysis (DIF)................................................... 46

CHAPTER 7: Proposed Procedures for Using LIFs and DIFs in Static AP Analyses ................ 50

Linear Static AP Procedure............................................................................................... 50

Non-Linear Static AP Procedure ...................................................................................... 52

CHAPTER 8: Conclusions and Recommendations...................................................................... 55

vii

BIBLIOGRAPHY......................................................................................................................... 56

Appendix - RESULT TABLES .................................................................................................... 57

VITA

viii

LIST OF TABLES

Table 1. Study Matrix of AP Analyses Performed ....................................................... 34

Table 2. Design Loads .................................................................................................. 34

Table 3. Steel Buildings, Material Properties ............................................................... 35

Table 4. Reinforced Concrete Buildings, Material Properties ...................................... 35

Table 5. 2-Dimmensionals Analyses ............................................................................ 37

Table 6. Steel Building, 10-Story - 25 ft Bay, Interior Column Removal .................... 38

Table 7. Reinforced Concrete Building, 3-Story-25 ft, Interior Column Removal ..... 39

Table 8 LIF Data for RC Sections ............................................................................... 45

Table 9 LIF Data for Steel Sections............................................................................. 45

Table 10. Complete Results for RC 3-Dimmensional AP Analyses............................... 60

Table 11. Complete Results, Steel Building 3-Dimmensional AP Analysis .................. 76

Table 12. Complete Results, RC Double Span Beams, SDOF Analyses ....................... 78

ix

LIST OF FIGURES

Figure 1. Ronan Point Collapse...................................................................................... 14

Figure 2. Procedure to Determine Load Increase Factors. ............................................. 24

Figure 3. Steel Frame Building Hinge Definition (ASCE 41). ...................................... 26

Figure 4. Reinforced Concrete Hinge Definition. .......................................................... 27

Figure 5. NLD Analysis Procedure. ............................................................................... 28

Figure 6. Results of NLD Procedure. ............................................................................. 29

Figure 7. Stage Construction Setup................................................................................ 30

Figure 8. NLS Analysis Stage 1. .................................................................................... 30

Figure 9. NLS Stage 2, Load Around Loss Location..................................................... 31

Figure 10. NLS Stage 3, Nonlinear Analysis of Structure Response............................... 31

Figure 11. Typical Floor Plan........................................................................................... 33

Figure 12. 2-Dimmensional Models................................................................................. 36

Figure 13. LIF vs Plastic Rotation for RC sections.......................................................... 40

Figure 14. RC Sections Strong Dependence on Stiffness ................................................ 41

Figure 15. LIF vs. Total Rotation for Steel Sections........................................................ 41

Figure 16. Normalized LIF for RC sections..................................................................... 42

Figure 17. Normalized LIF for Steel Sections ................................................................. 43

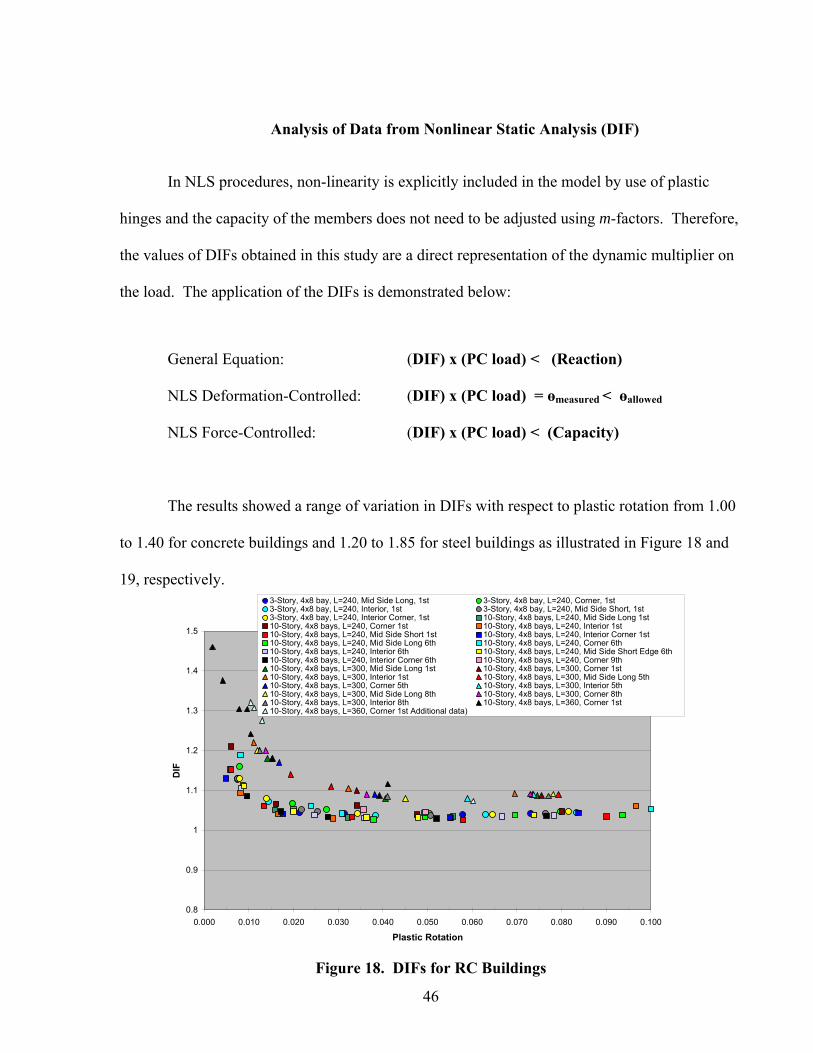
Figure 18. DIFs for RC Buildings .................................................................................... 46

Figure 19. DIFs for Steel Buildings ................................................................................. 47

Figure 20 . Normalized DIFs for RC Buildings ................................................................ 48

Figure 21. Normalized DIFs for Steel Buildings ............................................................. 48

Figure 22. LIF for LS Analysis ........................................................................................ 51

x

Figure 23. DIF for NLS Analysis..................................................................................... 53

11

CHAPTER ONE: INTRODUCTION

As a result of the increasing number of terrorist attacks registered against American

facilities in the United States or abroad, United States government agencies continue to improve

the design of their buildings to make them safer and less vulnerable to terrorist attacks. One of

the factors typically considered in designing safer buildings and structures, is their ability to

prevent total collapse after the loss of load-carrying components (Progressive Collapse) resulting

from a terrorist attack. The consequences of not having a building capable of reducing the

potential for progressive collapse could be catastrophic, as it was the case of the Oklahoma City

bombing in 1995 where 42% of the Alfred P. Murrah Federal Building was destroyed by

progressive collapse and only 4% by the explosion or blast. This attack claimed 168 lives and

left over 800 injured.

Over the last 10 years, two United States government agencies have developed guidelines

for the design of their structures to resist progressive collapse: 1. The General Services

Administration, “Progressive Collapse Analysis and Design Guidelines,” (GSA Guidelines) and

2. The Department of Defense Unified Facilities Criteria 4-023-03 “Design of Buildings to

Resist Progressive Collapse” (UFC 4-023-03). Although both documents incorporate some of

the same approaches, there are notable differences in the application of these procedures. Within

both approaches, the main direct design procedure is the Alternate Path (AP) method, in which a

structure is analyzed for collapse potential after the removal of a column or section of wall.

Different analytical procedures may be used, including Linear Static (LS), Nonlinear Static

(NLS), and Nonlinear Dynamic (NLD). Typically, NLD procedures give better and more

accurate results, but are more complicated and expensive. As a result, designers often choose

static procedures, which tend to be simpler, requiring less labor. As progressive collapse is a

12

dynamic and nonlinear event, the load cases for the static procedures require the use of factors to

account for inertial and nonlinear effects, similar to the approach used in ASCE Standard 41

“Seismic Rehabilitation of Existing Buildings” (ASCE 41). It is important that design

requirements for progressive collapse incorporate appropriate dynamic and nonlinear factors

such that the linear static and nonlinear static designs are more representative of the actual

nonlinear and dynamic response of the structure.

13

CHAPTER 2: PROGRESSIVE COLLAPSE

Progressive collapse is defined in the commentary of the American Society of Civil

Engineers Standard 7-05 Minimum Design Loads for Buildings and Other Structures (ASCE 7-

05) as “the spread of an initial local failure from element to element, eventually resulting in the

collapse of an entire structure or a disproportionately large part of it.”

There have been a number of progressive collapse failures where the above definition can

be clearly observed. Probably one of the most famous progressive collapse failures was the 1968

collapse of the Ronan Point apartment building. The building was a 22-story precast concrete

bearing wall system. An explosion in a corner kitchen on the 18th floor blew out the exterior

wall panel and failure of the corner bay propagated up and down to cover almost the complete

height of the building. Figure 1 illustrates the final state of the collapse of the Ronan Point

apartment building. After this event, England was the first nation to address progressive collapse

explicitly in their building standards. Another famous case of progressive collapse was the

Oklahoma City bombing in 1995 of the Alfred P. Murrah Federal Building mentioned

previously.

14

Figure 1. Ronan Point Collapse It is important to point out that, as stated in (Ellingwood, Smilowitz, Dusenberry,

Duthinh, Carino, 2006) there have been numerous cases of progressive collapse of buildings

during construction and data suggest that buildings under construction have a higher probability

of sustaining collapse. However, the design approaches against progressive collapse mentioned

in this paper relate only to progressive collapse of finished buildings in service.

U.S. Existing Guidelines for Design against Progressive Collapse

Existing U.S building codes do not address progressive collapse explicitly. Standards

such as ASCE 7 and ACI-318 include references to improve structural integrity but do not

provide quantifiable or enforceable requirements to resist progressive collapse. Only two U.S

15

agencies have developed guidelines that provide quantifiable and prescriptive requirements to

reduce the potential for progressive collapse. These guidelines are: The General Services

Administration Progressive Collapse Analysis and Design Guidelines 2003 and The Unified

Facilities Criteria Design of Buildings to Resist Progressive Collapse 2005 by the Department of

Defense ( DoD).

Currently, work is being done to update the Unified Facilities Criteria Design of

Buildings to Resist Progressive Collapse. One of the improvements in the new updated

guidelines will be more realistic load factors for static analysis procedures based on the approach

used in ASCE41.

Design Approaches to Resist Progressive Collapse

Prevention or mitigation of progressive collapse can be achieved using two different

methods: indirect design and direct design. The indirect method consists of improving the

structural integrity of the building by providing redundancy of load paths and ductile detailing.

Currently, only UFC 4-023-03 allows the use of indirect methods. The direct method is divided

into two approaches: Specific Load Resistance (SLR) and Alternate Path (AP), with the latter

being the most widely used in the US. The updated guidelines will incorporate a combination of

indirect and direct methods with AP being the main direct design procedure. This research

focuses primarily on the AP method for progressive collapse.

Overview of GSA Guidelines

The purpose of the Guidelines is to: Assist in the reduction of the potential for

progressive collapse in new Federal Office Buildings, assist in the assessment of the potential for

16

progressive collapse in existing Federal Office Buildings, and assist in the development of

potential upgrades to facilities if required.

To meet this purpose, these Guidelines provide a threat independent methodology for

minimizing the potential for progressive collapse in the design of new and upgraded buildings,

and for assessing the potential for progressive collapse in existing buildings (GSA, 2003). The

GSA guidelines only provide requirements for Reinforced Concrete and Steel structures. The

main design procedure is the AP method. In the AP method, designers and analysts are allowed

to choose between linear/non-linear, dynamic/static and 2-dimmensional/3-dimmensional

procedures and models. The load combination used for dynamic analyses is D + 0.25L and a

factor of 2 is applied for static cases to account for dynamic and inertial effects 2(D + 0.25L).

For non-linear analyses the acceptance criteria is based upon ductility and rotation limits

specified in tables for different component types. For linear analyses, the capacity of the

members is artificially enhanced using demand capacity ratios DCR (specified in the guidelines)

to account for non-linearity effects not explicitly included in the model. If the enhanced capacity

is more than the demand or acting force in the component, the member is said to be acceptable.

DCR values range from 1 to 3 based on construction type and configurations. The guidelines

recommend that non-linear procedures should be use for buildings with more than 10 stories.

Finally, vertical support removal locations are explicitly provided and each loss location must be

considered as an independent analysis.

Overview of DoD Guidelines UFC 4-023-03

The purpose of these guidelines is to “provide a design to reduce the potential of

progressive collapse for new and existing DoD facilities,” (UFC, 2005). The DoD guidelines use

17

a combination of direct and indirect approaches and must be applied to all DoD building with 3

or more stories. In addition to RC and steel structures, the DoD guidelines include Masonry,

Wood and Cold-formed structural components. The requirements can be applied to provide four

different levels of protection (LOP). For Very Low LOP, only indirect design is employed by

specifying the required levels of Tie Forces. If a structural element does not provide the required

tie force, the element must be re-designed or retrofitted. For Low LOP, a combination of the

Indirect and Direct method is used. The design must incorporate both horizontal and vertical tie

forces. However, if the vertical tie forces are insufficient, the designer must upgrade the vertical

ties or perform an AP analysis to prove the structure is capable of bridging over the deficient

vertical member. For Medium and High LOP, both, Tie Forces and AP requirements are

mandatory. In the AP method, the DoD guidelines allowed the use of three procedures: Linear

Static, Non-linear Static and Non-linear Dynamic. The load combination used for the AP

analysis is 1.2D + 0.5L and as with the GSA guidelines a factor of 2 is applied for static

procedures 2(1.2D+0.5L). Response criteria are given for non-linear analyses in terms of

allowable levels of ductility and rotation presented in tables for each construction type. For

static analyses, the un-enhanced capacity of the members is compared to the demand or acting

force on the component. This differs drastically with the GSA guidelines, which use DCR values

ranging from 1 to 3. A more detail explanation of the use of these capacity increase factors is

presented in Chapter 4.

18

CHAPTER 3: PROCEDURES FOR THE ALTERNATE PATH METHOD

In the AP method, the designer must show that the building is capable of bridging over a

removed structural element and that the resulting extent of damage does not exceed the damage

limits. In the updated UFC 4-023-03, an AP analysis may be performed using one of three

procedures, Nonlinear Dynamic, Nonlinear Static, or Linear Static, as described next.

Linear Static (LS): In general, this is the simplest of the three procedures to apply. A

linear static model of the structure is created and two load cases are considered: one is used to

calculate the deformation-controlled (or ductile) actions (or internal forces and moments or

demands) and the second load case is used to calculate the force-controlled (or brittle) actions.

For the analysis of the deformation-controlled actions, the applied load is enhanced by a “Load

Increase Factor” that approximately accounts for both dynamic and nonlinear effects. The

enhanced load is applied to the linear static model that has been modified by removal of a

column, wall section or other vertical load-bearing member. The calculated internal member

forces (actions) due to the enhanced loads are compared to the expected member capacities. For

deformation-controlled actions, the expected member capacities are increased by a capacity

increase factor (CIF, similar to the “m-factor” in ASCE 41) that accounts for the expected

ductility and the resulting values are compared to the deformation-controlled actions. For force-

controlled actions, the model is re-analyzed with a different Load Increase Factor that accounts

for only the inertial effects and the calculated demand is directly compared to the un-modified

member capacity.

Nonlinear Static (NLS): After the materially- and geometrically-nonlinear model is built,

the loads are magnified by a “Dynamic Increase Factor” that accounts only for inertia effects and

the resulting load is applied to the model with the removed vertical load-bearing element. For

19

deformation-controlled actions, the resulting member deformations are compared to the

deformation limits based on the desired performance level; for force-controlled actions, the

member strength is not modified and is compared to the maximum actions (internal member

forces).

Nonlinear Dynamic (NLD): In this case, the un-modified load case is directly applied to

a materially- and geometrically-nonlinear model of the structure. In the first phase of the

dynamic analysis, the structure is allowed to reach equilibrium under the applied load case. In

the second phase, the column or wall section is removed almost instantaneously and the software

tool calculates the resulting motion of the structure. As with the NLS case, the resulting

maximum member deformations are compared to the deformation limits and for force-controlled

actions, the member strength is compared to the maximum internal member force. Dynamic

nonlinear analysis explicitly includes nonlinearity and inertial effects and therefore no correction

factors are needed.

20

CHAPTER 4: INCONSISTENCIES OF EXISTING FACTORS

As mentioned earlier, the linear static procedure requires the use of a load increase factor

(LIF) to account for both dynamic and non-linear effects. The nonlinear static procedure

requires a dynamic increase factor (DIF) to account for just the inertial effects. For linear and

nonlinear static analysis methods, the current UFC 4-023-03 and the GSA Guidelines use the

same load multiplier of 2.0, which is applied directly to the progressive collapse load

combination. Four major issues have been identified in the static procedures.

1. The same load enhancement factor is used for Linear Static and Nonlinear Static

analyses. To approximate the actual nonlinear and dynamic response of a damaged

structure, the load on a LS model must be increased by a factor that accounts for both

effects. For a NLS model, the load must be increased by a factor that accounts only for

the dynamic effects, as the nonlinear behavior has already been addressed. The current

UFC 4-023-03 and GSA Guidelines use the same increase factor of 2.0 for both types of

analyses, which is incorrect.

2. The dynamic increase factor of 2.0 is not appropriate for the majority NLS cases. As is

well known from structural dynamics, the maximum dynamic displacement of an

instantaneously applied, constant load in a linear analysis is twice the displacement

achieved when the load is applied statically. If a structure is designed to remain elastic, a

factor of 2.0 would be appropriate. However, in extreme loading events, it is more

economical and typical to design structures to respond in the nonlinear range. Thus, as

will be shown later for the buildings that were analyzed, the dynamic increase factor

(DIF) that allows a Nonlinear Static solution to approximate a Nonlinear Dynamic

solution, is typically less than 2.

21

3. Load enhancement factors do not vary with the performance level. The current

guidelines apply the same multiplier to the loads independent of the performance level

being used in the design. In other words, a structure is assigned a load enhancement

factor of 2.0 regardless of whether the designer wants to allow significant structural

damage (Collapse Prevention, as described in ASCE 41) or very little damage

(Immediate Occupancy in ASCE 41). As will be shown later, the load enhancement

factors can be defined as functions of the desired building performance level and the

building characteristics.

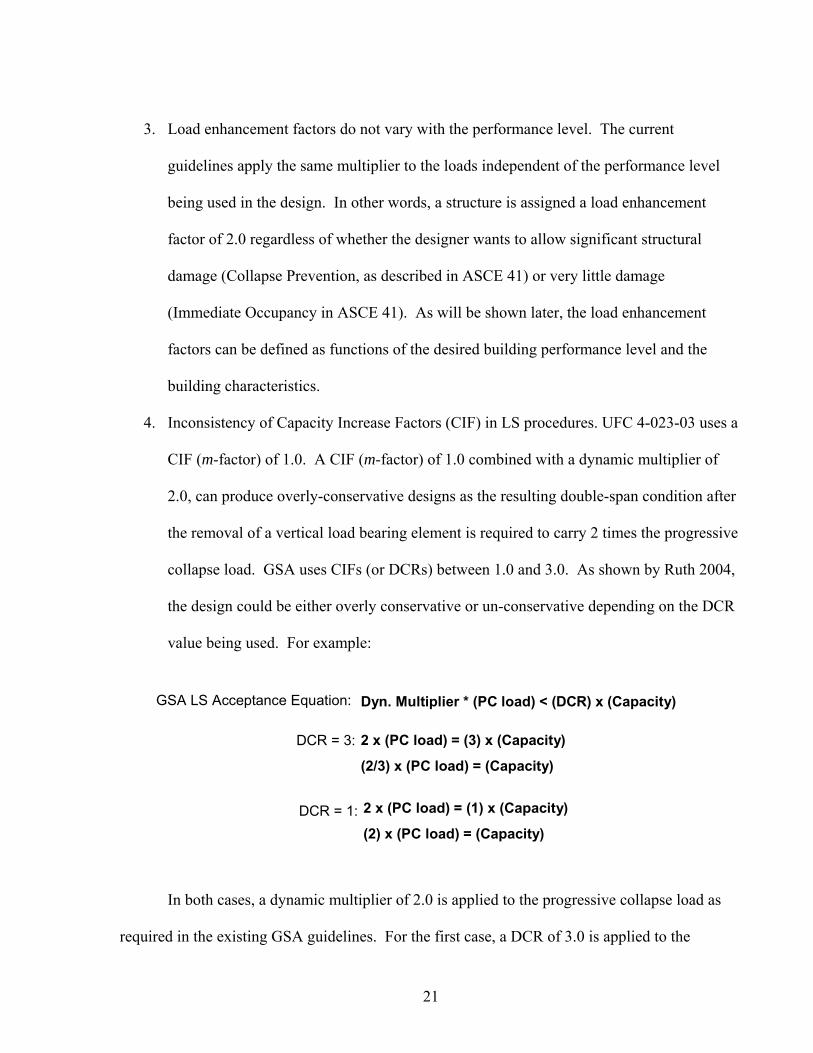
4. Inconsistency of Capacity Increase Factors (CIF) in LS procedures. UFC 4-023-03 uses a

CIF (m-factor) of 1.0. A CIF (m-factor) of 1.0 combined with a dynamic multiplier of

2.0, can produce overly-conservative designs as the resulting double-span condition after

the removal of a vertical load bearing element is required to carry 2 times the progressive

collapse load. GSA uses CIFs (or DCRs) between 1.0 and 3.0. As shown by Ruth 2004,

the design could be either overly conservative or un-conservative depending on the DCR

value being used. For example:

In both cases, a dynamic multiplier of 2.0 is applied to the progressive collapse load as

required in the existing GSA guidelines. For the first case, a DCR of 3.0 is applied to the

GSA LS Acceptance Equation: Dyn. Multiplier * (PC load) < (DCR) x (Capacity)

DCR = 3: 2 x (PC load) = (3) x (Capacity)

(2/3) x (PC load) = (Capacity)

DCR = 1: 2 x (PC load) = (1) x (Capacity)

(2) x (PC load) = (Capacity)

22

capacity of the member, which could be a beam in flexure. If the dynamic multiplier (2.0) and

the DCR (3.0) are combined and applied to the progressive collapse load, it can be seen that the

member would be designed for 2/3 of the original progressive collapse load, which is un-

conservative. Conversely, if the structural member under consideration has a DCR of 1.0, which

could correspond to a column in flexure, the combined factor (Dynamic Multiplier / DCR) would

be 2.0. In this case, the member would be designed for a load of 2 times the progressive collapse

load, which could be overly conservative.

23

CHAPTER 5: VARIATION OF LOAD AND DYNAMIC INCREASE FACTORS

RESEARCH PROCEDURE

As a result of the inconsistencies presented in the previous chapter, a study was

undertaken to investigate the factors needed to better match the LS and NLS static procedures to

the NLD procedure in AP analysis for Progressive Collapse. The variation of the enhanced load

with respect to structure deformation was investigated. As in ASCE 41, structural deformation is

considered to be the best metric for approximating structural damage.

To study the variation of load increase factors (LIFs for LS analyses) and dynamic

increase factors (DIFs for NLS analyses), a series of 3-dimensional reinforced concrete and

moment-frame steel building and 2-dimensional double span beam models were developed. The

3-dimensional models were used to perform AP analyses using SAP2000, and the 2-dimensional

double-span beam models were use to simulate column removals using a Single-Degree-of-

Freedom (SODF) software. The basic procedure to determine the LIFs and DIFs consisted of

3 steps:

1. Starting with a baseline model of a building designed using conventional design loads, a

NLD AP analysis was performed for a given column removal location (Corner,

perimeter or interior). The analysis used the ASCE 7 extreme event load case without

any enhancement; the values of plastic rotation and displacement at the column removal

location were recorded.

2. Using the exact same design and column removal location in the model from Step 1, a

NLS analysis was performed, with a trial DIF applied to the ASCE extreme event load

case. The DIF was adjusted and the model was re-run until the maximum plastic rotation

24

matched the rotation measured in Step 1. This step yielded the DIF for the first design of

the first building configuration.

3. Using the same design and column removal location in the model from Step 1, a LS

analysis was performed. A trial LIF was applied to the ASCE extreme event load case.

The LIF was adjusted and the model was re-run until the maximum displacement

matched the displacement that corresponds to plastic rotation measured in Step 1. This

step yielded the LIF for the first design of the first building configuration.

After a value for the DIF and LIF had been determined for the initial design, the beams

and girders were re-designed to produce a new design using the same building configuration

(building height and bay spacing), and Steps 1 through 3 were repeated. This process is

illustrated in Figure 2 .

Figure 2. Procedure to Determine Load Increase Factors.

After a series of values of LIF and DIF were recorded for a given column removal

location, the procedure was repeated for a different column removal location using the same

building configuration (same building height and bay spacing). After all three column removal

locations had been analyzed for a particular building configuration, a new building (new building

height and bay spacing) would be analyzed following the same steps described above.

1 (NLD)

(1.0) PC ө

2 (NLS)

(DIF) PC ө

3 (LS)

(LIF) PC ΔNLD ΔNLD

25

3- Dimensional Analytical Models

The study included reinforced concrete and steel moment frame buildings. For each

building type, different configurations of building height and bay spacing were analyzed to

determine how the variation of these parameters affected the load and dynamic increase factors.

Constant material over-strength factors were employed. The ASCE 7 extreme event load case

was used for all analyses; ignoring wind and snow loads, this load combination is 1.2D + 0.5L,

where D is the dead load and L is the live load. For each model, different factors were applied to

the load to match a given deformation level.

All 3-dimensional structures were analyzed using SAP2000, a well-know structural

software commonly used in conventional design and other applications. The lateral resisting

frames for both; RC and steel buildings were modeled using “full moment connections.” The

connections at the foundations were modeled as pinned connections and secondary members

were not included. For RC buildings, the analyses were performed assuming appropriate

detailing practices for progressive collapse. In other words, it was assumed that the reinforcing

steel was continuous through the supports and that it was properly anchored at the ends to

develop the full tension capacity of the bars. Appropriate detailing practices are necessary to

allow the structure to achieve large deformations typical of progressive collapse. A more detail

description of the set-up and properties for each type of analysis follows:

Nonlinear Dynamic Analysis: As mentioned earlier, the NLD procedure is the most

comprehensive and realistic method of analysis for progressive collapse. The important

modeling parameters included the damping ratio, time step, column removal time and plastic

hinge definitions. For these analyses, these parameters were taken as follows:

26

- Damping ratio = 1%

- Column removal and time step = 1/20 of the structure’s natural period

- Analysis Time Step = 1/200 of the structure’s natural period

The natural period was determined by performing a Modal Analysis, and selecting the

Natural Period (T) of the dominating mode of vibration. The dominating mode of vibration was

selected visually based on the location of the column removal and the motion of the structure.

Non-linearity was included in the model by using “Plastic hinges” at both ends and mid-

point of every beam element and at both ends of the column elements. No hinge offsets were

used. The hinge definition for the steel buildings was taken from the pre-set options available in

SAP2000 corresponding to the hinge definition given in Chapter 5 (Steel Frame Structures) of

ASCE 41. A graphical representation of this hinge definition is shown next in Figure 3.

Figure 3. Steel Frame Building Hinge Definition (ASCE 41).

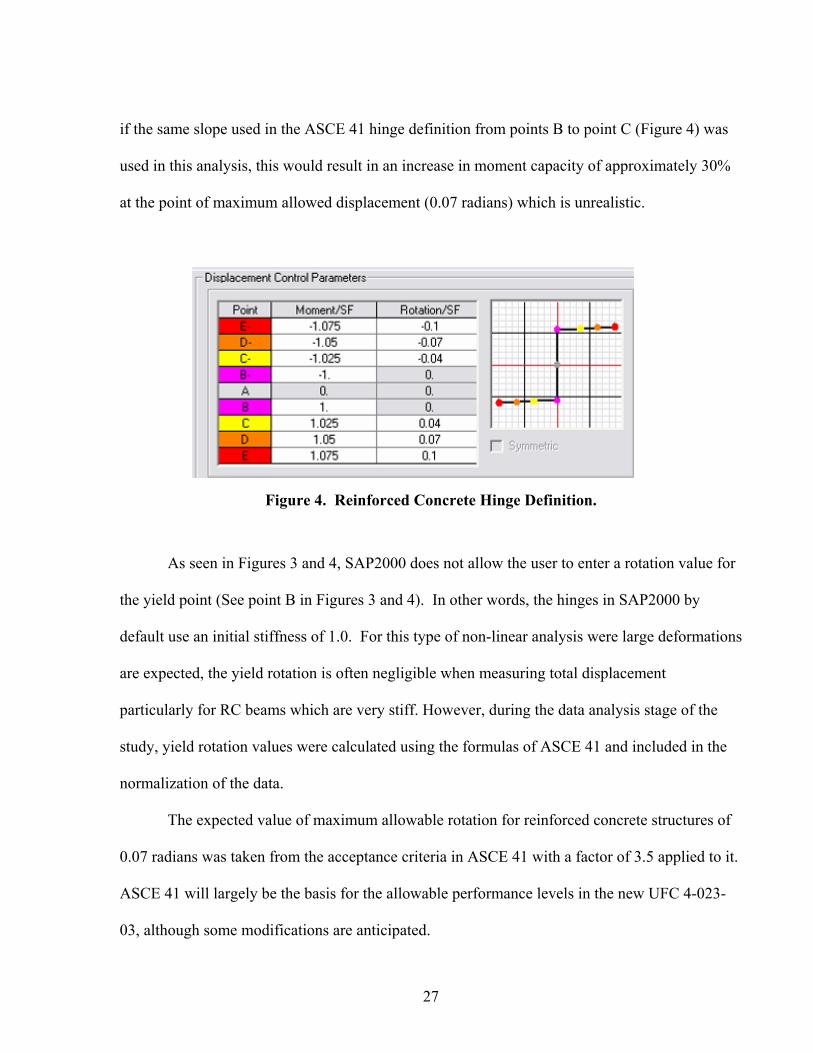
For reinforced concrete structures, the hinge definition (Figure 4) was designed to allow

strain hardening of 5% at the point expected to be the maximum allowed rotation (0.07 radians).

This differs from the 10% hardening at 0.025 radians used in ASCE 41. The reason for this

difference is the larger allowable rotations used in progressive collapse analyses. In other words,

27

if the same slope used in the ASCE 41 hinge definition from points B to point C (Figure 4) was

used in this analysis, this would result in an increase in moment capacity of approximately 30%

at the point of maximum allowed displacement (0.07 radians) which is unrealistic.

Figure 4. Reinforced Concrete Hinge Definition.

As seen in Figures 3 and 4, SAP2000 does not allow the user to enter a rotation value for

the yield point (See point B in Figures 3 and 4). In other words, the hinges in SAP2000 by

default use an initial stiffness of 1.0. For this type of non-linear analysis were large deformations

are expected, the yield rotation is often negligible when measuring total displacement

particularly for RC beams which are very stiff. However, during the data analysis stage of the

study, yield rotation values were calculated using the formulas of ASCE 41 and included in the

normalization of the data.

The expected value of maximum allowable rotation for reinforced concrete structures of

0.07 radians was taken from the acceptance criteria in ASCE 41 with a factor of 3.5 applied to it.

ASCE 41 will largely be the basis for the allowable performance levels in the new UFC 4-023-

03, although some modifications are anticipated.

28

The deformation limits for Life Safety for steel buildings were taken identical to those

values in Table 5-6 of ASCE 41. However, for reinforced concrete (RC) buildings, the Life

Safety values in Table 6-7 were increased by a factor of 3.5. This is because, within the seismic

community, the RC limits in FEMA are considered to be conservative [EERI/PEER 2006] and,

in the blast-design community, the allowable deformation criteria in ASCE 41 are much smaller

than indicated by test data from blast- and impact-loaded RC structural members. In addition, the

conservative ASCE 41 RC criteria are based on backbone curves derived from cyclic testing of

members and joints, whereas only one-half cycle is applied in a progressive collapse event.

To simulate the instantaneous removal a given column, the column was replaced with

equivalent reactions obtained from a static analysis of the building using the progressive collapse

load applied to the entire structure (1.2D + 0.5L). These loads were then removed over time to

simulate the removal of the column. This process is shown in Figure 5.

Figure 5. NLD Analysis Procedure.

1.2D +0.5L

=

1.2D +0.5L

Equivalent loads

Equivalent loads

t

1

0(1/20) T

Removal

29

After the equivalent column loads were removed, the building was allowed to deform until it

settled and the maximum plastic rotation was recorded for all hinges formed during the analyses.

(See Figure 6)

Figure 6. Results of NLD Procedure.

Nonlinear Static Analysis: In the NLS analysis, non-linearity was modeled identically as

with the NLD model discussed above (with plastic hinges). However, to simulate the column

removal, the “non-linear staged construction” feature in SAP2000 was used (Figure 7). The

model was analyzed in three stages using 100 steps per stage.

Structure Settles

Plastic Hinge Rotation

30

Figure 7. Stage Construction Setup. In the first stage, the progressive collapse load case was applied to all elements; see

Figure 8.

Figure 8. NLS Analysis Stage 1. In the second stage, only the bays around the loss location were loaded with the

progressive collapse load, multiplied by the trial DIF, as shown in Figure 9.

31

Figure 9. NLS Stage 2, Load Around Loss Location.

In the final stage, the column was removed and the analysis was run until the building

settled; see Figure 10. After the building had settled, the maximum plastic hinge rotations were

recorded in a similar manner to the NLD case. If the maximum plastic rotation was not equal to

the plastic rotation from the NLD analysis, the DIF was adjusted and the analysis was repeated,

until the plastic rotations from the NLD and NLS analyses matched within 2%.

Figure 10. NLS Stage 3, Nonlinear Analysis of Structure Response.

Non-linear Hinge Rotation

32

Linear Static Analysis: The linear static procedure is simpler in that it does not require

the use of dynamic and non-linear parameters such as time step, damping ratio, plastic hinges,

etc. In these analyses, two sets of loads were applied to the building model, from which a

column has been removed: one set of loads was applied to the whole structure, and the other set

of loads, which includes the trial LIF, was applied only around the column removal locations as

directed in UFC 4-023-03.

The analysis was run using the linear elastic option in SAP2000 and the displacement was

measured at the loss location. If the displacement did not match the displacement from the NLD

procedure, the trial LIF was adjusted and the analysis was run again.

The rigidity (EI) of the steel beams was modeled implicitly in SAP2000 by defining the

size and Elastic Modulus (E) of the structural components. For concrete however, the rigidity

must be explicitly modified to account for the effects of cracking at large rotations, which tend to

reduce the effective Moment of Inertia (I). Therefore, the Rigidity of the RC linear models was

taken as 0.5 E I as indicated in Table 6.5 of ASCE 41.

33

3-Dimmensinal Building Designs

The baseline for all 3D models (reinforced concrete and steel moment frame) was taken

from the examples in the current UFC 4-023-03. This floor plan is illustrated in next figure.

Figure 11. Typical Floor Plan.

Using the floor plan illustrated above, different building configurations were obtained by

varying the bay spacing and the number of stories. After the building designs were finalized, the

variation and magnitude of load and dynamic increase factors was investigated following the

procedure explained above. AP analyses were performed in all buildings. For each building, the

AP analysis included corner exterior and interior column removals. The following table presents

a summary of all the AP analyses included in this research. As seen in Table 1, a total of 408 AP

analyses were performed in this research study.

5 @ 25ft

4 @

25f

t

Spandrel

Spandrel-girder

Girder

Interior Beam

34

Table 1. Study Matrix of AP Analyses Performed

Alternate Path Analysis Performed for Steel Moment Frame Buildings

Building Configuration Corner Column Removal Perimeter Column Removal Interior Column

Removal

3-Story, 25 ft bay Spacing 12 12 24 10-Story, 25 ft bay Spacing 12 9 30

Total AP Analyses for

Steel Buildings 99

Alternate Path Analysis Performed for Reinforced Concrete Buildings

Building Configuration Corner Column Removal Perimeter Column Removal Interior Column

Removal

3-Story, 20 ft bay Spacing 15 30 15 10-Story, 20 ft bay Spacing 15 30 18

* 10-Story, 20 ft bay Spacing 15 33 15 10-Story, 25 ft bay Spacing 9 9 9

** 10-Story, 25 ft bay Spacing 9 9 9 *** 10-Story, 25 ft bay Spacing 9 9 9

3-Story, 25 ft bay Spacing 0 0 21 10-Story, 30 ft bay Spacing 21 0 0

Total AP Analyses for RC

Buildings 309 * Denotes removal of column at 6th floor level ** Denotes removal of column at 5th floor level *** Denotes removal of column at 8th floor level

The loads and material properties used for the analyses are presented in the following

tables.

Table 2. Design Loads

DL 49 psf (steel)

54 psf (RC) Includes self weight of members not modeled

SDL 35 psf Includes partitions, ceiling weight and mechanical equipment

CL 15 psf Cladding load, only in the perimeter

LL 50 psf Live load

The DL values in Table 2 are abased on lightweight RC floor systems as indicated in the

examples of the current UFC 4-023-03.

35

Table 3. Steel Buildings, Material Properties f’y 52.5 ksi Includes 1.05 over-strength factor

E 29,000 ksi Modulus of elasticity

Table 4. Reinforced Concrete Buildings, Material Properties f’c 6.25 ksi Includes 1.25 over-strength factor

f’y 75 ksi Reinforcing steel w/ 1.25 over-strength factor

In progressive collapse, strength increase factors applied to material properties are used to

account for the average ratio of the actual static strength of materials to the nominal specified

value, and the rapid application of the load. These values are specified in the UFC 4-023-03

guidelines as 1.05 for structural steel, and 1.25 for concrete compressive strength and reinforcing

steel.

2-Dimmensional Models

Additional data needed to be generated to develop a larger baseline for comparison of

results. However, AP analysis using 3D models can be time consuming and expensive.

Therefore, additional data was generated using simple 2-dimensional double-span models

analyzed with a SDOF approach. The models consisted of a fixed-fixed double span beam. The

analysis procedure was similar to the procedure describe previously for 3D models. First, the

double span was loaded with a given design load, and the deflection of the beam was calculated

performing a non-linear dynamic analysis using time integration techniques and SDOF approach.

Next, the LIF corresponding to that design was calculated using the following equation:

wkLIF Δ

=* , where k is the beam stiffness calculated per ASCE 41 procedures, Δ is the

calculated displacement, and w is the applied load. The DIF was calculated as follows:

36

1)( +−

=R

wRDIF , where R is the ultimate flexural resistance of the beam. The ultimate

resistance R is calculated using the equations for maximum moment of single span beams and

solving for “w.” When divided “w” by tributary area, R can be expresses in units of psi. An

example follows for a simply supported beam.

2**8

LBMpR = , where w is the beam loading in lb/ft, and L is the beam span. Mp is the cross-

sectional moment capacity and B is the tributary width.

An illustration of the 2D models and their typical resistance function is presented next in

schematic form.

Figure 12. 2-Dimmensional Models

Different beam configurations were obtained by changing the beam stiffness and ultimate

resistance. The concrete compressive strength used for the 2-dimensional analyses was 5000 psi,

and the steel yield strength was 75 ksi. A total of 48 column removal simulations were

Span, LSpan, L

Load, w

Δ

k

R

Beam Resistance

Deflection

37

performed using 2D double-span beam models and SDOF approach. Table presented below

presents a summary of all the simulations performed.

Table 5. 2-Dimmensionals Analyses Double-Span Beam Configuration

Beam Span (ft)

Width (in)

Depth (in)

Avg. Steel Area (in2)

Stiffness k

(psi/in)

Ultimate Resistance, R

(psi)

Number of Column

Removals

20 24 20 1.45 1.20 0.58 8 20 24 20 1.70 1.22 0.68 8 20 24 20 2.40 1.29 0.95 8 20 12 30 0.98 1.98 0.58 8 20 12 30 1.30 2.05 0.76 8 20 12 30 1.70 2.13 0.98 8

Total No. of

runs 48

38

CHAPTER 6: ANALYSIS RESULTS AND DATA ANALYSIS

A sample of the result tables generated for the 3-dimensional building analyses is

presented next. Similar tables were generated for the 2-dimensional study. A complete set of

results is provided in the Appendix.

Each table below lists the different structural designs that were evaluated for the

particular building configuration and column removal location. The first column in each table

indicates the “design” number. As mentioned earlier, a baseline design model was developed

using standard structural design software and then modified (Re-Design 1 through X) by

changing the beam, spandrel, girder, and spandrel-girder cross-sections to acquire different

displacements and plastic rotations. The following columns provide the section properties and

geometry of the structural elements framing into the loss location for that particular “re-design”.

Finally, the last three columns on the right hand side of the tables show the displacement and/or

plastic rotation measured with the NLD analysis and the values of DIF and LIF obtained from

the NLS and LS analysis of that particular “re-design.”

Table 6. Steel Building, 10-Story - 25 ft Bay, Interior Column Removal

Run # Frame Section Section Zx Ix Weight NLD, Disp.

NLD Plastic

Rotation

NLS DIF

LS LIF

sap name in^3 in^4 lb in rad Re-Design 6 Girder w24x76 200 2100. 76 3.77 0.0021 1.82 1.80

Int. Beam w18x60 123 984. 60 Re-Design 5 Girder w21x73 172 1600. 73 4.76 0.0080 1.68 1.84

Int. Beam w16x57 105 758. 57 Re-Design 4 Girder w24x62 153 1550. 62 4.80 0.0103 1.60 1.90

Int. Beam w21x44 95.4 843. 44 Re-Design 3 Girder w24x55 134 1350. 55 6.42 0.0167 1.44 2.12

Int. Beam w18x40 78.4 612. 40 Re-Design 2 Girder w18x60 123 984. 60 8.99 0.0260 1.38 2.37

Int. Beam w16x40 72.9 518. 40 Baseline Girder w18x55 112 890. 55 11.44 0.0349 1.29 2.84

Int. Beam w18x35 66.5 510. 35 Re-Design 1 Girder w16x57 105 758. 57 16.91 0.0532 1.23 3.49

Int. Beam w14x38 61.5 385. 38

39

Table 7. Reinforced Concrete Building, 3-Story-25 ft, Interior Column Removal

Frame Section Top. As Bot. As Steel % NLD,Plastic

Rotation. Run # sap name in^2 in^2 increment in

NLS DIF

LS LIF

Girder 4.48 2.42 --- --- Baseline Int. Beam 2.40 1.76 ---

Girder 7.84 4.24 75% 0.021 1.14 4 Re-Design 1 Int. Beam 4.20 3.08 75%

Girder 7.48 4.04 67% 0.028 1.09 5.5 Re-Design 2 Int. Beam 4.01 2.94 67%

Girder 7.17 3.87 60% 0.042 1.06 8 Re-Design 3 Int. Beam 3.84 2.82 60%

Girder 7.03 3.80 57% 0.053 1.05 10 Re-Design 4 Int. Beam 3.77 2.76 57%

Girder 6.94 3.75 55% 0.064 1.05 13 Re-Design 5 Int. Beam 3.72 2.73 55%

Girder 6.81 3.68 52% 0.086 1.04 17 Re-Design 6 Int. Beam 3.65 2.68 52%

Girder 6.76 3.65 51% 0.097 1.04 19 Re-Design 7 Int. Beam 3.62 2.66 51%

The results obtained from the 3-dimensional and 2-dimensional models presented above

were use to generate plots with proposed normalized factors for static procedures.

Analysis of Data from Linear Static AP Analyses (LIF)

The results obtained in this study demonstrated that LIFs are a function of section

properties and geometry; particularly for RC sections where stiffness can vary significantly

based on rebar placement and section aspect ratio. For steel structures, the LIFs results were

found to be less dependent on the selected section. The plot in Figure 13 shows the LIF plotted

versus plastic rotation for reinforced concrete for selected analysis cases. Figure 15 shows the

LIF plotted versus total rotation for steel sections. Plastic rotation was use to plot the LIF values

for concrete sections to be consistent with ASCE41 which treats reinforced concrete sections as

having negligible elastic rotations. Steel sections are in general more ductile and exhibit more

40

considerable elastic rotations; hence, the LIF values for steel sections are plotted against total

rotation as in ASCE 41.

Figure 13. LIF vs Plastic Rotation for RC sections

The dispersion of data points in Figure 13 represents the LIFs strong dependence on

section properties for the concrete members mentioned earlier. In concrete members, two beams

with the same moment capacity can have different stiffness values. Therefore, when analyzed as

non-linear members, the maximum calculated deflection will be similar since, most of the

response will be plastic as concrete members exhibit small elastic rotations. However, if the

same two beams are analyzed as linear members, the stiffness (not the capacity) becomes the

controlling parameter, and the factor applied to the stiffness of the member to achieve the same

deflection calculated with the non-linear analysis could differ significantly. This is illustrated

0.0

10.0

20.0

30.0

40.0

50.0

60.0

70.0

80.0

90.0

100.0

0.000 0.010 0.020 0.030 0.040 0.050 0.060 0.070 0.080 0.090 0.100

Plastic Rotation (rad)

LIF

3-story interior column removal (20x22 girder, L=240, rho=.0037) 3-story interior column removal (30x20 girder, L=300, rho~.01)3-story interior column removal (20x22 girder, L=240, rho~.004) 3-story corner column removal (6x15 girder, L=240, rho~.03)3-Story, 4x8 bay, L=240, Mid Side Long, 1st 3-Story, 4x8 bay, L=240, Corner, 1st3-Story, 4x8 bay, L=240, Interior, 1st 3-Story, 4x8 bay, L=240, Mid Side Short, 1st3-Story, 4x8 bay, L=240, Interior Corner, 1st 3-Story, 4x8 bay, L=240, Corner Optimized, 1st10-Story, 4x8 bays, L=240, Mid Side Long 1st 10-Story, 4x8 bays, L=240, Corner 1st10-Story, 4x8 bays, L=240, Interior 1st 10-Story, 4x8 bays, L=240, Mid Side Short 1st10-Story, 4x8 bays, L=240, Interior Corner 1st 10-Story, 4x8 bays, L=240, Mid Side Long 6th10-Story, 4x8 bays, L=240, Corner 6th 10-Story, 4x8 bays, L=240, Interior 6th10-Story, 4x8 bays, L=240, Mid Side Short Edge 6th 10-Story, 4x8 bays, L=240, Interior Corner 6th10-Story, 4x8 bays, L=240, Corner 9th 10-Story, 4x8 bays, L=300, Mid Side Long 1st10-Story, 4x8 bays, L=300, Corner 1st 10-Story, 4x8 bays, L=300, Interior 1st10-Story, 4x8 bays, L=300, Mid Side Long 5th 10-Story, 4x8 bays, L=300, Corner 5th10-Story, 4x8 bays, L=300, Interior 5th 10-Story, 4x8 bays, L=300, Mid Side Long 8th10-Story, 4x8 bays, L=300, Corner 8th 10-Story, 4x8 bays, L=300, Interior 8th

41

next. CIF, in the figure below, corresponds to the artificial increase factor applied to the stiffness

of the element to allow it to achieve the same displacement as in the plastic response.

Figure 14. RC Sections Strong Dependence on Stiffness

Figure 15. LIF vs. Total Rotation for Steel Sections

0.00

1.00

2.00

3.00

4.00

5.00

6.00

0.000 0.020 0.040 0.060 0.080 0.100 0.120 0.140

Total Rotation (rad)

LIF

3-story corner column removal3-story interior column removal3-story perimeter column removal10-story interior column removal3-story perimeter column; rev hinge

K1, MK2, M

Δ

K2

K1

RPlastic Response

Δ

K2

K1

kElastic Response

CIF 1

CIF 2

42

Because the LIFs need to be applied consistently to different structural elements

regardless of their stiffness or shape, the data above was normalized and plotted against the ratio

of total rotation to the calculated yield rotation of the element, which corresponds to the m-

factors in ASCE 41. A more detail explanation about the use of m-factors if provided in

Chapter 7. The plots in Figure 16 and 17 show the same LIF data when normalized by yield

rotation.

Figure 16. Normalized LIF for RC sections

0.0

10.0

20.0

30.0

40.0

50.0

60.0

70.0

80.0

90.0

0.0 10.0 20.0 30.0 40.0

Norm Rotation (total rot/member yield) (m factor)

LIF

3-story interior column removal (20x22 girder, L=240, rho=.0037) 3-story interior column removal (30x20 girder, L=300, rho~.01)3-story interior column removal (20x22 girder, L=240, rho~.004) 3-story corner column removal (6x15 girder, L=240, rho~.03)3-Story, 4x8 bay, L=240, Mid Side Long, 1st 3-Story, 4x8 bay, L=240, Corner, 1st3-Story, 4x8 bay, L=240, Interior, 1st 3-Story, 4x8 bay, L=240, Mid Side Short, 1st3-Story, 4x8 bay, L=240, Interior Corner, 1st 3-Story, 4x8 bay, L=240, Corner Optimized, 1st10-Story, 4x8 bays, L=240, Mid Side Long 1st 10-Story, 4x8 bays, L=240, Corner 1st10-Story, 4x8 bays, L=240, Interior 1st 10-Story, 4x8 bays, L=240, Mid Side Short 1st10-Story, 4x8 bays, L=240, Interior Corner 1st 10-Story, 4x8 bays, L=240, Mid Side Long 6th10-Story, 4x8 bays, L=240, Corner 6th 10-Story, 4x8 bays, L=240, Interior 6th10-Story, 4x8 bays, L=240, Mid Side Short Edge 6th 10-Story, 4x8 bays, L=240, Interior Corner 6th10-Story, 4x8 bays, L=240, Corner 9th 10-Story, 4x8 bays, L=300, Mid Side Long 1st10-Story, 4x8 bays, L=300, Corner 1st 10-Story, 4x8 bays, L=300, Interior 1st10-Story, 4x8 bays, L=300, Mid Side Long 5th 10-Story, 4x8 bays, L=300, Corner 5th10-Story, 4x8 bays, L=300, Interior 5th 10-Story, 4x8 bays, L=300, Mid Side Long 8th10-Story, 4x8 bays, L=300, Corner 8th 10-Story, 4x8 bays, L=300, Interior 8thFit LIF eqnASCE41(Mod) Concrete Beams (Primary) ASCE41(Mod) Concrete Beams (Primary/NC shear steel)ASCE41(Mod) Concrete Beams (Secondary) ASCE41Concrete Columns (P/Agf'c < 0.1)ASCE41Concrete Columns (P/Agf'c > 0.4) Linear (Fit)

recommended eqnLIF = 1.2m + 0.8

Linear fit to all data except 10-story L=240: y = 1.1259x + 0.87 R2 = 0.987

43

Figure 17. Normalized LIF for Steel Sections

Using the normalized plots of Figure 16 and 17, a linear fit of the data was performed to

support the development of equations for determination of the required LIF for LS procedures.

The linear fit for RC sections and steel sections had an R-square value of 0.99 and 0.95

respectively, which indicate a good fit. The linear fit for each plot is shown in black. However,

to provide conservatism and avoid effective multipliers (LIF/m) smaller than 1.0, the linear fits

were shifted up and manually adjusted. Therefore, an “upper bound fit” (the line in red) which

encloses the envelope of data is the final recommended equation. The upper bound fit provides a

conservative factor on the effective multiplier of 1.05 for RC and 1.35 for steel sections. A

larger factor was required for steel sections to keep all effective multipliers greater than 1.0.

This is demonstrated in Tables 8 and 9. Also presented on the plots are “typical” acceptance

0.0

1.0

2.0

3.0

4.0

5.0

6.0

7.0

8.0

9.0

10.0

11.0

12.0

0.0 1.0 2.0 3.0 4.0 5.0 6.0 7.0 8.0 9.0 10.0 11.0 12.0 13.0 14.0

Norm Rotation (total rotation/member yield)) (m factor)

LIF

3-story corner column removal3-story interior column removal3-story perimeter column removal10-story interior column removal3-story perimeter column; rev hingeFitLIF FitASCE41 "Compact" Beams and Columns (P/Pcl < 2.0)ASCE41 "Non-Compact" BeamsASCE41 "Compact" Columns (P/Pcl = 0.5)ASCE41 (Mod) WUF for W18ASCE41 (Mod) RBS for W18ASCE41 "Compact" Secondary BeamsASCE41 (Mod) Shear Tab for W14Linear (Fit)

recommended eqn:LIF = 0.9m + 1.1

Linear fit to data: y = 0.6674x + 0.8027 R2 = 0.9493

44

values for both concrete and steel components. This illustrates the general range of applicability

of the fits. The equations are:

RC Structures: LIF = 1.2 m + 0.80

Steel Structures: LIF = 0.9 m + 1.1

m is the component m-factor. The m-factor will be a direct multiplier on the expected

component strengths given in the revised UFC 4-023-03, which will correspond to the existing

values for acceptance criteria on ASCE 41. Although the LIF values from Figure 16 and 17

seem high, it should be noted that the “effective multiplier” on the static load case for LS

analysis is the LIF divided by the m-factor (LIF/m). This is demonstrated next.

General Equation: (LIF) x (PC load) < m x (Capacity)

LS: (LIF/m) x (PC load) < (Capacity)

The m-factors in ASCE41 need to be modified before being added to the revised UFC 4-

023-03. However, for reinforced concrete, the proposed m-factors will nominally range from 5

to 20 after adjustments are made to account for the conservatism in the existing concrete criteria

of ASCE 41. For steel, the range of m-factors will be a function of the component but will not be

significantly different from the existing ASCE41 criteria, i.e., 1.5 to 7. Hence, final “effective

load multipliers” for LS analysis will generally vary from 1.0 to 2.0, never below 1.0.

45

Table 8 LIF Data for RC Sections

Typical LIF LIF/m LIF LIF/m Consv. Factor

m-factors Upp.

Bound Upp.

Bound Linear

Fit Linear Fit (Up. Bound/ Lin.

fit) 5 6.80 1.36 6.52 1.30 1.04 6 8.00 1.33 7.65 1.28 1.05 7 9.20 1.31 8.78 1.25 1.05 8 10.40 1.30 9.91 1.24 1.05 9 11.60 1.29 11.04 1.23 1.05

10 12.80 1.28 12.17 1.22 1.05 11 14.00 1.27 13.30 1.21 1.05 12 15.20 1.27 14.43 1.20 1.05 13 16.40 1.26 15.56 1.20 1.05 14 17.60 1.26 16.69 1.19 1.05 15 18.80 1.25 17.82 1.19 1.05 16 20.00 1.25 18.95 1.18 1.06 17 21.20 1.25 20.08 1.18 1.06 18 22.40 1.24 21.21 1.18 1.06 19 23.60 1.24 22.34 1.18 1.06 20 24.80 1.24 23.47 1.17 1.06

Table 9 LIF Data for Steel Sections

Typical LIF LIF/m LIF LIF/m Consv. Factor

m-factors Upp.

Bound Upp.

Bound Linear Fit Linear Fit (Up. Bound/ Lin.

fit) 1 2.00 2.00 1.47 1.47 1.36

1.5 2.45 1.63 1.81 1.20 1.36 2 2.90 1.45 2.14 1.07 1.36

2.5 3.35 1.34 2.48 0.99 1.35 3 3.80 1.27 2.81 0.94 1.35

3.5 4.25 1.21 3.15 0.90 1.35 4 4.70 1.18 3.48 0.87 1.35

4.5 5.15 1.14 3.82 0.85 1.35 5 5.60 1.12 4.15 0.83 1.35

5.5 6.05 1.10 4.49 0.82 1.35 6 6.50 1.08 4.82 0.80 1.35

6.5 6.95 1.07 5.16 0.79 1.35 7 7.40 1.06 5.49 0.78 1.35

46

Analysis of Data from Nonlinear Static Analysis (DIF)

In NLS procedures, non-linearity is explicitly included in the model by use of plastic

hinges and the capacity of the members does not need to be adjusted using m-factors. Therefore,

the values of DIFs obtained in this study are a direct representation of the dynamic multiplier on

the load. The application of the DIFs is demonstrated below:

General Equation: (DIF) x (PC load) < (Reaction)

NLS Deformation-Controlled: (DIF) x (PC load) = өmeasured < өallowed

NLS Force-Controlled: (DIF) x (PC load) < (Capacity)

The results showed a range of variation in DIFs with respect to plastic rotation from 1.00

to 1.40 for concrete buildings and 1.20 to 1.85 for steel buildings as illustrated in Figure 18 and

19, respectively.

Figure 18. DIFs for RC Buildings

0.8

0.9

1

1.1

1.2

1.3

1.4

1.5

0.000 0.010 0.020 0.030 0.040 0.050 0.060 0.070 0.080 0.090 0.100

Plastic Rotation

DIF

3-Story, 4x8 bay, L=240, Mid Side Long, 1st 3-Story, 4x8 bay, L=240, Corner, 1st3-Story, 4x8 bay, L=240, Interior, 1st 3-Story, 4x8 bay, L=240, Mid Side Short, 1st3-Story, 4x8 bay, L=240, Interior Corner, 1st 10-Story, 4x8 bays, L=240, Mid Side Long 1st10-Story, 4x8 bays, L=240, Corner 1st 10-Story, 4x8 bays, L=240, Interior 1st10-Story, 4x8 bays, L=240, Mid Side Short 1st 10-Story, 4x8 bays, L=240, Interior Corner 1st10-Story, 4x8 bays, L=240, Mid Side Long 6th 10-Story, 4x8 bays, L=240, Corner 6th10-Story, 4x8 bays, L=240, Interior 6th 10-Story, 4x8 bays, L=240, Mid Side Short Edge 6th10-Story, 4x8 bays, L=240, Interior Corner 6th 10-Story, 4x8 bays, L=240, Corner 9th10-Story, 4x8 bays, L=300, Mid Side Long 1st 10-Story, 4x8 bays, L=300, Corner 1st10-Story, 4x8 bays, L=300, Interior 1st 10-Story, 4x8 bays, L=300, Mid Side Long 5th10-Story, 4x8 bays, L=300, Corner 5th 10-Story, 4x8 bays, L=300, Interior 5th10-Story, 4x8 bays, L=300, Mid Side Long 8th 10-Story, 4x8 bays, L=300, Corner 8th10-Story, 4x8 bays, L=300, Interior 8th 10-Story, 4x8 bays, L=360, Corner 1st10-Story, 4x8 bays, L=360, Corner 1st Additional data)

47

Figure 19. DIFs for Steel Buildings

DIF’s needed to be expressed in terms of “allowable plastic rotation” since these are

values that an analyst is expected to look up in the tables provided in the revised progressive

collapse guidelines. Therefore, the DIF’s were plotted as a function of the ratio of allowable

plastic rotation to member yield rotation. Figure 20 and 21 show the DIFs values from Figure

and 19 normalized using the ratio of allowable plastic rotation over the calculated yield rotation

of the (typically) beam element.

1

1.1

1.2

1.3

1.4

1.5

1.6

1.7

1.8

1.9

2

0.000 0.050 0.100 0.150 0.200

Plastic Rotation (rad)

DIF

3-story corner column removal

3-story interior column removal

3-story perimeter column removal

10-story interior column removal

48

Figure 20 . Normalized DIFs for RC Buildings

Figure 21. Normalized DIFs for Steel Buildings

1

1.1

1.2

1.3

1.4

1.5

1.6

1.7

1.8

1.9

2

0.0 2.0 4.0 6.0 8.0 10.0

Norm Rotation (allowable plastic rot/member yield)

DIF

3-story corner column removal

3-story perimeter column removal

3-story interior column removal

10-story interior column removal

DIF Fit

recommended eqn:DIF = 1.08+(0.76/((allow plastic rot/member yield)+0.83))

R2 = 0.83

0.8

0.9

1

1.1

1.2

1.3

1.4

1.5

1.6

1.7

1.8

1.9

2

0.0 5.0 10.0 15.0 20.0 25.0 30.0 35.0 40.0

Norm Rotation (allowable plastic rot/member yield)

DIF

3-Story, 4x8 bay, L=240, Mid Side Long, 1st 3-Story, 4x8 bay, L=240, Corner, 1st3-Story, 4x8 bay, L=240, Interior, 1st 3-Story, 4x8 bay, L=240, Mid Side Short, 1st3-Story, 4x8 bay, L=240, Interior Corner, 1st 10-Story, 4x8 bays, L=240, Mid Side Long 1st10-Story, 4x8 bays, L=240, Corner 1st 10-Story, 4x8 bays, L=240, Interior 1st10-Story, 4x8 bays, L=240, Mid Side Short 1st 10-Story, 4x8 bays, L=240, Interior Corner 1st10-Story, 4x8 bays, L=240, Mid Side Long 6th 10-Story, 4x8 bays, L=240, Corner 6th10-Story, 4x8 bays, L=240, Interior 6th 10-Story, 4x8 bays, L=240, Mid Side Short Edge 6th10-Story, 4x8 bays, L=240, Interior Corner 6th 10-Story, 4x8 bays, L=240, Corner 9th10-Story, 4x8 bays, L=300, Mid Side Long 1st 10-Story, 4x8 bays, L=300, Corner 1st10-Story, 4x8 bays, L=300, Interior 1st 10-Story, 4x8 bays, L=300, Mid Side Long 5th10-Story, 4x8 bays, L=300, Corner 5th 10-Story, 4x8 bays, L=300, Interior 5th10-Story, 4x8 bays, L=300, Mid Side Long 8th 10-Story, 4x8 bays, L=300, Corner 8th10-Story, 4x8 bays, L=300, Interior 8th 10-Story, 4x8 bays, L=360, Corner 1st10-Story, 4x8 bays, L=360, Corner 1st Additional data) Fit

recommended eqn:DIF = 1.04+(0.45/((allow plastic rot/member yield)+0.48))

R2 = 0.80

49

Similar to the LIFs for LS procedures, a mathematical fit of the data in Figure 20 and 21

was performed to develop the equations that represent the required DIF for NLS procedures.

The mathematical fit was performed manually using the general equation for a rectangular

hyperbola. The data from Figures 20 and 21 was used to adjust the equations until an acceptable

fit was determined. The R-square values calculated for the RC sections and steel sections were

0.80 and 0.83 respectively. The DIF fits determined in this study are purposely shifted towards

the upper limit of the data to add a level of conservatism. Because of this, the calculated R-

square values are lower than typical acceptable values for R-square in the range of 0.9-1.0.

These equations are presented next:

RC Structures: 48.0

45.004.1+

+=

yieldall

DIF

θθ

Steel Structures: 83.0

76.008.1+

+=

yieldall

DIF

θθ

In the equations above, the allowable plastic rotation (θall) is taken from the nonlinear

acceptance criteria tables in the revised guidelines, which will be taken from ASCE41. For RC

concrete structures, the allowable plastic rotations in ASCE 41 will be modified to account for

the extra conservatism included due to the cyclic nature of seismic events. θyield, corresponds to

the yield rotation of the member calculated per ASCE 41 procedures.

50

CHAPTER 7: PROPOSED PROCEDURES FOR USING LIFS AND DIFS IN

STATIC AP ANALYSES

After developing new equations for the application of LIFs and DIFs, procedures were

developed for the application of these factors. These procedures are described next.

Linear Static AP Procedure

The LS approach will often be used in concept development of complex structural

systems required to satisfy AP requirements. The proposed procedure for using LIF values to

perform these preliminary analyses is presented next:

1. Select most restrictive structural component (smallest m-factor) from bays immediately

around loss location at all floor levels. Separate analyses will be performed for

horizontal flexural (beam element and connection) and vertical column components.

2. Select the m-factor corresponding to the element found on step 1 from tables given in the

revised UFC 4-023-03.

3. Using the m-factor from step 2, and the LIF equations developed previously; calculate the

LIF to be used in the LS analysis.

4. Divide the LIF from step 3 by m-factor from step 2 to determine the “effective load

multiplier.”

5. Apply “effective load multiplier” (LIF/m) to progressive collapse load (1.2D + 0.5L) and

perform LS analysis.

The proposed procedure presented above is inherently conservative as it uses the most

restrictive component around the loss location to select the m-factor used to calculate the

51

effective load multiplier for the analysis. Therefore, the majority of the structural components

are designed or analyzed for a progressive collapse load larger than that required for that

particular member based on the equations developed for LIF presented in this document. This is

demonstrated next for a corner column removal on a typical steel moment frame structure. The

following example assumes that the structural elements in the corner bay are the same at all floor

levels.

Figure 22. LIF for LS Analysis

As seen in the example of Figure 22, based on the corresponding m-factors and the

equations developed for calculating LIFs, the W14x38 beam and WUF connection should be

W14x38 W

14x3

8

Loss Location W12x190 Corner Column

WUF Fully Restrained Connection

W14x38

m-factor (CP value from Table 5-5 ASCE41) = 8.0

LIF = LIF = 0.9(8) + 1.1 = 8.3

LIF/m (Effective Load Multiplier) = 8.3 / 8.0 = 1.04

General Equation: 1.04 (PC load) < (Capacity)

W12x190 Column

m-factor (LS value from Table 5-5 ASCE41, P/Pcl < 0.20) = 6.0

LIF = 0.9(6) + 1.1 = 6.5

LIF/m (Effective Load Multiplier) = 6.5 / 6.0 = 1.08

General Equation: 1.08 (PC load) < (Capacity) WUF Connection

m-factor (CP value from Table 5-5 ASCE41) = 3.9 – 0.043d = 3.30

LIF = 0.9(3.30) + 1.1 = 4.07

LIF/m (Effective Load Multiplier) = 4.07 / 3.34 = 1.22 (CONTROLS OVER BEAM)

General Equation: 1.22 (PC load) < (Capacity)

Typical Corner bay

W12x190 Columns

52

designed for a load equal to 122% of the progressive collapse load. The 122% for the WUF

connection controls as it is larger than the 104% multiplier for the beam. The effective load

multiplier calculated for the W12x190 column, 108%, could be used if the designer chooses to

perform a separate LS analysis to check columns.

Comparison with existing UFC 4-023-03

The LS procedure for AP analysis of progressive collapse given in the existing UFC 4-

023-03 specifies a factor of 2.0 to be applied directly on the load without increasing the capacity

of the members, sine there are no m-factors in the existing UFC criteria. Therefore, if expressed

in terms of this study, the existing UFC criteria use an LIF of 2.0 and an “m-factor” of 1.0. This

results in an effective multiplier per UFC 4-023-03 of 2.0. This value is overly conservative

when compared to 1.22, the calculated value in Figure 22.

Non-Linear Static AP Procedure

In the new PC guidelines, the practitioner will select a value of DIF to be applied to the

progressive collapse load combination in NLS procedures based on the ratio of allowable plastic

rotation to yield rotation specified in the acceptance criteria. The proposed steps to select the DIF

for NLS analysis are presented next:

1. Select most restrictive structural component (smallest allowable plastic rotation) from

bays immediately around loss location at all floor levels. Separate analyses will be

performed for horizontal flexural (beam element and connection) and vertical column

components.

53

2. Calculate the yield rotation of the flexural element or column using procedures in ASCE

41. Calculate the ratio of allowable plastic rotation to this yield rotation for the element

found on step 1.

3. Using the ratio from step 2, and the DIF equations developed previously; calculate the

DIF to be used in the NLS analysis.

4. Apply DIF to the progressive collapse load and performed NLS analysis.

An example of how to select the appropriate DIF for a NLS analysis of a RC

structure is presented next.

Figure 23. DIF for NLS Analysis

Spandrel

Typical Floors Roof

Spandrel

Gird

er

Loss Location

Roof Spandrel

Roo

f Gird

er

Loss Location

Roof Spandrel

Top. Columns

Bot. Columns

Spandrel

Typical Floors Roof

Spandrel

Gird

er

Loss Location

Roof Spandrel

Roo

f Gird

er

Loss Location

Roof Spandrel

Top. Columns

Bot. Columns

Spandrels:

b=15 in, d=24 in, As = 5.3 in2, As’ = 5.3 in2

allowable plastic rotation (ASCE41, table 6-11, NC) = 0.05 rad

Calculated yield rotation = 0.0096 rad

DIF = 1.04+(0.45/((0.05/0.0096)+0.48)) = 1.12

Girder:

b=10 in, d=24 in, As = 4.5 in2, As’ = 4.5 in2

allowable plastic rotation (ASCE41, table 6-11, C) = 0.0625 rad

Calculated yield rotation = 0.0118 rad

DIF = 1.04+(0.45/((0.0625/0.0118)+0.48)) = 1.12

Bot. Columns:

b=30 in, d=30 in, As = 15.24 in2

allowable plastic rotation (ASCE41, table 6-11, P / Ag f’c > 0.4,

C) = 0.015 rad

Calculated yield rotation = 0.0007 rad

DIF = 1.04+(0.45/((0.015/0.0007)+0.48)) = 1.07

Roof Spandrels:

b=15 in, d=24 in, As=4.17 in2, As’=4.17 in2

allowable plastic rotation (ASCE41, table 6-11, NC) = 0.05 rad

Calculated yield rotation = 0.0110 rad

DIF = 1.04+(0.45/((0.05/0.0110)+0.48)) = 1.13 (CONTROLS) Girder:

b=10 in, d=24 in, As=2.62 in2, As’=2.62 in2

allowable plastic rotation (ASCE41, table 6-11, C) = 0.0625 rad

Calculated yield rotation = 0.0073 rad

DIF = 1.04+(0.45/((0.0625/0.0073)+0.48)) = 1.09

Top. Columns:

b=18 in, d=18 in, As=10.16 in2

allowable plastic rotation (ASCE41, table 6-11, P / Ag f’c > 0.4,

C) = 0.015 rad

Calculated yield rotation = 0.0019

DIF = 1.04+(0.45/((0.015/0.0019)+0.48)) = 1.09 (CONTROLS)

54

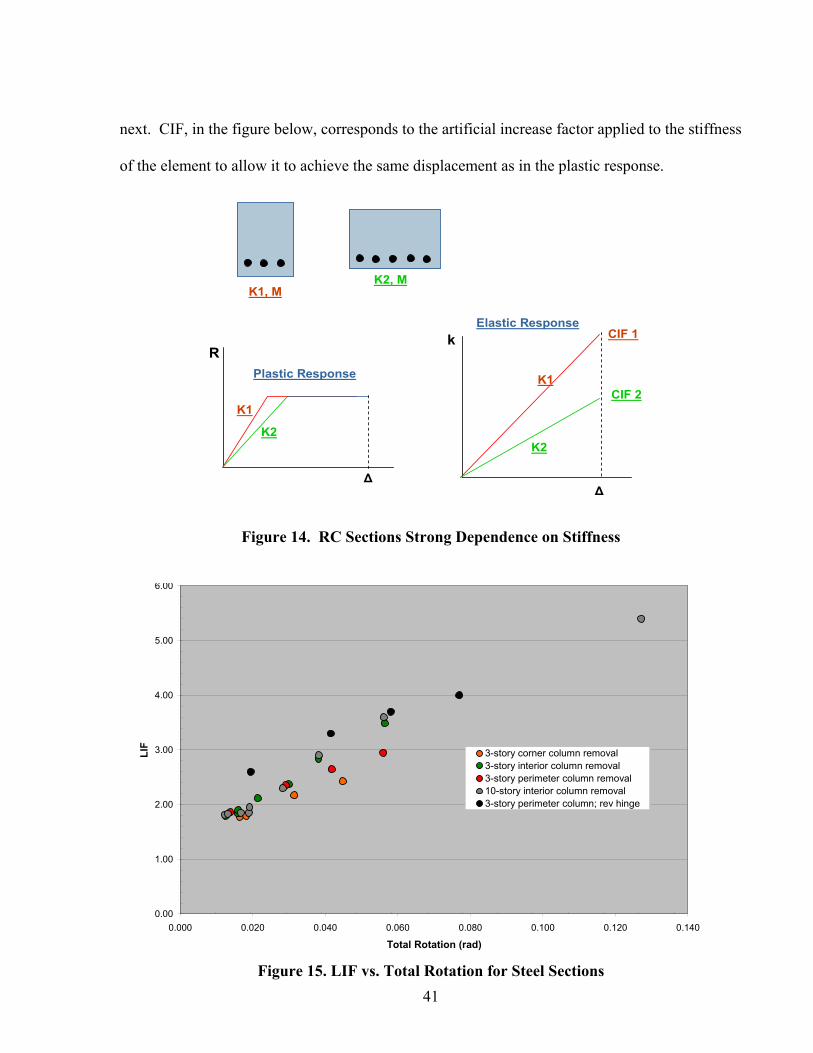
As seen in the example of Figure 23, based the equation developed for calculating DIFs,

the roof spandrels should be designed or analyzed for a load of 113% of the progressive collapse

load. The DIF calculated for all the other components is less than 1.13, therefore, 1.13 is the

multiplier on the load used for the progressive collapse analysis or design of this building.

Comparison with existing UFC 4-023-03

Similarly to the LS procedure, the NLS procedure for AP analysis of progressive collapse

given in the existing UFC 4-023-03 specifies a factor of 2.0 to be applied directly on the load.

Capacity increase factors are not necessary in NLS procedures. Therefore, the 2.0 value per the

UFC criteria is overly conservative when compared to 1.13, the calculated value in Figure 23.

55

CHAPTER 8: CONCLUSIONS AND RECOMMENDATIONS

The dynamic multiplier on the load of 2.0 currently used for AP analysis can produce

overly conservative designs. This is particularly true for cases where large deformations are

allowed. The results of this study showed that for RC buildings, the dynamic multiplier on the

load (DIF) ranges from 1.05 to 1.75, which is significantly less than 2.0, particularly at

normalized rotations greater than 1. Similarly, for steel buildings analyzed, the dynamic

multiplier on the load (DIF) ranged from 1.2 to 1.8.

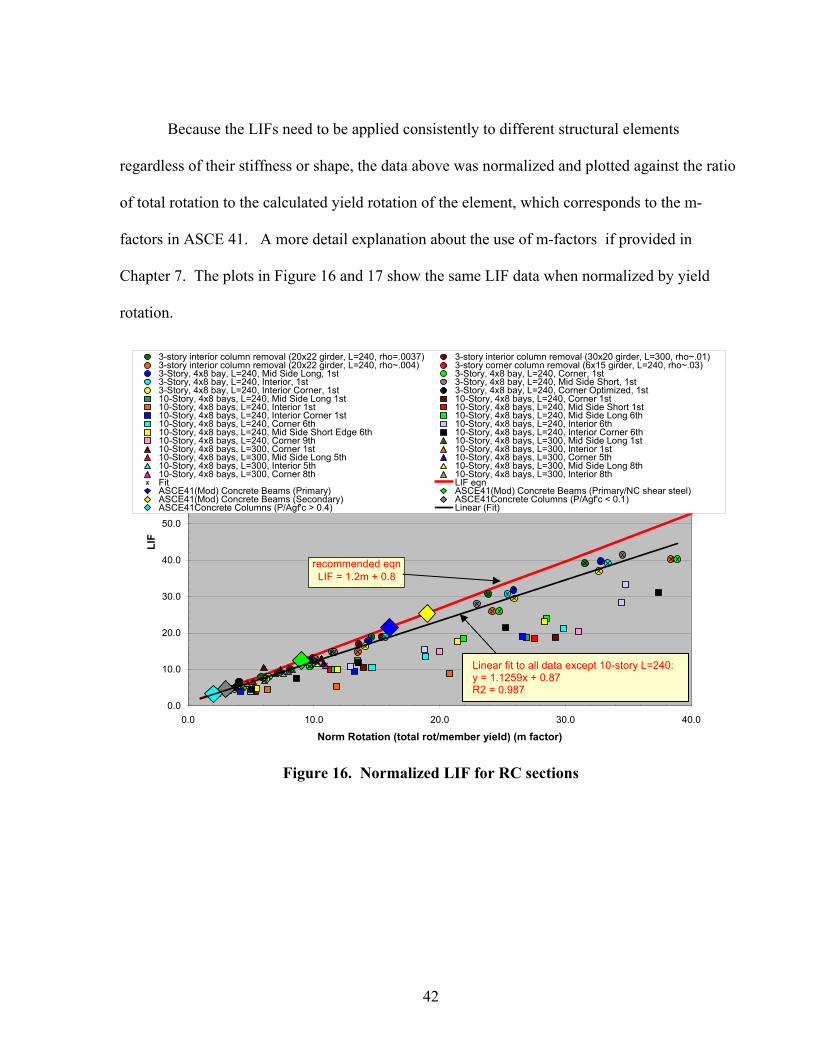
Additionally, the results from the analyses of LS procedures demonstrated that LIFs

depend on the total deformation as was expected, but are also strongly dependent on section

properties. As there are no LIFs in the current guidelines, there is no direct comparison that can

be made between the conservatism of the existing approach and the proposed use of the LIFs.

However, the current DoD and GSA procedures use a load multiplier of 2.0, and capacity

increase factors (DCRs only in GSA) of between 1.5 and 2.0. Therefore, while the LIFs

proposed in this work are greater than 2.0, the CIFs (m-factors) are much larger than the capacity

increase factors used in the current criteria. Hence, relative conservatism must be evaluated

based on the effective multiplier on the load. With a multiplier of 2.0 and a capacity increase

factor of 1.0, the effective multiplier in the current UFC criteria, for example, is 2.0. For an LIF

of 20 in the current research, the corresponding m-factor for a RC section would be 16, and the

effective multiplier is 1.25, significantly smaller than the current criteria. This reinforces that the

current UFC 4-023-03 could be considered overly conservative. Likewise, for the GSA criteria if

a DCR value of 2.0 is coupled with the specified load increase factor in the current criteria of

2.0. The resulting effective multiplier would be 1.0, which could be under-conservative.

56

BIBLIOGRAPHY

ASCE/SEI 41-06 Prestandard and Commentary for the Seismic Rehabilitation of Buildings, American Society of Civil Engineers, 2007. ASCE/SEI 7-05 Minimum Design Loads for Buildings and Other Structures, American Society of Civil Engineers, Reston, VA, 2006 Biggs, John M., “Introduction to Structural Dynamics” A McGraw-Hill Publication: McGraw-Hill Inc., 1964 Design of Buildings to Resist Progressive Collapse, Unified Facilities Criteria (UFC) 4-023-03, Department of Defense (DoD), January, 2005. EERI/PEER, 2006, New Information on the Seismic Performance of Existing Concrete Buildings, Seminar Notes, Earthquake Engineering Research Institute, Oakland, California. Ellingwood, B., Smilowitz, R., Dusenberry, D., Duthinh, D., Carino, N., “Best Practices for Reducing the Potential for Progressive Collapse”, August 2006 Herrle, K., Mckay, A., “Development and Application or Progressive Collapse Design Criteria for the Federal Government”, ARA Technology Review, Volume 2, Number 2, June 2006 Mckay, A., Marchand, K., Stevens, D., “Dynamic Increase Factors (DIF) and Load Increase Factors (LIF) for Alternate Path Procedures”, A Report prepared for UFC 4-023-03 Steering Group, January, 2008 Powell, G., “Progressive Collapse: Case Studies Using Nonlinear Analysis”, SEAOC Annual Convention, Monterrey, 2004. Progressive Collapse Analysis and Design Guidelines for New Federal Office Buildings and Major Modernizations Projects, U.S General Services Administration (GSA), 2003. Ruth, P., “Dynamic Considerations in Progressive Collapse Guidelines,” MS Thesis, Department of Civil Engineering, University of Texas at Austin, 2004.

57

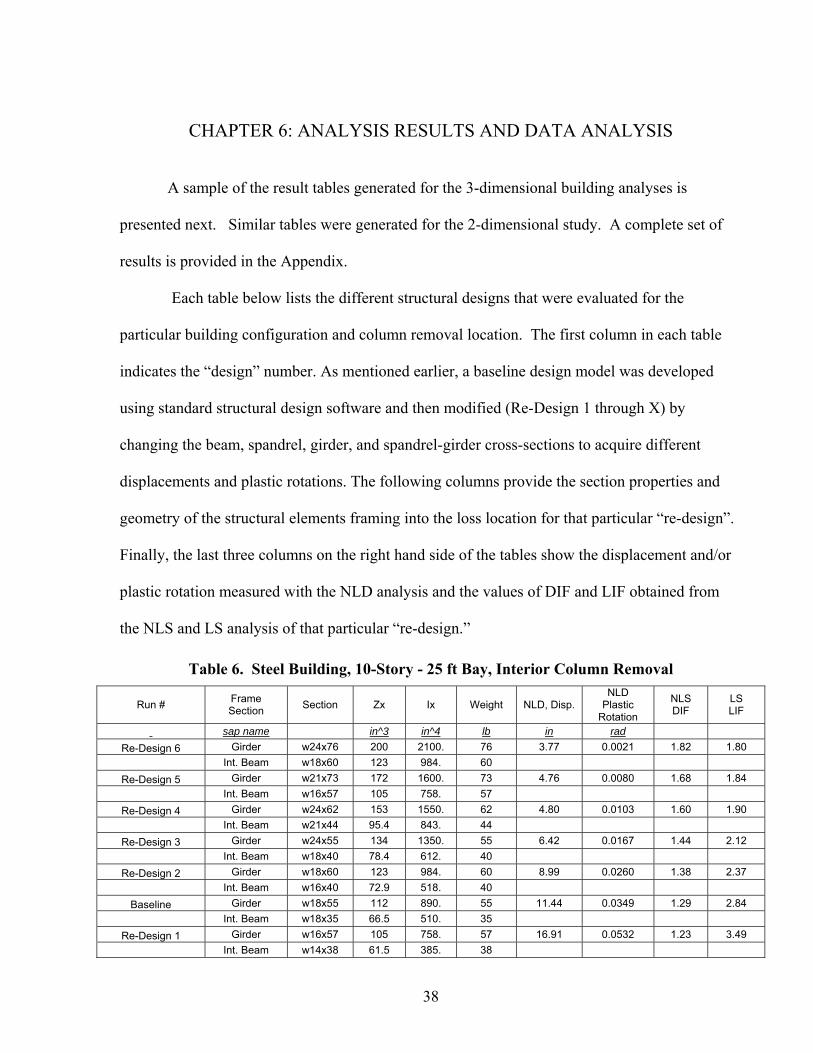
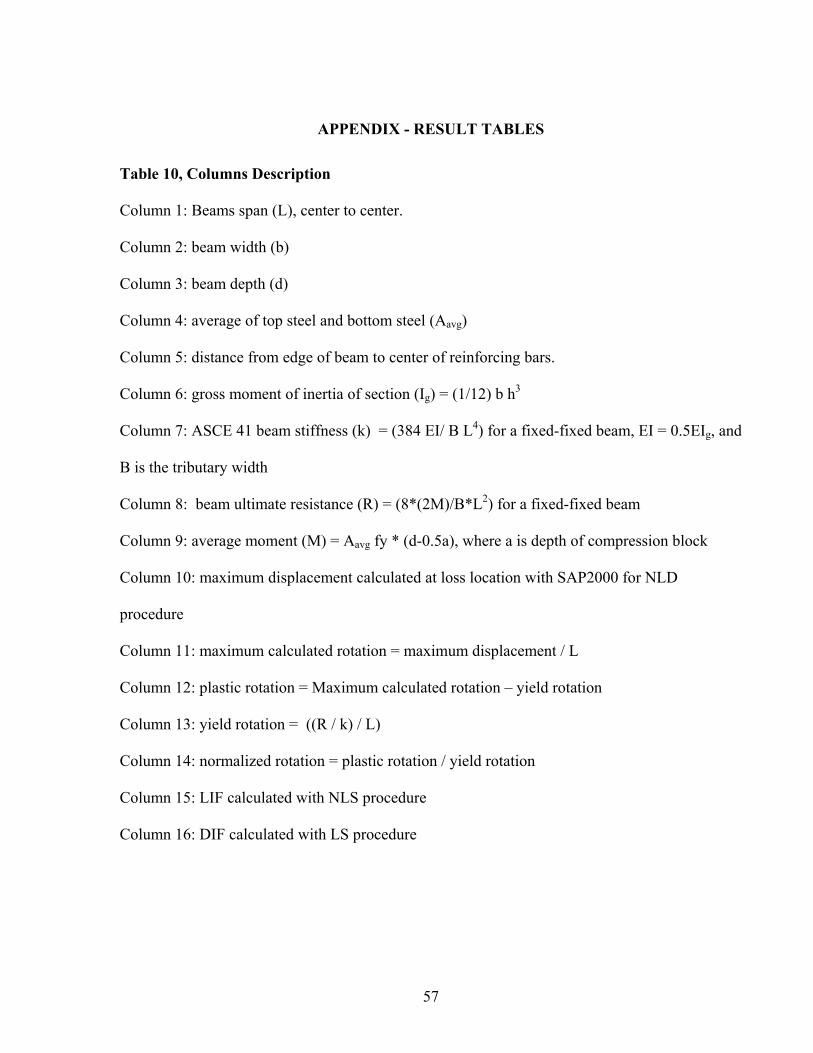
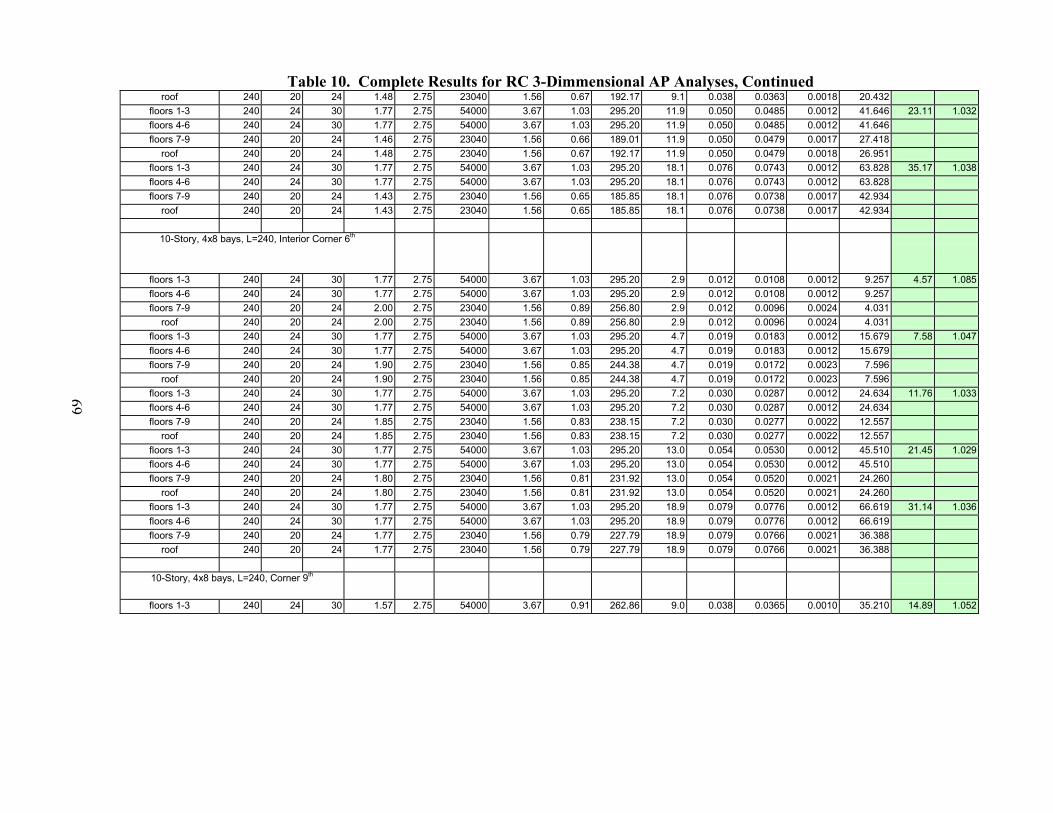
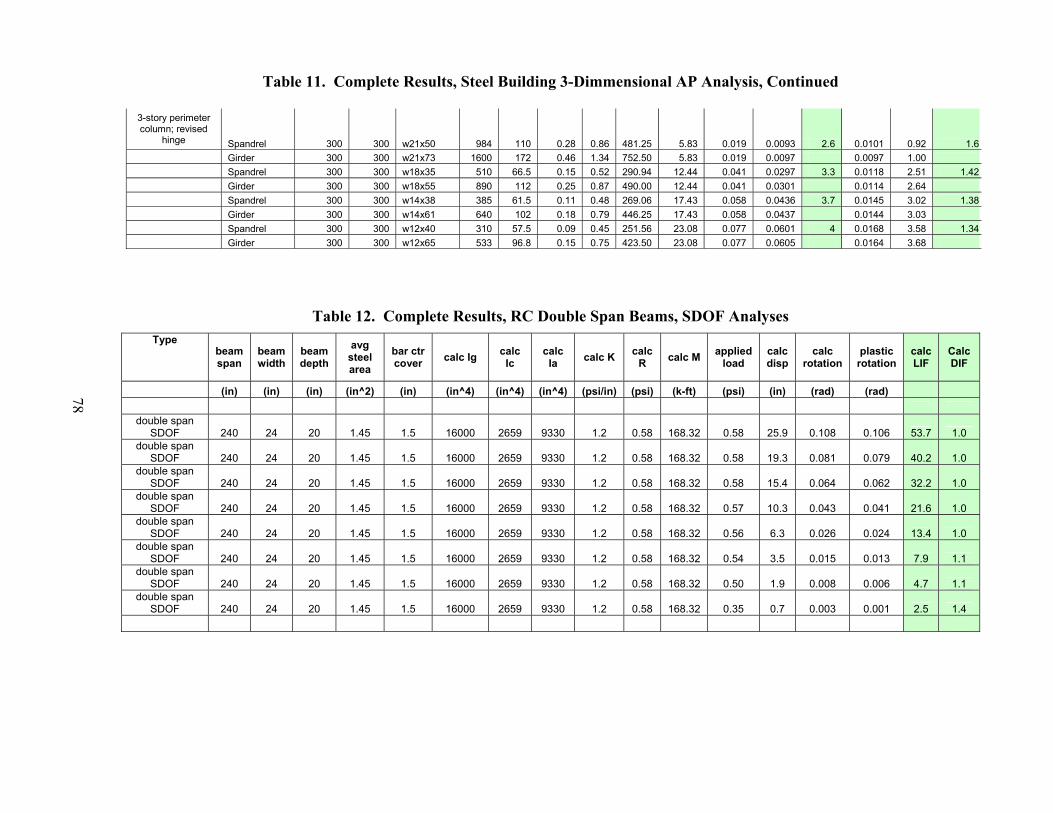
APPENDIX - RESULT TABLES

Table 10, Columns Description

Column 1: Beams span (L), center to center.

Column 2: beam width (b)

Column 3: beam depth (d)

Column 4: average of top steel and bottom steel (Aavg)

Column 5: distance from edge of beam to center of reinforcing bars.

Column 6: gross moment of inertia of section (Ig) = (1/12) b h3

Column 7: ASCE 41 beam stiffness (k) = (384 EI/ B L4) for a fixed-fixed beam, EI = 0.5EIg, and

B is the tributary width

Column 8: beam ultimate resistance (R) = (8*(2M)/B*L2) for a fixed-fixed beam

Column 9: average moment (M) = Aavg fy * (d-0.5a), where a is depth of compression block

Column 10: maximum displacement calculated at loss location with SAP2000 for NLD

procedure

Column 11: maximum calculated rotation = maximum displacement / L

Column 12: plastic rotation = Maximum calculated rotation – yield rotation

Column 13: yield rotation = ((R / k) / L)

Column 14: normalized rotation = plastic rotation / yield rotation

Column 15: LIF calculated with NLS procedure

Column 16: DIF calculated with LS procedure

58

Table 11, Columns Description

Column 1: Beams span (L), center to center.

Column 2: beam Spacing (B)

Column 3: steel section

Column 4: Moment of Inertia (I)

Column 5: plastic section modulus (Z).

Column 6: ASCE 41 beam stiffness (k) = (384 EI/ B L4) for a fixed-fixed beam, EI = 0.5EIg, and

B is the tributary width

Column 7: beam ultimate resistance (R) = (8*(2M)/B*L2) for a fixed-fixed beam

Column 8: moment capacity (M) = Z* fy

Column 9: maximum displacement calculated at loss location with SAP2000 for NLD procedure

Column 10: maximum calculated rotation = maximum displacement / L

Column 11: plastic rotation = Maximum calculated rotation – yield rotation

Column 12: LIF calculated with NLS procedure

Column 13: yield rotation = ((R / k) / L)

Column 14: normalized rotation = plastic rotation / yield rotation

Column 15: DIF calculated with LS procedure

59

Table 12, Columns Description

Column 1: Beams span (L), center to center.

Column 2: beam width (b)

Column 3: beam depth (d)

Column 4: average of top steel and bottom steel (Aavg)

Column 5: distance from edge of beam to center of reinforcing bars.

Column 6: gross moment of inertia of section (Ig) = (1/12) b h3

Column 7: cracked moment of inertia (Icr)

Column 8: average moment of inertia (Iavg)

Column 9: beam stiffness (k) = (384 EIavg/ B L4) for a fixed-fixed beam, B is the tributary width

Column 10: beam ultimate resistance (R) = (8*(2M)/B*L2) for a fixed-fixed beam

Column 11: average moment (M) = Aavg fy * (d-0.5a), where a is depth of compression block

Column 12: applied load in psi

Column 13: maximum displacement calculated at loss location with SDOF approach

Column 14: maximum calculated rotation = maximum displacement / L

Column 15: plastic rotation = Maximum calculated rotation – yield rotation

Column 16: LIF calculated with NLS procedure

Column 17: DIF calculated with LS procedure

Table 10. Complete Results for RC 3-Dimmensional AP Analyses Type beam

span beam width

beam depth

avg steel area

bar ctr cover

calc beam Ig

ASCE 41 beam

stiffness

calc beam R

calc beam M

SAP calc disp

calc rotation

plastic rotation

ASCE41 beam yield

rotation

norm rotation

calc LIF calc DIF

(in) (in) (in) (in^2) (in) (in^4) (psi/in) (psi) (k-ft) (in) (rad) (rad) (rad) 3-story, 20 ft bay,

interior 240 20 22 2.21 2.5 17747 1.21 0.90 258.46 2.4 0.010 0.0071 0.0031 2.284 4.70 1.129

240 20 22 2.09 2.5 17747 1.21 0.85 244.63 4.1 0.017 0.0142 0.0029 4.837 8.00 1.072 240 20 22 1.99 2.5 17747 1.21 0.81 233.57 9.8 0.041 0.0381 0.0028 13.586 19.00 1.038 240 20 22 1.95 2.5 17747 1.21 0.80 229.27 15.8 0.066 0.0629 0.0028 22.859 30.70 1.039 240 20 22 1.93 2.5 17747 1.21 0.79 226.63 20.6 0.086 0.0831 0.0027 30.550 39.20 1.044

3-Story, 25 ft bay, Interior

Girder 300 30 20 6.04 2 20000 0.45 1.11 625.61 6.3 0.021 0.0128 0.0083 1.533 4.00 1.14Int. Beam 300 24 20 3.64 2 16000 0.36 0.68 385.14 6.3 0.021 0.0147 0.0064 2.292 4.00

Girder 300 30 20 5.76 2 20000 0.45 1.07 599.35 8.4 0.028 0.0200 0.0080 2.504 5.50 1.09Int. Beam 300 24 20 3.47 2 16000 0.36 0.66 368.60 8.4 0.028 0.0218 0.0061 3.559 5.50

Girder 300 30 20 5.52 2 20000 0.45 1.02 576.19 12.5 0.042 0.0339 0.0077 4.418 8.00 1.06Int. Beam 300 24 20 3.33 2 16000 0.36 0.63 354.04 12.5 0.042 0.0357 0.0059 6.054 8.00

Girder 300 30 20 5.42 2 20000 0.45 1.01 566.21 15.9 0.053 0.0456 0.0075 6.043 10.00 1.05Int. Beam 300 24 20 3.27 2 16000 0.36 0.62 347.78 15.9 0.053 0.0473 0.0058 8.174 10.00

Girder 300 30 20 5.35 2 20000 0.45 0.99 559.54 19.2 0.064 0.0566 0.0075 7.599 13.00 1.05Int. Beam 300 24 20 3.22 2 16000 0.36 0.61 343.59 19.2 0.064 0.0583 0.0057 10.203 13.00

Girder 300 30 20 5.24 2 20000 0.45 0.98 549.51 25.8 0.086 0.0788 0.0073 10.772 17.00 1.04Int. Beam 300 24 20 3.16 2 16000 0.36 0.60 337.31 25.8 0.086 0.0805 0.0056 14.343 17.00

Girder 300 30 20 5.21 2 20000 0.45 0.97 546.16 29.2 0.097 0.0901 0.0073 12.385 19.00 1.04Int. Beam 300 24 20 3.14 2 16000 0.36 0.60 335.21 29.2 0.097 0.0918 0.0056 16.446 19.00

3-story (over-reinforced), 20 ft bay,

corner

240 6 15 2.21 2.5 1688 0.11 0.47 136.70 12.7 0.053 0.0357 0.0173 2.071 5.10

240 6 15 2.13 2.5 1688 0.11 0.46 132.81 16.5 0.069 0.0518 0.0168 3.090 6.62

60

Table 10. Complete Results for RC 3-Dimmensional AP Analyses, Continued

3-story, 20 ft bay interior

240 20 22 1.57 2.5 17747 1.21 0.65 185.91 7.2 0.030 0.0278 0.0022 12.476 14.80

240 20 22 1.50 2.5 17747 1.21 0.62 177.85 19.7 0.082 0.0798 0.0021 37.389 40.30 240 20 22 1.53 2.5 17747 1.21 0.63 181.31 12.6 0.053 0.0504 0.0022 23.179 26.00 240 20 22 1.60 2.5 17747 1.21 0.66 189.35 5.3 0.022 0.0197 0.0023 8.671 10.80 240 20 22 1.74 2.5 17747 1.21 0.71 205.38 2.5 0.010 0.0078 0.0025 3.169 5.00

3-Story, 4x8 bay, L=240, Mid Side Long, 1st

ext 240 20 22 1.77 2.75 17747 1.21 0.71 205.70 2.4 0.010 0.0076 0.0025 3.085 5.22 1.128int 240 20 22 1.99 2.75 17747 1.21 0.80 230.46 2.4 0.010 0.0073 0.0028 2.646ext 240 20 22 1.65 2.75 17747 1.21 0.67 192.51 5.7 0.024 0.0214 0.0023 9.273 12.53 1.044int 240 20 22 1.77 2.75 17747 1.21 0.71 205.70 5.7 0.024 0.0213 0.0025 8.615ext 240 20 22 1.65 2.75 17747 1.21 0.67 192.51 8.1 0.034 0.0314 0.0023 13.606 17.80 1.041int 240 20 22 1.72 2.75 17747 1.21 0.70 200.41 8.1 0.034 0.0313 0.0024 13.030ext 240 20 22 1.57 2.75 17747 1.21 0.64 183.45 14.5 0.060 0.0580 0.0022 26.358 31.75 1.039int 240 20 22 1.77 2.75 17747 1.21 0.71 205.70 14.5 0.060 0.0578 0.0025 23.399ext 240 20 22 1.57 2.75 17747 1.21 0.64 183.45 18.1 0.075 0.0732 0.0022 33.245 39.67 1.042int 240 20 22 1.72 2.75 17747 1.21 0.70 200.41 18.1 0.075 0.0730 0.0024 30.348

3-Story, 4x8 bay, L=240, Corner, 1st

ext 240 20 22 1.74 2.75 17747 1.21 0.70 202.67 2.5 0.010 0.0078 0.0024 3.225 5.00 1.161int 240 20 22 1.64 2.75 17747 1.21 0.66 191.38 2.5 0.010 0.0080 0.0023 3.474ext 240 20 22 1.60 2.75 17747 1.21 0.65 186.85 5.3 0.022 0.0197 0.0022 8.801 10.80 1.068int 240 20 22 1.65 2.75 17747 1.21 0.67 192.51 5.3 0.022 0.0197 0.0023 8.513ext 240 20 22 1.57 2.75 17747 1.21 0.64 183.45 7.2 0.030 0.0279 0.0022 12.657 14.80 1.053int 240 20 22 2.36 2.75 17747 1.21 0.94 271.21 7.2 0.030 0.0268 0.0033 8.238ext 240 20 22 1.53 2.75 17747 1.21 0.62 178.91 12.6 0.053 0.0505 0.0021 23.502 26.00 1.042int 240 20 22 1.50 2.75 17747 1.21 0.61 175.51 12.6 0.053 0.0505 0.0021 23.978ext 240 20 22 1.50 2.75 17747 1.21 0.61 175.51 19.7 0.082 0.0799 0.0021 37.901 40.30 1.047int 240 20 22 1.50 2.75 17747 1.21 0.61 175.51 19.7 0.082 0.0799 0.0021 37.901

61

Table 10. Complete Results for RC 3-Dimmensional AP Analyses, Continued 3-Story, 4x8 bay, L=240, Interior, 1st

ext 240 20 22 1.77 2.75 17747 1.21 0.71 205.70 2.4 0.010 0.0077 0.0025 3.126 4.70 1.129int 240 20 22 2.21 2.75 17747 1.21 0.89 255.01 2.4 0.010 0.0071 0.0031 2.328ext 240 20 22 1.77 2.75 17747 1.21 0.71 205.70 4.1 0.017 0.0147 0.0025 5.942 8.00 1.072int 240 20 22 2.09 2.75 17747 1.21 0.84 241.37 4.1 0.017 0.0142 0.0029 4.916ext 240 20 22 1.77 2.75 17747 1.21 0.71 205.70 9.8 0.041 0.0384 0.0025 15.561 19.00 1.038int 240 20 22 1.99 2.75 17747 1.21 0.80 230.46 9.8 0.041 0.0381 0.0028 13.782ext 240 20 22 1.77 2.75 17747 1.21 0.71 205.70 15.8 0.066 0.0632 0.0025 25.593 30.70 1.039int 240 20 22 1.95 2.75 17747 1.21 0.79 226.22 15.8 0.066 0.0630 0.0027 23.181ext 240 20 22 1.77 2.75 17747 1.21 0.71 205.70 20.6 0.086 0.0834 0.0025 33.759 39.20 1.044int 240 20 22 1.93 2.75 17747 1.21 0.78 223.62 20.6 0.086 0.0831 0.0027 30.975

3-Story, 4x8 bay, L=240, Mid Side Short, 1st

ext 240 20 22 1.77 2.75 17747 1.21 0.71 205.70 2.4 0.010 0.0076 0.0025 3.082 5.24 1.129int 240 20 22 1.99 2.75 17747 1.21 0.80 230.46 2.4 0.010 0.0073 0.0028 2.643ext 240 20 22 1.70 2.75 17747 1.21 0.69 198.16 5.8 0.024 0.0218 0.0024 9.165 12.80 1.051int 240 20 22 1.70 2.75 17747 1.21 0.69 198.16 5.8 0.024 0.0218 0.0024 9.165ext 240 20 22 1.65 2.75 17747 1.21 0.67 192.51 6.7 0.028 0.0255 0.0023 11.024 14.70 1.047int 240 20 22 1.77 2.75 17747 1.21 0.71 205.70 6.7 0.028 0.0253 0.0025 10.253ext 240 20 22 1.63 2.75 17747 1.21 0.66 190.25 12.7 0.053 0.0508 0.0023 22.225 28.00 1.037int 240 20 22 1.67 2.75 17747 1.21 0.68 194.77 12.7 0.053 0.0507 0.0023 21.686ext 240 20 22 1.60 2.75 17747 1.21 0.65 186.85 18.9 0.079 0.0764 0.0022 34.053 41.50 1.042int 240 20 22 1.65 2.75 17747 1.21 0.67 192.51 18.9 0.079 0.0763 0.0023 33.023

3-Story, 4x8 bay, L=240, Interior Corner, 1st

ext 240 20 22 1.77 2.75 17747 1.21 0.71 205.70 2.6 0.011 0.0083 0.0025 3.355 4.75 1.129int 240 20 22 2.21 2.75 17747 1.21 0.89 255.01 2.6 0.011 0.0077 0.0031 2.513ext 240 20 22 1.77 2.75 17747 1.21 0.71 205.70 4.0 0.017 0.0142 0.0025 5.741 7.38 1.079int 240 20 22 2.10 2.75 17747 1.21 0.84 242.93 4.0 0.017 0.0137 0.0029 4.708ext 240 20 22 1.77 2.75 17747 1.21 0.71 205.70 8.8 0.037 0.0344 0.0025 13.931 16.30 1.041int 240 20 22 2.00 2.75 17747 1.21 0.80 231.80 8.8 0.037 0.0341 0.0028 12.250ext 240 20 22 1.77 2.75 17747 1.21 0.71 205.70 20.2 0.084 0.0816 0.0025 33.051 36.94 1.046int 240 20 22 1.93 2.75 17747 1.21 0.78 223.99 20.2 0.084 0.0814 0.0027 30.271ext 240 20 22 1.77 2.75 17747 1.21 0.71 205.70 16.1 0.067 0.0646 0.0025 26.166 29.47 1.04

62

Table 10. Complete Results for RC 3-Dimmensional AP Analyses, Continued

3-Story, 4x8 bay, L=240, Corner Optimized, 1st

ext 240 6 15 2.21 2.5 1688 0.11 0.47 136.70 12.7 0.053 0.0357 0.0173 2.071 5.10 -- int 240 6 15 2.21 2.5 1688 0.11 0.47 136.70 12.7 0.053 0.0357 0.0173 2.071ext 240 6 15 2.13 2.5 1688 0.11 0.46 132.81 16.5 0.069 0.0518 0.0168 3.090 6.62 -- int 240 6 15 2.21 2.5 1688 0.11 0.47 136.70 16.5 0.069 0.0513 0.0173 2.974

10-Story, 4x8 bays, L=240, Mid Side Long 1st

floors 1-3 240 24 30 1.77 2.75 54000 3.67 1.03 295.20 1.8 0.007 0.0062 0.0012 5.290 4.323 1.152floors 4-6 240 24 30 1.77 2.75 54000 3.67 1.03 295.20 1.8 0.007 0.0062 0.0012 5.290floors 7-9 240 20 24 1.67 2.75 23040 1.56 0.75 215.46 1.8 0.007 0.0053 0.0020 2.677

roof 240 20 24 1.67 2.75 23040 1.56 0.75 215.46 1.8 0.007 0.0053 0.0020 2.677floors 1-3 240 24 30 1.70 2.75 54000 3.67 0.99 284.22 4.1 0.017 0.0161 0.0011 14.366 12.310 1.051floors 4-6 240 24 30 1.70 2.75 54000 3.67 0.99 284.22 4.1 0.017 0.0161 0.0011 14.366floors 7-9 240 20 24 1.35 2.75 23040 1.56 0.61 175.28 4.1 0.017 0.0156 0.0016 9.631

roof 240 20 24 1.35 2.75 23040 1.56 0.61 175.28 4.1 0.017 0.0156 0.0016 9.631floors 1-3 240 24 30 1.65 2.75 54000 3.67 0.96 276.01 8.1 0.034 0.0325 0.0011 29.811 18.64 1.032floors 4-6 240 24 30 1.65 2.75 54000 3.67 0.96 276.01 8.1 0.034 0.0325 0.0011 29.811floors 7-9 240 20 24 1.33 2.75 23040 1.56 0.60 172.10 8.1 0.034 0.0320 0.0016 20.083

roof 240 20 24 1.33 2.75 23040 1.56 0.60 172.10 8.1 0.034 0.0320 0.0016 20.083floors 1-3 240 24 30 1.62 2.75 54000 3.67 0.94 271.08 13.7 0.057 0.0558 0.0011 52.220 26.07 1.034floors 4-6 240 24 30 1.62 2.75 54000 3.67 0.94 271.08 13.7 0.057 0.0558 0.0011 52.220floors 7-9 240 20 24 1.31 2.75 23040 1.56 0.59 170.20 13.7 0.057 0.0553 0.0016 35.167

roof 240 20 24 1.31 2.75 23040 1.56 0.59 170.20 13.7 0.057 0.0553 0.0016 35.167floors 1-3 240 24 30 1.61 2.75 54000 3.67 0.94 269.44 18.0 0.075 0.0740 0.0011 69.596 54.34 1.038floors 4-6 240 24 30 1.61 2.75 54000 3.67 0.94 269.44 18.0 0.075 0.0740 0.0011 69.596floors 7-9 240 20 24 1.29 2.75 23040 1.56 0.58 167.02 18.0 0.075 0.0735 0.0015 47.591

roof 240 20 24 1.29 2.75 23040 1.56 0.58 167.02 18.0 0.075 0.0735 0.0015 47.591

63

Table 10. Complete Results for RC 3-Dimmensional AP Analyses, Continued 10-Story, 4x8 bays, L=240, Corner 1st

floors 1-3 240 24 30 1.77 2.75 54000 3.67 1.03 295.20 1.8 0.008 0.0064 0.0012 5.465 3.98 1.21floors 4-6 240 24 30 1.77 2.75 54000 3.67 1.03 295.20 1.8 0.008 0.0064 0.0012 5.465floors 7-9 240 20 24 1.67 2.75 23040 1.56 0.75 215.46 1.8 0.008 0.0055 0.0020 2.779

roof 240 20 24 1.67 2.75 23040 1.56 0.75 215.46 1.8 0.008 0.0055 0.0020 2.779floors 1-3 240 24 30 1.65 2.75 54000 3.67 0.96 276.01 4.2 0.017 0.0163 0.0011 14.956 10.58 1.066floors 4-6 240 24 30 1.65 2.75 54000 3.67 0.96 276.01 4.2 0.017 0.0163 0.0011 14.956floors 7-9 240 20 24 1.33 2.75 23040 1.56 0.60 172.10 4.2 0.017 0.0158 0.0016 9.918

roof 240 20 24 1.33 2.75 23040 1.56 0.60 172.10 4.2 0.017 0.0158 0.0016 9.918floors 1-3 240 24 30 1.60 2.75 54000 3.67 0.93 267.79 8.5 0.035 0.0344 0.0011 32.527 18.79 1.062floors 4-6 240 24 30 1.60 2.75 54000 3.67 0.93 267.79 8.5 0.035 0.0344 0.0011 32.527floors 7-9 240 20 24 1.30 2.75 23040 1.56 0.59 168.93 8.5 0.035 0.0339 0.0016 21.677

roof 240 20 24 1.30 2.75 23040 1.56 0.59 168.93 8.5 0.035 0.0339 0.0016 21.677floors 1-3 240 24 30 1.57 2.75 54000 3.67 0.91 262.86 11.7 0.049 0.0479 0.0010 46.170 29.40 1.039floors 4-6 240 24 30 1.57 2.75 54000 3.67 0.91 262.86 11.7 0.049 0.0479 0.0010 46.170floors 7-9 240 20 24 1.29 2.75 23040 1.56 0.58 167.02 11.7 0.049 0.0474 0.0015 30.675

roof 240 20 24 1.29 2.75 23040 1.56 0.58 167.02 11.7 0.049 0.0474 0.0015 30.675floors 1-3 240 24 30 1.57 2.75 54000 3.67 0.91 262.86 19.5 0.081 0.0803 0.0010 77.430 43.34 1.047floors 4-6 240 24 30 1.57 2.75 54000 3.67 0.91 262.86 19.5 0.081 0.0803 0.0010 77.430floors 7-9 240 20 24 1.20 2.75 23040 1.56 0.54 156.20 19.5 0.081 0.0799 0.0014 55.314

roof 240 20 24 1.20 2.75 23040 1.56 0.54 156.20 19.5 0.081 0.0799 0.0014 55.314

10-Story, 4x8 bays, L=240, Interior 1st

floors 1-3 240 24 30 2.06 2.75 54000 3.67 1.19 343.29 2.3 0.010 0.0084 0.0014 6.215 4.42 1.094floors 4-6 240 24 30 2.06 2.75 54000 3.67 1.19 343.29 2.3 0.010 0.0084 0.0014 6.215floors 7-9 240 20 24 1.67 2.75 23040 1.56 0.75 215.46 2.3 0.010 0.0078 0.0020 3.905

roof 240 20 24 1.67 2.75 23040 1.56 0.75 215.46 2.3 0.010 0.0078 0.0020 3.905floors 1-3 240 24 30 2.03 2.75 54000 3.67 1.17 337.83 4.3 0.018 0.0167 0.0013 12.527 5.37 1.041floors 4-6 240 24 30 2.03 2.75 54000 3.67 1.17 337.83 4.3 0.018 0.0167 0.0013 12.527floors 7-9 240 20 24 1.64 2.75 23040 1.56 0.73 211.25 4.3 0.018 0.0161 0.0020 8.230

roof 240 20 24 1.64 2.75 23040 1.56 0.73 211.25 4.3 0.018 0.0161 0.0020 8.230floors 1-3 240 24 30 2.00 2.75 54000 3.67 1.16 333.76 7.3 0.030 0.0290 0.0013 22.018 8.83 1.029floors 4-6 240 24 30 2.00 2.75 54000 3.67 1.16 333.76 7.3 0.030 0.0290 0.0013 22.018floors 7-9 240 20 24 1.45 2.75 23040 1.56 0.65 187.94 7.3 0.030 0.0286 0.0017 16.441

roof 240 20 24 1.45 2.75 23040 1.56 0.65 187.94 7.3 0.030 0.0286 0.0017 16.441

64

Table 10. Complete Results for RC 3-Dimmensional AP Analyses, Continued

floors 1-3 240 24 30 1.96 2.75 54000 3.67 1.14 327.24 13.6 0.057 0.0554 0.0013 42.926 15.03 1.031floors 4-6 240 24 30 1.96 2.75 54000 3.67 1.14 327.24 13.6 0.057 0.0554 0.0013 42.926floors 7-9 240 20 24 1.29 2.75 23040 1.56 0.58 167.02 13.6 0.057 0.0552 0.0015 35.720

roof 240 20 24 1.29 2.75 23040 1.56 0.58 167.02 13.6 0.057 0.0552 0.0015 35.720floors 1-3 240 24 30 1.96 2.75 54000 3.67 1.14 327.24 23.5 0.098 0.0968 0.0013 74.974 48.25 1.06floors 4-6 240 24 30 1.96 2.75 54000 3.67 1.14 327.24 23.5 0.098 0.0968 0.0013 74.974floors 7-9 240 20 24 1.29 2.75 23040 1.56 0.58 167.02 23.5 0.098 0.0965 0.0015 62.511

roof 240 20 24 1.29 2.75 23040 1.56 0.58 167.02 23.5 0.098 0.0965 0.0015 62.511

10-Story, 4x8 bays, L=240, Mid Side Short 1st

floors 1-3 240 24 30 1.77 2.75 54000 3.67 1.03 295.20 1.8 0.007 0.0063 0.0012 5.418 4.30 1.152floors 4-6 240 24 30 1.77 2.75 54000 3.67 1.03 295.20 1.8 0.007 0.0063 0.0012 5.418floors 7-9 240 20 24 1.67 2.75 23040 1.56 0.75 215.46 1.8 0.007 0.0055 0.0020 2.752

roof 240 20 24 1.67 2.75 23040 1.56 0.75 215.46 1.8 0.007 0.0055 0.0020 2.752floors 1-3 240 24 30 1.72 2.75 54000 3.67 1.00 287.50 3.5 0.015 0.0136 0.0011 11.949 9.90 1.061floors 4-6 240 24 30 1.72 2.75 54000 3.67 1.00 287.50 3.5 0.015 0.0136 0.0011 11.949floors 7-9 240 20 24 1.36 2.75 23040 1.56 0.61 176.55 3.5 0.015 0.0131 0.0016 7.997

roof 240 20 24 1.36 2.75 23040 1.56 0.61 176.55 3.5 0.015 0.0131 0.0016 7.997floors 1-3 240 24 30 1.65 2.75 54000 3.67 0.96 276.01 8.2 0.034 0.0333 0.0011 30.538 18.47 1.033floors 4-6 240 24 30 1.65 2.75 54000 3.67 0.96 276.01 8.2 0.034 0.0333 0.0011 30.538floors 7-9 240 20 24 1.33 2.75 23040 1.56 0.60 172.10 8.2 0.034 0.0328 0.0016 20.580

roof 240 20 24 1.33 2.75 23040 1.56 0.60 172.10 8.2 0.034 0.0328 0.0016 20.580floors 1-3 240 24 30 1.61 2.75 54000 3.67 0.94 269.44 14.2 0.059 0.0581 0.0011 54.701 25.74 1.025floors 4-6 240 24 30 1.61 2.75 54000 3.67 0.94 269.44 14.2 0.059 0.0581 0.0011 54.701floors 7-9 240 20 24 1.29 2.75 23040 1.56 0.58 167.02 14.2 0.059 0.0577 0.0015 37.339

roof 240 20 24 1.29 2.75 23040 1.56 0.58 167.02 14.2 0.059 0.0577 0.0015 37.339floors 1-3 240 24 30 1.57 2.75 54000 3.67 0.91 262.86 21.9 0.091 0.0903 0.0010 87.033 53.07 1.034floors 4-6 240 24 30 1.57 2.75 54000 3.67 0.91 262.86 21.9 0.091 0.0903 0.0010 87.033floors 7-9 240 20 24 1.29 2.75 23040 1.56 0.58 167.02 21.9 0.091 0.0897 0.0015 58.113

roof 240 20 24 1.29 2.75 23040 1.56 0.58 167.02 21.9 0.091 0.0897 0.0015 58.113

65

Table 10. Complete Results for RC 3-Dimmensional AP Analyses, Continued 10-Story, 4x8 bays, L=240, Interior Corner 1st

floors 1-3 240 24 30 2.36 2.75 54000 3.67 1.36 391.05 1.6 0.006 0.0049 0.0015 3.205 3.982 1.13floors 4-6 240 24 30 1.96 2.75 54000 3.67 1.14 327.24 1.6 0.006 0.0052 0.0013 4.025floors 7-9 240 20 24 1.57 2.75 23040 1.56 0.71 203.08 1.6 0.006 0.0046 0.0019 2.455

roof 240 20 24 1.57 2.75 23040 1.56 0.71 203.08 1.6 0.006 0.0046 0.0019 2.455floors 1-3 240 24 30 1.96 2.75 54000 3.67 1.13 326.51 4.6 0.019 0.0179 0.0013 13.876 9.565 1.041floors 4-6 240 24 30 1.86 2.75 54000 3.67 1.08 310.42 4.6 0.019 0.0179 0.0012 14.647floors 7-9 240 20 24 1.57 2.75 23040 1.56 0.71 203.08 4.6 0.019 0.0173 0.0019 9.205

roof 240 20 24 1.57 2.75 23040 1.56 0.71 203.08 4.6 0.019 0.0173 0.0019 9.205floors 1-3 240 24 30 1.85 2.75 54000 3.67 1.07 308.79 9.0 0.038 0.0364 0.0012 29.882 19.059 1.03floors 4-6 240 24 30 1.85 2.75 54000 3.67 1.07 308.79 9.0 0.038 0.0364 0.0012 29.882floors 7-9 240 20 24 1.57 2.75 23040 1.56 0.71 203.08 9.0 0.038 0.0357 0.0019 19.035

roof 240 20 24 1.57 2.75 23040 1.56 0.71 203.08 9.0 0.038 0.0357 0.0019 19.035floors 1-3 240 24 30 1.77 2.75 54000 3.67 1.03 295.20 13.6 0.057 0.0554 0.0012 47.585 32.184 1.032floors 4-6 240 24 30 1.77 2.75 54000 3.67 1.03 295.20 13.6 0.057 0.0554 0.0012 47.585floors 7-9 240 20 24 1.67 2.75 23040 1.56 0.75 215.46 13.6 0.057 0.0546 0.0020 27.402

roof 240 20 24 1.67 2.75 23040 1.56 0.75 215.46 13.6 0.057 0.0546 0.0020 27.402floors 1-3 240 24 30 1.74 2.75 54000 3.67 1.01 290.78 20.5 0.085 0.0841 0.0011 73.350 46.945 1.044floors 4-6 240 24 30 1.74 2.75 54000 3.67 1.01 290.78 20.5 0.085 0.0841 0.0011 73.350floors 7-9 240 20 24 1.65 2.75 23040 1.56 0.74 212.51 20.5 0.085 0.0833 0.0020 42.407

roof 240 20 24 1.65 2.75 23040 1.56 0.74 212.51 20.5 0.085 0.0833 0.0020 42.407

10-Story, 4x8 bays, L=240, Mid Side Long 6th

floors 1-3 240 24 30 1.77 2.75 54000 3.67 1.03 295.20 2.6 0.011 0.0096 0.0012 8.213 4.78 1.112floors 4-6 240 24 30 1.77 2.75 54000 3.67 1.03 295.20 2.6 0.011 0.0096 0.0012 8.213floors 7-9 240 20 24 1.67 2.75 23040 1.56 0.75 215.46 2.6 0.011 0.0087 0.0020 4.386

roof 240 20 24 1.67 2.75 23040 1.56 0.75 215.46 2.6 0.011 0.0087 0.0020 4.386floors 1-3 240 24 30 1.65 2.75 54000 3.67 0.96 276.01 5.2 0.022 0.0208 0.0011 19.078 10.05 1.052floors 4-6 240 24 30 1.65 2.75 54000 3.67 0.96 276.01 5.2 0.022 0.0208 0.0011 19.078floors 7-9 240 20 24 1.58 2.75 23040 1.56 0.71 203.71 5.2 0.022 0.0200 0.0019 10.607

roof 240 20 24 1.58 2.75 23040 1.56 0.71 203.71 5.2 0.022 0.0200 0.0019 10.607floors 1-3 240 24 30 1.65 2.75 54000 3.67 0.96 276.01 9.5 0.040 0.0386 0.0011 35.493 18.48 1.027floors 4-6 240 24 30 1.65 2.75 54000 3.67 0.96 276.01 9.5 0.040 0.0386 0.0011 35.493floors 7-9 240 20 24 1.53 2.75 23040 1.56 0.69 197.41 9.5 0.040 0.0379 0.0018 20.770

66

Table 10. Complete Results for RC 3-Dimmensional AP Analyses, Continued roof 240 20 24 1.50 2.75 23040 1.56 0.67 194.26 9.5 0.040 0.0379 0.0018 21.123

floors 1-3 240 24 30 1.65 2.75 54000 3.67 0.96 276.01 12.3 0.051 0.0501 0.0011 46.027 23.87 1.034floors 4-6 240 24 30 1.65 2.75 54000 3.67 0.96 276.01 12.3 0.051 0.0501 0.0011 46.027floors 7-9 240 20 24 1.50 2.75 23040 1.56 0.67 194.26 12.3 0.051 0.0494 0.0018 27.510

roof 240 20 24 1.50 2.75 23040 1.56 0.67 194.26 12.3 0.051 0.0494 0.0018 27.510floors 1-3 240 24 30 1.65 2.75 54000 3.67 0.96 276.01 17.1 0.071 0.0703 0.0011 64.586 33.32 1.038floors 4-6 240 24 30 1.65 2.75 54000 3.67 0.96 276.01 17.1 0.071 0.0703 0.0011 64.586floors 7-9 240 20 24 1.48 2.75 23040 1.56 0.66 191.10 17.1 0.071 0.0696 0.0018 39.417

roof 240 20 24 1.48 2.75 23040 1.56 0.66 191.10 17.1 0.071 0.0696 0.0018 39.417floors 1-3 240 24 30 1.61 2.75 54000 3.67 0.94 269.44 22.9 0.095 0.0943 0.0011 88.725 44.47 1.038floors 4-6 240 24 30 1.61 2.75 54000 3.67 0.94 269.44 22.9 0.095 0.0943 0.0011 88.725floors 7-9 240 20 24 1.45 2.75 23040 1.56 0.65 187.94 22.9 0.095 0.0936 0.0017 53.883

roof 240 20 24 1.45 2.75 23040 1.56 0.65 187.94 22.9 0.095 0.0936 0.0017 53.883

10-Story, 4x8 bays, L=240, Corner 6th

floors 1-3 240 24 30 1.77 2.75 54000 3.67 1.03 295.20 2.4 0.010 0.0089 0.0012 7.658 3.957 1.188floors 4-6 240 24 30 1.77 2.75 54000 3.67 1.03 295.20 2.4 0.010 0.0089 0.0012 7.658floors 7-9 240 20 24 1.67 2.75 23040 1.56 0.75 215.46 2.4 0.010 0.0081 0.0020 4.061

roof 240 20 24 1.67 2.75 23040 1.56 0.75 215.46 2.4 0.010 0.0081 0.0020 4.061floors 1-3 240 24 30 1.65 2.75 54000 3.67 0.96 276.01 6.2 0.026 0.0246 0.0011 22.579 10.51 1.061floors 4-6 240 24 30 1.65 2.75 54000 3.67 0.96 276.01 6.2 0.026 0.0246 0.0011 22.579floors 7-9 240 20 24 1.47 2.75 23040 1.56 0.66 190.47 6.2 0.026 0.0239 0.0018 13.579

roof 240 20 24 1.45 2.75 23040 1.56 0.65 187.94 6.2 0.026 0.0239 0.0017 13.775floors 1-3 240 24 30 1.60 2.75 54000 3.67 0.93 267.79 7.8 0.033 0.0315 0.0011 29.778 13.38 1.042floors 4-6 240 24 30 1.60 2.75 54000 3.67 0.93 267.79 7.8 0.033 0.0315 0.0011 29.778floors 7-9 240 20 24 1.45 2.75 23040 1.56 0.65 187.31 7.8 0.033 0.0308 0.0017 17.775

roof 240 20 24 1.43 2.75 23040 1.56 0.64 184.78 7.8 0.033 0.0308 0.0017 18.032floors 1-3 240 24 30 1.57 2.75 54000 3.67 0.91 262.86 12.3 0.051 0.0500 0.0010 48.220 21.12 1.043floors 4-6 240 24 30 1.57 2.75 54000 3.67 0.91 262.86 12.3 0.051 0.0500 0.0010 48.220floors 7-9 240 20 24 1.43 2.75 23040 1.56 0.64 185.41 12.3 0.051 0.0493 0.0017 28.772

roof 240 20 24 1.41 2.75 23040 1.56 0.64 182.88 12.3 0.051 0.0494 0.0017 29.185floors 1-3 240 24 30 1.57 2.75 54000 3.67 0.91 262.86 24.4 0.102 0.1006 0.0010 96.997 42.10 1.053floors 4-6 240 24 30 1.57 2.75 54000 3.67 0.91 262.86 24.4 0.102 0.1006 0.0010 96.997floors 7-9 240 20 24 1.37 2.75 23040 1.56 0.62 177.81 24.4 0.102 0.1000 0.0016 60.811

roof 240 20 24 1.35 2.75 23040 1.56 0.61 175.28 24.4 0.102 0.1000 0.0016 61.705

67

Table 10. Complete Results for RC 3-Dimmensional AP Analyses, Continued 10-Story, 4x8 bays, L=240, Interior 6th

floors 1-3 240 24 30 2.06 2.75 54000 3.67 1.19 343.29 2.5 0.010 0.0090 0.0014 6.679 4.02 1.105floors 4-6 240 24 30 2.06 2.75 54000 3.67 1.19 343.29 2.5 0.010 0.0090 0.0014 6.679floors 7-9 240 20 24 1.77 2.75 23040 1.56 0.79 227.79 2.5 0.010 0.0083 0.0021 3.938

roof 240 20 24 1.77 2.75 23040 1.56 0.79 227.79 2.5 0.010 0.0083 0.0021 3.938floors 1-3 240 24 30 2.06 2.75 54000 3.67 1.19 343.29 6.4 0.027 0.0254 0.0014 18.736 10.89 1.038floors 4-6 240 24 30 2.06 2.75 54000 3.67 1.19 343.29 6.4 0.027 0.0254 0.0014 18.736floors 7-9 240 20 24 1.73 2.75 23040 1.56 0.78 223.60 6.4 0.027 0.0247 0.0021 11.928

roof 240 20 24 1.73 2.75 23040 1.56 0.78 223.60 6.4 0.027 0.0247 0.0021 11.928floors 1-3 240 24 30 2.06 2.75 54000 3.67 1.19 343.29 9.1 0.038 0.0364 0.0014 26.914 15.53 1.03floors 4-6 240 24 30 2.06 2.75 54000 3.67 1.19 343.29 9.1 0.038 0.0364 0.0014 26.914floors 7-9 240 20 24 1.68 2.75 23040 1.56 0.75 217.34 9.1 0.038 0.0358 0.0020 17.812

roof 240 20 24 1.68 2.75 23040 1.56 0.75 217.34 9.1 0.038 0.0358 0.0020 17.812floors 1-3 240 24 30 2.06 2.75 54000 3.67 1.19 343.29 16.5 0.069 0.0674 0.0014 49.733 28.40 1.034floors 4-6 240 24 30 2.06 2.75 54000 3.67 1.19 343.29 16.5 0.069 0.0674 0.0014 49.733floors 7-9 240 20 24 1.67 2.75 23040 1.56 0.75 215.46 16.5 0.069 0.0667 0.0020 33.489

roof 240 20 24 1.67 2.75 23040 1.56 0.75 215.46 16.5 0.069 0.0667 0.0020 33.489floors 1-3 240 24 30 2.06 2.75 54000 3.67 1.19 343.29 19.4 0.081 0.0793 0.0014 58.563 33.35 1.037floors 4-6 240 24 30 2.06 2.75 54000 3.67 1.19 343.29 19.4 0.081 0.0793 0.0014 58.563floors 7-9 240 20 24 1.95 2.75 23040 1.56 0.87 250.60 19.4 0.081 0.0783 0.0023 33.813

roof 240 20 24 1.95 2.75 23040 1.56 0.87 250.60 19.4 0.081 0.0783 0.0023 33.813

10-Story, 4x8 bays, L=240, Mid Side Short Edge 6th

floors 1-3 240 24 30 1.77 2.75 54000 3.67 1.03 295.20 2.6 0.011 0.0098 0.0012 8.374 4.85 1.111floors 4-6 240 24 30 1.77 2.75 54000 3.67 1.03 295.20 2.6 0.011 0.0098 0.0012 8.374floors 7-9 240 20 24 1.67 2.75 23040 1.56 0.75 215.46 2.6 0.011 0.0089 0.0020 4.480

roof 240 20 24 1.67 2.75 23040 1.56 0.75 215.46 2.6 0.011 0.0089 0.0020 4.480floors 1-3 240 24 30 1.77 2.75 54000 3.67 1.03 295.20 5.2 0.022 0.0207 0.0012 17.758 10.01 1.047floors 4-6 240 24 30 1.77 2.75 54000 3.67 1.03 295.20 5.2 0.022 0.0207 0.0012 17.758floors 7-9 240 20 24 1.53 2.75 23040 1.56 0.69 198.48 5.2 0.022 0.0200 0.0018 10.904

roof 240 20 24 1.53 2.75 23040 1.56 0.69 198.48 5.2 0.022 0.0200 0.0018 10.904floors 1-3 240 24 30 1.77 2.75 54000 3.67 1.03 295.20 9.1 0.038 0.0369 0.0012 31.700 17.67 1.032floors 4-6 240 24 30 1.77 2.75 54000 3.67 1.03 295.20 9.1 0.038 0.0369 0.0012 31.700floors 7-9 240 20 24 1.48 2.75 23040 1.56 0.67 192.17 9.1 0.038 0.0363 0.0018 20.432

68

Table 10. Complete Results for RC 3-Dimmensional AP Analyses, Continued roof 240 20 24 1.48 2.75 23040 1.56 0.67 192.17 9.1 0.038 0.0363 0.0018 20.432

floors 1-3 240 24 30 1.77 2.75 54000 3.67 1.03 295.20 11.9 0.050 0.0485 0.0012 41.646 23.11 1.032floors 4-6 240 24 30 1.77 2.75 54000 3.67 1.03 295.20 11.9 0.050 0.0485 0.0012 41.646floors 7-9 240 20 24 1.46 2.75 23040 1.56 0.66 189.01 11.9 0.050 0.0479 0.0017 27.418

roof 240 20 24 1.48 2.75 23040 1.56 0.67 192.17 11.9 0.050 0.0479 0.0018 26.951floors 1-3 240 24 30 1.77 2.75 54000 3.67 1.03 295.20 18.1 0.076 0.0743 0.0012 63.828 35.17 1.038floors 4-6 240 24 30 1.77 2.75 54000 3.67 1.03 295.20 18.1 0.076 0.0743 0.0012 63.828floors 7-9 240 20 24 1.43 2.75 23040 1.56 0.65 185.85 18.1 0.076 0.0738 0.0017 42.934

roof 240 20 24 1.43 2.75 23040 1.56 0.65 185.85 18.1 0.076 0.0738 0.0017 42.934

10-Story, 4x8 bays, L=240, Interior Corner 6th

floors 1-3 240 24 30 1.77 2.75 54000 3.67 1.03 295.20 2.9 0.012 0.0108 0.0012 9.257 4.57 1.085floors 4-6 240 24 30 1.77 2.75 54000 3.67 1.03 295.20 2.9 0.012 0.0108 0.0012 9.257floors 7-9 240 20 24 2.00 2.75 23040 1.56 0.89 256.80 2.9 0.012 0.0096 0.0024 4.031

roof 240 20 24 2.00 2.75 23040 1.56 0.89 256.80 2.9 0.012 0.0096 0.0024 4.031floors 1-3 240 24 30 1.77 2.75 54000 3.67 1.03 295.20 4.7 0.019 0.0183 0.0012 15.679 7.58 1.047floors 4-6 240 24 30 1.77 2.75 54000 3.67 1.03 295.20 4.7 0.019 0.0183 0.0012 15.679floors 7-9 240 20 24 1.90 2.75 23040 1.56 0.85 244.38 4.7 0.019 0.0172 0.0023 7.596

roof 240 20 24 1.90 2.75 23040 1.56 0.85 244.38 4.7 0.019 0.0172 0.0023 7.596floors 1-3 240 24 30 1.77 2.75 54000 3.67 1.03 295.20 7.2 0.030 0.0287 0.0012 24.634 11.76 1.033floors 4-6 240 24 30 1.77 2.75 54000 3.67 1.03 295.20 7.2 0.030 0.0287 0.0012 24.634floors 7-9 240 20 24 1.85 2.75 23040 1.56 0.83 238.15 7.2 0.030 0.0277 0.0022 12.557

roof 240 20 24 1.85 2.75 23040 1.56 0.83 238.15 7.2 0.030 0.0277 0.0022 12.557floors 1-3 240 24 30 1.77 2.75 54000 3.67 1.03 295.20 13.0 0.054 0.0530 0.0012 45.510 21.45 1.029floors 4-6 240 24 30 1.77 2.75 54000 3.67 1.03 295.20 13.0 0.054 0.0530 0.0012 45.510floors 7-9 240 20 24 1.80 2.75 23040 1.56 0.81 231.92 13.0 0.054 0.0520 0.0021 24.260

roof 240 20 24 1.80 2.75 23040 1.56 0.81 231.92 13.0 0.054 0.0520 0.0021 24.260floors 1-3 240 24 30 1.77 2.75 54000 3.67 1.03 295.20 18.9 0.079 0.0776 0.0012 66.619 31.14 1.036floors 4-6 240 24 30 1.77 2.75 54000 3.67 1.03 295.20 18.9 0.079 0.0776 0.0012 66.619floors 7-9 240 20 24 1.77 2.75 23040 1.56 0.79 227.79 18.9 0.079 0.0766 0.0021 36.388

roof 240 20 24 1.77 2.75 23040 1.56 0.79 227.79 18.9 0.079 0.0766 0.0021 36.388

10-Story, 4x8 bays, L=240, Corner 9th

floors 1-3 240 24 30 1.57 2.75 54000 3.67 0.91 262.86 9.0 0.038 0.0365 0.0010 35.210 14.89 1.052

69

Table 10. Complete Results for RC 3-Dimmensional AP Analyses, Continued floors 4-6 240 24 30 1.57 2.75 54000 3.67 0.91 262.86 9.0 0.038 0.0365 0.0010 35.210floors 7-9 240 20 24 1.23 2.75 23040 1.56 0.55 159.39 9.0 0.038 0.0361 0.0015 24.479

roof 240 20 24 1.57 2.75 23040 1.56 0.71 203.08 9.0 0.038 0.0357 0.0019 18.997floors 1-3 240 24 30 1.57 2.75 54000 3.67 0.91 262.86 12.3 0.051 0.0501 0.0010 48.340 20.41 1.045floors 4-6 240 24 30 1.57 2.75 54000 3.67 0.91 262.86 12.3 0.051 0.0501 0.0010 48.340floors 7-9 240 20 24 1.38 2.75 23040 1.56 0.62 178.45 12.3 0.051 0.0495 0.0016 30.010

roof 240 20 24 1.38 2.75 23040 1.56 0.62 178.45 12.3 0.051 0.0495 0.0016 30.010

10-Story, 4x8 bays, L=300, Mid Side Long 1st

floors 1-3 300 15 24 4.00 2.75 17280 0.38 0.86 484.19 6.5 0.022 0.0141 0.0075 1.893 4.50 1.18floors 4-6 300 15 24 4.00 2.75 17280 0.38 0.86 484.19 6.5 0.022 0.0141 0.0075 1.893floors 7-9 300 15 24 4.00 2.75 17280 0.38 0.86 484.19 6.5 0.022 0.0141 0.0075 1.893

roof 300 15 24 4.00 2.75 17280 0.38 0.86 484.19 6.5 0.022 0.0141 0.0075 1.893floors 1-3 300 15 24 3.60 2.75 17280 0.38 0.78 440.01 14.2 0.047 0.0406 0.0068 5.980 8.88 1.08floors 4-6 300 15 24 3.60 2.75 17280 0.38 0.78 440.01 14.2 0.047 0.0406 0.0068 5.980floors 7-9 300 15 24 3.60 2.75 17280 0.38 0.78 440.01 14.2 0.047 0.0406 0.0068 5.980

roof 300 15 24 3.60 2.75 17280 0.38 0.78 440.01 14.2 0.047 0.0406 0.0068 5.980floors 1-3 300 10 24 3.35 2.75 11520 0.26 0.70 395.41 25.0 0.083 0.0743 0.0091 8.124 12.71 1.0874floors 4-6 300 10 24 3.35 2.75 11520 0.26 0.70 395.41 25.0 0.083 0.0743 0.0091 8.124floors 7-9 300 10 24 3.05 2.75 11520 0.26 0.65 364.04 25.0 0.083 0.0750 0.0084 8.911

roof 300 10 24 3.05 2.75 11520 0.26 0.65 364.04 25.0 0.083 0.0750 0.0084 8.911

10-Story, 4x8 bays, L=300, Corner 1st

floors 1-3 300 15 24 3.61 2.75 17280 0.38 0.78 441.12 6.6 0.022 0.0152 0.0068 2.241 5.05 1.18floors 4-6 300 15 24 3.61 2.75 17280 0.38 0.78 441.12 6.6 0.022 0.0152 0.0068 2.241floors 7-9 300 15 24 3.61 2.75 17280 0.38 0.78 441.12 6.6 0.022 0.0152 0.0068 2.241

roof 300 15 24 3.61 2.75 17280 0.38 0.78 441.12 6.6 0.022 0.0152 0.0068 2.241floors 1-3 300 15 24 3.60 2.75 17280 0.38 0.78 440.01 12.3 0.041 0.0342 0.0068 5.037 10.51 1.1floors 4-6 300 15 24 3.60 2.75 17280 0.38 0.78 440.01 12.3 0.041 0.0342 0.0068 5.037floors 7-9 300 15 24 3.60 2.75 17280 0.38 0.78 440.01 12.3 0.041 0.0342 0.0068 5.037

roof 300 15 24 3.60 2.75 17280 0.38 0.78 440.01 12.3 0.041 0.0342 0.0068 5.037floors 1-3 300 10 24 2.98 2.75 11520 0.26 0.63 356.60 25.0 0.083 0.0752 0.0082 9.117 13.10 1.0874floors 4-6 300 10 24 2.98 2.75 11520 0.26 0.63 356.60 25.0 0.083 0.0752 0.0082 9.117floors 7-9 300 10 24 2.62 2.75 11520 0.26 0.56 317.68 25.0 0.083 0.0761 0.0073 10.357

roof 300 10 24 2.62 2.75 11520 0.26 0.56 317.68 25.0 0.083 0.0761 0.0073 10.357

70

Table 10. Complete Results for RC 3-Dimmensional AP Analyses, Continued 10-Story, 4x8 bays, L=300, Interior 1st

floors 1-3 300 15 24 5.30 2.75 17280 0.38 1.10 621.29 6.2 0.021 0.0111 0.0096 1.159 3.40 1.22floors 4-6 300 15 24 5.30 2.75 17280 0.38 1.10 621.29 6.2 0.021 0.0111 0.0096 1.159floors 7-9 300 15 24 5.30 2.75 17280 0.38 1.10 621.29 6.2 0.021 0.0111 0.0096 1.159

roof 300 15 24 5.30 2.75 17280 0.38 1.10 621.29 6.2 0.021 0.0111 0.0096 1.159floors 1-3 300 15 24 4.71 2.75 17280 0.38 1.00 560.51 12.3 0.041 0.0323 0.0086 3.735 6.14 1.105floors 4-6 300 15 24 4.71 2.75 17280 0.38 1.00 560.51 12.3 0.041 0.0323 0.0086 3.735floors 7-9 300 15 24 4.71 2.75 17280 0.38 1.00 560.51 12.3 0.041 0.0323 0.0086 3.735

roof 300 15 24 4.71 2.75 17280 0.38 1.00 560.51 12.3 0.041 0.0323 0.0086 3.735floors 1-3 300 10 24 4.50 2.75 11520 0.26 0.90 508.32 24.3 0.081 0.0692 0.0118 5.893 9.10 1.0924floors 4-6 300 10 24 4.50 2.75 11520 0.26 0.90 508.32 24.3 0.081 0.0692 0.0118 5.893floors 7-9 300 10 24 4.17 2.75 11520 0.26 0.85 477.11 24.3 0.081 0.0700 0.0110 6.344

roof 300 10 24 4.17 2.75 11520 0.26 0.85 477.11 24.3 0.081 0.0700 0.0110 6.344

10-Story, 4x8 bays, L=300, Mid Side Long 5th

floors 1-3 300 15 24 3.74 2.75 17280 0.38 0.81 455.58 7.9 0.026 0.0193 0.0070 2.756 5.37 1.14floors 4-6 300 15 24 3.74 2.75 17280 0.38 0.81 455.58 7.9 0.026 0.0193 0.0070 2.756floors 7-9 300 15 24 3.74 2.75 17280 0.38 0.81 455.58 7.9 0.026 0.0193 0.0070 2.756

roof 300 15 24 3.74 2.75 17280 0.38 0.81 455.58 7.9 0.026 0.0193 0.0070 2.756floors 1-3 300 15 24 3.60 2.75 17280 0.38 0.78 440.01 10.6 0.035 0.0284 0.0068 4.186 6.69 1.11floors 4-6 300 15 24 3.60 2.75 17280 0.38 0.78 440.01 10.6 0.035 0.0284 0.0068 4.186floors 7-9 300 15 24 3.60 2.75 17280 0.38 0.78 440.01 10.6 0.035 0.0284 0.0068 4.186

roof 300 15 24 3.60 2.75 17280 0.38 0.78 440.01 10.6 0.035 0.0284 0.0068 4.186floors 1-3 300 10 24 3.35 2.75 11520 0.26 0.70 395.41 26.3 0.088 0.0786 0.0091 8.602 11.91 1.0896floors 4-6 300 10 24 3.35 2.75 11520 0.26 0.70 395.41 26.3 0.088 0.0786 0.0091 8.602floors 7-9 300 10 24 3.05 2.75 11520 0.26 0.65 364.04 26.3 0.088 0.0794 0.0084 9.430

roof 300 10 24 3.05 2.75 11520 0.26 0.65 364.04 26.3 0.088 0.0794 0.0084 9.430

10-Story, 4x8 bays, L=300, Corner 5th

floors 1-3 300 15 24 3.42 2.75 17280 0.38 0.75 419.82 7.0 0.023 0.0168 0.0065 2.590 5.10 1.17floors 4-6 300 15 24 3.42 2.75 17280 0.38 0.75 419.82 7.0 0.023 0.0168 0.0065 2.590floors 7-9 300 15 24 3.42 2.75 17280 0.38 0.75 419.82 7.0 0.023 0.0168 0.0065 2.590

roof 300 15 24 3.42 2.75 17280 0.38 0.75 419.82 7.0 0.023 0.0168 0.0065 2.590floors 1-3 300 15 24 3.16 2.75 17280 0.38 0.69 390.32 13.3 0.044 0.0382 0.0060 6.354 10.00 1.09

71

Table 10. Complete Results for RC 3-Dimmensional AP Analyses, Continued floors 4-6 300 15 24 3.16 2.75 17280 0.38 0.69 390.32 13.3 0.044 0.0382 0.0060 6.354floors 7-9 300 15 24 3.16 2.75 17280 0.38 0.69 390.32 13.3 0.044 0.0382 0.0060 6.354

roof 300 15 24 3.16 2.75 17280 0.38 0.69 390.32 13.3 0.044 0.0382 0.0060 6.354floors 1-3 300 10 24 2.98 2.75 11520 0.26 0.63 356.60 24.2 0.081 0.0726 0.0082 8.802 11.64 1.0896floors 4-6 300 10 24 2.98 2.75 11520 0.26 0.63 356.60 24.2 0.081 0.0726 0.0082 8.802floors 7-9 300 10 24 2.62 2.75 11520 0.26 0.56 317.68 24.2 0.081 0.0735 0.0073 10.003

roof 300 10 24 2.62 2.75 11520 0.26 0.56 317.68 24.2 0.081 0.0735 0.0073 10.003

10-Story, 4x8 bays, L=300, Interior 5th

floors 1-3 300 15 24 5.14 2.75 17280 0.38 1.08 604.95 6.5 0.022 0.0123 0.0093 1.318 3.43 1.2floors 4-6 300 15 24 5.14 2.75 17280 0.38 1.08 604.95 6.5 0.022 0.0123 0.0093 1.318floors 7-9 300 15 24 5.14 2.75 17280 0.38 1.08 604.95 6.5 0.022 0.0123 0.0093 1.318

roof 300 15 24 5.14 2.75 17280 0.38 1.08 604.95 6.5 0.022 0.0123 0.0093 1.318floors 1-3 300 15 24 4.39 2.75 17280 0.38 0.94 526.36 20.1 0.067 0.0589 0.0081 7.264 10.06 1.08floors 4-6 300 15 24 4.39 2.75 17280 0.38 0.94 526.36 20.1 0.067 0.0589 0.0081 7.264floors 7-9 300 15 24 4.39 2.75 17280 0.38 0.94 526.36 20.1 0.067 0.0589 0.0081 7.264

roof 300 15 24 4.39 2.75 17280 0.38 0.94 526.36 20.1 0.067 0.0589 0.0081 7.264floors 1-3 300 10 24 4.50 2.75 11520 0.26 0.90 508.32 25.4 0.085 0.0730 0.0118 6.217 9.00 1.0892floors 4-6 300 10 24 4.50 2.75 11520 0.26 0.90 508.32 25.4 0.085 0.0730 0.0118 6.217floors 7-9 300 10 24 4.17 2.75 11520 0.26 0.85 477.11 25.4 0.085 0.0738 0.0110 6.689

roof 300 10 24 4.17 2.75 11520 0.26 0.85 477.11 25.4 0.085 0.0738 0.0110 6.689

10-Story, 4x8 bays, L=300, Mid Side Long 8th

floors 1-3 300 15 24 3.81 2.75 17280 0.38 0.82 463.32 5.7 0.019 0.0119 0.0071 1.671 3.88 1.2floors 4-6 300 15 24 3.81 2.75 17280 0.38 0.82 463.32 5.7 0.019 0.0119 0.0071 1.671floors 7-9 300 15 24 3.81 2.75 17280 0.38 0.82 463.32 5.7 0.019 0.0119 0.0071 1.671

roof 300 15 24 3.81 2.75 17280 0.38 0.82 463.32 5.7 0.019 0.0119 0.0071 1.671floors 1-3 300 15 24 3.33 2.75 17280 0.38 0.73 409.65 15.4 0.051 0.0450 0.0063 7.131 10.23 1.08floors 4-6 300 15 24 3.33 2.75 17280 0.38 0.73 409.65 15.4 0.051 0.0450 0.0063 7.131floors 7-9 300 15 24 3.33 2.75 17280 0.38 0.73 409.65 15.4 0.051 0.0450 0.0063 7.131

roof 300 15 24 3.33 2.75 17280 0.38 0.73 409.65 15.4 0.051 0.0450 0.0063 7.131floors 1-3 300 10 24 3.35 2.75 11520 0.26 0.70 395.41 26.0 0.087 0.0774 0.0091 8.467 11.71 1.0914floors 4-6 300 10 24 3.35 2.75 11520 0.26 0.70 395.41 26.0 0.087 0.0774 0.0091 8.467floors 7-9 300 10 24 3.05 2.75 11520 0.26 0.65 364.04 26.0 0.087 0.0781 0.0084 9.283

roof 300 10 24 3.05 2.75 11520 0.26 0.65 364.04 26.0 0.087 0.0781 0.0084 9.283

72

Table 10. Complete Results for RC 3-Dimmensional AP Analyses, Continued

10-Story, 4x8 bays, L=300, Corner 8th

floors 1-3 300 15 24 3.33 2.75 17280 0.38 0.73 409.65 6.0 0.020 0.0138 0.0063 2.179 4.36 1.2floors 4-6 300 15 24 3.33 2.75 17280 0.38 0.73 409.65 6.0 0.020 0.0138 0.0063 2.179floors 7-9 300 15 24 3.33 2.75 17280 0.38 0.73 409.65 6.0 0.020 0.0138 0.0063 2.179

roof 300 15 24 3.33 2.75 17280 0.38 0.73 409.65 6.0 0.020 0.0138 0.0063 2.179floors 1-3 300 15 24 3.00 2.75 17280 0.38 0.66 371.97 12.6 0.042 0.0364 0.0057 6.350 9.60 1.09floors 4-6 300 15 24 3.00 2.75 17280 0.38 0.66 371.97 12.6 0.042 0.0364 0.0057 6.350floors 7-9 300 15 24 3.00 2.75 17280 0.38 0.66 371.97 12.6 0.042 0.0364 0.0057 6.350

roof 300 15 24 3.00 2.75 17280 0.38 0.66 371.97 12.6 0.042 0.0364 0.0057 6.350floors 1-3 300 10 24 2.98 2.75 11520 0.26 0.63 356.60 24.1 0.080 0.0721 0.0082 8.745 11.12 1.0914floors 4-6 300 10 24 2.98 2.75 11520 0.26 0.63 356.60 24.1 0.080 0.0721 0.0082 8.745floors 7-9 300 10 24 2.62 2.75 11520 0.26 0.56 317.68 24.1 0.080 0.0730 0.0073 9.939

roof 300 10 24 2.62 2.75 11520 0.26 0.56 317.68 24.1 0.080 0.0730 0.0073 9.939

10-Story, 4x8 bays, L=300, Interior 8th

floors 1-3 300 15 24 5.00 2.75 17280 0.38 1.05 590.53 6.5 0.022 0.0124 0.0091 1.366 3.46 1.2floors 4-6 300 15 24 5.00 2.75 17280 0.38 1.05 590.53 6.5 0.022 0.0124 0.0091 1.366floors 7-9 300 15 24 5.00 2.75 17280 0.38 1.05 590.53 6.5 0.022 0.0124 0.0091 1.366

roof 300 15 24 5.00 2.75 17280 0.38 1.05 590.53 6.5 0.022 0.0124 0.0091 1.366floors 1-3 300 15 24 4.39 2.75 17280 0.38 0.94 526.36 14.7 0.049 0.0410 0.0081 5.053 6.89 1.085floors 4-6 300 15 24 4.39 2.75 17280 0.38 0.94 526.36 14.7 0.049 0.0410 0.0081 5.053floors 7-9 300 15 24 4.39 2.75 17280 0.38 0.94 526.36 14.7 0.049 0.0410 0.0081 5.053

roof 300 15 24 4.39 2.75 17280 0.38 0.94 526.36 14.7 0.049 0.0410 0.0081 5.053floors 1-3 300 10 24 4.50 2.75 11520 0.26 0.90 508.32 26.4 0.088 0.0764 0.0118 6.501 9.39 1.0865floors 4-6 300 10 24 4.50 2.75 11520 0.26 0.90 508.32 26.4 0.088 0.0764 0.0118 6.501floors 7-9 300 10 24 4.17 2.75 11520 0.26 0.85 477.11 26.4 0.088 0.0771 0.0110 6.991

roof 300 10 24 4.17 2.75 11520 0.26 0.85 477.11 26.4 0.088 0.0771 0.0110 6.991

73

Table 10. Complete Results for RC 3-Dimmensional AP Analyses, Continued 10-Story, 4x8 bays, L=360, Corner 1st

floors 1-3 360 24 30 11.00 2.75 54000 0.48 1.70 1651.01 3.1 0.009 0.0001 0.0086 0.009 1.736floors 4-6 360 24 30 11.00 2.75 54000 0.48 1.70 1651.01 3.1 0.009 0.0001 0.0086 0.009floors 7-9 360 20 24 10.50 2.75 23040 0.21 1.18 1151.33 3.1 0.009 0.0000 0.0160 0.000

roof 360 20 24 10.50 2.75 23040 0.21 1.18 1151.33 3.1 0.009 0.0000 0.0160 0.000floors 1-3 360 24 30 7.00 2.75 54000 0.48 1.13 1102.11 4.5 0.012 0.0059 0.0065 0.908 1.376floors 4-6 360 24 30 7.00 2.75 54000 0.48 1.13 1102.11 4.5 0.012 0.0059 0.0065 0.908floors 7-9 360 20 24 6.65 2.75 23040 0.21 0.81 785.65 4.5 0.012 0.0015 0.0109 0.142

roof 360 20 24 6.65 2.75 23040 0.21 0.81 785.65 4.5 0.012 0.0015 0.0109 0.142floors 1-3 360 24 30 6.40 2.75 54000 0.48 1.04 1014.71 5.5 0.015 0.0094 0.0060 1.565 1.3044floors 4-6 360 24 30 6.40 2.75 54000 0.48 1.04 1014.71 5.5 0.015 0.0094 0.0060 1.565floors 7-9 360 20 24 6.05 2.75 23040 0.21 0.74 722.77 5.5 0.015 0.0054 0.0100 0.536

roof 360 20 24 6.05 2.75 23040 0.21 0.74 722.77 5.5 0.015 0.0054 0.0100 0.536floors 1-3 360 15 30 7.00 2.75 33750 0.30 1.08 1048.07 5.6 0.015 0.0055 0.0099 0.556 1.46floors 4-6 360 15 30 7.00 2.75 33750 0.30 1.08 1048.07 5.6 0.015 0.0055 0.0099 0.556floors 7-9 360 10 24 6.65 2.75 11520 0.10 0.71 688.10 5.6 0.015 -0.0036 0.0191 -0.191

roof 360 10 24 6.65 2.75 11520 0.10 0.71 688.10 5.6 0.015 -0.0036 0.0191 -0.191floors 1-3 360 24 30 6.10 2.75 54000 0.48 1.00 970.51 6.4 0.018 0.0119 0.0057 2.078 1.242floors 4-6 360 24 30 6.10 2.75 54000 0.48 1.00 970.51 6.4 0.018 0.0119 0.0057 2.078floors 7-9 360 20 24 5.75 2.75 23040 0.21 0.71 690.74 6.4 0.018 0.0081 0.0096 0.845

roof 360 20 24 5.75 2.75 23040 0.21 0.71 690.74 6.4 0.018 0.0081 0.0096 0.845floors 1-3 360 15 30 5.95 2.75 33750 0.30 0.94 909.23 7.7 0.022 0.0129 0.0086 1.497 1.304floors 4-6 360 15 30 5.95 2.75 33750 0.30 0.94 909.23 7.7 0.022 0.0129 0.0086 1.497floors 7-9 360 10 24 5.60 2.75 11520 0.10 0.62 605.40 7.7 0.022 0.0047 0.0168 0.280

roof 360 10 24 5.60 2.75 11520 0.10 0.62 605.40 7.7 0.022 0.0047 0.0168 0.280floors 1-3 360 24 30 5.80 2.75 54000 0.48 0.95 925.97 8.0 0.022 0.0166 0.0055 3.037 1.18floors 4-6 360 24 30 5.80 2.75 54000 0.48 0.95 925.97 8.0 0.022 0.0166 0.0055 3.037floors 7-9 360 20 24 5.45 2.75 23040 0.21 0.68 658.31 8.0 0.022 0.0130 0.0091 1.423

roof 360 20 24 5.45 2.75 23040 0.21 0.68 658.31 8.0 0.022 0.0130 0.0091 1.423floors 1-3 360 24 30 5.30 2.75 54000 0.48 0.88 851.02 16.4 0.046 0.0405 0.0050 8.046 1.087floors 4-6 360 24 30 5.30 2.75 54000 0.48 0.88 851.02 16.4 0.046 0.0405 0.0050 8.046floors 7-9 360 20 24 4.95 2.75 23040 0.21 0.62 603.37 16.4 0.046 0.0372 0.0084 4.444

roof 360 20 24 4.95 2.75 23040 0.21 0.62 603.37 16.4 0.046 0.0372 0.0084 4.444floors 1-3 360 15 30 5.00 2.75 33750 0.30 0.80 778.03 18.5 0.051 0.0440 0.0074 5.968 1.116floors 4-6 360 15 30 5.00 2.75 33750 0.30 0.80 778.03 18.5 0.051 0.0440 0.0074 5.968floors 7-9 360 10 24 4.65 2.75 11520 0.10 0.54 522.18 18.5 0.051 0.0368 0.0145 2.544

74

Table 10. Complete Results for RC 3-Dimmensional AP Analyses, Continued

10-Story, 4x8 bays, L=360, Corner 1st Additional data)

floors 1-3 360 24 30 6.10 2.75 54000 0.48 1.00 970.51 6.4 0.018 0.0120 0.0057 2.084 1.321floors 4-6 360 24 30 6.10 2.75 54000 0.48 1.00 970.51 6.4 0.018 0.0120 0.0057 2.084floors 7-9 360 20 24 5.75 2.75 23040 0.21 0.71 690.74 6.4 0.018 0.0081 0.0096 0.849

roof 360 20 24 5.75 2.75 23040 0.21 0.71 690.74 6.4 0.018 0.0081 0.0096 0.849floors 1-3 360 24 30 6.00 2.75 54000 0.48 0.98 955.70 6.6 0.018 0.0127 0.0057 2.242 1.307floors 4-6 360 24 30 6.00 2.75 54000 0.48 0.98 955.70 6.6 0.018 0.0127 0.0057 2.242floors 7-9 360 20 24 5.65 2.75 23040 0.21 0.70 679.97 6.6 0.018 0.0089 0.0094 0.944

roof 360 20 24 5.65 2.75 23040 0.21 0.70 679.97 6.6 0.018 0.0089 0.0094 0.944floors 1-3 360 24 30 5.80 2.75 54000 0.48 0.95 925.97 7.2 0.020 0.0144 0.0055 2.628 1.275floors 4-6 360 24 30 5.80 2.75 54000 0.48 0.95 925.97 7.2 0.020 0.0144 0.0055 2.628floors 7-9 360 20 24 5.45 2.75 23040 0.21 0.68 658.31 7.2 0.020 0.0108 0.0091 1.177

roof 360 20 24 5.45 2.75 23040 0.21 0.68 658.31 7.2 0.020 0.0108 0.0091 1.177floors 1-3 360 24 30 5.15 2.75 54000 0.48 0.85 828.35 23.9 0.066 0.0615 0.0049 12.543 1.074floors 4-6 360 24 30 5.15 2.75 54000 0.48 0.85 828.35 23.9 0.066 0.0615 0.0049 12.543floors 7-9 360 20 24 4.80 2.75 23040 0.21 0.60 586.68 23.9 0.066 0.0583 0.0081 7.159

roof 360 20 24 4.80 2.75 23040 0.21 0.60 586.68 23.9 0.066 0.0583 0.0081 7.159

75

Table 11. Complete Results, Steel Building 3-Dimmensional AP Analysis

Type

beam span

bay spcg

steel section I Z calc K

calc R calc M

calc disp

calc rotation

plastic rotation

calc LIF

yield rotation

norm rot calc DIF

(in) (in) (in^4) (in^3) (psi/in) (psi) (k-ft) (in) (rad) (rad) (rad) 3-story corner

column spandrel 300 300 W18x60 984 123 0.28 0.96 538.13 4.93 0.016 0.0051 1.78 0.0113 0.45 1.74

spandrel-girder 300 300 W18x65 1070 133 0.31 1.03 581.88 4.93 0.016 0.0052 1.78 0.0113 0.46 1.74

spandrel 300 300 W21x44 843 95.4 0.24 0.74 417.38 5.47 0.018 0.0080 1.80 0.0102 0.78 1.62

spandrel-girder 300 300 W21x50 984 110 0.28 0.86 481.25 5.47 0.018 0.0081 1.80 0.0101 0.80 1.62

spandrel 300 300 W18x35 510 66.5 0.15 0.52 290.94 9.44 0.031 0.0197 2.17 0.0118 1.67 1.42

spandrel-girder 300 300 W18x40 612 78.4 0.18 0.61 343.00 9.44 0.031 0.0199 2.17 0.0116 1.71 1.42

spandrel 300 300 W14x38 385 61.5 0.11 0.48 269.06 13.45 0.045 0.0304 2.43 0.0145 2.10 1.36

spandrel-girder 300 300 W14x43 428 69.6 0.12 0.54 304.50 13.45 0.045 0.0301 2.43 0.0147 2.05 1.36

3-story interior

column girder 300 300 w24x76 2100 200 0.60 1.56 875.00 3.77 0.013 0.0039 1.8 0.0086 0.46 1.82 int beam 300 300 w18x60 984 123 0.28 0.96 538.13 3.77 0.013 0.0013 1.80 0.0113 0.00 1.82 girder 300 300 w21x73 1600 172 0.46 1.34 752.50 4.76 0.016 0.0061 1.84 0.0097 0.63 1.68 int beam 300 300 w16x57 758 105 0.22 0.82 459.38 4.76 0.016 0.0033 1.84 0.0125 0.27 1.68 girder 300 300 w24x62 1550 153 0.44 1.19 669.38 4.8 0.016 0.0071 1.9 0.0089 0.79 1.6 int beam 300 300 w21x44 843 95.4 0.24 0.74 417.38 4.8 0.016 0.0058 1.90 0.0102 0.56 1.6 girder 300 300 w24x55 1350 134 0.39 1.04 586.25 6.42 0.021 0.0124 2.12 0.0090 1.38 1.44 int beam 300 300 w18x40 612 78.4 0.18 0.61 343.00 6.42 0.021 0.0098 2.12 0.0116 0.85 1.44 girder 300 300 w18x60 984 123 0.28 0.96 538.13 8.99 0.030 0.0187 2.37 0.0113 1.65 1.38 int beam 300 300 w16x40 518 72.9 0.15 0.57 318.94 8.99 0.030 0.0172 2.37 0.0127 1.35 1.38 girder 300 300 w18x55 890 112 0.25 0.87 490.00 11.44 0.038 0.0267 2.84 0.0114 2.35 1.29 int beam 300 300 w18x35 510 66.5 0.15 0.52 290.94 11.44 0.038 0.0263 2.84 0.0118 2.23 1.29 girder 300 300 w16x57 758 105 0.22 0.82 459.38 16.91 0.056 0.0438 3.49 0.0125 3.50 1.23 int beam 300 300 w14x38 385 61.5 0.11 0.48 269.06 16.91 0.056 0.0419 3.49 0.0145 2.90 1.23

76

Table 11. Complete Results, Steel Building 3-Dimmensional AP Analysis, Continued 3-story perimeter

column spandrel 300 300 w21x50 984 110 0.28 0.86 481.25 4.13 0.014 0.0036 1.86 0.0101 0.36 1.73

spandrel-girder 300 300 w21x73 1600 172 0.46 1.34 752.50 4.13 0.014 0.0040 0.0097 0.41

spandrel 300 300 w18x35 510 66.5 0.15 0.52 290.94 8.74 0.029 0.0173 2.35 0.0118 1.47 1.38

spandrel-girder 300 300 w18x55 890 112 0.25 0.87 490.00 8.74 0.029 0.0177 0.0114 1.56

spandrel 300 300 w14x38 385 61.5 0.11 0.48 269.06 12.52 0.042 0.0273 2.65 0.0145 1.89 1.33

spandrel-girder 300 300 w14x61 640 102 0.18 0.79 446.25 12.52 0.042 0.0273 0.0144 1.89

spandrel 300 300 w12x40 310 57.5 0.09 0.45 251.56 16.8 0.056 0.0392 2.95 0.0168 2.34 1.31

spandrel-girder 300 300 w12x65 533 96.8 0.15 0.75 423.50 16.8 0.056 0.0396 0.0164 2.41

10-story interior

column girder 300 300 w21x93 2070 221 0.59 1.72 966.88 3.7 0.012 0.0027 1.81 0.0097 0.28 1.75 int beam 300 300 w18x71 1170 145 0.34 1.13 634.38 3.7 0.012 0.0011 0.0112 0.00 girder 300 300 w21x83 1830 196 0.52 1.52 857.50 3.92 0.013 0.0034 1.83 0.0097 0.35 1.7 int beam 300 300 w21x57 1170 129 0.34 1.00 564.38 3.92 0.013 0.0031 0.0100 0.31 girder 300 300 w21x68 1480 160 0.42 1.24 700.00 5.03 0.017 0.0070 1.85 0.0098 0.71 1.57 int beam 300 300 w18x50 800 101 0.23 0.79 441.88 5.03 0.017 0.0053 0.0114 0.47 girder 300 300 w18x76 1330 163 0.38 1.27 713.13 5.69 0.019 0.0079 1.85 0.0111 0.71 1.55 int beam 300 300 w14x61 640 102 0.18 0.79 446.25 5.69 0.019 0.0045 0.0144 0.31 girder 300 300 w21x62 1330 144 0.38 1.12 630.00 5.73 0.019 0.0093 1.95 0.0098 0.95 1.5 int beam 300 300 w18x46 712 90.7 0.20 0.71 396.81 5.73 0.019 0.0076 0.0115 0.66 girder 300 300 w21x57 1170 129 0.34 1.00 564.38 8.48 0.028 0.0183 2.3 0.0100 1.83 1.39 int beam 300 300 w12x53 425 77.9 0.12 0.61 340.81 8.48 0.028 0.0117 0.0166 0.70 girder 300 300 w18x55 890 112 0.25 0.87 490.00 11.45 0.038 0.0268 2.9 0.0114 2.35 1.28 int beam 300 300 w18x35 510 66.5 0.15 0.52 290.94 11.45 0.038 0.0264 0.0118 2.23 girder 300 300 w16x57 758 105 0.22 0.82 459.38 16.82 0.056 0.0435 3.6 0.0125 3.47 1.22 int beam 300 300 w14x38 385 61.5 0.11 0.48 269.06 16.82 0.056 0.0416 0.0145 2.88 girder 300 300 w10x77 455 97.6 0.13 0.76 427.00 38.15 0.127 0.1078 5.4 0.0194 5.55 1.18 int beam 300 300 w10x45 248 54.9 0.07 0.43 240.19 38.15 0.127 0.1071 0.0200 5.35

77

Table 11. Complete Results, Steel Building 3-Dimmensional AP Analysis, Continued

3-story perimeter column; revised

hinge Spandrel 300 300 w21x50 984 110 0.28 0.86 481.25 5.83 0.019 0.0093 2.6 0.0101 0.92 1.6 Girder 300 300 w21x73 1600 172 0.46 1.34 752.50 5.83 0.019 0.0097 0.0097 1.00 Spandrel 300 300 w18x35 510 66.5 0.15 0.52 290.94 12.44 0.041 0.0297 3.3 0.0118 2.51 1.42 Girder 300 300 w18x55 890 112 0.25 0.87 490.00 12.44 0.041 0.0301 0.0114 2.64 Spandrel 300 300 w14x38 385 61.5 0.11 0.48 269.06 17.43 0.058 0.0436 3.7 0.0145 3.02 1.38 Girder 300 300 w14x61 640 102 0.18 0.79 446.25 17.43 0.058 0.0437 0.0144 3.03 Spandrel 300 300 w12x40 310 57.5 0.09 0.45 251.56 23.08 0.077 0.0601 4 0.0168 3.58 1.34 Girder 300 300 w12x65 533 96.8 0.15 0.75 423.50 23.08 0.077 0.0605 0.0164 3.68

Table 12. Complete Results, RC Double Span Beams, SDOF Analyses Type

beam span

beam width

beam depth

avg steel area

bar ctr cover calc Ig calc

Ic calc Ia calc K calc

R calc M applied load

calc disp

calc rotation

plastic rotation

calc LIF

Calc DIF

(in) (in) (in) (in^2) (in) (in^4) (in^4) (in^4) (psi/in) (psi) (k-ft) (psi) (in) (rad) (rad)

double span SDOF 240 24 20 1.45 1.5 16000 2659 9330 1.2 0.58 168.32 0.58 25.9 0.108 0.106 53.7 1.0

double span SDOF 240 24 20 1.45 1.5 16000 2659 9330 1.2 0.58 168.32 0.58 19.3 0.081 0.079 40.2 1.0

double span SDOF 240 24 20 1.45 1.5 16000 2659 9330 1.2 0.58 168.32 0.58 15.4 0.064 0.062 32.2 1.0

double span SDOF 240 24 20 1.45 1.5 16000 2659 9330 1.2 0.58 168.32 0.57 10.3 0.043 0.041 21.6 1.0

double span SDOF 240 24 20 1.45 1.5 16000 2659 9330 1.2 0.58 168.32 0.56 6.3 0.026 0.024 13.4 1.0

double span SDOF 240 24 20 1.45 1.5 16000 2659 9330 1.2 0.58 168.32 0.54 3.5 0.015 0.013 7.9 1.1

double span SDOF 240 24 20 1.45 1.5 16000 2659 9330 1.2 0.58 168.32 0.50 1.9 0.008 0.006 4.7 1.1

double span SDOF 240 24 20 1.45 1.5 16000 2659 9330 1.2 0.58 168.32 0.35 0.7 0.003 0.001 2.5 1.4

78

Table 12. Complete Results, RC Double Span Beams, SDOF Analyses, Continued double span

SDOF 240 24 20 1.7 1.5 16000 3191 9596 1.22 0.68 196.5 0.68 26.6 0.111 0.108 48.0 1.0 double span

SDOF 240 24 20 1.7 1.5 16000 3191 9596 1.22 0.68 196.5 0.67 19.1 0.080 0.077 34.7 1.0 double span

SDOF 240 24 20 1.7 1.5 16000 3191 9596 1.22 0.68 196.5 0.67 15.0 0.062 0.060 27.3 1.0 double span

SDOF 240 24 20 1.7 1.5 16000 3191 9596 1.22 0.68 196.5 0.67 11.6 0.048 0.046 21.3 1.0 double span

SDOF 240 24 20 1.7 1.5 16000 3191 9596 1.22 0.68 196.5 0.65 6.4 0.027 0.024 12.0 1.0 double span

SDOF 240 24 20 1.7 1.5 16000 3191 9596 1.22 0.68 196.5 0.62 3.4 0.014 0.012 6.7 1.1 double span

SDOF 240 24 20 1.7 1.5 16000 3191 9596 1.22 0.68 196.5 0.55 1.7 0.007 0.005 3.8 1.2 double span

SDOF 240 24 20 1.7 1.5 16000 3191 9596 1.22 0.68 196.5 0.40 0.8 0.003 0.001 2.4 1.4

double span SDOF 240 24 20 2.4 1.5 16000 4331 10165 1.29 0.95 273.9 0.94 22.4 0.093 0.090 30.9 1.0

double span SDOF 240 24 20 2.4 1.5 16000 4331 10165 1.29 0.95 273.9 0.93 17.3 0.072 0.069 24.0 1.0

double span SDOF 240 24 20 2.4 1.5 16000 4331 10165 1.29 0.95 273.9 0.93 14.1 0.059 0.056 19.6 1.0

double span SDOF 240 24 20 2.4 1.5 16000 4331 10165 1.29 0.95 273.9 0.92 11.9 0.050 0.047 16.7 1.0

double span SDOF 240 24 20 2.4 1.5 16000 4331 10165 1.29 0.95 273.9 0.90 7.4 0.031 0.028 10.7 1.1

double span SDOF 240 24 20 2.4 1.5 16000 4331 10165 1.29 0.95 273.9 0.85 3.9 0.016 0.013 5.9 1.1

double span SDOF 240 24 20 2.4 1.5 16000 4331 10165 1.29 0.95 273.9 0.75 2.1 0.009 0.006 3.6 1.2

double span SDOF 240 24 20 2.4 1.5 16000 4331 10165 1.29 0.95 273.9 0.60 1.2 0.005 0.002 2.6 1.4

79

Table 12. Complete Results, RC Double Span Beams, SDOF Analyses

double span SDOF 240 12 30 0.98 3 27000 4370 15685 1.98 0.58 166.3 0.57 22.3 0.093 0.092 76.9 1.0

double span SDOF 240 12 30 0.98 3 27000 4370 15685 1.98 0.58 166.3 0.57 17.9 0.074 0.073 61.7 1.0

double span SDOF 240 12 30 0.98 3 27000 4370 15685 1.98 0.58 166.3 0.57 14.9 0.062 0.061 51.5 1.0

double span SDOF 240 12 30 0.98 3 27000 4370 15685 1.98 0.58 166.3 0.57 11.2 0.047 0.045 38.8 1.0

double span SDOF 240 12 30 0.98 3 27000 4370 15685 1.98 0.58 166.3 0.57 6.9 0.029 0.027 24.1 1.0

double span SDOF 240 12 30 0.98 3 27000 4370 15685 1.98 0.58 166.3 0.55 3.3 0.014 0.012 11.8 1.1

double span SDOF 240 12 30 0.98 3 27000 4370 15685 1.98 0.58 166.3 0.53 1.9 0.008 0.007 7.2 1.1

double span SDOF 240 12 30 0.98 3 27000 4370 15685 1.98 0.58 166.3 0.45 0.8 0.003 0.002 3.5 1.2

double span

SDOF 240 12 30 1.3 3 27000 5196 16098 2.05 0.76 218.9 0.76 25.5 0.106 0.105 69.1 1.0 double span

SDOF 240 12 30 1.3 3 27000 5196 16098 2.05 0.76 218.9 0.75 19.0 0.079 0.077 51.6 1.0 double span

SDOF 240 12 30 1.3 3 27000 5196 16098 2.05 0.76 218.9 0.75 15.4 0.064 0.062 42.0 1.0 double span

SDOF 240 12 30 1.3 3 27000 5196 16098 2.05 0.76 218.9 0.75 10.9 0.046 0.044 30.0 1.0 double span

SDOF 240 12 30 1.3 3 27000 5196 16098 2.05 0.76 218.9 0.74 8.1 0.034 0.032 22.2 1.0 double span

SDOF 240 12 30 1.3 3 27000 5196 16098 2.05 0.76 218.9 0.73 4.3 0.018 0.016 12.0 1.0 double span

SDOF 240 12 30 1.3 3 27000 5196 16098 2.05 0.76 218.9 0.65 1.5 0.006 0.005 4.6 1.1 double span

SDOF 240 12 30 1.3 3 27000 5196 16098 2.05 0.76 218.9 0.45 0.5 0.002 0.001 2.5 1.4

80

Table 12. Complete Results, RC Double Span Beams, SDOF Analyses

double span

SDOF 240 12 30 1.7 3 27000 6495 16748 2.13 0.98 283.5 0.98 23.6 0.098 0.096 51.5 1.0 double span

SDOF 240 12 30 1.7 3 27000 6495 16748 2.13 0.98 283.5 0.97 19.7 0.082 0.080 43.2 1.0 double span

SDOF 240 12 30 1.7 3 27000 6495 16748 2.13 0.98 283.5 0.97 15.9 0.066 0.064 34.8 1.0 double span

SDOF 240 12 30 1.7 3 27000 6495 16748 2.13 0.98 283.5 0.97 12.6 0.052 0.050 27.7 1.0 double span

SDOF 240 12 30 1.7 3 27000 6495 16748 2.13 0.98 283.5 0.96 8.0 0.033 0.032 17.9 1.0 double span

SDOF 240 12 30 1.7 3 27000 6495 16748 2.13 0.98 283.5 0.94 5.5 0.023 0.021 12.4 1.0 double span

SDOF 240 12 30 1.7 3 27000 6495 16748 2.13 0.98 283.5 0.85 1.9 0.008 0.006 4.8 1.1 double span

SDOF 240 12 30 1.7 3 27000 6495 16748 2.13 0.98 283.5 0.65 0.8 0.004 0.002 2.8 1.3

double span SDOF 360 30 30 3.4 3 67500 13581 40541 0.68 0.59 587.4 0.58 35.7 0.099 0.097 41.8 1.0

double span SDOF 360 30 30 3.4 3 67500 13581 40541 0.68 0.59 587.4 0.58 25.8 0.072 0.069 30.3 1.0

double span SDOF 360 30 30 3.4 3 67500 13581 40541 0.68 0.59 587.4 0.57 16.6 0.046 0.044 19.7 1.0

double span SDOF 360 30 30 3.4 3 67500 13581 40541 0.68 0.59 587.4 0.57 12.8 0.036 0.033 15.3 1.0

double span SDOF 360 30 30 3.4 3 67500 13581 40541 0.68 0.59 587.4 0.55 7.3 0.020 0.018 9.0 1.1

double span SDOF 360 30 30 3.4 3 67500 13581 40541 0.68 0.59 587.4 0.53 4.9 0.014 0.011 6.3 1.1

double span SDOF 360 30 30 3.4 3 67500 13581 40541 0.68 0.59 587.4 0.40 1.7 0.005 0.002 2.9 1.3

double span SDOF 360 30 30 3.4 3 67500 13581 40541 0.68 0.59 587.4 0.35 1.3 0.004 0.001 2.5 1.4

81

VITA

Mr. McKay was born in Panama City, Panama in 1978 where he completed his high

school education in 1995. From 1998 until 2002, Mr. Mckay attended John Brown University in

Siloam Springs, AR where he obtained his Bachelor of Engineering degree with Electrical

Concentration in 2002.

Currently, Mr. Mckay is a Project Engineer at Protection Engineering Consultants, and

has 6 years of experience in the field of security and protection engineering. Mr. McKay’s

experience includes research, testing of barriers and structural components, and design and

analysis of structures to mitigate the effects of blast loads and progressive collapse. Research

and testing experience includes the investigation of load factors used in dynamic analysis of

buildings for Progressive Collapse, shear capacity of bridge piers subjected to blast loads, breach

and flexural capacity of high-strength concrete panels and counter-mobility barriers.

In the future, Mr. Mckay hopes to continue his development in the area of Anti-Terrorism

and Force Protection by developing new and innovative ways of protecting people and

structures.


Recommended