Abstract The importance of analyzing different businessmodels and technologies in the mobile industry has becomemore crucial for the investment policy of the telecom oper-ators. This paper aims to cover some of the most interestingbusiness alternatives in providing the new 3G and beyondservices including cases where the operator already hasan existing second-generation cellular network and perhapseven a license for the 3G UMTS network, and cases wherethe operator does not have any existing network. Three casesfor incumbents and new entrants are foreseen, leaving al-ternatives for new competing 3G technology deployment oracting as a mobile virtual network operator (MVNO) with-out owning any radio infrastructure. A techno-economic ap-proach has been used to identify business opportunities andquantify the potential profitability of different kind of busi-ness players. The scenarios have been analyzed in the West-ern European context by different country groups that arenot exactly representative of any defined country, but rathershare typical demographic characteristics.
D. Katsianis · D. VaroutasUniversity of Athens, Athens, Greece
T. Smura · K.R.R. KumarHelsinki University of Technology, Helsinki, Finland
T.G. Eskedal · R. VenturinTelenor, Fornebu, Norway
O.P. PohjolaNokia, Espoo, Finland
Keywords Mobile telecommunication · Network andservice rollout · Business models · MVNO · 3G
1 Introduction
Mobile business has become one of the drivers of the worldeconomy during the last 10 years. Implications of new tech-nologies, user needs, emerging business models, market anddemographic conditions and regulatory aspects have to beunderstood, as creating a successful investment strategy fora network, service or virtual operator. The winning schemesand the financial margins for each business approach haveto be discovered.
Offering rich broadband services in conjunction withthe traditional mobile voice services seems to be the nextstep for most of the European network and service oper-ators. Network operators are extending their capacity forwideband/broadband applications, whereas service opera-tors promote new services to attract customers and increaserevenues. 3G mobile technologies have opened up new pos-sibilities in providing advanced value-added data and con-tent services, such as rich video and audio, games, locationservices and m-commerce. Service related aspects have tobe combined with different technologies, and all the pos-sible business plans, with deferent partnering alternatives,should be investigated by the players, making the beyond3G business extremely complicated.
Techno-economic analysis of telecommunication sys-tems and services, combining the economical and businessaspects with a comprehensive technical parameters model-ing, has not been widely published [1–3]. Handling of busi-ness models and earning logics has to be combined withmarket forecasts, willingness to pay, and cost modeling of
both operational and capital expenditures in a right granu-larity to gain balanced results.
In this paper, a representative set of possible business sce-narios have been selected. These include cases for incum-bents and new entrants, those having a UMTS license andthose lacking it—leaving a choice between using an alterna-tive technology or acting as a Mobile Virtual Network Oper-ator (MVNO) without own radio infrastructure. These sce-narios will be described in the next chapters, with the aimto highlight the potential business profitability by utilizingvarious types of technology and business models. A techno-economic approach has been used to identify business op-portunities and quantify the potential profitability of differ-ent kind of business players. With the utilized scenario ap-proach we analyze three alternatives to enter the beyond 3Gmobile business, as the possibilities are quite different de-pending on the background and assets in the telecom busi-ness, and on the investment potential and risk aversion of thecompany.
The presented results are based on the work within EU-REKA Celtic project ECOSYS. For more details, please seethe reference [4].
2 Business scenarios selection
In this paper, three scenarios are introduced to cover someof the most interesting business alternatives in providing thenew 3G and beyond services. The opportunities and strate-gies differ between operators that already have an existingsecond-generation cellular network and possibly a licensefor the 3G UMTS network, and operators that do not haveany existing network.
Scenario 1 (2G incumbent operator with or withoutUMTS license) analyses the incumbent player, i.e. one whohas an existing 2G network, and wants to deploy its own3G network. This study setting compares, two alternatives:UMTS deployment (with license), and a new competing 3Gtechnology deployment. As we are here looking at incum-bent players, we normally have clear connection betweenthe Service Operator and the Network Operator sides ofthe business. So in this scenario we have currently onlyone Service Operator and one Network Operator linked to-gether. Even as such, however, this separation gives inter-esting insight to the economical dynamics of these entities.There is available techno-economic research handling the3G competition on a monolithic operator framework, e.g.[5–7] and [8], but they are not analyzing the service andnetwork sides of the business separately.
The competing 3G technology here was in the early studyperiod loosely defined as “OFDM”, the characteristics ofwhich include full IP compatibility throughout the network,and an effective OFDM radio frequency utilization. Later, as
the competition revealed WiMAX to be the most prominentchallenger of the cellular based 3G technologies, the analy-sis was completed with the technical and economical para-meters relating to Mobile WiMAX (IEEE 802.16e). Withinall alternatives, full GPRS coverage is supposed to be al-ready built, and it is possible to utilize also EDGE technol-ogy as a fast upgrade for new services. As all the investi-gated technologies have different performance characteris-tics, which on their half affect the user behavior in the ser-vice take-up, the modeling of these characteristics is of cru-cial importance.
The first scenario tries to find answers to questions like:Is it possible in the Western European context to competeUMTS with some other technology, if no license for UMTSfrequencies is possessed? How the business situation differsfor the Service Operator compared to Network Operator? Isan intermediate EDGE deployment paying back in the endresults? Does the HSDPA upgrade increase profitability ornot?
Scenario 2 (2G and 3G Service Provider/MVNO) ana-lyzes the new entrant case, where there are no new licensesavailable for GSM/UMTS networks. Many firms, workingin the telecom sector or not, have expressed their interest toenter the market through the networks operation or the ser-vice provision channel. For those, who have been left with-out license, a new channel to enter the market is the MVNOchannel or the service-provisioning channel. This scenariois important for comparing the investment levels, cost struc-tures, and revenue streams between the SP and MVNO sce-narios as well as analyzing the key differences between thesetwo models in terms of business profitability.
Scenario 3 (CDMA450 Business Case) analyzes the newentrant case, where there is possibility to get a license tobuild a network utilizing the 450 MHz frequency band.CDMA450, based on the CDMA 2000 technology, has at-tracted keen interest in the industry. One of the initial drivershas been the opportunity to reuse the 450 MHz spectrumfrom the exiting NMT450 analogue cellular systems for anew digital radio technology. In addition to the wide cover-age capabilities of the 450 MHz spectrum due to the lowfrequency, the CDMA450 system enables building a 3Glike mobile network with enhanced service capabilities com-pared to 2G. The scenario thus describes the case of a Green-field CDMA 450 operator entering the market concentratingto the sparsely populated areas.
3 Assumptions
A study period of eight years and a discount factor of 15%are used in the analysis for all scenarios.
Alternatives for mobile operators in the competitive 3G and beyond business 79
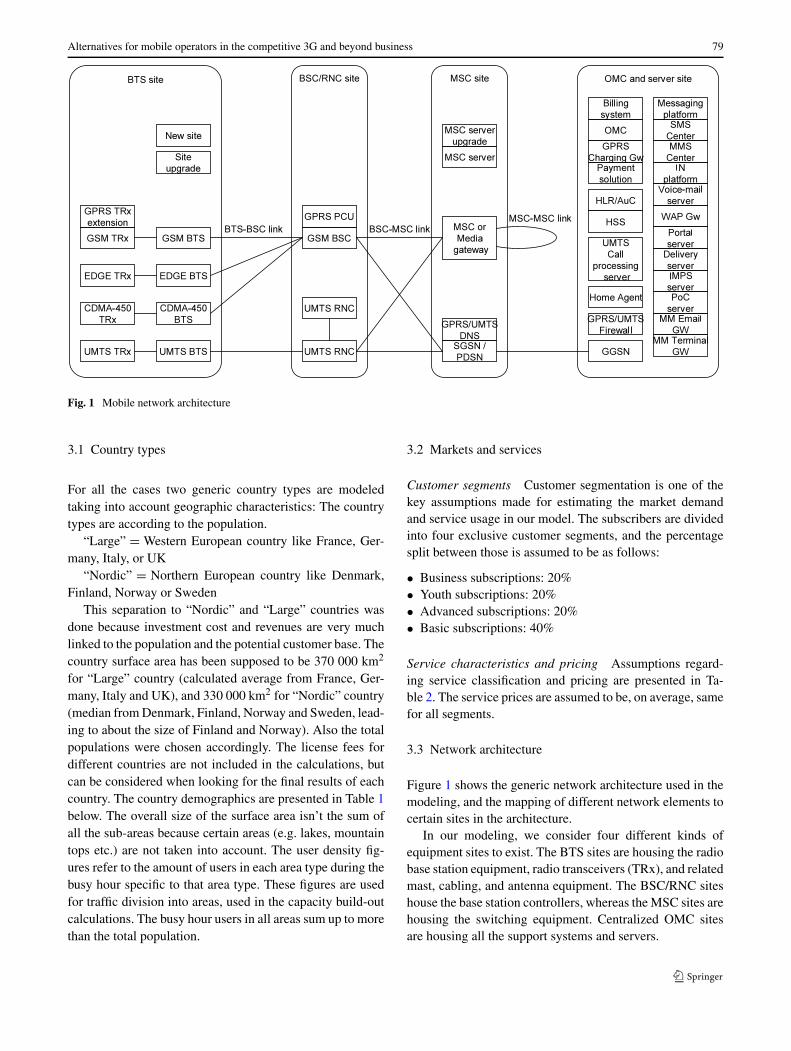
Fig. 1 Mobile network architecture
3.1 Country types
For all the cases two generic country types are modeledtaking into account geographic characteristics: The countrytypes are according to the population.
“Large” = Western European country like France, Ger-many, Italy, or UK
“Nordic” = Northern European country like Denmark,Finland, Norway or Sweden
This separation to “Nordic” and “Large” countries wasdone because investment cost and revenues are very muchlinked to the population and the potential customer base. Thecountry surface area has been supposed to be 370 000 km2
for “Large” country (calculated average from France, Ger-many, Italy and UK), and 330 000 km2 for “Nordic” country(median from Denmark, Finland, Norway and Sweden, lead-ing to about the size of Finland and Norway). Also the totalpopulations were chosen accordingly. The license fees fordifferent countries are not included in the calculations, butcan be considered when looking for the final results of eachcountry. The country demographics are presented in Table 1below. The overall size of the surface area isn’t the sum ofall the sub-areas because certain areas (e.g. lakes, mountaintops etc.) are not taken into account. The user density fig-ures refer to the amount of users in each area type during thebusy hour specific to that area type. These figures are usedfor traffic division into areas, used in the capacity build-outcalculations. The busy hour users in all areas sum up to morethan the total population.
3.2 Markets and services
Customer segments Customer segmentation is one of thekey assumptions made for estimating the market demandand service usage in our model. The subscribers are dividedinto four exclusive customer segments, and the percentagesplit between those is assumed to be as follows:
Service characteristics and pricing Assumptions regard-ing service classification and pricing are presented in Ta-ble 2. The service prices are assumed to be, on average, samefor all segments.
3.3 Network architecture
Figure 1 shows the generic network architecture used in themodeling, and the mapping of different network elements tocertain sites in the architecture.
In our modeling, we consider four different kinds ofequipment sites to exist. The BTS sites are housing the radiobase station equipment, radio transceivers (TRx), and relatedmast, cabling, and antenna equipment. The BSC/RNC siteshouse the base station controllers, whereas the MSC sites arehousing the switching equipment. Centralized OMC sitesare housing all the support systems and servers.
80 J. Harno et al.
Table 1 Population covered in Large and Nordic country examples
Country type Large Nordic Description
Area size 370,000 330,000 Size of surface area of the country (km2)
Area dense 185 17 Size of dense urban area (km2)
Area urban 2,960 264 Size of urban area (km2)
Area suburban 37,000 3,300 Size of suburban area (km2)
Area rural 303,400 264,000 Size of rural area (km2)
Users dense 50,000 50,000 Number of users in dense urban area per km2 (during busy hour)
Users urban 4,000 4,000 Number of users in urban area per km2 (during busy hour)
Users suburban 1,000 1,000 Number of users in suburban area per km2 (during busy hour)
Users rural 40 3 Number of users in rural area per km2 (during busy hour)
Total Population 65,000,000 5,500,000 Total population
Table 2 Service classification and pricing
Service Description Price unit Price in 2005 Ann. price reduct.
Subscription SIM card €/month 2.00 0%
Voice Make and receive calls €/min 0.08 15%
Video call Make and receive calls €/min 0.16 15%
Push-to-talk over cellular Make and receive calls €/min 0.05 10%
Downloads E.g. music files and games €/transact. 1.00 20%
Browsing Browse to web sites and content €/MB 0.80 20%
Streaming Audio streaming €/MB 0.80 20%
Other data Business data etc. €/MB 0.80 20%
Network elements Table 3 shows assumptions regardingthe cost and capacity characteristics of some of the key ra-dio network elements. Only radio network elements are pre-sented here as they comprise about two thirds of the totalnetwork investments. For control, core, operation and sup-port, and service related elements and prices, refer to theECOSYS deliverables [1]. For many elements, like base sta-tions, the anticipated annual price reduction is about 15% inthe beginning of the study period (price curve with severalparameters applied; for the Cost Evolution Model refer to[8] and [11]).
Network dimensioning Network dimensioning aims at cal-culating the optimal number of network elements (includ-ing nodes and links) that fulfills the capacity, coverage, andquality of service demands of the service area at minimaltotal costs (OPEX + CAPEX).
The network dimensioning in the business cases is mod-eled according to the following logic:
1. Traffic demands in different area types are calculatedbased on the service usage forecasts.
2. The number of radio base station sites and transceivers iscalculated for each area type based on the cell range andcapacity assumptions.
3. The number of core network elements like BSC/RNCsand MSCs, SGSNs, GGSNs is calculated from the basestation amount, generated traffic load and subscriber/useramount based on the network element capacities.
4. The number of backhaul and core transmission links(BTS-BSC, BSC-MSC, MSC-MSC) is calculated basedon network architecture, generated traffic, and availablelink capacities. Transmission network is not built by theoperator themselves, but leased, and the costs are thusincluded in the operational expenses.
5. The number of OMC-related and value-added service el-ements is calculated based on capacity figures relating tonumber of transactions, service requests, messages, andusers. In some cases, just one element is needed per op-erator.
Alternatives for mobile operators in the competitive 3G and beyond business 81
Table 3 Network element characteristics
Component Reference price 2005 Capacity
EDGE BTS Site and Installation 30 000 (no price reduction) Upgrade to existing GSM site, no active equipment
EDGE BTS (update) 24 000 3 sectors + 3 TRX install., max 6 TRX per sector, max 18 TRX per BTS
EDGE additional TRX 5 700 Max. 256 kbps
UMTS BTS Site Installation 35 000 (no price reduction) Upgrade to existing GSM site, no active equipment
UMTS BS 34 000 3 sectors × 2 bands, max 6 TRX per sector, max 18 TRX per BS
aThree sector cells, indoor coverage probability 80%, also outdoor coverage might be relevant in certain later described casesbOptimistic in relation to current simulations against realistic conditions, takes into account the future development; at least 2-Rx terminals orMIMO assumed
For radio network dimensioning, the required assumptionsinclude both coverage and capacity related parameters, asshown in Table 4.
3.4 Operational expenditures
The following generic breakdown is used to distribute therelative OPEX costs according to the available information:
Group A: Network related elements
− Maintenance of equipment and components− Equipment and software licenses, outsourcing− Network operation and maintenance (incl. OSS)− Planning and optimization− Rental of physical network resources, e.g. leased lines− Site rental and electricity costs
− Yearly cost of radio spectrum licenses
Group B: Marketing and sales related elements
− Sales and marketing− Customer acquisition− Handset subsidies
Group D: IT, support and service development related ele-ments
− Service management− New service development− Business IT (like SAP)− Payroll systems− Logistics and inventory− Human resources management− Management support− End-user support− Reporting for the regulator− Third parties/consulting− Content related
It should be noted that the “cost of goods sold” is not in-cluded in this breakdown, although many operators act alsoas handset resellers. Neither are the related revenues countedin the business cases, but the handset subsidies costs aretracked separately and included here in the sales and market-ing costs. For more information about the presented group-ing, please see the ECOSYS Deliverable 6 “OPEX mod-els” [4].
Our estimation of monthly OPEX costs of 13–39 € persubscriber can be further divided into grouping presentedabove, based on the knowledge and history data we haveon the GSM operators. Here again we perceive much vari-ance between different kinds of operators. Diverse compe-tition strategies are available that affect immediately one ormore of the OPEX groups: high or low network quality, bigor small marketing investments, good or moderate customerservice, etc.
For reference, the estimated W–European division of to-tal network and service operator OPEX in the case studies isas follows:
• Network related elements 20%• Marketing and sales related elements 26%• Customer service related elements 8%• IT, support and service development 11%• Interconnection and roaming costs 35%
Leased line rental Costs relating to the base station back-haul and transport network connecting the BSC sites andcore sites are modeled as leased lines and thus included intothe operational expenditures. The required number of basestation sites, BSC/RNC sites, and core network elements ineach area type is calculated according to the principles de-scribed in the Network dimensioning section. The assumednumber of MSC sites and their interconnection links is 15nodes and 23 links (providing redundant paths).
The number of leased lines between base station sitesand RNC/BSC sites, as well as between RNC/BSC sites andMSC sites is calculated based on the traffic amounts. Therequired leased line lengths are calculated based on the as-sumptions shown in Table 5.
When the exact number of transmission links and theirlengths (node distances) are known for each year, the re-lated leased line costs (OPEX) are calculated according toTable 6.
It should be noted that the leased line prices in differentcountries might vary substantially.
4 Scenario modeling, results and discussion
4.1 2G incumbent operator with or without UMTS licensecase
This scenario analyses the incumbent player, i.e. one whohas an existing 2G network, and wants to deploy its own3G network to survive in the new 3G and beyond servicecompetition. This study setting includes, and compares, two
Table 5 Geographicaldistances between key networkcomponents
Distances (km) Dense urban Urban Suburban Rural
BS/BTS–RNC/BSC 2 10 20 30
RNC/BSC–MSC 10 20 35 50
MSC–MSC = 2 ∗√
CountryArea (km2)π∗NumberOfMSCs = 177 km
Table 6 Leased line tariffassumptions Capacity Basic price per line/year (2005) Additional price per km/year (2005)
2 Mbit/s (BS/BTS–RNC/BSC) 5 400 € 486 € (Large)
240 € (Nordic)
155 Mbit/s (RNC/BSC–MSC) 16 913 € 1920 €
Up to 10 Gbit/s – 3144 €
Alternatives for mobile operators in the competitive 3G and beyond business 83
alternatives: UMTS deployment (with license), and a newcompeting 3G technology deployment. In both cases, an ini-tial EDGE deployment is considered. For the UMTS case,also the potential savings through inclusion of HSDPA up-grade have been studied. For this scenario, only the “Large”country type has been analyzed.
This analysis approach is unique in published literature aslinking three models dynamically together; namely the Net-work Operator cost modeling, the Service Operator serviceprovisioning, revenue and operational expenditure model-ing, and the end-user benefit and behavior modeling, all re-lating to the emerging advanced mobile telecommunicationbusiness and technologies.
4.1.1 Technology alternatives investigated
As an evolution path for GSM and GPRS technologies,EDGE, UMTS and HSDPA technologies are modeled. Mo-bile WiMAX technology has been modeled as representingan alternative technology approach for an operator withoutUMTS license. The technical and cost parameters of eachtechnology have been presented in the previous chapter.
Worse availability and choice of the Mobile WiMAXhandsets is seen in the lower service take-up figures in thebeginning. As the Mobile WiMAX technology has been de-ployed in the higher bands, it has smaller site coverage areathan UMTS. This has cost effects especially in the rural ar-eas, where the capacity need per surface area is low. Forthese reasons Mobile WiMAX has been deployed only inthe urban areas.
Although there are already several business case analy-ses for the fixed WiMAX, no comprehensive quantitativeanalyses, except some commercial analyst reports, are avail-able on Mobile WiMAX. An extensive list of references onWiMAX technology is available in WiMAX Forum Inter-net pages [9], and on UMTS and HSDPA in Global mobileSuppliers Association (GSA) Internet pages [10].
The WiMAX, UMTS and HSDPA parameters presentedin the preceding Assumptions chapter are based on real en-vironment and normal usage conditions simulation results.Many earlier studies base on pre-implementation theoreticalparameters.
4.1.2 Rollout schemes and related investments
The study period starts from year 2006 (first calculated in-vestments) continuing until year 2013. In the beginning theNetwork Operator has the GSM capacity built up to sup-port the traffic level at the year 2006. Also the initial quitelow data traffic is supported by the existing GPRS capabil-ity. After that point, the needed extra GSM/GPRS capacityis rolled out and calculated in the model. If the EDGE capa-bility update is decided to be rolled out, it takes place in theyear 2006.
For the UMTS there are regulatory rollout requirements,which differ country by country, but we have used genericschedules. UMTS rollout starts in the year 2006, and theservice is provided from the beginning of the year 2007. Thedeployment starts at the same time in all area types, but takesone year to cover the Dense area, two years for the Urban,three years for the Suburban, and 7 years to cover the wholerural area.
The rollout of the base stations (BS) is based on the cellranges given in Table 4; three pentagon cells (sectors) aremodeled for each BS, so that the BS coverage area is approx-imated to be 1.95R2, where R = “Cell range” in the Table 4.Other equipments are counted accordingly, either based onBS amount, or the required capacity. Most significant ele-ments’ capacities and historical price data are presented inthe Table 3. A cost evolution model utilizing learning curveexpression with several parameters has been applied; for theformulas refer to [8] and [11]. For elements like base sta-tions, the anticipated annual price reduction is about 15%in the beginning of the study period. After the BS coveragehas been built out, the needed additional BS/TRX capacityis rolled out in the previous calendar year of the foreseentraffic amount; the capacities (throughputs) of the differentradio technology BSs are included in the Table 4.
The Mobile WiMAX rollout is considered later than inthe UMTS case, starting in the year 2007, so that the ser-vice provisioning can start in the beginning of the year 2008.The rollout schedule has the same pace as with UMTS, butwithout the suburban and rural rollout. The development ofpopulation coverage for different technologies is presentedin the following figure. In addition, the potential traffic fromthe terminals using the most advanced technologies has beenpresented.
An extensive list of references on cost analysis of thewireless networks can be found in [12], and a more recentstudy in [13].
4.1.3 Services and revenues
Demand modeling is based on penetration estimates for dif-ferent technology subscribers in selected segments and theirforecasted usage patterns. End-user modeling gives the us-age amounts for active users of each service, per each seg-ment and each technology.
The first step in the end-user modeling is to build the userexperience and behavior process for the provided services.Process includes everything related to what the user experi-ences while interacting with the service: pricing, usability,service penetration (for person-to-person services), networkperformance, and the actual usage, e.g. listening the piece ofmusic. Process includes also behaviors like reattempts andwaiting times.
The parameters relating to the user experience dif-fer by technology and user segment. The most impor-tant differences between technologies are: Network block-ing/unavailability, Technical trouble or delay, Practical up-stream bit rate, Practical downstream bit rate and Perceivedquality of the service channel (differs especially for highcapacity requiring services, like video call or streaming).All the above parameters are clearly better for the advancedtechnologies UMTS and WiMAX compared to the lowerlevel technologies EDGE and especially GPRS. The dif-ferences between user segments include their valuation be-tween time and money and their capabilities to use the ser-vices. The applied tariffs and tariff erosion are same to alltechnologies (presented in the Table 2).
The role of the end-user model is to create a link betweenservice usage and user experiences with different technolo-gies, user segments, and services. The reference parametervalues used to calibrate the initial usage amounts with theset tariff levels are chosen between the advanced technologyvalues and EDGE parameter values. Based on the parame-ters the end-user model calculates the benefit, cost, and suc-cess figures for each technology, service, and user segment,and for the reference. The actual paid tariff is part of thecosts, which include also the so-called opportunity cost dueto loss of available alternative benefits. Valuation of oppor-tunity cost takes into account also the value of time, whichdiffers between the four segments used in the modeling.
The service usage for technologies, user segments, andservices are calculated using the end-user model by compar-ing the benefit, cost, and success figures with the reference.As the parameter values get better along with the advancedtechnologies the usage grows from the reference values, andrespectively in case of lower level technologies the usagediminishes as the user expectations are not met. For moreabout the utilized end-user model, see Deliverable 19, Ap-
pendix A, in [4]. Generally about end-user benefit analysisrelating to mobile services, see [14].
Upon the usage figures we have applied the market sizeand market share of the operator, technology penetrations,and rollout schedules, to get the user amounts. As the End-user model gives the usage volumes for active users of eachservice in each segment and technology, we have in addi-tion estimated the penetrations of active users of each ser-vice type in each segment and technology.
Estimated percentages of different technology subscribersare based on terminal/handset penetrations. When the pop-ulation coverage is incomplete, the potential usage and traf-fic amounts realize only partially according to the availablecoverage. The figures are dependent on the particular net-work operator and service operator provisioning. The popu-lation coverage development by the Network Operator waspresented in Fig. 2. It should be noted that e.g. EDGE pen-etration is tracked here as for operator who provides EDGEnetwork, not as general EDGE penetration. It is foreseenthat if the operator goes for UMTS its data subscriber baseis quite fast migrated from EDGE to UMTS, boosted bysubscription packages including terminals and related ter-minal subsidies. WiMAX is in a weaker position to reachmass penetration in the W–E mobile market due to the pathdependency of the dominant players and the benefit of scalein handsets, but has its possibility in the more niche marketof special IP centric approach. The penetrations for usersof different technologies are presented in Fig. 3. Those datausers not having any of the presented technologies are sup-posed to use GPRS.
Subscribers utilizing more advanced technologies aresupposed to have also the less advanced technologies in use.WiMAX penetration is estimated to be clearly lower thanUMTS, due to the terminal availability, form and price fac-tors. Potential laptop users e.g. are considered to be muchlower in number than pocket size handset users.
Alternatives for mobile operators in the competitive 3G and beyond business 85
Fig. 3 Potential users ofdifferent technologies
The customer base is supposed to be 16.5 million in theyear 2007, comprising a 30% market share of mobile usersfrom the total population of 65 million. The penetrations ofactive users are out of this user base. Voice and SMS ser-vices are supposed to have 100% penetrations in all seg-ments. Each technology induces slightly different penetra-tions for data services, so that higher capacity technologyimposes more users, but this increase is not as significantas the usage amount difference calculated in the End-usermodel.
The Service Operator’s revenues are calculated by com-bining the technology related user behavior from End-usermodel (usage amounts for the selected price level), with seg-ment sizes and related actual active service users. The earlierthe enhanced technology is deployed, the more traffic is gen-erated, but only in the limits of general demand developmentand terminal availability. The generated average revenue peruser (ARPU) is clearly higher for the more advanced tech-nologies. On the other hand, also the costs are higher forearly capacity deployment.
The Network Operator’s revenues are based on the traf-fic amounts calculated in the Service Operator model. Thewholesale tariff levels are defined so that the operating prof-its of the Service Operator and Network Operator are at thesame level in the UMTS case. Same wholesale tariffs areapplied for all cases.
Wholesale prices that the Service Operator pays to theNetwork Operator in the year 2006 are as follows, with 15%yearly price reduction applied thereafter:
• Narrowband conversational (voice): 0.011 €/min (in-bound and outbound)
• Wideband conversational (video telephony): 0.043 €/min(inbound and outbound)
• Data: 0.15 €/MB (both directions)
The annual price reduction is quite substantial comparedto the average tariff erosion in the recent years, but is inaccordance with the high increase of traffic foreseen, any-how causing the Network Operator revenues to grow. Atthis phase the wholesale data traffic pricing is not differ-entiated between e.g. streaming, interactive, or backgroundtraffic classes.
4.1.4 Results and conclusions
Five sub-scenarios will be presented: “UMTS with HSDPAplus EDGE deployment” “UMTS plus EDGE deployment”,“UMTS without EDGE deployment”, “WiMAX plus EDGEdeployment”, and “WiMAX without EDGE deployment”.For the NPV (net present value) calculations, discounts rateis 15%, due to the fact that in the turbulent markets andheavy technology competition the future revenues from theinvestments are somewhat unsure. With reasonably high dis-counts rate, the possibly positive results are more depend-able. The presented NPV does not include investments donebefore 2006 and potential positive cash flows after 2013,so it should be interpreted more like discounted cash bal-ance over the years 2006–2013, but a slight rest value of theequipment is included.
In the UMTS cases, Service Operator’s net cash flow in-creases towards the end of the study period. For the MobileWiMAX cases, such growth is not seen, and the end resultsare more modest, although the cash flow keeps clearly pos-itive. This is mainly due to UMTS being more mature tech-nology (handsets and network) in the beginning, being ableto serve all types of services.
From the cash flow results of the model, we can see thatthe revenues from the advanced services grow steadily in theUMTS case, as the demand and usage increase faster thanthe tariffs are falling, especially in the middle period. Theresults are improving also because the costs are leveling off
86 J. Harno et al.
Fig. 4 Cash flows of the Service Operator (UMTS + HSPA)
Fig. 5 Cash flows of the Service Operator (WiMAX)
towards the end of the study period. For the WiMAX case,the revenues do not grow to such level, because of loweramount of acquired high capacity users. See Figs. 4 and 5below.
The Network Operator, on the other hand, has negativecash balance for all cases in the beginning, but then in twoyears the discounted cash balance turns to steady growth.Due to the negative cash balance in the beginning Net-work Operator’s technology risk is higher compared to theService Operator, who does not have to make so big in-vestments. In the UMTS case, the Service Operator part-
ner can catch more advanced data users, so that the traf-fic and thus revenues are estimated to grow higher alsofor the Network Operator providing UMTS. The invest-ments or operational costs do not show crucial differencesbetween the technologies. However, because of less trafficand thus revenues the payback for the WiMAX investmentis not so strong in this kind of operator case. Cash flowsof UMTS and WiMAX cases are presented below in theFigs. 6 and 7.
According to the results shown in the Table 7 below, itseems that successful competition is possible also by uti-
Alternatives for mobile operators in the competitive 3G and beyond business 87
Fig. 6 Cash flows of the Network Operator (UMTS + HSPA)
Fig. 7 Cash flows of the Network Operator (WiMAX)
lizing another 3G technology, when the UMTS license isnot available. The results for Mobile WiMAX are some-what lower than for UMTS, but the license costs (which arenot included here), might be lower for the other technology.
However, there are still uncertainties relating to the dissem-ination of technologies, which are not yet in mature massproduction phase—either for the network part, or especiallyfor the terminal/handset part.
88 J. Harno et al.
Table 7 Network Operator and Service Operator investments and NPV summary
Technologydeployment
Unit NtwOper.CAPEXa
NtwOper.OPEXa
NtwOper. NPV ServOper.CAPEXa
ServOper.OPEXa
ServOper.NPV
UMTS/HSDPAwith EDGE
B€ 1.57 5.08 1.47 0.140 24.5 5.24
UMTS withEDGE
B€ 1.75 5.24 1.23 0.140 24.5 5.24
UMTS withoutEDGE
B€ 2.46 5.48 0.310 0.140 24.5 5.10
WiMAX withEDGE
B€ 0.919 4.40 0.330 0.103 19.7 4.32
WiMAXwithout EDGE
B€ 1.88 5.40 −1.88 0.103 19.2 3.02
aDiscounted values, from year 2006 to 2013
This increases the risks for Mobile WiMAX cases relatedto the potential delay in market maturity. For the HSDPA,the future concerning the terminal and network technologyavailability and maturity is already more assured.
Plain EDGE deployment does not give optimal resultsdue to lack of appeal to growing number of heavy datausers, but is best as an auxiliary solution together withUMTS or WiMAX. The auxiliary EDGE deployment hasclearly higher effect on the Network Operator business thanon the Service Operator. This reflects that the investmentsavings are considerable. For the 2G business player go-ing for Mobile WiMAX as 3G technology, the interme-diate EDGE deployment is crucial, so that without it theNO WiMAX case becomes heavily negative. These find-ings relate to the fact that EDGE is deployed in the be-ginning of the study period, and if the EDGE is not de-ployed, more low capacity GPRS base stations have to berolled out, raising the costs dramatically in WiMAX case.As the UMTS rollout is one year earlier, the effect is not sostrong.
The revenue potential from UMTS and Mobile WiMAXrelate to the End-user modeling results indicating that thegrowing revenues of especially business segment can onlybe captured with the higher-level technologies. HSDPA hasbeen modeled here only as cost saving factor, as the datacapacity per base station is increased, but it will probablyalso have some impact as to increase spending.
Especially the Network Operator part in the MobileWiMAX alternative is in weaker position as looking the re-sults, and also the risks are at the highest there, as the userbase growth is delayed compared to the UMTS path. For thisreason, it is natural that the WiMAX NO tries to raise thewholesale tariff levels. This would respectively cause somereduction in the profitability of the WiMAX Service Opera-tor.
In this scenario a high market share has been assumedas for an incumbent player. For a new entrant to W–E mar-
ket without 2G network the situation is more challenging, aswe can see also from the two other scenarios presented inthis paper. It would be possible to act as an MVNO in the2G market, and build only the 3G IP overlay with MobileWiMAX. In this case too the challenge is to get customerbase large enough to compete with UMTS—economies ofscale work for the UMTS players’ benefit in the W–E mar-ket. As the challenge is more in the network provider side,one possibility for the WiMAX NO could be to try to findseveral MVNOs to sell their IP based services (includingVoIP) operating on the deployed WiMAX network.
4.2 2G and 3G Service Provider/MVNO case
For a new entrant not having a license to build own net-work, or not willing to take the investment risks, the ServiceProvider/Mobile Virtual Network Operator (SP/MVNO) ap-proach provides an alternative business model. Here, thecrucial factor is the relationship and contract terms with theincumbent network operator.
The SP/MVNO business case can be analyzed from manyviewpoints. One interesting option would be to study thefeasibility of different types of MVNO strategies (e.g. costleadership vs. service leadership) for players with differ-ent backgrounds (e.g. fixed line operators, retailers, mediahouses). The quantitative nature of ECOSYS methodologyand tool, however, is better suited for studies with emphasison the cost (OPEX/CAPEX) and revenue structure of dif-ferent technology options. In this study, the differences be-tween two most commonly used virtual operator businessmodels are analyzed, including a SP scenario and a MVNOscenario.
Becoming an SP/MVNO is a possible strategy for opera-tors with many different backgrounds, e.g.:
1. Operator with 2G license and without 3G license (�3GSP/MVNO)
Alternatives for mobile operators in the competitive 3G and beyond business 89
Table 8 Summary of differences between the SP and MVNO model
# SP model MVNO model
1 Network operator’s identity Own network identity (MNC, IMSI)
2 Changing of network generally requires changing SIMcards, transferring prepaid subscription from one networkto another is not possible
Can route to other network, when required, withoutchanging SIM cards regardless of subscription type
3 Network operator’s interconnection agreements Own interconnection agreements
4 Services are based on services provided by the networkoperator, development of own services is very limited
Possibility to create value-added services (i.e. mobileswitchboard, short numbers etc.)
5 Incoming traffic to the network is priced according to thepricing of the network operator
Incoming traffic to the network is priced by operator itself
6 Services are priced according to the pricing offered by thenetwork operator
Services are priced component-specifically
7 Service operator from number portability viewpoint Network operator from number portability viewpoint
8 Network and value-added service elements of the networkoperator, it is not possible to have own value-added serviceelements
Own network elements MSC, HLR, SRR, IN as well asvalue-added elements if it so wishes
Voice calls (originating) 35% of retail price 35% of retail price
Voice calls (terminating) 0 35% of retail price
Video calls (originating) 35% of retail price 35% of retail price
Video calls (terminating) 0 35% of retail price
Other services (originating) 35% of retail price 35% of retail price
Other services (terminating) 0 0
2. Operator with 3G license but without 2G license (�2GSP/MVNO)
3. New entrant without any licenses (2G/3G SP/MVNO)4. Operator acting as an Mobile Network Operator in some
geographical markets and as an SP/MVNO in another.
In this study, the third case is assumed, i.e. the operatoris assumed to have no spectrum licenses in any markets.
The study concentrates on building a flexible model forcomparing the investment levels, cost structures, and rev-enue streams between the SP and MVNO scenarios. Themodel can be used to gain insight to the tradeoffs betweencosts and revenues when deciding on the most suitable levelof outsourcing. Furthermore, by comparing the results ofthis study to the other scenarios, the general feasibility ofboth SP and MVNO models can be assessed. The main dif-ferences between SP and MVNO model are presented in theTable 8 [17].
An incumbent operator with GSM, EDGE, and UMTSnetwork (see Scenario 1) has been assumed to be contractedwith for the network capacity required for the services. Thetwo models are very different in terms of investment struc-
tures. In the SP model the costs are mainly OPEX as most ofthe network equipment and service machinery is outsourcedto the network operator. In the MVNO model, the level ofoutsourcing is lower and CAPEX is higher due to invest-ments to own switching center, gateways, messaging cen-ters, etc. However, bulk of the investments is in the networkoperator side.
Most of the costs of a SP/MVNO are OPEX, from whicha significant part of consists of the outsourcing of the net-work infrastructure. In the case of SP, these costs are higher,as a result of higher degree of outsourcing. The pricing ofthe outsourced services is usually negotiated between theSP/MVNO and the network operator on a commercial ba-sis, without regulator intervention. Generally, the wholesaleprice level can be assumed to be somewhere between thenetwork operator’s cost of providing the network servicesand the retail prices. As the contracts can be freely negoti-ated, there are many options and possible revenue sharingmodels that could be applied. The negotiated wholesale tar-iffs with the network operator that are assumed for SP andMVNO are presented in the Table 9. For reference studiesand market data relied, see [15–17] and [18].
90 J. Harno et al.
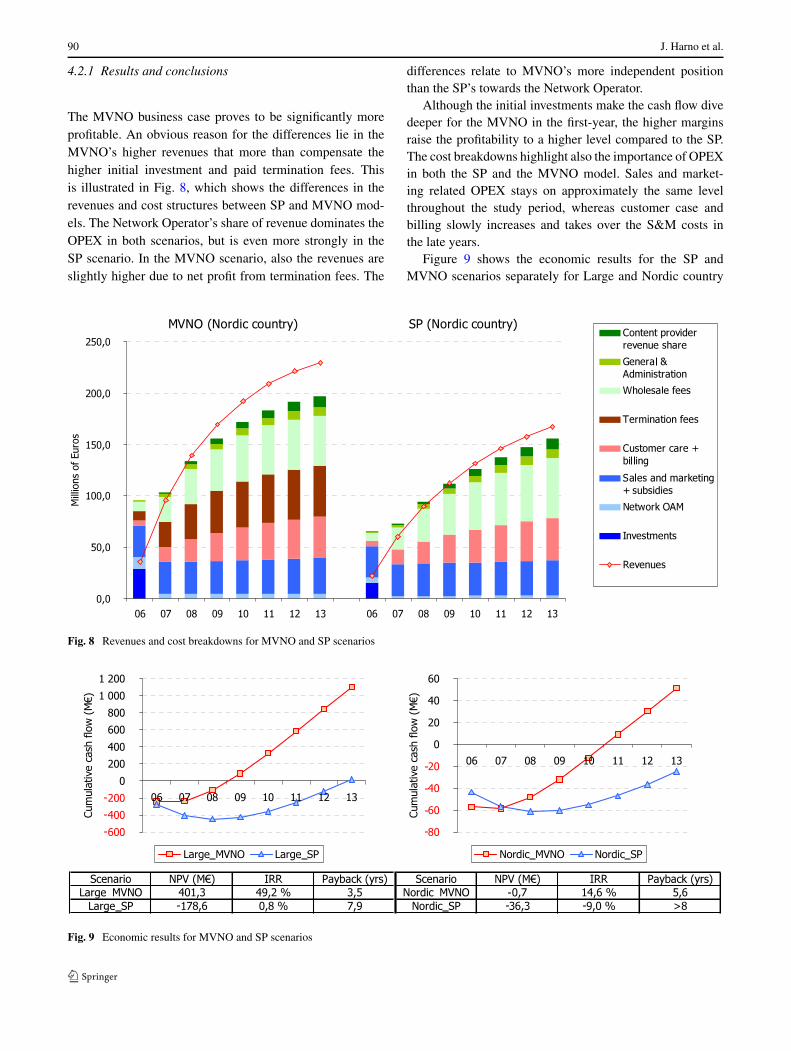
4.2.1 Results and conclusions
The MVNO business case proves to be significantly moreprofitable. An obvious reason for the differences lie in theMVNO’s higher revenues that more than compensate thehigher initial investment and paid termination fees. Thisis illustrated in Fig. 8, which shows the differences in therevenues and cost structures between SP and MVNO mod-els. The Network Operator’s share of revenue dominates theOPEX in both scenarios, but is even more strongly in theSP scenario. In the MVNO scenario, also the revenues areslightly higher due to net profit from termination fees. The
differences relate to MVNO’s more independent positionthan the SP’s towards the Network Operator.
Although the initial investments make the cash flow divedeeper for the MVNO in the first-year, the higher marginsraise the profitability to a higher level compared to the SP.The cost breakdowns highlight also the importance of OPEXin both the SP and the MVNO model. Sales and market-ing related OPEX stays on approximately the same levelthroughout the study period, whereas customer case andbilling slowly increases and takes over the S&M costs inthe late years.
Figure 9 shows the economic results for the SP andMVNO scenarios separately for Large and Nordic country
Fig. 8 Revenues and cost breakdowns for MVNO and SP scenarios
Fig. 9 Economic results for MVNO and SP scenarios
Alternatives for mobile operators in the competitive 3G and beyond business 91
Fig. 10 Sensitivity analysis results, Large country/MVNO
types. The MVNO business case proves to be significantlymore profitable in both country types. In the Large country,the MVNO scenario yields an NPV of over 400 M€ andthe payback time is 3.5 years, whereas the SP scenario hasnegative NPV and a payback time of almost 8 years. In theNordic country, the results are generally worse.
When comparing the results of the two country types, theLarge country business cases prove to be more profitable dueto better economies of scale and resulting lower unit costs.In both country types, however, OPEX outweighs CAPEXin cost breakdown and NPV sensitivity analysis. The mostsignificant OPEX elements include the Average Billing PerUser (ABPU), MNO’s share of the revenue, sales & market-ing costs, and customer care costs. Market share evolution,churn level, and network OA&M related costs are clearlyless significant. In Figs. 10 and 11, we can see that about13% reduction in ABPU can make even the Large countryMVNO case NPV negative, but about 7% increase in ABPU,or 10% reduction in MNO’s share of the revenue, can makethe Large country SP case positive. For further discussionon sensitivity analysis results, please refer to the Deliverable19 [4].
The contract terms and revenue sharing deal between theSP/MVNO and MNO are of prime importance when lookingfor a profitable business case. Based on the results of thisstudy, the MNOs share of retail revenue should not be morethan 30–40% in the MVNO case and 25–30% in the SP case.
Compared to the incumbent cases in previous scenarios,we can directly see that the revenue and profitability poten-tial is limited. Only in the “Large” country type, clear pos-itive results are indicated. These results are in line with theperception that only a few significant SPs or MVNOs areemerged and still in operation in the Nordic countries. Newmobile services, Internet business models and regulatory in-tervention in the wholesale pricing are the foreseen possibil-ities to change the situation.
4.3 CDMA450 case
This scenario investigates the potential of CDMA2000technology in 450 MHz frequency band, also known asCDMA450. The studied case includes a Greenfield CDMA-450 operator entering the Western-European market to com-pete with 2G and 3G mobile networks. The CDMA450 oper-ator has acquired a license for the 450-frequency band withthe possibility to use up to three 1.25 MHz carriers.
The operator enters a mature market in terms of com-munication facilities. There are already several GSM/GPRSand UMTS operators in the market. A fixed access operatorowns and runs a fixed network infrastructure from which thenewcomer will need to lease transport capacity. We assumethat initially multi-mode terminals that enable roaming be-tween CDMA450 and GSM/GPRS/W-CDMA networks arenot available in the market. We study the economics for a
92 J. Harno et al.
Fig. 11 Sensitivity analysis results, Large country/SP
combined Service and Network Operator with two build outstrategies: CDMA450 covered in the whole country or justin rural areas. Study period is 2006–2011. Monthly averagerevenue per user (ARPU) is €28,44.
The network build out parameters are presented in theSect. 3 Assumptions, in common with the Scenario 1. Thenew entrant operator aims to offer CDMA450 servicesthroughout the country. The focus however is on rural ar-eas, as the technology is intended to be used as an ADSLLight product offering data applications and VoIP servicesto the users. In the Nordic countries, where population in therural areas is scattered and where it is very difficult to rollout DSL technology, CDMA450 would thus be a substitute.The mobility comes as an extra value to the users. The oper-ator will support the customers throughout the country withCDMA450 coverage, and also the dense area roll-out is donefast, to support the customers possessing only CDMA450terminals. For reference studies and market data see [19, 20]and [21].
4.3.1 Results and conclusions
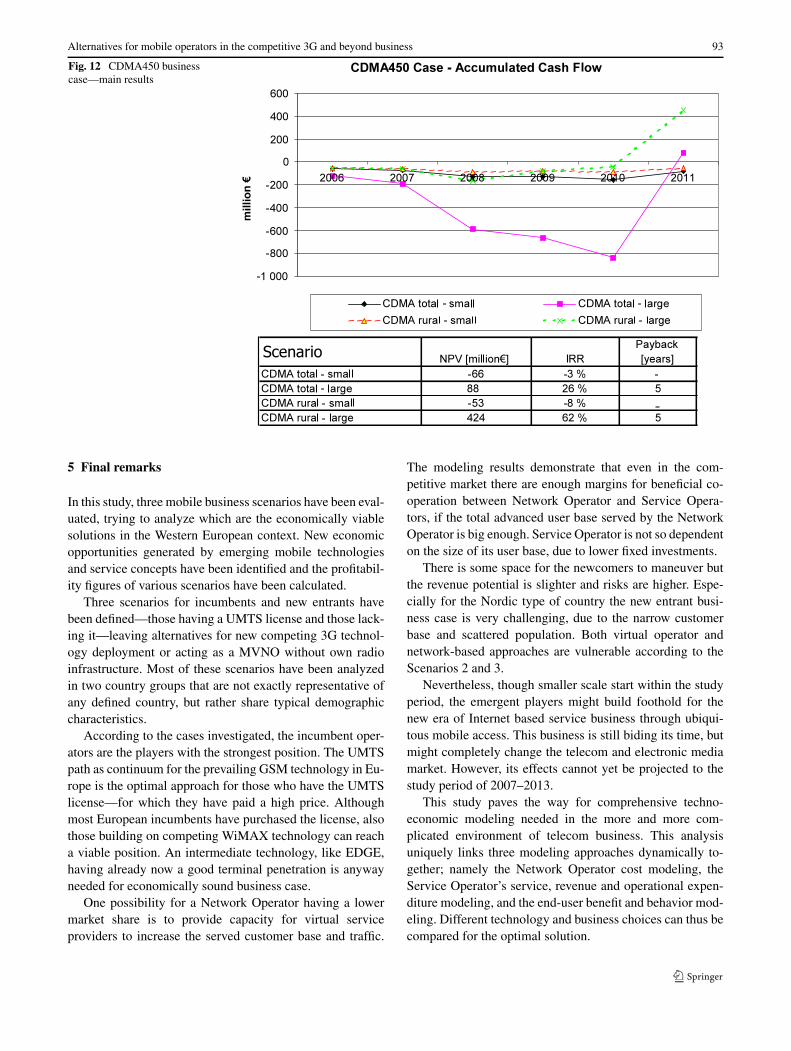
The main economics results are given in Fig. 12. The pre-sented results are obtained assuming Discount Rate of 15%.Presented values IRR and NPV are values before tax reduc-tion.
Results show that new entrant building CDMA450 net-work is not a competitive in small Western European coun-tries due to rather high investments and low customer base.On the other hand the case could give a pay back (5 years)in large country where customer base is much higher. Asseen, the NPV is positive for the large country cases bothfor the full country coverage and rural area coverage. Thebest case is the rural large country case. In this case thelarge coverage of each base station is one of the assetsfor CDMA450. However the market share is very uncer-tain and all cases involve high risks due to the networkinvestments. From Fig. 12 we can notice that especiallyin the “Large country with total coverage” case the accu-mulated cash flow goes quite deep with the network in-vestments. Altering the customer base will alter the prof-itability considerably. This means also that the businessplayer has to have a deep enough capital base for the op-eration.
These results are quite much in line with the conclusionsfrom the Scenario 2: in a Nordic type of small population,sparsely populated country the entry to the market is chal-lenging. Even though this scenario indicates positive resultsfrom the Large country type they are very risky and the payback time rather long. For that reason the Large countryMVNO case, with low investments, presents itself as morelucrative a choice.
Alternatives for mobile operators in the competitive 3G and beyond business 93
Fig. 12 CDMA450 businesscase—main results
5 Final remarks
In this study, three mobile business scenarios have been eval-uated, trying to analyze which are the economically viablesolutions in the Western European context. New economicopportunities generated by emerging mobile technologiesand service concepts have been identified and the profitabil-ity figures of various scenarios have been calculated.
Three scenarios for incumbents and new entrants havebeen defined—those having a UMTS license and those lack-ing it—leaving alternatives for new competing 3G technol-ogy deployment or acting as a MVNO without own radioinfrastructure. Most of these scenarios have been analyzedin two country groups that are not exactly representative ofany defined country, but rather share typical demographiccharacteristics.
According to the cases investigated, the incumbent oper-ators are the players with the strongest position. The UMTSpath as continuum for the prevailing GSM technology in Eu-rope is the optimal approach for those who have the UMTSlicense—for which they have paid a high price. Althoughmost European incumbents have purchased the license, alsothose building on competing WiMAX technology can reacha viable position. An intermediate technology, like EDGE,having already now a good terminal penetration is anywayneeded for economically sound business case.
One possibility for a Network Operator having a lowermarket share is to provide capacity for virtual serviceproviders to increase the served customer base and traffic.
The modeling results demonstrate that even in the com-petitive market there are enough margins for beneficial co-operation between Network Operator and Service Opera-tors, if the total advanced user base served by the NetworkOperator is big enough. Service Operator is not so dependenton the size of its user base, due to lower fixed investments.
There is some space for the newcomers to maneuver butthe revenue potential is slighter and risks are higher. Espe-cially for the Nordic type of country the new entrant busi-ness case is very challenging, due to the narrow customerbase and scattered population. Both virtual operator andnetwork-based approaches are vulnerable according to theScenarios 2 and 3.
Nevertheless, though smaller scale start within the studyperiod, the emergent players might build foothold for thenew era of Internet based service business through ubiqui-tous mobile access. This business is still biding its time, butmight completely change the telecom and electronic mediamarket. However, its effects cannot yet be projected to thestudy period of 2007–2013.
This study paves the way for comprehensive techno-economic modeling needed in the more and more com-plicated environment of telecom business. This analysisuniquely links three modeling approaches dynamically to-gether; namely the Network Operator cost modeling, theService Operator’s service, revenue and operational expen-diture modeling, and the end-user benefit and behavior mod-eling. Different technology and business choices can thus becompared for the optimal solution.
94 J. Harno et al.
Acknowledgements The authors would like to acknowledge thesupport from the EUREKA CELTIC program, and the colleagues inthe ECOSYS project.
References
1. Monath, T., et al. (2003). Economics of fixed broadband accessnetwork strategies. IEEE Communications Magazine, 41, 132–139.
2. Katsianis, D., et al. (2001). The financial perspective of the mobilenetworks in Europe. IEEE Personal Communications, 8, 58–64.
4. ECOSYS project web site: http://optcomm.di.uoa.gr/ecosys/deliverableslist.html.
5. Varoutas, D., et al. (2003). Business opportunities through UMTS-WLAN networks. Annals of Telecommunications, 58, 553–575.
6. Harno, J. (2002). 3G business case successfulness within the con-straints set by competition, regulation and alternative technolo-gies. The Journal of the Communications Network, 1(2), 159–165.
7. Harno, J. (2005). With or without UMTS license—can networkdeployment with alternative technologies compete with UMTS inEurope? The Journal of the Communications Network, 4(3), 147–152.
8. Olsen, B. T., et al. (2006). Technoeconomic evaluation of the ma-jor telecommunication investment options for European players.In IEEE network, July/August 2006.
9. WiMAX Forum, website: http://www.wimaxforum.org/.10. Global mobile Suppliers Association, GSA website: http://www.
gsacom.com/.11. Olsen, B. T., et al. (1996). Technoeconomic evaluation of nar-
rowband and broadband access network alternatives and evolutionscenario assessment. IEEE Journal on Selected Areas in Commu-nications, 14(8).
12. Johansson, K. (2005). Cost efficient provisioning of wireless ac-cess. Licentiate thesis, Royal Institute of Technology.
13. Johansson, K., Zander, J., & Furuskar, A. (2007). Cost efficientdeployment of heterogeneous wireless access networks. In Proc.IEEE vehicular technology conference VTC2007.
14. Pohjola, O.-P., & Kilkki, K. (2008). Value-based methodology toanalyse communication services. In 5th conference on telecommu-nications techno-economics (CTTE2006). Athens, Greece, June2006. Available at http:/holistic.nokia.com.
15. Smura, T., Kiiski, A., & Hämmäinen, H. (2006). Techno-economic analysis of mobile virtual network operators: strategies,investments, and revenues. In 5th conference on telecommunica-tions techno-economics (CTTE2006), Athens, 8–9 June 2006.
16. Katsianis, D., et al. 3G mobile virtual network operators(MVNOs): business strategies, regulation and policy issues.In S. Park (Ed.), Strategies and policies in digital convergence.Idea Group Publishing.
17. Saunalahti Group Oyj (2004). Capital Markets Day presentation30.11.2004. Available at http://www.saunalahtigroup.fi/.
19. Samra, S. (2004). Worldwide success of CDMA2000: benefitsto operators in 450 MHz. In CDMA450 evolution seminar. June2004, Warsaw, Poland.
20. Albright, P. (2005). Revision of the vision. In Evolution. 01 No-vember 2005. Available at http://www.telecoms.com/.
21. CDMA Development Group (CDG). (2005). Website. Available athttp://www.cdg.org.
Jarmo Harno received his M.Sc.degree in Mathematical Analysisfrom the University of Helsinki in1983. After working in SW indus-try he joined Nokia in 1987, andhas worked as systems analyst andmanager in R&D, Quality Assur-ance and Product Management. Hestarted as a senior research scientiston techno-economics with NokiaResearch Center in 2001. As do-ing research on the future telecomtechnologies and service concepts,he has also taken part in the EUIST framework co-operation project
TONIC (2001–2002) and EUREKA’s CELTIC co-operation projectECOSYS (2004–2006). Mr. Harno is an author of several journal ar-ticles and conference presentations relating to techno-economics andtelecom business modelling. He is also inventor for some patents relat-ing to telecom technology and services.
Dimitris Katsianis received theInformatics degree, the M.Sc. inSignal Processing and Computa-tional Systems from and the Ph.D.diploma in network desing withtechno-economics aspects from theUniversity of Athens, Dept. of In-formatics and Telecommunications.He is a research fellow with theOptical Communications Group,participating in several EuropeanR & D projects. He has worked asan expert scientific advisor with sev-eral firms in the field of techno-economic & network design studies
including national activities for techno-economic evaluation of broad-band strategies. His research interests include broadband communica-tions and methodology of network design with techno-economic as-pects. He has more than 50 publications in journals and conferences inthe field of techno-economics and telecommunication network designand he serves as a reviewer in journals and conferences.
Timo Smura is a research scientistand a post-graduate student in theDepartment of Communications andNetworking at the TKK HelsinkiUniversity of Technology. His re-search work has been published in avariety of journals, books, and con-ference proceedings. His researchinterests include emerging wirelesstechnologies and services, techno-economic modelling of mobile net-work investments, competition be-tween technologies and standards inmobile communications, and mo-bile operator business models andstrategies.
Alternatives for mobile operators in the competitive 3G and beyond business 95
Thor Gunnar Eskedal receivedhis M.Sc. degree in physics fromthe university of Oslo, Norway in1990. After graduation he startedworking as a research assistant atthe Norwegian institute of Technol-ogy (NTH) in Trondheim. In 1991he received his business economicsdegree from BI Norwegian Schoolof Management and joined TelenorR&I. At Telenor he started workingwith system architecture, broadbandtechnologies an IP network perfor-mance. Since 1998 he has been fol-lowing standardisation and uptake
of various wireless networks such a s 2G/3G and Wi-Fi. From 2006 hismain focus has been on business modelling, techno-economic analysisand strategy of network technology usage and roll out.
Olli Pekka Pohjola received a Mas-ter of Science in Technology withhonours in Engineering Physics andMathematics from Helsinki Univer-sity of Technology in 1998. Sincethen he has worked with Nokiain various positions. He designedthe first optical transport systemfor Nokia Networks and developednovel optical transport solutions inNokia Research Center. He has de-veloped a methodology to holisti-cally model and analyse user experi-ence, economic, and technology as-
pects of ecosystems. He was been commercializing the system withNokia Networks. Currently Olli-Pekka is a researcher for Smart SpacesLaboratory at Nokia Research Center, Tampere, Finland, where his re-search focuses on the conceptual model and user interfaces for theSmart World.
K.R. Renjish Kumar is a Ph.D.student at Helsinki University ofTechnology and Manager, TMETechnology Services Lab, at Cap-gemini Consulting, India. Prior tojoining Capgemini, he was withNetworking Lab, Helsinki Univer-sity of Technology as research sci-entist, working on techno-economicissues in mobile, convergence andinternational roaming. He was withSiemens ICM, Singapore as R & Dengineer, working on the policyserver design prototype for UMTScore network and with Cognizant
Technology Solutions as Programmer Analyst. Renjish has a Mas-ters (Computer science) from National University of Singapore(NUS) and B.E. (Electronics and communications) from NationalInstitute of Technology (N.I.T.) Surathkal, India. He participated inCELTIC/EUREKA project ECOSYS, involving key players of the Eu-ropean telecom industry as team member and work package leader forFixed-Mobile Convergence. Renjish has published over 20 papers ininternational conferences and journals on topics covering technologyas well as business issues in telecom and Internet. His current areasof interest include techno-economic and strategic studies in the tele-com, Internet and media sectors with a focus on systems, platformsand architectures. Renjish is a member of the IEEE.
Dimitris Varoutas holds a Physicsdegree and M.Sc. and Ph.D. diplo-mas in communications and techno-economics from the University ofAthens. He is a lecturer on telecom-munications techno-economics inthe Department of Informatics andTelecommunications at the Univer-sity of Athens. He has been par-ticipating in numerous EuropeanR & D projects in the RACE I &II, ACTS, Telematics, RISI and ISTframeworks in the areas of telecom-munications and techno-economics.He actively participates in several
techno-economic activities for telecommunications, networks and ser-vices such the ICT-OMEGA and the CELTIC/CINEMA projects, aswell as the Conferences on Telecommunications TechnoEconomics.He also participates in or manages related national activities for techno-economic evaluation of broadband strategies, telecommunications de-mand forecasting, price modelling etc. His research interests spandesign of optical and wireless communications systems to techno-economic evaluation of network architectures and services. He haspublished more than 60 publications in refereed journals and confer-ences in the area of telecommunications, optoelectronics and techno-economics, including leading IEEE Journals and conferences. He is amember of LEOS, Communications, Circuits and Systems, Educationand Engineering Management Societies of IEEE and serves as reviewerin several including IEEE journals and conferences.