Page 1
Alternatives for the production of propene oxide
Citation for published version (APA):Perez Ferrandez, D. M. (2015). Alternatives for the production of propene oxide. Eindhoven: TechnischeUniversiteit Eindhoven.
Document status and date:Published: 01/01/2015
Document Version:Publisher’s PDF, also known as Version of Record (includes final page, issue and volume numbers)
Please check the document version of this publication:
• A submitted manuscript is the version of the article upon submission and before peer-review. There can beimportant differences between the submitted version and the official published version of record. Peopleinterested in the research are advised to contact the author for the final version of the publication, or visit theDOI to the publisher's website.• The final author version and the galley proof are versions of the publication after peer review.• The final published version features the final layout of the paper including the volume, issue and pagenumbers.Link to publication
General rightsCopyright and moral rights for the publications made accessible in the public portal are retained by the authors and/or other copyright ownersand it is a condition of accessing publications that users recognise and abide by the legal requirements associated with these rights.
• Users may download and print one copy of any publication from the public portal for the purpose of private study or research. • You may not further distribute the material or use it for any profit-making activity or commercial gain • You may freely distribute the URL identifying the publication in the public portal.
If the publication is distributed under the terms of Article 25fa of the Dutch Copyright Act, indicated by the “Taverne” license above, pleasefollow below link for the End User Agreement:
www.tue.nl/taverne
Take down policyIf you believe that this document breaches copyright please contact us at:
[email protected]
providing details and we will investigate your claim.
Download date: 04. Mar. 2020
Page 2
Alternatives for the Production of
Propene Oxide
PROEFSCHRIFT
ter verkrijging van de graad van doctor aan de
Technische Universiteit Eindhoven, op gezag van de
rector magnificus, prof.dr.ir. C.J. van Duijn, voor een
commissie aangewezen door het College voor
Promoties, in het openbaar te verdedigen
op donderdag 12 februari om 16:00 uur.
door
Dulce María Pérez Ferrández
geboren te A Coruña, Spanje
Page 3
Dit proefschrift is goedgekeurd door de promotoren en de samenstelling van de
promotiecommissie is als volgt:
voorzitter: prof.dr.ir. R.A.J. Janssen
1e promotor: prof.dr.ir. J.C. Schouten
copromotor: dr.ir. T.A. Nijhuis
leden: prof.dr. K. Seshan (Twente University)
prof.dr. J.H. Bitter (Wageningen University)
prof.dr.ir. G.M.W. Kroesen
adviseur: dr. M.H.J.M. de Croon
Page 5
This research is supported by the Dutch Technology Foundation STW, which is
part of the Netherlands Organisation for Scientific Research (NWO) and partly
funded by the Ministry of Economic Affairs (project number 10745)
Alternatives for the Production of Propene Oxide
Dulce María Pérez Ferrández
Technische Universiteit Eindhoven, 2015.
A catalogue record is available from the Eindhoven University of Technology
Library
ISBN: 978-90-386-3775-4
Cover design by Jacobo Parga, Dulce M. Pérez Ferrández and Paul Verspaget
(Verspaget&Bruinink), using SEM and TEM images taken by Carlo Buijs.
Printed at Ipskamp Drukkers
Page 6
v
Table of Contents
1 Introduction……………………………………………………………………… 1
1.1 Propene oxide: uses and industrial production……………………… 1
1.1.1 The chlorohydrin process (CHPO)……………………………. 2
1.1.2 The hydroperoxide processes (PO/TBA, SMPO, CHP)……. 3
1.1.3 Hydrogen peroxide-based epoxidation………………………. 5
1.1.4 Comparison of existing technologies and other
alternatives………………………………………………………. 6
1.2 Hydrogen Peroxide to Propene Oxide (HPPO)………………………. 6
1.2.1 Titanium silicalite-1 (TS-1) …………………………………… 6
1.2.2 Reaction: Active sites and kinetics…………………………… 7
1.2.3 Hydrogen peroxide……………………………………………… 10
1.2.3.1 Synthesis of hydrogen peroxide.. …………………. 10
1.2.3.2 Decomposition………………………………………… 14
1.2.4 HPPO: Process integration…………………………………….. 15
1.3 Potential alternatives for the production of PO…………………….. 18
1.3.1 DSHP/HPPO: Direct synthesis of Hydrogen
peroxide/HPPO…………………………….…………………….. 18
1.3.2 HOPO: Direct synthesis with hydrogen and oxygen………. 19
1.3.3 DOPO: Direct epoxidation with molecular oxygen………… 22
1.3.4 Other alternatives………………………………………………. 23
1.4 Scope and outline of the thesis…………………………………………. 24
References………………………………………………………………………. 25
Page 7
Table of Contents
vi
vi
2 Gas phase epoxidation of propene with hydrogen peroxide vapor……. 33
2.1 Introduction……………………………………………………………… 34
2.2 Experimental……………………………………………………………. 37
2.2.1 Catalyst synthesis and characterization…………………… 37
2.2.2 Experimental setup……………………………………………. 37
2.2.3 Decomposition experiments………………………………… 38
2.2.4 Epoxidation experiments…………………………………….. 39
2.3 Results and discussion………………………………………………… 40
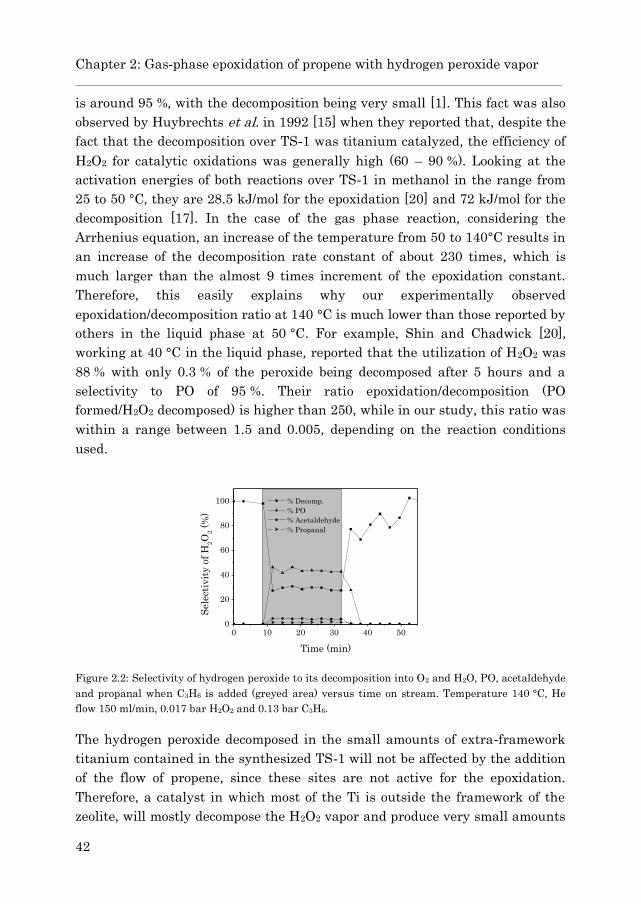
2.3.1 Hydrogen peroxide decomposition………………………… 40
2.3.2 Gas phase epoxidation……………………………………….. 43
2.4 Conclusions……………………………………………………………… 47
Appendix 2.A: TS-1 synthesis and characterization………………. 48
References………………………………………………………………………. 50
3 Microreactors for the liquid-phase epoxidation of propene: Coated
capillary microchannel and fixed bed microreactor…………………….. 53
3.1 Introduction…………………………………………………………….. 54
3.2 Experimental…………………………………………………………… 56
3.2.1 Preparation and characterization of TS-1-coated
capillaries and fixed-bed microreactor……………………… 56
3.2.2 Experimental setup……………………………………………. 59
3.2.3 Epoxidation of propene………………………………………. 60
3.3 Results and discussion…………………………………………………. 61
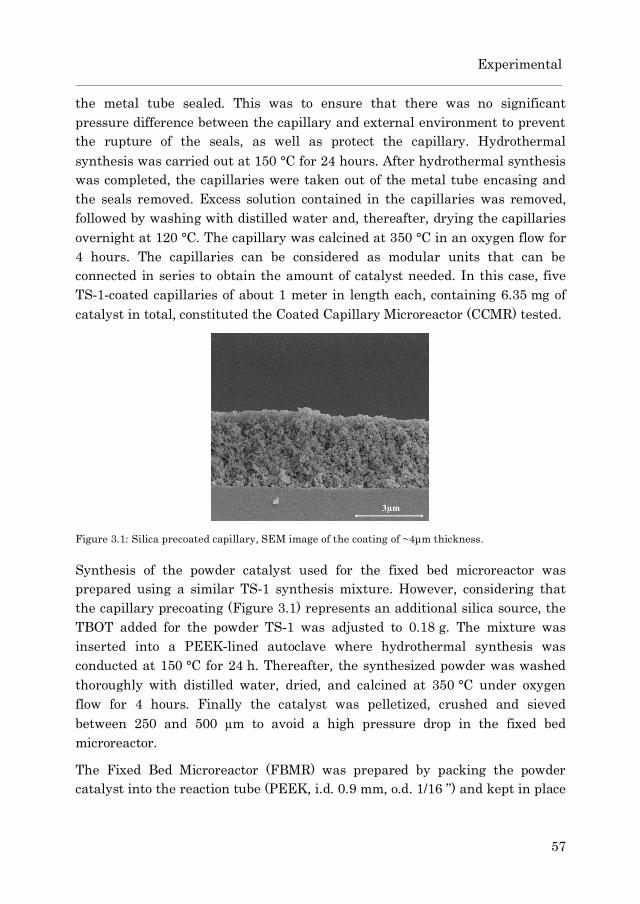
3.3.1 TS-1 coated capillary…..……………………………………… 61
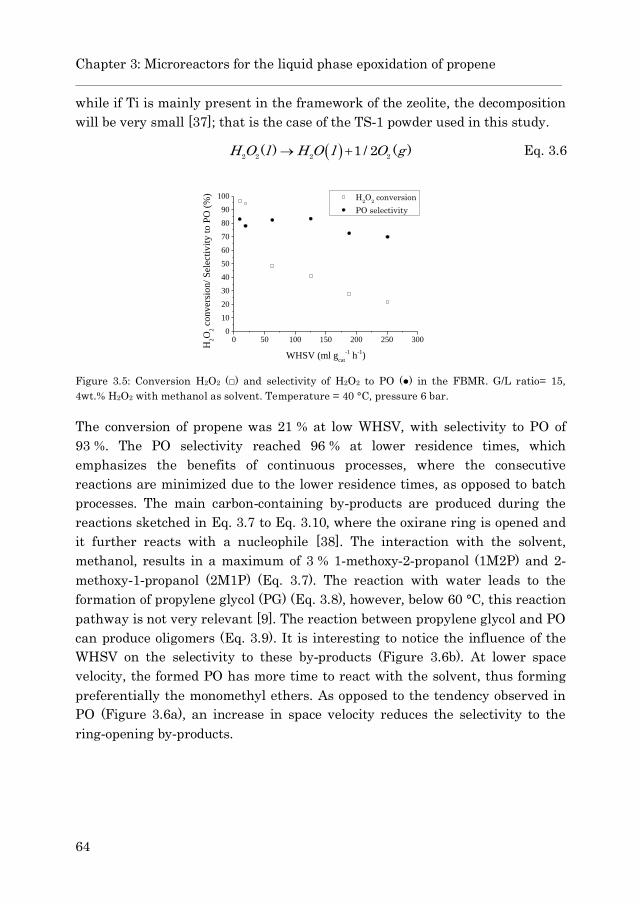
3.3.2 Epoxidation in a fixed bed microreactor (FBMR) ………... 63
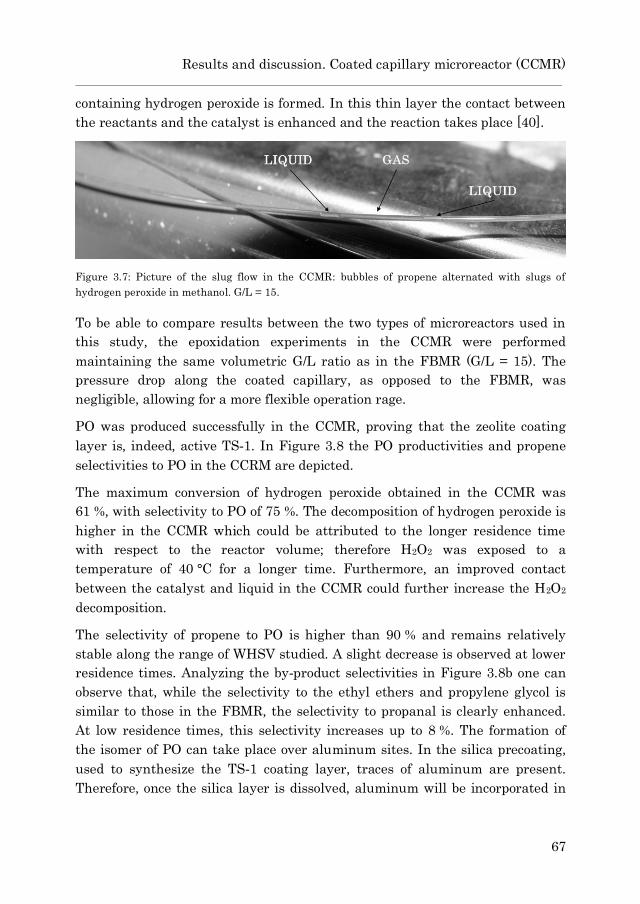
3.3.3 Epoxidation in a coated capillary microreactor (CCMR)… 66
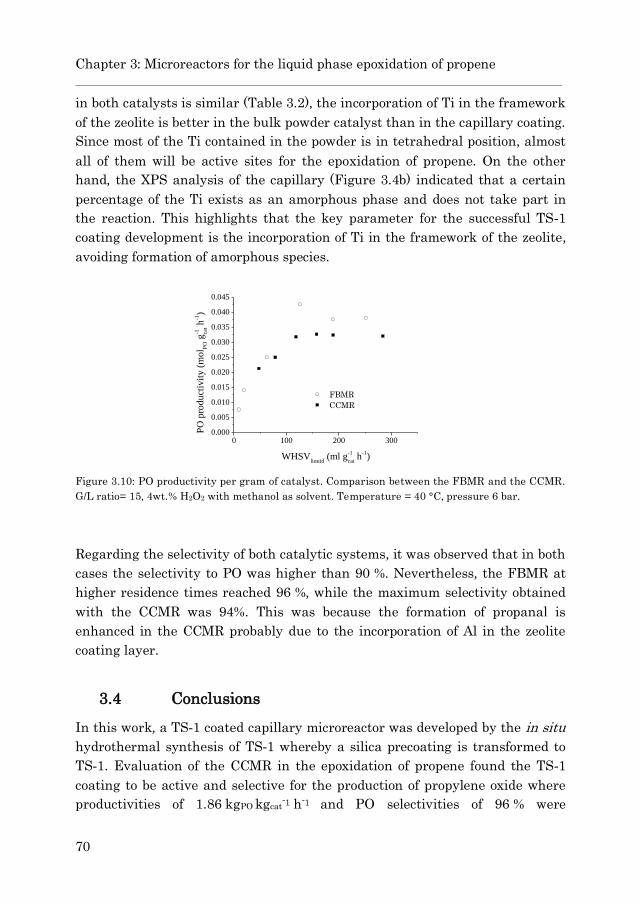
3.3.4 Comparison between both types of microreactor…………. 69
Page 8
Table of Contents
vii
vii
3.4 Conclusions……………………………………………………………… 70
3.5 Outlook……………………………………………………………………. 71
Appendix 3.A: Characterization of TS-1 powder…………………………. 71
Appendix 3.B: Mass transfer limitations…………………………………... 72
References………………………………………………………………………. 74
4 An integrated microreactor for the epoxidation of propene using a
microplasma……………………………………………………………………. 77
4.1 Introduction ……………………………………………………………... 78
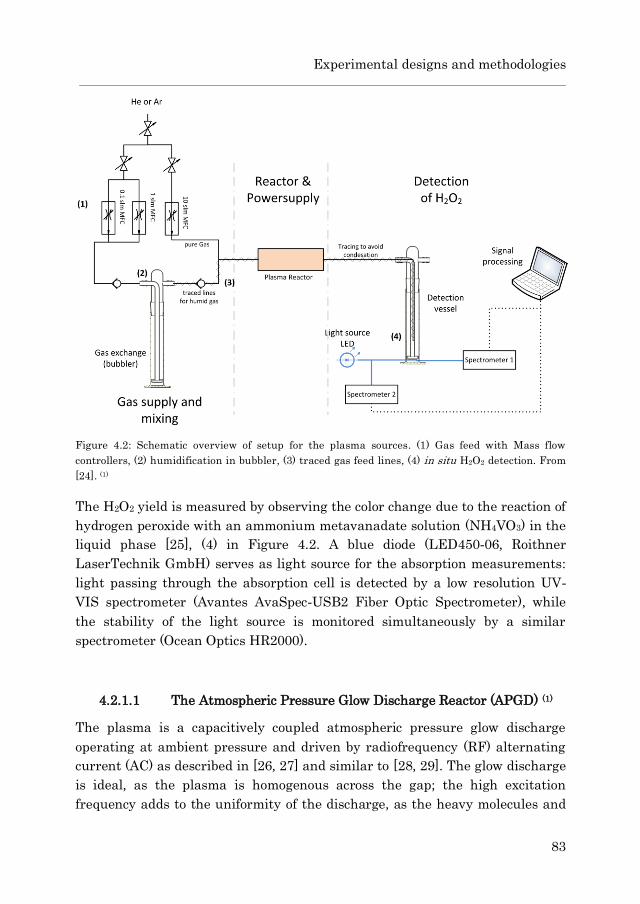
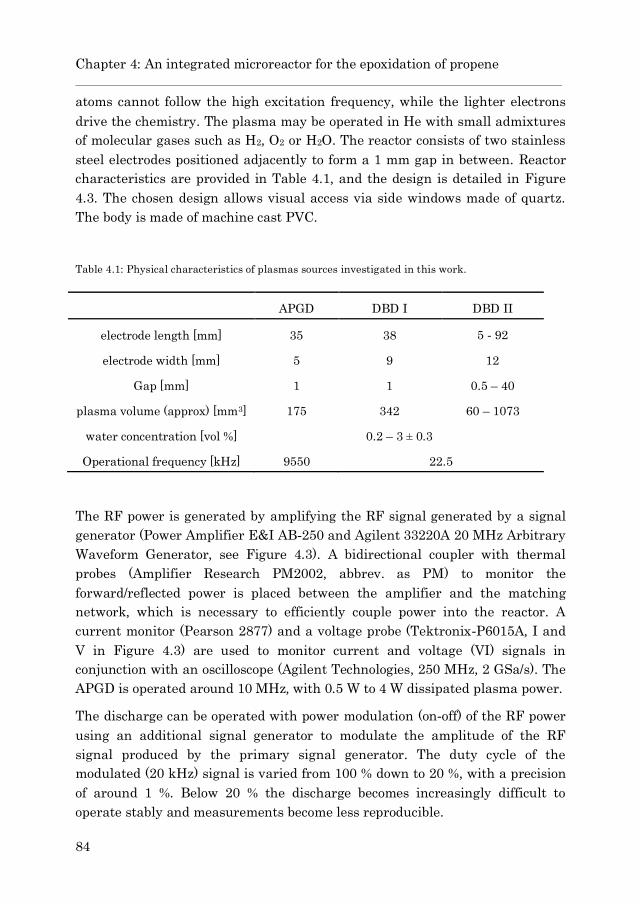
4.2 Experimental designs and methodologies…………………………... 82
4.2.1 Experimental Plasma Setups ……………………………….. 82
4.2.1.1 The Atmospheric Pressure Glow Discharge
Reactor (APGD) ……………………………………. 83
4.2.1.2 The Dielectric Barrier Discharges (DBD I and
DBD II) ……………………………………………… 85
4.2.2 Plasma power measurements ……………………………… 87
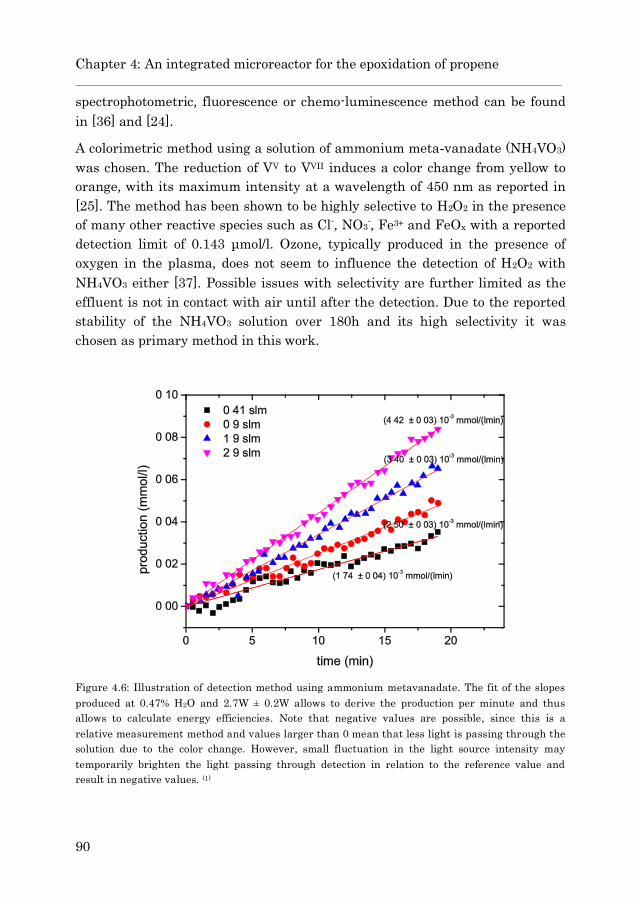
4.2.3 Hydrogen Peroxide detection in the plasma source …….. 89
4.2.4 Epoxidation of propene with hydrogen peroxide …………. 91
4.2.4.1 Gas phase epoxidation setup …………………….. 91
4.2.4.2 Liquid phase epoxidation setup …………………. 93
4.2.5 Epoxidation experiments …………………………………….. 94
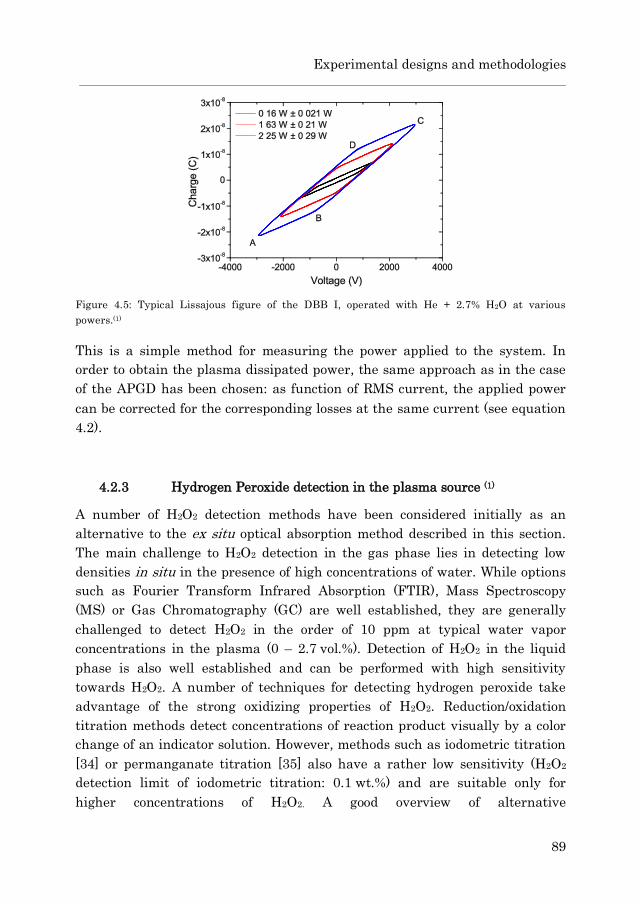
4.3 Results and Discussion………………………………………………… 96
4.3.1 Hydrogen peroxide production results …………………….. 96
4.3.2 Results of the epoxidation of propene ……………………… 99
4.3.3 Experimental combination of plasma reactor and
epoxidation reactor ……………………………………………. 101
4.3.4 Direct oxidation of propene in a plasma reactor …………. 101
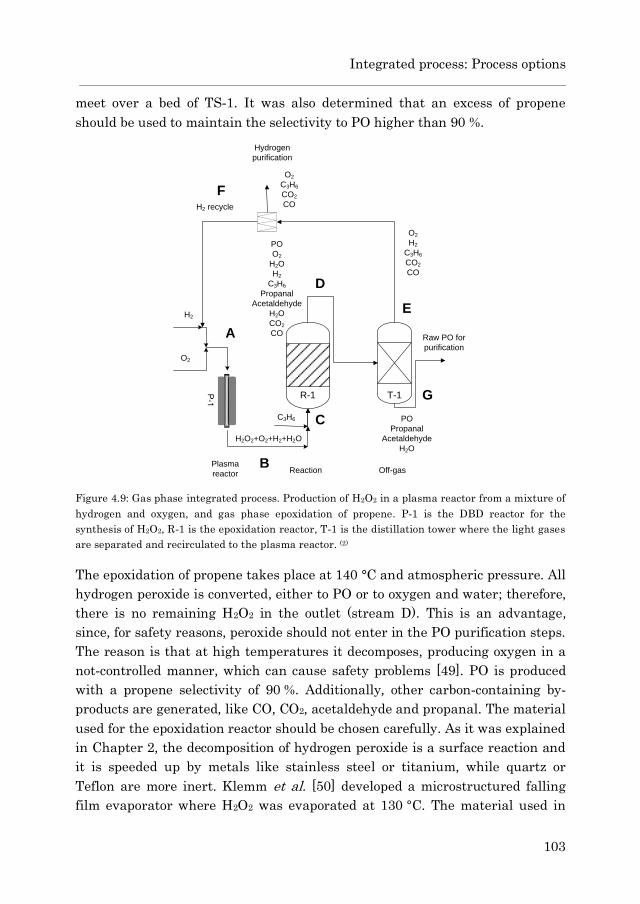
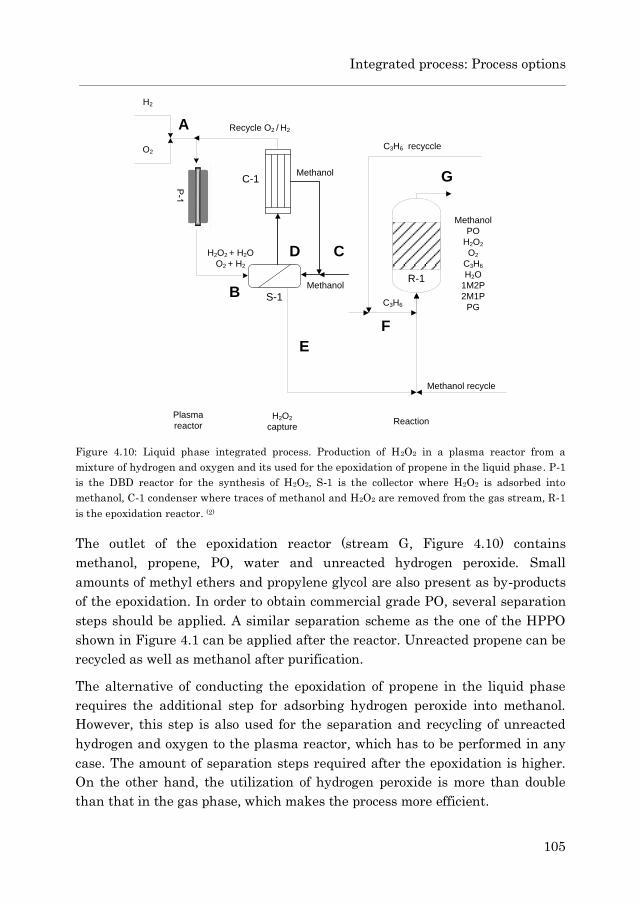
4.4 Integrated process: Process options …………………………………. 102
Page 9
Table of Contents
viii
vii
i
4.5 Summarizing discussion……………………………………………….. 107
4.5.1 Production of H2O2 in a microdischarge …………………… 107
4.5.2 Epoxidation of propene ………………………………………. 108
4.5.3 Recommendations and Economic Evaluation……………... 109
4.6 Conclusions ……………………………………………………………… 113
References………………………………………………………………………. 113
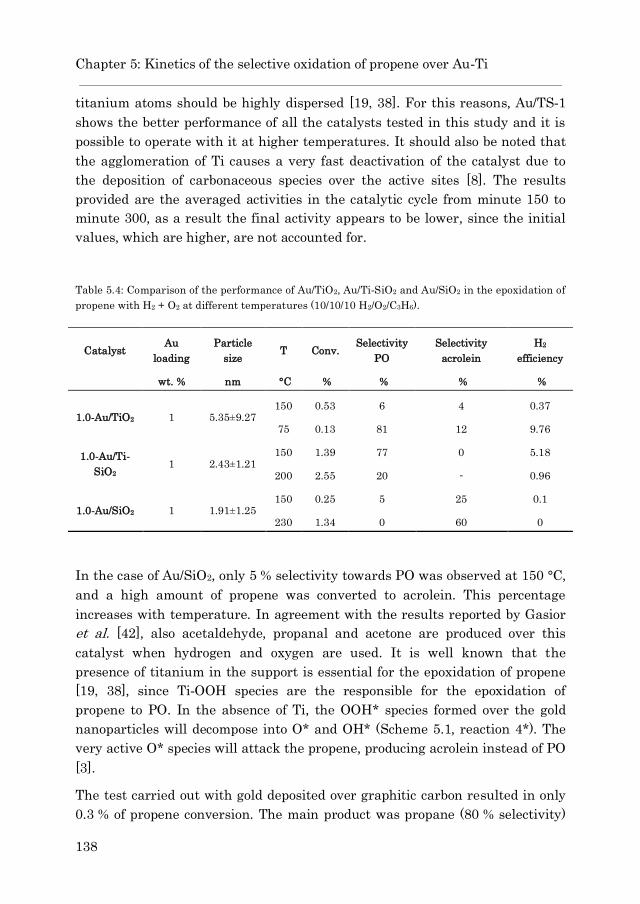
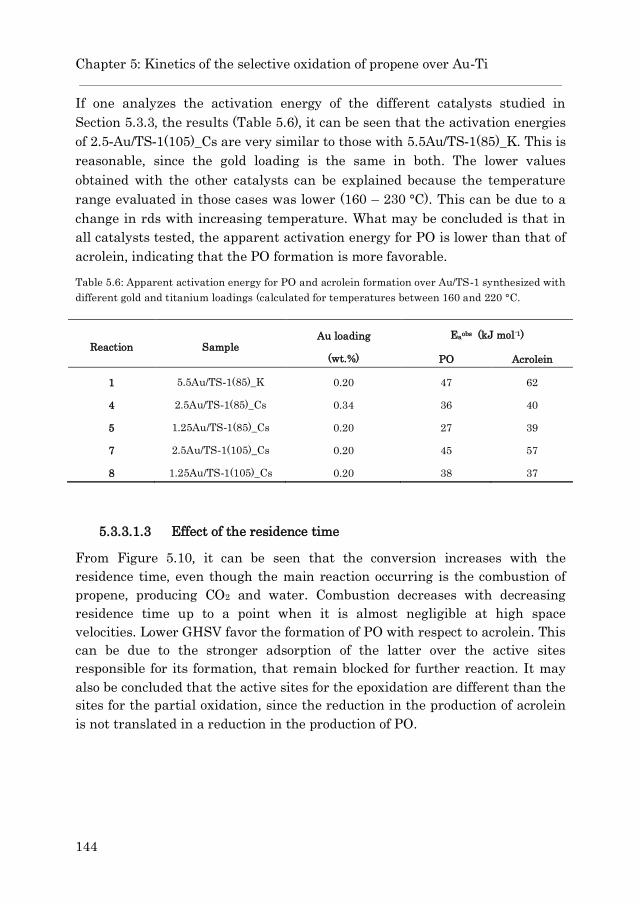
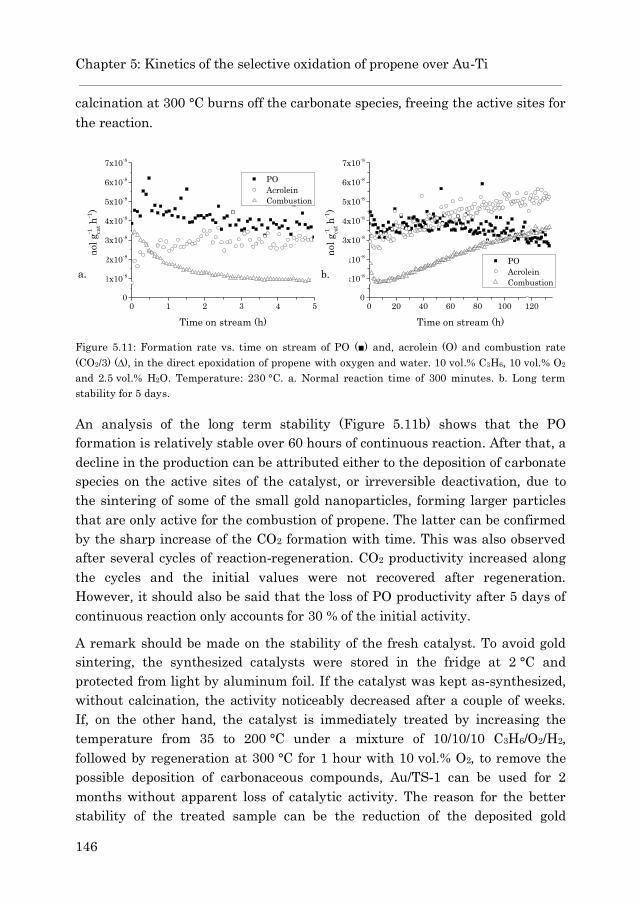
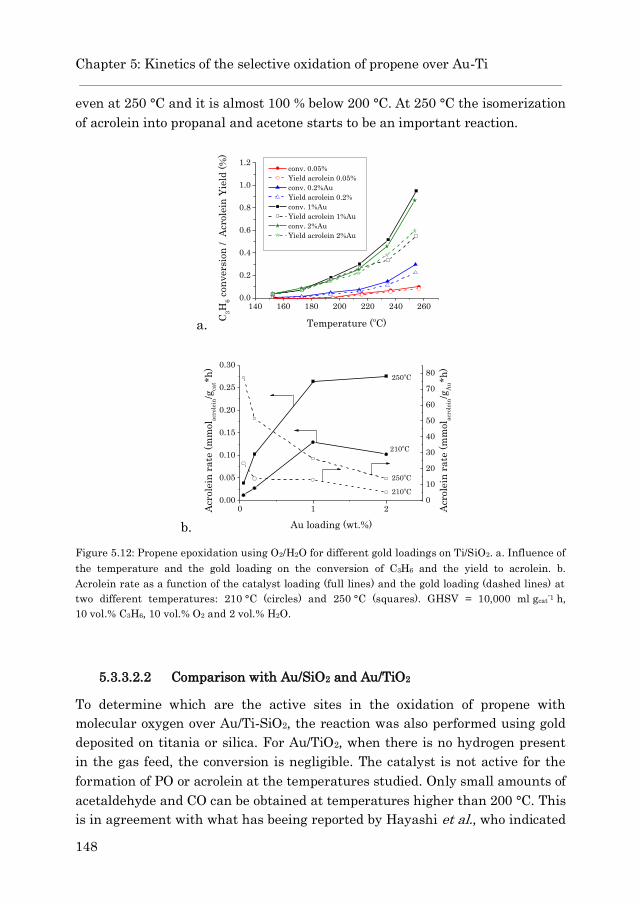
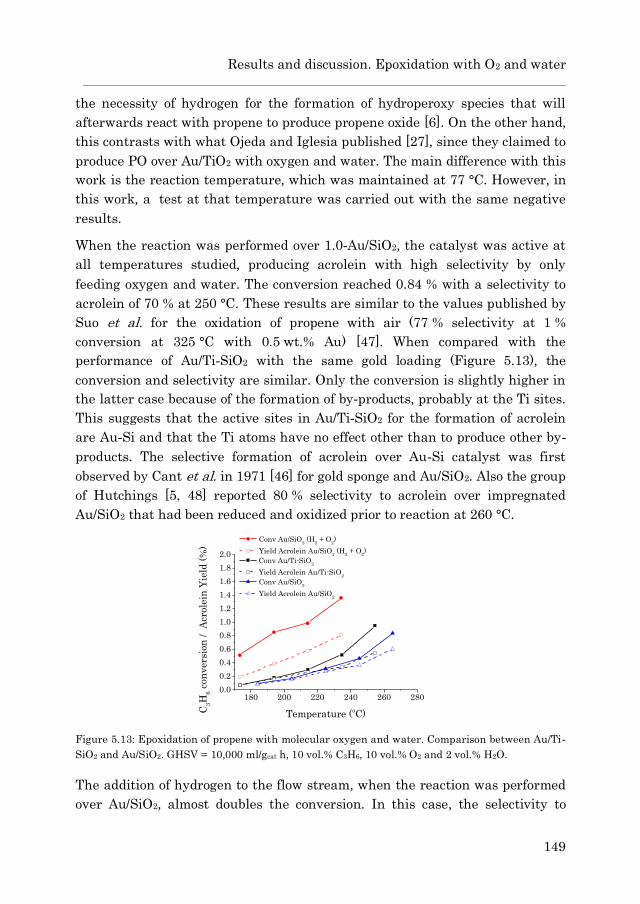
5 Kinetics of the selective oxidation of propene with O2 over Au-Ti
catalyst in the presence of water……………………………………………. 117
5.1 Introduction……………………………………………………………… 118
5.2 Experimental…………………………………………………………….. 121
5.2.1 Catalyst synthesis and characterization…………………… 121
5.2.2 Catalytic testing……………………………………………….. 124
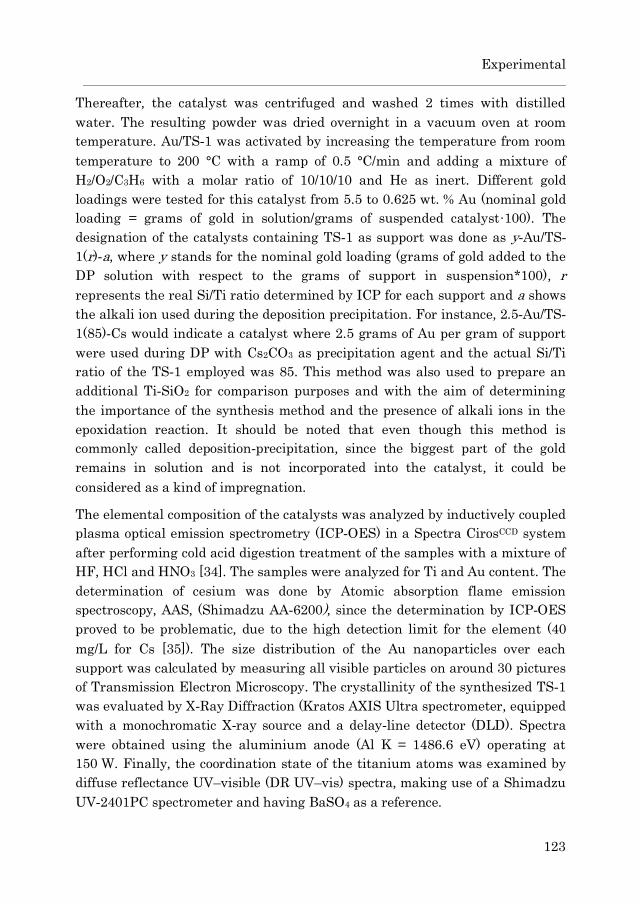
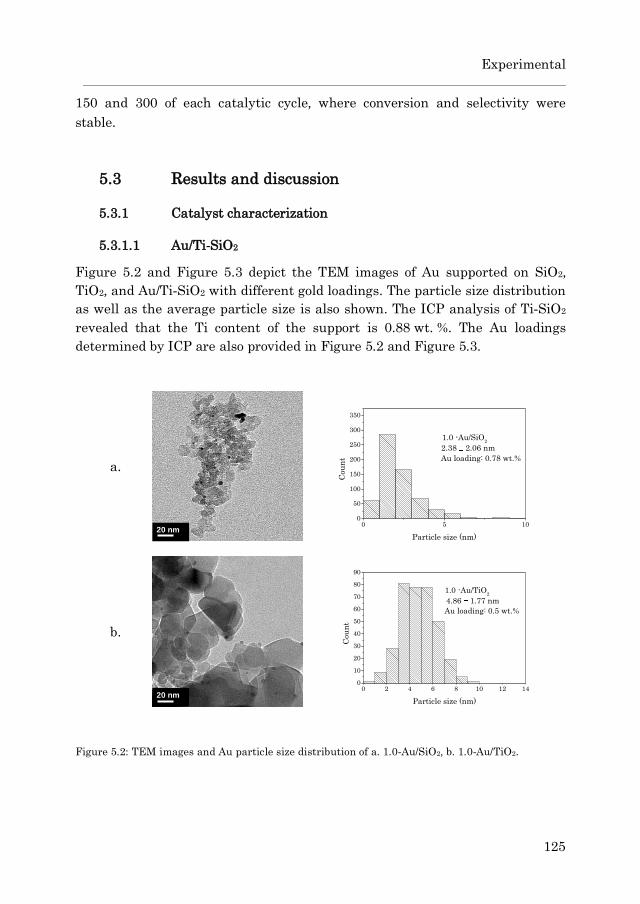
5.3 Results and discussion…………………………………………………. 125
5.3.1 Catalyst characterization…………………………………….. 125
5.3.1.1 Au/Ti-SiO2…………………………………………… 125
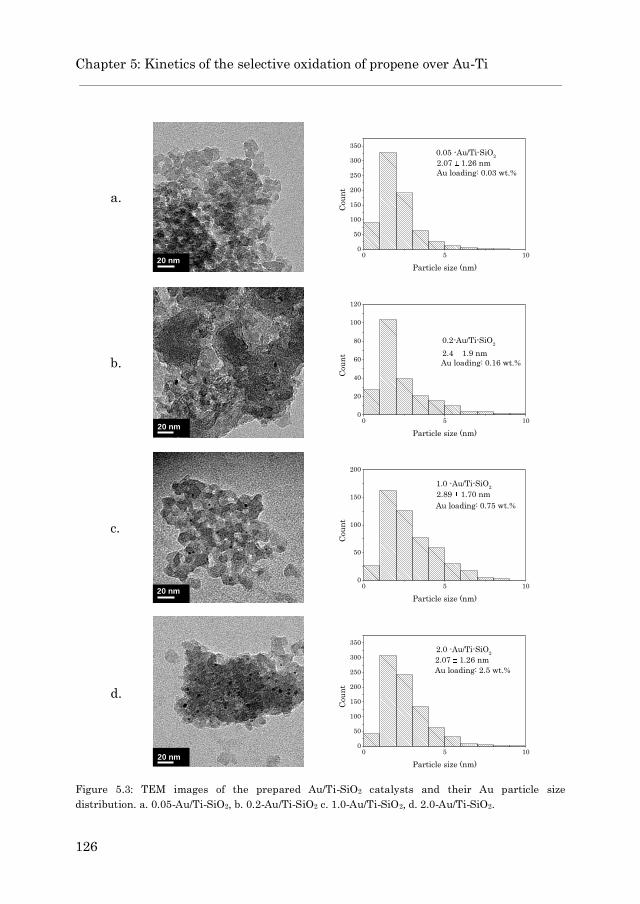
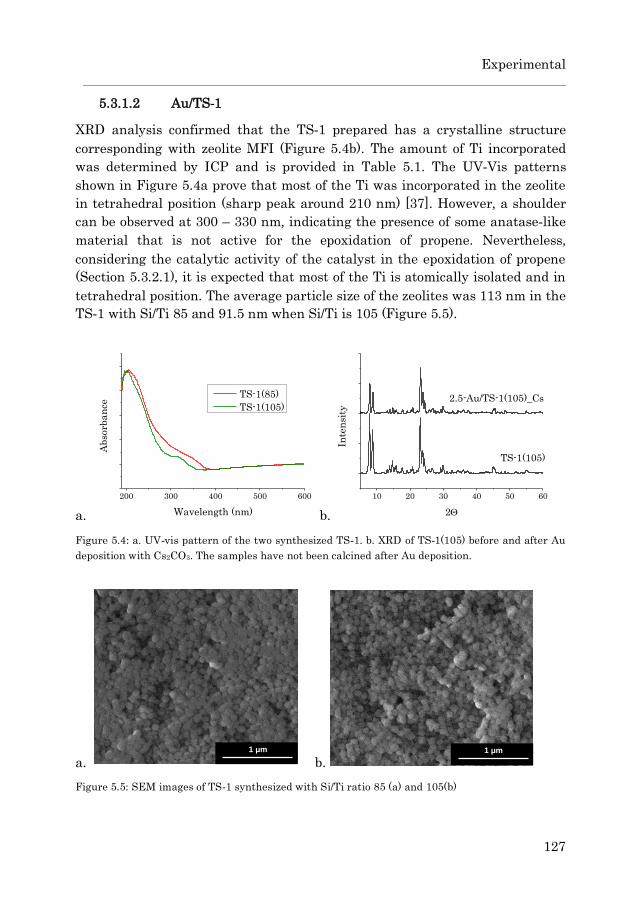
5.3.1.2 Au/TS-1……………………………………………… 127
5.3.2 Epoxidation with H2 + O2…………………………………… 132
5.3.2.1 Au/TS-1……………………………………………… 132
5.3.2.2 Au/Ti-SiO2…………………………………………… 136
5.3.3 Epoxidation with O2 and water 139
5.3.3.1 Au/TS-1……………………………………………… 139
5.3.3.2 Au/Ti-SiO2…………………………………………… 147
5.3.4 Kinetic study……………………………………………………. 152
5.3.4.1 Au/TS-1……………………………………………… 152
5.3.4.2 Acrolein formation over Au/Ti-SiO2……………… 169
5.4 Summarizing discussion……………………………………………….. 175
Page 10
Table of Contents
ix
ix
5.5 Conclusions………………………………………………………………. 178
5.6 Outlook……………………………………………………………………. 179
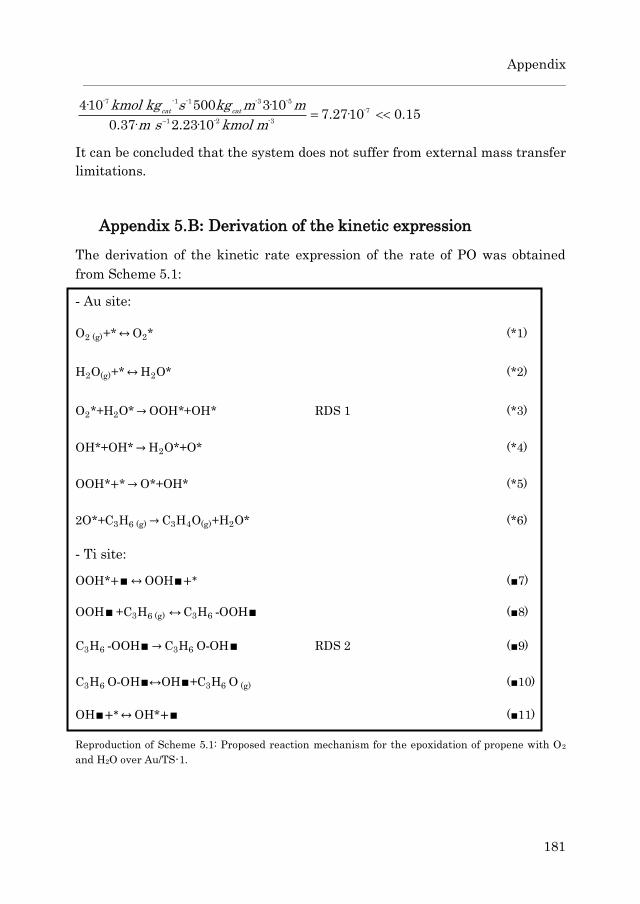
Appendix 5.A: Internal and external mass transfer limitations……….. 179
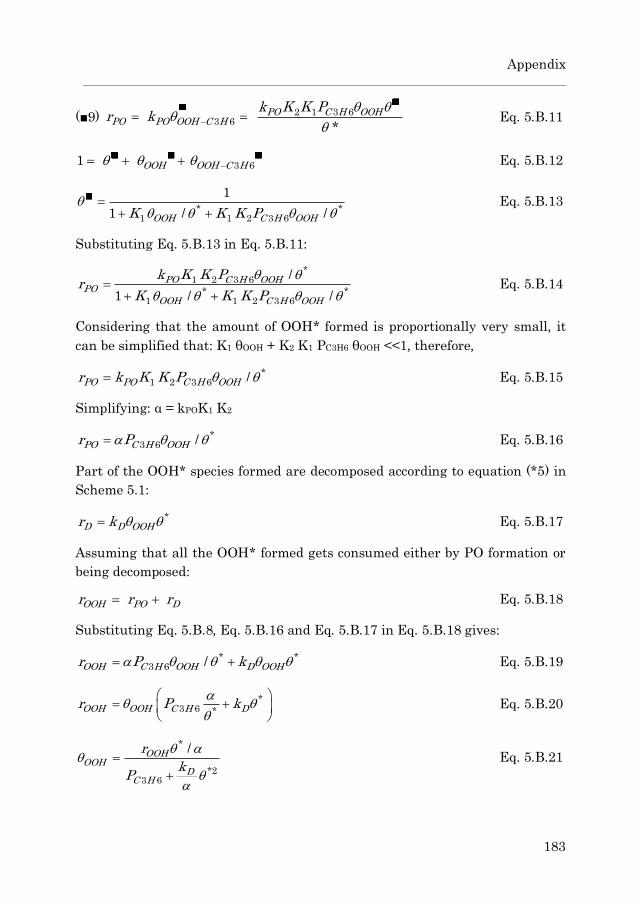
Appendix 5.B: Derivation of the kinetic expression……………………… 181
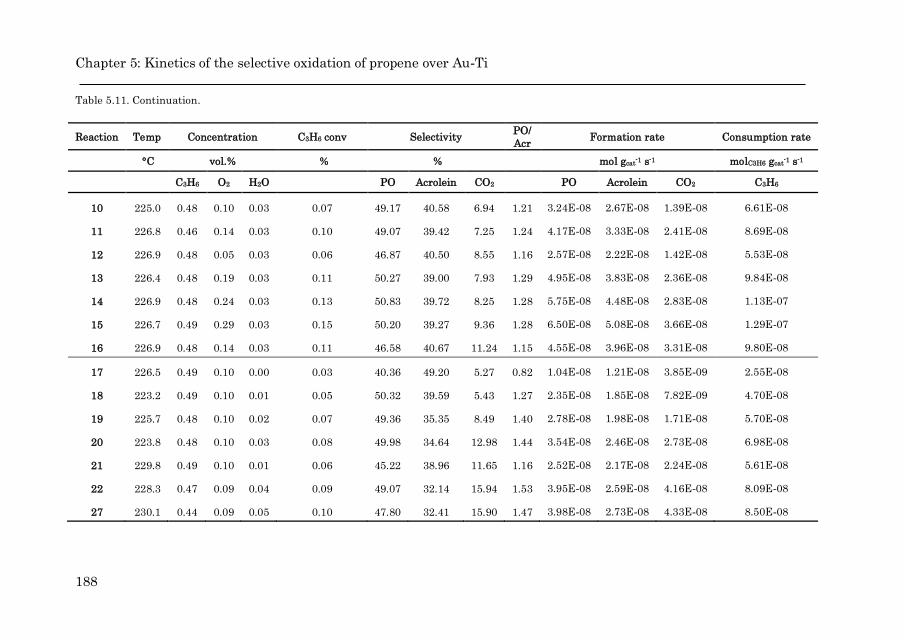
Appendix 5.C: Catalytic results for the epoxidation over Au/TS-1…….. 187
References………………………………………………………………………. 189
6 Selective propene oxidation to acrolein by gold dispersed on a Cu-
containing MgCr2O4 spinel support………………………………………… 193
6.1 Introduction……………………………………………………………… 194
6.2 Experimental……………………………………………………………. 197
6.2.1 Catalyst synthesis and characterization…………………… 197
6.2.2 Oxidation experiments………………………………………... 198
6.3 Results and discussion…………………………………………………. 199
6.3.1 Catalyst characterization…………………………………….. 199
6.3.2 Catalytic experiments…………………………………………. 201
6.3.2.1 Influence of the residence time…………………… 203
6.3.2.2 Effect of hydrogen co-feeding……………………... 205
6.3.2.3 Reaction with N2O………………………………….. 206
6.3.3 Computational analysis………………………………………. 207
6.4 Conclusions………………………………………………………………. 210
6.5 Outlook……………………………………………………………………. 210
References………………………………………………………………………. 211
7 Conclusions and outlook……………………………………………………… 213
7.1 Conclusions………………………………………………………………. 213
7.2 Outlook…………………………………………………………………… 216
Page 11
Table of Contents
x
x
List of Publications………………………………………………………………… 217
Acknowledgements………………………………………………………………… 221
About the Author…………………………………………………………………... 227
Page 12
xi
Summary
Alternatives for the Production of Propene Oxide
Propene oxide (PO) is an important building block in industry, with a demand
that grows continuously. The two main technologies for the production of PO,
the chlorohydrin and the hydroperoxide processes, suffer from certain
limitations, such as the release of high amounts of hazardous chemicals or the
generation of a co-product whose market determines the economy of the process.
Despite the disadvantages, these methods still hold the biggest market share of
PO production and are profitable. However, it is desirable to find a more
efficient and PO-only alternative. The most recently implemented PO
production process involves the epoxidation of propene with aqueous hydrogen
peroxide (HPPO), producing water as only by-product. The limitation brought by
the high price of the commercially available H2O2 can be overcome by its in-situ
synthesis and immediate utilization of the epoxidation of propene with
methanol as a solvent. This process represented a milestone in process
intensification and PO production. There are still downsides in the HPPO
process. Hydrogen peroxide is typically produced via the anthraquinone process,
which is not so environmentally friendly. It also requires three reactors and
multiple separation steps, making it quite a complex process. Other promising
technologies are also being researched, such as the combination of the HPPO
with different methods for the synthesis of hydrogen peroxide, or the direct
epoxidation of propene with hydrogen and oxygen, or oxygen alone. The purpose
of this thesis is to analyze some of these alternatives and to evaluate their
feasibility.
In the first part of this work, the possibility of developing an alternative
process to the HPPO process, where hydrogen peroxide is synthesized in a
plasma reactor, is assessed. From the epoxidation point of view, two process
options are proposed and analyzed in individual chapters. The first one
considers the use of hydrogen peroxide vapor, which can be readily produced in
the plasma reactor, to carry out the gas phase epoxidation of propene. The
epoxidation can be successfully achieved, even though the utilization of
hydrogen peroxide is low due to the fast decomposition of the chemical at high
temperatures. The main factors affecting the epoxidation and decomposition
Page 13
Summary
xii
xii
are analyzed. The second alternative considers the possibility of H2O2 being
synthesized in a microplasma reactor and captured into methanol. Thereafter,
the epoxidation can take place in the liquid phase in a microreactor. Two types
of microreactors were considered: a fixed-bed microreactor and a coated
capillary microreactor. The epoxidation of propene was achieved and high
selectivity to PO (>95 %) could be obtained. In a third chapter, the overall
unified process is analyzed, considering the integration of epoxidation and
plasma reactors. Two types of plasma reactors are presented and the use of
either hydrogen/oxygen mixtures or simply water vapor as reactants is
evaluated. The combination of the previously studied epoxidation options with
the plasma reactor is analyzed from a process point of view. Finally, an
economic evaluation is performed to assess the feasibility of the combined
concept.
The second part of the thesis is focused on the one step oxidation of propene
with molecular oxygen. It is known that gold-titanium catalysts are very
selective in the epoxidation of propene with hydrogen and oxygen. This reaction
is highly interesting; however, the H2 efficiency is rather low and the reaction
uses reactants that can form explosive mixtures. In this section, Au/TS-1 and
Au/Ti-SiO2 are tested both for the epoxidation with H2/O2 and with O2 in the
presence of water. While both were active in the epoxidation of propene with
H2/O2, only Au/TS-1 was capable of producing PO in the reaction with O2, as
well as acrolein in a one-to-one ratio. Au/Ti-SiO2 could catalyze the acrolein
formation very selectively. Acrolein is also a very important chemical
intermediate with high industrial interest. A kinetic study was performed to
understand the mechanism of the epoxidation of propene with O2 and H2O. In a
final chapter, the oxidation of propene with O2 over gold nanoparticles,
deposited on a copper-containing spinel, was investigated. The result was the
selective production of acrolein, for which the reaction mechanism was also
analyzed.
It can be concluded that there are several alternatives for the production of PO.
So far, the HPPO process seems to be the most efficient, thus looking for
simpler ways to synthesize hydrogen peroxide can be a way of optimizing it.
The single step epoxidation with H2/O2 or O2 has been defined as the holy grail,
but still needs certain improvements to reach the targets for its industrial
implementation.
Page 14
1 Publication of this chapter is under preparation.
1.1 Propene oxide: uses and industrial production
Propene oxide (propylene oxide, PO, 1,2-epoxypropane, methyloxirane) is an
important chemical intermediate. The annual worldwide production capacity of
PO reached 7.7 million tons in 2012 and it is expected to grow up to 9.5 million
tons in 2018 [1]. 66 % of the PO produced is used as intermediate in the
synthesis of polyether polyols, which are primarily consumed in the production
of polyurethane foams, both rigid (refrigerators, insulation) and flexible
(furniture, car seats). The second main application of PO is the synthesis of
propylene glycols (mono-, di-, tri- and higher), which are raw materials for the
production of unsaturated polyester resins, that are found in textile and
construction industries. Finally, a growing market for PO is its use for the
synthesis propylene glycol ethers, which are increasingly replacing ethylene
glycol ethers as solvent for paintings, coatings, inks, etc. [2].
The various industrial processes for the synthesis of PO have been thoroughly
reviewed by Nijhuis et al. [3] and more recently by Baer et al. [2]. Scheme 1.1
Introduction
Page 15
Chapter 1: Introduction
2
outlines the different methods that are either currently being used or in the
research phase. In this figure the market share for each one of the processes in
2008 can also be found [4] (first number in brackets) together its expected
evolution for 2015 [2] (second number). Chlorohydrin and the co-product
processes are the most commonly used nowadays. However, the growth
observed in the HPPO highlights its increasing importance.
Scheme 1.1: Summary of propene oxide production routes. Adapted from Baer et al. [2]. The first
number in brackets indicates share of total world PO production capacity for each one of the
technologies in 2008 [4]. The second number shows the expected individual share for 2015
(predictions from 2012) [2].
(*) The information provided does not specify the distribution of the market share between the two
chlorohydrin processes.
(**) Processes that are still under development or in the research phase.
1.1.1 The chlorohydrin process (CHPO)
The chlorohydrin process was the only method available for both ethylene oxide
(EO) and PO production during the first half of the 20th century. In the 1930s
the direct synthesis of EO using a silver catalyst was patented [5], after which
this process became almost exclusive for EO production. In the case of PO, the
co-product routes where patented in the 1960s by Halcon [6], gaining market
share as the time passed.
Propene
Chlorohydrin
Routes
Chlor-Alkali PO
(43.2 % / 38.7 %)
Lime PO
(*)
Co-product
routes
PO/Styrene
(32.7 % / 35 %)
PO/tert-butanol
(15.5 % / 13.5 %)
PO/Cumene
(3.7 % / 4.3 %)
H2O2 routes
HPPO
(4.9 % / 8.5 %)
DSHP/HPPO**
Hydro oxidation HOPO**
Direct oxidation DOPO**
Cl2
O2
NaOH
Ca(OH)2
H2O2
H2/O2
O2
Ethylbencene
Isobutene
Catalyst
Catalyst
Catalyst
Catalyst
Catalyst
Catalyst
Cumene
PO
PO
PO
PO
PO
PO
PO
PO
NaCl brine
CaCl2 brine
Styrene
tert-butanol
Cumene
H2O
H2O
Catalyst PO
H2O
Page 16
Propene oxide: uses and industrial production
3
The chlorohydrin process is performed in two steps (Scheme 1.2). The first one
involves the reaction of propene with aqueous chlorine solution, in which HCl
and HOCl are in equilibrium. As a result, a mixture of two propene
chlorohydrin isomers is obtained, together with 1,2-dichloropropane as by-
product. The second step is the dehydrochlorination of propene chlorohydrin
using a base (Ca(OH)2 or NaOH), resulting in PO. Besides PO, in this last step,
a solution of 5 % CaCl2 is generated in an amount 40 times more than the
amount of PO. This is problematic because its reuse is not economically
favorable. On the other hand, if NaOH is the base employed, the brine
generated is NaCl, which can be consumed in the production of chlorine.
Additionally, up to 10 % 1,2-dichloropropane is obtained, which has limited
applications. The disposal of these two substances that are environmentally
hazardous is the main limitation of the chlorohydrin process. Nowadays, no
new chlorohydrin plants are being built, even though the existing large
production plants are up-to-date and profitable. This can explain the decrease
in the market share of this technology between 2008 and 2015 observed in
Scheme 1.1.
Scheme 1.2: Reactions occurring in the chlorohydrin process using Ca(OH)2.
1.1.2 The hydroperoxide processes (PO/TBA, SMPO, CHP)
The second and currently most used PO production method is the oxidation of
propene with organic hydroperoxides, resulting in PO and an alcohol. Different
organic hydroperoxides can be used, but due to the market demand of the co-
product generated, the ones applied in industry are the tert-butyl
hydroperoxide process (PO/TBA) [6, 7] and the ethylbenzene hydroperoxide
process (PO/SM, SMPO) [8-10]. These processes are selective and produce less
waste than the chlorohydrin. On the other hand, a fixed stoichiometric amount
of co-product is always generated in larger amounts than PO itself due to the
O
+ Cl2 + H
2O
1-chloro-2-propanol
OH
Cl+
+ Ca(OH)2 + CaCl
2
+ 2 H2O
Cl
OH
OH
Cl+
Cl
OH
2-chloro-1-propanol
Page 17
Chapter 1: Introduction
4
differences in molecular weight and decomposition of the hydroperoxide. For
instance, in the PO/TBA, 2.5 to 3.5 kg of tert-butyl alcohol are produced per
kilogram of PO (because the alcohol is produced in the two steps of the process),
and in the SMPO, 2.2 to 2.5 kg styrene are produced per kilogram of PO. This
makes the economy of the process dependent on the market of the co-product,
which can be a disadvantage [3].
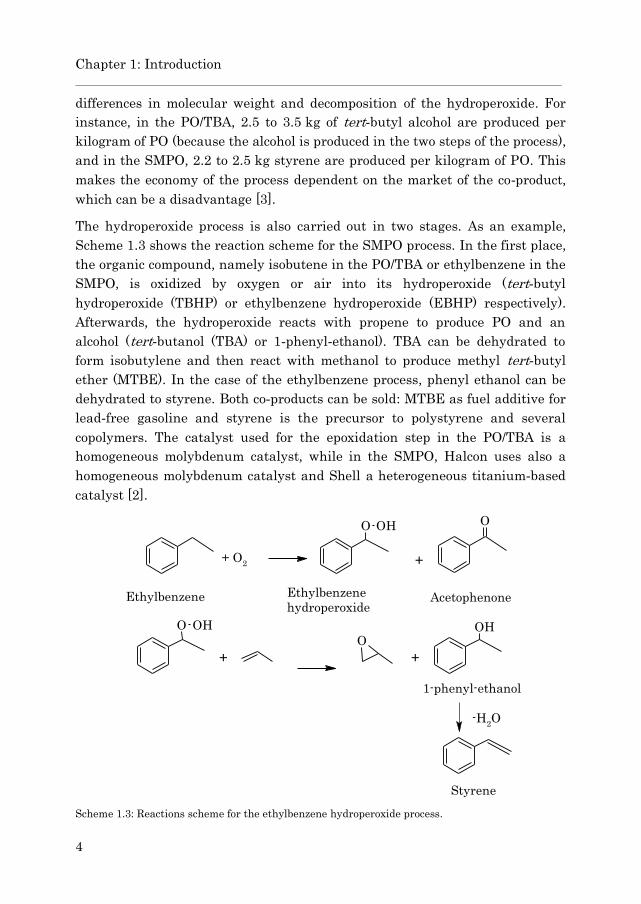
The hydroperoxide process is also carried out in two stages. As an example,
Scheme 1.3 shows the reaction scheme for the SMPO process. In the first place,
the organic compound, namely isobutene in the PO/TBA or ethylbenzene in the
SMPO, is oxidized by oxygen or air into its hydroperoxide (tert-butyl
hydroperoxide (TBHP) or ethylbenzene hydroperoxide (EBHP) respectively).
Afterwards, the hydroperoxide reacts with propene to produce PO and an
alcohol (tert-butanol (TBA) or 1-phenyl-ethanol). TBA can be dehydrated to
form isobutylene and then react with methanol to produce methyl tert-butyl
ether (MTBE). In the case of the ethylbenzene process, phenyl ethanol can be
dehydrated to styrene. Both co-products can be sold: MTBE as fuel additive for
lead-free gasoline and styrene is the precursor to polystyrene and several
copolymers. The catalyst used for the epoxidation step in the PO/TBA is a
homogeneous molybdenum catalyst, while in the SMPO, Halcon uses also a
homogeneous molybdenum catalyst and Shell a heterogeneous titanium-based
catalyst [2].
Scheme 1.3: Reactions scheme for the ethylbenzene hydroperoxide process.
O
+ O2
O
+
OHO
OHO
+
OH
+
-H2O
Ethylbenzene Ethylbenzene
hydroperoxideAcetophenone
1-phenyl-ethanol
Styrene
Page 18
Propene oxide: uses and industrial production
5
The third co-product process shown in Scheme 1.1 is the cumene route. It is a
relatively new process, operated by Sumitomo Chemical Company [11]. It
follows the same principle as the other hydroperoxide processes, but avoiding
the limitation of the high amounts of co-products. The oxidation of cumene
results in cumene hydroperoxide (CHP), which epoxidizes propene to give PO
and dimethylphenylmethanol. The latter can be dehydrated to α-methylstyrene
and afterwards hydrogenated back to cumene. The main advantage of this
system with respect to the other two hydroperoxide processes is the absence of
co-products. The catalyst employed in the epoxidation step of the cumene
process is titanium silicate with a specific mesoporous configuration [2].
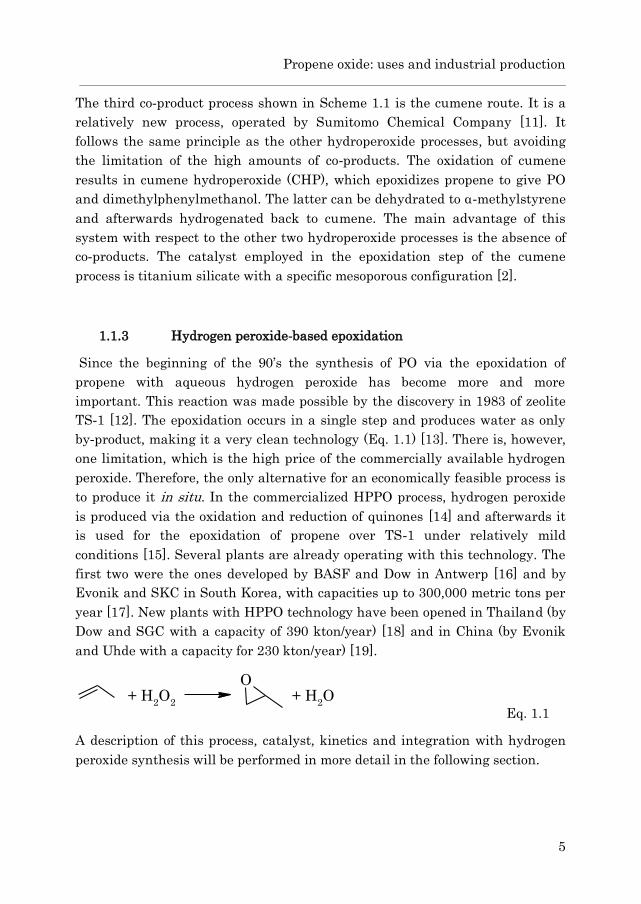
1.1.3 Hydrogen peroxide-based epoxidation
Since the beginning of the 90’s the synthesis of PO via the epoxidation of
propene with aqueous hydrogen peroxide has become more and more
important. This reaction was made possible by the discovery in 1983 of zeolite
TS-1 [12]. The epoxidation occurs in a single step and produces water as only
by-product, making it a very clean technology (Eq. 1.1) [13]. There is, however,
one limitation, which is the high price of the commercially available hydrogen
peroxide. Therefore, the only alternative for an economically feasible process is
to produce it in situ. In the commercialized HPPO process, hydrogen peroxide
is produced via the oxidation and reduction of quinones [14] and afterwards it
is used for the epoxidation of propene over TS-1 under relatively mild
conditions [15]. Several plants are already operating with this technology. The
first two were the ones developed by BASF and Dow in Antwerp [16] and by
Evonik and SKC in South Korea, with capacities up to 300,000 metric tons per
year [17]. New plants with HPPO technology have been opened in Thailand (by
Dow and SGC with a capacity of 390 kton/year) [18] and in China (by Evonik
and Uhde with a capacity for 230 kton/year) [19].
Eq. 1.1
A description of this process, catalyst, kinetics and integration with hydrogen
peroxide synthesis will be performed in more detail in the following section.
O+ H
2O+ H
2O
2
Page 19
Chapter 1: Introduction
6
1.1.4 Comparison of existing technologies and other alternatives
The selection of one technology or the other would depend on several factors.
For instance, if a company has styrene or MTBE in its portfolio, it most
probably would invest in any of the co-product routes. In the case of
chlorohydrin process, no new plants are being built nowadays [3]. However, the
existing world-scale plants have been optimized, being integrated with chlor-
alkali plants and dedicated wastewater treatment plants, making them more
competitive. Nevertheless, the reduction of water requirements and the
decreases in capital cost for the processing of co-products or waste brought by
the PO-only processes (Cumene process and HPPO) suggest that these
technologies will be mostly commissioned in the foreseeable future [2]. This
trend is noticeable already in the 6 year-difference between the data of 2009
and prediction for 2015 of Scheme 1.1. It can be seen that, even though
chlorohydrin was the most used technology in 2009, by 2015 it will already be
surpassed by SMPO. The sharpest increase is the one observed for HPPO,
which is expected to almost double its market share from 2009 to 2015.
The other three processes shown in Scheme 1.1 are still in the research phase,
and the reported values do not reach the requirements for industrial
implementation. The DSHP/HPPO uses the same concept as the HPPO
previously mentioned, but carries out the hydrogen peroxide production via the
direct synthesis from hydrogen and oxygen. The other two are promising
technologies based on the direct oxidation of propene in a single step, either
from molecular oxygen alone (DOPO), or from a mixture of hydrogen and
oxygen (HOPO). These routes would be extremely attractive, considering the
reduction in capital costs and the simplification of the overall process.
1.2 Hydrogen Peroxide to Propene Oxide (HPPO)
The hydrogen peroxide to propene oxide process is, nowadays, the most
promising technology for the synthesis of PO [15]. In this section, a detailed
explanation of the catalyst used, the reaction conditions employed as well as
the methods for the in situ production of hydrogen peroxide will be provided.
1.2.1 Titanium silicalite-1 (TS-1)
Titanium silicalite-1 (TS-1) was first created in the Enichem laboratories and
patented by Taramasso et al. [12] in 1983. It is a zeolite with crystalline MFI
Page 20
Hydrogen Peroxide to Propene Oxide (HPPO)
7
structure that presents unique catalytic properties for the oxidation of several
organic compounds with hydrogen peroxide. Evidence of this efficiency has
been published for olefin epoxidation [20, 21], oxidation of alkanes [22], alcohols
[23] and amines [24] or the hydroxylation of phenol [25], among others.
The composition of this zeolite can be defined as x TiO2 · (1-x) SiO2, being x a
value between 0 and 0.025 [26]. The selective and efficient activity of TS-1 is
believed to be related to the isomorphous substitution of Si(IV) by Ti(IV) in its
framework [27]. Initially this idea arose some skepticism [28] since, according
to Pauling’s criterion, the atomic radius of Ti(IV) is too large for being inserted
in lattice positions of the silicalite, therefore it should show a preference to be
octahedrally bound rather than tetrahedrally bound [29]. However, further
studies from Millini et al. have demonstrated that the framework of the
silicalite can accommodate tetrahedrally coordinated titanium [30]. The
maximum degree of isomorphous substitution (x), calculated as Ti/(Ti+Si),
determined [30] is 0.025. Trying to exceed this value results in titanium being
ejected to extraframework positions and forming a TiO2 phase. This is
important because TiO2 is not active for the epoxidation of propene and only
catalyzes the decomposition of hydrogen peroxide [31].
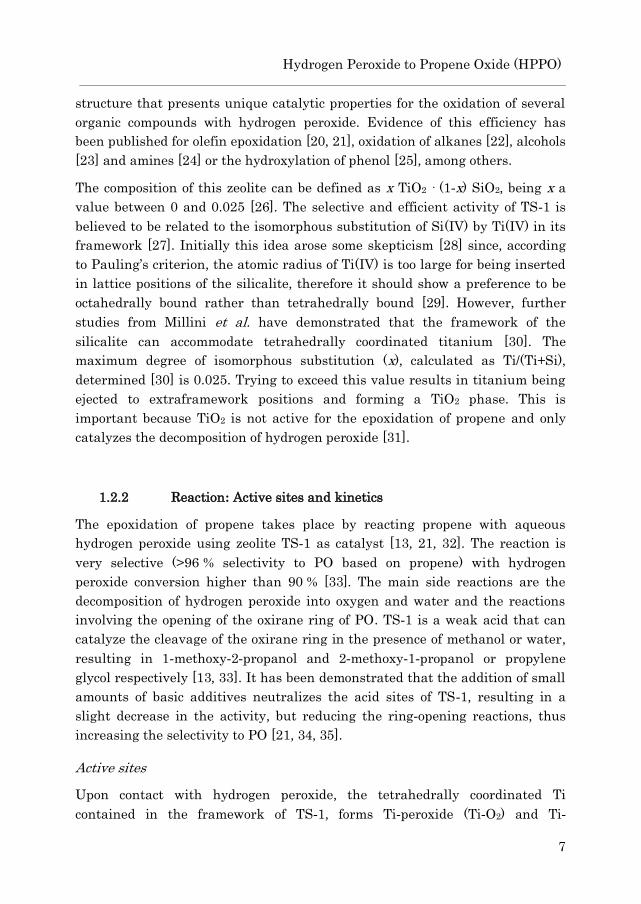
1.2.2 Reaction: Active sites and kinetics
The epoxidation of propene takes place by reacting propene with aqueous
hydrogen peroxide using zeolite TS-1 as catalyst [13, 21, 32]. The reaction is
very selective (>96 % selectivity to PO based on propene) with hydrogen
peroxide conversion higher than 90 % [33]. The main side reactions are the
decomposition of hydrogen peroxide into oxygen and water and the reactions
involving the opening of the oxirane ring of PO. TS-1 is a weak acid that can
catalyze the cleavage of the oxirane ring in the presence of methanol or water,
resulting in 1-methoxy-2-propanol and 2-methoxy-1-propanol or propylene
glycol respectively [13, 33]. It has been demonstrated that the addition of small
amounts of basic additives neutralizes the acid sites of TS-1, resulting in a
slight decrease in the activity, but reducing the ring-opening reactions, thus
increasing the selectivity to PO [21, 34, 35].
Active sites
Upon contact with hydrogen peroxide, the tetrahedrally coordinated Ti
contained in the framework of TS-1, forms Ti-peroxide (Ti-O2) and Ti-
Page 21
Chapter 1: Introduction
8
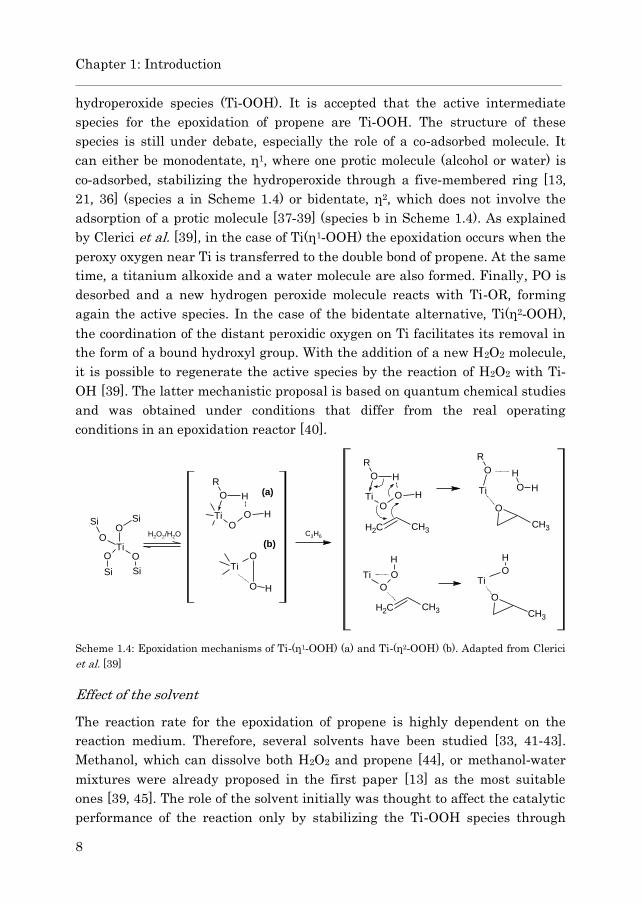
hydroperoxide species (Ti-OOH). It is accepted that the active intermediate
species for the epoxidation of propene are Ti-OOH. The structure of these
species is still under debate, especially the role of a co-adsorbed molecule. It
can either be monodentate, η1, where one protic molecule (alcohol or water) is
co-adsorbed, stabilizing the hydroperoxide through a five-membered ring [13,
21, 36] (species a in Scheme 1.4) or bidentate, η2, which does not involve the
adsorption of a protic molecule [37-39] (species b in Scheme 1.4). As explained
by Clerici et al. [39], in the case of Ti(η1-OOH) the epoxidation occurs when the
peroxy oxygen near Ti is transferred to the double bond of propene. At the same
time, a titanium alkoxide and a water molecule are also formed. Finally, PO is
desorbed and a new hydrogen peroxide molecule reacts with Ti-OR, forming
again the active species. In the case of the bidentate alternative, Ti(η2-OOH),
the coordination of the distant peroxidic oxygen on Ti facilitates its removal in
the form of a bound hydroxyl group. With the addition of a new H2O2 molecule,
it is possible to regenerate the active species by the reaction of H2O2 with Ti-
OH [39]. The latter mechanistic proposal is based on quantum chemical studies
and was obtained under conditions that differ from the real operating
conditions in an epoxidation reactor [40].
Scheme 1.4: Epoxidation mechanisms of Ti-(η1-OOH) (a) and Ti-(η2-OOH) (b). Adapted from Clerici
et al. [39]
Effect of the solvent
The reaction rate for the epoxidation of propene is highly dependent on the
reaction medium. Therefore, several solvents have been studied [33, 41-43].
Methanol, which can dissolve both H2O2 and propene [44], or methanol-water
mixtures were already proposed in the first paper [13] as the most suitable
ones [39, 45]. The role of the solvent initially was thought to affect the catalytic
performance of the reaction only by stabilizing the Ti-OOH species through
Ti-
O
O
R
O H
H
CH2 CH3CH3
O
Ti-
O
R
O H
H
H2O2/H2O
Ti
O
OO
O
SiO3
O3Si SiO3
O3Si
C3H6
Ti-
O
O
H
CH2 CH3
Ti-
O
H
(a)
(b)
CH3
O
OH
OH
OHTi
-
O
O
H
OH
OH
OH
Ti-
O
O
R
O H
H
CH4
Page 22
Hydrogen Peroxide to Propene Oxide (HPPO)
9
electronic and steric effects [21]. However, Langhendries et al. [46] showed that
the medium also has a role influencing the partition coefficient, which is the
ratio between intra-porous and extra-porous concentrations of the olefin in the
zeolite, thus in the adsorption of the olefin. They reported that linear α-olefins,
such as propene, are concentrated inside the TS-1 micropores, especially when
the solvent is methanol. The rate of epoxidation decreases in alcohol solvents in
the order methanol > ethanol > i-propanol > t-butanol, with the two extremes
differing more than one order of magnitude [39]. This is the same decreasing
order that Langhendries indicated for the competition of the each alcohol for
the solvation of the olefin, resulting in a decrease in the concentration of the
olefin close to the active sites of the zeolite [46]. Additionally, TS-1 is more
hydrophobic than other Ti-containing zeolites, so the intra-porous
concentration of olefins is higher. Therefore, it can be said that the role of the
solvent in the reaction rate is a combination of several effects and that, in the
epoxidation of propene, methanol is the most suitable one.
Kinetics
During the last years, several kinetic studies on the epoxidation of propene
with hydrogen peroxide over TS-1 have been published [47-51]. There is some
discrepancy in literature regarding the type of mechanism followed. While most
publications supported an Eley-Rideal reaction mechanism [47, 49], Shin et al.
[48] obtained their best fit with a Langmuir-Hinshelwood dual site mechanism
(Eq. 1.2). It should be mentioned that the latter worked with very low
concentrations and reaction conditions far from the industrial ones [51].
1 2 2 2 3 6
1
1 2 2 3 3 2 3 6 4 3
[ ] [ ][ -1]
1 1PO
K K H O C Hr k TS
K H O K CH OH K C H K CH OH
Eq. 1.2
Recently, Russo et al. [51] performed a detailed kinetic study of this reaction.
They analyzed not only the epoxidation of propene, but also the side reactions
taking place in the HPPO process, such as the decomposition of hydrogen
peroxide into oxygen and water as well as the ring-opening reactions. They
determined that an Eley-Rideal mechanism, with propene reacting from the
gas phase (Eq. 1.3) dominates both the epoxidation and the ring-opening
reactions.
1 2 2 3 6
1
1 2 2 2 3 6 3 2 4
[ ][ ][ -1]
1 [ ] [ ] [ ] [ ]PO
K H O C Hr k TS
K H O K C H K H O K PO
Eq. 1.3
Page 23
Chapter 1: Introduction
10
During their analysis, they observed that the key factors that influence the PO
formation and the ring-opening reactions are the temperature, the catalyst
concentration and the amount of H2O2 in solution. An increase in any of these
three parameters favors both the epoxidation and the formation of by-products.
As a result, the conversion of hydrogen peroxide increases, but also the
selectivity to PO decreases. Therefore, a good compromise should be chosen in
order to maximize the production of PO. The influence of the concentration of
propene was not linear.
1.2.3 Hydrogen peroxide
Hydrogen peroxide is regarded as a green chemical, since water is its only by-
product during the oxidation reactions. It is also one of the most efficient
oxidizing agents due to its high active oxygen content, i.e. the amount of oxygen
transferred to the substrate with respect to the total mass of the oxidant, which
is 47 %. This value is only comparable with molecular oxygen [52]. H2O2 is one
of the most important inorganic bulk chemicals, mostly used for bleaching in
pulp/paper (ca 57 %) and textile industries (ca 6 %), for waste water and
effluent treatment (5 %), and for laundry products (ca 12 %). Only around 10 %
of the hydrogen peroxide produced is consumed for the production of chemicals
(data from 2000, [53]). The largest H2O2 production plant so far was
commissioned for the integration with the propene oxide production in
Thailand by Solvay and Dow with a capacity of 330,000 tons per year [54].
1.2.3.1 Synthesis of hydrogen peroxide
Considering the industrial implementation of the HPPO process, to purchase
commercially available hydrogen peroxide would not be economically profitable,
because its price (~ 1.5 $/kg, 100 wt.%) is similar to that of propene oxide
(2.2 $/kg) (prices from 2008, [55]). Additionally, the transport of the large
amounts of hydrogen peroxide required to produce hundreds of tons per year of
PO involves certain risks. Therefore, it is necessary to perform the synthesis of
hydrogen peroxide on site. The traditional and most employed way of producing
this important oxidant is the anthraquinone auto-oxidation process. However,
it is a rather complex technology, so new alternatives are being sought.
Page 24
Hydrogen Peroxide to Propene Oxide (HPPO)
11
The integration of the synthesis of H2O2 with the epoxidation of propene has
multiple advantages, such as the independence from an external supply of
H2O2 and the elimination of the need for the expensive purification and
concentration steps of the synthesized hydrogen peroxide. Additionally, the
capital costs are reduced, since no infrastructure is necessary for the handling
of co-products. Another factor that makes this integration possible is the easily
accomplished separation of propene from the liquid solution of PO in methanol,
which can be afterwards recycled to the epoxidation step [56, 57].
1.2.3.1.1 Anthraquinone auto-oxidation process (AO)
Almost all the hydrogen peroxide commercialized nowadays is produced via the
anthraquinone auto-oxidation process. In a typical process (Scheme 1.5), 2-
alkylanthraquinone (AQ) is hydrogenated catalytically to the corresponding
anthraquinol or anthrahydroquinone (AHQ). The catalyst in this step is
normally supported Pd or Pt. The AHQ is subsequently oxidized in air to
produce once again AQ and equimolecular amounts of hydrogen peroxide. The
AHQ can undergo a further hydrogenation to tetrahydroanthrahydroquinone
(THAHQ). The latter can be also oxygenated to form H2O2. The resulting
hydrogen peroxide is separated from the solution of quinones and solvent by
counter current extraction with water [58, 59].
Scheme 1.5: Reactions taking part in the synthesis of hydrogen peroxide via anthraquinone auto-
oxidation process. Source [59].
O
O
R
OH
OH
R
OH
OH
R
O
O
R
Pt or Pd
H2
Pt or Pd
H2
O2
H2O
2
O2
H2O
2
(AQ) (AHQ) (THAHQ)
(THAQ)CH4
Page 25
Chapter 1: Introduction
12
Even though this process is used worldwide to produce H2O2, it presents
certain limitations, such as the use of complex and toxic solvents (i.e.
ester/hydrocarbon or octanol/methylnaphthalene), the periodic replacement of
costly quinones, deactivation of the hydrogenation catalyst or being energy
intensive among others. Additionally, the overhydrogenation of AQ results in
the generation of by-products that cause water contamination. Due to the high
capital and investment costs required by the AO process, only large scale
production is economically viable [59]. Therefore, other alternatives have been
researched with the aim of achieving a more cost effective and environmentally
friendly way to produce hydrogen peroxide.
1.2.3.1.2 Direct synthesis
The direct synthesis aims at producing hydrogen peroxide from a mixture of
hydrogen and oxygen. The reaction takes place over a supported noble metal,
using a solvent (normally alcohols) and in the presence of acids to prevent the
decomposition of hydrogen peroxide. The catalysts employed typically contain
palladium supported on a variety of supports, such as silica, alumina or carbon.
The efficiency of gold in the direct synthesis has also been proven [60]. Also,
Pd/Au alloys have been investigated with better results than the individual
monometallic systems [61].
Even though this reaction seems simple, it is actually quite complex. First, it
involves three phases: gas (hydrogen and oxygen), solid (catalyst) and liquid,
because the produced hydrogen peroxide is highly unstable, so a liquid solvent
should be added to the system. This 3-phase system can suffer from mass
transfer limitations. Second, there are side reactions that result in the decrease
of the selectivity to the desired product, hydrogen peroxide. The side reactions
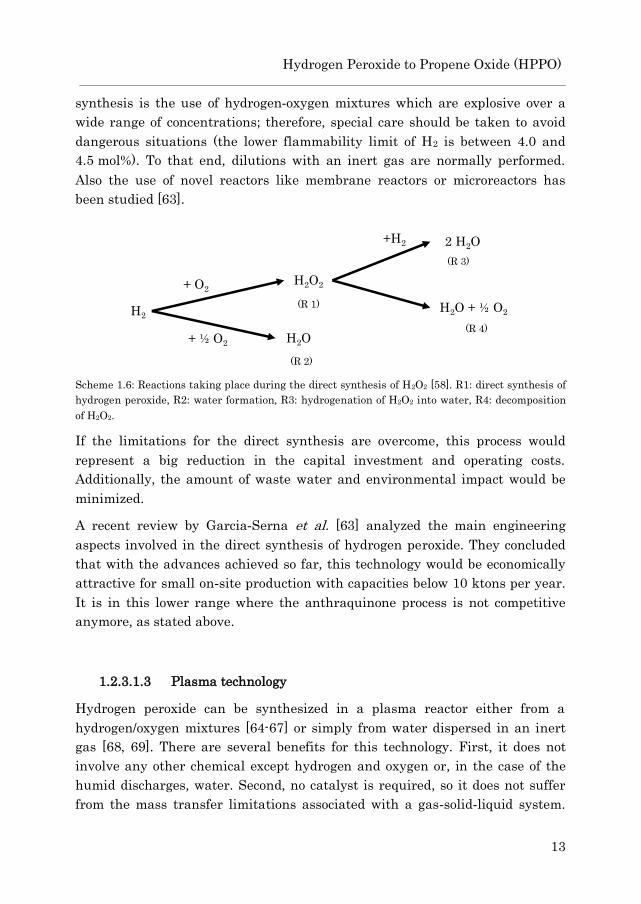
can be seen in Scheme 1.6. Besides the reaction between hydrogen and oxygen
to produce H2O2 (R1), there is a parallel reaction that is the formation of water
(R2). Hydrogen peroxide can also undergo other reactions once it is formed,
such as the hydrogenation (R3) and its decomposition (R4) [58]. The selection of
a suitable catalyst is essential to promote one reaction over the others. It is
essential that the chosen catalyst is capable of adsorbing O2 in a non-
dissociatively manner, which would cause water formation (R2), at the same
time as dissociatively adsorb H2 [59, 62]. Diluted acids and halides are also
added to the reaction medium to avoid decomposition (R4) and hydrogenation
(R3) of the produced hydrogen peroxide [59]. A third issue of the direct
Page 26
Hydrogen Peroxide to Propene Oxide (HPPO)
13
synthesis is the use of hydrogen-oxygen mixtures which are explosive over a
wide range of concentrations; therefore, special care should be taken to avoid
dangerous situations (the lower flammability limit of H2 is between 4.0 and
4.5 mol%). To that end, dilutions with an inert gas are normally performed.
Also the use of novel reactors like membrane reactors or microreactors has
been studied [63].
Scheme 1.6: Reactions taking place during the direct synthesis of H2O2 [58]. R1: direct synthesis of
hydrogen peroxide, R2: water formation, R3: hydrogenation of H2O2 into water, R4: decomposition
of H2O2.
If the limitations for the direct synthesis are overcome, this process would
represent a big reduction in the capital investment and operating costs.
Additionally, the amount of waste water and environmental impact would be
minimized.
A recent review by Garcia-Serna et al. [63] analyzed the main engineering
aspects involved in the direct synthesis of hydrogen peroxide. They concluded
that with the advances achieved so far, this technology would be economically
attractive for small on-site production with capacities below 10 ktons per year.
It is in this lower range where the anthraquinone process is not competitive
anymore, as stated above.
1.2.3.1.3 Plasma technology
Hydrogen peroxide can be synthesized in a plasma reactor either from a
hydrogen/oxygen mixtures [64-67] or simply from water dispersed in an inert
gas [68, 69]. There are several benefits for this technology. First, it does not
involve any other chemical except hydrogen and oxygen or, in the case of the
humid discharges, water. Second, no catalyst is required, so it does not suffer
from the mass transfer limitations associated with a gas-solid-liquid system.
H2
H2O2
2 H2O
H2O + ½ O2
H2O
+ O2
+ ½ O2
+H2
(R 1)
(R 2)
(R 3)
(R 4)
Page 27
Chapter 1: Introduction
14
Finally, the hydrogen peroxide obtained has high purity, as water is the only
possible by-product [64]. The limitations, on the other hand, are related to the
amount of energy necessary to produce H2O2. Research is oriented to increase
the energy efficiency (g H2O2/kWh) in order to produce more peroxide while
applying less power. The energy efficiencies reported in literature span from
0.2 to 134 g H2O2/kWh, depending on the type of plasma [70]; these big
differences may be attributed to the possible differences in the power
measurements [71].
The use of plasma reactors for the synthesis of hydrogen peroxide from a
mixture of hydrogen and oxygen was already proposed in the 1960’s [72]. Then,
a silent electric discharge was used and yields of hydrogen peroxide not higher
than 5 % were obtained. In 2005, Zhou et al. [64] reported the use of an
atmospheric pressure dielectric barrier discharge (DBD) with which, from a
hydrogen/oxygen mixture, a H2O2 yield of 33 % and selectivity of 56 % were
obtained. In further publications they improved these results by modifying the
reactor [65] or scaling it up [66, 73], reaching concentrations of hydrogen
peroxide in solution up to 65 % and energy efficiencies of 134 g/kWh.
The use of water discharges has also been thoroughly studied. A review by
Locke et al. [70] summarizes all the different discharges investigated in this
field. High energy efficiencies have been reported (81 g/kWh ) as well. The main
benefits of using water over H2/O2, besides the properties of the plasma, would
be the reduction in operation costs and the improvement of the safety
conditions.
1.2.3.2 Decomposition
Hydrogen peroxide can be decomposed into oxygen and water (Eq. 1.4). This
reaction should not be underestimated when using hydrogen peroxide as
oxidant. In the first place for safety reasons, since, when it decomposes,
molecular oxygen is released. If the reaction takes place in a closed system, the
pressure will increase considerably, affecting the integrity of the system
(depending on the resistance of the materials used) and the reaction itself
(conversions and selectivities). The oxygen released can also form explosive
mixtures upon contact with organic compounds at certain concentrations. For
instance, during the epoxidation of propene, oxygen and propene are explosive
over a particular range of concentrations (i.e. the lower explosion limit (LEL) of
propene/O2/N2 mixture at 1 bar is 2 vol.% and the upper explosion limit (UEL)
Page 28
Hydrogen Peroxide to Propene Oxide (HPPO)
15
is 58 vol.%; at 10 bar they are 2 and 75 vol.%, respectively) [74]. Hydrogen
peroxide itself can form explosive mixtures with organic compounds, heavy
metals or alkaline substances [75]. Additionally, when it is heated up at
atmospheric pressure, vapors containing 26 vol.% or more H2O2 can explode by
a spark, by contact with catalytically active materials at room temperature, or
by ‘non-catalytic’ materials like aluminum at temperatures above about 150 °C
[75].
2 2 2 2
1 / 2H O O H O Eq. 1.4
The second, and also important, effect of the decomposition of hydrogen
peroxide is the decrease of the utilization (mol oxidized products obtained / mol
H2O2 converted) of the oxidant and the selectivity to the desired product. This
plays an important role in the whole HPPO process, because the cost of
producing hydrogen peroxide is one of the main economic factors of the process
[51].
Even though it is considered that the decomposition of hydrogen peroxide
during the liquid-phase epoxidation of propene at low temperatures is small
[13], it still plays a role and various research groups have studied it [51, 76-78].
The main factor influencing the decomposition is the temperature, with
increasing temperature, the decomposition rate increases as well [77]. Russo et
al. [51] observed that there was a strong dependency of the decomposition rate
on the concentration of TS-1, concluding that a second order kinetic law could
be applied (Eq. 1.5). These results are reasonable, given that the decomposition
of H2O2 is a surface reaction and can be Ti-catalyzed [31]. Therefore, the more
catalyst added the more active sites for the decomposition.
2 2[ -1][ ]D Dr k TS H O Eq. 1.5
1.2.4 HPPO: Process integration
The integration of the epoxidation of propene by hydrogen peroxide with the
synthesis of hydrogen peroxide by the anthraquinone auto-oxidation process is
possible thanks to the unique properties of TS-1, which allows to epoxidize
propene very selectively by using very diluted H2O2. The possibility of using
methanol both for the extraction of hydrogen peroxide and the epoxidation of
propene favors the process integration to a high extent.
Page 29
Chapter 1: Introduction
16
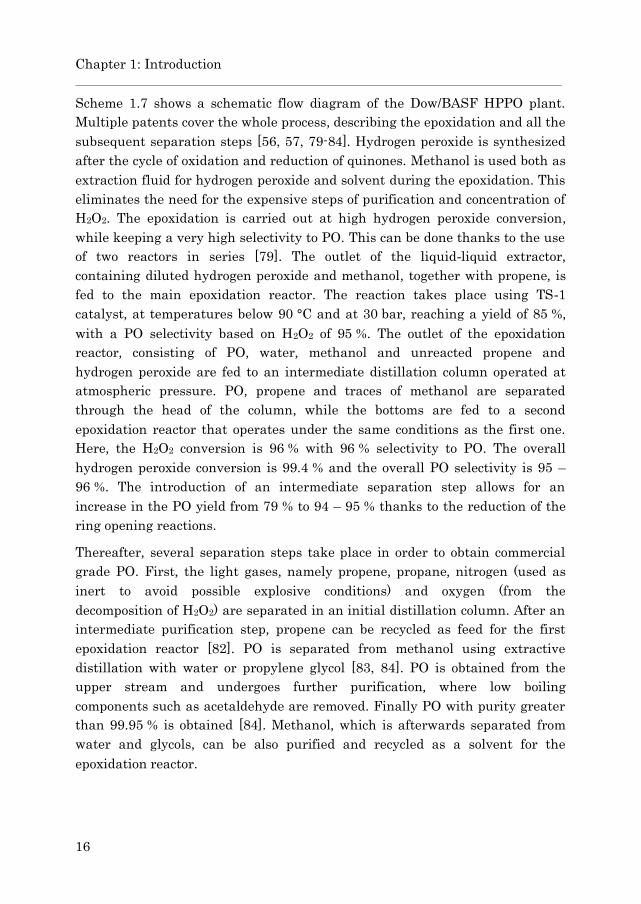
Scheme 1.7 shows a schematic flow diagram of the Dow/BASF HPPO plant.
Multiple patents cover the whole process, describing the epoxidation and all the
subsequent separation steps [56, 57, 79-84]. Hydrogen peroxide is synthesized
after the cycle of oxidation and reduction of quinones. Methanol is used both as
extraction fluid for hydrogen peroxide and solvent during the epoxidation. This
eliminates the need for the expensive steps of purification and concentration of
H2O2. The epoxidation is carried out at high hydrogen peroxide conversion,
while keeping a very high selectivity to PO. This can be done thanks to the use
of two reactors in series [79]. The outlet of the liquid-liquid extractor,
containing diluted hydrogen peroxide and methanol, together with propene, is
fed to the main epoxidation reactor. The reaction takes place using TS-1
catalyst, at temperatures below 90 °C and at 30 bar, reaching a yield of 85 %,
with a PO selectivity based on H2O2 of 95 %. The outlet of the epoxidation
reactor, consisting of PO, water, methanol and unreacted propene and
hydrogen peroxide are fed to an intermediate distillation column operated at
atmospheric pressure. PO, propene and traces of methanol are separated
through the head of the column, while the bottoms are fed to a second
epoxidation reactor that operates under the same conditions as the first one.
Here, the H2O2 conversion is 96 % with 96 % selectivity to PO. The overall
hydrogen peroxide conversion is 99.4 % and the overall PO selectivity is 95 –
96 %. The introduction of an intermediate separation step allows for an
increase in the PO yield from 79 % to 94 – 95 % thanks to the reduction of the
ring opening reactions.
Thereafter, several separation steps take place in order to obtain commercial
grade PO. First, the light gases, namely propene, propane, nitrogen (used as
inert to avoid possible explosive conditions) and oxygen (from the
decomposition of H2O2) are separated in an initial distillation column. After an
intermediate purification step, propene can be recycled as feed for the first
epoxidation reactor [82]. PO is separated from methanol using extractive
distillation with water or propylene glycol [83, 84]. PO is obtained from the
upper stream and undergoes further purification, where low boiling
components such as acetaldehyde are removed. Finally PO with purity greater
than 99.95 % is obtained [84]. Methanol, which is afterwards separated from
water and glycols, can be also purified and recycled as a solvent for the
epoxidation reactor.
Page 30
Hydrogen Peroxide to Propene Oxide (HPPO)
17
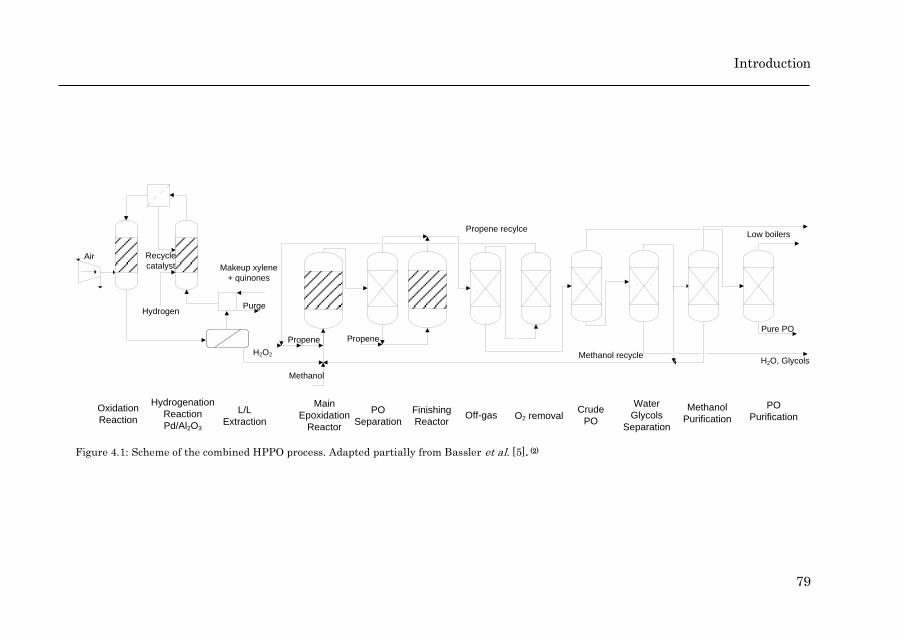
Scheme 1.7: Simplified flow diagram of the BASF/Dow process for PO production. Epoxidation section adapted from Bassler et al. [16] and H2O2
synthesis from Campos-Martin et al. [58]
Methanol recycle
Methanol
Propene
Pure PO
H2O, Glycols
Low boilers
Main
Epoxidation
Reactor
Off-gasCrude
PO
Water
Glycols
Separation
Methanol
Purification
PO
Purification
Purge
Air
Hydrogen
Oxidation
Reaction
Hydrogenation
Reaction
Pd/Al2O3
L/L
Extraction
H2O2
Makeup xylene
+ quinones
Recycle
catalyst
Propene
PO
Separation
Finishing
ReactorO2 removal
P-9
Page 31
Chapter 1: Introduction
18
18
In the overall process, there is also a strong integration of energy, the vapors
are compressed and the condensation heat is returned to the vaporizer
employed in the extractive distillation column [56]. As a result of the raw
material integration and the fact that there is no need for additional
infrastructure for co-product handling, up to 25 % reduction in capital
investment can be obtained with respect to the existing PO production
processes [56]. Additionally, substantial environmental benefits have been
achieved, such as the reduction by up to 80 % of the wastewater generated as
well as 35 % decrease in energy use [16].
Degussa-Evonik, together with Krupp-Uhde developed a different strategy for
the overall epoxidation and separation steps, obtaining a final PO purity of
99.97 %. A summary of the patents and reaction schemes employed by Degussa
has been published by Cavani et al. [56]. They opened the first plant in Korea,
in collaboration with SKC with a capacity of 100 000 tons per year [17].
In spite of all the aforementioned benefits, there are some limitations to the
current commercial HPPO process. First, the anthraquinone process cannot be
considered green, because of the reasons explained in section 1.2.3.1.
Additionally, three (Degussa) or four (BASF/Dow) reactors are required in the
overall process, as well as multiple separation steps in order to obtain pure PO.
Therefore, other alternatives are being sought, even though so far they are still
in the research or development stage.
1.3 Potential alternatives for the production of PO
1.3.1 DSHP/HPPO: Direct synthesis of Hydrogen peroxide/HPPO
The integration of the direct synthesis of hydrogen peroxide with the
epoxidation of propene with hydrogen peroxide would eliminate the problems
associated with the anthraquinone process. In this case, H2O2 is synthesized
using a mixture of hydrogen and oxygen over a Pd or Pd/Pt-based catalyst and
in the presence of strong mineral acids and halide ions. In a separate stage, PO
is produced via the epoxidation over TS-1. A pilot plant was built by Degussa-
Evonik and Headwaters Nanokinetix in Germany and was expected to start
operating in 2009 [56, 85-87]. However, no news have been reported about this
plant since the announcement in 2005 and no more reports about any new
plant using this technology have been released [63].
Page 32
Potential alternatives for the production of PO
19
This process claims to reduce the investment costs with one-third to one-half in
comparison with conventional technologies and that it eliminates the
hazardous reaction conditions and chemicals [56]. There are still several
limitations that hinder its industrial implementation, such as the possibility of
forming explosive mixtures of H2 and O2 with a flammable solvent (methanol).
The strong acids and bromide needed during the direct synthesis step should be
removed before the epoxidation step because they can catalyze the ring-opening
reactions, among others, that reduce the selectivity to PO. In the same line,
during the process some impurities can be formed such as formaldehyde,
acetaldehyde or propanal that may form azeotrope with methanol and are, not
only difficult to separate, but also a poison for the Pd or Pd/Au-based catalyst
[2, 56].
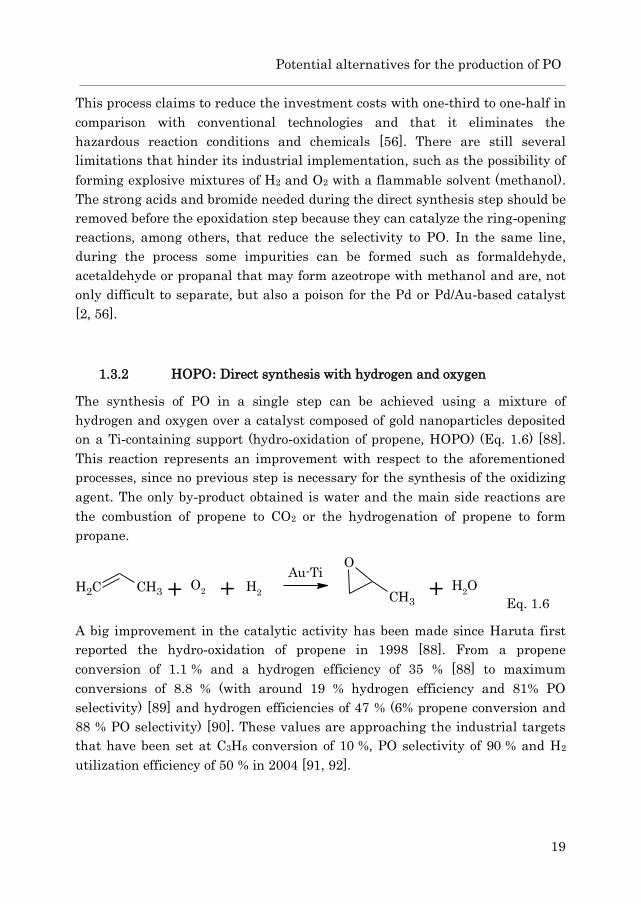
1.3.2 HOPO: Direct synthesis with hydrogen and oxygen
The synthesis of PO in a single step can be achieved using a mixture of
hydrogen and oxygen over a catalyst composed of gold nanoparticles deposited
on a Ti-containing support (hydro-oxidation of propene, HOPO) (Eq. 1.6) [88].
This reaction represents an improvement with respect to the aforementioned
processes, since no previous step is necessary for the synthesis of the oxidizing
agent. The only by-product obtained is water and the main side reactions are
the combustion of propene to CO2 or the hydrogenation of propene to form
propane.
Eq. 1.6
A big improvement in the catalytic activity has been made since Haruta first
reported the hydro-oxidation of propene in 1998 [88]. From a propene
conversion of 1.1 % and a hydrogen efficiency of 35 % [88] to maximum
conversions of 8.8 % (with around 19 % hydrogen efficiency and 81% PO
selectivity) [89] and hydrogen efficiencies of 47 % (6% propene conversion and
88 % PO selectivity) [90]. These values are approaching the industrial targets
that have been set at C3H6 conversion of 10 %, PO selectivity of 90 % and H2
utilization efficiency of 50 % in 2004 [91, 92].
+ O2 + H
2
Au-TiCH2 CH3
H2O+CH3
O
Page 33
Chapter 1: Introduction
20
20
Catalyst
The epoxidation reported by the group of Haruta [88] in 1998 was performed
over gold nanoparticles deposited on TiO2. Later on it was demonstrated that, if
Ti is in the tetrahedral position and highly dispersed on a silica matrix, the
catalyst showed greater stability to deactivation and the PO yield increased
significantly [93]. Therefore, catalyst such as Ti-SiO2 [94, 95], microporous TS-1
[96-98] or mesoporous Ti-SBA-15 [99] and Ti-TUD [100] have been thoroughly
researched for this reaction.
The catalyst preparation is a key factor that determines the catalytic activity.
Parameters such as Si/Ti ratio, addition of bases (LiOH, NaOH, CsOH, etc.)
[90, 101], pH value during the synthesis [98], gold loading [95] and calcination
temperatures have been carefully studied. The best methods for obtaining
active gold nanoparticles are deposition-precipitation (DP) [60, 102] and solid-
grinding (SG) [97]. The size of the gold nanoparticles is essential to determine
the reactivity of the catalyst [103]. The optimum gold particle size for the
epoxidation of propene was determined to be between 2 and 5 nm. Smaller
particles favor the hydrogenation of propene to propane, while Au
nanoparticles bigger than 5 nm catalyze the combustion to CO2. Low titanium
content is preferred in the catalyst because it influences the high Ti and Au
dispersion and optimizes the cooperation between the two species [56].
Other studies focused on the addition of other active metal components like Ag,
Pd, Pt or Cu, among others [56, 104]. Incorporation of Pd resulted in the
hydrogenation of propene to propane and hydrogen oxidation to water. With Pt
as an additive, both hydrogen and oxygen efficiencies improved [104]. Llorca et
al. obtained very interesting results by combining bimetallic Au-Cu [105].
The potential of this reaction can be demonstrated by the amount of patents
released by several chemical companies such as Dow or Bayer, where
modifications to catalyst and optimum reaction conditions are evaluated [56].
Reaction mechanism
The presence of both Ti and Au in the catalyst has been demonstrated to be
essential for the epoxidation to take place. Gold deposited on silica produces
only acrolein [106], while TiO2 alone is inactive for the reaction. The synergy
between Au and Ti is very important. It is known that Au can catalyze the
synthesis of H2O2 from a mixture of hydrogen and oxygen [61]. Furthermore, as
it was explained before, the epoxidation of propene with hydrogen peroxide
Page 34
Potential alternatives for the production of PO
21
required the formation of an active Ti-OOH species after the interaction
between tetrahedral Ti and H2O2. Therefore, it is reasonable to assume that Ti-
hydroperoxides are also active intermediates in the epoxidation with H2 and O2
over Au-Ti catalysts. This has been demonstrated via in situ spectroscopic
techniques [107, 108]. Using data obtained via XAFS, Bravo Suarez et al. [107]
were capable of proposing a possible reaction mechanism (Scheme 1.8). This
mechanism involves the formation of hydrogen peroxide over Au surfaces, the
transfer of H2O2 from Au to neighboring isolated Ti sites to form Ti-OOH and
the epoxidation of propene to PO by the Ti-OOH species. Finally, PO and water
are desorbed from species V, resulting in species I.
Scheme 1.8: A sequential mechanism proposed for the direct epoxidation of propene with hydrogen
and oxygen over Au supported on titanosilicates. Adapted from [107]
Limitations
In spite of the big improvements in the catalytic activity mentioned before,
there are still some drawbacks that need to be solved before this technology can
be implemented industrially [108]. In the first place, the hydrogen efficiency is
still too low. So far, 3 to 10 molecules of water are produced per molecule of PO,
making the process inefficient. In the second place, bigger efforts should be
made to evaluate and improve the long-term stability of the catalyst. Normally,
the products of the oligomerization of PO can deposit on the catalyst, blocking
the active sites. The risk of forming explosive mixtures with hydrogen and
Ti
O
H
OAu0
O2-
Ti
O
H
O
Au+
Ti
OOH
O
Au0
H2O
Ti
OOH
O
Au0
H2O
CH3CH=CH2
H2O2
Ti
OH
O
Au0
H2OO
CH3-CH-CH2
PO + H2O
O2 H2
C3H6
(I)
(II)
(III)
(VI)
(V)
Page 35
Chapter 1: Introduction
22
22
oxygen also limits the application of this process. The use of novel reactors such
as microreactors [109, 110] and membrane reactors [111] can be a solution to
this issue. Using these reactors, mixtures that in a macro system would be
considered explosive, can be employed under safe conditions.
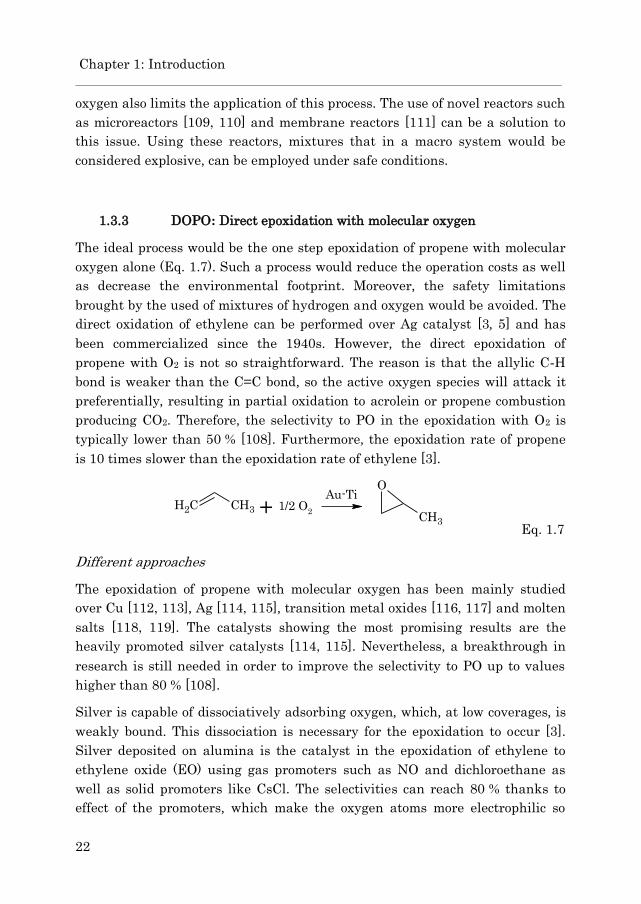
1.3.3 DOPO: Direct epoxidation with molecular oxygen
The ideal process would be the one step epoxidation of propene with molecular
oxygen alone (Eq. 1.7). Such a process would reduce the operation costs as well
as decrease the environmental footprint. Moreover, the safety limitations
brought by the used of mixtures of hydrogen and oxygen would be avoided. The
direct oxidation of ethylene can be performed over Ag catalyst [3, 5] and has
been commercialized since the 1940s. However, the direct epoxidation of
propene with O2 is not so straightforward. The reason is that the allylic C-H
bond is weaker than the C=C bond, so the active oxygen species will attack it
preferentially, resulting in partial oxidation to acrolein or propene combustion
producing CO2. Therefore, the selectivity to PO in the epoxidation with O2 is
typically lower than 50 % [108]. Furthermore, the epoxidation rate of propene
is 10 times slower than the epoxidation rate of ethylene [3].
Eq. 1.7
Different approaches
The epoxidation of propene with molecular oxygen has been mainly studied
over Cu [112, 113], Ag [114, 115], transition metal oxides [116, 117] and molten
salts [118, 119]. The catalysts showing the most promising results are the
heavily promoted silver catalysts [114, 115]. Nevertheless, a breakthrough in
research is still needed in order to improve the selectivity to PO up to values
higher than 80 % [108].
Silver is capable of dissociatively adsorbing oxygen, which, at low coverages, is
weakly bound. This dissociation is necessary for the epoxidation to occur [3].
Silver deposited on alumina is the catalyst in the epoxidation of ethylene to
ethylene oxide (EO) using gas promoters such as NO and dichloroethane as
well as solid promoters like CsCl. The selectivities can reach 80 % thanks to
effect of the promoters, which make the oxygen atoms more electrophilic so
Au-TiCH2 CH3
CH3
O
1/2 O2+
Page 36
Potential alternatives for the production of PO
23
they can be preferentially inserted into the C=C double bond instead of
cleaving the C-H bond. In the case of propene, the C-H bond is weaker than in
ethylene, resulting in the formation of the allylic intermediates. On top of that,
the γ-H of the reaction intermediates are very weakly bonded, and the active
oxygen adatoms can easily abstract them, eventually being completely oxidized
to CO2 and water [108]. ARCO Chem Tech (now Liondell) [120, 121] studied
and patented a catalyst with high silver loading (30 – 60 %) on calcium
carbonate. Using this catalyst, containing K, Mo and Cl promoters and carrying
out the epoxidation in the presence of chloroethane, nitric oxide and CO,
selectivity values close to 60 % were obtained at 3 % propene conversion [3,
120].
Gold catalysis
Considering the high catalytic activity shown by gold-titanium catalysts for the
hydro-oxidation of propene, the possibility of using them for the direct
epoxidation with molecular oxygen has also been explored. In 2009, the
research of Huang et al. [122] and Ojeda and Iglesia [123] proved that Au/TS-1
and Au/TiO2, respectively, could catalyze the epoxidation of propene with O2 if
water vapor was added to the gas stream. In a recent paper Huang et al. [124]
proposed a possible reaction mechanism in which the presence of basic salts on
the catalyst is necessary in order to stabilize O2- over the gold nanoparticle.
Water dissociates heterolytically over the Au nanoparticle into OH- and a
proton (H+). The latter reacts with O2- to form OOH* species that can be
transferred to the neighboring Ti atom and react with propene in the same way
as in the epoxidation with H2 and O2. Lee et al. [125] reported that propene
could be epoxidized over Au6-10 clusters supported on three-monolayer Al2O3
grown by atomic layer deposition. The selectivity to PO with O2 alone was 33 %,
while when water was added, it increased to above 90 %. Even though this
system seems attractive, the values obtained are not comparable with the ones
obtained with Ag. Therefore more research is needed in order to improve the
efficiencies and understand how the reaction works.
1.3.4 Other alternatives
A very complete review of the main existing and promising alternative
processes for the synthesis of PO has been published by Cavani et al. [56].
Besides the aforementioned processes, there are others that also show
Page 37
Chapter 1: Introduction
24
24
potential. One of the possible options reported is the gas-phase oxidation with
N2O, which can be used as oxidant of the selective oxidation of hydrocarbons.
Another reaction that has been researched is the gas-phase oxidation with O3.
Finally, the process that would represent a huge reduction in costs is the direct
oxidation of propane to PO.
1.4 Scope and outline of the thesis
Throughout this chapter, the benefits and drawbacks of the existing processes
for the synthesis of PO have been highlighted. The two main technologies, the
chlorohydrin and the hydroperoxide processes are still very important and
profitable. The commercialization of the HPPO represented a milestone in
process intensification and PO production [56], for which several prizes were
awarded to BASF and Dow [126]. Nevertheless, there is still room for
improvement in the existing technologies and potential in the alternatives that
are currently under research. The purpose of this thesis is to analyze some of
those alternatives and to evaluate their feasibility.
In the first part of this work, the possibility of developing an alternative
process to the HPPO, where hydrogen peroxide is synthesized in a plasma
reactor, is assessed. Chapter 2 analyzes the gas phase epoxidation of propene
with hydrogen peroxide vapor, considering the fact that hydrogen peroxide is
produced in the plasma in the gas phase and can be immediately utilized for
the epoxidation. In Chapter 3 the liquid phase epoxidation of propene with
aqueous hydrogen peroxide is studied in a microreactor. This option would be
compatible with the synthesis of H2O2 in a microplasma reactor and the
subsequent capturing in an adsorbing liquid, or with the direct synthesis of
peroxide from H2 and O2 in a microreactor. Finally, the overall process is
analyzed in Chapter 4, considering the integration of epoxidation and plasma
reactors and the feasibility of the combined concept.
The second part of the thesis focuses on the one step oxidation of propene with
molecular oxygen. Chapter 5 contains a detailed experimental and kinetic
study of the epoxidation of propene with O2 alone using Au/TS-1 and Au/Ti-
SiO2 as catalysts. Here, a comparison with the hydro-oxidation of propene
using hydrogen and oxygen over the same catalysts is also performed. The
main by-product obtained with this reaction is acrolein, which is, like PO, an
important chemical intermediate. In Chapter 6 the oxidation of propene with
O2 over gold nanoparticles deposited on a copper-containing spinel was
Page 38
Scope and outline
25
investigated. The result was the selective production of acrolein, for which the
reaction mechanism was also analyzed.
Finally, Chapter 7 summarizes the conclusions reached along the thesis and
ends with an outlook of the alternative processes for the production of PO.
References
[1] http://www.prweb.com/releases/2013/1/prweb10344181.htm, 2013 (accessed
August 2014).
[2] H. Baer, M. Bergamo, A. Forlin, L.H. Pottenger, J. Lindner, Propylene
Oxide, Ullmann's Encyclopedia of Industrial Chemistry, Wiley-VCH Verlag
GmbH & Co. KGaA, 2012.
[3] T.A. Nijhuis, M. Makkee, J.A. Moulijn, B.M. Weckhuysen, Ind. Eng. Chem.
Res. 45 (2006) 3447-3459.
[4] http://praetorian.nexant.com/about/cs/news/items/PERP%200708_6_
PropyleneOxide.cfm, 2009 (accessed July 2014).
[5] T.E. Lefort (Fr De Catalyse Generalisee SA), US1998878 A, 1935.
[6] J. Kollar (Halcon International Inc), US3351635 A, 1967.
[7] E.T. Marquis, K.P. Keating, J.F. Knifton, W.A. Smith, J.R. Sanderson, J.
Lustri (Texaco Inc), US 4891437 A, 1990.
[8] E.I. Korchak, M. Pell (Halcon International Inc), US3439001 A, 1969.
[9] W.S. Dubner, R.N. Cochran (Arco Chemical Technology, L.P.), US5210354
A, 1993.
[10] J.J. Van Der Sluis (Shell Corporation), US6504038 B1, 2003.
[11] T. Seo, J. Tsuji (Sumitomo Chemical Company), US6646139, 2003.
[12] M. Taramasso, G. Perego, B. Notari (SnamProggeti), US 4410501, 1983.
[13] M.G. Clerici, G. Bellussi, U. Romano, J. Catal. 129 (1991) 159-167.
[14] G. Goor, J. Glenneberg, S. Jacobi, Hydrogen Peroxide, Ullmann's
Encyclopedia of Industrial Chemistry, Wiley-VCH Verlag GmbH & Co. KGaA,
2000.
[15] V. Russo, R. Tesser, E. Santacesaria, M. Di Serio, Chemical and Technical
Aspects of Propene Oxide Production via Hydrogen Peroxide (HPPO Process),
Ind. Eng. Chem. Res., 2013, pp. 1168-1178.
[16] P. Bassler, H.G. Goebbel, M. Weidenbach, Chem. Eng. Trans. 21 (2010)
571-576.
Page 39
Chapter 1: Introduction
26
26
[17] http://dx.doi.org/10.1021/cen-v086n003.p025, 2008 (accessed August 2014).
[18] http://www.dow.com/polyurethane/news/2012/20120104a.htm, 2012
(accessed August 2014).
[19] http://corporate.evonik.com/en/media/archive/Pages/news-
details.aspx?newsid=35597, 2013 (accessed August 2014).
[20] M.G. Clerici, Appl.Catal. 68 (1991) 249-261.
[21] M.G. Clerici, P. Ingallina, J. Catal. 140 (1993) 71-83.
[22] C.B. Khouw, C.B. Dartt, J.A. Labinger, M.E. Davis, J. Catal. 149 (1994)
195-205.
[23] A.J.H.P. van der Pol, J.H.C. van Hooff, Appl. Catal., A 106 (1993) 97-113.
[24] R. Joseph, T. Ravindranathan, A. Sudalai, Tetrahedron Lett. 36 (1995)
1903-1904.
[25] A. Tuel, S. Moussa-Khouzami, Y.B. Taarit, C. Naccache, J. Mol. Catal. 68
(1991) 45-52.
[26] R. Millini, E.P. Massara, G. Perego, G. Bellussi, J. Catal. 137 (1992) 497-
503.
[27] P. Ratnasamy, D. Srinivas, H. Knözinger, Active sites and reactive
intermediates in titanium silicate molecular sieves, Elsevier Academic Press
Inc., San Diego, 2004.
[28] B. Notari, Microporous Crystalline Titanium Silicates, in: W.O.H. D.D.
Eley, G. Bruce (Eds.), Adv. Catal., 41, Academic Press, 1996, pp. 253-334.
[29] P. Hartman, Mineral. Mag. 37 (1969) 366-&.
[30] R. Millini, G. Perego, Gazz. Chim. Ital. 126 (1996) 133-140.
[31] D.R.C. Huybrechts, P.L. Buskens, P.A. Jacobs, J. Mol. Catal. 71 (1992)
129-147.
[32] C. Neri, B. Anfossi, A. Esposito, F. Buonomo (ANIC SpA), US4833260,
1989.
[33] X. Liu, X. Wang, X. Guo, G. Li, Catal. Today 93-95 (2004) 505-509.
[34] G. Thiele (Degussa Aktiengesellschaft), US5675026, 1997.
[35] V. Arca, R. Buzzoni, P. Furlan (The Dow Chemical Company),
EP19980124647, 2004.
[36] G. Bellussi, A. Carati, M.G. Clerici, G. Maddinelli, R. Millini, J. Catal. 133
(1992) 220-230.
[37] E. Karlsen, K. Schoffel, Catal. Today 32 (1996) 107-114.
[38] P.E. Sinclair, C.R.A. Catlow, J. Phys. Chem. B 103 (1999) 1084-1095.
Page 40
References
27
[39] M.G. Clerici, Oil Gas Eur. Mag. 32 (2006) 77-82.
[40] P.E. Sinclair, G. Sankar, C.R.A. Catlow, J.M. Thomas, T. Maschmeyer, J.
Phys. Chem. B 101 (1997) 4232-4237.
[41] M.G. Clerici, Top. Catal. 15 (2001) 257-263.
[42] Y. Wu, Q. Liu, X. Su, Z. Mi, Front. Chem. Chin. 3 (2008) 112-117.
[43] Z. Zhang, J. Kang, Y. Wang, React. Kinet. Catal. Lett. 92 (2007) 49-54.
[44] Y. Miyano, K. Fukuchi, Fluid Phase Equilib. 226 (2004) 183-187.
[45] A. Corma, P. Esteve, Martı, amp, x, A. nez, J. Catal. 161 (1996) 11-19.
[46] G. Langhendries, D.E. De Vos, G.V. Baron, P.A. Jacobs, J. Catal. 187
(1999) 453-463.
[47] X.H. Liang, Z.T. Mi, Y.L. Wu, L. Wang, E.H. Xing, React. Kinet. Catal.
Lett. 80 (2003) 207-215.
[48] S.B. Shin, D. Chadwick, Ind. Eng. Chem. Res. 49 (2010) 8125-8134.
[49] G. Wu, Y. Wang, L. Wang, W. Feng, H. Shi, Y. Lin, T. Zhang, X. Jin, S.
Wang, X. Wu, P. Yao, Chem. Eng. J. 215–216 (2013) 306-314.
[50] S.M. Danov, A.V. Sulimov, V.A. Kolesnikov, A.A. Ovcharov, Kinet. Catal.
54 (2013) 193-198.
[51] V. Russo, R. Tesser, E. Santacesaria, M. Di Serio, Ind. Eng. Chem. Res. 53
(2014) 6274-6287.
[52] A. Goti, F. Cardona, Hydrogen peroxide in green oxidation reactions:
Recent catalytic processes, in: P. Tundo, V. Esposito (Eds.), Green Chemical
Reactions, Springer, Dordrecht, 2008, pp. 191-212.
[53] M.G. Clerici, Titanium Silicalite-1, Metal Oxide Catalysis, Wiley-VCH
Verlag GmbH & Co. KGaA, 2009, pp. 705-754.
[54] http://www.solvay.com/en/media/press_releases/20111005-
hydrogenperoxideplant.html, 2001 (accessed August 2014).
[55] http://www.icis.com/chemicals/channel-info-chemicals-a-z/, 2014 (accessed
21/07/2014).
[56] F. Cavani, A.M. Gaffney, Synthesis of Propene Oxide: A Successful
Example of Sustainable Industrial Chemistry, in: F. Cavani, G. Centi, S.
Perathoner, F. Trifiro (Eds.), Sustainable Industrial Chemistry, Wiley-VCH
Verlag GmbH & Co. KGaA, 2009, pp. 319-365.
[57] G.P. Schindler, C. Walsdorff, R. Korner, H.G. Goebbel (Basf
Aktiengesellschaft, The Dow Chemical Company), US20070004926 A1, 2007.
[58] J.M. Campos-Martin, G. Blanco-Brieva, J.L.G. Fierro, Angew. Chem., Int.
Ed. 45 (2006) 6962-6984.
Page 41
Chapter 1: Introduction
28
28
[59] C. Samanta, Appl. Catal., A 350 (2008) 133-149.
[60] M. Haruta, CATTECH 6 (2002) 102-115.
[61] P. Landon, P.J. Collier, A.J. Papworth, C.J. Kiely, G.J. Hutchings, Chem.
Commun. (2002) 2058-2059.
[62] E. Ntainjua N, J.K. Edwards, A.F. Carley, J.A. Lopez-Sanchez, J.A.
Moulijn, A.A. Herzing, C.J. Kiely, G.J. Hutchings, Green Chem. 10 (2008)
1162-1169.
[63] J. Garcia-Serna, T. Moreno, P. Biasi, M.J. Cocero, J.-P. Mikkola, T.O.
Salmi, Green Chem. 16 (2014) 2320-2343.
[64] J.C. Zhou, H.C. Guo, X.S. Wang, M.X. Guo, J.L. Zhao, L.X. Chen, W.M.
Gong, Chem. Commun. (2005) 1631-1633.
[65] Y. Yi, J. Zhou, H. Guo, J. Zhao, J. Su, L. Wang, X. Wang, W. Gong, Angew.
Chem., Int. Ed. 52 (2013) 8446-8449.
[66] Y. Yi, J. Zhou, T. Gao, H. Guo, J. Zhou, J. Zhang, AIChE J. 60 (2014) 415-
419.
[67] J. Su, J. Zhou, C. Liu, X. Wang, H. Guo, Chin. J. Catal. 31 (2010) 1195-
1199.
[68] R. Burlica, K.Y. Shih, B.R. Locke, Ind. Eng. Chem. Res. 49 (2010) 6342-
6349.
[69] C.A. Vasko, D.X. Liu, E.M. van Veldhuizen, F. Iza, P.J. Bruggeman,
Plasma Chem. Plasma Process. 34 (2014) 1081-1099.
[70] B.R. Locke, S. Kai-Yuan, Plasma Sources Sci. Techol. 20 (2011) 034006.
[71] C.A. Vasko, In preparation, Technische Universiteit Eindhoven, 2015.
(PhD Thesis).
[72] K. Morinaga, Bull. Chem. Soc. Jpn. 35 (1962) 345-348.
[73] J.L. Zhao, J.C. Zhou, J. Su, H.C. Guo, X.S. Wang, W.M. Gong, Plasma
Science & Technology 11 (2009) 181-186.
[74] H.P. Schildberg, FORSCH INGENIEURWES 73 (2009) 33-65.
[75] W.C. Schumb, C.N. Satterfield, R.L. Wentworth, Concentration,
Purification, Structural Materials and Handling, in: W.C. Schumb, C.N.
Satterfield, R.L. Wentworth (Eds.), Hydrogen Peroxide, 128, Reinhold
Publishing Corporation, New York, 1955, pp. 152 - 188.
[76] V.V. Potekhin, V.A. Kulikova, E.G. Kochina, V.M. Potekhin, Russ J. Appl.
Chem 84 (2011) 1195-1200.
[77] L.N. Wang, Y.Q. Wang, G.Q. Wu, W.P. Feng, T. Zhang, R.M. Yang, X. Jin,
H.N. Shi, Int. J. Chem. React. Eng. 11 (2013) 265-269.
Page 42
References
29
[78] C.W. Yoon, K.F. Hirsekorn, M.L. Neidig, X.Z. Yang, T.D. Tilley, ACS Catal.
1 (2011) 1665-1678.
[79] P. Bassler, W. Harder, P. Resch, N. Rieber, W. Ruppel, J.H. Teles, A.
Walch, A. Wenzel, P. Zehner (Basf Aktiengesellschaft), US6479680, 2002.
[80] H.G. Goebbel, P. Bassler, J.H. Teles, P. Rudolf, U. Mueller, A. Forlin, M.
Schulz, M. Weidenbach (Basf Se, The Dow Chemical Company), EP1973891,
2007.
[81] H.G. Gobbel, H. Schultz, P. Schultz, R. Patrascu, M. Schulz, M.
Weidenbach (Basf Aktiengesellschaft, The Dow Chemical Company),
US20060161010 A1, 2006.
[82] P. Babler, H.G. Goebbel, J. Teles, P. Rudolf (Basf Aktiengesellschaft),
US20060058539, 2006.
[83] H.G. Goebbel, H. Schultz, P. Schultz, R. Patrascu, M. Schulz, M.
Weidenbach (Basf Aktiengesellschaft, The Dow Chemical Company),
US20070238888, 2007.
[84] R. Patrascu, S. Astori, M.M. Weidenbach (The Dow Chemical Company),
EP 2168953 A1, 2010.
[85] M. Bender, P. Zehner, O. Machhammer, U. Mueller, K. Harth, G.P.
Schindler, H. Junicke (BASF Aktiengesellschaft), US7173143, 2007.
[86] T. Haas, G. Stochniol, R. Jahn (Degussa Ag), US7241908, 2007.
[87] http://www.businesswire.com/news/home/20051011005295/en/Degussa
Headwaters-Incorporated-Building-Demonstration-Plant-Direct-
Synthesis#.U_2BSzK1YZ0, 2005 (accessed August 2014).
[88] T. Hayashi, K. Tanaka, M. Haruta, J. Catal. 178 (1998) 566-575.
[89] B. Taylor, J. Lauterbach, W.N. Delgass, Appl. Catal., A 291 (2005) 188-
198.
[90] J. Huang, T. Takei, T. Akita, H. Ohashi, M. Haruta, Appl. Catal., B 95
(2010) 430-438.
[91] B. Chowdhury, J.J. Bravo-Suarez, M. Date, S. Tsubota, M. Haruta, Angew.
Chem., Int. Ed. Engl. 45 (2006) 412-415.
[92] A.K. Sinha, S. Seelan, S. Tsubota, M. Haruta, Angew. Chem., Int. Ed.
Engl. 43 (2004) 1546-1548.
[93] T.A. Nijhuis, B.J. Huizinga, M. Makkee, J.A. Moulijn, Ind. Eng. Chem.
Res. 38 (1999) 884-891.
[94] T.A. Nijhuis, T.Q. Gardner, B.M. Weckhuysen, J. Catal. 236 (2005) 153-
163.
Page 43
Chapter 1: Introduction
30
30
[95] J. Chen, S.J.A. Halin, E.A. Pidko, M.W.G.M. Verhoeven, D.M. Perez
Ferrandez, E.J.M. Hensen, J.C. Schouten, T.A. Nijhuis, ChemCatChem 5
(2013) 467-478.
[96] J.J. Bravo-Suarez, K.K. Bando, T. Fujitani, S.T. Oyama, J. Catal. 257
(2008) 32-42.
[97] J.H. Huang, E. Lima, T. Akita, A. Guzman, C.X. Qi, T. Takei, M. Haruta,
J. Catal. 278 (2011) 8-15.
[98] W.S. Lee, M.C. Akatay, E.A. Stach, F.H. Ribeiro, W.N. Delgass, J. Catal.
287 (2012) 178-189.
[99] T.A. Nijhuis, E. Sacaliuc, B.M. Weckhuysen, The Epoxidation of Propene
over Gold Nanoparticle Catalysts, in: S.T. Oyama (Ed.), Mechanisms in
Homogeneous and Heterogeneous Epoxidation Catalysis, Elsevier, Amsterdam,
2008, pp. 339-386.
[100] J.J. Bravo-Suarez, J. Lu, C.G. Dallos, T. Fujitani, S.T. Oyama, J. Phys.
Chem. C 111 (2007) 17427-17436.
[101] W.S. Lee, M.C. Akatay, E.A. Stach, F.H. Ribeiro, W.N. Delgass, J. Catal.
308 (2013) 98-113.
[102] E.E. Stangland, B. Taylor, R.P. Andres, W.N. Delgass, J. Phys. Chem. B
109 (2005) 2321-2330.
[103] C.X. Qi, T. Akita, M. Okumura, M. Haruta, Appl. Catal., A 218 (2001) 81-
89.
[104] Y. Zhang, X.J. Cui, F. Shi, Y.Q. Deng, Chem. Rev. 112 (2012) 2467-2505.
[105] J. Llorca, M. Dominguez, C. Ledesma, R.J. Chimentao, F. Medina, J.
Sueiras, I. Angurell, M. Seco, O. Rossell, J. Catal. 258 (2008) 187-198.
[106] N.W. Cant, W.K. Hall, J. Phys. Chem. A 75 (1971) 2914-2921.
[107] J.J. Bravo-Suárez, K.K. Bando, J. Lu, M. Haruta, T. Fujitani, T. Oyama,
J. Phys. Chem. C 112 (2008) 1115-1123.
[108] J.H. Huang, M. Haruta, Res. Chem. Intermed. 38 (2012) 1-24.
[109] J. Chen, S.J.A. Halin, J.C. Schouten, T.A. Nijhuis, Faraday Discuss. 152
(2011) 321-336.
[110] T.A. Nijhuis, J. Chen, S.M.A. Kriescher, J.C. Schouten, Ind. Eng. Chem.
Res. 49 (2010) 10479-10485.
[111] S.T. Oyama, X.M. Zhang, J.Q. Lu, Y.F. Gu, T. Fujitani, J. Catal. 257
(2008) 1-4.
[112] J. Lu, M. Luo, H. Lei, X. Bao, C. Li, J. Catal. 211 (2002) 552-555.
Page 44
References
31
[113] O.P.H. Vaughan, G. Kyriakou, N. Macleod, M. Tikhov, R.M. Lambert, J.
Catal. 236 (2005) 401-404.
[114] J. Lu, M. Luo, H. Lei, C. Li, Appl. Catal., A 237 (2002) 11-19.
[115] J. Lu, J.J. Bravo-Suárez, M. Haruta, S.T. Oyama, Appl. Catal., A 302
(2006) 283-295.
[116] Y. Liu, K. Murata, M. Inaba, N. Mimura, Appl. Catal., A 309 (2006) 91-
105.
[117] N. Mimura, S. Tsubota, K. Murata, K. Bando, J. Bravo-Suárez, M.
Haruta, S.T. Oyama, Catal. Lett. 110 (2006) 47-51.
[118] B.T. Pennington, M.C. Fullington (Olin Corporation), US4943643 1990.
[119] T.A. Nijhuis, S. Musch, M. Makkee, J.A. Moulijn, Appl. Catal., A 196
(2000) 217-224.
[120] R. Pitchai, A.P. Kahn, A.M. Gaffney (Arco Chemical Technology, L.P.),
US5686380, 1997.
[121] B. Cooker, A.M. Gaffney, J.D. Jewson, A.P. Kahn, R. Pitchai (Arco
Chemical Technology, L.P.), US5770746, 1998.
[122] J. Huang, T. Akita, J. Faye, T. Fujitani, T. Takei, M. Haruta, Angew.
Chem., Int. Ed. Engl. 48 (2009) 7862-7866.
[123] M. Ojeda, E. Iglesia, Chem. Commun. (2009) 352-354.
[124] J.H. Huang, T. Takei, H. Ohashi, M. Haruta, Appl. Catal., A 435 (2012)
115-122.
[125] S. Lee, L.M. Molina, M.J. Lopez, J.A. Alonso, B. Hammer, B. Lee, S.
Seifert, R.E. Winans, J.W. Elam, M.J. Pellin, S. Vajda, Angew. Chem., Int. Ed.
Engl. 48 (2009) 1467-1471.
[126] http://www.dow.com/propyleneoxide/news/20091105a.htm, 2009 (accessed
August 2014).
Page 46
2 This Chapter has been published as:
D.M. Perez Ferrandez, M.H.J.M. de Croon, J.C. Schouten & T.A.
Nijhuis (2013). Gas-phase epoxidation of propene with hydrogen
peroxide vapor. Ind. Eng. Chem. Res., 52(30), 10126-10132.
Abstract
A study on the gas phase epoxidation of propene with vapor hydrogen peroxide
has been carried out. The main purpose was to understand the key factors in
the reaction and the relationship between epoxidation of propene and
decomposition of hydrogen peroxide, which is the main side reaction. The
decomposition was highly influenced by the materials used, being higher in
metals than in PTFE and glass and it was complete when the epoxidation
catalyst, TS-1, was introduced in the system. However, when propene was
added, the peroxide was preferentially used for the epoxidation, even with
amounts of catalyst as small as 10 mg, reaching productivities of
10.5 kgPO kgcat-1 h-1 for a GHSV of 450,000 ml gcat
-1 h-1. The hydrogen peroxide
was converted completely in all the experiments conducted, with selectivity to
PO of around 40 % for all peroxide concentrations. Finally, if concentrations of
propene higher than the stoichiometrically required amounts were used, the
selectivity to PO increased to almost 90 %.
Gas phase epoxidation
of propene with
hydrogen peroxide
vapor
Page 47
Chapter 2: Gas-phase epoxidation of propene with hydrogen peroxide vapor
34
2.1 Introduction
The use of aqueous hydrogen peroxide for the synthesis of propene oxide (PO) is
an attractive alternative to the traditional chlorohydrin and hydroperoxide
processes. In the first place, because water is the only by-product, making it a
clean technology, and in the second place because of the high yields that can be
obtained. This reaction was first carried out by Clerici et al. [1], who reported a
conversion of hydrogen peroxide higher than 95 %, with negligible
decomposition and the selectivity of propene to PO of around 90 %. The final
step for its industrial implementation occurred in 2008, when the epoxidation
of propene was coupled with the synthesis of hydrogen peroxide via the
anthraquinone process and two plants were opened by Evonik and SKC and by
Dow and BASF, respectively [2, 3].
Zhao et al. [4] reported the possibility of integrating the epoxidation of propene
with the synthesis of hydrogen peroxide in a plasma reactor starting from a
mixture of O2 and H2. This simplifies the overall process, since the first step
does not require any solvent and the peroxide obtained has high purity.
Additionally, if one considers that the H2O2 leaves the plasma as vapor, to
perform the epoxidation in the gas phase would avoid intermediate capturing
steps. This combination was first used by Su et al. [5], who reported a yield of
0.25 kgPO kgcat-1 h-1, selectivity of propene to PO of 95.4 % and peroxide
utilization of 36.1 %. A more detailed description of the gas phase epoxidation
was published by Klemm et al. [6], who performed the reaction in a
microstructured reactor coated with TS-1, both on laboratory scale and in a
pilot plant. They reached productivities higher than 1 kg of PO per kilogram of
catalyst per hour and selectivities to PO based on propene higher than 90 %.
However, the selectivity based on peroxide that they reported was 25 % in lab
experiments and 60 % in the pilot plant, which is still too low for being able to
compete with the liquid phase route mentioned before.
2 2 2 2
1 / 2H O O H O Eq. 2.1
The main side reaction encountered when working with hydrogen peroxide
vapor is its decomposition into oxygen and water (Eq. 2.1), which can occur
both on the surface of the reactor and over the catalyst. The decomposition of
H2O2 vapor over different materials, even relatively inert ones, was broadly
studied in the middle of the 20th century. Satterfield et al. [7, 8] and Mackenzie
et al. [9] reported that, at temperatures between 15 and 450 °C, it is mainly a
surface reaction, with the rate of reaction being higher over metals than over
Page 48
Introduction
35
borosilicate glass or quartz. Analyzing the effect of temperature, Satterfield et
al. [7] indicated that the decomposition reaches a minimum at 150 °C. The
reason for higher decomposition values at lower temperatures was attributed to
the adsorption of hydrogen peroxide on the walls of the glass vessel, forming a
multilayer which gets thicker at lower temperatures until there is
condensation. With respect to the kinetics of the decomposition of hydrogen
peroxide vapor, Giguere et al. [10] and Hoare et al. [11] reported that it is a
first order reaction with respect to the concentration of hydrogen peroxide
when using partial pressures of H2O2 higher than 0.0013 bar, and that the
activation energy is about 63 kJ/mol. This contrasted with the 1.5 order
predicted by Satterfield et al. [7] or the bimolecular reaction published by
Mackenzie et al. [9] The reasons for these discrepancies can be that the former
did not use any inert gas, while both Giguere et al. [10] and Hoare et al. [11]
studied the influence of various inert gases, and the latter conducted his study
at partial pressures of peroxide of 0.0013 bar. In a more recent study, Lin et al.
[12] analyzed the decomposition of aqueous H2O2 in flow at high temperatures,
from 100 to 280 °C, over reactor tubing of various materials. They also observed
first order reaction kinetics and their results were in agreement with the
research of Hoare et al. [11] The values for the decomposition rate constants for
several materials that they reported can be seen in the third column of Table
2.1. The rate constants for Teflon and glass followed the same pattern, so they
averaged their results and summarized them in a unique constant for both
materials. On the other hand, the reaction over titanium or stainless steel was
100 times faster. They attributed the catalytic effect of the metals to a charge
transfer reaction where radicals are involved.
In 2011, Klemm et al. [13] developed a microstructured falling film evaporator
for hydrogen peroxide made of AlMg3. This material was chosen due to its
higher mechanical strength. The decomposition that they observed accounted
for 10 % of the peroxide evaporated at 130 °C. According to their observations,
it occurred in the liquid phase while it was being evaporated, instead of in the
vapor phase when it comes into contact with the reactor surfaces. They
supported this information with the fact that they could not reduce the
decomposition by diminishing the residence time, which was done by increasing
flow rate of the inert gas.
Page 49
Chapter 2: Gas-phase epoxidation of propene with hydrogen peroxide vapor
36
Table 2.1: Influence of the materials in the decomposition of hydrogen peroxide vapor at 140 °C and
comparison with the results of Lin et al. [12] between 100 and 280 °C in the liquid phase.
Material Decomposition (%) Rate constant from literature
[12]
Quartz 30 3 67000
4.0 10 exp
kRT
PTFE 25 3 67000
4.0 10 exp
kRT
Titanium 100 5 68200
7.2 10 exp
kRT
Stainless steel 100 5 61900
2 5 10. exp
kRT
Conditions: Temperature 140 °C, 0.028 bar H2O2, 0.14 bar H2O and He flow of 100 ml/min.
Rate constants for the first order kinetics of the decomposition of peroxide in the liquid phase at
temperatures from 100 to 280 °C for different materials, reported by Lin et al. [12]. Rate constants,
k, in s-1, R= 8.314 J mol-1 K-1, T in K.
When a catalyst is added to the system, its interference with the peroxide
decomposition can influence the performance of the desired reaction. In the
case of TS-1, it contains titanium, which can be present as isolated
tetrahedrally-coordinated Ti atoms or as amorphous extra-framework titanium
dioxide species. The former is assumed to be responsible for the catalytic
activity of TS-1 in the oxidation of organic compounds with hydrogen peroxide.
Upon contact with H2O2, Ti-hydroperoxide species are formed, which are
intermediate species in the epoxidation of propene [14]. On the other hand,
Huybrechts et al. [15] reported that the decomposition of peroxide increased
when they used TS-1 with higher titanium content, even when it was in
tetrahedral position. With this, they concluded that the reaction is titanium
catalyzed. These observations were confirmed by the DFT calculations of Yoon
et al. [16] They indicated that the Ti-hydroperoxide species, formed in the
tetrahedrally coordinated Ti in TS-1, are capable of oxidizing a second
equivalent of peroxide, producing radical ·OOH and Ti(O·)(OH2) species that
may be involved in the decomposition of H2O2. Potekhin et al. [17], studying the
kinetics of the decomposition of H2O2 over TS-1, reported an activation energy
Page 50
Introduction
37
of 72 kJ/mol, which is similar to the 68.2 kJ/mol published by Lin et al. [12] for
titanium tubes. The second type of titanium, contained in the extraframework
amorphous titania, has a stronger effect in the decomposition of hydrogen
peroxide. According to Huybrechts et al. [15], the anatase present in some of
their synthesized TS-1 samples was only active for the decomposition of
peroxide and not for the oxidation of organic compounds.
The aim of this work is to provide insight into the epoxidation of propene with
hydrogen peroxide vapor at high temperatures, understanding the key factors
in the reaction and the relationship between epoxidation and decomposition of
hydrogen peroxide.
2.2 Experimental
2.2.1 Catalyst synthesis and characterization
TS-1 was synthesized following the procedure described by Shan et al. [18] to
produce conventional zeolite nanocrystals. The resulting catalyst was
characterized by XRD for crystallinity, SEM for studying the particle size, UV-
vis for the coordination state of the titanium in the zeolite and ICP for its
elemental composition. The details for the synthesis method as well as the
characterization techniques followed can be found in Appendix 2.A.
2.2.2 Experimental setup
The gas phase epoxidation was performed in a tubular reactor with an inner
diameter of 4 mm and a length of 470 mm. The reactor was placed inside a
tubular oven, in which the experiments were conducted at different
temperatures, ranging from 120 °C to 160 °C. The hydrogen peroxide vapor was
obtained by feeding liquid H2O2 (30 wt.%, Sigma Aldrich, containing
stabilizers) with a syringe pump (KDS 100 with a borosilicate gas-tight syringe
SGE) through a PEEK capillary inside the reactor, where it evaporates over a
bed of PFA (perfluoroalcoxy) beads at the working temperature. The syringe
pump was placed inside a fridge at 7 °C to avoid decomposition of H2O2. The
gases, helium (carrier gas) and propene, were dosed by mass flow controllers
(BROOKS Instruments B.V.). The outlet gases of the reactor were analyzed
online by a Compact GC (Interscience B.V.) equipped with a Rt-Q-Bond column
and a Molsieve 5A column in two separate channels, both with a thermal
Page 51
Chapter 2: Gas-phase epoxidation of propene with hydrogen peroxide vapor
38
conductivity detector (TCD). Given the limitations of the analysis of hydrogen
peroxide vapor, which is fully decomposed at the high temperature in the
injector of the GC, a capturing setup was developed. A 4-way valve was
installed just after the reactor, giving the possibility of diverting the flow to a
capturing vessel. This vessel was immersed in a cooling bath prepared with a
mixture of liquid nitrogen and ethanol (-116 °C) so that all the vapors were
frozen when passing through it. The remaining gases were measured in the
GC. All the oxygen measured during these runs can be directly related to the
amount of hydrogen peroxide decomposed in the reactor (Eq. 2.2). To verify the
validity of this method, in a number of experiments, the frozen content of the
vessel was analyzed by iodometric titration to determine the peroxide
concentration in the gas phase. Using this method, we could determine the
hydrogen peroxide decomposition with an experimental error of approximately
10 %.
2.2.3 Decomposition experiments
The stability of peroxide against factors like construction materials or the
presence of catalyst was evaluated in the setup described above. Four different
types of materials for the reactor were compared both with and without
catalyst: quartz, PTFE (ERIKS, 10014664), titanium (Grade 2 titanium, DIN
17850) and stainless steel. To that end, the setup was in its capturing position
and the measured O2 was related to the decomposed peroxide in vapor phase as
explained in Eq. 2.2.
2
2 2
2 2
2 min
(%) 1 00
min
molO measured inGC
H O decomposedmol
H O pumped
Eq. 2.2
Additional H2O2 decomposition experiments were performed in the liquid phase
both at the conditions generally used in literature for the liquid phase
epoxidation and at the normal operating temperature employed during the gas
phase reaction. The former was carried out with 400 mg of catalyst, in a 100-ml
stirred glass vessel at 50 °C. Methanol was used as a solvent and the
concentration of peroxide was 4 wt. %. The latter test was performed at 140 °C
in a titanium autoclave at 12 bar, due to the high vapor pressure of methanol
(10.3 bar) and the possible release of oxygen due to the higher decomposition
rate of peroxide at this high temperature. In this case, a blank test was done
Page 52
Experimental
39
without catalyst to evaluate the thermal decomposition before adding 100 mg
of TS-1.
2.2.4 Epoxidation experiments
The gas phase epoxidation experiments were carried out in the setup described
above, analyzing different parameters that can be important for the
performance of the reaction.
The conversion and selectivity to PO of hydrogen peroxide (XH2O2, SH2O2 to PO)
and propene (XC3H6, SC3H6 to PO) were calculated following Eq. 2.3 to Eq. 2.6:
2 2 2 2
2 2
2 2
-100
IN OUT
H O H O
H O IN
H O
P PX
P Eq. 2.3
2 2
2 2 2 2
100
-
PO
H O to PO IN OUT
H O H O
PS
P P Eq. 2.4
3 6 3 6
3 6
3 6
-100
IN OUT
C H C H
C H IN
C H
P PX
P Eq. 2.5
3 6
2
100
2
3 3 3
PO
C H to PO
COACETALDEHYDE CO
PO PROPANAL ACETONE
PS
PP PP P P
Eq. 2.6
The effect of the concentration of hydrogen peroxide and propene was evaluated
by maintaining one of them at a constant concentration in excess and varying
the concentration of the other. Helium was used as inert gas, with flows of
50 and 100 ml/min. In all these experiments the temperature was maintained
at 140°C
The influence of the catalyst loading was also tested. To that end, different
amounts of the synthesized TS-1, ranging from 10 to 100 mg, were packed in
the reactor. The epoxidation was carried out at a total flow rate of 64 ml/min,
0.037 bar H2O2 and 0.13 bar C3H6 at a temperature of 140 °C.
The behavior of the system at different temperatures was evaluated by varying
the temperature of the oven between 120 and 160 °C. The partial pressures of
peroxide and propene were 0.024 and 0.008 bar respectively, maintaining a
total flow rate of 116 ml/min.
Page 53
Chapter 2: Gas-phase epoxidation of propene with hydrogen peroxide vapor
40
2.3 Results and discussion
2.3.1 Hydrogen peroxide decomposition
Four different types of reactor materials were tested for their interaction with
hydrogen peroxide vapor. The levels of decomposition varied to a high extent,
as shown in Table 2.1.
It was observed that, as reported by Satterfield et al. [7] and Lin et al. [12], the
decomposition over quartz and PTFE is considerably smaller than the
decomposition over metals, as all the H2O2 vapor added in the latter case is
decomposed immediately. The values for the decomposition over Teflon were,
however, the lowest. This result is not in agreement with what Satterfield et al.
[7] published, where the decomposition rate over the polymer at 120°C was
twice as high as over borosilicate glass. The reason for this discrepancy can be
the fact that quartz can participate in a cation exchange mechanism, attracting
cations like Na+, K+ or Ca+ that can act as active centers for the H2O2
decomposition [7]. While, on the other hand, the surface of PTFE is more inert
to ion exchange. Another contribution to this explanation can be the
hydrophobicity of the polymer, which prevents water and peroxide to
accumulate over its surfaces at lower temperatures, reducing the surface
decomposition.
It was chosen to perform the gas phase epoxidation experiments in a quartz
reactor due to its higher thermal resistance and its lower permeability to
helium, which is the carrier gas used.
During the tests performed in the liquid phase, the addition of the catalyst was
found to have little effect under the mild conditions employed normally for the
liquid phase epoxidation (50 °C). According to the experiments, only 0.5 % of
the initial peroxide added was decomposed in contact with 400 mg of TS-1 after
3 hours. It is worth noting that the catalyst employed in this study contains
certain amounts of extra-framework titanium (see Appendix 2.A, Figure 2.8).
However, the low peroxide decomposition observed in the liquid phase
experiments, indicates that the amount of extra-framework Ti is low and does
not significantly affect the catalyst performance. When the temperature was
increased to 140 °C, the decomposition increased dramatically both with and
without catalyst (Figure 2.1). The trend observed without the catalyst can be
seen as similar to the results obtained in the gas phase in the empty flow
reactor. The decomposition at higher temperatures occurs on the surface of the
Page 54
Results and discussion. Hydrogen peroxide decomposition
41
titanium reactor, as this reaction is catalyzed and speeded up by the surface of
the metal. The incorporation of the catalyst to the system resulted in a faster
consumption of the hydrogen peroxide, being partly decomposed and partly
used for oxidizing the methanol to form formaldehyde. However, the half-life
time of H2O2 under these conditions was about 30 minutes, which is much
longer than the typical residence time of 3 - 7 s in the gas phase flow reactor.
Figure 2.1: Decomposition of H2O2 at 140°C in the liquid phase with and without catalyst, using
methanol as a solvent.
When the catalyst was tested in the packed bed flow reactor at 140°C by
feeding peroxide vapor and water, 100 % of the peroxide added was
decomposed, even when only 10 mg of TS-1 were loaded in the reactor. Various
reasons can justify the difference between this behavior and the one observed
in the liquid phase at the same temperature. First, it can be due to the higher
availability of the catalyst in a flow system and the stabilizing effect of the
liquid. Secondly, because of the higher affinity of TS-1 for methanol than for
water [19]. Finally, in the liquid phase experiments, part of the Ti sites
responsible for the decomposition of peroxide were probably coordinated with
methanol, and thus are less available for the decomposition of peroxide over TS-
1.
The introduction of a flow of propene together with the hydrogen peroxide
vapor changes the product distribution obtained. Figure 2.2 shows the
selectivity of hydrogen peroxide to the decomposition and to the production PO
and by-products. It can be seen that hydrogen peroxide is still converted
completely, but it is primarily used for the epoxidation of propene. This implies
that the epoxidation rate is faster than the decomposition rate. The same as in
the liquid phase epoxidation, where the selectivity of hydrogen peroxide to PO
0 50 100 150 200 2500.0
0.2
0.4
0.6
0.8
[H2O
2]
(mol/
l)
Time (min)
Without TS-1
With TS-1
Page 55
Chapter 2: Gas-phase epoxidation of propene with hydrogen peroxide vapor
42
is around 95 %, with the decomposition being very small [1]. This fact was also
observed by Huybrechts et al. in 1992 [15] when they reported that, despite the
fact that the decomposition over TS-1 was titanium catalyzed, the efficiency of
H2O2 for catalytic oxidations was generally high (60 – 90 %). Looking at the
activation energies of both reactions over TS-1 in methanol in the range from
25 to 50 °C, they are 28.5 kJ/mol for the epoxidation [20] and 72 kJ/mol for the
decomposition [17]. In the case of the gas phase reaction, considering the
Arrhenius equation, an increase of the temperature from 50 to 140°C results in
an increase of the decomposition rate constant of about 230 times, which is
much larger than the almost 9 times increment of the epoxidation constant.
Therefore, this easily explains why our experimentally observed
epoxidation/decomposition ratio at 140 °C is much lower than those reported by
others in the liquid phase at 50 °C. For example, Shin and Chadwick [20],
working at 40 °C in the liquid phase, reported that the utilization of H2O2 was
88 % with only 0.3 % of the peroxide being decomposed after 5 hours and a
selectivity to PO of 95 %. Their ratio epoxidation/decomposition (PO
formed/H2O2 decomposed) is higher than 250, while in our study, this ratio was
within a range between 1.5 and 0.005, depending on the reaction conditions
used.
Figure 2.2: Selectivity of hydrogen peroxide to its decomposition into O2 and H2O, PO, acetaldehyde
and propanal when C3H6 is added (greyed area) versus time on stream. Temperature 140 °C, He
flow 150 ml/min, 0.017 bar H2O2 and 0.13 bar C3H6.
The hydrogen peroxide decomposed in the small amounts of extra-framework
titanium contained in the synthesized TS-1 will not be affected by the addition
of the flow of propene, since these sites are not active for the epoxidation.
Therefore, a catalyst in which most of the Ti is outside the framework of the
zeolite, will mostly decompose the H2O2 vapor and produce very small amounts
0 10 20 30 40 500
20
40
60
80
100 % Decomp.
% PO
% Acetaldehyde
% Propanal
Sele
ctiv
ity o
f H
2O
2 (
%)
Time (min)
Page 56
Results and discussion. Hydrogen peroxide decomposition
43
of PO. In the absence of amorphous Ti, it can be expected that the
epoxidation/decomposition ratio will be even higher.
2.3.2 Gas phase epoxidation
The main side reaction during the gas phase epoxidation of propene was the
decomposition of hydrogen peroxide into oxygen and water. Nevertheless, some
carbon-containing byproducts were also observed: acetaldehyde, CO and CO2
from the subsequent oxidation of propene oxide at high temperatures and
propanal and small amounts of acetone from the isomerization due to the
opening of the C(3)-O and the C(2)-O bond respectively. Additionally, small
amounts of propionic acid, acetic acid and propene glycol were detected. TGA
analysis of the spent catalyst showed the deposition of organic compounds,
which were burned at 220 °C and represented 1 % of the amount of PO
produced. These compounds can be associated with the olygomerization or
polymerization of propylene oxide in the presence of water (Eq. 2.7).
Eq. 2.7
The use of hydrogen peroxide in excess with respect to propene was not
possible, since all the peroxide added reacted with full conversion in all the
experiments, partially to give PO and by-products and partially being
decomposed. This contrasts with the findings of Klemm et al. [6], who reported
that only after a modified residence time of 0.12 gcat s-1 ml-1 STP they obtained
full conversion of hydrogen peroxide. By maintaining an excess of propene and
varying the concentration of peroxide below stoichiometric amounts, the
selectivity to PO remains constant around 40 %, only increasing slightly with
the peroxide concentration. This value is higher than the 25 % reported by
Klemm et al. [6] for the experiments in their laboratory setup. In Figure 2.3 it
can be seen that there is an almost constant ratio between the partial pressure
of H2O2 and the PO formed, which indicates that the two competing reactions
(epoxidation and decomposition) are both probably of the same order with
respect to peroxide, evolving in the same manner as the concentration of the
reactant is increased. In this case, the ratio epoxidation/decomposition (PO
formed/H2O2 decomposed) was 1.5.
H2O OH
CH3OH
CH3
OCH3
O
OH
CH3O
OH
CH3
Page 57
Chapter 2: Gas-phase epoxidation of propene with hydrogen peroxide vapor
44
Figure 2.3: Dependence of the PO production and selectivity on the concentration of H2O2. Excess of
C3H6 (0.07 bar), 50 mg TS-1, total flow 50 ml/min.
The influence of the catalyst loading was evaluated by varying the amount of
catalyst in the range from 100 mg to 10 mg. The use of even lower quantities
did not give accurate results due to by-passing of the flow past the catalyst. It
was observed that even with loadings of TS-1 of 10 mg, the conversion of
hydrogen peroxide was always complete, obtaining in all cases, for the same
given reaction conditions, the same amount of propene oxide and the same
amount of oxygen from the decomposition. With 10 mg of catalyst, the
productivity of PO goes up to 10.5 kgPO·kgcat-1·h-1 at a GHSV of 450,000 ml gcat-
1 h-1, which is higher than the minimum required 1 kgPO kgcat-1 h-1 for industrial
implementation [6]. The reason for this behavior is that the full conversion of
hydrogen peroxide occurs already in the first section of the catalyst bed,
because both reactions happen very fast. Therefore, the remainder of the
catalyst has no effect in the reaction. This can be seen with the bare eye, since
after the reaction, the initial part of the catalyst bed has a yellowish coloration,
associated with a peroxo moiety which is a result of the interaction of the Ti
atoms in the framework of the zeolite with H2O2/H2O [21]. The rest of the
catalyst remains white, which implies that when the reactant stream reaches
it, H2O2 has been already fully converted.
0.01 0.02 0.03 0.04 0.051x10
-5
2x10⁻⁵
3x10⁻⁵
4x10⁻⁵
5x10⁻⁵
FP
O (
mol/
min
)
PH2O2
(bar)
0
20
40
60
80
100
Sele
ctiv
ity t
o P
O (
%)
Page 58
Results and discussion. Gas phase epoxidation
45
a.
b.
Figure 2.4: a. Dependence of the PO production rate (■) and the selectivity of propene to PO (▲) on
the partial pressure of C3H6. b. Conversion (●) and selectivity to PO (▲) of C3H6 and utilization of
hydrogen peroxide (■) as a function of the partial pressure of propene. Greyed area: Excess of
hydrogen peroxide. White area: Excess of propene. Constant PH2O2 = 0.024 bar. Total flow rate: 100
ml/min. Temperature: 140°C. 10 mg of TS-1.
When working below stoichiometric concentrations of propene, a progressive
increment in PO formation was observed as the PC3H6 increased (squares in
Figure 2.4a). On the other hand, the low selectivity of propene to PO at very
low concentrations of the reactant should be noticed. In this case, the main
products were CO, CO2 and acetaldehyde, suggesting that the big excess of
peroxide can be responsible for the further degradation of propene oxide. As the
amount of propene increases, the peroxide present is not enough for the
subsequent oxidation of the formed PO, resulting in the growth of the
selectivity. When concentrations higher than stoichiometrically needed were
used, the selectivity approached 90 % (Figure 2.4b). Contrary to the selectivity,
the conversion of propene decreased as the partial pressure of propene
increased, even when concentrations of propene below stoichiometry were used.
0.00 0.01 0.020
1x10⁻⁵
2x10⁻⁵
3x10⁻⁵
FP
O (
mol/
min
)
PC3H6
(bar)
0
20
40
60
80
100
Sele
ctiv
ity C
3H
6 t
o P
O (
%)
0.00 0.01 0.02 0.03 0.04 0.05 0.06 0.07 0.080
20
40
60
80
100
Con
vers
ion
of
C3H
6 (
%)
PC3H6
(bar)
0
20
40
60
80
100
Sele
ctiv
ity C
3H
6 t
o P
O
(%)
Page 59
Chapter 2: Gas-phase epoxidation of propene with hydrogen peroxide vapor
46
As explained before, according to our observations, the decomposition and the
epoxidation are of the same order in hydrogen peroxide; however, the
epoxidation rate also depends on the concentration of propene. According to
Shin et al. [20], in the liquid phase this order is 0.63. Therefore, if the
concentration of propene is not high enough, the epoxidation rate will decrease,
while the decomposition rate remains the same. This results in a situation
where the decomposition rate is faster than the epoxidation rate. In this case,
most of the peroxide is consumed before it can react with all the propene
available, resulting in a lower conversion of the latter.
Figure 2.5: Influence of the temperature in the PO production and in the selectivity of propene to
PO. 0.024 bar H2O2, 0.008 bar C3H6, total flow rate: 116 ml/min, 14 mg TS-1.
The influence of the temperature on the epoxidation is shown in Figure 2.5. At
the conditions employed in these experiments, the conversion of hydrogen
peroxide is 100 % and the conversion of propene is around 75 %, at all
temperatures. However, with increasing temperature, the selectivity of propene
to PO raises from 70.2 % at 120 °C to 75.8 % at 150 °C. There are several
factors that can explain this effect. First, due to the increase of hydrogen
peroxide adsorbed on the surface of the reactor as the temperature is
decreased, forming a multilayer infinitely thick as the condensation
temperature is reached. For instance, at 120 °C, the condensation would begin
at partial pressures of H2O2 of 0.126 bar [7]. The multilayer adsorption
increases the decomposition rates with respect to the epoxidation rates.
Because both reactions occur so fast, it can also be that the rate limiting step is
the diffusion of propene to the active Ti sites where the hydrogen peroxide is
adsorbed. With increasing temperature, the propene will reach faster the
hydroperoxide species, and the epoxidation will occur preferentially. The
120 140 1601.0x10
-5
1.5x10⁻⁵
2.0x10⁻⁵
2.5x10⁻⁵
3.0x10⁻⁵
FP
O (
mol/
min
)
Temperature (oC)
0
20
40
60
80
100
Sele
ctiv
ity C
3H
6 t
o P
O (
%)
Page 60
Results and discussion. Gas phase epoxidation
47
activation energies can also play a role in the effect of the temperature in the
competitive reactions of this system: epoxidation and decomposition. Both the
reaction rate constant of the decomposition and of the epoxidation increase
with the temperature according to the Arrhenius equation. The fact that there
is a point where the increase in temperature is not translated into an increase
in the PO productivity (150 and 160 °C give approximately the same results)
can be associated to the stronger increase of the decomposition constant
compared to the epoxidation one, since the activation energy of the former is
higher than the latter.
2.4 Conclusions
When working with H2O2 vapor, the main side reaction is its decomposition
into oxygen and water. This is a surface reaction at temperatures below 450 °C,
which is highly dependent on the materials that will be in contact with the
chemical. Therefore, special attention should be paid to the selection of the
working materials for the reactor and the piping. The decomposition at 140 °C
over PTFE and quartz was 25 and 30 %, respectively, while all the peroxide
added was immediately decomposed when the reactor was made of a metal like
titanium or stainless steel. The addition of the catalyst, TS-1, resulted in the
full decomposition of the peroxide vapor. However, when a flow of propene was
introduced, even though the conversion remained 100 %, the peroxide was more
selectively used for the epoxidation of propene, indicating that, at these
conditions, the epoxidation rate is faster than the decomposition rate.
The gas phase epoxidation of propene was achieved successfully, obtaining PO
productivities of 10.5 kgPO kgcat-1
h-1 using only 10 mg of catalyst and a GHSV of
450,000 ml gcat-1 h-1. This implies that, at the temperatures of this study, the
reaction is very fast. The conversion of hydrogen peroxide vapor was 100 % in
all the experiments and at all the conditions tested and its selectivity to
propene oxide was around 40 % at different concentrations of peroxide used. In
this case, an almost constant ratio between the partial pressure of peroxide and
PO formed was obtained, implying that both the epoxidation and the
decomposition are of the same order in peroxide. The analysis of the influence
of the amount of propene added, leads one to conclude that, as long as the
concentration of propene is higher than the stoichiometrically required, its
selectivity to PO will be close to 90 %. Finally, an increase in the temperature
up to 160 °C was translated in an increase in the amount of PO produced
Page 61
Chapter 2: Gas-phase epoxidation of propene with hydrogen peroxide vapor
48
probably due to the higher decomposition of vapor peroxide at temperatures
below its boiling point.
Appendix 2.A: TS-1 synthesis and characterization
The catalyst chosen for the epoxidation of propene was TS-1. It was
synthesized following the procedure described by Shan et al. [18] for
conventional zeolite nanocrystals. The molar ratio of the synthesis gel was
1:0.02:0.28:40:0.33 (SiO2/TBOT/TPAOH/H2O/IPA). An aliquot of 1.55 ml of
titanium butoxide (TBOT, 97 %, Aldrich) was mixed with 4.49 ml of isopropyl
alcohol anhydrous (2-Propanol, anhydrous, 99.5+ %, Alfa Aesar). Afterwards,
35.1 ml of aqueous tetrapropylammonium hydroxide (TPAOH, 40 % aq.sol.,
Merck), previously mixed with 71.4 ml of deionized water, were added dropwise
to the mixture, followed by the incorporation of 60 additional ml of water and
50 ml of tetraethylorthosilicate (TEOS, 98 %, Aldrich). The gel was stirred for
24 h at room temperature before being transferred to 5 PEEK-lined autoclaves,
where the crystallization occurred at 180 °C during 48 h. The white powder
was collected by high speed centrifugation at 14,000 rpm, washed three times
with plenty of deionized water by cycles of resuspension-centrifugation, dried at
room temperature and calcined at 550 °C for 4 h.
The crystallinity of the obtained catalyst was analyzed at ambient temperature
with powder X-ray diffraction (XRD) employing a Bruker D8 using Cu Kα
radiation in standard Bragg–Brentano geometry and a Ni filter at the detector,
covering the range of 2θ from 5 to 90 ° and a step of 0.01. The coordination
state of the titanium atoms incorporated in the zeolite structure was examined
by diffuse reflectance UV–visible (DR UV–vis) spectra, making use of a
Shimadzu UV-2401PC spectrometer and having BaSO4 as a reference. The
particle size and the shape of the zeolite crystals were evaluated by XL30-
ESEM-FEG scanning electron microscope (SEM). Finally, the elemental
composition of the catalyst was checked by inductively coupled plasma optical
emission spectrometry (ICP-OES) using a Spectra CirosCCD system. The method
for the sample preparation for the latter was similar to the one published by
Peru et al. [22]. In it, the structure of the zeolite was dissolved by cold digestion
with a mixture of HF, HCl and HNO3 at room temperature.
With the purpose of reducing the pressure drop in the packed bed reactor, the
catalyst powder was pressed and sieved into pellets with a particle size
between 60 and 200 μm.
Page 62
Appendix
49
Results of the catalyst characterization
The SEM analysis showed that the particle size ranged from 180 to 150 nm
Figure 2.7 and the ICP indicated that the amount of Ti contained in the zeolite
was 1.5 wt. %.
2.A.1 XRD
Figure 2.6: XRD pattern of the TS-1 used in this study.
2.A.2 SEM
Figure 2.7: SEM image of TS-1.
Page 63
Chapter 2: Gas-phase epoxidation of propene with hydrogen peroxide vapor
50
2.A.3 UV-Vis
Figure 2.8: UV-vis pattern of TS-1.
References
[1] M.G. Clerici, G. Bellussi, U. Romano, J. Catal. 129 (1991) 159-167.
[2] A.H. Tullo, P.L. Short, Chem. Eng. News 84 (2006) 22-23.
[3] P. Bassler, G. H.G., M. Weidenbach, The new HPPO Process for Propylene
Oxide: From Joint Development to Worldscale Production, in: J.J. Klemes, H.L.
Lam, P.S. Varbanov (Eds.), Proceedings of the 13th International Conference
on Process Integration, Modelling and Optimisation for Energy Saving and
Pollution Reduction, Aidic Servizi Srl, Milano, 2010, pp. 571-576.
[4] J.L. Zhao, J.C. Zhou, J. Su, H.C. Guo, X.S. Wang, W.M. Gong, AIChE J. 53
(2007) 3204-3209.
[5] J. Su, J. Zhou, C. Liu, X. Wang, H. Guo, Chin. J. Catal. 31 (2010) 1195-1199.
[6] E. Klemm, E. Dietzsch, T. Schwarz, T. Kruppa, A.L. de Oliveira, F. Becker,
G. Markowz, S. Schirrmeister, R. Schutte, K.J. Caspary, F. Schuth, D. Honicke,
Ind. Eng. Chem. Res. 47 (2008) 2086-2090.
[7] C. Satterfield, T. Stein, Ind.Eng.Chem 49 (1957) 1173-1180.
[8] C.N. Satterfield, R.C. Reid, A.E. Wechsler, AIChE J. 9 (1963) 168-175.
[9] R.C. Mackenzie, M. Ritchie, Proc. R. Soc. London, A 185 (1946) 207-224.
[10] P.A. Giguère, I.D. Liu, Can. J. Chem. 35 (1957) 283-293.
[11] D.E. Hoare, J.B. Protheroe, A.D. Walsh, Trans. Faraday Soc. 55 (1959)
548-557.
[12] C.C. Lin, F.R. Smith, N. Ichikawa, T. Baba, M. Itow, Int. J. Chem. Kinet.
23 (1991) 971-987.
Page 64
References
51
[13] E. Klemm, G. Mathivanan, T. Schwarz, S. Schirrmeister, Chem. Eng.
Process. 50 (2011) 1010-1016.
[14] M.G. Clerici, Oil Gas Eur. Mag. 32 (2006) 77-82.
[15] D.R.C. Huybrechts, P.L. Buskens, P.A. Jacobs, J. Mol. Catal. 71 (1992)
129-147.
[16] C.W. Yoon, K.F. Hirsekorn, M.L. Neidig, X.Z. Yang, T.D. Tilley, ACS Catal.
1 (2011) 1665-1678.
[17] V.V. Potekhin, V.A. Kulikova, E.G. Kochina, V.M. Potekhin, Russ J. Appl.
Chem 84 (2011) 1195-1200.
[18] Z.C. Shan, Z.D. Lu, L. Wang, C. Zhou, L.M. Ren, L. Zhang, X.J. Meng, S.J.
Ma, F.S. Xiao, ChemCatChem 2 (2010) 407-412.
[19] G. Langhendries, D.E. De Vos, G.V. Baron, P.A. Jacobs, J. Catal. 187
(1999) 453-463.
[20] S.B. Shin, D. Chadwick, Ind. Eng. Chem. Res. 49 (2010) 8125-8134.
[21] P. Ratnasamy, D. Srinivas, H. Knözinger, Active sites and reactive
intermediates in titanium silicate molecular sieves, Elsevier Academic Press
Inc., San Diego, 2004.
[22] D.A. Peru, R.J. Collins, Fresenius. J. Anal. Chem. 346 (1993) 909-913.
Page 66
3 This chapter is a part of: L.A. Truter, D.M. Perez Ferrandez, J.C.
Schouten, T.A. Nijhuis, 2015, TS-1 coated microreactor for selective
oxidations. Appl. Catal., A., 22, 139-145.
Abstract
Microreactors containing zeolite TS-1 can be efficiently used for the oxidation of
organic compounds with hydrogen peroxide. Ideally, these microreactors can be
combined with the catalytic direct synthesis of H2O2 in a microreactor or a
plasma microreactor. Here, a TS-1 coated capillary microreactor (CCMR) was
developed by an in situ hydrothermal synthesis and its performance was
evaluated in the continuous epoxidation of propene. The results were compared
with a fixed bed microreactor (FBMR) loaded with TS-1 powder. The coating
layer was determined to be TS-1 using SEM and XPS and reached productivity
values of 1.8 kgPO kgcat-1 h-1. It was found that the key parameter for the
catalyst coating is the incorporation of tetrahedral Ti in the framework of the
zeolite. These types of reactors are more suitable for the synthesis of fine
chemicals or pharmaceuticals, where smaller inventories are required, than for
the production of bulk chemicals.
NOTE: This chapter is the joint work of D.M. Pérez Ferrández and L.A. Truter. The
development of the catalytic coating was done by L.A. Truter.
Microreactors for the
liquid phase
epoxidation of propene:
Coated capillary
microchannel and fixed
bed microreactor
Page 67
Chapter 3: Microreactors for the liquid phase epoxidation of propene
54
54
3.1 Introduction
Hydrogen peroxide is considered to be a green oxidant due to its high oxygen
content, and the fact that water is its only by-product [1]. Its use for the
oxidation of organic compounds was driven by the discovery of TS-1 in 1983 [2].
Since then, numerous papers and patents have shown the unique properties of
this zeolite and the possibility of using it for reactions like the hydroxylation of
phenol [3], olefin epoxidation [4, 5], or in the oxidations of alkanes [6], alcohols
[7] and amines [8]. Among all of these reactions, the epoxidation of propene to
propene oxide (PO) [9, 10] is one that has attracted significant attention due to
its high selectivity to PO, which can reach 97 %, and the advantage that the
only by-product obtained is water. The traditional industrial processes for PO
production present certain disadvantages such as environmental concerns and
generation on unrelated co-products [11]. Therefore, the epoxidation of propene
with H2O2 is a sustainable and clean alternative. The integration of the
synthesis of peroxide via the antraquinone process and the epoxidation of
propene over TS-1 was industrially implemented for the first time by a joint
venture of BASF and Dow in a plant opened in 2008 in Antwerp with a
capacity of 300,000 tons per year [12].
In spite of being a green chemical, hydrogen peroxide is almost uniquely
produced in industry via the antraquinone auto-oxidation process. This
technique is not so green because of the generation of by-products during the
hydrogenation step (due to overhydrogenation of AQ and solvent), which causes
water contamination [13-15]. An attractive and cleaner alternative for small
scale production (<10 ktons per year) of hydrogen peroxide is the direct
synthesis through the reaction of hydrogen and oxygen over Pd or Au-Pd-
supported catalyst [13, 16]. Additionally, this method would benefit from a
reduction in capital investment and operation costs [13]. Nevertheless, one of
the main limitations of the direct synthesis is the risk of explosion when
working with mixtures of hydrogen and oxygen over a wide range of
concentrations. Microreactors, due to their high surface area-to-volume ratio,
allow operating under safe conditions using gas mixtures that are within the
explosive regime [17]. Therefore, these types of reactors are highly attractive
alternatives for the direct synthesis of hydrogen peroxide [18-20].
Another option for the production of hydrogen peroxide is the use of plasma
reactors [21-23]. By feeding a mixture of hydrogen and oxygen, with no solvents
involved, hydrogen peroxide can be obtained with high purity. Mass-transfer
Page 68
Introduction
55
55
limitations associated with heterogeneous reactions are also avoided. In
Chapter 4, this option will be discussed in detail. Microplasma reactors, where
the plasma is generated in a volume with sub-millimeter geometry, have also
been used for chemical synthesis. Besides the benefits listed before for catalytic
microreactors, other advantages can be obtained, such as high densities of
reactive ions, radicals and electrons, or the possibility to operate at near-room
temperature, which favors its implementation [24]. Microplasma reactors have
been successfully used for the conversion of methane into synthesis gas [25, 26],
hydrocarbon reforming [24], or the conversion of propane [27].
Considering the risks involved with the transport of hydrogen peroxide, which
include potential fire and vapor phase explosions [28] and the fact that it
decomposes relatively easily, to couple the synthesis of this chemical with its
use in situ for oxidation reactions would be very efficient. When the direct
synthesis is carried out in a microreactor or a plasma microreactor, it would be
convenient to implement the oxidation process also on micro or miliscale. A
number of papers have focused on the oxidation of organic compounds with
aqueous hydrogen peroxide in a microreactor using TS-1 as a catalyst.
Different approaches have been used regarding the catalyst immobilization.
Yube et al. [29, 30] proposed a catalytic wall microreactor that consisted of two
independent parts: catalyst elements and microchannel elements. It was
claimed that this configuration could reduce costs in catalyst replacement due
to the ease of exchanging the catalyst elements. A fixed bed microreactor was
compared with the catalytic wall microreactor in the selective oxidation of
phenol to benzenediols, hydroquinone and catechol. The results showed that
the microreactor concept improved the contact efficiency between catalyst and
reactants; the residence time was reduced, which suppressed consecutive
reactions, therefore increasing the selectivity to desired products [29]. However,
this type of reactor showed one main disadvantage: the poor catalyst utilization
because the TS-1 pellet was only on one of the channel walls and, therefore, the
contact of the catalyst with reactants was reduced with respect to the fixed bed
reactor. Another alternative was presented by Wan et al. [31, 32], who grew TS-
1 on the channels of a microreactor with trapezoidal cross-section by selective
seeding with TS-1 nanocrystals. The zeolite layer obtained was 5 μm thick and
formed by crystals of 3 μm in size. This reactor was tested in the epoxidation of
1-pentene to 1,2-epoxypentane, where a 5.1 % 1,2-epoxypentane yield was
obtained. Even though the catalyst was active for the reaction, the deactivation
was an issue and two types were observed: short-term reversible deactivation
Page 69
Chapter 3: Microreactors for the liquid phase epoxidation of propene
56
56
and long-term irreversible deactivation. The former could be due to the
deposition of organic compounds on the active sites of the TS-1 and the latter
because of the possible leaching of framework titanium by water and hydrogen
peroxide. The method of catalyst immobilization and design of the microreactor
is thus highly important in order to maximize the catalyst loading, as well as
provide a stable and active catalyst. Therefore, the catalyst preparation is a
main focal point in this work.
Propene oxide is a bulk chemical, typically produced in the scale of thousands
of tons per year and a microreactor might not be the most attractive option for
industry. Nevertheless, the epoxidation of propene can be used as a model
reaction to be studied in a microreactor, considering its high conversion and
selectivities. In this work, a coated capillary microreactor was developed by in
situ hydrothermal synthesis of TS-1 as a coating layer. Its performance was
evaluated in the epoxidation of propene and compared with a fixed bed
microreactor, packed with the same catalyst in powder state.
3.2 Experimental
3.2.1 Preparation and characterization of TS-1-coated capillaries and
fixed bed microreactor
The method used for the preparation of the TS-1 synthesis mixtures was
adapted from Shan et al. [33] for conventional zeolite nanocrystals. 0.24 g of
titanium butoxide (TBOT, 97 %, Aldrich) was mixed with 0.49 g of anhydrous
isopropyl alcohol (2-Propanol, anhydrous, 99.5 %, Alfa Aesar). Afterwards, 1.3 g
of deionized water and 3.1 g of aqueous tetrapropylammonium hydroxide
(TPAOH, 40 % aq. sol., Merck) was mixed and added dropwise to the mixture,
followed by the addition of 2.5 g of tetraethylorthosilicate (TEOS, 98%, Aldrich)
(Si/Ti ratio in the synthesis mixture was 17.2). The synthesis mixture was
stirred for 24 h at room temperature.
The TS-1 coated capillaries were prepared according to the method developed
by Truter et al. [34] for the in situ hydrothermal synthesis of zeolite in
capillary microchannels. The TS-1 synthesis mixture was injected into a 1-
meter capillary commercially precoated with a 4-µm silica layer (CP-
silicaPLOT, 0.32 mm i.d., about 4 µm silica, fused silica, Agilent) (Figure 3.1)
and the capillary ends sealed with glass end caps (Atas GL International).
Thereafter, the sealed capillary was inserted into a ¼” circular metal tube and
Page 70
Experimental
57
57
the metal tube sealed. This was to ensure that there was no significant
pressure difference between the capillary and external environment to prevent
the rupture of the seals, as well as protect the capillary. Hydrothermal
synthesis was carried out at 150 °C for 24 hours. After hydrothermal synthesis
was completed, the capillaries were taken out of the metal tube encasing and
the seals removed. Excess solution contained in the capillaries was removed,
followed by washing with distilled water and, thereafter, drying the capillaries
overnight at 120 °C. The capillary was calcined at 350 °C in an oxygen flow for
4 hours. The capillaries can be considered as modular units that can be
connected in series to obtain the amount of catalyst needed. In this case, five
TS-1-coated capillaries of about 1 meter in length each, containing 6.35 mg of
catalyst in total, constituted the Coated Capillary Microreactor (CCMR) tested.
Figure 3.1: Silica precoated capillary, SEM image of the coating of ~4μm thickness.
Synthesis of the powder catalyst used for the fixed bed microreactor was
prepared using a similar TS-1 synthesis mixture. However, considering that
the capillary precoating (Figure 3.1) represents an additional silica source, the
TBOT added for the powder TS-1 was adjusted to 0.18 g. The mixture was
inserted into a PEEK-lined autoclave where hydrothermal synthesis was
conducted at 150 °C for 24 h. Thereafter, the synthesized powder was washed
thoroughly with distilled water, dried, and calcined at 350 °C under oxygen
flow for 4 hours. Finally the catalyst was pelletized, crushed and sieved
between 250 and 500 µm to avoid a high pressure drop in the fixed bed
microreactor.
The Fixed Bed Microreactor (FBMR) was prepared by packing the powder
catalyst into the reaction tube (PEEK, i.d. 0.9 mm, o.d. 1/16 ”) and kept in place
Page 71
Chapter 3: Microreactors for the liquid phase epoxidation of propene
58
58
by a 2 µm PEEK filter. The amount of TS-1 loaded was 26.3 mg. The
specifications for the two types of microreactors are given in Table 3.1.
Table 3.1: Specifications for the two types of microreactors tested in the liquid-phase epoxidation of
propene.
Parameters Fixed Bed Microreactor
(FBMR)
Coated Capillary Microreactor
(CCMR)
Material PEEK Silica precoated fused silica
Outer Diameter (mm) 1.59 0.72
Inner diameter (mm) 0.9 0.32
Length (cm) 3 425
Volume reactor (ml) 0.019 0.33
Catalyst loading (mg) 26.3 6.35
Particle size (µm) 250 - 500 Coating layer ~3 µm
TS-1 crystallites (nm) 250 800
The crystallinity of the obtained powder catalyst was analyzed at ambient
temperature powder X-ray diffraction (XRD) using a Bruker D8 using Cu Kα
radiation in standard Bragg–Brentano geometry and a Ni filter at the detector,
covering the range of 2θ from 5 to 90° and a step of 0.02. The coordination state
of the titanium atoms incorporated in the zeolite structure was examined by
diffuse reflectance UV–visible (DRUV–vis) spectra, making use of a Shimadzu
UV-2401PC spectrometer and having BaSO4 as a reference. The use of UV-Vis
for the analysis of the TS-1 in the capillary coating by crushing the capillary
proved to not be possible. The amount of fused silica was 130 times higher than
the amount of TS-1, therefore it was not possible to identify any Ti-peak.
Consequently, the coordination state of the Ti in the zeolite framework was
determined by XPS after crushing the capillary and separating as much glass
from the coating as possible. The equipment employed was a Kratos AXIS
Ultra spectrometer, equipped with a monochromatic X-ray source and a delay-
line detector (DLD). Spectra were obtained using the aluminium anode (Al K =
1486.6 eV) operating at 150 W. The elemental composition of the catalyst, both
powder and capillary, was determined by inductively coupled plasma optical
emission spectrometry (ICP-OES) using a Spectra CirosCCD system. The
samples were dissolved by cold acid digestion with a mixture of HF, HCl and
Page 72
Experimental
59
59
HNO3 at room temperature. The coated capillary’s morphology was examined
after drying with a XL30-ESEM-FEG scanning electron microscope (SEM)
operated at 10 kV, working distance of 10 mm and various magnifications.
Samples were sputter coated with a 200 Å gold coating. The catalyst loading in
the coated capillary was estimated from calculations due to the experimental
difficulty of detaching and weighting the TS-1 coating from the capillary
accurately. The calculations were done considering a layer thickness of
approximately 3 µm, a capillary with an internal diameter of 0.32 mm and 1
meter in length and zeolite density of 0.5 g/cm3. By using the formula for the
volume of a hollow cylinder (Vlayer = πh(R2 − r2), where h is the length, R is the
internal radius of the capillary and r is the radius minus the layer thickness),
the calculated amount of TS-1 per meter of capillary was 1.5 mg.
3.2.2 Experimental setup
The epoxidation experiments were conducted in the setup depicted in Figure
3.2. Either the Coated Capillary Microreactor (CCMR) or the Fixed Bed
Microreactor (FBMR) were connected to the setup and kept in a thermostatic
oven to maintain the reaction temperature. The liquid phase was fed at a flow
rate between 0.2 and 6 ml/h with a high precision syringe pump (Teledyne
ISCO) connected with a cooling jacket at 10 °C to minimize H2O2
decomposition. The propene flow was controlled by a mass flow controller
(Bronkhorst) in a range between 0.1 and 10 Nml/min. Both reactants were
mixed before entering in the reactor using a T-shaped mixer. A back pressure
regulator was introduced downstream to maintain a constant pressure by
feeding N2 at a constant flow rate of 1 Nml/min. After the reaction, the two
phases were separated and the gas stream was analyzed in an online microGC
(Varian) equipped with a Porabond Q column and a Molsieve 5A column in two
separate channels, both with a thermal conductivity detector (TCD). Liquid
samples were taken every hour and analyzed for their composition in an offline
GC (Varian CP-3800) with CP-Sil-5 column and equipped with an FID detector.
The concentration of hydrogen peroxide in the liquid samples was determined
by iodometric titration. A three-way valve situated after the ISCO pump
allowed samples to be taken to analyze the actual concentration of hydrogen
peroxide that was used, since some decomposition of H2O2 occurred with time
inside the pump.
Page 73
Chapter 3: Microreactors for the liquid phase epoxidation of propene
60
60
Figure 3.2: Scheme of microreactor setup for the epoxidation of propene with hydrogen peroxide.
3.2.3 Epoxidation of propene
The epoxidation of propene with aqueous hydrogen peroxide was conducted in
the Fixed Bed Microreactor (FBMR) and in the Coated Capillary Microreactor
(CCMR) described above. The pressure was maintained at 6 bar and the
temperature at 40 °C. The liquid phase consisted of 13.3 wt.% hydrogen
peroxide (30 wt.%, Sigma Aldrich, containing stabilizers, effectively 4 wt.%
H2O2 and 9.3 wt.% water), with methanol as solvent and 4 wt.% ethanol as
internal standard. The gas phase was pure propene. The WHSV was calculated
using Eq. 3.1. The space velocity of the liquid was varied by changing the
pumping rate in the ISCO pump and maintaining the same amount of catalyst.
The gas-to-liquid ratio (G/L) was maintained constant at 15 for all the
experiments conducted, calculated considering that the conditions inside the
reactor are at 6 bar and 40 °C.
( / )
( )
TOT
cat cat
Q ml hmlWHSV
g h W g
Eq. 3.1
The propene conversion, selectivity to PO of hydrogen peroxide (XH2O2, SH2O2 to
PO) and propene (XC3H6, SC3H6 to PO) were calculated as follows:
BACK
PRESSURE
REGULATOR
COLLECTION
VESSEL
P-1
MFC
C3H6
Methanol +
H2O2 + H2O
LIQUID
SAMPLING
GAS
MICRO GC
Air
OVEN
CAPILLARY
FIXED BED
MICROREACTOR
N2
MFC
ISCO PUMP
SAMPLING
VALVE
Page 74
Experimental
61
61
2 2 2 2
2 2
2 2
-100
IN OUT
H O H O
H O IN
H O
F FX
F Eq. 3.2
2 2
2 2 2 2
100
-
POH O to PO IN OUT
H O H O
FS
F F Eq. 3.3
3 6
3 6
1 2 2 1 100PO PROPANAL M P M P PROPYLENE GLYCOL PROPIONIC ACIDC H IN
C H
F F F F F FX
F
Eq. 3.4
3 6
1 2 2 1
100POC H to PO
PO PROPANAL M P M P PROPYLENE GLYCOL PROPIONIC ACID
FS
F F F F F F
Eq. 3.5
The absence of internal mass transfer limitations was confirmed using the
Weisz-Prater criterion. The calculations can be found in Appendix 3.B.
3.3 Results and discussion
3.3.1 TS-1 coated capillary
The TS-1 coated capillary (Figure 3.3) was formed by an in situ hydrothermal
synthesis method [34], whereby a TS-1 coating is formed within the capillary
microreactor. A silica precoating (Figure 3.1) acts as a site for nucleation and a
nutrient source to favor the transformation to a TS-1 coating and minimize
bulk-crystallization. The precursor suspension was optimized in order to allow
the dissolution of the silica precoating to be comparable to the nucleation and
growth rates. This was important in order to ensure that the transformation of
the silica precoating to zeolite occurred uniformly throughout the layer, as well
as to prevent bulk crystallization from occurring in the capillary. By selectively
transforming the silica precoating, the TS-1 coating retained a similar coating
thickness and uniformity to the initial silica precoating. The final TS-1 coating
contained a coating of about 3 μm thickness with individual 800 nm crystals
(Figure 3.3).
TEM and XPS of the coated capillary were used to determine the crystallinity
and the incorporation of Ti in the zeolite structure. The presence of a peak in
459.8 eV in the XPS pattern of the capillary (Figure 3.4b) confirms the
Page 75
Chapter 3: Microreactors for the liquid phase epoxidation of propene
62
62
incorporation of Ti in tetrahedral position in the framework of the zeolite [35].
However, there is also amorphous Ti in the catalyst, which can be identified by
the peak in 458.3 eV [35]. An analysis of the XPS pattern of the ex situ
synthesized TS-1 powder (Figure 3.4a) reveals that the ratio of tetrahedral Ti
with respect to amorphous Ti is larger than in the capillary. This can indicate
that the incorporation of Ti in the powder is easier than in the coating of the
capillary. In the latter case, part of the Ti added remains in the zeolite as an
amorphous phase. A reason for the different behavior can be the different silica
source added with the dissolution of the silica precoating layer that can have
an effect in the hydrothermal synthesis [36]. Additionally, Ti incorporation is
dependent on the concentration of monomeric and dimeric silicate species [36].
During the synthesis of the TS-1 coating layer, the concentration of silica in
solution will vary, depending on the dissolution rate of the silica precoating,
thus influencing the Ti incorporation.
a. b.
Figure 3.3: SEM images of the cross sections of the TS-1 coated 0.32 mm capillary.
a. b.
Figure 3.4: XPS pattern of TS-1 powder (a) and TS-1 coating layer (b).
Page 76
Results and discussion. TS-1 coated capillary
63
63
The ex situ, bulk synthesized TS-1 powder resulted in the formation of TS-1
crystals of 250 nm size (Appendix 3.A, Figure 3.12). The results of the XRD and
UV-Vis confirmed the TS-1 powder to be both crystalline and the Ti to be
incorporated in the tetrahedral position (Appendix 3.A, Figure 3.11).
ICP was used to determine the amount of Ti contained in the capillary and
bulk synthesized powder (Table 3.2). The titanium contained in the TS-1 coated
capillary was approximately 1.5 wt.%, which is higher than the Ti content of
the TS-1 powder. This can be explained by the slightly higher Si/Ti ratio used
in synthesis mixture for the capillary. Nevertheless, from the information
extracted from the XPS, it was observed that part of the Ti in the coating is not
incorporated in the framework of the zeolite, but present as an anatase-like
phase. These species are not active in the epoxidation of propene, but only
catalyze the decomposition of hydrogen peroxide [37].
Table 3.2: ICP results indicating the Ti content in the powder TS-1 and the TS-1 coated in the
capillary microchannel.
Sample [Ti] (wt.%)
TS-1 powder 1.20
CCMR 1.47
3.3.2 Epoxidation in a Fixed Bed Microreactor (FBMR)
The epoxidation of propene with aqueous hydrogen peroxide was carried out
with the bulk-synthesized TS-1 powder in the fixed bed microreactor (FBMR).
An excess of propene was used in all the experiments and the temperature was
maintained at 40 °C to keep the decomposition of hydrogen peroxide to a
minimum.
Figure 3.5 shows that the conversion of H2O2 was almost complete (96 %) at
low WHSV, with selectivity to PO of 83 %. This is comparable with the results
reported in literature [9, 38]. At lower residence times, the conversion
decreased to 21 %. The main side reaction based on H2O2 was its decomposition
into oxygen and water (Equation 3.6). Even though the decomposition typically
remained below 5 % at high flow rates, it increased to 15 % at low WHSV. The
decomposition is a surface reaction that can be Ti-catalyzed [37]. Catalysts that
contain certain amounts of amorphous TiO2 would favor the decomposition,
Page 77
Chapter 3: Microreactors for the liquid phase epoxidation of propene
64
64
while if Ti is mainly present in the framework of the zeolite, the decomposition
will be very small [37]; that is the case of the TS-1 powder used in this study.
2 2 2 2 ( ) 1 / 2 ( )H O l H O l O g Eq. 3.6
Figure 3.5: Conversion H2O2 (□) and selectivity of H2O2 to PO (●) in the FBMR. G/L ratio= 15,
4wt.% H2O2 with methanol as solvent. Temperature = 40 °C, pressure 6 bar.
The conversion of propene was 21 % at low WHSV, with selectivity to PO of
93 %. The PO selectivity reached 96 % at lower residence times, which
emphasizes the benefits of continuous processes, where the consecutive
reactions are minimized due to the lower residence times, as opposed to batch
processes. The main carbon-containing by-products are produced during the
reactions sketched in Eq. 3.7 to Eq. 3.10, where the oxirane ring is opened and
it further reacts with a nucleophile [38]. The interaction with the solvent,
methanol, results in a maximum of 3 % 1-methoxy-2-propanol (1M2P) and 2-
methoxy-1-propanol (2M1P) (Eq. 3.7). The reaction with water leads to the
formation of propylene glycol (PG) (Eq. 3.8), however, below 60 °C, this reaction
pathway is not very relevant [9]. The reaction between propylene glycol and PO
can produce oligomers (Eq. 3.9). It is interesting to notice the influence of the
WHSV on the selectivity to these by-products (Figure 3.6b). At lower space
velocity, the formed PO has more time to react with the solvent, thus forming
preferentially the monomethyl ethers. As opposed to the tendency observed in
PO (Figure 3.6a), an increase in space velocity reduces the selectivity to the
ring-opening by-products.
0 50 100 150 200 250 3000
10
20
30
40
50
60
70
80
90
100 H2O
2 conversion
PO selectivityH
2O
2 c
on
ver
sio
n/
Sel
ecti
vit
y t
o P
O (
%)
WHSV (ml gcat
-1 h
-1)
Page 78
Results and discussion. Epoxidation in a fixed bed microreactor (FBM)
65
65
a.
b.
Figure 3.6: Epoxidation of propene with hydrogen peroxide in a FBMR. a. PO productivity and
selectivity of C3H6 to PO. b. Selectivity to by-products as a function of the WHSV. G/L ratio= 15,
4wt.% H2O2 with methanol as solvent. Temperature = 40 °C, pressure 6 bar.
Eq. 3.7
Eq. 3.8
Eq. 3.9
0 50 100 150 200 250 300
0.005
0.010
0.015
0.020
0.025
0.030
0.035
0.040
0.045
PO productivity
PO
pro
du
ctiv
ity
(m
ol P
O g
-1 cat h
-1)
WHSVliquid
(ml g-1
cat h
-1)
0
20
40
60
80
100
Selectivity C3H
6 to PO S
elec
tiv
ity
to
PO
(%
)
0 50 100 150 200 250 3000
1
2
3
4 Sel propanal
Sel 1M2P
Sel 2M1P
Sel PG
Sel propionic acid
Sel
ecti
vit
y (
%)
WHSV (ml gcat
-1 h
-1)
CH3OH
CH3
O
+
OH
O
CH3CH3
OH
CH3
O CH3
+
1M2P 2M1P
H2O OH
CH3OH
CH3
O
H2O OH
CH3OH
CH3
OCH3
O
OH
CH3O
OH
CH3
Page 79
Chapter 3: Microreactors for the liquid phase epoxidation of propene
66
66
Eq. 3.10
The selectivity to propanal experiences a different trend in Figure 3.6b, which
is more similar to that of PO. Furthermore, the mechanism for propanal
formation does not follow the opening of the oxirane ring, but an isomerization
reaction, indicated in Eq. 3.11. The activity of the zeolite for the isomerization
is determined by its acidity [39]. Typically the isomerization to propanal is not
a main reaction in the liquid-phase epoxidation of propene. However, the
presence of traces of aluminum can act as active sites for this reaction.
Eq. 3.11
The PO productivity (Figure 3.6a) increases steadily with WHSV until it
reaches a maximum where it stabilizes at 0.037 molPO·gcat-1·h-1. Thereafter,
other phenomena such as adsorption of reactants or desorption of products are
more dominant.
3.3.3 Epoxidation in a coated capillary microreactor (CCMR)
The epoxidation of propene was also carried out in a coated capillary
microreactor (CCMR), where the active catalyst for the epoxidation is coated on
the wall of the capillary microreactor. The tested CCMR was composed of five
1-meter capillaries connected in series and containing a total of 6.35 mg of TS-1
in its coating.
The epoxidation of propene is a three-phase reaction (gas-liquid-solid), since
propene at 40 °C, below 18 bar is in the gas phase. This allows for the
adjustment of the gas-liquid flow regime in a way that benefits the mixing and
the contact between reactants and catalyst. The flow regime in the case of a
CCMR can be better controlled than in the FBMR because there is no obstacle
in the direction perpendicular to the flow. The selected flow regime in this case
was slug flow, in which slugs of liquid flow alternate with bubbles of the gas
phase (propene in this case) (see Figure 3.7). In this type of regime, between
the catalyst coated in the wall and the bubble of propene, a small layer of liquid
H2O OH
CH3OH
CH3
OCH3
O
OH
CH3O
OH
CH3
CH3
O
CH3O
Al
Page 80
Results and discussion. Coated capillary microreactor (CCMR)
67
67
containing hydrogen peroxide is formed. In this thin layer the contact between
the reactants and the catalyst is enhanced and the reaction takes place [40].
Figure 3.7: Picture of the slug flow in the CCMR: bubbles of propene alternated with slugs of
hydrogen peroxide in methanol. G/L = 15.
To be able to compare results between the two types of microreactors used in
this study, the epoxidation experiments in the CCMR were performed
maintaining the same volumetric G/L ratio as in the FBMR (G/L = 15). The
pressure drop along the coated capillary, as opposed to the FBMR, was
negligible, allowing for a more flexible operation rage.
PO was produced successfully in the CCMR, proving that the zeolite coating
layer is, indeed, active TS-1. In Figure 3.8 the PO productivities and propene
selectivities to PO in the CCRM are depicted.
The maximum conversion of hydrogen peroxide obtained in the CCMR was
61 %, with selectivity to PO of 75 %. The decomposition of hydrogen peroxide is
higher in the CCMR which could be attributed to the longer residence time
with respect to the reactor volume; therefore H2O2 was exposed to a
temperature of 40 °C for a longer time. Furthermore, an improved contact
between the catalyst and liquid in the CCMR could further increase the H2O2
decomposition.
The selectivity of propene to PO is higher than 90 % and remains relatively
stable along the range of WHSV studied. A slight decrease is observed at lower
residence times. Analyzing the by-product selectivities in Figure 3.8b one can
observe that, while the selectivity to the ethyl ethers and propylene glycol is
similar to those in the FBMR, the selectivity to propanal is clearly enhanced.
At low residence times, this selectivity increases up to 8 %. The formation of
the isomer of PO can take place over aluminum sites. In the silica precoating,
used to synthesize the TS-1 coating layer, traces of aluminum are present.
Therefore, once the silica layer is dissolved, aluminum will be incorporated in
Page 81
Chapter 3: Microreactors for the liquid phase epoxidation of propene
68
68
the TS-1 and can act as active site for the isomerization to propanal. For this
reason the selectivity to PO decreases slightly with increasing WHSV.
a.
b.
Figure 3.8: a. PO productivity (full squares) and selectivity to PO (empty circles) in the Coated
Capillary Microreactor. b. Selectivity to by-products. G/L ratio= 15,4 wt.% H2O2 with methanol as
solvent. Temperature 40 °C, pressure 6 bar.
A possible improvement for the CCMR could involve the test of other types of
commercially available silica-precoated capillaries, where the aluminum traces
are smaller than in the silica-PLOT capillary used in this study. It is expected
that, in those cases, the propanal production would be reduced, even
eliminated, increasing the selectivity to PO obtained in the CCMR.
The stability of the CCMR was evaluated during 400 hours (Figure 3.9). There
is a sharp peak of productivity during the first hours of reaction. During this
period all the active sites of the catalyst are available for reaction. Afterwards
there is a decline in the reaction rate until it reaches steady state. There are
two possible deactivation mechanisms for these types of reactions. The first one
0 100 200 3000.000
0.005
0.010
0.015
0.020
0.025
0.030
0.035
0.040
0.045
PO productivity
PO
pro
du
ctiv
ity
(m
ol P
O g
-1 cat h
-1)
WHSVliquid
(ml g-1
cat h
-1)
0
20
40
60
80
100
Selectivity C3H
6 to PO
Sele
ctiv
ity t
o P
O (
%)
0 50 100 150 200 250 3000
1
2
3
4
5
6
7
8
Sel propanal
Sel 1M2P
Sel 2M1P
Sel PG
Sel propionic acidSel
ecti
vit
y (
%)
WHSV (ml gcat
-1 h
-1)
Page 82
Results and discussion. Coated capillary microreactor (CCMR)
69
69
is the deposition of PO and other by-products like propylene glycol and
oligomers, blocking the zeolite pores and the active sites for the epoxidation.
Figure 3.9: Deactivation and regeneration in the CCMR after 1 week of reaction with H2O2 (30
wt.%, Sigma Aldrich, containing stabilizers) at 60 °C and flow of 2.5 ml/h during 4 hours. WHSV =
56 ml gcat-1 h-1. Temperature 40 °C and 6 bar.
The other type of deactivation is irreversible and is due to the leaching of Ti
atoms from the framework of the zeolite. To evaluate if the CCMR was
suffering from this sort of deactivation, after 400 h time-on-stream, the catalyst
was regenerated by flushing the capillary with H2O2 (30 wt.%, Sigma Aldrich,
containing stabilizers) at 60 °C and a flow of 2.5 ml/h during 4 hours. The
activity of the catalyst was recovered almost completely, implying that the
deactivation was mainly due to the deposition of organic compounds and,
therefore, reversible (Figure 3.9) [9]. These results show the long-term stability
of the TS-1 layer synthesized in this work by the in situ hydrothermal
synthesis method which is in contrast with the work published by Wan et al.
[32], which suffered from strong irreversible deactivation after 15 hours of
reaction due to Ti leaching.
3.3.4 Comparison between both types of microreactor
It is interesting to determine the relationship between the performances of the
FBMR using powder TS-1 with the CCMR where a layer of TS-1 is in situ
synthesized on the walls of a capillary microreactor. Figure 3.10a shows a
comparison between the PO productivity in terms of the amount of catalyst in
both microreactors. It can be observed that they follow the same trend, even
though the productivity in the FBMR is slightly higher. This discrepancy has to
do with the amount of active sites in the catalyst. Even though the Ti content
0 100 200 300 400 5000.00
0.01
0.02
0.03
0.04
0.05
PO
pro
du
ctiv
ity
(m
ol P
O g
-1 cat h
-1)
Time (h)
Regeneration
30 wt.% H2O
2 at 60C
Page 83
Chapter 3: Microreactors for the liquid phase epoxidation of propene
70
70
in both catalysts is similar (Table 3.2), the incorporation of Ti in the framework
of the zeolite is better in the bulk powder catalyst than in the capillary coating.
Since most of the Ti contained in the powder is in tetrahedral position, almost
all of them will be active sites for the epoxidation of propene. On the other
hand, the XPS analysis of the capillary (Figure 3.4b) indicated that a certain
percentage of the Ti exists as an amorphous phase and does not take part in
the reaction. This highlights that the key parameter for the successful TS-1
coating development is the incorporation of Ti in the framework of the zeolite,
avoiding formation of amorphous species.
Figure 3.10: PO productivity per gram of catalyst. Comparison between the FBMR and the CCMR.
G/L ratio= 15, 4wt.% H2O2 with methanol as solvent. Temperature = 40 °C, pressure 6 bar.
Regarding the selectivity of both catalytic systems, it was observed that in both
cases the selectivity to PO was higher than 90 %. Nevertheless, the FBMR at
higher residence times reached 96 %, while the maximum selectivity obtained
with the CCMR was 94%. This was because the formation of propanal is
enhanced in the CCMR probably due to the incorporation of Al in the zeolite
coating layer.
3.4 Conclusions
In this work, a TS-1 coated capillary microreactor was developed by the in situ
hydrothermal synthesis of TS-1 whereby a silica precoating is transformed to
TS-1. Evaluation of the CCMR in the epoxidation of propene found the TS-1
coating to be active and selective for the production of propylene oxide where
productivities of 1.86 kgPO kgcat-1 h-1 and PO selectivities of 96 % were
0 100 200 3000.000
0.005
0.010
0.015
0.020
0.025
0.030
0.035
0.040
0.045
FBMR
CCMR
PO
pro
du
ctiv
ity
(m
ol P
O g
-1 cat h
-1)
WHSVliquid
(ml g-1
cat h
-1)
Page 84
Conclusions
71
71
obtainable. The coating was found to be stable during long periods of time-on-
stream (160 h), reach steady-state quickly, and shows no signs of Ti leaching.
Comparison to the fixed bed microreactor showed similar PO productivities.
However, due to the better Ti incorporation, minimizing the presence of extra-
framework species in the ex situ synthesized powder used for the fixed bed
microreactor, a slightly higher productivity (2.15 kgPO·kgcat-1·h-1) was obtainable
at high WHSV. The Ti incorporation in the TS-1 coating is thus the key
parameter for obtaining a comparable catalyst to the powder one.
3.5 Outlook
According to the values reported by Klemm et al. [41], productivities higher
than 1 kgPO kgcat-1 h-1 need to be reached to be able to compete with the existing
technologies for PO production. However, considering the PO productivities
reported above, to produce 10 ktons of PO per year, around 100 million CCMR,
or 20 million FBMR like the ones analyzed in this study would be necessary.
Therefore, even though the epoxidation of propene is a fast reaction,
microreactors are not suitable for the industrial production of such a bulk
chemical. Nevertheless, this work proves that this type of reactors can be used
for the oxidation of organic compounds with hydrogen peroxide. The small
reactant inventory required for microreactors, makes them applicable for the
production of fine chemicals or pharmaceuticals.
Appendix 3.A: Characterization of TS-1 powder
The results of the catalyst characterization of powder TS-1 are shown here:
a. b.
Figure 3.11: a. XRD pattern of TS-1 powder. b. UV-Vis pattern of powder TS-1
Page 85
Chapter 3: Microreactors for the liquid phase epoxidation of propene
72
72
Figure 3.12: SEM image of powder TS-1.
Appendix 3.B: Mass transfer limitations
To determine whether there are internal mass transfer limitations in any of
the two reactor systems studied in this chapter, the Weisz-Prater criterion was
determined. If CWP, described in Eq. 3.B.1 is lower than 1, the internal mass
transfer effects can be neglected [42]:
' 2
1cA obs
WPe AS
r RC
D C
Eq. 3.B.1
-r’A(obs) = observed reaction rate
ρc = Solid catalyst density
R = Particle radius
CAS = Concentration of hydrogen peroxide at the surface of the catalyst
De = Effective gas-phase diffusivity [42] was determined using Eq. 3.B.2:
AB p c
e
DD
Eq. 3.B.2
with p= Pellet porosity, c = Constriction factor, DAB =
Mutual diffusion coefficient of solute A at very low concentrations in solvent B.
DAB was calculated according to Wilke-Chang equation [42], Eq. 3.B.3, being
the solute, A, hydrogen peroxide and solvent, B, methanol.
-8 1/2
0
2
.6
7.4/ )
10 ( )(B B
B A
ABD cm sM T
V
Eq. 3.B.3
Page 86
Appendix
73
73
where φ = Association factor of solvent B, MB = Molecular weight of solvent B
(g/mol), T is the temperature (K), μB = Viscosity of solvent B (cP), and VA =
molar volume of solute A at its normal boiling temperature (cm3/mol). Then:
-8 1/2-5
0.63
27.4 10 (1.9 32 / ) 313 10
0.54 23.4 /
5.04 /AB
g mol K
cP cm mol
D cm s
The limiting reactant in this case is hydrogen peroxide, since propene is in
excess. Therefore, CAS in Eq. 3.B1 was calculated based on 4 wt.% H2O2 in
methanol. The reaction rates considered were extracted from Figure 3.10 in the
point where the reaction rate does not vary with WHSV.
Table 3.3: Parameters for the analysis of Weisz-Prater criterion for internal mass transfer
limitations.
Parameters Units
Fixed bed
microreactor
(FBMR)
Coated capillary
microreactor (CCMR)
-r’A(obs) kmol kgcat-1 s-1 1.0·10-5 9.0·10-6
ρc kgcat m-3 500 500
dP (average) m 3.8·10-4 3.0·10-6
CAS kmol m-3 0.97 0.97
DAB m2 s-1 5.0·10-9 5.0·10-9
p - 0.4 0.25
c - 0.8 0.8
τ - 3 5
De m2 s-1 5.4·10-10 2.0·10-10
CWP - 0.37 6.3·10-5
It can be concluded that none of the two reactors used in this study suffers from
internal mass transfer limitations.
Page 87
Chapter 3: Microreactors for the liquid phase epoxidation of propene
74
74
References
[1] A. Goti, F. Cardona, Hydrogen peroxide in green oxidation reactions: Recent
catalytic processes, in: P. Tundo, V. Esposito (Eds.), Green Chemical Reactions,
Springer, Dordrecht, 2008, pp. 191-212.
[2] M. Taramasso, G. Perego, B. Notari (SnamProggeti), US 4410501, 1983.
[3] A. Tuel, S. Moussa-Khouzami, Y.B. Taarit, C. Naccache, J. Mol. Catal. 68
(1991) 45-52.
[4] M.G. Clerici, P. Ingallina, J. Catal. 140 (1993) 71-83.
[5] M.G. Clerici, Appl.Catal. 68 (1991) 249-261.
[6] C.B. Khouw, C.B. Dartt, J.A. Labinger, M.E. Davis, J. Catal. 149 (1994)
195-205.
[7] A.J.H.P. van der Pol, J.H.C. van Hooff, Appl. Catal., A 106 (1993) 97-113.
[8] R. Joseph, T. Ravindranathan, A. Sudalai, Tetrahedron Lett. 36 (1995)
1903-1904.
[9] M.G. Clerici, G. Bellussi, U. Romano, J. Catal. 129 (1991) 159-167.
[10] M.G. Clerici, Oil Gas Eur. Mag. 32 (2006) 77-82.
[11] T.A. Nijhuis, M. Makkee, J.A. Moulijn, B.M. Weckhuysen, Ind. Eng. Chem.
Res. 45 (2006) 3447-3459.
[12] P. Bassler, H.G. Goebbel, M. Weidenbach, Chem. Eng. Trans. 21 (2010)
571-576.
[13] J.M. Campos-Martin, G. Blanco-Brieva, J.L.G. Fierro, Angew. Chem., Int.
Ed. 45 (2006) 6962-6984.
[14] G. Goor, J. Glenneberg, S. Jacobi, Hydrogen Peroxide, Ullmann's
Encyclopedia of Industrial Chemistry, Wiley-VCH Verlag GmbH & Co. KGaA,
2000.
[15] Q. Wang, I. Vural Gürsel, M. Shang, V. Hessel, Chem. Eng. J. 234 (2013)
300-311.
[16] J. Garcia-Serna, T. Moreno, P. Biasi, M.J. Cocero, J.-P. Mikkola, T.O.
Salmi, Green Chem. 16 (2014) 2320-2343.
[17] T.A. Nijhuis, J.Q. Chen, S.M.A. Kriescher, J.C. Schouten, Ind. Eng. Chem.
Res. 49 (2010) 10479-10485.
[18] T. Inoue, Y. Kikutani, S. Hamakawa, K. Mawatari, F. Mizukami, T.
Kitamori, Chem. Eng. J. 160 (2010) 909-914.
[19] J.F. Ng, Y. Nie, G.K. Chuah, S. Jaenicke, J. Catal. 269 (2010) 302-308.
Page 88
References
75
75
[20] V. Paunovic, V. Ordomsky, M.F. Neira D’Angelo, J.C. Schouten, T.A.
Nijhuis, J. Catal. 309 (2014) 325-332.
[21] K. Morinaga, Bull. Chem. Soc. Jpn. 35 (1962) 345-348.
[22] J.L. Zhao, J.C. Zhou, J. Su, H.C. Guo, X.S. Wang, W.M. Gong, AIChE J. 53
(2007) 3204-3209.
[23] Y. Yi, J. Zhou, H. Guo, J. Zhao, J. Su, L. Wang, X. Wang, W. Gong, Angew.
Chem., Int. Ed. 52 (2013) 8446-8449.
[24] P.J. Lindner, R.S. Besser, Chem. Eng. Technol. 35 (2012) 1249-1256.
[25] T. Nozaki, A. Ağıral, S. Yuzawa, J.G.E. Gardeniers, K. Okazaki, Chem.
Eng. J. 166 (2011) 288-293.
[26] A. Ağıral, T. Nozaki, M. Nakase, S. Yuzawa, K. Okazaki, J.G.E.
Gardeniers, Chem. Eng. J. 167 (2011) 560-566.
[27] A. Ağıral, C. Trionfetti, L. Lefferts, K. Seshan, J.G.E. Gardeniers, Chem.
Eng. Technol. 31 (2008) 1116-1123.
[28]
http://www.solvaychemicals.com/Chemicals%20Literature%20Documents/Pero
xygen/H2O2/h202_handling_and_storage_english.pdf, 1998 (accessed July
2014).
[29] K. Yube, M. Furuta, K. Mae, Catal. Today 125 (2007) 56-63.
[30] K. Yube, M. Furuta, N. Aoki, K. Mae, Appl. Catal., A 327 (2007) 278-286.
[31] Y.S.S. Wan, J.L.H. Chau, A. Gavriilidis, K.L. Yeung, Chem. Commun.
(2002) 878-879.
[32] Y.S.S. Wan, J.L.H. Chau, K.L. Yeung, A. Gavriilidis, J. Catal. 223 (2004)
241-249.
[33] Z.C. Shan, Z.D. Lu, L. Wang, C. Zhou, L.M. Ren, L. Zhang, X.J. Meng, S.J.
Ma, F.S. Xiao, ChemCatChem 2 (2010) 407-412.
[34] L.A. Truter, V.V. Ordomsky, T.A. Nijhuis, J.C. Schouten, J. Mater. Chem.
22 (2012) 15976-15980.
[35] B. Notari, Microporous crystalline titanium silicates, ACADEMIC PRESS
INC, SAN DIEGO, 1996.
[36] A. Thangaraj, M.J. Eapen, S. Sivasanker, P. Ratnasamy, Zeolites 12 (1992)
943-950.
[37] D.R.C. Huybrechts, P.L. Buskens, P.A. Jacobs, J. Mol. Catal. 71 (1992)
129-147.
[38] G.F. Thiele, E. Roland, J. Mol. Catal. A Chem. 117 (1997) 351-356.
Page 89
Chapter 3: Microreactors for the liquid phase epoxidation of propene
76
76
[39] T. Imanaka, Y. Okamoto, S. Teranishi, Bull. Chem. Soc. Jpn. 45 (1972)
3251-3254.
[40] R. Pohorecki, P. Sobieszuk, K. Kula, W. Moniuk, M. Zielielinski, P.
Cygganski, P. Gawinski, Chem. Eng. J. 135, Supplement 1 (2008) S185-S190.
[41] E. Klemm, E. Dietzsch, T. Schwarz, T. Kruppa, A.L. de Oliveira, F. Becker,
G. Markowz, S. Schirrmeister, R. Schutte, K.J. Caspary, F. Schuth, D. Honicke,
Ind. Eng. Chem. Res. 47 (2008) 2086-2090.
[42] H.S. Fogler, Elements of chemical reaction engineering, 4th ed., Prentice-
Hall, 1992.
Page 90
4 Abstract
The development of an integrated system for the epoxidation of propene by
synthesizing hydrogen peroxide in a plasma reactor has been evaluated. The
production of H2O2 was studied using humid Ar or H2/O2 mixtures in two different plasma reactors: atmospheric pressure RF glow discharge (APGD)
and dielectric barrier discharge (DBD). The feasibility of combining the plasma
reactor with the epoxidation of propene was assessed both in the liquid and in
the gas phase. It was concluded that the best combination includes a humid Ar plasma integrated with the epoxidation of propene in the liquid phase, due to
the better utilization of H2O2. Finally, a basic economic evaluation was
performed based on the analysis of the obtained efficiencies for the plasma and
the epoxidation reactor and comparing them with off the shelf prices of
reactants and products. Only limited benefit can be obtained with the best
energy efficiencies reported up to date. This suggested that the integrated process would economically not be feasible, since the energy efficiencies are not
high enough and PO is a bulk chemical with low added value.
NOTE: This chapter is the joint work of D.M. Pérez Ferrández and C.A. Vasko
(Elementary Processes in Gas Discharges, Department of Applied Physics, Eindhoven
University of Technology), bringing together the two parts of this STW funded project.
Sections noted with (1) are primarily authored by Vasko, describing his experimental
work. Sections noted with (2) are primarily authored by Pérez Ferrández, describing her
experimental work. The sections marked with (3) are the result of joint authorship.
An integrated
microreactor for the
epoxidation of propene
using a microplasma
Page 91
Chapter 4: An integrated microreactor for the epoxidation of propene
78
4.1 Introduction (3)
Propene oxide (PO) is an important bulk chemical, with a market that reached
7.7 million tons in 2012, and it is expected to grow up to 9.5 million tons in
2018 [1]. It is commonly used as an intermediate in the synthesis of polyether
polyols and propylene glycol, among others. Currently the two main processes
for the production of PO are the chlorohydrin and the hydroperoxide processes.
The former releases high quantities of chlorinated by-products, which raises
environmental concerns due to their hazardousness of their disposal. In the
latter process, co-products such as styrene or tert-butyl alcohol are produced in
quantities of 2 to 4 times as large as the amount of PO. This strongly couples
the economy of the process with the market of the co-product [2]. Since the
beginning of the 90’s the synthesis of PO via the epoxidation of propene with
aqueous hydrogen peroxide (H2O2) has become increasingly important. This
reaction occurs in a single step and produces water as the only by-product,
making it a very clean technology. However, the main limitation is the high
commercial price of hydrogen peroxide. Therefore, the only alternative to an
economically feasible process is to produce H2O2 cheaper. This can be achieved
by production in situ, cutting handling costs and minimizing H2O2 losses. In
the hydrogen peroxide to propene oxide process (HPPO), H2O2 is produced via
the oxidation and reduction of quinones (anthraquinone process, AQ [3]) and is
afterwards used in the epoxidation of propene over a catalyst (TS-1) under
relatively mild conditions [4]. Several industrial production plants are already
operating with this technology. The first of those were developed by BASF and
Dow in Antwerp [5] (Figure 4.1) and by Evonik and SKC in South Korea [6],
with capacities up to 300,000 metric tons PO per year.
The HPPO process reduces the waste water by 80 % and the required energy by
35 % with respect to existing technologies. On top of this, the integration of the
raw materials reduces the physical footprint [5]. Despite all the aforementioned
advantages, HPPO is a complex process requiring three reactors and several
separation steps after the epoxidation reactor to obtain PO with high purity,
which can be energy intensive and hence increases the production costs.
Moreover, the anthraquinone process cannot be considered “green” because of
the by-products of the hydrogenation step (due to overhydrogenation of AQ and
solvent) causing water contamination [3, 7, 8].
Page 92
Introduction
79
Figure 4.1: Scheme of the combined HPPO process. Adapted partially from Bassler et al. [5]. (2)
Propene recylce
Methanol recycle
Methanol
Propene
Pure PO
H2O, Glycols
Low boilers
Main
Epoxidation
Reactor
Off-gasCrude
PO
Water
Glycols
Separation
Methanol
Purification
PO
Purification
Purge
Air
Hydrogen
Oxidation
Reaction
Hydrogenation
Reaction
Pd/Al2O3
L/L
Extraction
H2O2
Makeup xylene
+ quinones
Recycle
catalyst
Propene
PO
Separation
Finishing
ReactorO2 removal
Page 93
Chapter 4: An integrated microreactor for the epoxidation of propene
80
A cleaner alternative for H2O2 production is the direct synthesis from hydrogen
and oxygen mixtures [9, 10]. The catalysts typically used are supported Pd, Au
or Pd/Au alloys, However, this process is limited by the risk of explosive
mixtures of hydrogen and oxygen. A possible solution may be found in the use
of novel reactor concepts such as microreactors or membrane reactors.
Additionally, the low selectivity to hydrogen peroxide should be improved for
this process to be competitive and feasible for industrial applications. The main
reasons for the low selectivity values are the hydrogenation of oxygen
(producing water) and the decomposition of hydrogen peroxide into oxygen and
water [7, 10].
A different and attractive approach for the synthesis of H2O2 is the use of
plasma technology. The advantages of plasma processing using cold non-
equilibrium plasmas are their relative simplicity in design and operation,
combined with the recent developments of reactors, such as dielectric barrier
discharges (DBDs) [11, 12], radio frequency jets [13, 14] and similar, small
plasma sources for a variety of applications. The electron driven plasma
chemistry of these discharges produces a high amount of gas phase reactive
species, which can be exploited by a wide array of applications, if their
chemistry can be understood and directed.
A review on H2O2 production methods by plasma sources can be found in Locke
et al. [15]. The energy efficiencies of the processes described average around
several grams per kilowatt hour of production energy. One of the most efficient
methods identified is the recent work on a gas phase DBDs operating with
H2/O2 mixtures, reporting energy efficiencies for gas phase H2O2 production of
80 to 134 g/kWh [16, 17]. Dielectric Barrier Reactors have already found
applications in many industrial processes, such as e.g. air purification, and
forming H2O2 directly from the reaction of H2 and O2 seems beneficial from the
thermodynamic point of view. Another efficient approach is the use of a gliding
arc reactor operating with gas (Ar) and liquid phase (water vapor spray), where
similar energy efficiencies have been reported [18]. The use of water instead of
H2/O2 mixtures has great potential to minimize production costs. In addition to
their high energy efficiencies, by-products of both methods will mostly be water
– thus turning them into ecologically sustainable alternatives.
However, while both discharges are small (physical length in the order of cm,
while the electrode gaps vary from sub- to several mm) and are operated at
atmospheric pressure, their chemistries are not fully understood yet. This
Page 94
Introduction
81
specially holds for the chemistry involving a plasma in contact with or in the
presence of a liquid phase. The chemistry of atmospheric pressure glow
discharges (APGDs) operating with water vapor, on the other hand, has been
successfully modeled with high energy efficiencies in the order up to several 10
g/kWh [19]. Thus two types of plasma discharges have been studied in this
work: an APGD and a DBD (similar to the ones used in literature). They were
designed to allow optimal spectroscopic access to study relevant plasma
parameters.
With a better understanding of the driving parameters for H2O2 production
using these microplasmas, gas phase H2O2 may be produced directly where it is
put to use. This allows two approaches for the integration of the plasma
synthesis of H2O2 with the epoxidation of propene: either in the gas or in the
liquid phase. The traditional and most studied approach of performing the
epoxidation is with aqueous hydrogen peroxide with methanol as a solvent.
This reaction can reach conversion values of 97 % with very high selectivity to
PO [20]. An intermediate step is necessary, where the synthesized hydrogen
peroxide vapor is captured into an adsorbing liquid like water or methanol
before it is pumped to the epoxidation reactor. This type of process was
proposed by Zhao et al. [16]. Hydrogen peroxide was synthesized in a DBD
reactor using a mixture of hydrogen and oxygen. The products were absorbed
into a fixed volume of methanol contained in a collector and, afterwards,
pumped to the epoxidation reactor. The combined process reached 69 %
selectivity of O2 to H2O2 in the plasma reactor with a yield of 62 % and 92 % of
the peroxide produced was converted to PO with 93 % selectivity. If the size of
the plasma reactor used is of the micro scale, the use of a microreactor for the
epoxidation step is reasonable. In addition, microreactors favor the heat and
mass transfer within the system due to the high surface area to volume ratio.
This reduces the possibility of hot spots and minimizes the side-reactions that
decrease the selectivity to the desired product [21].
The second process option, from the epoxidation point of view, is the gas phase
epoxidation, where H2O2 vapor coming from the plasma is fed directly to the
epoxidation reactor. There it can react immediately with propene gas over a
TS-1 bed. This alternative would avoid the intermediate capturing step in
which the produced peroxide is absorbed into methanol. Su et al. [22] reported
this combination with a yield of 0.25 kgPO kgcat-1 h-1, a selectivity of propene to
PO of 95.4 % and a H2O2 utilization of 36.1 %. A more detailed description of
the gas phase epoxidation was published by Klemm et al. [23], who performed
Page 95
Chapter 4: An integrated microreactor for the epoxidation of propene
82
the reaction in a microstructured reactor coated with TS-1, both on laboratory
scale and in a pilot plant. They obtained productivities higher than 1 kg of PO
per kilogram of catalyst per hour and selectivities to PO based on propene
higher than 90 %. However, the selectivity based on peroxide that they
reported was 25 % in lab experiments and 60 % in the pilot plant, which is still
too low for being able to compete with the liquid phase route mentioned before.
The purpose of this project is to develop and evaluate the feasibility of an
integrated system for the production of propene oxide, where hydrogen
peroxide is produced in situ in a plasma microreactor.
4.2 Experimental designs and methodologies
4.2.1 Experimental Plasma Setups (1)
This section introduces the variety of setups used for the gas phase production
of H2O2. The reactors developed are described in greater detail in [24]. Small
and homogenous discharges were considered over larger, multiphase and
corona like discharges. These treat most of the gas passing through the reactor
in contrast to large/filamentary reactors, where only a fraction of the gas is
actually in contact with the plasma. At the same time, key parameters such as
temperature, power density, electron density and short lived species are more
uniformly distributed. This not only makes it easier to understand the
chemistry with simple theoretical models, but also improves the measurements
of those parameters. A schematic description of the experimental setup used in
common with all plasma reactors can be seen in Figure 4.2. Mass flow
controllers ((1), Brooks 5800, 10 slm, 300 sccm) allow gas and admixture
concentration control, enabling to add up to 2.7 % ± 0.3 % water vapor (using
water bubbler of 250 ml, Duran (2)) to the total gas flow of typically 2 slm. The
discharges are generated in either humidified argon or helium.
The gas feed lines (3) are traced between the humidifier and the detection
vessel and kept above room temperature to avoid condensation. The design of
the reactors, their equivalent circuits and power supplies are described in the
following subsections, followed by a description of the principal methods for the
determination of power in each case.
Page 96
Experimental designs and methodologies
83
Figure 4.2: Schematic overview of setup for the plasma sources. (1) Gas feed with Mass flow
controllers, (2) humidification in bubbler, (3) traced gas feed lines, (4) in situ H2O2 detection. From
[24]. (1)
The H2O2 yield is measured by observing the color change due to the reaction of
hydrogen peroxide with an ammonium metavanadate solution (NH4VO3) in the
liquid phase [25], (4) in Figure 4.2. A blue diode (LED450-06, Roithner
LaserTechnik GmbH) serves as light source for the absorption measurements:
light passing through the absorption cell is detected by a low resolution UV-
VIS spectrometer (Avantes AvaSpec-USB2 Fiber Optic Spectrometer), while
the stability of the light source is monitored simultaneously by a similar
spectrometer (Ocean Optics HR2000).
4.2.1.1 The Atmospheric Pressure Glow Discharge Reactor (APGD) (1)
The plasma is a capacitively coupled atmospheric pressure glow discharge
operating at ambient pressure and driven by radiofrequency (RF) alternating
current (AC) as described in [26, 27] and similar to [28, 29]. The glow discharge
is ideal, as the plasma is homogenous across the gap; the high excitation
frequency adds to the uniformity of the discharge, as the heavy molecules and
Page 97
Chapter 4: An integrated microreactor for the epoxidation of propene
84
atoms cannot follow the high excitation frequency, while the lighter electrons
drive the chemistry. The plasma may be operated in He with small admixtures
of molecular gases such as H2, O2 or H2O. The reactor consists of two stainless
steel electrodes positioned adjacently to form a 1 mm gap in between. Reactor
characteristics are provided in Table 4.1, and the design is detailed in Figure
4.3. The chosen design allows visual access via side windows made of quartz.
The body is made of machine cast PVC.
Table 4.1: Physical characteristics of plasmas sources investigated in this work.
APGD DBD I DBD II
electrode length [mm] 35 38 5 - 92
electrode width [mm] 5 9 12
Gap [mm] 1 1 0.5 – 40
plasma volume (approx) [mm3] 175 342 60 – 1073
water concentration [vol %] 0.2 – 3 ± 0.3
Operational frequency [kHz] 9550 22.5
The RF power is generated by amplifying the RF signal generated by a signal
generator (Power Amplifier E&I AB-250 and Agilent 33220A 20 MHz Arbitrary
Waveform Generator, see Figure 4.3). A bidirectional coupler with thermal
probes (Amplifier Research PM2002, abbrev. as PM) to monitor the
forward/reflected power is placed between the amplifier and the matching
network, which is necessary to efficiently couple power into the reactor. A
current monitor (Pearson 2877) and a voltage probe (Tektronix-P6015A, I and
V in Figure 4.3) are used to monitor current and voltage (VI) signals in
conjunction with an oscilloscope (Agilent Technologies, 250 MHz, 2 GSa/s). The
APGD is operated around 10 MHz, with 0.5 W to 4 W dissipated plasma power.
The discharge can be operated with power modulation (on-off) of the RF power
using an additional signal generator to modulate the amplitude of the RF
signal produced by the primary signal generator. The duty cycle of the
modulated (20 kHz) signal is varied from 100 % down to 20 %, with a precision
of around 1 %. Below 20 % the discharge becomes increasingly difficult to
operate stably and measurements become less reproducible.
Page 98
Experimental designs and methodologies
85
Figure 4.3: The APGD reactor and its electrical equivalent circuit (inset top right). (1) Swagelok gas
inlet, (2) stainless steel electrodes, (3)set of o-rings sealing reactor windows and body, (4) quartz
windows, (5) gas outlet. For more detail consult [24] (1).
4.2.1.2 The Dielectric Barrier Discharges (DBD I and DBD II) (1)
The DBD concept is well known and has been investigated extensively [12], e.g.
in the context of ozone production. First investigations were conducted in 1857
[30]. In a DBD, one or both electrodes are covered with a dielectric limiting the
current transport. At atmospheric pressure, electron avalanches build up
charge very quickly which leads to breakdown in the gas. As this breakdown
channel reaches the adjacent dielectric surface, it is almost instantly disrupted
again. These so called microdischarges have a very short lifetime in the order of
ns, as the surfaces are dielectrical, giving a quick rise in surface charge which
disrupts the local field in an area larger than the filament itself. This effect
limits the lifetime of such a filament to a few ns and the slow dissipation of the
surface discharge inhibits the formation of a new filament at the exact same
location in subsequent periods [11, 31, 32]. This is a great advantage, as the
Page 99
Chapter 4: An integrated microreactor for the epoxidation of propene
86
very active electron chemistry of these microdischarges requires only very little
energy per microdischarge and thus has great potential for many applications.
In this work, two DBDs were developed and put to use. The first one, DBD I, is
depicted in Figure 4.4. It was designed for power control and as a closed system
to be able to investigate Ar, He and H2/O2 admixtures in the same reactor. The
DBD II was developed with a scalable electrode gap and the option to cool the
electrodes. As such, it is possible to freely vary the interelectrode gap and the
length of the electrodes in the same system. DBD I and DBD II are described in
detail in chapter 2 of [24].
Figure 4.4: Description of the DBD I design with electrical equivalent circuit. (1) Gas inlet, (2) high
voltage contact (3) electrodes , (4) gas outlet towards detection. Detail view highlights the
crossection of the reactor with the discharge gap. (1)
It is possible to excite a discharge using a kHz AC power source (Amazing1
Plasma Driver, 22.5 kHz) with sufficiently high output voltages to cause
breakdown of the gas in the reactor. In both reactors developed for this work,
the electrodes are parallel sheets of 1 mm thick dielectric material (pyrex glass)
with a gap between them (see Figure 4.4). These dielectric sheets are coated
with conductive layers of silver paint (3) on the outer side, serving both as
electrical connections as well as electrodes. The plasma is excited in the gas
supplied to the reactor (1), which completely fills the gap between the glass
sheets.
Page 100
Experimental designs and methodologies
87
A layer of silicon rubber glue on the reactor outside, covering the electrode
outer surfaces, prevents corona discharges at the electrode edges. Temperature
measurements of the silver surface using an infrared thermometer suggested
that they do not heat up significantly under typical operational conditions,
ranging from slightly above room temperature at low powers ( < 1 W), to about
68 °C at high powers (> 5 W). The dimensions and characteristics of the DBD I
are listed in Table 4.1.
4.2.2 Plasma power measurements (1)
As both discharge types used in this work are significantly different and the
power used by the source is one of the key parameters for the energy efficiency,
it is essential to measure it correctly. The total applied power to a system,
totalapplP , significantly differs from case to case. It depends on the choice of
equipment and the efficiency of matching the plasma source to the power
supply. As such, total
applP is a poor parameter to compare different sources and of
no use to understand the chemical kinetics of a discharge. Energy efficiencies
described in [24] and this work are based on the power dissipated by the
plasma alone, without losses occurring in the system, Pplasma.
The standard approach to measure power, which is valid for the APGD source,
is described in [13].
0
1T
P U t I t dtT
Eq. 4.1
with P denoting power, T the period of the applied signal and U(t) and I(t) the
measured voltage and current, respectively. A simple measurement may be
strongly influenced by the capacitance introduced by the voltage probe in the
circuit. Thus a power meter (bidirectional coupler) was used in addition to the
voltage probes to obtain both reflected and forward power between power
amplifier and matching box as a function of the measured current root mean
square (IRMS), 𝑃𝑎𝑝𝑝(𝐼𝑅𝑀𝑆). To calculate the 𝑃𝑝𝑙𝑎𝑠𝑚𝑎(𝐼𝑅𝑀𝑆) it is necessary to correct
the measured forward power going into matching the box and the reactor, for
losses in the matching box [13, 24]:
plasma RMS app RMS match RMSP I P I P I Eq. 4.2
Page 101
Chapter 4: An integrated microreactor for the epoxidation of propene
88
with 𝑃𝑚𝑎𝑡𝑐ℎ(𝐼𝑅𝑀𝑆) being considered as heat losses in the coil and 𝐼𝑅𝑀𝑆 the
measured root mean square current. With all losses established as a function of
the applied RMS current, it is possible to set and monitor specific dissipated
plasma powers, 𝑃𝑝𝑙𝑎𝑠𝑚𝑎(𝐼𝑅𝑀𝑆), in the APGD source. For more detail, see the
Experimental Methods section in [24].
Another approach is chosen in the case of the filamentary discharges in DBD’s.
These filaments are seen in typical current / voltage graphs in Figure 4.5. For
an accurate power measurement, the current of an individual filament has to
be measured requiring probes with very high rise times to resolve individual
peaks produced by microdischarges, as seen in the jagged current signal
produced by many individual, overlapping peaks. Thus the conventional
approach to calculate the power as in equation 4.2 cannot be applied. A solution
to this was introduced by Manley [33] and has been applied for similar
discharges.
The method uses a measurement capacitance in series with the source, forming
an electrical equivalent circuit of two capacitances in series. If this
measurement capacitance 𝐶𝑀 is much bigger than the capacitance of the DBD,
the influence of the measurement capacitance on the whole system is negligible
and the charge 𝐶𝑀 measured across the measurement capacitance represents
the same charge as on the plates of the DBD. The current through the
measurement capacitance is physically integrated, and hence short current
pulses of all filaments are included in the power measurement without the
need to identify them up individually.
The charge is determined by
M MQ t C U t Eq. 4.3
and can be measured by current and voltage across the measurements
capacitance. Plotting the sinusoidal high voltage driving the plasma against
the charge will result in a symmetric figure due to the periodic nature,
commonly referred to as Lissajous figure. Actual figures are shown in Figure
4.5. Integrating over the area enclosed represents the energy dissipated by the
discharge during a full period, and thus
0
1T
app MP Q t dtT
Eq. 4.4
Page 102
Experimental designs and methodologies
89
Figure 4.5: Typical Lissajous figure of the DBB I, operated with He + 2.7% H2O at various
powers.(1)
This is a simple method for measuring the power applied to the system. In
order to obtain the plasma dissipated power, the same approach as in the case
of the APGD has been chosen: as function of RMS current, the applied power
can be corrected for the corresponding losses at the same current (see equation
4.2).
4.2.3 Hydrogen Peroxide detection in the plasma source (1)
A number of H2O2 detection methods have been considered initially as an
alternative to the ex situ optical absorption method described in this section.
The main challenge to H2O2 detection in the gas phase lies in detecting low
densities in situ in the presence of high concentrations of water. While options
such as Fourier Transform Infrared Absorption (FTIR), Mass Spectroscopy
(MS) or Gas Chromatography (GC) are well established, they are generally
challenged to detect H2O2 in the order of 10 ppm at typical water vapor
concentrations in the plasma (0 – 2.7 vol.%). Detection of H2O2 in the liquid
phase is also well established and can be performed with high sensitivity
towards H2O2. A number of techniques for detecting hydrogen peroxide take
advantage of the strong oxidizing properties of H2O2. Reduction/oxidation
titration methods detect concentrations of reaction product visually by a color
change of an indicator solution. However, methods such as iodometric titration
[34] or permanganate titration [35] also have a rather low sensitivity (H2O2
detection limit of iodometric titration: 0.1 wt.%) and are suitable only for
higher concentrations of H2O2. A good overview of alternative
Page 103
Chapter 4: An integrated microreactor for the epoxidation of propene
90
spectrophotometric, fluorescence or chemo-luminescence method can be found
in [36] and [24].
A colorimetric method using a solution of ammonium meta-vanadate (NH4VO3)
was chosen. The reduction of VV to VVII induces a color change from yellow to
orange, with its maximum intensity at a wavelength of 450 nm as reported in
[25]. The method has been shown to be highly selective to H2O2 in the presence
of many other reactive species such as Cl-, NO3-, Fe3+ and FeOx with a reported
detection limit of 0.143 μmol/l. Ozone, typically produced in the presence of
oxygen in the plasma, does not seem to influence the detection of H2O2 with
NH4VO3 either [37]. Possible issues with selectivity are further limited as the
effluent is not in contact with air until after the detection. Due to the reported
stability of the NH4VO3 solution over 180h and its high selectivity it was
chosen as primary method in this work.
Figure 4.6: Illustration of detection method using ammonium metavanadate. The fit of the slopes
produced at 0.47% H2O and 2.7W ± 0.2W allows to derive the production per minute and thus
allows to calculate energy efficiencies. Note that negative values are possible, since this is a
relative measurement method and values larger than 0 mean that less light is passing through the
solution due to the color change. However, small fluctuation in the light source intensity may
temporarily brighten the light passing through detection in relation to the reference value and
result in negative values. (1)
Page 104
Experimental designs and methodologies
91
The concentration c of H2O2, absorbed by the detection liquid and leading to a
change in absorption signal, can be determined using the Beer-Lambert Law
0
cdI I e Eq. 4.5
with
0
I
I being the ratio of measured to reference intensity, d the optical
absorption path length and ε the molar extinction coefficient of the detection
liquid as reported in [25].
For every measurement run, the first obtained spectrum is used as a reference
signal. Solving the equation for c, the H2O2 yield in [mol/l] can be obtained for
each measurement. Performing a measurement every minute results in a
graph like in Figure 4.6.
The slope of a linear fit of these individual measurements is the H2O2 yield in
[mmol l-1 min-1] in the detection volume. Combined with the measured plasma
power the energy efficiency η in units of [g kWh-1] can be calculated.
Transforming this concentration into molar densities and considering the flow
through the system allows to calculate gas phase (volume) densities of
hydrogen peroxide, 2 2H On , in [ppm].
4.2.4 Epoxidation of propene with hydrogen peroxide (2)
The epoxidation of propene in the gas and in the liquid phase is explored with
the aim to evaluate the eventual integration with the synthesis of hydrogen
peroxide in a plasma reactor. Titanium silicalite-1 was used as a catalyst in
both cases, considering its high performance in the oxidation of organic
compounds with hydrogen peroxide [38-41].
4.2.4.1 Gas phase epoxidation setup (2)
The gas phase epoxidation is performed in a tubular reactor with an inner
diameter of 4 mm and a length of 470 mm (Figure 4.7, (3)). The material of the
reactor may be varied: quartz, PTFE, titanium and stainless steel depending on
the experiments. The reactor is inserted into a tubular oven (4) for conducting
experiments at different temperatures, ranging from 120°C to 160°C. The
hydrogen peroxide vapor was obtained by feeding aqueous H2O2 (30 wt.%,
Page 105
Chapter 4: An integrated microreactor for the epoxidation of propene
92
Sigma Aldrich, containing stabilizers) with a syringe pump (KDS 100 with a
borosilicate gas-tight syringe SGE) through a PEEK capillary inside the
reactor, where it evaporates over a bed of PFA (perfluoroalcoxy) beads at the
working temperature. The syringe pump is located inside a fridge at 7 °C to
avoid decomposition of H2O2 (2). The gases, helium (carrier gas) (0 –
200 ml/min) and propene (0 – 20 ml/min), were dosed by mass flow controllers
(BROOKS Instruments B.V.) (1). The outlet gases of the reactor were analyzed
online by a Compact Gas Chromatograph (GC, Interscience B.V.) equipped with
a Rt-Q-Bond column and a Molsieve 5A column in two separate channels, both
with a thermal conductivity detector (TCD) (6).
Figure 4.7: Setup for the epoxidation of propene in the gas phase. (1) Mass flow controllers, (2)
Syringe pump for feeding aqueous H2O2 to the system, (3) quartz reactor, (4) heating oven, (5)
capturing setup, (6) online GC. (2)
Given the limitations presented by the analysis of H2O2 vapor, which is fully
decomposed at the high temperature in the injector of the GC, a capturing
setup was developed (5). A 4-way valve was installed just after the reactor,
giving the possibility of diverting the flow to a capturing vessel. This vessel was
immersed in a cooling bath prepared with a mixture of liquid nitrogen and
ethanol (-116°C) so that all the vapors were frozen when passing through it.
GC
He
C3H6
MFC 5
MFC 001
Vent
F1
P6
P5
P
Vent
H2O21
2
3
4
5
6
Page 106
Experimental designs and methodologies
93
The remaining gases were measured in the GC. All the oxygen measured
during these runs can be directly related to the amount of hydrogen peroxide
decomposed in the reactor. To verify the validity of this method, in a number of
experiments, the frozen content of the vessel was analyzed by iodometric
titration to determine the peroxide concentration in the gas phase. Using this
method, the hydrogen peroxide decomposition was determined with an
experimental error of less than around 10 %.
Liquid phase epoxidation setup (2) 4.2.4.2
Considering the possibility of synthesizing hydrogen peroxide in a microplasma
reactor, the liquid phase epoxidation of propene was carried out in a
microreactor. Two types of microreactors were evaluated: a TS-1 coated
capillary microreactor (CCMR) and a fixed bed microreactor (FBMR). The
former was prepared by in situ hydrothermal synthesis of TS-1 zeolite in the
walls of a fused silica capillary, resulting in a homogeneous TS-1 coating layer
of ~3 μm thickness. The latter was loaded with TS-1 powder. More details
about the characteristics of the microreactors can be found in Chapter 3.
The experiments were conducted in the setup shown in Figure 4.8. Either the
coated capillary microreactor (CCMR) or the fixed bed microreactor (FBMR)
were connected to the setup and kept in a thermostatic oven (Figure 4.8, (4)) to
maintain the reaction temperature. The liquid phase was fed at a flow rate
between 0.2 and 6 ml/h with a high precision syringe pump (Teledyne ISCO)
(Figure 4.8, (2)) connected with a cooling jacket at 10 °C to minimize H2O2
decomposition. The propene flow was controlled by a mass flow controller
(Bronkhorst) in a range between 0.1 and 10 Nml/min (Figure 4.8, (1)). Both
reactants were mixed before entering in the reactor using a T-shaped mixer
(Figure 4.8, (3)). A back pressure regulator was used downstream to facilitate
maintaining a constant pressure N2 at a constant flow rate of 1 Nml/min
(Figure 4.8, (7)). After the reaction, the two phases were separated and the gas
stream was analyzed in an online microGC (Varian) equipped with a Porabond
Q column and a Molsieve 5A column in two separate channels, both with a
thermal conductivity detector (TCD) (Figure 4.8, (6)). Liquid samples were
taken every hour (Figure 4.8, (5)) and analyzed for their composition in an
offline GC (Varian CP-3800) with a CP-Sil-5 column and equipped with an FID
detector. The concentration of hydrogen peroxide in the liquid samples was
determined by iodometric titration. A three-way valve situated after the ISCO
Page 107
Chapter 4: An integrated microreactor for the epoxidation of propene
94
pump allowed samples to be taken to analyze the actual concentration of
hydrogen peroxide that was used, since some decomposition of H2O2 occurred
with time inside the pump.
Figure 4.8: Scheme of microreactor setup for the epoxidation of propene with hydrogen peroxide. (1)
Mass flow controllers, (2) ISCO pump, (3) T-shaped mixer, (4) thermostatic oven, (5) valve for the
sampling of liquid to be analyzed in an off line GC, (6) on line gas microGC, (7) back pressure
regulator. (2)
4.2.5 Epoxidation experiments (2)
The epoxidation experiments were carried out in the setups described above,
analyzing different parameters that can be important for the performance of
the reaction.
The conversion and selectivity to PO of hydrogen peroxide (XH2O2, SH2O2 to PO)
were calculated following equations:
2 2 2 2
2 2
2 2
-100
IN OUTH O H O
H O INH O
F FX
F Eq. 4.6
2 2
2 2 2 2
100-
POH O to PO IN OUT
H O H O
FS
FF Eq. 4.7
The selectivity of propene to PO and other by-products (3 6
C H Cx
n m ) can be
obtained as:
BACK
PRESSURE
REGULATOR
COLLECTION
VESSEL
P-1
MFC
C3H6
Methanol +
H2O2 + H2O
LIQUID
SAMPLING
GAS
MICRO GC
Air
OVEN
CAPILLARY
FIXED BED
MICROREACTOR
N2
MFC
ISCO PUMP
SAMPLING
VALVE
1
2
3
4
6
7
5
Page 108
Experimental designs and methodologies
95
3 6 3 6
3 6 % 100 100
x x
in out
C
C H to
C Hx
x
H
n nF F
m mn F FF
S
m
Eq. 4.8
where Fx is the molar flow of the reactants and products used and obtained
during the oxidation of propene (mol/min). In the gas phase epoxidation the
main by-products are acetaldehyde, CO2 and CO, from the further oxidation of
propene, as well as acetone and propanal from the isomerization of PO. In the
case of the liquid phase epoxidation, the formation of 1-methoxy-2-propanol
(1M2P), 2-methoxy-1-propanol (2M1P) and propylene glycol (PG) are the result
of the opening of the oxirane ring due to the acidic conditions.
In the gas phase epoxidation of propene, the effect of the concentration of
hydrogen peroxide and propene was evaluated by maintaining one constant
concentration in excess and varying the concentration of the other. Helium was
used as inert gas, with flows of 50 and 100 ml/min. In all these experiments the
temperature was maintained at 140°C. Additionally, the influence of the
catalyst loading was also tested. To that end, different amounts of TS-1,
ranging from 10 to 100 mg, were packed in the reactor. The epoxidation was
carried out at a total flow rate of 64 ml/min, 3.7 vol.% H2O2 and 13 vol.% C3H6
at a temperature of 140°C. The behavior of the system at different
temperatures was evaluated by varying the temperature of the oven between
120 and 160°C. The concentrations of peroxide and propene were 2.4 and 0.8
vol.% respectively, maintaining a total flow rate of 116 ml/min.
The liquid phase epoxidation of propene was conducted with aqueous hydrogen
peroxide using the FBMR and the CCMR, described above. The pressure was
maintained at 6 bar and the temperature at 40 °C. The liquid phase consisted
of 13.3 wt.% hydrogen peroxide (30 wt.%, Sigma Aldrich, containing stabilizers,
effectively 4 wt.% H2O2 and 9.3 wt.% water), with methanol as solvent and 4
wt.% ethanol as internal standard. The gas phase was pure propene. The gas
and liquid space velocity (GHSV and LHSV, respectively) were calculated using
Equation 4.9. The space velocity of the liquid was varied by changing the
pumping rate in the ISCO pump and maintaining the same amount of catalyst.
The volumetric gas-to-liquid ratio (G/L) was maintained constant at 15 for all
the experiments conducted, calculated considering that the conditions inside
the reactor are at 6 bar and 40 °C.
Page 109
Chapter 4: An integrated microreactor for the epoxidation of propene
96
( / )
· ( )
TOT
cat cat
Q ml hmlGHSV or LHSV
g h W g
Eq. 4.9
The space velocity used in this work relates the reactant liquid or gas flow rate
to the amount of catalyst employed in the system.
4.3 Results and Discussion
4.3.1 Hydrogen peroxide production results (1)
With the methods detailed in the previous section, all three reactors where
investigated regarding their maximum energy efficiency for H2O2 production.
The following section intends to present an overview of the results and focuses
on the main parameters for H2O2 production.
Table 4.2: Maximum energy efficiencies for H2O2 production. The APGD cannot be operated in Ar.
These results are obtained with maximum water vapor saturation of 2.7 % ± 0.3 % H2O vapor.
APGD DBD I DBD II
He [g/kWh] 0.18 ± 0.02 0.16 ± 0.02 0.3 ± 0.01
Ar [g/kWh] - 0.24 ± 0.05 1.4 ± 0.4
diss. plasma power [W] 1 – 3 0.1 – 4 0.5 – 10
Gas Temperature
In all cases, it was found that the gas temperature in the reactor did not exceed
380 K. This is important to note, as especially H2O2 has been reported to
decompose at higher gas temperatures. At ambient gas temperature up to well
beyond 400 K, electron driven chemistry reaction rates are orders of magnitude
faster than thermal dissociation rates. Between the lowest and highest powers,
the measured change in gas temperature is of the order of 30 K.
Water concentration
In the experiments performed with water vapor dispersed in a carrier gas (Ar
or He), the H2O2 yield rises with increasing content of water in all reactors.
This can be expected, as H2O2 is produced by the dissociation of H2O molecules
and the formation of OH radicals in the process. Two of these radicals may
Page 110
Results and discussion. Hydrogen peroxide results
97
recombine to form a H2O2 molecule in a three body recombination process [42].
In the operational regime of up to maximal water vapor concentrations of 2.7 –
3 % ± 0.3 %, the energy efficiency rises linearly (APGD case) or in fair
approximation linearly (as in the case of the DBD I).
However, while all measurements listed in Table 4.2 have been obtained with
the maximal water vapor concentrations of up to 3 vol.%, a set of
measurements was carried out at concentrations of up to 16 % H2O in the gas
phase. The power required to operate a discharge increases in the presence of
molecules compared to atomic gases. This was one of the reasons that lead to
the use of humid gas discharges instead of admixtures as reported in literature.
In this case the sharp increase in power needed to keep the discharge
operational balanced the gain in product yield by higher initial water
concentrations, thus leading to lower energy efficiencies. These values are
below the maximum values reported in Table 4.2.
Use of H2/O2 admixtures
While H2/O2 admixtures were considered and investigated in both source types,
the results remain inconclusive. In contrast to [16], a buffered 1:1 mixture with
96 % He was used in order to avoid explosive mixtures and allow safer
handling, as both reactor types are open to the ambient and the detection
method requires an open architecture. Energy efficiencies and peroxide yields
measured with these admixes are a factor two lower than using humid He and
are subject to strong variations. These variations maybe due to influences of
radicals produced by the discharge interacting with the detection solution.
Using alternative captioning methods, such as the capturing with water in
combination with consecutive ex-situ analysis of the treated sample volume or
gas trap to capture the effluent, yielded very low H2O2 densities and did not
reflect results observed in literature.
The use of undiluted, non-explosive mixtures of 96 % H2 and 4 % O2 was made
possible using the epoxidation setup described in section 4.2.4.1 (Figure 4.7).
When the plasma ignites, the O2 completely dissociates as measured by the GC.
Simultaneously, H2O is being produced and detected in the GC. As H2O2
decomposes in the GC and cannot be detected, it is not possible to comment on
the underlying chemistry of this process.
It seems, however, from the use of both buffered and pure H2/O2 admixtures
that the energy efficiency of humid Ar and He discharges is higher.
Page 111
Chapter 4: An integrated microreactor for the epoxidation of propene
98
Carrier Gas
The gasses chosen for this investigation differ from the gases used in literature
[16, 43], as the chemistry of H2/O2 is poorly understood, while humid non-
equilibrium discharges with H2O have been modeled preceding this work [19]
and are understood to a certain extent. As understanding the chemistry is
essential, existing models where investigated further to see how far the energy
efficiency may be improved.
Thus Ar and He where used, while it is only possible to directly compare both
in the same reactor in the DBDs without modifications of the source. Results
indicate that the main production mechanism is indeed the 3 body
recombination of OH,
2 2
OH OH M H O M Eq. 4.10
M is a third body, neutral atom or gas molecule, which is required to allow the
conservation of Energy (as the two OH radicals recombine, excess/required
Energie for the formation of H2O2 molecule have to be provided/absorbed).
Reults further reflect the higher OH densities in Ar than in He measured both
elsewhere and in the current setups [24, 44]. Thus the use of Ar is preferable as
it yields higher OH densities and consecutively higher H2O2 yields.
Power
Plasma dissipated power is one of the key factors affecting its performance, as
higher powers lead to higher electron densities and thus to a more active
plasma chemistry.
In the case of the APGD, the energy efficiency rises with dissipated power in
the operational range, while below 1 W the APGD becomes increasingly
unstable. For more detail see [42].
On the other hand, in both cases of the DBD sources, the energy efficiency does
not increase linearly with power in all cases. Using He as a carrier gas, results
are comparable to the AGPG, while in the case of Ar as carrier gas, a
pronounced maximum in energy efficiency at low powers [42, 45] is observed.
This suggests that the different, filamentary nature of the DBDs might give
rise to a higher H2O2 yield. Electron densities in a filament are orders of
magnitudes higher than in a glow discharge, hence also the OH density, most
likely boosting the dissociation of H2O in the gas. Outside the filament, electron
Page 112
Results and discussion. Hydrogen peroxide results
99
densities and gas temperature are significantly lower, allowing for the
formation of molecules such as H2O2.
Modeling as well as a simple balance of experimental results using the APGD
suggests [42] that electron-induced losses are the most important H2O2 loss
mechanisms in the plasma. High electron densities (ne) are responsible for
driving most of the chemical reactions as well as for the main loss mechanisms
for H2O2 as many highly energetic electrons are available. However, the
highest ne is restricted to transient filaments in the DBD, leading to the
assumption that a low number of filaments might result in higher H2O2 yields.
At lower power, fewer filaments are formed and thus there are less highly
energetic electrons to dissociate the peroxide, while it is still being produced
efficiently enough by the recombination of OH radicals. Striking the right
balance is essential for the optimalisation of this process.
This might be supported by the observation that at low plasma powers, the
discharge gap is not uniformly filled with filaments. With increasing power, the
plasma becomes optically more uniform and the energy efficiency of H2O2
production drops slightly, again supporting the idea that too many filaments
dissociate the H2O2 better. However, it should be mentioned that the model
developed in [42] was for a completely different discharge chemistry and that
loss mechanisms in this case might be different.
4.3.2 Results of the epoxidation of propene (2)
Gas phase epoxidation
The gas phase epoxidation of propene was successfully accomplished by
evaporating aqueous hydrogen peroxide in situ. Amounts of catalyst as small
as 10 mg were capable of catalyzing the synthesis of PO, reaching
productivities as high as 10 gPO gcat-1 h-1. This value is very high in comparison
with the gas phase epoxidation experiments carried out with a mixture of H2
and O2 over Au-Ti catalyst, where the highest productivity achieved so far was
0.3 gPO gcat-1 h-1 [46]. The high values obtained with H2O2 vapor are due to the
large reaction rate of the epoxidation and decomposition over TS-1 at 140 °C.
Even when more catalyst is added, the conversion and selectivity remain the
same, indicating that the reactions occur in the first section of the catalyst bed,
utilizing only a few mg of catalyst.
Page 113
Chapter 4: An integrated microreactor for the epoxidation of propene
100
Hydrogen peroxide was completely converted in all experiments (XH2O2 =
100 %), partially in the epoxidation and partially decomposed. The presence of
the catalyst enhanced the decomposition, due to the presence of Ti in its
structure. However, at the moment propene was introduced in the gas feed, the
decomposition dropped to around 35 % while the selectivity of hydrogen
peroxide to PO reached 40 %. This indicates that the epoxidation of propene is
faster that the decomposition of H2O2. Regarding the selectivity to PO based on
propene, as long as an excess of propene is maintained during the reaction,
values higher than 90 % can be obtained, with acetaldehyde, CO and CO2 from
the further oxidation of PO, and propanal and acetone from its isomerization as
main by-products. The reason for the need of an excess of propene lies in the
fact that an excess of hydrogen peroxide would further oxidize the produced PO
into CO and CO2 and acetaldehyde.
Liquid phase epoxidation
The traditional liquid phase epoxidation of propene was studied in a
microreactor, to evaluate the possibility of combining this reaction with the
synthesis of hydrogen peroxide in a microplasma reactor. Two alternatives
were contemplated in this case: a fixed bed microreactor and a coated capillary
microreactor. The epoxidation of propene was achieved and high selectivity to
PO (>95 %) could be obtained. Productivity values of 2.15 gPO gcat-1 h-1 were
attained. Considering that PO is a bulk chemical, produced in the scale of
thousands of tons per year, it was concluded that a microreactor was not the
most suitable kind of reactor for the production of this chemical. Nevertheless,
the powder catalyst synthesized and the productivity obtained can be scaled up
in order to be used in a traditional packed-bed reactor.
The main results of both gas and liquid phase epoxidation can be found in
Table 4.3. It can be seen that the conversion of hydrogen peroxide is higher in
the gas phase reaction; however, the peroxide consumed is better utilized in the
liquid phase reaction. Considering that the synthesis of H2O2 is one of the most
expensive parts of the HPPO process, the best process would be the one that
converts the higher amount of peroxide with the highest selectivity, thus the
liquid phase reaction at lower space velocities seems to be the most suitable.
Page 114
Results and discussion. Results of the epoxidation of propene
101
Table 4.3: Summary of results of the epoxidation of propene with hydrogen peroxide in the gas and
in the liquid phase obtained in Chapters 2 and 3.
SV XH2O2 SH2O2 to PO SC3H6 to PO PO prod
ml gcat-1 h-1 % gPO gcat
-1 h-1
Gas phase 450000
(GHSV) 100 40 90 10
Liquid phase
200
(LHSV) 30 75 97 2
25 95 78 96 0.9
4.3.3 Experimental combination of plasma reactor and epoxidation
reactor (3)
The feasibility of combining both reactors into a single system was evaluated.
The DBD I reactor was mounted in the epoxidation setup, connected directly to
the H2, O2, He and C3H6 MFCs. Initial tests were carried out by feeding a
mixture of H2/O2 into a 96/4 molar ratio into the DBD reactor. The outlet
stream was bubbled through 5 ml of water contained in the capturing vessel in
order to adsorb all the produced H2O2.
4.3.4 Direct oxidation of propene in a plasma reactor (3)
The direct oxidation of ethylene to ethylene oxide (EO) in a DBD reactor was
attempted by Suttikul et al. [47] in the absence of any catalyst. In the study
several factors such as the feed position as well as the applied voltage, input
frequency and the ratio C2H4/O2 were analyzed. The highest EO yield achieved
was 7.5 %, with a selectivity of 34 %. Besides the epoxidation, other undesirable
reactions were observed, such as combustion, dehydrogenation, cracking and
coupling of C2H4.
Using the DBD I, developed in this study, the direct epoxidation of propene
with oxygen alone was evaluated. Initially a mixture of 90 vol.% C3H6 and
10 vol.% O2 was used, but achieving breakdown in this admixture required very
high applied powers for stable operation. This was avoided by adding He to the
admixture (C3H6/O2/He 2.5/2.5/90). The result was a mixture of multiple
carbon-containing products, such as PO, propane, CO, CO2, acetaldehyde,
Page 115
Chapter 4: An integrated microreactor for the epoxidation of propene
102
propanal, acetone, and others. Consequently, the selectivity to PO was minor.
Several factors should be adjusted in order to minimize the side reactions;
nevertheless, it would be very difficult to control the system in such a way that
the selectivity to PO would reach high values.
4.4 Integrated process: Process options (2)
The selection of one epoxidation option over the other for the integration with
the plasma reactor has to be done considering several factors, such as the
intermediate steps between the synthesis of hydrogen peroxide and its use in
the epoxidation, as well as the subsequent separation steps, required to purify
the synthesized PO. Therefore, this section will be focusing on the evaluation of
the overall combined process.
The first alternative process considers the synthesis of H2O2 in a DBD reactor
with a mixture of H2 and O2, like the process proposed by Zhao et al. [48], while
the second alternative studied considers a plasma where hydrogen peroxide is
produced from a mixture of Ar (or He) and water.
Gas phase epoxidation
A scheme of the proposed flow diagram for the integrated process with
epoxidation carried out in the gas phase can be seen in Figure 4.9. The
synthesis of hydrogen peroxide takes place in a DBD plasma reactor (Figure
4.9, (P-1)). A mixture of pure hydrogen and oxygen can be fed avoiding
explosive conditions. Therefore, the concentration of oxygen should be kept
below 6 %. Zhao et al. [16] developed a DBD reactor in which, using 4.8 % of
oxygen, up to 90 % O2 conversion was obtained with 69 % H2O2 selectivity.
Even though it was not possible to reproduce these results in this study, these
values are used as reference for the maximum amount of hydrogen peroxide
produced in the combined process when using hydrogen and oxygen. The outlet
of the plasma reactor consists of hydrogen peroxide vapor and water as well as
unreacted hydrogen and oxygen (stream B in Figure 4.9) which can be directly
fed to the epoxidation reactor together with propene. In the analysis of the gas
phase epoxidation it was determined that the residence time of hydrogen
peroxide vapor should be minimized in order to avoid decomposition. Therefore,
the distance between the plasma and the epoxidation reactors should be kept
as short as possible. Su et al. [22] proposed to create a single unit, where
propene is fed immediately after the peroxide formation and the two reactants
Page 116
Integrated process: Process options
103
meet over a bed of TS-1. It was also determined that an excess of propene
should be used to maintain the selectivity to PO higher than 90 %.
Figure 4.9: Gas phase integrated process. Production of H2O2 in a plasma reactor from a mixture of
hydrogen and oxygen, and gas phase epoxidation of propene. P-1 is the DBD reactor for the
synthesis of H2O2, R-1 is the epoxidation reactor, T-1 is the distillation tower where the light gases
are separated and recirculated to the plasma reactor. (2)
The epoxidation of propene takes place at 140 °C and atmospheric pressure. All
hydrogen peroxide is converted, either to PO or to oxygen and water; therefore,
there is no remaining H2O2 in the outlet (stream D). This is an advantage,
since, for safety reasons, peroxide should not enter in the PO purification steps.
The reason is that at high temperatures it decomposes, producing oxygen in a
not-controlled manner, which can cause safety problems [49]. PO is produced
with a propene selectivity of 90 %. Additionally, other carbon-containing by-
products are generated, like CO, CO2, acetaldehyde and propanal. The material
used for the epoxidation reactor should be chosen carefully. As it was explained
in Chapter 2, the decomposition of hydrogen peroxide is a surface reaction and
it is speeded up by metals like stainless steel or titanium, while quartz or
Teflon are more inert. Klemm et al. [50] developed a microstructured falling
film evaporator where H2O2 was evaporated at 130 °C. The material used in
R-1 T-1
Reaction Off-gas
H2O2+O2+H2+H2O
O2
H2
PO
O2
H2O
H2
C3H6
Propanal
Acetaldehyde
H2O
CO2
CO
O2
H2
C3H6
CO2
CO
PO
Propanal
Acetaldehyde
H2O
Plasma
reactor
C3H6
A
B
C
D
E
G
O2
C3H6
CO2
COH2 recycle
Hydrogen
purification
F
Raw PO for
purification
Page 117
Chapter 4: An integrated microreactor for the epoxidation of propene
104
that case was AlMg3, for which an initial self-passivation procedure under
reaction conditions was applied. The selection of specific materials plays an
important role in the total capital investment of the plant and should be taken
into account.
The light gases can be separated in a subsequent step by fractional distillation
(T-1), where hydrogen, propene, oxygen, CO and CO2 are removed from the tops
(stream E) and the heavier hydrocarbons, together with water, leave through
the bottoms (stream G). The off-gas consists of 95 % hydrogen, consequently, it
should be purified in order to be recycled as feed for the plasma reactor.
It can be concluded that the epoxidation of propene in the gas phase avoids the
intermediate capturing stage in which hydrogen peroxide is adsorbed into
methanol. Nevertheless, various separation stages are required after the
reactor to obtain commercial grade PO, including the purification of hydrogen
in order to be recycled to the plasma reactor, which is expensive. The recycle of
propene would also be more complicated more complicated than in the HPPO.
Liquid phase epoxidation
To analyze the possibility of combining the synthesis of hydrogen peroxide
vapor from hydrogen and oxygen with the liquid phase epoxidation of propene,
the same conditions for the plasma reactor as the ones from the previous
section will be considered. Following the results of Zhao et al. [16], a collector,
in which the produced hydrogen peroxide was adsorbed into methanol, was
employed. The concentration of the H2O2 fed to the epoxidation can be
regulated by adjusting the pre-discharge time of the plasma (before starting
operation) and the flow of methanol/peroxide/water leaving the collector. For
instance, if the concentration required is 5.4 wt.%, the flow that should be used
is 6.4 ml/h with a pre-discharge time of 7.5 h. The unreacted hydrogen and
oxygen are separated in the collector and recycled to the feed of the plasma
reactor (stream D in Figure 4.10). Before this stream is recycled, it should pass
through a condenser (C-1) in order to remove the traces of methanol, water and
H2O2.
The liquid stream, consisting of methanol, hydrogen peroxide and water
(stream E in Figure 4.10), together with an excess of propene, enters the
packed bed reactor, where the epoxidation takes place. The catalyst used is TS-
1 in pellets. To avoid high concentrations of hydrogen peroxide at the outlet of
the reactor, because of the safety concerns explained in the previous section, a
high conversion of the reactant should be ensured.
Page 118
Integrated process: Process options
105
Figure 4.10: Liquid phase integrated process. Production of H2O2 in a plasma reactor from a
mixture of hydrogen and oxygen and its used for the epoxidation of propene in the liquid phase. P-1
is the DBD reactor for the synthesis of H2O2, S-1 is the collector where H2O2 is adsorbed into
methanol, C-1 condenser where traces of methanol and H2O2 are removed from the gas stream, R-1
is the epoxidation reactor. (2)
The outlet of the epoxidation reactor (stream G, Figure 4.10) contains
methanol, propene, PO, water and unreacted hydrogen peroxide. Small
amounts of methyl ethers and propylene glycol are also present as by-products
of the epoxidation. In order to obtain commercial grade PO, several separation
steps should be applied. A similar separation scheme as the one of the HPPO
shown in Figure 4.1 can be applied after the reactor. Unreacted propene can be
recycled as well as methanol after purification.
The alternative of conducting the epoxidation of propene in the liquid phase
requires the additional step for adsorbing hydrogen peroxide into methanol.
However, this step is also used for the separation and recycling of unreacted
hydrogen and oxygen to the plasma reactor, which has to be performed in any
case. The amount of separation steps required after the epoxidation is higher.
On the other hand, the utilization of hydrogen peroxide is more than double
than that in the gas phase, which makes the process more efficient.
R-1
C3H6 recyccle
Methanol recycle
Reaction
Recycle O2 / H2
S-1
H2O2
capture
H2O2 + H2O
O2 + H2
O2
H2
Plasma
reactor
A
B
D C
E
C3H6
F
G
Methanol
PO
H2O2
O2
C3H6
H2O
1M2P
2M1P
PG
C-1Methanol
Methanol
Page 119
Chapter 4: An integrated microreactor for the epoxidation of propene
106
Synthesis of hydrogen peroxide with liquid water
The group of Locke [18] reported the possibility to synthesize hydrogen
peroxide by using a water-spray plasma reactor. In this system up to 20 ml/min
of water were sprayed in a gas flow of 2 l/min. The maximum productivity was
obtained with argon as carrier gas, reaching energy yields up to 81 g/kWh.
Considering the high concentration of water droplets in the gas stream, after
the plasma reactor, water will immediately condense. Therefore, the use of the
hydrogen peroxide synthesized with this method for the further epoxidation of
propene should be done in the liquid phase.
The main advantage is the fact that water is the only required reactant,
reducing the reactant costs. However, the H2O2 concentrations in water
reached are extremely low (0.002 wt.%). Furthermore, the use of water as
solvent for the epoxidation results in low conversions and selectivities to PO
[20, 51]. Liu et al. obtained 41 % H2O2 conversion with 21 % selectivity to PO
[52]. The low selectivity is due to the ring-opening reactions catalyzed by the
acidic conditions, generated by the presence of water. This also causes the
faster deactivation of the catalyst. An additional concentration step, where
H2O2 is concentrated in water and dissolved into methanol would be necessary.
The overall process would be inefficient.
Another option would be to use a dielectric reactor with vapor water (maximum
3 %), like the one described in this work (section 4.2.1.1). In that case, smaller
amounts of water are contained in the Ar (or He) stream. The hydrogen
peroxide produced and the unreacted water can be captured in methanol in the
condenser, like in the case of the DBD with H2 and O2. Argon or helium can be
recycled directly to the plasma reactor in a very efficient manner. Thereafter,
the epoxidation and all the necessary separation steps are the same as in
Figure 4.10. However, with this approach, there is still 10,000 times more
water than hydrogen peroxide in the gas stream, which makes the
concentration of H2O2 in a methanol stream challenging. Additionally, the
concentrations of hydrogen peroxide in the gas phase attained were 8 ppm with
a maximum energy efficiency of 0.12 g H2O2/kWh [42]. These values are so far
not efficient enough for a feasible process.
Page 120
Summarizing discussion
107
4.5 Summarizing discussion
4.5.1 Production of H2O2 in a microdischarge (1)
As seen from the results, the plasma sources investigated in this work are not
as energy efficient as some reported by literature (Table 4.4).
While it was possible to improve the understanding of the underlying processes
involved in the generation of H2O2 and to improve modeling tools, the high
yields projected remained unattainable. A selection of reasons for this is
discussed in the following.
The main loss processes of gas phase H2O2 in the plasma are electron
induced losses and the dissociation of OH in the bulk [42]. Electron
induced losses may be lower in other types of discharges, as suggested
by the peak in energy efficiency observed in the DBDs. While these
discharges are fundamentally different, it may be assumed that the loss
mechanisms do not change too much.
Low power in the DBD leads to fewer plasma filaments, which still
produce H2O2 sufficiently fast but due to their short lifetime, the
exposure of gas molecules to high electron densities is reduced.
The detection of gas phase H2O2 in the presence of large amounts of
water is challenging, as described in the methods sections of [24]. The
ex situ detection method applied here is suitable for small quantities
and has a high reproducibility. However, recently it was shown that a
continuous exposure to NO2 (which might be readily formed by air
leaking into the system) reverts the color change used for absorption in
this work [53]. Heating of the detection liquid similarly reverts the
coloring and might influence results, resulting in an underestimation of
the actual H2O2 productivity. While these effects have been minimized,
they highlight the challenges of determining small densities of H2O2.
Condensation of excess water in the effluent system has been avoided,
as the presence of a liquid could significantly influence the detection.
While other points may be added to this list, the key element seems to be the
measurement of the plasma dissipated power. As discussed, it differs from the
total applied power and using it for comparison of fundamentally different
discharges is does not give much information, since the system inherent losses
should also be included. Unfortunately, it is often not clear from literature if
this has been taken into consideration (especially in cases of extremely low or
Page 121
Chapter 4: An integrated microreactor for the epoxidation of propene
108
high energy efficiencies). In some cases this might be straightforward; however,
in the comparably simple sources presented here it must be done carefully as
the errors in energy efficiencies measurements, especially at low powers, are
very large.
Table 4.4: Summary of energy efficiencies of hydrogen peroxide production methods in gas phase
plasmas (adapted from [42])
Gas mixture Discharge type η (g/kWh) Reference
Ar + H2O DBD 1.7 [37]
Ar + H2O DBD 0.14 [54]
Ar / water spray Pulsed Gliding Arc 80.0 [18]
Steam MW + supersonic
expansion 24.0 [55]
Gas (H2 + O2) DBD 80.0 [16]
Gas (H2 + O2) DBD 134.0 [17]
this work
He + H2O APGD 0.12 [42]
Ar + H2O DBD 1.2 [24], [45]
In addition, scaling up setups has to be done carefully as the electrical system
needs to be adapted accordingly. As seen from work on an ozone reactor [56],
the energy efficiency of the production is not expected to improve if the plasma
dissipated power is measured appropriately.
4.5.2 Epoxidation of propene (2)
Coupled with the plasma reactor as source of H2O2, two alternatives for the
epoxidation of propene were investigated: the gas and the liquid phase
reaction. Considering the experimental results previously shown, the main
challenge with this system is the decomposition of hydrogen peroxide at the
high operational temperatures, which is highly dependent on the materials
used for reactor and piping. Therefore, a special material should be chosen for
Page 122
Summarizing discussion
109
the reactor, which would increase the capital costs of the plant. Furthermore,
the conversion of H2O2 was complete in all cases studied, with a maximum
selectivity to PO of 40 %. This implies that less than half of the amount of H2O2
supplied by the plasma source is leading to production of PO.
Finally, special care should be paid to condensation of hydrogen peroxide vapor.
The existence of cold spots would lead to condensation, favoring the
decomposition of hydrogen peroxide due to the higher contact times. On the
other hand, this process benefits from the direct contact of the synthesized
hydrogen peroxide with the propene, without the need of intermediate
capturing steps such as in the case of the liquid phase process.
The evaluation of the liquid phase epoxidation in a microreactor proved to
produce PO very selectively based on propene (> 95 %). The selectivity of
hydrogen peroxide to PO was higher than 80 %. Methanol was used as a
solvent and, in agreement with literature, produced a limited amount of
solvent-related by-products [57]. It was concluded that given the high demand
of PO and considering the productivity values obtained, a microreactor would
not be capable of satisfying the production requirements of such a bulk
chemical.
4.5.3 Recommendations and Economic Evaluation (3)
Considering all these facts, it was determined that the most efficient
epoxidation strategy in combination with using a plasma reactor as H2O2
source would be the liquid phase epoxidation. The synthesis of hydrogen
peroxide is one of the main costs of the process, so the best choice should be the
one that utilizes the reactant in the most efficient manner.
The most energy efficient H2O2 production strategy in this work is using humid
Ar plasmas, as they have both high OH densities and yields. Residence time
might be of importance to improve yields, thus higher gas feed flows and
different geometries should be considered. This might further improve
efficiency if combined with larger plasma volumes for treating more gas
simultaneously. The increased power needed to sustain larger discharges
would, however, put a limitation on gains achieved by increasing the plasma
size.
Despite these steps, the energy efficiency of the peroxide production is not
expected to raise two orders of magnitude. Results from the DBDs suggest that
Page 123
Chapter 4: An integrated microreactor for the epoxidation of propene
110
using a different type of discharge, such as a corona like discharge above a
liquid water layer, might be a suitable step to consider. These types of
discharges are filamentary, thus likely both energy efficient and with an active
chemistry. The presence of a liquid water phase in direct contact with the
plasma plays a significant role in the formation of complex molecules on the
phase boundary. In addition, issues with condensation of the plasma effluent
would be avoided while offering a transport medium for reaction products.
However, the plasma chemistry of the processes involved is poorly understood.
The analysis of the overall integrated process performed in section 4.1 proved
that, despite requiring an intermediate capturing step to absorb H2O2 in
methanol, it actually benefits from the recycling of the unreacted feed gases of
the plasma source. If the feed gas enters the epoxidation unit, further
separation would become more complex in the presence of other gases like
propene, CO or CO2. If the plasma is operated with humid Ar, liquid phase
epoxidation would still be the best option.
Economic evaluation
As one of the project aims is to determine whether the integrated process is
economically feasible, the following section is intended to perform a simple
economic evaluation of the previously defined processes.
While this is a simple estimate, a more accurate analysis would require an
estimation of the size of every unit as well as the energy input required for
each separation step.
This feasibility evaluation is based on the amount and price of the reactants
required to operate a 100 kton/year PO production process using the integrated
system described above. Based on the observations made earlier, the liquid
phase epoxidation of propene is combined with the synthesis of hydrogen
peroxide in a DBD or a APGD reactor, operated with pure H2/O2 and humid Ar
admixtures. The calculations were done taking the following considerations
into account:
For the DBD reactor operated with H2/O2 mixtures, a feed of 96 vol.%
H2 and 4 vol.% O2 was assumed. As reported by Zhao et al. [16], 90 %
O2 reacts, with 69 % selectivity to H2O2. 99.9 % of the unreacted H2 and
O2 are recycled and mixed with the feed of the plasma reactor.
The epoxidation reaction takes place with high conversion and
selectivity values. Thus, 97 % H2O2 fed reacts with 97 % selectivity to
Page 124
Summarizing discussion
111
PO. The unreacted propene is also recirculated to the epoxidation
reactor with 85 % efficiency. 99.8 % of the methanol used as a solvent
can be recycled to the epoxidation reactor.
The plasma reactor described by Locke et al. [18] operates with 2 l/min
of Ar and 20 ml/min of water sprayed. Using this ratio, the amount of
both chemicals required for producing 100 kton/year PO was calculated.
It was assumed that, since Ar does not react in the plasma, all the gas
fed can be recycled to the plasma reactor after passing through the
capturing vessel. Therefore, no costs for Ar have been taken into
account in these calculations.
Table 4.5: Cost of reactants and products for the production of 100 kton/year PO using the
combined process, with the epoxidation performed in the liquid phase.
H2 O2 propene methanol
H2O2
required
kg/h 0.6 103 9.7 103 10.1 103 22 7.1 103
$/h(a) 0.75 103 0.97 103 15.1 103 9
[$/h] of product Commercial(a) Zhao (b) Locke (c) DBD II (d) APGD (d)
H2O2 10.6 103 5.6 103 6.6 103 438.5 103 3769 103
COSTS (FOR PO) 25.7 103 (e) 20.7 103 21.7 103 453.7 103 >108
REVENUE (PO
SOLD) 25.6 103 25.6 103 25.6 103 25.6 103 25.6 103
PROFIT -0.1 103 4.9 103 3.9 103 -428 103 -3.7 106
(a) Prices for commercially available reactants obtained from [58]
(b) Considering price of energy in the Netherlands of 0.1 €/kWh [59] and assuming the
energy efficiency reported by Zhao et al. [17] of 134 g/kWh.
(c) Energy efficiency reported by Locke et al. [18]
(d) With energy efficiencies obtained using the sources in this work.
(e) Price of PO when the H2O2 required is purchased commercially.
From the calculations in Table 4.5 it can be observed that, as explained in the
introduction, the use of commercially available H2O2 (second column) brings no
revenue, since the price of the overall process is equivalent to the benefits
Page 125
Chapter 4: An integrated microreactor for the epoxidation of propene
112
obtained when selling the PO produced. On the other hand, the production of
PO by synthesizing hydrogen peroxide in a plasma reactor would not be
significantly more profitable than buying the required H2O2, even under the
assumptions made here and considering the highest energy efficiencies
reported in literature. The use of a DBD with a mixture of H2/O2 [16] produces
similar results as when only Ar and water are used in a pulsed gliding arc [18],
due to the higher energy efficiencies reported by the former study.
It should be noted that following more recent work from the same group of
Zhao et al. [17, 60], where the reactor is described in more detail, it is unclear
how such high efficiencies were obtained. When upscaling the physical
dimensions of both DBDs used here to the dimensions reported, at least one
order of magnitude difference in power can be expected. However, larger
volume does not lead to higher energy efficiencies as seen in [45], nor can it be
expected that operating several reactors in parallel would affect the energy
efficiency of the peroxide production.
On the other hand, while the work of Locke et al. [18] seems almost just as
economical as the approach of Zhao et al. [17], it is using an arc in a water
vapor spray, capturing H2O2 in a liquid H2O phase. However, this would lead to
difficulties for the epoxidation process as the selectivity of H2O2 to PO using
H2O as a medium is only around 20%, while using methanol it is significantly
higher and could be expected to be around 97%. And additional separation step
to separate the H2O2 from the H2O and dissolving it in methanol would make
this approach unfeasible.
In order to use one of the DBDs as H2O2 source with water as only reactant, an
energy efficiency of around 50 g/kWh would be necessary for a breakeven,
balancing investment costs. The thermodynamical limit of producing H2O2 from
water using the enthalpy of the reaction
2 2 2 2 2H O H O H O H Eq. 4.11
at standard conditions is given by 3.2 eV /molecule or 400 g/kWh [61]. It seems
reasonable that going beyond 50 g/kWh is possible using water as a source to
form H2O2 using different discharges, but not with the design that has been
chosen in this work. It seems that the presence of a liquid phase close to the
plasma effluent further aids the formation of H2O2 at the phase boundary, and
efficiencies of discharges in direct contact with water support this argument.
Page 126
Conclusions
113
4.6 Conclusions (3)
It can be concluded that the integrated system would not be economically
feasible for its industrial implementation with the processes presented here. It
has been shown that hydrogen peroxide can be produced from water vapor in a
plasma, which would significantly reduce the reactant costs in comparison with
the anthraquinone and the direct synthesis processes. However, the energy
efficiencies of the sources investigated here are still not high enough for
making the plasma synthesis competitive. The epoxidation of propene with
aqueous hydrogen peroxide is a selective reaction in the liquid phase and has
already been implemented industrially. The combination with the synthesis of
hydrogen peroxide in a plasma reactor would be feasible. Yet, propene oxide is
a bulk chemical with low added value, which makes the revenue of the
integrated process economically not favorable. On the other hand there is
considerable potential for the combination of the plasma reactor with the
synthesis of a chemical with higher added value, such as pharmaceuticals or
fine chemicals that could compensate for the price of the extra energy required.
The benefit of such a process would be the high purity of the H2O2 synthesized
and the fact that no catalyst is required, limiting the further separation steps.
References
[1] http://www.prweb.com/releases/2013/1/prweb10344181.htm, 2013 (accessed
August 2014).
[2] T.A. Nijhuis, M. Makkee, J.A. Moulijn, B.M. Weckhuysen, Ind. Eng. Chem.
Res. 45 (2006) 3447-3459.
[3] G. Goor, J. Glenneberg, S. Jacobi, Hydrogen Peroxide, Ullmann's
Encyclopedia of Industrial Chemistry, Wiley-VCH Verlag GmbH & Co. KGaA,
2000.
[4] V. Russo, R. Tesser, E. Santacesaria, M. Di Serio, Ind. Eng. Chem. Res. 52
(2013) 1168-1178.
[5] P. Bassler, H.G. Gobbel, M. Weidenbach, Chem. Eng. Trans. 21 (2010) 571-
576.
[6] http://corporate.evonik.com/en/company/locations/location-asia/pages/skc-
evonik-peroxide-korea-co-ltd.aspx, 2011 (accessed August 2014).
[7] J.M. Campos-Martin, G. Blanco-Brieva, J.L.G. Fierro, Angew. Chem., Int.
Ed. 45 (2006) 6962-6984.
Page 127
Chapter 4: An integrated microreactor for the epoxidation of propene
114
[8] Q. Wang, I. Vural Gürsel, M. Shang, V. Hessel, Chem. Eng. J. 234 (2013)
300-311.
[9] P. Landon, P.J. Collier, A.J. Papworth, C.J. Kiely, G.J. Hutchings, Chem.
Commun. (2002) 2058-2059.
[10] J. Garcia-Serna, T. Moreno, P. Biasi, M.J. Cocero, J.-P. Mikkola, T.O.
Salmi, Green Chem. 16 (2014) 2320-2343.
[11] U. Kogelschatz, IEEE Trans. Plasma Sci. 30 (2002) 1400-1408.
[12] U. Kogelschatz, B. Eliasson, W. Egli, J. Phys IV France 7 4 (1997) 47-66.
[13] S. Hofmann, B.V. Gessel, T. Verreycken, P. Bruggeman, Plasma Sources
Sci. Technol. (2011).
[14] A. Schuetze, J.Y. Jeong, S.E. Babayan, J. Park, G.S. Selwyn, R.F. Hicks,
IEEE Transactions on Plasma Science 26 (1998) 1685-1694.
[15] B.R. Locke, S. Kai-Yuan, Plasma Sources Sci. Technol. 20 (2011) 034006.
[16] J.L. Zhao, J.C. Zhou, J. Su, H.C. Guo, X.S. Wang, W.M. Gong, AIChE J. 53
(2007) 3204-3209.
[17] J.L. Zhao, J.C. Zhou, J. Su, H.C. Guo, X.S. Wang, W.M. Gong, Plasma Sci.
Technol. 11 (2009) 181-186.
[18] R. Burlica, K.Y. Shih, B.R. Locke, Ind. Eng. Chem. Res. 49 (2010) 6342-
6349.
[19] D.X. Liu, P. Bruggeman, F. Iza, M.Z. Rong, M.G. Kong, Plasma Sources
Sci. Technol. 19 (2010) 025018-025018.
[20] M.G. Clerici, G. Bellussi, U. Romano, J. Catal. 129 (1991) 159-167.
[21] K. Yube, M. Furuta, N. Aoki, K. Mae, Appl. Catal., A 327 (2007) 278-286.
[22] J. Su, J. Zhou, C. Liu, X. Wang, H. Guo, Chin. J. Catal. 31 (2010) 1195-
1199.
[23] E. Klemm, E. Dietzsch, T. Schwarz, T. Kruppa, A.L. de Oliveira, F. Becker,
G. Markowz, S. Schirrmeister, R. Schutte, K.J. Caspary, F. Schuth, D. Honicke,
Ind. Eng. Chem. Res. 47 (2008) 2086-2090.
[24] C.A. Vasko, In preparation, Technische Universiteit Eindhoven, 2015.
(PhD Thesis).
[25] R.F.P. Nogueira, M.C. Oliveira, W.C. Paterlini, Talanta 66 (2005) 86-91.
[26] P. Bruggeman, F. Iza, P. Guns, D. Lauwers, M.G. Kong, Y.A. Gonzalvo, C.
Leys, D.C. Schram, Plasma Sources Sci. Technol. 19 (2010) 015016-015016.
[27] P. Bruggeman, F. Iza, D.l. Lauwers, Y.A. Gonzalvo, J. Phys. D: Appl. Phys.
43 (2010) 12003-12003.
[28] F. Iza, J. Lee, M. Kong, Phys. Rev. Lett. 99 (2007) 075004-075004.
Page 128
References
115
[29] N. Knake, S. Reuter, K. Niemi, V. Schulz-von der Gathen, J. Winter, J.
Phys. D: Appl. Phys. 41 (2008) 194006-194006.
[30] W. Siemens, Ann. Phys.-Chem. 178 (1857) 66-122.
[31] U. Kogelschatz, APP Spring Meeting Bad Honnef (2001).
[32] H.E. Wagner, R. Brandenburg, K.V. Kozlov, A. Sonnenfeld, P. Michel, J.F.
Behnke, Vacuum 71 (2003) 417-436.
[33] T.C. Manley, T. Electrochem. Soc. 84 (1943) 450-460.
[34] C.D. Wagner, R.H. Smith, E.D. Peters, Anal. Chem. 19 (1947) 976-979.
[35] W.C. Schumb, C.N. Satterfield, R.L. Wentworth, Hydrogen Peroxide,
Reinhold Publishing Corporation, New York, 1955.
[36] P.J. Brandhuber, G. Korshin, Methods for the Detection of Residual
Concentrations of Hydrogen Peroxide in Advanced Oxidation Processes,
WateReuse Foundation, 2009.
[37] B. Dodet, E. Odic, A. Goldman, M. Goldman, D. Renard, J. Adv. Oxid.
Technol. 8 (2005) 91-97.
[38] C.B. Khouw, C.B. Dartt, J.A. Labinger, M.E. Davis, J. Catal. 149 (1994)
195-205.
[39] A.J.H.P. van der Pol, J.H.C. van Hooff, Appl. Catal., A 106 (1993) 97-113.
[40] R. Joseph, T. Ravindranathan, A. Sudalai, Tetrahedron Lett. 36 (1995)
1903-1904.
[41] M.G. Clerici, Appl. Catal., A 68 (1991) 249-261.
[42] C.A. Vasko, D.X. Liu, E.M. van Veldhuizen, F. Iza, P.J. Bruggeman,
Plasma Chem. Plasma Process. 34 (2014) 1081-1099.
[43] J.C. Zhou, H.C. Guo, X.S. Wang, M.X. Guo, J.L. Zhao, L.X. Chen, W.M.
Gong, Chem. Commun. (2005) 1631-1633.
[44] G. Dilecce, S.D. Benedictis, Plasma Phys. Controlled Fusion 53 (2011)
124006-124006.
[45] L.P.T. Schepers, Characterisation of Hydrogen Peroxide Production in a
Cold Atmospheric Pressure Dielectric Barrier Discharge, Technische
Universiteit Eindhoven, 2013. (Master Thesis).
[46] W.S. Lee, M.C. Akatay, E.A. Stach, F.H. Ribeiro, W.N. Delgass, J. Catal.
308 (2013) 98-113.
[47] T. Suttikul, C. Tongurai, H. Sekiguchi, S. Chavadej, Plasma Chem. Plasma
Process. 32 (2012) 1169-1188.
[48] Z. Zhang, J. Kang, Y. Wang, React. Kinet. Catal. Lett. 92 (2007) 49-54.
Page 129
Chapter 4: An integrated microreactor for the epoxidation of propene
116
[49] G. Blanco-Brieva, M.P. de Frutos-Escrig, H. Martín, J.M. Campos-Martin,
J.L.G. Fierro, Catal. Today 187 (2012) 168-172.
[50] E. Klemm, G. Mathivanan, T. Schwarz, S. Schirrmeister, Chem. Eng.
Process. 50 (2011) 1010-1016.
[51] M.G. Clerici, Oil Gas Eur. Mag. 32 (2006) 77-82.
[52] X. Liu, X. Wang, X. Guo, G. Li, Catal. Today 93-95 (2004) 505-509.
[53] M.S.A. Galil, Mahadevaiah, M.S.Y. Kumar, G. Nagendrappa, Spectrochim.
Acta, Part A 67 (2007) 76-82.
[54] M.J. Kirkpatrick, B. Dodet, E. Odic, Int. J. Plasma Env. Sci. Tech. 1 (2007)
96-101.
[55] A.F. Gutsol, V.K. Zhivotov, B.V. Potapkin, V.D. Rusanov, High Energy
Chem. 26 (1992) 228-228.
[56] L. Grabowski, Pulsed Corona in air for water treatment, Technische
Universiteit Eindhoven, 2006. (PhD Thesis).
[57] G. Langhendries, D.E. De Vos, G.V. Baron, P.A. Jacobs, J. Catal. 187
(1999) 453-463.
[58] http://www.icis.com/chemicals/channel-info-chemicals-a-z/, 2014 (accessed
21/07/2014).
[59] European Commission, Energy prices and costs in Europe, 2014.
[60] Y. Yi, J. Zhou, H. Guo, J. Zhao, J. Su, L. Wang, X. Wang, W. Gong, Angew.
Chem., Int. Ed. 52 (2013) 8446-8449.
[61] A. Fridman, Plasma Chemistry, Cambridge University Press, New York,
2008.
Page 130
5 Publication of this chapter is under preparation.
Abstract
A kinetic study of the epoxidation of propene with molecular oxygen and water
in the gas phase has been carried out. Two Au-Ti catalysts were evaluated:
Au/TS-1 and Au/Ti-SiO2. It was observed that Au/TS-1 promoted by Cs is active
for the reaction, producing propene oxide (PO) and acrolein almost in a one to
one ratio. On the other hand, Au/Ti-SiO2 produced acrolein with almost 100 %
selectivity when no hydrogen was present. The difference in activity is a result
of the presence of alkali ions and dispersed Ti atoms in close proximity to Au
nanoparticles (<2 nm). Water in the gas stream is essential for the synthesis of
OOH* species that are the active species in the epoxidation. A kinetic model
was developed to understand the mechanism. It was determined that an excess
of oxygen and water is favorable for the PO/acrolein ratio, while propene had a
slight detrimental effect.
Kinetics of the selective
oxidation of propene
with O2 over Au-Ti
catalyst in the presence
of water
Page 131
Chapter 5: Kinetics of the selective oxidation of propene over Au-Ti
118
5.1 Introduction
The discovery that, over a silver catalyst, oxygen could be used as reactant for
the direct epoxidation of ethylene to ethylene oxide (Eq. 5.1) represented a big
breakthrough in industry. Initially, this important bulk chemical was
synthesized via the chlorohydrin process, which was rapidly substituted by the
direct synthesis, due to the elimination of the need for chlorine and a
significant reduction of the operating costs [1]. This process has been used
industrially since 1940, which gave an important impulse to the industry of
ethylene oxide [2]. Unfortunately, the attempts to carry out the direct
epoxidation of propene with molecular oxygen alone proved to be not so
successful. The selectivity to propene oxide is very limited because the weaker
allylic C-H bond of propene is preferentially attacked, producing acrolein or
resulting in combustion directly to CO2 [3]. It should be noted that acrolein is
also a highly demanded bulk chemical. It can be commercialized in isolated
form for the production of methionine, which is an essential amino acid, a
supplement in animal feed. But its production is even higher in the synthesis of
acrylic acid, where the acrolein is further oxidized over a heterogeneous
catalyst. This chemical is industrially produced via the oxidation of propene
with air over a bismuth molybdate-based catalyst, obtaining propene
conversions from 93 to 98 % and acrolein selectivities ranging from 85 to 90 %
[4]. Despite the high conversions and selectivities, it would be interesting to
find a process that avoids the use of heavy metal compounds and still shows
high selectivity [5].
When gold nanoparticles deposited on a Ti-containing support are used, and H2
is co-fed as a sacrificial reductant together with oxygen, the epoxidation of
propene can take place with high selectivity to PO, thereby producing water as
only by-product (Eq. 5.2) [6, 7]. Hayashi et al. published for the first time in
1998 that the epoxidation of propene could be performed over Au/TiO2. The
selectivity to the epoxide was very high (>90 %) at temperatures below 100 °C,
but the conversion of propene remained rather low and the catalyst was
deactivated very fast [6-8]. On the other hand, if titanium in tetrahedral
position is highly dispersed on a silica matrix, the catalyst has greater stability
and the PO yield increases significantly [7]. Therefore, supports like
mesoporous Ti-SiO2 [8-11], zeolite TS-1 [12-14] or Ti-SBA15 [15, 16] have been
widely analyzed in the reaction of H2 and O2 with C3H6. Major improvements
have been made for these catalysts since they were first used in the epoxidation
of propene. The results have evolved from a propene conversion of 1.1 % and a
Page 132
Introduction
119
hydrogen efficiency of 35 % [6] to maximum conversions of 8.8 % (with around
19 % hydrogen efficiency and 81 % PO selectivity) [17] and hydrogen
efficiencies of 47 % (6 % propene conversion and 88 % PO selectivity) [18].
Values that are approaching the initial industrial targets of 10 % C3H6
conversion, PO selectivity of 90 % and H2 efficiency of 50 % [19, 20].
Eq. 5.1
Eq. 5.2
The major issue for these catalysts is, nevertheless, the low hydrogen efficiency.
Currently around 3 molecules of water are typically produced per molecule of
PO, making the process so far not efficient enough [3, 9, 10]. In addition,
hydrogen and oxygen can form explosive mixtures over a wide range of
concentrations, limiting the operating spectrum to a high extent. Therefore, by
not using hydrogen and obtaining a catalyst capable of catalyzing selectively
the epoxidation of propene with oxygen alone would represent an ideal
alternative, avoiding the biggest problems presented by the reaction with
H2/O2. And last, but not least, the cost would be highly reduced, since oxygen
can be directly obtained from the air, and a situation similar to that of ethylene
oxide could be reached. The search for a suitable catalyst has been focused in
the use of coinage metals, such as Cu mixed with silica [21, 22] or other oxides
[23, 24], or silver-based catalysts [25, 26]. The use of gold catalysts for the
direct epoxidation with molecular oxygen has also been explored, considering
the high activity shown for the reaction with hydrogen and oxygen. In 2009,
Ojeda and Iglesia [27] reported the possibility of using water instead of
hydrogen for the epoxidation of propene over Au/TiO2 even though it was with
low PO selectivity and propene conversion (<0.1 %). At the same time, the
group of Haruta [28] published the use of Au nanoparticles deposited on TS-1
that had been previously treated with alkaline salts, to carry out the
epoxidation with O2/H2O mixtures. They successfully produced PO with 0.88 %
propene conversion and around 50 % PO selectivity. In a later work [29], the
same group investigated the influence of the presence of alkali ions in the
system and their role in the stabilization of molecular oxygen over the gold
nanoparticles. According to their experimental results, four conditions should
H
H
H
H
+ H
O
HH
H1/2 O2
Ag
+ O2 + H
2
Au-TiCH2 CH3
H2O+CH3
O
Page 133
Chapter 5: Kinetics of the selective oxidation of propene over Au-Ti
120
be fulfilled for the reaction to occur: 1. Au NPs smaller than 2 nm, 2. presence
of basic salts that act as promoter, 3. water in the gas feed, and 4. dispersed Ti
sites. The proposed mechanism for the epoxidation of propene with molecular
oxygen and water is depicted in Figure 5.1. Also in 2009, Lee et al. [30] were
capable of obtaining PO from the direct epoxidation with O2 using Au6-10
clusters over three-monolayer Al2O3 grown by atomic laser deposition on silicon
wafers. They clearly observed that by introducing water in the gas stream the
PO selectivity increased from 30 to 90 %. However, the catalyst preparation
technique is so complex that the scaling up for industrial production would be
very challenging.
Figure 5.1: Possible mechanistic pathway for the epoxidation of propene with molecular oxygen and
water over Au/TS-1 promoted with KOH proposed by Huang et al. [29]. The mechanism occurs as
follows: 1. Reversible transfer of an electron between OH-and Au cluster. 2. Capture of the electron
by O2 and stabilization of O2- on the Au surface by the K+ cation. 3. Heterolytic dissociation of
water. The reaction between H+ and O2- results in OOH* species and OH-. 4. Transfer of OOH*
species to the neighboring Ti to form Ti-OOH. 5. Reaction between Ti-OOH and propene to form
PO, leaving OH. 6. Reaction between OH* and Ti-OH to form water and an O* radical. 7. Non
selective oxidation of propene by the O* radical, resulting in PO, acrolein and CO2. Adapted from
[29].
Au
Ti4+
Au
Ti4+
Au
Ti4+
Au
Ti4+
Au
Ti4+
Au
Ti4+
OH-
K+
OH*
K+e-
O2
1 2OH*
K+ O2-
H2O
OH*
K+OOH*
-OH
3
4OH*
K+
O
-OH OH
C3H6
OH*
K+
OH
-OH
PO
5
6
Au
Ti4+
K+-OH
O*
C3H6
H2O
7Au
Ti4+
K+-OH
PO
Acrolein
CO2
Page 134
Introduction
121
Despite all the aforementioned efforts to improve the catalyst used, no study
has been made to try to understand the kinetics of the Au-Ti system in the
epoxidation of propene with molecular oxygen alone. In the present work the
influence of parameters such as concentration of reactants, temperature and
residence time will be evaluated in two types of Au-Ti catalysts: Au/Ti-SiO2 and
Au/TS-1. The high dispersion of Ti atoms in TS-1 makes it an ideal support for
the epoxidation of propene, while, Ti-SiO2 is a very stable catalyst, well defined
and with easily controllable composition. The kinetic and mechanistic
understanding developed in this study can be used for further catalyst
improvements.
5.2 Experimental
5.2.1 Catalyst synthesis and characterization
Two types of Au-Ti catalyst were investigated in this study: Au/Ti-SiO2 and
Au/TS-1. Even though the elemental composition is similar, their properties
and synthesis methods are different. For the sake of comparison, Au/SiO2,
Au/TiO2 and Au/C were also synthesized and tested.
Ti-SiO2 was prepared in a single batch, following the method described by
Nijhuis et al. [31]. Titanium was grafted on silica by dispersing 10 g dried silica
(Davisil, 643, 300 m2/g, pore size 150 Å, pore volume 1.15 cm2/g) in 250 ml of
anhydrous 2-propanol (max 0.005 % H2O, Merk) in a glove box under N2
atmosphere. After stirring for 10 minutes, 0.7 ml tetraethylorthotitanate
(TEOT, Aldrich, 97 %) was added to the slurry and the stirring was maintained
for 30 minutes longer. The 2-propanol was evaporated under N2 atmosphere in
a rotating evaporator. The resulting powder support was dried overnight in air
at 120 °C, followed by calcinations, first at 120 °C (heating 5 °C /min) during 2
hours, and then at 600 °C (heating 10 °C /min) for 4 hours.
The TiO2 used was commercially available Degussa P25 (primarily anatase,
surface area approximately 50 m2/g), SiO2 was the same as the one employed
for the Ti grafting (Davisil 643) and the graphite was HSA from Johnson
Matthey. These supports were used as they were supplied.
TS-1 was prepared by hydrothermal synthesis, following a method similar to
the one described by Chen et al. [32]. Two different Si/Ti ratios (53 and 100)
were used to be able to determine the influence of the Ti loading. For Si/Ti = 53,
an aliquot of 1.18 g (0.626 g for Si/Ti=100) of titanium butoxide (TBOT,
Page 135
Chapter 5: Kinetics of the selective oxidation of propene over Au-Ti
122
Aldrich) was mixed at 0 °C with 38.4 g of tetraethylorthosilicate (TEOS,
Aldrich) and stirred for 30 minutes. Afterwards, 30 g of aqueous
tetrapropylammonium hydroxide (TPAOH, Merck, 40 % aq.sol.), previously
mixed with 30 g of water, was added dropwise while stirring and temperature
were kept for another half an hour. The solution was then heated in an oil bath
at 60 °C and this temperature was maintained for 2 hours. The crystallization
was carried out in a PEEK-lined stainless steel autoclave at 175 °C for 48 h.
The resulting white powder was separated by centrifugation, washed three
times with distilled water, dried at 120 °C overnight and calcined at 540 °C for
6 hours.
The gold nanoparticles were deposited by a deposition-precipitation method. In
this case, the procedure followed for Au/Ti-SiO2 and Au/TS-1 was different due
to the hydrophobicity of the latter and the relative difficulty to deposit gold
over TS-1 [14].
Gold was deposited on Ti-SiO2 by the deposition-precipitation method described
by Chen et al. [10]. In a typical synthesis, 2 g of support were dispersed in
100 ml of deionized water and the pH was adjusted between 9.4 and 9.5 by
adding a solution of 2.5 wt. % NH3 dropwise. The required amount of gold for
each loading was introduced by dissolving aurochloric acid (HAuCl4, Aldrich,
30 wt. % aqueous solution) in approximately 20 ml of deionized water and
adding it dropwise with the help of a burette during 15 minutes. The
suspension was stirred for 1 hour, during which the pH was controlled by small
additions of NH3. Afterwards, the yellowish powder was collected by filtration
and washed with plenty of deionized water three times. After drying it
overnight at 80 °C, the catalyst was calcined in two steps, first during 2 hours
at 120 °C (5 °C/min) and then at 400 °C (heating 10 °C /min) for 4 hours. The
catalysts prepared using this method are denoted as x-Au/Ti-SiO2, where x
stands for the nominal gold loading in each sample. For Au/Ti-SiO2, the gold
loading was varied between 0.05 wt. % Au and 2 wt. % Au, while for Au/TiO2,
Au/SiO2 and Au/C, the catalyst prepared contained 1 wt. % of gold.
In the deposition-precipitation method used for TS-1 [14, 33], 2 grams of the
synthesized zeolite were suspended in 40 ml of water that had been previously
mixed with the required amount of aurochloric acid (HAuCl4, Aldrich, 30 wt. %
aqueous solution) to reach the desired nominal gold loading. The suspension
was vigorously stirred for 30 minutes, after which the pH was adjusted to 7.3
by adding dropwise a 1 M solution of carbonate salts (K2CO3 or Cs2CO3,
depending on the experiment). The stirring was maintained for 5 hours.
Page 136
Experimental
123
Thereafter, the catalyst was centrifuged and washed 2 times with distilled
water. The resulting powder was dried overnight in a vacuum oven at room
temperature. Au/TS-1 was activated by increasing the temperature from room
temperature to 200 °C with a ramp of 0.5 °C/min and adding a mixture of
H2/O2/C3H6 with a molar ratio of 10/10/10 and He as inert. Different gold
loadings were tested for this catalyst from 5.5 to 0.625 wt. % Au (nominal gold
loading = grams of gold in solution/grams of suspended catalyst·100). The
designation of the catalysts containing TS-1 as support was done as y-Au/TS-
1(r)-a, where y stands for the nominal gold loading (grams of gold added to the
DP solution with respect to the grams of support in suspension*100), r
represents the real Si/Ti ratio determined by ICP for each support and a shows
the alkali ion used during the deposition precipitation. For instance, 2.5-Au/TS-
1(85)-Cs would indicate a catalyst where 2.5 grams of Au per gram of support
were used during DP with Cs2CO3 as precipitation agent and the actual Si/Ti
ratio of the TS-1 employed was 85. This method was also used to prepare an
additional Ti-SiO2 for comparison purposes and with the aim of determining
the importance of the synthesis method and the presence of alkali ions in the
epoxidation reaction. It should be noted that even though this method is
commonly called deposition-precipitation, since the biggest part of the gold
remains in solution and is not incorporated into the catalyst, it could be
considered as a kind of impregnation.
The elemental composition of the catalysts was analyzed by inductively coupled
plasma optical emission spectrometry (ICP-OES) in a Spectra CirosCCD system
after performing cold acid digestion treatment of the samples with a mixture of
HF, HCl and HNO3 [34]. The samples were analyzed for Ti and Au content. The
determination of cesium was done by Atomic absorption flame emission
spectroscopy, AAS, (Shimadzu AA-6200), since the determination by ICP-OES
proved to be problematic, due to the high detection limit for the element (40
mg/L for Cs [35]). The size distribution of the Au nanoparticles over each
support was calculated by measuring all visible particles on around 30 pictures
of Transmission Electron Microscopy. The crystallinity of the synthesized TS-1
was evaluated by X-Ray Diffraction (Kratos AXIS Ultra spectrometer, equipped
with a monochromatic X-ray source and a delay-line detector (DLD). Spectra
were obtained using the aluminium anode (Al K = 1486.6 eV) operating at
150 W. Finally, the coordination state of the titanium atoms was examined by
diffuse reflectance UV–visible (DR UV–vis) spectra, making use of a Shimadzu
UV-2401PC spectrometer and having BaSO4 as a reference.
Page 137
Chapter 5: Kinetics of the selective oxidation of propene over Au-Ti
124
5.2.2 Catalytic testing
The catalytic experiments were performed in a continuous flow setup
containing a quartz reactor tube with a packed bed of catalyst and an inner
diameter of 4 mm, placed inside a tubular oven. The reaction products were
measured every 5 minutes by an online Compact GC (Interscience B.V.)
equipped with a Rt-Q-Bond column and a Molsieve 5A column in two separate
channels, both with a thermal conductivity detector (TCD). A normal catalytic
cycle consisted of 5 hours of reaction at the desired temperature, followed by
1 hour calcination at 300 °C with 10 vol.% O2. The typical GHSV employed
ranged between 10,000 ml gcat-1 h-1 and 14,000 ml gcat
-1 h-1 with helium as inert.
All the catalysts were tested initially in the epoxidation of propene with H2 and
O2 (volume ratio of C3H6/O2/H2 was 10/10/10) with the aim of assessing their
performance in comparison with the values reported in literature for this type
of catalyst.
The catalyst screening for the oxidation of propene with molecular oxygen was
done at temperatures ranging between 150 and 250 °C. The concentrations of
propene and oxygen were fixed at 10 vol.% each. To evaluate if water favored
the epoxidation of propene with respect to its partial oxidation (as stated by
Haruta et al. [28]), 2.5 vol.% of water vapor was introduced in the system. This
was achieved by flowing part of the helium stream through a bubbler saturator
where the temperature was controlled using a Lauda thermostatic bath.
The influence of the concentration of reactants was evaluated by modifying the
rates of propene, oxygen and water, always taking special care to operate
outside the explosive regime [36]. The ranges considered were: 1 to 60 vol.%
C3H6, while maintaining O2 at 10 vol.%, and oxygen was varied between 1 and
30 vol.% when propene concentration was 50 vol.%. The variation of the
concentration of water was done between 1 and 5 vol.%, to avoid condensation
of water in the tubing leading to the reactor, and maintaining propene and
oxygen at 50 and 10 vol.% respectively. The influence of the residence time was
studied using total flows between 10 and 100 ml min-1 (GHSV 4,000 – 40,000
ml gcat-1 h-1).
The performance of the catalysts was stable and reproducible for a period of
approximately 5 days (see section 5.3.3.1.4), after that time, the catalyst was
replaced by fresh one. Since there was a small deactivation during the first
hour of the reaction, the results reported here are averaged between minutes
Page 138
Experimental
125
150 and 300 of each catalytic cycle, where conversion and selectivity were
stable.
5.3 Results and discussion
5.3.1 Catalyst characterization
5.3.1.1 Au/Ti-SiO2
Figure 5.2 and Figure 5.3 depict the TEM images of Au supported on SiO2,
TiO2, and Au/Ti-SiO2 with different gold loadings. The particle size distribution
as well as the average particle size is also shown. The ICP analysis of Ti-SiO2
revealed that the Ti content of the support is 0.88 wt. %. The Au loadings
determined by ICP are also provided in Figure 5.2 and Figure 5.3.
Figure 5.2: TEM images and Au particle size distribution of a. 1.0-Au/SiO2, b. 1.0-Au/TiO2.
a.
b.
20 nm
20 nm
0 5 100
50
100
150
200
250
300
350
Cou
nt
Particle size (nm)
1.0 -Au/SiO2
2.38 2.06 nm
Au loading: 0.78 wt.%
0 2 4 6 8 10 12 140
10
20
30
40
50
60
70
80
90
Cou
nt
Particle size (nm)
Au loading: 0.5 wt.%
1.0 -Au/TiO2
4.86 1.77 nm
Page 139
Chapter 5: Kinetics of the selective oxidation of propene over Au-Ti
126
Figure 5.3: TEM images of the prepared Au/Ti-SiO2 catalysts and their Au particle size
distribution. a. 0.05-Au/Ti-SiO2, b. 0.2-Au/Ti-SiO2 c. 1.0-Au/Ti-SiO2, d. 2.0-Au/Ti-SiO2.
20 nm
a.
b.
c.
d.
20 nm
20 nm
20 nm0 5 10
0
50
100
150
200
250
300
350
Au loading: 0.03 wt.%
0.05 -Au/Ti-SiO2
2.07 1.26 nm
Cou
nt
Particle size (nm)
0 5 100
20
40
60
80
100
120
Au loading: 0.16 wt.%
0.2-Au/Ti-SiO2
2.4 1.9 nm
Cou
nt
Particle size (nm)
0 5 100
50
100
150
200
Au loading: 0.75 wt.%
1.0 -Au/Ti-SiO2
2.89 1.70 nm
Cou
nt
Particle size (nm)
0 5 100
50
100
150
200
250
300
350
Au loading: 2.5 wt.%
2.0 -Au/Ti-SiO2
2.07 1.26 nm
Cou
nt
Particle size (nm)
Page 140
Experimental
127
5.3.1.2 Au/TS-1
XRD analysis confirmed that the TS-1 prepared has a crystalline structure
corresponding with zeolite MFI (Figure 5.4b). The amount of Ti incorporated
was determined by ICP and is provided in Table 5.1. The UV-Vis patterns
shown in Figure 5.4a prove that most of the Ti was incorporated in the zeolite
in tetrahedral position (sharp peak around 210 nm) [37]. However, a shoulder
can be observed at 300 – 330 nm, indicating the presence of some anatase-like
material that is not active for the epoxidation of propene. Nevertheless,
considering the catalytic activity of the catalyst in the epoxidation of propene
(Section 5.3.2.1), it is expected that most of the Ti is atomically isolated and in
tetrahedral position. The average particle size of the zeolites was 113 nm in the
TS-1 with Si/Ti 85 and 91.5 nm when Si/Ti is 105 (Figure 5.5).
a. b.
Figure 5.4: a. UV-vis pattern of the two synthesized TS-1. b. XRD of TS-1(105) before and after Au
deposition with Cs2CO3. The samples have not been calcined after Au deposition.
a. b.
Figure 5.5: SEM images of TS-1 synthesized with Si/Ti ratio 85 (a) and 105(b)
200 300 400 500 600
Ab
sorb
an
ce
Wavelength (nm)
TS-1(85)
TS-1(105)
10 20 30 40 50 60
TS-1(105)
2.5-Au/TS-1(105)_Cs
Inte
nsi
ty
2
1 μm 1 μm
Page 141
Chapter 5: Kinetics of the selective oxidation of propene over Au-Ti
128
The gold uptake efficiency (defined as the final gold loading in the catalyst per
amount of gold in the initial solution) of TS-1 is lower than that of Ti-SiO2. And
even though deposition precipitation, together with solid grinding [13], is the
best technique for preparing an active gold catalyst [38], only around 5 % of the
gold put in contact with TS-1 gets deposited [39]. The low gold uptake efficiency
is due to the low isoelectric point and the high hydrophobicity of the zeolite.
These two reasons also may explain why the particles that do get deposited
remain highly dispersed on the support, being then more active in the
epoxidation of propene [14]. The gold that has not been deposited on the
catalyst remains in solution; therefore, for an efficient use of resources, it would
be possible to reuse it several times for the gold deposition over TS-1, since only
a small percentage is used every time. Care should be taken, however, on the
alkali content, since the pH adjustment by alkali carbonates would increase the
concentration of the salts in solution, possibly affecting the final alkali content
of the catalyst.
In this work, two different alkali carbonates were used as precipitation agents:
K2CO3 and Cs2CO3. The ICP results as well as the average particle size are
summarized in Table 5.1. Figure 5.6 and Figure 5.7 show the TEM images of
the synthesized catalysts with their particle size distribution. In Table 5.1 it
can be seen that the gold uptake efficiency is influenced by the precipitation
agent used. By comparing the samples with the same Ti content and nominal
gold loading of 5.5 %, but deposited with K2CO3 and Cs2CO3, it is evident that
with Cs almost double the amount of gold gets loaded on the catalyst. This is
even more evident with lower nominal gold loadings (2.5 %), where Cs allows
for the same gold incorporation (0.34 wt. %) while with K only 0.05 wt. %
remains in the catalyst. This is in agreement with the results published by Lee
et al. [33]. The explanation given for this different trend with the two alkali
ions is that Cs has stronger affinity for Au than K and it helps to attract and
stabilize Au nanoparticles on TS-1. This stabilization is more important inside
the nanopores of the zeolite, where, thanks to Cs, very small Au nanoparticles
get deposited. These small Au nanoparticles that are not even visible by TEM
are postulated to be the active sites for the epoxidation of propene [40].
Huang et al. [18] proposed that the effect of pretreating the TS-1 with alkali
salts and the reason for their improved gold uptake efficiency was the
roughening of the surface of TS-1 and the generation of defects where Au
anions could be anchored. The XRD results (Figure 5.4b) before and after the
Au deposition with alkaline salts are the same, indicating that the crystalline
structure of the zeolite remains undisturbed. Additionally, the TEM pictures of
Au/TS-1_a are very similar to those of the untreated zeolite.
Page 142
Experimental
129
Table 5.1: Properties of Au/TS-1 catalysts synthesized with different precipitation agents, Si/Ti
ratios and nominal gold loadings.
Sample Real
Si/Ti
Precip.
agent
Nominal Au
loading
Real Au
loading
Au uptake
efficiency
Cs
loading
Part.
size
gAusol/gcatsup·100 wt. % wt.% gAu-1ml-1 wt. % nm
5.5-
Au/TS-1
(53)_K
85 K2CO3 5.5 0.20 73 (a)
2.5-
Au/TS-1
(53)_K
85 K2CO3 2.5 0.05 40 2.4 ±
1.4
5.5-
Au/TS-1
(53)_Cs
85 Cs2CO3 5.5 0.34 124 2.6 3.4 ±
2.2
2.5-
Au/TS-1
(53)_Cs
85 Cs2CO3 2.5 0.34 272 2.0 3.9 ±
2.2
1.25-
Au/TS-1
(53)_Cs
85 Cs2CO3 1.25 0.19 304 1.9 3.3 ±
1.4
0.63-
Au/TS-1
(53)_Cs
85 Cs2CO3 0.625 0.06 192 1.9 3.1 ±
1.0
2.5-
Au/TS-1
(100)_Cs
105 Cs2CO3 2.5 0.20 160 1.8 3.5 ±
1.4
1.25-
Au/TS-1
(100)_Cs
105 Cs2CO3 1.25 0.19 304 2.1 4.1 ±
1.9
(a) Due to the small amount of visible particles, an accurate particle size distribution analysis for
this sample was not possible.
The influence of the gold loading can be observed by analyzing the samples
with Si/Ti ratio 85, deposited with Cs and varying the nominal gold loading
from 0.63 to 5.5 wt. %. At low amounts of gold in solution, an increase in the
gold precursor concentration is directly translated in an increment of the gold
loading. However, there is no difference in the amount of gold deposited
between the samples 5.5-Au/TS-1(85)-Cs and 2.5-Au/TS-1(85)-Cs. A direct
relationship between the Au loading and Ti content in the zeolite can be
Page 143
Chapter 5: Kinetics of the selective oxidation of propene over Au-Ti
130
observed in Table 5.1, and samples with a higher Si/Ti ratio, are capable of
incorporating less Au on their surface. Due to the low isoelectric point (IEP) of
TS-1 (IEP 2-3), when it is in water solution it is highly negatively charged,
repelling the anionic gold (AuCl4-) and preventing the deposition of gold
nanoparticles. Titania has lower IEP (4-5), so if a certain amount of Ti is
incorporated in the framework of the zeolite, the negative charge in the surface
will be reduced, favoring the deposition of Au [39]. Probably, for a Si/Ti ratio of
85, 0.34 wt. % is the limit for the amount of Au that can be loaded, therefore,
even if the amount of Au in solution is doubled, it is not translated in an
increase in gold deposited. This behavior can also be observed in the TS-1 with
lower Ti content (105). Two catalysts with different nominal gold loadings were
prepared, but the amount of Au in the support did not increase further than
0.2 wt. %wt. %. As expected, the maximum value for a Si/Ti ratio of 105 is
lower than what is obtained with 85, even though it is not proportional. From
Figure 5.4a, it can be noticed that the zeolite with a higher titanium content
also contains more extra-framework Ti. Therefore, it can be assumed that the
more scattered isolated Ti will attract smaller Au nanoparticles than the
amorphous TiO2, resulting in less incorporation, but in a more effective
manner. Another benefit of using alkali elements could be the fact that they
make the surface of the zeolite less negatively charged, thus assisting the
deposition of gold [39].
Figure 5.6: TEM image of 5.5-Au-TS-1(85)-K its particle size distribution.
20 nm1 2 3 4 5 6 7 8 9 10
0
20
40
60
80
100
120
140
160
5.5-Au-TS-1(85)-K
3.07 5.21 nm
Cou
nt
Particle size (nm)
Page 144
Results and discussion. Catalyst characterization
131
Figure 5.7: TEM images of Au/TS-1 deposited using Cs2CO3 and with different titanium and gold loadings and their particle size distribution. a. 5.5-
Au-TS-1(85)-Cs, b. 2.5-Au-TS-1(85)-Cs, c. 1.25-Au-TS-1(85)-Cs, d. 0.625-Au-TS-1(85)-Cs, e. 2.5-Au-TS-1(105)-Cs, f. 1.25-Au-TS-1(105)-Cs.
20 nm
a.
b.
c.
20 nm
20 nm0 1 2 3 4 5 6 7 8 9 10 11 12 13 14 15 16
0
40
80
120
160
Cou
nt
Particle size (nm)
5.5-Au-TS-1(85)-Cs
3.3 nm
0 1 2 3 4 5 6 7 8 9 10 11 12 13 14 15 160
40
80
120
Cou
nt
Particle size (nm)
2.5-Au-TS-1(85)-Cs
3.90 2.17 nm
1 2 3 4 5 6 7 8 9 10 11 12 13 14 15 160
10
20
30
40
50
60
1.25-Au-TS-1(85)-Cs
3.25 1.42 nm
Cou
nt
Particle size (nm)
20 nm
d.
e.
f.
20 nm
20 nm1 2 3 4 5 6 7 8 9 10 11 12 13 14 15 16
0
10
20
0.625-Au-TS-1(85)-Cs
3.14 1.04 nm
Cou
nt
Particle size (nm)
1 2 3 4 5 6 7 8 9 10 11 12 13 14 15 160
10
20
30
40
50
60
Cou
nt
Particle size (nm)
2.5-Au-TS-1(105)-Cs
3.53 1.43 nm
0 1 2 3 4 5 6 7 8 9 10 11 12 13 14 15 160
20
40
Cou
nt
Particle size (nm)
1.25-Au-TS-1(105)-Cs
4.12 nm
Page 145
Chapter 5: Kinetics of the selective oxidation of propene over Au-Ti
132
It is generally accepted that higher Au loading leads to bigger Au nanoparticles
[40]. This is confirmed by the results of Figure 5.7 a-d. There is not a very big
difference in the average particle size between 5.5-Au/TS-1(85)-Cs and 0.63-
Au/TS-1(85)-Cs. However, the particle size distribution of the former is broader
than that of the latter. With a higher gold loading, particles as big as 14 nm
appear deposited on the catalyst, while the biggest particle for the nominal gold
loading of 0.63 wt. % is 6 nm. This will have an evident effect in the
epoxidation of propene. A decrease in the Ti content did not result in a decrease
in the particle size. It should also be noted that if the volume of the Au
particles is considered, the differences between the samples would be
emphasized.
The amount of Cs incorporated in the catalyst was determined by AAS and is
summarized in Table 5.1. It can be seen that all the catalysts contain around
2 wt. % Cs, which is in the same range as the catalyst prepared by Lee et al.
using the same method [33]. The incorporation seems to increase with the
initial concentration of gold in the synthesis solution. It has been reported that
the Cs/Au ratio can have an influence in the epoxidation of propene, both with
H2/O2 [33] and with O2/H2O [29].
5.3.2 Epoxidation with H2 + O2
5.3.2.1 Au/TS-1
All Au/TS-1 catalysts prepared produced preferentially PO in the direct
epoxidation of propene with hydrogen and oxygen. As explained before, the
precipitation agent used during the deposition-precipitation of gold over TS-1
plays a role not only on the gold uptake efficiency, but also on the performance
of the catalyst in the epoxidation of propene. In Table 5.2 the results obtained
with the different catalyst synthesized using, K2CO3 and Cs2CO3 are
summarized.
The performance values are within the same range as those reported by Lee et
al. [33]. In general, this catalyst proved to be very active, with conversion
values higher than with other Au-Ti (like Au/Ti-SiO2) catalysts in the same
reaction. One of the reasons for this high activity is the possibility to operate at
higher temperatures than, for instance, Au/Ti-SiO2, while maintaining a high
selectivity to PO. This is favored by the insulation of Ti atoms in TS-1. The
Page 146
Results and discussion. Epoxidation with H2 + O2
133
selectivity obtained is slightly low because of the presence of some larger gold
particles that catalyze the CO2 formation. Nevertheless, selectivity values
higher than 90 % can be obtained at low gold loadings. The hydrogen efficiency,
on the other hand, remains quite low in all the catalysts tested. This is, again,
due to the presence of bigger Au nanoparticles that are active in the hydrogen
combustion to produce water. Another reason for the low hydrogen efficiency
might the higher operation temperatures of Au/TS-1, which favor the
combustion of hydrogen versus the epoxidation.
Table 5.2: Results of the epoxidation of propene with H2 + O2 with Au/TS-1 synthesized using
different precipitation agents. Temperatures: 200 °C, GHSV = 14,000 ml/gcat h, 150 mg catalyst.
10/10/10 of C3H6/O2/H2 with He as balance.
R Sample Real Au
loading Conv.
Cs
loading
Sel. to
PO
H2
eff. PO rate PO rate
wt.% % wt.% % % molPO gcat
-1 s-1 molPO gAu-1 s-1
1
5.5-
Au/TS-1
(85)_K
0.20 6.5 -- 74.0 3.9 7.6·10-7 3.8E·10-4
2
2.5-
Au/TS-1
(85)_K
0.05 4.1 -- 94.5 15.9 6.0·10-7 1.2·10-3
3
5.5-
Au/TS-1
(85)_Cs
0.34 4.8 2.6 56.0 2.0 4.7·10-7 1.38·10-4
4
2.5-
Au/TS-1
(85)_Cs
0.34 5.1 2.0 63.2 2.8 6.1·10-7 1.79·10-4
5
1.25-
Au/TS-1
(85)_Cs
0.19 6.5 1.9 76.4 6.0 7.9·10-7 4.16·10-4
6
0.625-
Au/TS-1
(85)_Cs
0.06 3.8 1.9 92.8 9.9 4.9·10-7 8.17·10-4
7
2.5-
Au/TS-1
(105)_Cs
0.20 6.0 1.8 72.3 3.82 7.5·10-7 3.75·10-4
8
1.25-
Au/TS-1
(105)_Cs
0.20 7.4 2.1 75.0 5.0 9.4·10-7 4.70·10-4
Page 147
Chapter 5: Kinetics of the selective oxidation of propene over Au-Ti
134
The use of K as precipitation agent results in lower Au loading compared to Cs.
Besides this, the performance of the catalysts in the epoxidation of propene is
comparable to the performance of Au/TS-1(85) with the same actual gold
loading and synthesized with Cs2CO3 (5.5-Au/TS-1(85)_K and 1.25-Au/TS-
1(85)_Cs, with 0.2 wt. % Au), i.e, the productivities per gram of gold (turnover
frequencies) are the same, independently of the alkali ion used. Comparable
conversions and selectivities to PO are obtained, suggesting that Cs enhances
the Au deposition, but does not affect the activity of the catalysts during the
epoxidation with hydrogen and oxygen in comparison with K. Lee et al. [33],
suggested that the benefit of depositing gold with Cs2CO3 was the stabilization
of very small Au nanoparticles in the pores of TS-1, while they did not indicate
that Cs plays a role in the reaction itself. Huang et al. [18] reported that the
benefit of pretreating TS-1 with alkali metal hydroxides (Na, K and Cs) before
Au solid grinding was essential to obtain the optimum Au particle size for the
epoxidation.
For the catalysts synthesized with Cs, the gold uptake efficiency is higher,
reaching Au loadings as high as 0.34 wt. %. However, an increase in gold
loading does not represent an increase in PO rate, as can be seen in Table 5.2.
The conversion of propene with 5.5-Au/TS-1(85)_Cs is 4.8 %, but the selectivity
is only 56.3 %. At 200 °C, the main by-product obtained with this catalyst is
CO2 with a selectivity of 25 %, either from the complete combustion of propene
or the cracking of PO [41]. There is, additionally, 15 % selectivity to propane
from the hydrogenation of propene. The increase in the combustion rate can be
associated to the presence of larger Au nanoparticles, and a broader particle
size distribution (Figure 5.7a). It is known that particles larger than 5 nm
catalyze the CO2 formation [6, 18]. A similar performance is observed in the
catalyst 2.5-Au/TS-1(85)_Cs, which is reasonable, since the actual gold loading
is the same and the particle size distribution is also similar (Figure 5.7b).
When the temperature is increased to more than 230 °C, the propene
conversion drops dramatically, the PO production is limited and the hydrogen
efficiency drops to 0.5 % (Figure 5.8a). At this temperature, the conversion of
hydrogen is almost complete, being mostly oxidized to form water. This is also
due to the larger Au nanoparticles, which are mostly active for H2 combustion
[33]. Additionally, other carbon-containing products are obtained, like acrolein
or propanal. This was also observed by Lu et al. [39] in samples with high Au
loading and promoted with Ca, Sr and Ba. The same reasoning explains why
the conversion of propene does not increase with the gold loading (Figure 5.8b).
At 200 °C, the two catalysts with 0.34 wt. % Au already reach almost complete
hydrogen conversion. Therefore, the conversion of propene does not increase, as
Page 148
Results and discussion. Epoxidation with H2 + O2
135
would be expected from a catalyst with more active sites [39]. The maximum
propene conversion was 6.5 %, obtained from the catalyst 1.25-Au/TS-1(85)_Cs,
with 0.2 wt. % Au. The selectivity and hydrogen efficiency are also higher (76 %
and 6 % respectively), resulting in a better PO productivity and less generation
of by-products and water. The catalyst with 0.06 wt. % Au presents a very high
selectivity (92.8 %) but lower conversion (3.8 %), since there are less active sites
for the epoxidation.
a.
b.
Figure 5.8: a. Epoxidation of propene with H2 + O2 over 2.5-Au/TS-1(85)_Cs. Influence of the
temperature. ■ Propene conversion, ∆ PO selectivity. b. Influence of the gold loading over TS-1(85)
at 200 °C. ■ Propene conversion, ∆ PO selectivity.
The influence of the amount of Ti incorporated in the zeolite is also noticeable
in the epoxidation of propene. The presence of Ti in the support is essential for
the production of propene oxide, since Ti-OOH species are the active species in
the epoxidation of propene. However, as opposed to the reaction with H2O2,
where the more tetrahedral Ti, the more active sites for the epoxidation and
the reaction rate will be enhanced, in the epoxidation with H2 and O2, the rate
limiting step is the formation of OOH* species over the gold nanoparticles.
160 170 180 190 200 210 220 2300.0
1.0
2.0
3.0
4.0
5.0
C3H
6 c
on
vers
ion
(%
)
Temperature (C)
0
20
40
60
80
100
Sele
ctiv
ity t
o P
O (
%)
0 1 2 3 4 5 60.0
1.0
2.0
3.0
4.0
5.0
6.0
C3H
6 c
on
vers
ion
(%
)
Nominal Au loading (gAu in solut
gsupport
-1 ·100)
0
20
40
60
80
100
Sele
ctiv
ity t
o P
O (
%)
Page 149
Chapter 5: Kinetics of the selective oxidation of propene over Au-Ti
136
Therefore, it is more important to have a catalyst with small Au nanoparticles,
which is favored by low Ti loadings in the support. An increase in the Si/Ti
ratio resulted in less Au incorporation, when the same nominal gold loading
was used (2.5-Au/TS-1(85)_Cs compared to 2.5-Au/TS-1(105)_Cs). But if the
real gold loading is compared, the four samples with 0.2 wt. % Au present
similar results in conversion, selectivity and PO productivity. The only sample
that does not follow this trend is 1.25-Au/TS-1(105)_Cs, with which higher
propene conversions and PO rates are obtained. This can be due to the higher
Ti dispersion when the Si/Ti is higher, thus the Au nanoparticles are deposited
in positions that are farther from each other. Also, in Figure 5.4 it can be seen
that the sample with larger Ti content has higher amount of extrafra-mework
Ti, which is not active for the epoxidation and catalyzes de decomposition of
hydrogen peroxide species. The difference with 2.5-Au/TS-1(105)_Cs is
surprising, since both have the same amount of gold and titanium and the
average particle size of 1.25-Au/TS-1(105)_Cs is slightly larger. The reason for
this discrepancy can be the presence of smaller Au nanoparticles in the pores of
the zeolite that are not visible in the TEM images and, therefore, not accounted
for. Another possible explanation can be the incorporation of more Cs in the
zeolite during the deposition-precipitation (Table 5.1), reaching a more
optimum ratio Au/Cs. The results obtained with this catalyst are the best of all
the Au/TS-1 tested in this study.
It can be concluded that the Au/TS-1 synthesized is very active in the
epoxidation of propene with hydrogen and oxygen, reaching high conversion
values with relatively high selectivities to propene oxide. The main limitation
is the rather low hydrogen efficiency that is affected by the presence of larger
gold nanoparticles on the catalyst.
5.3.2.2 Au/Ti-SiO2
The epoxidation of propene was also studied over Au/Ti-SiO2. The
concentration of reactants used was the same as in the previous section. A
summary of the results obtained with Au/Ti-SiO2 with different gold loadings
at 150 °C is provided in Table 5.3.
In general, the conversion values are considerably lower than the ones obtained
with Au/TS-1. The reason is, first, the crystallographic insulation of Ti in the
silica matrix of TS-1, which ensures the absence of any connectivity between Ti
atoms. In the case of Ti-SiO2, during the grafting method used to deposit Ti
over porous SiO2, it is more likely that two or more Ti atoms will be grafted
Page 150
Results and discussion. Epoxidation with H2 + O2
137
together [10], which is detrimental for the conversion and selectivity. For this
reason, the reaction temperature over this catalyst should be lower to avoid
complete combustion of propene. In Table 5.4 it can be seen that the conversion
of propene at 200 °C reaches 2.5 %, but the selectivity to PO remains 20 %.
Table 5.3: Results for the epoxidation of propene with H2 + O2 with Au/Ti-SiO2 with difference Au
loadings. Temperatures: 150 °C, GHSV = 10,000 ml gcat-1 h-1, 150 mg catalyst. 10 vol.% of each
reactant.
R Au
loading
Particle
size Conversion
Selectivity
to PO
H2
eff. PO rate PO rate
wt.% nm % % % molPO gcat-1 s-1 molPO gAu
-1 s-1
1 0.2 2.4±1.9 0.62 89.30 8.14 7.7·10-8 4.8·10-5
2 1.0 2.4±1.2 1.39 76.76 5.18 1.4·10-7 1.9·10-5
3 2.0 2.3±1.3 2.61 57.53 1.05 1.8·10-7 7.2·10-6
The results are similar to those reported by Chen et al. [9, 10] for the same gold
and titanium loadings. It can be observed that, as the gold loading increases,
the conversion of propene increases as well, while there is a clear decrease in
selectivity. The same can be said about the hydrogen efficiency, which is higher
at lower gold loadings. As explained by Chen et al. [10], this can be due to the
higher number of interfacial Au-Ti sites when the gold loading is low and,
therefore, it is more dispersed. It is at these Au-Ti sites where the active
hydroperoxy species for the epoxidation of propene are formed.
5.3.2.2.1 Comparison with Au/TiO2, Au/SiO2 and Au/C
Comparing the performance in the epoxidation of propene of 1 wt. % Au
deposited over TiO2, SiO2 and Ti-SiO2, the first feature to notice is the different
optimum temperatures for each of the supports (Table 5.4). Au/TiO2 shows the
best results at lower temperature (75 °C), with a selectivity to PO of 80 %, and
small amounts of acetaldehyde being produced. However, when the
temperature is raised to 150 °C, the hydrogen efficiency decreases from 10 to
0.3 % and the production of PO drops dramatically to a yield of 0.035 %, which
is in accordance with the results of Nijhuis et al. [8]. This is an indication that
for a better performance in the epoxidation of propene with Au-Ti catalyst,
Page 151
Chapter 5: Kinetics of the selective oxidation of propene over Au-Ti
138
titanium atoms should be highly dispersed [19, 38]. For this reasons, Au/TS-1
shows the better performance of all the catalysts tested in this study and it is
possible to operate with it at higher temperatures. It should also be noted that
the agglomeration of Ti causes a very fast deactivation of the catalyst due to
the deposition of carbonaceous species over the active sites [8]. The results
provided are the averaged activities in the catalytic cycle from minute 150 to
minute 300, as a result the final activity appears to be lower, since the initial
values, which are higher, are not accounted for.
Table 5.4: Comparison of the performance of Au/TiO2, Au/Ti-SiO2 and Au/SiO2 in the epoxidation of
propene with H2 + O2 at different temperatures (10/10/10 H2/O2/C3H6).
Catalyst
Au
loading
Particle
size T Conv.
Selectivity
PO
Selectivity
acrolein
H2
efficiency
wt. % nm °C % % % %
1.0-Au/TiO2 1 5.35±9.27 150 0.53 6 4 0.37
75 0.13 81 12 9.76
1.0-Au/Ti-
SiO2 1 2.43±1.21
150 1.39 77 0 5.18
200 2.55 20 - 0.96
1.0-Au/SiO2 1 1.91±1.25 150 0.25 5 25 0.1
230 1.34 0 60 0
In the case of Au/SiO2, only 5 % selectivity towards PO was observed at 150 °C,
and a high amount of propene was converted to acrolein. This percentage
increases with temperature. In agreement with the results reported by Gasior
et al. [42], also acetaldehyde, propanal and acetone are produced over this
catalyst when hydrogen and oxygen are used. It is well known that the
presence of titanium in the support is essential for the epoxidation of propene
[19, 38], since Ti-OOH species are the responsible for the epoxidation of
propene to PO. In the absence of Ti, the OOH* species formed over the gold
nanoparticles will decompose into O* and OH* (Scheme 5.1, reaction 4*). The
very active O* species will attack the propene, producing acrolein instead of PO
[3].
The test carried out with gold deposited over graphitic carbon resulted in only
0.3 % of propene conversion. The main product was propane (80 % selectivity)
Page 152
Results and discussion. Epoxidation with H2 + O2
139
from the hydrogenation of propene. Small amounts of acrolein, acetaldehyde,
acetone and propanal were also observed, but not in a significant manner. It
should be said that the gold particles deposited over carbon were bigger than
the ones deposited over any of the other supports. Nevertheless, no PO was
observed, highlighting the importance of the presence of Ti. Acrolein was not
produced as selectively as over Au/SiO2, indicating that the support also plays a
role on the partial oxidation, which was also indicated by Suo et al. [43]. The
conversion of hydrogen 2.5 %, with 90 % selectivity to water, indicating that
there is probably formation of OOH* species that, in the absence of Ti in the
neighborhood, are decomposed, producing water, or are hydrogenated, resulting
in the same final product [9].
5.3.3 Epoxidation with O2 and water
5.3.3.1 Au/TS-1
The same catalysts as in the previous section were used for the epoxidation of
propene with molecular oxygen in the presence of water. When Au/TS-1 was
tested, the main products obtained in this case were PO (C3H6O) (Eq. 5.3),
acrolein (C3H4O) (Eq. 5.4) and CO2 (Eq. 5.5), according to the following
reactions:
3 6 2 2 3 6 2
1C H + O +H O C H O+H O2
Eq. 5.3
3 6 2 3 4 2
C H +O C H O+H O Eq. 5.4
3 6 2 2 22C H +9O CO6 +6H O Eq. 5.5
Several factors like the influence of the gold and titanium loading, the
precipitation agent used and temperature were evaluated to determine which
was the best catalyst for the kinetic study.
5.3.3.1.1 Influence of the gold and titanium loading and the precipitation
agent
Here the results for the epoxidation of propene over the different catalysts are
summarized. The conversion values obtained in this study were lower than
those reported by Huang et al. [29] for the same reaction. While the maximum
Page 153
Chapter 5: Kinetics of the selective oxidation of propene over Au-Ti
140
conversion reported was 2.5 % with 36 % selectivity to PO, Table 5.5 shows that
the maximum propene conversion obtained at 200 °C was 0.34 %, with PO
selectivity of 42 %. The reason for this discrepancy can be the different
concentration in alkali ions. Huang et al. clearly showed that the concentration
of potassium ions, and its ratio to the amount of gold, played an important role.
If the concentration of K was 0.5 %, the conversion remained 0.9 % with 21 %
selectivity to PO. The optimum alkali concentration was found to be between
1.0 and 2.0 %. A further increase of the amount of potassium was detrimental
both for conversion and selectivity. On the other hand, the acidic surface of the
zeolite, created by the Ti-OH groups, catalyzes the isomerization of the formed
PO into propanal. Another role of the alkali ions is to neutralize the surface,
inhibiting the isomerization. In this work, no significant amounts of propanal
were observed, indicating that the surface of the catalyst is neutralized. The Cs
concentration, determined by AAS, was in all cases around 2 wt. % or higher
(Table 5.1), which is above the optimum indicated by Huang et al. [29]. This
can explain the lower propene conversion, due to the blockage of the active sites
by the excess of ions. Moreover, cesium ions are bigger than potassium ions and
more likely to obstruct the active sites if an excess is present.
It is generally accepted that PO is formed by the reaction of propene with Ti-
OOH species. In the epoxidation of propene with O2 and water, it has been
proposed that this hydroperoxy species are formed through the reaction
between O2 stabilized over the gold nanoparticle and the proton from the
heterolytic dissociation of water (Figure 5.1) [29]. However, the attack of the
allylic C-H bond of propene by oxygen is also a favorable reaction, resulting in
the production of acrolein [3, 44]. As can be seen in Table 5.5, the propene
converted is used almost in equal parts for the production of PO and acrolein,
with the ratio varying slightly from catalyst to catalyst. It should be noted that
CO2 was produced with lower selectivity (maximum 13 %). The presence of
water has been proven to allow for the PO formation; however, in contrast with
the results published by Lee et al. [30], the particle size distribution here is
broader and bigger nanoparticles (> 2 nm, not active for the epoxidation of
propene [28]) are also present. Therefore, the maximum PO/acrolein ratio
obtained was 1.43, which indicates that more PO than acrolein is being
produced. Huang et al. [29] reached a maximum selectivity to PO of 52 %, with
CO2 being the main by-product.
The precipitation agent used, as it was explained in the previous sections,
affected the amount of gold loaded in the support. But, as opposed to the
reaction with hydrogen and oxygen, it can also influence the reaction and the
PO/acrolein ratio. Potassium and cesium are expected to show the best
Page 154
Results and discussion. Epoxidation with O2 and water
141
performance in terms of propene conversion and PO selectivity [29]. Likewise,
the selection of the counter anion should be taken into account. The one used in
this case, CO32-, in combination with K+ and Cs+, is supposed to promote the
epoxidation of propene [29]. Similar results were obtained with 5.5-Au/TS-
1(85)_K and 1.25-Au/TS-1(85)_Cs, where the Au loading is the same. However,
the selectivity is slightly higher with the catalyst synthesized with potassium.
The best performance was obtained with 2.5-Au/TS-1(105)_Cs, achieving a PO
yield of 0.15 %. Even though the gold loading was the same as with the
previous two catalysts, probably the lower Ti content implied that most of the
titanium present is in tetrahedral position and, therefore, active for the
epoxidation. The precipitation agent used in that case is Cs2CO3, which in
principle favors the deposition of smaller Au nanoparticles (<1 nm) in the pores
of the zeolite [33].
Table 5.5: Results of the epoxidation of propene with O2 in the presence of water over Au/TS-1
synthesized using different precipitation agents and gold and titanium loadings. Temperature:
200 °C, GHSV = 14,000 ml gcat-1 h-1, 150 mg catalyst. 10/10/2.5 of C3H6/O2/H2O with He as balance.
R Sample Real Au
loading Conv.
Sel.
PO
Sel.
Acrol. PO rate
Acrolein
rate
PO/
Acrolein
wt.% % % % molPO gcat-1
s-1 molAc gcat-1
s-
1
5.5-
Au/TS-1
(85)_K
0.20 0.20 33.0 56.1 7.3·10-9 1.21·10-8 0.59
3
5.5-
Au/TS-1
(85)_Cs
0.34 0.32 28.5 49.7 1.1·10-8 1.68·10-8 0.57
4
2.5-
Au/TS-1
(85)_Cs
0.34 0.34 28 48.9 1.59·10-8 2.74·10-8 0.57
5
1.25-
Au/TS-1
(85)_Cs
0.19 0.15 27.6 64.16 7.51·10-9 1.62·10-8 0.43
7
2.5-
Au/TS-1
(105)_Cs
0.20 0.25 54.0 37.9 1.43·10-8 1.0·10-8 1.43
8
1.25-
Au/TS-1
(105)_Cs
0.20 0.22 53.6 40.9 1.89·10-8 1.45·10-8 1.31
Page 155
Chapter 5: Kinetics of the selective oxidation of propene over Au-Ti
142
Like in the case of the reaction with hydrogen and oxygen, a lower gold loading
favors the selectivity towards PO, which can be observed in 2.5-Au/TS-1(85)_K.
A higher gold loading (like 0.34 %) resulted in bigger Au nanoparticles that
catalyze other reactions, like the formation of acrolein and the full combustion
to CO2, which is highest in 5.5-Au/TS-1(85)_Cs (13 %). However, very small
gold loadings like 0.06 wt. % do not provide sufficient active sites and the PO
formation rate is rather low and not stable. The catalyst synthesized with a
lower Ti loading and a lower nominal Au loading, in spite of the fact that it has
the same Au loading as 2.5-Au/TS-1(105)_Cs, has a higher selectivity to PO.
This can be due to the higher dispersion of Ti atoms, due to the lower Ti
loading, attracting Au nanoparticles and reducing the risk of sintering [17].
Additionally, the TS-1 with higher Si/Ti ratio, contained less extrafra-mework
Ti, therefore, a highest percentage of it is active for the epoxidation.
5.3.3.1.2 Effect of the temperature
An increase in the reaction temperature resulted in an increase in the PO and
acrolein formation rate. In Figure 5.9a, it can be seen that PO is the
predominant product at lower temperatures, but the combustion becomes the
main reaction at temperatures higher than 260 °C. At 300 °C the conversion of
propene is 6.6 % with only 1.6 % selectivity to PO. In Figure 5.9a, all rates are
based on the amount of C3 converted (i.e. not the products formation rate).
It is interesting to notice that the formation of acrolein increases steadily with
the temperature, and even at 300 °C it is produced with a selectivity of 14.5 %
and a formation rate of 1.0·10-7 molacrolein gcat-1 s-1. This suggests that acrolein is
more resistant to combustion than PO.
In the Arrhenius plot of Figure 5.9b, the apparent activation energies for the
production of PO, acrolein and CO2 are calculated. As stated before, there is an
inflexion point, where the slope of the line for the formation of PO changes.
Therefore, two regions were considered with two different activation energies:
45 kJ mol-1, for temperatures lower than 250 °C, and -60 kJ mol-1 at higher
temperatures. The negative value can be associated to the faster increase of the
rate of the side reactions, like combustion, than the epoxidation rate, so PO is
consumed faster than what is produced. Therefore with increasing
temperature, a lower production rate is observed. The activation energies
reported in literature for the epoxidation of propene with H2 and O2 are, over
Au/TS-1, 35 kJ mol-1 [17], 47 kJ mol-1 using Au/TiO2 [45] and 24 kJ mol-1 when
Page 156
Results and discussion. Epoxidation with O2 and water
143
the catalyst was Au/Ti-SiO2 [9]. Both in the reaction with hydrogen and with
water the rate determining step (rds) is the formation of OOH* species.
However in the former reaction, what limits the OOH* formation is the
dissociation of hydrogen, while in this case, since there is no hydrogen, the rds
is the OOH* formation from water and oxygen. Therefore, the activation energy
is different.
a.
b.
Figure 5.9: a. Dependence of the rate of formation of PO and acrolein and the combustion of C3 to
CO2 and on the temperature during the epoxidation of propene with O2 and water over 2.5-Au/TS-
1(105)_Cs,10/10/2.5. b. Arrhenius plot for the formation rates of PO, acrolein and CO2 over 2.5-
Au/TS-1(105)_Cs,10/10/2.5 with C3H6/O2/H2O, GHSV = 14,000 ml gcat-1 h-1. NOTE: The last point of
CO2 formation rate reaches 1.74 10-7 molCO2 gcat-1 s-1.
The value obtained for acrolein was constant in the whole temperature range
studied and it is 57 kJ mol-1. This value is comparable to the range reported by
Cant for the formation of acrolein over Au/SiO2 (32-50 kJ mol-1) [46].
180 200 220 240 260 280 300 3200.0
2.0x10⁻⁷
4.0x10⁻⁷
6.0x10⁻⁷
Acrolein
PO
C3 Combusted
Ra
te (
mol
gca
t-1 s
-1)
Temperature (C)
0.0017 0.0018 0.0019 0.0020 0.0021 0.0022
-20
-19
-18
-17
-16
-15
-14
-13 Ea
obs (PO_low temp)=45 kJ mol
-1
Ea
obs (PO_high temp)=-60 kJ mol
-1
Ea
obs (Acrol)=57 kJ mol
-1
Ea
obs (CO
2)=152 kJ mol
-1
ln (
r)
1/T (K-1)
Page 157
Chapter 5: Kinetics of the selective oxidation of propene over Au-Ti
144
If one analyzes the activation energy of the different catalysts studied in
Section 5.3.3, the results (Table 5.6), it can be seen that the activation energies
of 2.5-Au/TS-1(105)_Cs are very similar to those with 5.5Au/TS-1(85)_K. This is
reasonable, since the gold loading is the same in both. The lower values
obtained with the other catalysts can be explained because the temperature
range evaluated in those cases was lower (160 – 230 °C). This can be due to a
change in rds with increasing temperature. What may be concluded is that in
all catalysts tested, the apparent activation energy for PO is lower than that of
acrolein, indicating that the PO formation is more favorable.
Table 5.6: Apparent activation energy for PO and acrolein formation over Au/TS-1 synthesized with
different gold and titanium loadings (calculated for temperatures between 160 and 220 °C.
Reaction Sample Au loading
(wt.%)
Eaobs (kJ mol-1)
PO Acrolein
1 5.5Au/TS-1(85)_K 0.20 47 62
4 2.5Au/TS-1(85)_Cs 0.34 36 40
5 1.25Au/TS-1(85)_Cs 0.20 27 39
7 2.5Au/TS-1(105)_Cs 0.20 45 57
8 1.25Au/TS-1(105)_Cs 0.20 38 37
5.3.3.1.3 Effect of the residence time
From Figure 5.10, it can be seen that the conversion increases with the
residence time, even though the main reaction occurring is the combustion of
propene, producing CO2 and water. Combustion decreases with decreasing
residence time up to a point when it is almost negligible at high space
velocities. Lower GHSV favor the formation of PO with respect to acrolein. This
can be due to the stronger adsorption of the latter over the active sites
responsible for its formation, that remain blocked for further reaction. It may
also be concluded that the active sites for the epoxidation are different than the
sites for the partial oxidation, since the reduction in the production of acrolein
is not translated in a reduction in the production of PO.
Page 158
Results and discussion. Epoxidation with O2 and water
145
Figure 5.10: Influence of the residence time of the formation of PO and acrolein and in the
combustion rate by direct oxidation of propene with oxygen and water. 10 vol.% C3H6, 10 vol.% O2
and 2.5 vol.% H2O. Temperature: 230 °C.
Since the rate determining step in the direct epoxidation is considered to be the
formation of OOH* species, the fact that lower residence times favor the
PO/acrolein ratio could indicate that at those space velocities the formation of
hydroperoxy species due to the reaction between oxygen and water is higher.
Then the OOH* species are preferentially utilized in the epoxidation to PO. At
higher GHSV, on the other hand, the oxygen is probably used faster for the
direct oxidation to acrolein. At higher residence times the selectivity to acrolein
drops, while the combustion increases, increasing therefore the PO/acrolein
ratio. It is also possible that acrolein, at low GHSV undergoes a consecutive
reaction, forming CO2.
5.3.3.1.4 Stability of Au/TS-1
The stability of the catalyst for the epoxidation of propene with oxygen and
water as a function of time is shown in Figure 5.11 a and b. The formation of
PO suffers from a slight deactivation after 90 minutes. The formation of
acrolein, on the other hand, increases during the first two hours of reaction,
being stable afterwards. Therefore, all the results reported in this work are
calculated by averaging the values for conversion, selectivity and rate between
150 and 300 minutes of the catalytic cycle. After regeneration of the catalyst at
300 °C with 10 vol.% O2, the initial activity values can be recovered, indicating
that there is reversible deactivation. This is due to the strong adsorption of PO
and carbonate species, blocking the active sites for the reaction [8]. The
0 10000 20000 30000 400000
1x10⁻⁸
2x10⁻⁸
3x10⁻⁸
4x10⁻⁸
5x10⁻⁸
PO rate
Acrolein rate
Combustion rate
rate
(m
ol
gca
t-1 s
-1)
GHSV (ml gcat
-1 s
-1)
Page 159
Chapter 5: Kinetics of the selective oxidation of propene over Au-Ti
146
calcination at 300 °C burns off the carbonate species, freeing the active sites for
the reaction.
Figure 5.11: Formation rate vs. time on stream of PO (■) and, acrolein (Ο) and combustion rate
(CO2/3) (∆), in the direct epoxidation of propene with oxygen and water. 10 vol.% C3H6, 10 vol.% O2
and 2.5 vol.% H2O. Temperature: 230 °C. a. Normal reaction time of 300 minutes. b. Long term
stability for 5 days.
An analysis of the long term stability (Figure 5.11b) shows that the PO
formation is relatively stable over 60 hours of continuous reaction. After that, a
decline in the production can be attributed either to the deposition of carbonate
species on the active sites of the catalyst, or irreversible deactivation, due to
the sintering of some of the small gold nanoparticles, forming larger particles
that are only active for the combustion of propene. The latter can be confirmed
by the sharp increase of the CO2 formation with time. This was also observed
after several cycles of reaction-regeneration. CO2 productivity increased along
the cycles and the initial values were not recovered after regeneration.
However, it should also be said that the loss of PO productivity after 5 days of
continuous reaction only accounts for 30 % of the initial activity.
A remark should be made on the stability of the fresh catalyst. To avoid gold
sintering, the synthesized catalysts were stored in the fridge at 2 °C and
protected from light by aluminum foil. If the catalyst was kept as-synthesized,
without calcination, the activity noticeably decreased after a couple of weeks.
If, on the other hand, the catalyst is immediately treated by increasing the
temperature from 35 to 200 °C under a mixture of 10/10/10 C3H6/O2/H2,
followed by regeneration at 300 °C for 1 hour with 10 vol.% O2, to remove the
possible deposition of carbonaceous compounds, Au/TS-1 can be used for 2
months without apparent loss of catalytic activity. The reason for the better
stability of the treated sample can be the reduction of the deposited gold
0 1 2 3 4 50
1x10⁻⁸
2x10⁻⁸
3x10⁻⁸
4x10⁻⁸
5x10⁻⁸
6x10⁻⁸
7x10⁻⁸
PO
Acrolein
Combustion
r (m
ol
g-1 ca
t h
-1)
Time on stream (h)
0 20 40 60 80 100 1200
1x10⁻⁸
2x10⁻⁸
3x10⁻⁸
4x10⁻⁸
5x10⁻⁸
6x10⁻⁸
7x10⁻⁸
PO
Acrolein
Combustion
r (m
ol
g-1 ca
t h
-1)
Time on stream (h)
a. b.
Page 160
Results and discussion. Epoxidation with O2 and water
147
nanoparticles from Au2O3 to metallic gold. This change in oxidation state can
be also observed in the decrease of the particle size after reaction in comparison
with the as-synthesized catalyst.
5.3.3.2 Au/Ti-SiO2
Different gold loadings deposited on porous titanium on silica support were
tested for the epoxidation of propene with molecular oxygen and water at
temperatures ranging from 150 to 250 °C. The first noticeable result of these
reactions is the complete absence of PO in the products obtained when
hydrogen is not co-fed. Nevertheless, propene was converted and acrolein was
produced with high selectivity.
5.3.3.2.1 Influence of the gold loading
The influence of the amount of gold loaded on Ti-SiO2 can be seen in Figure
5.12a. The increase of propene conversion with increasing gold loading is
evident. However, when more metal is deposited, even though the conversion is
high, other by-products are being formed, mainly acetaldehyde, CO2 and CO
from the further oxidation of propene, decreasing the selectivity to acrolein.
Similar to the case of PO production over Au/TS-1, higher gold loadings result
in a lower selectivity to acrolein, because there are more large particles (>5 nm)
that can catalyze the combustion of propene to CO2 and other side reactions. In
Figure 5.12b, the dashed lines represent the productivity of acrolein normalized
per gram of gold. It can be seen that the higher productivities are obtained at
lower Au loadings, probably because in 0.2-Au/Ti-SiO2, all the gold deposited is
active for the production of acrolein, while with 2.0-Au/Ti-SiO2, part of the
nanoparticles catalyze other reactions [17]. It can also be observed that there is
saturation in the productivity of acrolein after 1 wt. % Au, in which an increase
of gold loading is not translated in a change in productivity. Probably, after a
certain gold loading, in the formation of acrolein, the reaction occurring over
the gold active sites is not the rate determining step. So far, the reason for this
effect is not well understood.
Considering the combined effect of temperature and gold loading (Figure
5.12a), at lower gold loadings, the selectivity to acrolein remains above 70 %
Page 161
Chapter 5: Kinetics of the selective oxidation of propene over Au-Ti
148
even at 250 °C and it is almost 100 % below 200 °C. At 250 °C the isomerization
of acrolein into propanal and acetone starts to be an important reaction.
a.
b.
Figure 5.12: Propene epoxidation using O2/H2O for different gold loadings on Ti/SiO2. a. Influence of
the temperature and the gold loading on the conversion of C3H6 and the yield to acrolein. b.
Acrolein rate as a function of the catalyst loading (full lines) and the gold loading (dashed lines) at
two different temperatures: 210 °C (circles) and 250 °C (squares). GHSV = 10,000 ml gcat-1 h,
10 vol.% C3H6, 10 vol.% O2 and 2 vol.% H2O.
5.3.3.2.2 Comparison with Au/SiO2 and Au/TiO2
To determine which are the active sites in the oxidation of propene with
molecular oxygen over Au/Ti-SiO2, the reaction was also performed using gold
deposited on titania or silica. For Au/TiO2, when there is no hydrogen present
in the gas feed, the conversion is negligible. The catalyst is not active for the
formation of PO or acrolein at the temperatures studied. Only small amounts of
acetaldehyde and CO can be obtained at temperatures higher than 200 °C. This
is in agreement with what has beeing reported by Hayashi et al., who indicated
140 160 180 200 220 240 2600.0
0.2
0.4
0.6
0.8
1.0
1.2
C3H
6 c
on
vers
ion
/
Acr
ole
in Y
ield
(%
)
Temperature (oC)
conv. 0.05%
Yield acrolein 0.05%
conv. 0.2%Au
Yield acrolein 0.2%
conv. 1%Au
Yield acrolein 1%Au
conv. 2%Au
Yield acrolein 2%Au
0 1 20.00
0.05
0.10
0.15
0.20
0.25
0.30
210oC
210oC
250oC
Acr
ole
in r
ate
(m
mol a
crole
in/g
cat*
h)
Au loading (wt.%)
250oC
0
10
20
30
40
50
60
70
80
Acr
ole
in r
ate
(m
mol a
crole
in/g
Au*h
)
Page 162
Results and discussion. Epoxidation with O2 and water
149
the necessity of hydrogen for the formation of hydroperoxy species that will
afterwards react with propene to produce propene oxide [6]. On the other hand,
this contrasts with what Ojeda and Iglesia published [27], since they claimed to
produce PO over Au/TiO2 with oxygen and water. The main difference with this
work is the reaction temperature, which was maintained at 77 °C. However, in
this work, a test at that temperature was carried out with the same negative
results.
When the reaction was performed over 1.0-Au/SiO2, the catalyst was active at
all temperatures studied, producing acrolein with high selectivity by only
feeding oxygen and water. The conversion reached 0.84 % with a selectivity to
acrolein of 70 % at 250 °C. These results are similar to the values published by
Suo et al. for the oxidation of propene with air (77 % selectivity at 1 %
conversion at 325 °C with 0.5 wt.% Au) [47]. When compared with the
performance of Au/Ti-SiO2 with the same gold loading (Figure 5.13), the
conversion and selectivity are similar. Only the conversion is slightly higher in
the latter case because of the formation of by-products, probably at the Ti sites.
This suggests that the active sites in Au/Ti-SiO2 for the formation of acrolein
are Au-Si and that the Ti atoms have no effect other than to produce other by-
products. The selective formation of acrolein over Au-Si catalyst was first
observed by Cant et al. in 1971 [46] for gold sponge and Au/SiO2. Also the group
of Hutchings [5, 48] reported 80 % selectivity to acrolein over impregnated
Au/SiO2 that had been reduced and oxidized prior to reaction at 260 °C.
Figure 5.13: Epoxidation of propene with molecular oxygen and water. Comparison between Au/Ti-
SiO2 and Au/SiO2. GHSV = 10,000 ml/gcat h, 10 vol.% C3H6, 10 vol.% O2 and 2 vol.% H2O.
The addition of hydrogen to the flow stream, when the reaction was performed
over Au/SiO2, almost doubles the conversion. In this case, the selectivity to
180 200 220 240 260 2800.0
0.2
0.4
0.6
0.8
1.0
1.2
1.4
1.6
1.8
2.0
C3H
6 c
on
vers
ion
/
Acr
ole
in Y
ield
(%
)
Temperature (oC)
Conv Au/SiO2
Yield Acrolein Au/SiO2
Conv Au/Ti-SiO2
Yield Acrolein Au/Ti-SiO2
Conv Au/SiO2 (H
2 + O
2)
Yield Acrolein Au/SiO2 (H
2 + O
2)
Page 163
Chapter 5: Kinetics of the selective oxidation of propene over Au-Ti
150
acrolein is considerably lower (between 38 and 60 %) and increases with
temperature. At lower temperatures, the same amount of acetone and acrolein
are produced. Also small quantities of PO can be detected at 150 °C, but this
corresponds to only 5 % of the propene converted (Table 5.4). Over this catalyst,
the conversion of hydrogen is complete, being mostly oxidized into water. The
fact that the yield of acrolein is still higher than in the case when no hydrogen
is added to the system could be attributed to the formation of hydroperoxy
(OOH*) species on the Au nanoparticles, as in the case of the epoxidation over
Au-Ti catalyst. When there is no Ti in the neighborhood of the Au nanoparticle,
the OOH* can be decomposed into other active oxygen species, which are
responsible for the oxidation of propene, among other reactions [5]. In the case
of the reaction with only molecular oxygen, the responsible species for the
attack to the allylic bond of propene to form acrolein are the very active
negatively charged oxygen radicals (O*) [3].
The fact that the reaction over Au/Ti-SiO2 exhibits the same behavior as over
Au/SiO2 indicates that the reaction mechanism followed is the same and that
active sites for the partial oxidation to acrolein are the gold nanoparticles
which are not capable of producing OOH* species. The main difference between
Au/TS-1 and Au/Ti-SiO2 in this study is the absence of alkali ions in the
synthesis of the latter. Therefore, oxygen cannot be stabilized over the Au
nanoparticles, forming OOH* afterwards.
With the aim of confirming that the acrolein production is solely due to the Au-
Si interaction and to rule out possible contaminations in the catalysts used,
supplementary tests were performed under the same reaction conditions but
using gold deposited over graphitic carbon (HSA Johnson Mattthey), which is
known to be an inert support. No acrolein or PO were produced over the Au
nanoparticles deposited on carbon. Also a blank test with pure SiO2 (Davisil)
was carried out and resulted in no propene being converted.
5.3.3.2.3 Epoxidation over Au/Ti-SiO2-Cs
An additional set of experiments was performed with Au/Ti-SiO2 synthesized
using the same deposition precipitation method as Au/TS-1, with Cs2CO3 as
precipitation agent and at a pH of 7.3. Considering that the gold deposition
over Ti-SiO2 is easier than over TS-1, the stirring was maintained only for 1
hour instead of 5. The resulting catalyst had a clear pinkish coloration,
Page 164
Results and discussion. Epoxidation with O2 and water
151
indicating low Au loading. It is also expected that the catalyst will contain a
certain amount of Cs ions.
The test reaction at 150 °C with H2 and O2 produced PO with a selectivity of
92 % at 0.7 % conversion and 6 % hydrogen efficiency, which is the same as the
result obtained for 0.2-Au/Ti-SiO2 (Table 5.3). When hydrogen was substituted
by water in the gas stream, acrolein was again the main product of the
reaction. In this case, the optimum temperature was 220 °C, at which 0.23 % of
propene was converted with 74 % selectivity to acrolein. The difference in this
case is that, as opposed to the normal Au/Ti-SiO2, 11 % of the propene
converted was transformed into PO. In the absence of water, only acrolein was
obtained, indicating that water is again involved in the formation of OOH*
species that will catalyze the epoxidation to PO. Also the conversion of 0.23 %
is higher than the conversion of 0.2-Au/Ti-SiO2 in Figure 5.12. This indicates
that the presence of Cs as promotor results in a new active species formed over
the catalyst that can increase the yield to propene oxide.
These results emphasize the importance of the presence of alkali ions in the
Au-Ti catalyst. They are responsible for the stabilization of O2 on the Au
nanoparticle that will, thereafter, react with the proton from water, producing
OOH* species. If there is no alkali ion, molecular oxygen will not be stabilized
and the formation of hydroperoxy species will not be favored.
5.3.3.2.4 Effect of the temperature
The Arrhenius plot in Figure 5.14 shows the dependence on the temperature
for the production of acrolein over Au/Ti-SiO2 and Au/SiO2. The trend for both
catalysts is, as explained before, practically the same. The calculated activation
energy is 46 kJ mol-1 for Au/Ti-SiO2 and 48 kJ mol-1 for Au/ SiO2, which are very
similar.
If this activation energy is compared to the one for the formation of acrolein
over 2.5-Au/TS-1(105)-Cs (Figure 5.9b), it is lower. However, it is comparable to
the one obtained with other Au/TS-1 catalysts in which the selectivity to
acrolein is higher than the selectivity to PO (Table 5.6). In 2.5-Au/TS-1(105)-Cs,
acrolein is formed via two routes: Via the OOH* route (Scheme 5.1) and over
the bigger Au nanoparticles (Aub, Scheme 5.2). In the catalyst studied in this
section, a very limited amount of OOH* species is formed, because of the
absence of alkali ions to stabilize O2, so the preferential route for acrolein
Page 165
Chapter 5: Kinetics of the selective oxidation of propene over Au-Ti
152
formation will be over the Au nanoparticles that cannot form OOH* species,
explaining the difference in activation energy.
Figure 5.14: Arrhenius plot for the oxidation of propene with molecular oxygen over 1.0Au/Ti-SiO2.
(■) and Au/SiO2 (●). GHSV = 10,000 ml/gcat h. Concentration of reactants: 10 vol.% O2, 10 vol.%
C3H6 and 2 vol.% H2O.
5.3.4 Kinetic study
5.3.4.1 Au/TS-1
5.3.4.1.1 Experimental results
The kinetic study of the epoxidation of propene with O2 and water was
performed over the catalyst 2.5-Au/TS-1(105). The reaction conditions used
were 230 °C, 14,000 ml gcat-1h-1 and the concentration of one of the reactants
was varied while maintaining the rest constant. The conversions, selectivities
and reaction rates obtained are summarized in Table 5.11 in Appendix 5.C.
It can be seen that the temperature of the reactions in Table 5.11 (Appendix
5.C), varies slightly in some of the experiments due to the heat losses through
the insulation of the oven. Therefore, knowing the apparent activation energy
for the formation of PO, acrolein and CO2 over this catalyst (Figure 5.9b), the
rates were corrected to the rates at 230 °C, using the equation:
2
1 2 1
1 1ln - -
app
aEr
r R T T Eq. 5.6
0.0019 0.0020 0.0021 0.0022 0.0023-19
-18
-17
-16 E
obs
a(Au/Ti-SiO
2)=46 kJ mol
-1
Eobs
a(Au/SiO
2)=48 kJ mol
-1ln
(r/m
ola
crol g
cat-1
s-1)
1/T (K-1)
Page 166
Results and discussion. Kinetic study
153
The presence of internal mass transfer limitations was evaluated using the
Weisz-Prater criterion. The evaluation of the external diffusion was done using
the Maer’s criterion. The calculations can be found in Appendix 5.A. The
results indicated that the system does not suffer from internal or external mass
transfer limitations.
At low concentrations of reactants (below 10 vol.%), the formation rate of PO
and acrolein is dependent on the concentration of all three reactants (Figure
5.15a and b). However, at higher concentrations, oxygen and water determine
the reaction rate, while propene does not have any influence. What can also be
observed is that the production of PO is even more enhanced than the
production of acrolein at higher O2 concentrations. The absence of H2O in the
feed (PH2O = 0 vol.%, reaction 21 in Table 5.11) was expected to result in no PO
being produced. Nevertheless, in that experiment, 40 % of the propene
converted produced PO and 50 % acrolein. This can be explained by the
formation of water through the combustion of propene (5.27 % selectivity to
CO2) and during the production of acrolein, which can thereafter be utilized in
the epoxidation reaction. Then, as the water added to the system increases, the
selectivity to PO increases with respect to that of acrolein. This trend is similar
to the one observed for hydrogen by Chen et al. [49] in the epoxidation with
oxygen and hydrogen. The fact that at higher concentrations of reactants, only
oxygen and water determine the formation rate of PO, indicates that they are
involved in the rate determining step, which is probably formation of OOH*
species on Au nanoparticles by O2 adsorption and reaction with the proton
obtained from the heterolytic dissociation of water [29]. The preferential
production of PO at such high concentrations also suggests that the formed
OOH* species are consumed faster in the epoxidation of propene rather than in
any other reaction that results in acrolein. Higher concentrations of propene,
even though they do not have a big impact, favor slightly the formation of
acrolein. Propene can also be adsorbed over Au nanoparticles [50], so it is
possible that it blocks some active sites for the formation of OOH*. As opposed
to the reaction with hydrogen and oxygen, where a higher concentration of
propene is beneficial by competing with hydrogen for the consumption of OOH*
species and increase the hydrogen efficiency [9], in the reaction with water and
oxygen, there is no such competition. Therefore, to enhance the PO formation, a
lower concentration of propene should be maintained.
Page 167
Chapter 5: Kinetics of the selective oxidation of propene over Au-Ti
154
a. b.
c.
Figure 5.15: Dependence of the partial pressure of the reactants in the rate formation of PO (a),
acrolein (b) and CO2 (c). Temperature: 220 °C, atmospheric pressure, GHSV = 14,000 ml gcat-1 h-1.
The concentration of one of the reactants is varied while the other two are maintained constant (O2
at 10 vol.%, C3H6 at 50 vol.% and H2O at 2.5 vol.%).
The CO2 formation (Figure 5.15c), appears to be independent of the
concentration of propene, but it is affected by an increase in the amount of
oxygen or water fed. On the other hand, it was observed that the formation of
CO2 increases with increasing PO and acrolein concentrations. This can
suggest that the CO2 produced over this catalyst originates from the further
oxidation of PO and acrolein, rather than from the direct combustion of
propene. This was also proposed by Lu et al. [51] for the epoxidation of propene
with H2 and O2. A proper kinetic analysis is necessary to confirm this
hypothesis, however, as explained in the section of catalyst stability, the rate of
CO2 increases over time and is not only dependent on the concentration of the
reactants. In Figure 5.15c, rCO2 vs. partial pressures of the reactants shows
signification scatter. Therefore, an accurate kinetic fitting of this rate proves to
be challenging. Consequently, it was decided to carry out the fitting for PO and
acrolein, but not for CO2.
0.0 0.1 0.2 0.3 0.4 0.5 0.60.0
2.0x10⁻⁸
4.0x10⁻⁸
6.0x10⁻⁸
8.0x10⁻⁸
O2
C3H
6
H2O
r PO (
mol P
O g
-1 cat h
-1)
Reactant partial pressure (bar)
0.0 0.1 0.2 0.3 0.4 0.5 0.60.0
2.0x10⁻⁸
4.0x10⁻⁸
6.0x10⁻⁸
8.0x10⁻⁸
O2
C3H
6
H2O
r Acr
ole
in (
mol A
crole
in g
-1 cat h
-1)
Reactant partial pressure (bar)
0.0 0.1 0.2 0.3 0.4 0.5 0.60.0
2.0x10⁻⁸
4.0x10⁻⁸
6.0x10⁻⁸
8.0x10⁻⁸
O2
C3H
6
H2O
r CO
2 (
mol C
O2 g
-1 cat h
-1)
Reactant partial pressure (bar)
Page 168
Results and discussion. Kinetic study
155
Initially, power-rate law fittings were done for the rate expressions of PO and
acrolein formation, using the data reported in Table 5.11 of Appendix 5.A and
according to the expression in Eq. 5.7. The fitting was carried out applying
least square regression and its accuracy was evaluated by calculating the
regression coefficient (R2) [52], as stated by Eq. 5.8.
M1: 3 6 2 2
·[ ] ·[ ] ·[ ]i
r k C H O H O Eq. 5.7
being i = PO, acrolein
21
2
21
-1-
-
j j
j
jExp
PO PON
jExp Exp
PO PON
r rR
r r Eq. 5.8
where N is the number of experimental data points, j
Exp
POr are the experimental
rates, jPO
r are the calculated rates and Exp
POr is the average of the experimental rates.
The kinetic analysis was also performed considering the adsorption of propene,
oxygen and water over the active sites of the catalyst, following a Langmuir-
Hinshelwood mechanism (L-H). This analysis can provide a better
understanding of how the reaction occurs and can suggest which are the
elementary steps involved in the mechanism of PO and acrolein formation from
propene, oxygen and water over Au-Ti catalyst. Three alternatives are taken
into account, considering that there are different types of active sites over the
catalyst: gold and titanium. The first one assumes that there is competitive
adsorption of the reactants into one single type of site which would be, in this
case, gold (M2, Eq. 5.9), therefore three gold sites would accommodate propene,
oxygen and water. The second one considers that they are adsorbed over
different independent sites, which would be propene over a Ti site while oxygen
and water would be adsorbed on two different types of gold sites (M3, Eq. 5.10).
Finally, the model defined as dual site is obtained when it is speculated that
oxygen and water are adsorbed over the same type of Au sites (therefore two of
these sites would be necessary), while propene is adsorbed over Ti sites (M4,
Eq. 5.11)
M2:
3 6 2 23 6 2 2
33 6 2 23 6 2 2
· · ·[ ]·[ ]·[ ]
[1 [ ]]
C H O H O
i i
C H O H O
K K K C H O H Or k
K C H K O K H O Eq. 5.9
ki = k’·NT, being NT the total number of vacant sites.
Page 169
Chapter 5: Kinetics of the selective oxidation of propene over Au-Ti
156
Independent sites:
M3:
3 6 2 23 6 2 2
23 6 2 23 6 2
·[ ] ·[ ] ·[ ]
1 [ ]1 1
C H O H O
i iH OC H O
K C H K O K H Or k
K H OK C H K O Eq. 5.10
Dual site:
M4:
3 6 2 23 6 2 2
23 63 6 2 22 2
·[ ] ·[ ]· ·[ ]
11 [ ]
C H O H O
i iC H
O H O
K C H K O K H Or k
K C H K O K H O
Eq. 5.11
The results for all the Langmuir-Hinshelwood regression analysis are
summarized in Table 5.7, and the graphs where the model vs. experimental
results are compared are shown in Figure 5.16.
5.3.4.1.2 Analysis of the regression of the kinetic data
Four different models are compared in this study: Power-rate law, which is an
empirical method, Langmuir-Hinshelwood (L-H) single site, where the 3
reactants compete for 1 adsorption site, L-H independent sites, where there is a
different adsorption site for each of the components and, finally, L-H dual site,
assuming that oxygen and water adsorb over the Au sites and propene on the
Ti sites.
In Figure 5.15a it can be observed that the PO formation is highly dependent
on the concentrations of oxygen and water, even at higher concentrations.
There is, on the other hand, a saturation at high concentrations of propene,
indicating that the reactant does not play an important role in the reaction
rate. These observations could be described by the results of the power-rate law
(M1) in Eq. 5.12, where the order of propene, oxygen and water are 0.04 ± 0.03,
0.6 ± 0.05 and 0.3 ± 0.07 respectively.
-7 0.04 0.03 0.6 0.05 0.3 0.07PO 3 6 2 2r =4.1·10 ·[C H ] ·[O ] ·[H O] Eq. 5.12
The high reaction order in oxygen suggests that it is involved in the rate-
determining step. The equation and the rPO trend in Figure 5.15a also suggest
the involvement of water in the mentioned rate determining step. Both
reactants probably participate in the formation of the hydroperoxy
intermediate necessary for the epoxidation of propene.
Page 170
Results and discussion. Kinetic study
157
Table 5.7: Summary of kinetic parameters for different Langmuir-Hinshelwood mechanisms. Epoxidation of propene with O2 and H2O over 0.2-
Au/TS-1(105). Temperature: 220 °C, atmospheric pressure, GHSV = 14,000 ml/gcat· h.
Model Reaction rate Compound Param. Value 95 % confidence R2
Power-rate law(M1) 3 6 2 2·[ ] ·[ ] ·[ ]ir k C H O H O
PO
kPO 4.10E-07 2.86E-07 5.34E-07
0.976 α 0.04 0.01 0.07
β 0.59 0.54 0.63
γ 0.29 0.22 0.37
Acrolein
kAcr 2.17E-07 3.97E-08 3.94E-07
0.809 α 0.04 -0.06 0.13
β 0.55 0.42 0.68
γ 0.19 -0.02 0.40
Langmuir-
Hinshelwood Single
site (M2)
3 6 2 23 6 2 23
3 6 2 23 6 2 2
· · ·[ ]·[ ]·[ ]·[1 [ ]]
C H O H Oi i
C H O H O
K K K C H O H Or k
K C H K O K H O
PO
kPO 3.18E-06 1.85E-06 4.50E-06
0.9 KC3H6 7.07 2.98 11.16
KO2 6.03 1.81 10.25
KH2O 59.48 8.88 110.07
Acrolein
kAcr 1.87E-06 1.05E-06 2.70E-06
0.792 KC3H6 15.35 -8.96 39.65
KO2 14.68 -9.71 39.07
KH2O 165.37 -139.66 470.40
Page 171
Chapter 5: Kinetics of the selective oxidation of propene over Au-Ti
158
Table 5.7 cont.: Summary of kinetic parameters for different Langmuir-Hinshelwood mechanisms. Epoxidation of propene with O2 and H2O H2O over
0.2-Au/TS-1(105). Temperature: 220 °C, atmospheric pressure, GHSV = 14,000 ml/gcat· h.
Model Reaction rate Compound Param. Value 95 % confidence R2
Langmuir-
Hinshelwood
Independent
sites (M3)
3 6 2 23 6 2 2
2 23 6 2 23 6
· · ··
1 11
C H O H Oi i
O H OC H
K C H K O K H Or k
K O K H OK C H
PO
kPO 1.50E-07 1.18E-07 1.83E-07
0.955 KC3H6 115.08 5.86 224.30
KO2 4.85 3.52 6.18
KH2O 113.51 48.53 178.50
Acrolein
kAcr 1.05E-07 6.43E-08 1.45E-07
0.808 KC3H6 117.24 -109.69 344.17
KO2 5.72 2.55 8.88
KH2O 172.07 -53.71 397.85
Langmuir-
Hinshelwood
Two sites
(M4)
3 6 2 23 6 2 22
3 63 6 2 22 2
·[ ] ·[ ]· ·[ ]·
11 [ ]
C H O H Oi i
C HO H O
K C H K O K H Or k
K C HK O K H O
PO
kPO 6.44E-07 4.80E-07 8.09E-07
0.946 KC3H6 100.24 3.26 197.21
KO2 3.22 2.23 4.21
KH2O 32.22 20.81 43.63
Acrolein
kAcr 4.14E-07 2.64E-07 5.64E-07
0.825 KC3H6 97.86 -58.06 253.78
KO2 4.50 2.09 6.91
KH2O 47.56 19.89 75.23
Note: Partial pressures are expressed in bar, adsorption constants in bar-1, and the units of k are mol gcat-1 s-1.
Page 172
Results and discussion. Kinetic study
159
Figure 5.16: Kinetic fitting for PO formation. a. Power-rate law. b. L-H Independent sites. c. L-H Two sites, and acrolein formation. d. Power-rate
law. e. L-H Independent sites. f. L-H Two sites.
d
.a.
b.
c.
e.
c f.
Page 173
Chapter 5: Kinetics of the selective oxidation of propene over Au-Ti
160
These reaction orders differ significantly from those reported for the
epoxidation of propene with hydrogen and oxygen [49, 51-53]. For instance,
Taylor et al. [53] obtained the following orders: 0.3 for O2, 0.6 for H2 and 0.18
for propene. When hydrogen is involved, the formation of the hydroperoxy
species through a reaction between hydrogen and oxygen is also the rate-
determining step. But in that case, the dissociation of hydrogen over the gold
nanoparticles may be what limits the reaction. In the reaction with oxygen, it
appears that the limitation is the adsorption and stabilization of the molecular
oxygen over the gold nanoparticles and its reaction with water. If O2 is not
adsorbed over the Au site, the reaction does not occur.
In spite of the good fitting obtained with the power-rate law, it is an empirical
expression that does not give information about the reaction mechanism.
Besides, it would not predict accurately the PO formation at propene partial
pressures lower than the ones studied in this work (0.06 bar), considering the
trend of the propene line in Figure 5.15a. This behavior can be better explained
through a Langmuir-Hinshelwood mechanism, where the equilibrium
constants for adsorption are also taken into account.
The first possible mechanism to consider is the one proposed by Chang et al.
[54] based on DFT calculations. The study was performed simulating small-
sized unsupported gold clusters (Au38 and Au10). According to their calculations,
water and oxygen are favorably co-adsorbed over the same kind of Au atom (in
the apex sites). The formation of hydrogen bonds between both species helps to
stabilize the co-adsorption. This favors the formation of hydroperoxy (OOH*)
and hydroxyl (OH*) radicals over the Au clusters with an energy barrier as low
as 26.3 kJ/mol. Propene can be favorably adsorbed on the same gold atom as
OOH*, and the PO formation can take place, being the epoxidation reaction the
rate limiting step of the whole process. This combination of reaction steps
explains the results obtained by Lee et al. over unsupported Au clusters [30].
This mechanism can be modeled assuming a Langmuir-Hinshelwood
mechanism with one type of site, where there is competitive adsorption of the
three reactants. Therefore three of these sites take part in the mechanism (M2,
Eq. 5.9). The results of this model did not correspond with the experimental
observations (Table 5.7) and the predicted rPO with respect to the partial
pressure of reactants follows a parabola that does not represent the
experimental results. The main difference between this study and the
conditions used in the DFT calculations of Chang et al. is the fact that the gold
nanoparticles in this case are supported on TS-1. It is generally accepted that
Page 174
Results and discussion. Kinetic study
161
Ti-OOH species are intermediate species in the epoxidation of propene [6, 38].
Therefore, it is expected that, in the presence of a Ti-containing support, the
reaction path would also involve the Ti site, thus at least two different types of
active sites: Au and Ti. This alternative was also considered in this study and
modeled by M4 (Eq. 5.11). This model assumes that O2 and H2O adsorb on the
same type of gold site, while propene is adsorbed on a different Ti site. The
approximation provided by M4 was in good agreement with the experimental
data points (R2 = 0.946) (Figure 5.16c), suggesting that the actual mechanism
probably involves both sites. An additional test was done by evaluating the
possibility that there are 3 different types of active sites (M3, Eq. 5.10), like it
has been considered in the reaction with H2 and O2 [53]. In this case, oxygen
and water would be adsorbed on different types of sites within the gold
nanoparticle and propene on a Ti site. Numerically, this regression proved to be
the most accurate. However, this model is not coherent with the theoretical
observations of Chang et al. [54]. As it has just been explained, the synergetic
effect of the co-adsorption of O2 and H2O favors the stabilization of both species
over the gold cluster and the further OOH* formation. The production of OOH*
is also necessary for the weakening of the O-O bond that will result in further
epoxidation reactions. It can be concluded that, even though, numerically, the
best fit was obtained with the 3-site model, a more complex mechanism
dominates the epoxidation of propene with O2 and H2O.
A more detailed kinetic study can be performed based on the obtained results
and taking into account also the possible intermediate steps of the reaction
explained in Scheme 5.1. Considering the aforementioned reaction sites: Au (*)
and Ti (■), one can assume that oxygen and water are co-adsorbed over the
same type of Au site (*1 and *2) and react forming hydroperoxy (OOH*) and
hydroxyl (OH*) species (*3). Based on the trends observed in Figure 5.15a for
the formation of PO, it can be said that this is the rate determining step
(RDS1). The resulting OH* radicals react with each other, producing water and
O* (*4). Therefore, the water molecule is not consumed during the reaction,
even though its presence is essential for the formation of hydroperoxy radicals,
and thus, PO [54]. This is confirmed by the results of this study, where the
absence of water resulted in very limited PO formation and high selectivity to
acrolein. Afterwards, similar to the mechanism proposed by Lu et al. [51], the
formed hydroperoxy species are transferred to the adjacent Ti site, forming the
active Ti-OOH species (■7). Propene adsorbs in equilibrium on that same Ti
site with OOH■ (■8) and then the epoxidation takes place (■9), producing PO
Page 175
Chapter 5: Kinetics of the selective oxidation of propene over Au-Ti
162
and OH, and being the other rate determining step in this mechanism (RDS2).
Afterwards, PO is desorbed (■10) and OH is transferred to the gold site (■11).
For a complete analysis of the mechanism, the irreversible decomposition of the
formed OOH* species should be also taken into account. A simplified equation
for this step is provided by equation (*5). The formation of OOH* would, then,
be equal to the rage of the amount of PO produced (rPO) plus the rate of the
OOH* decomposed (rD):
OOH PO Dr r r Eq. 5.13
- Au site:
O2 (g)+*↔O2* (*1)
H2O(g)+*↔H2O* (*2)
O2*+H2O*→OOH*+OH* RDS 1 (*3)
OH*+OH*→H2O*+O* (*4)
OOH*+*→O*+OH* (*5)
2O*+C3H6 (g)→ C3H4O(g)+H2O* (*6)
- Ti site:
OOH*+∎↔OOH∎+* (■7)
OOH∎+C3H6 (g) ↔ C3H6 -OOH∎ (■8)
C3H6 -OOH∎→ C3H6 O-OH∎ RDS 2 (■9)
C3H6 O-OH∎↔OH∎+C3H6 O (g) (■10)
OH∎+*↔OH*+∎ (■11)
Scheme 5.1: Proposed reaction mechanism for the epoxidation of propene with water and oxygen
over Au/TS-1-Cs
Page 176
Results and discussion. Kinetic study
163
The derivation of the kinetic expression can be found in Appendix 5.B and the
final equation that represents the mechanism of the epoxidation of propene
with oxygen and water is the following:
2 2 2 2
2
2 2 2 2 2 2 2 23 6
1 ·
OOH O O H O H OPO
OOH DO O H O H O O O H O H O
OH C H
k P K P Kr
k kP K P K P K P K
k P
Eq. 5.14
The production of acrolein over Au/TS-1 (Figure 5.15b), follows a similar trend
as the production of PO, suggesting that both mechanisms could be correlated.
There is, however, a milder dependency on oxygen and water than in the case
of PO. Once again, the influence of propene is almost inexistent. The power-
rate law analysis confirms this (Eq. 5.15).
-7 0.04 0.09 0.55 0.13 0.19 0.213 6 2 22.17·10 ·[ ] ·[ ] ·[ ]Acroleinr C H O H O Eq. 5.15
The formation of acrolein is originated by the attack of very active oxygen
species to the allylic C-H bond of propene [3]. It can follow different paths.
First, through the oxidation of propene over the bigger Au nanoparticles [29] or
the Au nanoparticles that are not capable of producing OOH* species because
there is no alkali ion present that can stabilize the molecular oxygen (which
will be discussed in more detail later in this chapter). Additionally, the O*
radical resulting from the formation of water from two hydroxyl radicals or the
decomposition of hydroperoxy species (reactions *5 and *6 in Scheme 5.1), can
react in a non-selective way with propene, attacking the allylic C-H bond and
producing acrolein (Figure 5.1, step 7). The decomposition can also occur when
OOH* species are formed over Au nanoparticles but there is no neighboring Ti
atom whereto the hydroperoxy species can be transferred and take part in the
epoxidation. Therefore, an extra term could be included, accounting for the
percentage of Au nanoparticles that are in close proximity to Ti atoms and
would result in PO and acrolein being produced, while the other fraction would
originate the direct decomposition of the OOH* species being formed and favor
the formation of acrolein. However, it is not possible to determine this fraction
of Au sites and all the Au nanoparticles capable of producing hydroperoxy
species assumed identical.
The results obtained in this kinetic study with the initial L-H equations (Table
5.7) do not describe the acrolein formation in a very accurate manner, with
Page 177
Chapter 5: Kinetics of the selective oxidation of propene over Au-Ti
164
regression coefficients not higher than 0.83. The reason for this can be the
different reaction paths mentioned. However, the one that best models the
results obtained (Table 5.7) is the L-H with two sites, even though the propene
adsorption constant is always misrepresented, with very broad confidence
intervals. Therefore, a specific kinetic equation for acrolein would also be
necessary.
If the same reasoning as for the formation of PO is followed for acrolein,
Scheme 5.1 can provide an approximation for the acrolein synthesis via OOH*.
It can be assumed the very active O* species formed will preferentially attack
the allylic C-H bond of propene, resulting in acrolein, rather than the C=C
bond, which would produce PO [3]. An Eley-Rideal mechanism was assumed for
this reaction. Therefore, combining the equations in which these species are
formed (during the water formation via OH* reaction and during the
decomposition of OOH*), the following kinetic expression can be obtained:
2 2 2 2
2
2 2 2 2 2 2 2 2
2
2 2 2 2 2 2 2 2
3 6 2
2 2 2 2 2 2 2 2
2 1 ·
1 ·
1
1 ·
OOH O O H O H OAc
OOHO O H O H O O O H O H O
OH
D
OOHO O H O H O O O H O H O
OH
DC H
OOHO O H O H O O O H O H O
OH
k P K P Kr
kP K P K P K P K
k
k
kP K P K P K P K
k
kP
kP K P K P K P K
k
Eq. 5.16
The results of the fitting can be seen in Table 5.8. They proved to be fairly
accurate for the PO formation, suggesting that the model could be a good
approximation to what the actual mechanism is. It supports the reaction
mechanism proposed by Huang et al. [29] and confirms that the main
limitation for this reaction to occur is the formation of hydroperoxy species
from water and oxygen.
From the adsorption constants reported in Table 5.7 for all of the L-H models,
it is clear that the adsorption of oxygen is negligible in comparison with the
values for water. This was also noticed in the coupled mechanism, where the
Page 178
Results and discussion. Kinetic study
165
calculated adsorption constant for oxygen is 0. This value is obviously not
possible, otherwise the constant kOOH’, which is a combination of kOOH·KO2·KH2O,
would be also 0. Since for the production of OOH* the co-adsorption of both O2
and water is necessary, a consequence of KO2 being 0 would be no PO being
formed (rPO=0). What can be concluded from these results is that PO2KO2<<1,
where the actual value of KO2 is smaller than the error in the fitting of the
parameters. As explained by Huang et al. [29], the presence of alkali ions in the
catalyst is essential to stabilize the molecular oxygen over the Au nanoparticle,
indicating that the adsorption of O2 over Au is limited with respect to that of
water.
The kinetic modeling results for acrolein were not as accurate as those of PO.
The influence of propene was underestimated. It should be remembered that
there is a contribution to the acrolein formation over the bigger Au
nanoparticles, or over those Au not in contact with alkali ions. These gold sites
are not capable of producing OOH* species from O2 and H2O [54], resulting in
the direct partial oxidation, which is not represented in equation 16. An
additional term for the acrolein formation over those types of gold sites (▲,
Aub) should be added to the kinetic expression. The proposed mechanism is
depicted in Scheme 5.2 and the correspondent kinetic equation is derived in
Appendix 5.B, resulting in Eq. 5.17.
3 2 2 3 6
2 2 3 2 2 3 6
1
b Ac O b O C HAc
O b O O b O C H
k K K P Pr
K P K K P P Eq. 5.17
- Aub site, not capable of producing OOH* species:
O2 (g)+▲↔O2▲ (▲1)
O2▲+C3H6 (g) ↔C3H6-O2▲ (▲2)
C3H6-O2▲→C3H4O-H
2O▲ (▲3)
C3H4O-H2O▲↔C3H4O(g)+ H
2O▲ (▲4)
Scheme 5.2: Proposed reaction mechanism for the acrolein (C3H4O) formation over those gold sites
not capable of producing OOH* species.
Page 179
Chapter 5: Kinetics of the selective oxidation of propene over Au-Ti
166
Table 5.8: Kinetic parameters for the model proposed in Equation 5.14, 5.16 and 5.17.
Eq. Parameter Units Value model Value
calculated 95 % confidence R2 (PO) R2 (Acr)
PO and acrolein (Eq. 5.14 and
Eq. 5.16)
kOOH’ =kOOH KO2 KH2O mol gcat
-1 s-1 bar-2 8.2·10-5 1.9·10-5
0.96 0.79
KO2 bar-1 0 --
KH2O bar-1 19.3 5.6
kOOH mol gcat-1 s-1 bar-2 4.3·10-6/ KO2
kOH’= kOOH
’ / kOH mol gcat-1 s-1 315.1 138.2
kOH mol gcat-1 s-1 2.3·10-7
α= kPOK1K2 mol gcat-1 s-1 bar-2 3.8·10-5 (a)
kD mol gcat-1 s-1 2.1·10-6 1.4·10-6
Acrolein over Aub Eq. 5.17 (b)
kAc mol gcat-1 s-1 1.6·10-8 5.1·10-9
KO2b bar-1 0.31 0.44
K3 bar-1 271.8 (a)
NOTE: The fitting of the three equations was done simultaneously.
(a) Indeterminate value during the fitting. Therefore no confidence interval can be provided.
(b) Gold nanoparticles not capable of producing OOH* species from O2 and H2O.
Page 180
Results and discussion. Kinetic study
167
The regression provided by a combination of Eq. 5.16 and Eq. 5.17 proved to
represent the reaction rate of acrolein in a more accurate manner, suggesting
that acrolein is being produced both in the sites where OOH* is produced and,
in a direct way, over the bigger Au nanoparticles or those without alkali ions.
Once again, the adsorption constant of oxygen in the other gold sites (KO2b) is
insignificant and comparable to that in the small Au clusters. This highlights
the weakness of the interaction between oxygen and gold, which is based on the
exchange of an electron to form O2-. This is the reason why gold is active for the
epoxidation of propene. If the interaction would be too strong, O2 would
dissociate and the resulting in the formation of acrolein or complete oxidation
to CO2 and H2O. This is the case of silver catalysts, in which the allylic
intermediates formed are easily combusted, being CO2 the main product of the
oxidation of propene [3]. The adsorption of propene over the gold-oxygen site
(K3) is considerably stronger than that of oxygen. The reaction rate of acrolein
over Aub sites (kAc) is the smallest of all, indicating that the major part of the
acrolein should be produced over the small Au clusters after OOH*
decomposition or hydroxyl reaction.
As explained before, for those gold nanoparticles not close to Ti atoms, the
formed OOH* species would be directly decomposed, and would favor the
formation of acrolein. In those cases, rAc=rD.
Finally, the rate of decomposition of the hydroperoxy species being formed was
also considered, since it is known that hydrogen peroxide easily decomposes at
higher temperatures [55]. That is the reason why the direct synthesis of
hydrogen peroxide with oxygen and hydrogen is normally carried out at
temperatures below 20 °C [56]. The value of the decomposition constant
obtained with this model was lower than the expected constant for the
formation of OOH* species (kOOH), since the final value would be larger than
4.3·10-6, because KO2 is very small. For this reason there is PO production,
otherwise, all the hydroperoxy species formed would be decomposed
immediately and acrolein would be the main product.
5.3.4.1.3 Summary of the kinetics over Au/TS-1
To conclude this section, it can be said that two competitive reactions occur
over the surface of Au/TS-1 during the oxidation of propene with water and
oxygen: epoxidation to PO and partial oxidation to acrolein. Most probably both
Page 181
Chapter 5: Kinetics of the selective oxidation of propene over Au-Ti
168
of them pass through the initial formation of OOH* species, which is the rate
determining step. According to Lee et al. [30], the maximum ratio PO/acrolein
that they produced in such a catalytic system was 14/1. However, they
prepared a very sophisticated catalyst, with controlled Au6-10 clusters. The
calculations of Chang et al. indicate that over those small Au clusters, O*
species can also produce PO when reacting with propene in an Eley-Rideal
mechanism [54]. A normal deposition-precipitation method is not capable of
guaranteeing such a controlled particle size, even in the results of Huang et al.,
using solid grinding, the maximum selectivity to PO reported is 52 % [29].
Therefore, by understanding the reaction mechanism and the role of each
reactant in the reaction, it will be possible to tune the concentrations to shift
the PO/acrolein ratio to the best interest. To favor the PO formation, it is
important to maintain high concentrations of oxygen and water to make sure
that there are enough OOH* groups. The fact that the PO rate is higher than
the acrolein rate at higher concentrations of those two reactants indicates that
the OOH* species are consumed faster by the propene in the epoxidation
reaction rather than the in decomposition to form O* groups that would lead to
acrolein. The effect of the propene partial pressure is small in comparison with
the role of oxygen and water; nevertheless, it has been observed that higher
concentrations of the olefin are detrimental for the PO formation probably
because it blocks the gold sites where OOH* species are formed. Another
reason can be that high concentrations of propene enhance more the formation
of acrolein over the other gold sites (Scheme 5.2).
The kinetic model developed here agrees with the mechanism proposed by
Huang et al. [29] and depicted Figure 5.1. According to it, oxygen and water are
co-adsorbed over the same type of gold site. The electron transfer between both
molecules favors the formation of adsorbed OOH* species over the gold
nanoparticles that are, afterwards, transferred to a neighboring Ti site and
forms the well-known active Ti-OOH species. Propene is adsorbed over that
site, forming Ti-OOH-C3H6 that reacts producing PO and a hydroxyl group.
Two hydroxyl groups can react with each other, resulting in water and a very
active O* species that attack the allylic bond of propene producing acrolein.
This is the reason why, even though water is not consumed in the reaction, its
presence is essential for this to happen.
Acrolein is formed via two mechanisms. The first one involves the OOH*
production over Au sites, which has been explained before. There is a
percentage of gold nanoparticles not in contact with Ti atoms. Even if these
Page 182
Results and discussion. Kinetic study
169
sites are capable of producing hydroperoxy species, it will decompose, resulting
in O* that catalyzes acrolein formation. The second route is the direct partial
oxidation of propene over those sites not capable of producing OOH* species,
either because the Au particles are too big or because of the absence of alkali
ions near the particle.
This highlights the importance of the preparation method of the catalyst. If the
aim is to selectively produce PO, very small Au nanoparticles should be
deposited, minimizing the presence of big ones, and alkali salts should be used
during the deposition precipitation, to make sure that O2 is properly stabilized
on the nanoparticle and can react with water to produce OOH*. On the other
hand, the presence of adjacent Ti atoms to the gold nanoparticles is essential,
where the OOH* species can be transferred and that are the known
intermediate species in the epoxidation of propene.
5.3.4.2 Acrolein formation over Au/Ti-SiO2
As previously explained, the oxidation of propene with oxygen over Au/Ti-SiO2
produces acrolein in a selective manner. Figure 5.17a shows the influence of
the concentration of the reactants in the formation rate of acrolein. It is evident
that the concentration of oxygen plays the most important role. Water, on the
other hand, has almost no influence. The green circles show a small increase
from 0 to 0.01, but after that, the rate remains the same. Furthermore, in
Figure 5.17b there is a very small difference between the reaction with and
without water (blue line with full and empty triangles). The combination of
these two observations indicates that water is not involved in the rate
determining step, as opposed to what was reported for acrolein over Au/TS-1
(Figure 5.15b). Therefore, the main formation of acrolein over Au/Ti-SiO2 does
not pass through the synthesis of OOH* species, which also explains why no
PO is produced. There should be, nevertheless, a small amount of OOH* groups
being formed, which would account for the small increase in the rate with and
without water. This could occur on the very small Au clusters that do not even
appear in the TEM pictures. It could also be that water is strongly adsorbed
and, once there is enough, the rate would only depend on the concentration of
oxygen.
The effect of propene is, once again, very limited. Only at small concentrations
it is possible to see the increase in the rate with propene partial pressure.
Page 183
Chapter 5: Kinetics of the selective oxidation of propene over Au-Ti
170
Saturation is reached already at 0.05 bar. All this indicates that only oxygen is
involved in the rate determining step.
a.
b.
Figure 5.17: Oxidation of propene with molecular oxygen and water over Au/Ti-SiO2. a. Influence of
the concentration of reactants in the acrolein formation rate. Red squares: variation of propene
concentration while maintaining 10 vol.% O2 and 2 vol.% H2O. Blue triangles: variation of the
oxygen concentration with 50 vol.% C3H6 and 2 vol.% water. Green circles: variation of H2O with
10 vol.% O2 and 10 vol.% C3H6. b. Influence of the presence of water in the feed when varying
oxygen. Full triangles: 2 vol.% water. Empty triangles represent no water in the feed. Constant
propene flow: 1 vol.%. For all experiments: Temperature 210 °C, GHSV = 10,000 ml gcat-1 h-1.
5.3.4.2.1 Regression of the kinetic data and discussion
A similar kinetic study as the one carried out for Au/TS-1 was also performed
for Au/Ti-SiO2. Power-rate law and Langmuir-Hinshelwood models were fitted
to the experimental results obtained for the production of acrolein. Once again,
the possibility of the components being adsorbed over the same type of active
site (Au), or over 3 different types of active sites are considered.
0.0 0.1 0.2 0.3 0.4 0.5 0.60.0
2.0x10⁻⁸
4.0x10⁻⁸
6.0x10⁻⁸
8.0x10⁻⁸
C3H
6
Acr
ole
in r
ate
(m
ol a
crole
in g
cat-1
h-1)
Reactant partial pressure (bar)
O2
H2O
0.0 0.1 0.2 0.3 0.4 0.5 0.60.0
1.0x10⁻⁸
2.0x10⁻⁸
3.0x10⁻⁸
4.0x10⁻⁸
5.0x10⁻⁸
Acr
ole
in r
ate
(m
ol a
crole
in g
cat-1
h-1)
Oxygen partial pressure (bar)
Page 184
Results and discussion. Kinetic study
171
The results of the fittings are shown in Table 5.8. The power-rate law model
proved to be the most accurate fitting (Eq. 5.18). In this case, as predicted, the
influence of water in the formation rate is insignificant, with an order of 0.03.
According to this model, oxygen has the highest influence in the formation of
acrolein, confirming that it is involved in the rate determining step, and this
value is even higher than in the case of Au/TS-1.
-7 0.21 0.02 0.77 0.02 0.03 0.023 6 2 22.64·10 ·[ ] ·[ ] ·[ ]Acroleinr C H O H O Eq. 5.18
Again, the model with only one type of site (M2B) does not represent the
experimental data obtained in an accurate manner. The best results were
obtained when considering 3 different types of sites. However, the adsorption
constant of water (KH2O) has big errors, which could indicate that water is not
actually involved in the mechanism or it could also mean that there is very
strong adsorption of water, therefore KH2O[H2O]>> 1. The model with dual site,
in which water and oxygen are adsorbed over Au and Ti over a different site,
does not predict properly the influence of water (Figure 5.16d). Taking into
account that titanium is essential for the production of PO, but not for acrolein,
it can be assumed that the second site does not involve a Ti atom, as was the
case in Au/TS-1. This second site could be another type of site on the gold atom,
or the location where oxygen is adsorbed, like in Scheme 5.2.
The adsorption constant of oxygen is, in all the models, very small, like in the
case of Au/TS-1. The propene adsorption constant is accurately represented and
appears to play an important role. The adsorption of oxygen is very limited
with respect to the other reactants, and determines the reaction rate for
acrolein formation. The role of water is not exactly clear in these models. It
could be blocking the active sites for the reaction of acrolein (equation ▲3 in
Scheme 5.2 or taking part in the reaction, but only in the acrolein synthesis
that goes through OOH* formation (Scheme 5.1).
Page 185
Chapter 5: Kinetics of the selective oxidation of propene over Au-Ti
172
Table 5.9: Dependencies of the formation of acrolein on the concentration of reactants applying a power -rate law fitting and L-H. Catalyst: Au/Ti-
SiO2, temperature 210 °C, GHSV = 10,000 ml/gcat h.
Model Reaction rate Compound Param. Value 95 % confidence R2 F-
value
Power-rate
law(M1B) 3 6 2 2·[ ] ·[ ] ·[ ]ir k C H O H O Acrolein
kAcrol 2.64E-07 1.9E-08
0.998 1.02e4 α 0.21 0.02
β 0.77 0.02
γ 0.03 0.02
Langmuir-
Hinshelwood
Single site
(M2B)
3 6 2 23 6 2 2
33 6 2 23 6 2 2
· · ·[ ]·[1 ]
C H O H O
i i
C H O H O
K K K C H O H Or k
K C H K O K H O Acrolein
kAcrol 1.78e-5 3.12e-5
0.87 128 KC3H6 2.79 1.10
KO2 0.79 1.58
KH2O 18.36 8.92
Langmuir-
Hinshelwood
Independent
sites 3
components
(M3B)
3 6 2 23 6 2 2
3 6 2 23 6 2 2
· · ··
1 1 1
C H O H O
i i
C H O H O
K C H K O K H Or k
K C H K O K H O Acrolein
kAcrol 3.17E-07 1.34e-7
0.983 1.09e3
KC3H6 29.55 12
KO2 1.27 0.69
KH2O 2365.86 3500
Langmuir-
Hinshelwood
Dual sites
(M4B)
3 6 2 23 6 2 2
23 63 6 2 22 2
·[ ] ·[ ]· ·[ ]·
1 1 [ ]
C H O H O
i i
C HO H O
K C H K O K H Or k
K C H K O K H O Acrolein
kAcrol 1.46e-6 1.26e-6
0.91 196 KC3H6 61.11 74.2
KO2 1.11 1.2
KH2O 38.3 15.7
Note: Partial pressures are expressed in bar, and the units of k are those so that the final rate is mol gcat-1 s-1.
Page 186
Results and discussion. Kinetic study
173
Figure 5.18: Kinetic regression for Acrolein formation with the 4 models with the experimental data for the epoxidation of propene over Au/Ti-SiO2.
a. Power-rate law. b. L-H Single site 3 components. c. L-H Three independent sites. d. L-H Dual site
c.a.
b. d.
Page 187
Chapter 5: Kinetics of the selective oxidation of propene over Au-Ti
174
Considering that Au/Ti-SiO2 has a similar elemental composition as Au/TS-1
and that it is composed of small Au nanoparticles deposited on a support where
Ti is highly dispersed, it is reasonable to assume that the mechanism proposed
for the latter catalyst Scheme 5.1and Scheme 5.2 could also be applied to this
catalyst. However, experimentally no PO was observed over Au/Ti-SiO2,
probably because the gold nanoparticles contained in the catalyst are not
capable of producing a noticeable amount of OOH* species due to the absence
of alkali ions. Therefore, only the evaluation for acrolein synthesis was fitted
with the equation obtained with that model. In this equation both contributions
to acrolein formation are considered: the one passing through OOH* species
(Eq. 5.16) and the one in which oxygen attacks directly the allylic bond of
propene (Eq. 5.17). All combined in the following expression (Eq. 5.19):
2 2 2 2
2
2 2 2 2 2 2 2 2
2
2 2 2 2 2 2 2 2
3 6 2
2 2 2 2 2 2 2 2
2 1 ·
1 ·
1
1 ·
OOH O O H O H OAc
OOHO O H O H O O O H O H O
OH
D
OOHO O H O H O O O H O H O
OH
DC H
OOHO O H O H O O O H O H O
OH
k P K P Kr
kP K P K P K P K
k
k
kP K P K P K P K
k
kP
kP K P K P K P K
k
3 2 2 3 6
2 2 3 2 2 3 6
1
Ac O b O C H
O b O O b O C H
k K K P P
K P K K P P
Eq. 5.19
The resulting parameters are shown in Table 5.10.
The model fits the experimental results well, indicating that the acrolein
obtained in the experiments is produced via the two different gold sites. Initial
attempts to fit only the equation formed without OOH* did not give accurate
results, confirming the small contribution of the small Au clusters.
Therefore, it can be concluded that acrolein can be produced over large (>5 nm)
Au nanoparticles by the formation of oxidizing species that attack the allylic C-
H bond of propene. This reaction can also occur over smaller Au nanoparticles
when there is no alkali ion present that can stabilize the negatively charged,
Page 188
Results and discussion. Kinetic study
175
therefore no OOH* species can be formed. There is a small percentage of
acrolein being produced after the decomposition of hydroperoxy species into O*
and OH* when there is no neighboring Ti. This OOH* species can be formed
over small Au clusters.
Table 5.10: Kinetic parameters for the model proposed in Eq. 5.19 for the formation of acrolein over
Au/Ti-SiO2.
Parameter Units Value in model 95 % confidence R2 (Acr)
kOOH’ =kOOH KO2 KH2O mol gcat
-1 s-1 bar-2 2.9·10-5 1.2·10-5
0.936
KO2 bar-1 0 --
KH2O bar-1 37.3 15.9
kOH’ mol gcat
-1 s-1 0 --
kOH = kOOH’ / kOH
’ mol gcat-1 s-1 --
α= kPOK1K2 mol gcat-1 s-1 bar-2 0 --
kD mol gcat-1 s-1 3.5·103 (a)
kAc mol gcat-1 s-1 2.03·10-8 1.08·10-8
KO2b bar-1 0.18 0.16
K3 bar-1 436 (a)
(a) Indeterminate value during the fitting. Therefore no confidence interval can be provided.
5.4 Summarizing discussion
After years of study of gold-based catalysis, it is evident that the activity and
product distribution are highly dependent on the gold dispersion, on the
particle size, on the nature of the support and on the preparation method [57].
This has been observed in this chapter, in which two catalysts with similar
elemental composition catalyze in an different manner the epoxidation of
propene with oxygen and water.
Two Ti-Au catalysts were tested in the oxidation of propene, first with
hydrogen and oxygen and then with oxygen and water: Au/TS-1 and Au/Ti-
SiO2. The main difference between them, besides the support, is the presence of
Cs ions in the former due to the different precipitation agent used during the
deposition precipitation method.
Page 189
Chapter 5: Kinetics of the selective oxidation of propene over Au-Ti
176
Both catalysts were very active for the epoxidation of propene with H2 and O2
with values similar to those in the literature. However, the best performance
was obtained with Au/TS-1, proving that the zeolite is a better support [38]. It
is known that the high dispersion of titanium is beneficial for a higher propene
conversion and PO selectivity. Considering the preparation method for Ti-SiO2
(Ti grafting), it is likely that two or more Ti atoms will be grafted together [10],
even more at high Ti loadings like the one used in this study. In TS-1, the Ti
atoms are forced to be crystallographically insulated within the silica matrix
[38]. Additionally, because of the low isoelectric point (IEP) of silica, during the
deposition-precipitation method, the anionic gold is more attracted to the Ti
sites, whose IEP is higher [17, 58], resulting in very isolated Ti atoms in close
proximity to Au nanoparticles. With both catalysts it was observed that lower
gold loadings gave higher PO selectivities, because of the higher dispersion of
gold, avoiding possible sintering and favoring the formation of smaller gold
nanoparticles that give a higher interface between Au and Ti. It should be
noted the possible influence of the presence of Cs in Au/TS-1, which is expected
to stabilize Au nanoparticles inside the TS-1 pores, which can be active species
for the epoxidation [33].
The epoxidation with oxygen in the presence of water was performed
successfully. Water acts as a kind of catalyst, since it is not consumed, but it is
necessary for the reaction to occur. The kinetic study performed here confirms
the mechanism proposed by Huang et al. [29], in which oxygen is co-adsorbed
with water and forms OOH* species over the small Au nanoparticles. These
species are transferred to the neighboring Ti site, forming Ti-OOH species,
which are the active species during the epoxidation of propene with hydrogen
peroxide. Then propene reacts with Ti-OOH, producing PO and adsorbed
hydroxyl species. Parallel to this, part of the OOH* groups are decomposed into
OH* and O* species. The OH* reacts giving water and another O*. O* groups
are very active and tend to attack the allylic bond of propene, producing
acrolein. This is the reason why the experiments performed in this study
produce very similar amounts of PO and acrolein. As explained before, the
presence of alkali ions is essential for the stabilization of O2- and further
formation of hydroperoxy species. In the absence of alkali ions, which is the
case of Au/Ti-SiO2, almost no OOH* is being produced, so oxygen reacts directly
with propene producing acrolein. In the experiment where Au was deposited
over Ti-SiO2 in the presence of Cs, the catalyst was capable of producing small
amounts of PO, only when water was co-fed, suggesting that it is actually
forming OOH* species from O2 and H2O. The big difference in selectivity
Page 190
Summarizing discussion
177
between the two catalysts might be traced back to the Ti insulation in the
support, which will always be better in TS-1.
Even if OOH* species are being formed over Au nanoparticles, if there is no Ti
atom in close proximity, the hydroperoxy species cannot be transferred and
they will be directly decomposed into OH* and O*, which will result in acrolein
being formed. This is the case in the oxidation of propene with H2 and O2 over
Au/SiO2. Hydrogen and oxygen produce OOH* species over Au nanoparticles,
but in the absence of Ti, they decompose and produce acrolein. When there is
no hydrogen, acrolein is mostly produced from the reaction between oxygen and
propene. If hydrogen is added, also OOH* species are being formed,
contributing to the total acrolein rate. That is why the acrolein yield is higher
when H2 is co-fed, even though the reaction is less selective because of the
synthesis of other by-products. The fact that Au/Ti-SiO2 shows the same
behavior in the reaction with oxygen and water as Au/SiO2 is due to the
absence of alkali ions. Since no OOH* species could be formed, O2 will just
react with propene to give acrolein and Ti has no effect in the reaction.
Scheme 5.3 summarizes the reactions that can take place over Au-Ti catalyst
during the oxidation of propene with oxygen and water.
Scheme 5.3: Summary of the reactions taking place over Au-Ti catalyst during the reaction of
propene with oxygen and water. X indicates the absence of Ti or alkali ions.
C3H6
O2 + H2O
Small Au nanopart.
Alkali ion
Ti
PO
Acrolein
X Acrolein
X
Ti Acrolein
X Acrolein
Large Au particle
Acrolein
CO2
OH*+O*
2 O*
2 O*
Page 191
Chapter 5: Kinetics of the selective oxidation of propene over Au-Ti
178
5.5 Conclusions
A kinetic study has been carried out for the epoxidation of propene with
molecular oxygen in the presence of water with the aim of understanding the
reaction mechanism and thereby improving the PO selectivity. Two types of
Au-Ti catalysts have been tested: Au/TS-1 and Au/Ti-SiO2.
In the case of TS-1, an initial catalyst screening has been carried out, with the
aim to identify the optimum gold and titanium loading, as well as the most
suitable alkali ion for the epoxidation, both with hydrogen-oxygen and with
water-oxygen. It was determined that lower Ti and gold loadings favor the
selectivity to PO and that Cs favors the gold incorporation in the catalyst,
creating more active sites. The epoxidation with water and oxygen was
performed successfully over Au/TS-1-Cs, with selectivities to PO up to 54 %,
with acrolein as the most important by-product. A kinetic model was developed
for the reaction, including PO and acrolein formation considering two types of
active sites: Au sites, where water and oxygen react, and Ti sites, over which
the epoxidation takes place. Two rate determining steps were considered, the
first one is the formation of OOH* species from oxygen and water over the gold
nanoparticle and thanks to the stabilization of the molecular oxygen by the
alkali ion. The second one is the epoxidation reaction. Acrolein is formed by the
reaction of propene with very active O* species. These species can be formed in
the same Au-Ti sites as PO, via OOH* species, or directly from oxygen, in gold
nanoparticles that are too big or do not contain alkali ions, so they cannot
produce hydroperoxy species.
Gold over Ti-SiO2 was also evaluated and proved to be active for the
epoxidation with hydrogen and oxygen, but only produced acrolein when the
reactants were oxygen and water. The reason for this is, mainly, the absence of
alkali ions in the catalyst. The acrolein rate was equivalent as the one obtained
over Au/SiO2, suggesting that Ti does not play any role in the reaction.
As a conclusion, it can be said that the epoxidation of propene with molecular
oxygen is possible in the presence of water. The presence of alkali ions and Ti
atoms in the support are essential. An increase in the concentration of oxygen
and water favors the OOH* formation, therefore enhancing the PO/acrolein
ratio.
Page 192
Outlook
179
5.6 Outlook
The epoxidation of propene with molecular oxygen and water would be an ideal
process for industrial implementation that would reduce reactant and
operation costs, simplifying the current production of PO. However, more
research should be done regarding the catalyst development. So far, the
catalyst used has been optimized for the epoxidation with hydrogen and
oxygen, while an optimum should be found in terms of gold-titanium
interaction and the presence of promoters. It should be taken into account that
the current conversion values reported for this reaction are within the same
range as the ones obtained at the end of the 90’s for the epoxidation with
hydrogen and oxygen. The industrial reference values established by Haruta in
2004 [20] would need to be re-evaluated, considering that the reactants costs
would be lower, since oxygen can be obtained from the air, therefore probably
even with lower PO yields, the process could be economically feasible.
Appendix 5.A: Internal and external mass transfer limitations
Internal Diffusion: Weisz-Prater Criterion
The absence of internal mass transfer limitations was evaluated using the
Weisz-Prater criterion, where if CWP, shown in Eq. 5.A.1, is lower than 1, the
internal mass transfer effects can be neglected [59]:
' 2
1cA obs
WPe AS
r RC
D C Eq. 5.A.1
with:
-r’A(obs) = observed reaction rate: 4·10-7 kmol kgcat-1 s-1
ρc = Solid catalyst density: 500 kg m-3
R = Particle radius: 30·10-6 m
CAS = Concentration of propene at the surface of the catalyst. If CC3H6 =
50 vol.%, CAS = 2.23·10-2 kmol m-3
De = Effective gas-phase diffusivity [59]:
Page 193
Chapter 5: Kinetics of the selective oxidation of propene over Au-Ti
180
AB p ce
DD Eq. 5.A.2
DAB = Gas-phase diffusivity. DAB for a mixture of C3H6-He was calculated
according to Perry’s Chemical Engineer’s Handbook [60] to be 8.75·10-5 m2 s-1
Considering also p = Pellet porosity = 0.4, c = Constriction factor = 0.8,
Tortuosity = 3, De = 9.33·10-6 m2 s-1.
Solving Eq. 5.A.1 gives for CWP:
-7 -1 -1 -3 -5 2
-7
-5 2 1 -2 -3
4·10 500 (3·10 )8.64·10 1
8.83·10 2.23·10
cat cat
WP
kmol kg s kg m mC
m s kmol m
Therefore, this system does not suffer from internal mass transfer limitations.
External Diffusion: Mears Criterion
The absence of external mass transfer limitations can be evaluated using the
Mears criterion [59]:
'
0.15c
A b
Ab
r Rn
k C Eq. 5.A.3
-r’A = reaction rate: 4·10-7 kmol·kgcat-1·s-1
ρb = bulk density of the catalyst bed (ρb =(1-ф)ρc with ф= porosity or void
fraction of packed bed and ρc the density of the catalyst). ρb = 500 kg·m-3.
R = Particle radius: 30·10-6 m
n = reaction order
CAb = Bulk of propene. If CC3H6 = 50 vol.%, CAS = 2.23·10-2 kmol·m-3
kc = mass transfer coefficient (m s-1) = 0.37 m s-1
kc can be calculated from the Sherwood number with an equation obtained
from Perry’s Chemical Engineer’s Handbook [60]
0.49 1/30.91 0.91 Rec p
A
k dSh Sc
D Eq. 5.A.4
Solving equation Eq. 5.A.3:
Page 194
Appendix
181
-7 -1 -1 -3 -5
-7
1 -2 -30.3
4·10 500 3·107.27·10 0.15
· 2.23·1 7 0
cat catkmol kg s kg m m
m s kmol m
It can be concluded that the system does not suffer from external mass transfer
limitations.
Appendix 5.B: Derivation of the kinetic expression
The derivation of the kinetic rate expression of the rate of PO was obtained
from Scheme 5.1:
- Au site:
O2 (g)+*↔O2* (*1)
H2O(g)+*↔H2O* (*2)
O2*+H2O*→OOH*+OH* RDS 1 (*3)
OH*+OH*→H2O*+O* (*4)
OOH*+*→O*+OH* (*5)
2O*+C3H6 (g)→ C3H4O(g)+H2O* (*6)
- Ti site:
OOH*+∎↔OOH∎+* (■7)
OOH∎+C3H6 (g) ↔ C3H6 -OOH∎ (■8)
C3H6 -OOH∎→ C3H6 O-OH∎ RDS 2 (■9)
C3H6 O-OH∎↔OH∎+C3H6 O (g) (■10)
OH∎+*↔OH*+∎ (■11)
Reproduction of Scheme 5.1: Proposed reaction mechanism for the epoxidation of propene with O2
and H2O over Au/TS-1.
Page 195
Chapter 5: Kinetics of the selective oxidation of propene over Au-Ti
182
- Au site:
(*1) 2 2 2 *O O OK P Eq. 5.B.1
(*2) 2 2 2 *H O H O H OK P Eq. 5.B.2
(*3) 2 2OOH OOH O H Or k Eq. 5.B.3
(*4) 2OH OH OHr k Eq. 5.B.4
Considering that this analysis is carried out in steady state, it is assumed that
there is no accumulation of reactive species, therefore, rOOH = rOH
kOOH θO2 θH2O = kOH θOH2 → 22
· ·OOHOH O
OHH O
k
k Eq. 5.B.5
The balance active sites on Au (*) is done assuming that O* and OOH* are very
reactive; therefore, the occupancy is negligible:
2 21 * H O O OH Eq. 5.B.6
2 2 2 2 2 2 2 2
1*
1 ·OOHO O H O H O O O H O H O
OH
kP K P K P K P K
k
Eq. 5.B.7
Therefore, the formation rate of OOH* species introduced in Eq. 5.B.3 can be
calculated as:
2 2 2 2
2
2 2 2 2 2 2 2 21 ·
OOH O O H O H OOOH
OOHO O H O H O O O H O H O
OH
k P K P Kr
kP K P K P K P K
k
Eq. 5.B.8
- Ti site
Balance active sites on Ti (■):
(■7)
1 *
OOHOOH
K Eq. 5.B.9
(■8)
2 1 3 63 6 2 3 6
*
C H OOHOOH C H C H OOH
K K PK P Eq. 5.B.10
Page 196
Appendix
183
(■9)
2 1 3 63 6
*
PO C H OOHPO PO OOH C H
k K K Pr k Eq. 5.B.11
3 61 OOH OOH C H Eq. 5.B.12
* *
1 1 2 3 6
1
1 / /OOH C H OOHK K K P Eq. 5.B.13
Substituting Eq. 5.B.13 in Eq. 5.B.11:
*1 2 3 6
* *1 1 2 3 6
1
/
/ /
PO C H OOHPO
OOH C H OOH
k K K Pr
K K K P Eq. 5.B.14
Considering that the amount of OOH* formed is proportionally very small, it
can be simplified that: K1 θOOH + K2 K1 PC3H6 θOOH <<1, therefore,
*1 2 3 6 / PO PO C H OOHr k K K P Eq. 5.B.15
Simplifying: α = kPOK1 K2
*3 6 /PO C H OOHr P Eq. 5.B.16
Part of the OOH* species formed are decomposed according to equation (*5) in
Scheme 5.1:
*D D OOHr k Eq. 5.B.17
Assuming that all the OOH* formed gets consumed either by PO formation or
being decomposed:
OOH PO Dr r r Eq. 5.B.18
Substituting Eq. 5.B.8, Eq. 5.B.16 and Eq. 5.B.17 in Eq. 5.B.18 gives:
* *3 6 /OOH C H OOH D OOHr P k Eq. 5.B.19
*3 6 *OOH OOH C H Dr P k Eq. 5.B.20
*
*3 6
2
/OOHOOH
DC H
r
kP
Eq. 5.B.21
Page 197
Chapter 5: Kinetics of the selective oxidation of propene over Au-Ti
184
3 6
*3
26
OOH C HPO
DC H
r Pr
kP
Eq. 5.B.22
2 2 2 2
2
2 2 2 2 2 2 2 23 6
1 ·
OOH O O H O H OPO
OOH DO O H O H O O O H O H O
OH C H
k P K P Kr
k kP K P K P K P K
k P
Eq. 5.B.23
To prevent strong crosscorrelation between the parameters, during the fitting
of the data, the following substitutions were made:
'2 2OOH OOH O H Ok k K K Eq. 5.B.24
' ' /OH OOH OHk k k Eq. 5.B.25
- For the formation of acrolein, a similar reasoning can be followed. If it is
assumed that all the O* produced will preferentially attack the allylic C-H
bond, rather than the C=C bond, acrolein will originate from the reaction of all
O* obtained during the mechanism depicted in Scheme 5.1. Because of the
small dependency on the propene concentration and the lack of accuracy in the
prediction of the adsorption constants of propene with the LH mechanism, it
can be assumed that the acrolein formation follows a Eley-Rideal mechanism
with propene reacting from the gas phase with the adsorbed O* species (*6). As
can be seen in Scheme 5.1 equation (*6), two O* are necessary for the formation
of acrolein and water. However, it has been considered that the oxidation of
propene with the O* originated during the water formation (*4) is the rate
determining step, therefore, only one O* will be included in the rate equation
(5.B.27). However, both O* are taken into account for the oxygen balance
(5.B.28)
3 6Ac Ac O C Hr k P Eq. 5.B.26
Assuming that the O* formation is the rate limiting step for the acrolein
production and considering that there are two O* involved in the reaction, one
can simplify that:
/ 2Ac Or r Eq. 5.B.27
Page 198
Appendix
185
and calculating rO as:
O OH Dr r r Eq. 5.B.28
In Eq. 5.B.5 it was assumed that rOH= rOOH, therefore
**
*
* *
2
23
26 3 6
2
1
DOOH
O D OOH OOH D OOH OOHD D
C H C H
kr
r k r k r rk k
P P
Eq. 5.B.29
One then obtains the final expression for acrolein production:
2 2 2 2
2
2 2 2 2 2 2 2 2
2
2 2 2 2 2 2 2 2
3 6 2
2 2 2 2 2 2 2 2
2 1 ·
1 ·
1
1 ·
OOH O O H O H OAc
OOHO O H O H O O O H O H O
OH
D
OOHO O H O H O O O H O H O
OH
DC H
OOHO O H O H O O O H O H O
OH
k P K P Kr
kP K P K P K P K
k
k
kP K P K P K P K
k
kP
kP K P K P K P K
k
Eq. 5.B.30
Page 199
Chapter 5: Kinetics of the selective oxidation of propene over Au-Ti
186
- The acrolein formed over those gold sites not capable of producing OOH*
should also be taken into account. The mechanism is depicted in Scheme 5.2.
- Aub site, not capable of producing OOH* species:
O2 (g)+▲↔O2▲ (▲1)
O2▲+C3H6 (g) ↔C3H6-O2▲ (▲2)
C3H6-O2▲→C3H4O-H
2O▲ (▲3)
C3H4O-H2O▲↔C3H4O(g)+ H
2O▲ (▲4)
Reproduction of Scheme 5.2: Proposed reaction mechanism for the acrolein formation ofver those
gold sites not capable of producing *OOH species.
- Aub site not capable of producing OOH*
(▲1) 2 2 2O O b OK P Eq. 5.B.31
(▲2) 2 3 6 3 3 6 2 3 2 2 3 6O C H C H O O b O C HK P K K P P Eq. 5.B.32
(▲3) 2 3 6 3 2 2 3 6b
Ac Ac O C H Ac O b O C Hr k k K K P P Eq. 5.B.33
A balance of the active sites on Aub (▲) the gives:
2 2 3 61 O O C H Eq. 5.B.34
2 2 3 2 2 3 6
1
1 O b O O b O C HK P K K P P Eq. 5.B.35
Substituting Eq. 5.B.35 in Eq. 5.B.33 leads to:
3 2 2 3 6
2 2 3 2 2 3 6
1
b Ac O b O C HAc
O b O O b O C H
k K K P Pr
K P K K P P Eq. 5.B.36
Page 200
Appendix
187
Appendix 5.C: Catalytic results for the epoxidation over Au/TS-1
Table 5.11: Summary of catalytic results for the epoxidation of propene with molecular oxygen and water over 0.2 -Au/TS-1(105) at various
concentrations of reactants. Temperature: 220 °C, atmospheric pressure, GHSV = 14,000 ml/gcat· h.
Reaction Temp Concentration C3H6 conv Selectivity PO/
Acr Formation rate Consumption rate
°C vol.% % % mol gcat
-1 s-1 molC3H6 gcat-1 s-1
C3H6 O2 H2O
PO Acrolein CO2 PO Acrolein CO2 C3H6
1 231.9 0.049 0.096 0.027 0.74 47.47 38.04 10.94 1.26 2.94E-08 2.33E-08 3.14E-08 1.01E-07
2 231.9 0.058 0.096 0.027 0.68 45.55 39.09 11.99 1.18 3.06E-08 2.60E-08 3.77E-08 1.65E-07
3 231.6 0.094 0.094 0.026 0.42 48.13 37.44 11.39 1.29 3.38E-08 2.63E-08 4.11E-08 1.68E-07
4 231.5 0.188 0.095 0.026 0.22 46.77 40.37 9.65 1.15 3.46E-08 3.00E-08 4.79E-08 1.42E-07
5 231.6 0.481 0.096 0.027 0.09 45.47 43.56 8.72 1.05 3.34E-08 3.17E-08 4.74E-08 1.51E-07
6 231.7 0.385 0.096 0.027 0.11 45.15 43.96 9.58 1.04 3.47E-08 3.35E-08 5.87E-08 1.66E-07
7 231.5 0.578 0.097 0.026 0.08 41.32 44.30 11.16 0.94 3.32E-08 3.53E-08 6.40E-08 1.69E-07
8 231.7 0.481 0.096 0.026 0.09 42.77 45.20 10.46 0.96 3.42E-08 3.58E-08 6.84E-08 1.34E-07
9 231.7 0.094 0.094 0.026 0.50 39.20 40.79 16.88 0.97 3.30E-08 3.40E-08 5.94E-08 2.02E-07
Page 201
Chapter 5: Kinetics of the selective oxidation of propene over Au-Ti
188
Table 5.11. Continuation.
Reaction Temp Concentration C3H6 conv Selectivity PO/
Acr Formation rate Consumption rate
°C vol.% % % mol gcat
-1 s-1 molC3H6 gcat-1 s-1
C3H6 O2 H2O
PO Acrolein CO2 PO Acrolein CO2 C3H6
10 225.0 0.48 0.10 0.03 0.07 49.17 40.58 6.94 1.21 3.24E-08 2.67E-08 1.39E-08 6.61E-08
11 226.8 0.46 0.14 0.03 0.10 49.07 39.42 7.25 1.24 4.17E-08 3.33E-08 2.41E-08 8.69E-08
12 226.9 0.48 0.05 0.03 0.06 46.87 40.50 8.55 1.16 2.57E-08 2.22E-08 1.42E-08 5.53E-08
13 226.4 0.48 0.19 0.03 0.11 50.27 39.00 7.93 1.29 4.95E-08 3.83E-08 2.36E-08 9.84E-08
14 226.9 0.48 0.24 0.03 0.13 50.83 39.72 8.25 1.28 5.75E-08 4.48E-08 2.83E-08 1.13E-07
15 226.7 0.49 0.29 0.03 0.15 50.20 39.27 9.36 1.28 6.50E-08 5.08E-08 3.66E-08 1.29E-07
16 226.9 0.48 0.14 0.03 0.11 46.58 40.67 11.24 1.15 4.55E-08 3.96E-08 3.31E-08 9.80E-08
17 226.5 0.49 0.10 0.00 0.03 40.36 49.20 5.27 0.82 1.04E-08 1.21E-08 3.85E-09 2.55E-08
18 223.2 0.49 0.10 0.01 0.05 50.32 39.59 5.43 1.27 2.35E-08 1.85E-08 7.82E-09 4.70E-08
19 225.7 0.48 0.10 0.02 0.07 49.36 35.35 8.49 1.40 2.78E-08 1.98E-08 1.71E-08 5.70E-08
20 223.8 0.48 0.10 0.03 0.08 49.98 34.64 12.98 1.44 3.54E-08 2.46E-08 2.73E-08 6.98E-08
21 229.8 0.49 0.10 0.01 0.06 45.22 38.96 11.65 1.16 2.52E-08 2.17E-08 2.24E-08 5.61E-08
22 228.3 0.47 0.09 0.04 0.09 49.07 32.14 15.94 1.53 3.95E-08 2.59E-08 4.16E-08 8.09E-08
27 230.1 0.44 0.09 0.05 0.10 47.80 32.41 15.90 1.47 3.98E-08 2.73E-08 4.33E-08 8.50E-08
Page 202
References
189
References
[1] T.E. Lefort (Fr De Catalyse Generalisee SA), US1998878 A, 1935.
[2] J.P. Dever, K.F. George, W.C. Hoffman, H. Soo, Ethylene Oxide, Kirk-
Othmer Encyclopedia of Chemical Technology, John Wiley & Sons, Inc., 2000.
[3] J.H. Huang, M. Haruta, Res. Chem. Intermed. 38 (2012) 1-24.
[4] W.G. Etzkorn, Acrolein and Derivatives, Kirk-Othmer Encyclopedia of
Chemical Technology, John Wiley & Sons, Inc., 2000.
[5] C.L. Bracey, A.F. Carley, J.K. Edwards, P.R. Ellis, G.J. Hutchings, Catal.
Sci. Technol. 1 (2011) 76-85.
[6] T. Hayashi, K. Tanaka, M. Haruta, J. Catal. 178 (1998) 566-575.
[7] T.A. Nijhuis, B.J. Huizinga, M. Makkee, J.A. Moulijn, Ind. Eng. Chem. Res.
38 (1999) 884-891.
[8] T.A. Nijhuis, T.Q. Gardner, B.M. Weckhuysen, J. Catal. 236 (2005) 153-163.
[9] J. Chen, S.J.A. Halin, J.C. Schouten, T.A. Nijhuis, Faraday Discuss. 152
(2011) 321-336.
[10] J. Chen, S.J.A. Halin, E.A. Pidko, M.W.G.M. Verhoeven, D.M. Perez
Ferrandez, E.J.M. Hensen, J.C. Schouten, T.A. Nijhuis, ChemCatChem 5
(2013) 467-478.
[11] T.A. Nijhuis, J. Chen, S.M.A. Kriescher, J.C. Schouten, Ind. Eng. Chem.
Res. 49 (2010) 10479-10485.
[12] J.J. Bravo-Suarez, K.K. Bando, T. Fujitani, S.T. Oyama, J. Catal. 257
(2008) 32-42.
[13] J.H. Huang, E. Lima, T. Akita, A. Guzman, C.X. Qi, T. Takei, M. Haruta,
J. Catal. 278 (2011) 8-15.
[14] W.S. Lee, M.C. Akatay, E.A. Stach, F.H. Ribeiro, W.N. Delgass, J. Catal.
287 (2012) 178-189.
[15] T.A. Nijhuis, E. Sacaliuc, B.M. Weckhuysen, The Epoxidation of Propene
over Gold Nanoparticle Catalysts, in: S.T. Oyama (Ed.), Mechanisms in
Homogeneous and Heterogeneous Epoxidation Catalysis, Elsevier, Amsterdam,
2008, pp. 339-386.
[16] E. Parvulescu, New Mechanistic Insight into the Gold-Based Propene
Epoxidation, Universiteit Utrecht, 2009.
[17] B. Taylor, J. Lauterbach, W.N. Delgass, Appl. Catal., A 291 (2005) 188-
198.
Page 203
Chapter 5: Kinetics of the selective oxidation of propene over Au-Ti
190
[18] J. Huang, T. Takei, T. Akita, H. Ohashi, M. Haruta, Appl. Catal., B 95
(2010) 430-438.
[19] B. Chowdhury, J.J. Bravo-Suarez, M. Date, S. Tsubota, M. Haruta, Angew.
Chem., Int. Ed. Engl. 45 (2006) 412-415.
[20] A.K. Sinha, S. Seelan, S. Tsubota, M. Haruta, Angew. Chem., Int. Ed.
Engl. 43 (2004) 1546-1548.
[21] O.P.H. Vaughan, G. Kyriakou, N. Macleod, M. Tikhov, R.M. Lambert, J.
Catal. 236 (2005) 401-404.
[22] W. Zhu, Q. Zhang, Y. Wang, J. Phys. Chem. C 112 (2008) 7731-7734.
[23] J. Lu, M. Luo, H. Lei, X. Bao, C. Li, J. Catal. 211 (2002) 552-555.
[24] A. Seubsai, M. Kahn, S. Senkan, ChemCatChem 3 (2011) 174-179.
[25] J. Lu, J.J. Bravo-Suárez, M. Haruta, S.T. Oyama, Appl. Catal., A 302
(2006) 283-295.
[26] Y. Lei, F. Mehmood, S. Lee, J. Greeley, B. Lee, S. Seifert, R.E. Winans,
J.W. Elam, R.J. Meyer, P.C. Redfern, D. Teschner, R. Schlogl, M.J. Pellin, L.A.
Curtiss, S. Vajda, Science 328 (2010) 224-228.
[27] M. Ojeda, E. Iglesia, Chem. Commun. (2009) 352-354.
[28] J. Huang, T. Akita, J. Faye, T. Fujitani, T. Takei, M. Haruta, Angew.
Chem., Int. Ed. Engl. 48 (2009) 7862-7866.
[29] J.H. Huang, T. Takei, H. Ohashi, M. Haruta, Appl. Catal., A 435 (2012)
115-122.
[30] S. Lee, L.M. Molina, M.J. Lopez, J.A. Alonso, B. Hammer, B. Lee, S.
Seifert, R.E. Winans, J.W. Elam, M.J. Pellin, S. Vajda, Angew. Chem., Int. Ed.
Engl. 48 (2009) 1467-1471.
[31] T.A. Nijhuis, T. Visser, B.M. Weckhuysen, J. Phys. Chem. B 109 (2005)
19309-19319.
[32] L.Y. Chen, G.K. Chuah, S. Jaenicke, J. Mol. Catal. A Chem. 132 (1998)
281-292.
[33] W.S. Lee, M.C. Akatay, E.A. Stach, F.H. Ribeiro, W.N. Delgass, J. Catal.
308 (2013) 98-113.
[34] D.A. Peru, R.J. Collins, Fresenius. J. Anal. Chem. 346 (1993) 909-913.
[35] http://www.eag.com/documents/icp-oes-ms-detection-limit-guidance-
BR023.pdf, 2007 (accessed 01/04/2014).
[36] H.P. Schildberg, FORSCH INGENIEURWES 73 (2009) 33-65.
Page 204
References
191
[37] P. Ratnasamy, D. Srinivas, H. Knözinger, Active sites and reactive
intermediates in titanium silicate molecular sieves, Elsevier Academic Press
Inc., San Diego, 2004.
[38] E.E. Stangland, B. Taylor, R.P. Andres, W.N. Delgass, J. Phys. Chem. B
109 (2005) 2321-2330.
[39] J. Lu, X. Zhang, J.J. Bravo-Suárez, T. Fujitani, S.T. Oyama, Catal. Today
147 (2009) 186-195.
[40] N. Yap, R.P. Andres, W.N. Delgass, J. Catal. 226 (2004) 156-170.
[41] F. Moreau, G.C. Bond, A.O. Taylor, J. Catal. 231 (2005) 105-114.
[42] M. Gasior, B. Grzybowska, K. Samson, A. Ruszel, J. Haber, Catal. Today
91-2 (2004) 131-135.
[43] Z.H. Suo, M.S. Jin, J.Q. Lu, Z.B. Wei, C. Li, J. Nat. Gas Chem. 17 (2008)
184-190.
[44] M. Haruta, Nature 437 (2005) 1098-1099.
[45] T.A. Nijhuis, B.M. Weckhuysen, Catal. Today 117 (2006) 84-89.
[46] N.W. Cant, W.K. Hall, J. Phys. Chem. A 75 (1971) 2914-2921.
[47] Y. Ding, Q. Gao, B. Wang, G.X. Li, L. Yan, J.S. Suo, J. Porous Mater 12
(2005) 131-141.
[48] S. Belin, C.L. Bracey, V. Briois, P.R. Ellis, G.J. Hutchings, T.I. Hyde, G.
Sankar, Catal. Sci. Technol. 3 (2013) 2944-2957.
[49] J.Q. Chen, S.J.A. Halin, J.C. Schouten, T.A. Nijhuis, Faraday Discuss. 152
(2011) 321-336.
[50] T.A. Nijhuis, E. Sacaliuc, A.M. Beale, A.M.J. van der Eerden, J.C.
Schouten, B.M. Weckhuysen, J. Catal. 258 (2008) 256-264.
[51] J.Q. Lu, X.M. Zhang, J.J. Bravo-Suarez, S. Tsubota, J. Gaudet, S.T.
Oyama, Catal. Today 123 (2007) 189-197.
[52] J.J. Bravo-Suarez, J. Lu, C.G. Dallos, T. Fujitani, S.T. Oyama, J. Phys.
Chem. C 111 (2007) 17427-17436.
[53] B. Taylor, J. Lauterbach, G.E. Blau, W.N. Delgass, J. Catal. 242 (2006)
142-152.
[54] C.-R. Chang, Y.-G. Wang, J. Li, Nano Research 4 (2011) 131-142.
[55] C. Satterfield, T. Stein, Ind.Eng.Chem 49 (1957) 1173-1180.
[56] M. Piccinini, E. Ntainjua N, J.K. Edwards, A.F. Carley, J.A. Moulijn, G.J.
Hutchings, Phys. Chem. Chem. Phys. 12 (2010) 2488-2492.
[57] M. Haruta, Catal. Today 36 (1997) 153-166.
Page 205
Chapter 5: Kinetics of the selective oxidation of propene over Au-Ti
192
[58] C.X. Qi, T. Akita, M. Okumura, M. Haruta, Appl. Catal., A 218 (2001) 81-
89.
[59] H.S. Fogler, Elements of chemical reaction engineering, 4th ed., Prentice-
Hall, 1992.
[60] R. Perry, D. Green, Perry's Chemical Engineers' Handbook, Eighth
Edition, McGraw-Hill Education, 2008.
Page 206
6 This Chapter will be a part of:
W. Song, D.M. Perez Ferrandez, L. van Haandel, P. Liu, T.A. Nijhuis and
E.J.M. Hensen, 2014, Selective propylene oxidation to acrolein by gold
dispersed on a Cu-containing MgCr2O4 spinel support. ACS Catal.
Submitted.
Abstract
The use of gold nanoparticles deposited on a copper containing MgCr2O4 spinel
has been evaluated for the oxidation of propene to acrolein. High selectivities to
acrolein (83 %) were obtained at 1.6 % propene conversion. It was determined
that the presence of both gold nanoparticles and copper in the support is a
prerequisite for a good activity of the catalyst. A reaction mechanism is
proposed by combining the experimental performance with computational DFT
calculations. Propene is adsorbed over the gold nanoparticles, via the double
bond, and copper oxide is involved in the abstraction of the allylic hydrogen of
the olefin. The oxygen insertion takes place thanks to adsorbed oxygen on the
catalyst.
Selective propene
oxidation to acrolein by
gold dispersed on a Cu-
containing MgCr2O4
spinel support
Page 207
Chapter 6: Selective propene oxidation to acrolein over Au/MgCuCr2O4
194
194
6.1 Introduction
An important amount of commodity chemicals is industrially produced via
oxidation reactions. The design of selective catalysts, as well as the study of the
reaction kinetics of these oxidations is a challenge which is widely investigated.
In the case of the oxidation of propene, the resulting product will be determined
by the catalyst used and the reaction conditions employed (Scheme 6.1) [1].
Besides propene oxide (PO), for which its importance has been emphasized in
the previous chapters, other products from the oxidation of propene are also
relevant from an industrial point of view. That is the case for acrolein (C3H4O),
which is an intermediate in the synthesis of methionine (global methionine
demand in 2008 was 730,000 tons per year) as well as in the production of
acrylic acid (3,400,000 tons/year estimated for acrylic acid in 2007) [2].
Scheme 6.1: Oxidation reactions of propene when oxygen alone or a mixture of oxygen and
hydrogen ([H]) are used. Scheme adapted from [1].
Acrolein is currently produced via the direct oxidation of propene over bismuth-
molybdate-based catalysts, first patented by Sohio in the 1960’s [3]. This
catalyst has been thoroughly studied, and several patents have been released
using combinations of mixed-metal oxides together with bismuth and
molybdenum. Nowadays, typical values of acrolein selectivities between 85 and
90 % are obtained at 93 – 98 % propene conversion. The lifetime of these
catalysts can reach 10 years. Industrially, the oxidation of propene is typically
carried out in fixed-bed multitube reactors at near atmospheric pressure and
330 °C. The fact that air can be used as an oxidant reduces operation costs [2].
CH2 CH3CH3
O
CH3 CH3
CH2
O
CH2
OH
O
CH3O
CO2CH3
O
[H]
[H]
Page 208
Introduction
195
195
Before the Bi-Mo catalyst was discovered, copper oxide was used for the direct
oxidation to acrolein by Shell [4, 5]. From Table 6.1 it can be observed that
mostly acrolein and PO are obtained during the oxidation of propene over Cu-
containing catalysts. The selectivity towards one product or the other is
determined by the oxidation state of the metal. It is known that Cu0 adsorbs
propene in a very strong manner and is active for the epoxidation of propene to
propene oxide [6, 7]. The proposed mechanism for the epoxidation over copper
catalysts follows the formation of an oxametallacycle as surface intermediate
species when propene is adsorbed over the metal, similar to the case of silver
[8, 9]. The oxametallacycle is favorably converted to the epoxide due to the
lower basicity of oxygen atoms on metallic Cu, compared to Ag; therefore, the
selectivity to the desired epoxide increases [9]. There is, however, a limitation
in the use of metallic Cu, since it can be readily oxidized into CuO or Cu2O
under reaction conditions. Therefore the Cu oxidation state is highly dependent
on the composition of the gas fed, i.e. the ratio between propene, which is a
reducing agent, and oxygen, an oxidation agent, as well as on the reaction
temperature [10, 11]. Additionally, it is difficult to obtain simultaneously high
conversions and selectivities, because the formed epoxide can be readsorbed
over the catalyst and oxidize it [12]. When copper is in oxide form, its reactivity
towards propene also depends on whether the catalyst is cuprous (Cu2O) or
cupric oxide (CuO). Both oxides are capable of catalyzing the abstraction of
allylic hydrogen from propene. However, Cu2+ (CuO) favors mainly the
complete combustion of propene to CO2 [11, 13], while the presence of Cu+
(Cu2O) is beneficial for the partial oxidation of propene to acrolein [10, 11, 14]
More recently, the interest in using Cu for the oxidation of propene revived via
the use of bimetallic CuAu as catalyst. Sinfelt and Barnett reported that CuAu
can convert up to 40 % propene with up to 70 % selectivity to acrolein using
molecular oxygen [15]. Llorca et al. found that CuAu supported on titania can
epoxidize propene using nitrous oxide [16]. The group of Hutchings
investigated the synthesis of supported CuAu catalysts in more detail and
found that in their active state for propene oxidation their catalyst contains
metallic gold as well as a well-dispersed copper oxide phase, the latter being
suspected the origin of its reported high selectivity to acrolein [1, 14]. An
overview of the main results reported for the oxidation of propene using Au, Cu
and bimetallic Cu-Au catalysts can be found in Table 6.1.
Page 209
Chapter 6: Selective propene oxidation to acrolein over Au/MgCuCr2O4
196
Table 6.1: Summary of literature studies about partial oxidation of propene to acrolein over Au and Cu-containing catalysts.
Paper Ref. Catalyst Temp GHSV (ml gcat-1 h-1) C3H6 conversion Major prod. (sel) Gases
Adams 1964 [5] Cu2O 300-400 °C 167 (a) 10-12 % Acrolein (60-85 %) O2
Cant 1971 [17] Au/SiO2 285 °C 1,500 10 % Acrolein (50 %) O2
Sinfelt 1976 [15] CuAu/SiO2 265-305 °C 208 – 1,042 (b ) 40 % Acrolein (50-70 %) O2
Gasior 2004 [18] Au/SiO2 200 °C 3,750 (b ) 2.8 % Acetaldehyde (75 %) H2/O2
Vaughan 2005 [7] Cu/SiO2 320 °C 30,000 9 % Acrolein (35 %) O2
Chu 2006 [19] CuOx/SBA-15 227-350 °C 18,000 1-12 % PO (15–50 %) O2
Llorca 2008 [16] CuAu/TiO2 300 °C 12,000 – 36,000 2.5 % PO (50 %) N2O
Suo 2008 [20] Au/SiO2 325 °C 6,250 (b ) 1 % Acrolein (77 %) Air
Au/TiO2 325 °C 3,950 (c ) 0.80 % Acrolein (20 %) Air
Tuysuz 2009 [10] Cu/SBA-15 475 – 500 °C 7,500 – 15,000 20 % Acrolein (50 %) O2
Bracey 2011 [1] CuAu/SiO2 300 °C 23,440 (b ) 0.63 % Acrolein (81 %) H2/O2
0.23 % Acrolein (81 %) O2
Belin 2013 [14] CuAu/SiO2 320 °C 23,440 (b ) 10 % Acrolein (89 %) H2/O2
This study Au/MgCuCr2O4 200 °C 10,000 1.6 % Acrolein (83 %) O2
(a), (b), (c) SV original values were given in h-1. Converted from h-1 to ml gcat-1 h-1 using an assumed bed density of 2.16 (a). 0.96 (b) and 1.52 (c).
Page 210
Introduction
197
197
It is worthwhile to mention that CuAu catalysts have recently also been used
for the oxidation of ethanol to acetaldehyde. Bauer et al. reported a high
ethanol conversion with very high acetaldehyde selectivity (80 – 90 %) using
CuAu nanoparticle core-shell structures for this reaction [21]. These authors
contended that the active phase consists of a gold core with a CuOx shell in
which the O binding energy is lowered. Yet, they also mentioned the
importance of the interfacial site between gold and CuOx. Recently, the group of
Hensen explored the use of a Cu-containing spinel support for gold
nanoparticles. Gold nanoparticles (AuNP) dispersed on MgCuCr2O4 render a
very active, selective and stable catalyst for the aerobic ethanol oxidation to
acetaldehyde [22]. During the ethanol oxidation, a very strong synergy between
AuNP and the Cu-containing spinel was reported, showing clearly the
importance of the interaction between Au and Cu.
The aim of this study is to evaluate the performance of gold nanoparticles
deposited on MgCuCr2O4 in the selective oxidation of propene with molecular
oxygen. It is expected that acrolein will be the main product of the reaction,
because of the strong synergy between Cu and Au and that no Ti is present in
the catalyst, which would favor the PO formation. An experimental analysis is
made in order to try to determine the role of gold and copper in the reaction.
Finally, the experimental observations will be complemented with theoretical
calculations using DFT that will give insight into the reaction mechanism and
what are the active sites for the formation of acrolein.
6.2 Experimental
6.2.1 Catalyst synthesis and characterization
Mg0.75Cu0.25Cr2O4 (denoted further as MgCuCr2O4) and MgCr2O4 were prepared
and characterized by the group of Hensen at Eindhoven University of
Technology. The procedure followed for the synthesis was a co-precipitation-
calcination method using the corresponding metal nitrates as precursors. The
pH of an aqueous mixed nitrate solution with a Mg(NO3)2/Cu(NO3)2/Cr(NO3)3
ratio of 3/1/8 (in case of MgCr2O4, Mg(NO3)2 and Cr(NO3)3 were used in 1/2
ratio) was adjusted to ~11 by dropwise addition of a 1 M NaOH solution to
ensure complete precipitation. The precipitate was filtered, washed and dried
at 110 °C overnight and calcined at 700 °C in air for 8 h to yield the spinel
product. Gold nanoparticles were loaded on this support by homogeneous
Page 211
Chapter 6: Selective propene oxidation to acrolein over Au/MgCuCr2O4
198
198
deposition-precipitation using the method developed by Louis et al. [23]. Urea
was employed as precipitation agent, while the temperature was maintained at
90 °C for 6 hours and the final pH was ~ 9. The targeted gold loading was 1
wt%. Finally, the catalysts were calcined in air at 350 °C for 5 h.
XRD analysis was performed on a Bruker Endeavour D4 with Cu Kα radiation
(40 kV and 30 mA). TEM imaging was done with a FEI Tecnai 20 electron
microscope at an acceleration voltage of 200 kV with a LaB6 filament. The
average Au particle size was calculated by counting ~200 Au particles visible in
the TEM images. The surface area was determined by N2 porosimetry using a
Tristar 3000 automated gas absorption system. The samples were degassed at
180 °C for 3 h prior to analysis and the BET method was used to calculate the
surface area. The gold loading of the catalysts was determined by ICP-OES.
After an aliquot of the sample was treated in a mixture of HCl/HNO3 (3/1), the
residual solid was filtered and washed completely with demineralized water
until the filtrate was 100 ml in volume.
6.2.2 Oxidation experiments
The catalytic oxidation of propene was done in a packed bed quartz reactor
with an inner diameter of 4 mm. In a typical test, 150 mg of catalyst was
loaded in the reactor and the flow was adjusted to 25 ml min-1 (GHSV
10,000 ml gcat-1 h-1). Prior to reaction, the catalyst was calcined in situ at 300 °C
under 10 vol.% O2 for 1 h, followed by 1 h reduction also at 300 °C with 10 vol.%
H2. Cycles of 5 h of reaction with an intermediate regeneration by oxidation
and reduction were performed. The standard feed composition used was
10/10/80 O2/C3H6/He. Additionally, the influence of the presence of hydrogen in
the gas stream was analyzed by using a mixture of H2/O2/C3H6 with a ratio of
10/10/10 and He as a balance. The temperature of the reaction was controlled
by a tubular oven and varied between 150 °C and 300 °C, according to the
experiment. To evaluate the stability of the catalyst, the reaction at 200 °C was
repeated after several reaction cycles. The oxidation of propene with N2O was
also studied with a flow rate of 20 ml min-1 (GHSV 8,000 ml gcat-1 h-1) and a
concentration of propene and N2O of 9.3 vol.% each. The outlet gases of the
reaction were analyzed every 5 min by an online Compact GC (Interscience)
equipped with a Rt-Q-Bond column and a Molsieve 5A column in two separate
channels, both with a thermal conductivity detector (TCD). The propene
conversion (X) and selectivity (Sac) to acrolein and the other by-products were
Page 212
Experimental
199
199
calculated considering the reaction: 3 6
C H Cx
n m and according to the
following equations:
3 63 6
% 100 100OUT C
x x
IN
xH
C H
n n
XPP
P Pm m
nP
m
Eq. 6.1
% 100x
x
x
nP
mn
Pm
S Eq. 6.2
Where Px is the partial pressure of the carbon-containing products obtained
during the oxidation of propene: Acrolein, acetone, PO, propanal, acetaldehyde,
CO and CO2. For calculating the conversion of propene, the first equation in
Eq. 6.1 was used, since it is more robust towards small variations in the
injected gas (from pressure fluctuations).
6.3 Results and discussion
6.3.1 Catalyst characterization
Figure 6.1 shows the XRD patterns of MgCr2O4 and MgCuCr2O4 as well as of
the gold-containing catalysts. The structure of all materials is similar to that of
the reference MgCr2O4 spinel reported in literature [24]. The XRD patterns did
not change upon loading of gold nanoparticles and subsequent calcination.
The most important physico-chemical properties of these materials are
collected in Table 6.2. The BET surface areas of the spinel supports are very
low, which is due to the high calcination temperature. Representative TEM
images of the two spinel-supported gold catalysts are given in Figure 6.2. The
average particle sizes for these two catalysts were determined to be 3.5 ±
0.9 nm and 3.2 ± 0.9 nm for Au/MgCr2O4 and Au/MgCuCr2O4, respectively.
Page 213
Chapter 6: Selective propene oxidation to acrolein over Au/MgCuCr2O4
200
200
Figure 6.1: XRD patterns of MgCr2O4, MgCuCr2O4 and their gold nanoparticles containing
counterparts. The patterns are consistent with the pure MgCr2O4 spinel phase (JCPDS 10-0351).
The reference pattern of MgCr2O4 is generated from the structural data reported by Kemei et al.
[24].
Table 6.2: Summary of the characterization results of the spinels and catalysts used in this study.
Sample Cu/Mg ratio SBET (m2/g) [Au] (wt%) dAu (nm)
MgCr2O4 0 16 - -
Au/MgCr2O4 0 n.d. 0.93 3.5 ± 0.9
MgCuCr2O4 0.25 5 - -
Au/MgCuCr2O4 0.25 n.d. 0.90 3.2 ± 0.9
Figure 6.2: Representative TEM images of (left) Au/MgCr2O4 and (right) Au/MgCuCr2O4.
10 20 30 40 50 60 70 80
Reference
Au/MgCuCr2O
4
MgCuCr2O
4
Au/MgCr2O
4
Inte
nsit
y (
a.u
.)
2 ()
MgCr2O
4
Page 214
Results and discussion. Catalytic experiments
201
201
6.3.2 Catalytic experiments
Au/MgCuCr2O4 proved to be an active catalyst for the partial oxidation of
propene with O2, producing acrolein in a selective manner. The main by-
products observed were CO2, CO and acetaldehyde from the further oxidation
of acrolein or from the direct combustion of propene.
Figure 6.3 and Figure 6.4 show the conversion of propene and its selectivity to
acrolein as a function of temperature using the prepared catalysts. The highest
acrolein yield is obtained at 200 °C over Au/MgCuCr2O4, when 1.6 % of propene
is converted with selectivity to acrolein of 83 %. This selectivity is comparable
to the one reported by Bracey et al. [1] over CuAu/SiO2 using only oxygen as
oxidant. At temperatures above 220 °C the conversion increases dramatically
up to about 22 % and almost all the propene converted is combusted to form
CO2. This conversion value is the maximum amount of propene that can be
combusted using a 1/1 C3H6/O2 ratio in Helium, considering the stoichiometry.
After evaluating the catalyst performance at different temperatures, gradually
increasing the reaction temperature until 300 °C, reaction cycles were
performed at decreasing temperatures down to 200 °C. The conversion and
selectivity were exactly the same as the ones obtained during the ramp up of
the temperature. This indicates that, even at higher temperatures, the surface
of the catalyst remains unchanged and that there is no sintering of AuNPs or
decomposition of the spinel support. Comparing the optimum temperature of
Au/MgCuCr2O4 with the temperature range used in literature for Cu and Au-
containing catalysts (Table 6.1), clear differences can be observed. For a single
metal catalyst, copper is a very active catalyst for acrolein formation at
relatively high temperatures (~400 °C), while gold shows its best performance
for the synthesis of PO using H2/O2 mixtures between 100 and 200 °C. For a
bimetallic CuAu catalyst, it would be expected that the low temperature active
gold will shift the activity of Cu to a lower temperature. This was
experimentally observed by Belin et al. [14], who obtained the highest acrolein
yields (8.9 %) at 320 °C. From this it can be deduced that gold plays a very
important role in the rate determining step, which can be either by O2
activation or by propene activation.
Page 215
Chapter 6: Selective propene oxidation to acrolein over Au/MgCuCr2O4
202
202
Figure 6.3: Propene conversion in the partial oxidation of propene with O2 to acrolein over
Au/MgCuCr2O4 (■), Au/MgCr2O4 (▲) and MgCuCr2O4 (●). GHSV = 10,000 ml gcat-1 h-1. Left side of
the image: Magnification in the range of temperatures between 135 and 260 °C.
Figure 6.4: Selectivity to acrolein in the partial oxidation of propene with O2 to acrolein over
Au/MgCuCr2O4 (■), Au/MgCr2O4 (▲) and MgCuCr2O4 (●). GHSV = 10,000 ml gcat-1 h-1.
The influence of the presence of gold nanoparticles on the catalyst was
evaluated by carrying out the oxidation of propene over the support
(MgCuCr2O4) without AuNP deposited on it. In Figure 6.3 (●) it can be seen
that the conversion of propene is lower than when gold is present, but it still
reaches 1.6 % at 245 °C. This suggests that gold plays a role on the oxidation of
propene to acrolein. With respect to the selectivity to acrolein, even at lower
temperatures, the catalyst without gold is less selective that the original one,
140 160 180 200 220 240 260 280 300 3200
10
20
30
40
50
60
70
80
90
100
Temperature (C)
Au/MgCuCr2O
4
Au/MgCr2O
4
MgCuCr2O
4
Sele
ctiv
ity a
crole
in (
%)
Page 216
Results and discussion. Catalytic experiments
203
203
with CO2, CO and acetaldehyde as main by-products. Over this catalyst, up to
3.5 % of PO was also observed. The sharp increase in conversion at 270 °C is
similar to the one observed for Au/MgCuCr2O4 and, like in the previous case,
most of the propene is converted to CO2. This may suggest that the combustion
occurs over the support. The lower selectivity shown by the support suggests
that AuNPs play a role in the formation of acrolein, while if propene is
adsorbed directly on the spinel support, other reactions, such as combustion,
are preferential. The adsorption of propene over gold nanoparticles has been
proven by Nijhuis et al. [25] through the analysis of XANES spectra, where the
mode of adsorption was determined to be π-bonding.
A similar analysis was performed to determine the role of Cu in the oxidation
of propene. Gold nanoparticles were deposited over the spinel synthesized in
the absence of copper (Au/MgCr2O4). It is noticeable in Figure 6.3 (▲) that the
conversion is very limited, even at higher temperatures. Nevertheless, the
selectivity to acrolein is higher than in the absence of Au, pointing out that Au
catalyzes preferentially the formation of acrolein. The fact that the catalyst will
combust less propene at higher temperatures than when copper is present can
indicate that Cu catalyzes the CO2 formation observed with Au/MgCuCr2O4.
It can be concluded that the activity of the catalyst can be related to the
presence of both gold nanoparticles and copper in the support. The XPS
analysis of the same catalyst, but used for the oxidation of ethanol [22], showed
that the oxidation state of the copper contained in the spinel is Cu+ and that
the AuNPs deposited were metallic gold. The excellent catalytic activity of
Au/MgCuCr2O4 for the oxidation of ethanol to acetaldehyde also has been
attributed to the synergy between of Au0 and Cu+ [22]. As explained in the
introduction, the oxidation state of Cu determines the oxidation product
obtained. While CuO catalyzes the combustion of propene, Cu2O favors the
formation of acrolein [11]. Therefore, it is reasonable to assume that the
activity of Au/MgCuCr2O4 in the oxidation of propene to acrolein is due to a
combination of Au0 and Cu+.
6.3.2.1 Influence of the residence time
The influence of the residence time was evaluated by varying the total flow rate
and maintaining the same reactant concentrations and amount of catalyst.
Page 217
Chapter 6: Selective propene oxidation to acrolein over Au/MgCuCr2O4
204
204
a.
b.
Figure 6.5: Oxidation of propene with oxygen over Au/MgCuCr2O4. a. Rate of formation of acrolein
and rate of combustion of propene (rCO2/3). b. Conversion of propene and selectivity to acrolein and
combustion. Temperature: 210 °C. Reactants: 10% C3H6, 10% O2.
Conversions as high as 3.2% can be obtained at low space velocities, however,
the selectivity to acrolein decreases to 71 %, indicating that the combustion is
enhanced due to the higher contact times (Figure 6.5b). As can be seen in
Figure 6.5a, the rate of acrolein formation increases with increasing space
velocity, while the rate of combustion decreases. This may indicate that CO2
formation is the result of the further oxidation of acrolein, rather than the
direct combustion of propene.
It is expected that at higher GHSV, as the reactor starts operating under
differential conditions, the acrolein formation rate will stabilize and be
5000 10000 15000 200000.0
5.0x10⁻⁸
1.0x10⁻⁷
1.5x10⁻⁷
2.0x10⁻⁷
2.5x10⁻⁷
3.0x10⁻⁷
3.5x10⁻⁷
4.0x10⁻⁷
Rate
(m
ol
gca
t-1 s
-1)
GHSV(ml gcat
-1 h
-1)
Acrolein rate
Combustion rate
5000 10000 15000 200000.0
0.5
1.0
1.5
2.0
2.5
3.0
3.5
Con
vers
ion
(%
)
GHSV(ml gcat
-1 h
-1)
Propene conversion
0
10
20
30
40
50
60
70
80
90
100
Selectivity acrolein
Selectivity combustion
Sele
ctiv
ity (
%)
Page 218
Results and discussion. Catalytic experiments
205
205
independent of the residence time. At differential conditions, the conversions
are very low and the rates will depend only on the concentrations of the
reactants fed.
6.3.2.2 Effect of hydrogen co-feeding
In the experiments in which hydrogen was added to the gas feed (10 vol.%)
together with oxygen and propene for the oxidation over Au/MgCuCr2O4, no
beneficial effect was observed either in the conversion or selectivity to acrolein.
Additionally, the conversion of hydrogen was very low (maximum 5 %), which
produced only small amounts of water. It was similarly reported by Vaughan et
al. [7] that hydrogen co-feeding did not have an effect during the oxidation of
propene over Cu/SiO2. This behavior differs from the one of gold catalysis. In
Chapter 5, while using Au/SiO2 as a catalyst, the addition of H2 to the oxygen
and propene feed increased the conversion and decreased the selectivity to
acrolein due to the formation of other carbon-containing by-products, like
acetone and propanal. This performance can be associated to the formation of
OOH* species over the gold nanoparticles that, in the absence of neighboring Ti
atoms, dissociate producing water and O* species, capable of attacking the
allylic bond of propene forming acrolein as well as other non-selective oxidation
products. Analyzing the results obtained by Bracey et al. over CuAu/SiO2 [1],
the addition of hydrogen in the feed favored the formation of acrolein. They
postulated that the presence of hydrogen increased the amount of active
oxidizing species through the formation of OOH* species that may react
directly with propene, or dissociate, resulting in other oxidizing species. The
formation of OOH* over CuAu/SiO2 can be related to the presence of Au
nanoparticles in the catalyst, since it has been said that Cu/SiO2 is not capable
of doing so [7]. As opposed to CuAu/SiO2, the oxidation over Au/MgCuCr2O4 in
the presence of hydrogen resulted in the same conversion and selectivity to
acrolein as without it. This can indicate that, when using this catalyst, the
consumption of oxygen is faster in the direct oxidation to acrolein over Au-Cu
interface than the rate at which OOH* species are formed with hydrogen over
the gold nanoparticles. In the epoxidation of propene with Au-Ti catalysts using
a mixture of hydrogen and oxygen, the rate limiting step is the dissociation of
hydrogen to form OOH* species that will be the active species in the
epoxidation [26]. Therefore, it is plausible to presume that this step is also very
slow over Au/MgCuCr2O4. If the use of oxygen is faster for the attack of the
Page 219
Chapter 6: Selective propene oxidation to acrolein over Au/MgCuCr2O4
206
206
allylic C-H bond to form acrolein than the formation of hydroperoxy species, the
latter would be almost negligible, resulting in similar results with and without
hydrogen co-fed.
The evaluation of the MgCuCr2O4 in the absence of Au nanoparticles under a
flow of H2/O2 resulted in a very high selectivity (90 %) to the hydrogenation of
propene to propane at 1.4 % propene conversion. Similar to the reaction with
oxygen only, the conversion at 270 °C increases to 16 % due to the combustion
of propene. The use of copper catalysts for the hydrogenation of propene and
ethylene was already demonstrated at the beginning of the 20th century [27,
28]. Even more similar to the support of this study, Sussman et al. performed a
kinetic study on the hydrogenation of propene over copper-magnesia catalyst
[29] where a dual site reaction mechanism was proposed between atomically
adsorbed hydrogen and propene. The hydrogenation over Au is dependent on
the particle size, and becomes relevant at very low gold loadings, when Au is
present as subnanometer particles [30], which is smaller than the ones used in
this chapter. The fact that when Au is deposited over the Cu-containing spinel,
no significant hydrogenation of propene is observed might be due to the
deposition of Au NPs over the sites responsible for the hydrogenation, blocking
them and preventing the reaction from happening.
On the other hand, the catalyst with AuNP deposited on a copper-free support
(Au/MgCr2O4) produced acetone almost in the same amount as acrolein and the
conversion of propene and ethylene remained low. This can be associated with
the formation of OOH* species over the gold nanoparticles, like in the case of
CuAu/SiO2 [1]. In the absence of Cu, oxygen can react with hydrogen over
AuNP and, as explained before, release water and O* upon dissociation.
Adsorbed O* can react with propene in a non-selective way, thus the formation
of acetone as well as acrolein. Additionally, at high temperatures, the
conversion of hydrogen is complete, indicating that the formed OOH* species
are reduced to form water.
6.3.2.3 Reaction with N2O
According to Duma et al. [31], it is energetically more favorable to release a
single oxygen atom from N2O than from an oxygen molecule. Therefore, its use
as a mild oxidant for the epoxidation of propene over suitable catalyst, like
silica-supported iron oxide, can result in propene conversions of 6 – 12 % with
PO selectivities of 40 – 60 %. Llorca et al. [16] reported the epoxidation of
Page 220
Results and discussion. Catalytic experiments
207
207
propene over Au-Cu/TiO2 using also N2O as oxidant. They obtained propene
conversions of 2.5 % with PO selectivities up to 50 %. However, the attempt to
perform the oxidation of propene with N2O over Au/MgCuCr2O4 resulted in a
very small conversion (< 0.2 %) even though the selectivity to acrolein
remained close to 90 %. First, it is important to achieve the decomposition of
N2O into N2 gas and adsorbed O*. Decomposition experiments carried out over
Au/MgCuCr2O4 proved that this catalyst is not very active in the decomposition
of nitrous oxide (only 2 % conversion at 300 °C and 1 % at 200 °C).
Consequently, the amount of O* available to react with propene is very limited.
Additionally, part of the adsorbed O* forms molecular oxygen that is released
to the gas stream.
The fact that no PO was observed during the reaction with N2O, as opposed to
the observations of Llorca et al. [16], can be due to the oxidation state of Cu in
the catalyst support. As explained by Vaughan et al. [7], metallic copper (Cu0)
should be present in the catalyst to be able to catalyze the epoxidation of
propene. According to the XPS analysis of Au/MgCuCr2O4, the spinel contains
Cu+, which is mainly active for the partial oxidation to acrolein and less active
in N2O decomposition [11].
6.3.3 Computational analysis
With the aim of better understanding the mechanism of the oxidation of
propene to acrolein over Au/MgCuCr2O4, DFT calculations were carried out in
the group of Hensen at Eindhoven University of Technology. A description of
the procedure used for this analysis can be found in [32] and a diagram
summarizing the proposed mechanism is depicted in Figure 6.6.
It was determined that propene is favorably adsorbed on an interfacial Au
atom (which is neighbor to another Au atom and the support). This is in
agreement with the work published by Nijhuis et al. [25] and with the
experimental observations given in the previous sections, where gold
nanoparticles were necessary for the selective formation of acrolein over
Au/MgCuCr2O4. It was calculated that the adsorption is so strong that it can
lead to the reconstruction of gold nanoparticles and formation of isolated gold
atoms in the neighborhood of Cu and Cr cations (Figure 6.6, state i). One of the
allylic C-H bonds in adsorbed propene (Figure 6.6, state ii) dissociates with the
H atom relocating to one of the oxygen anions of the support. These O atoms
are coordinated to both Cu and Cr cations (Figure 6.6, state iii). Again, this is
Page 221
Chapter 6: Selective propene oxidation to acrolein over Au/MgCuCr2O4
208
208
supported by the experimental observations in which the presence of Cu in the
catalyst is necessary to be able to convert propene. In the absence of copper,
most probably, the hydrogen abstraction is not favored, and propene is
desorbed unreacted, as observed in section 6.3.2. Following the C-H bond
cleavage, the adsorption mode of the remaining C3H5 allyl intermediate
changes. The allyl is bound via the terminal C atom to the Au atom while the
other two C atoms form a new double bond, so that effectively a Au-CH2-
CH=CH2 intermediate is formed. This structure can tilt to one of the other
support O atoms with negligible barrier, resulting in an Au-CH2-CH-CH2-
Osupport in which the middle C atom again binds to the Au atom (Figure 6.6,
state iv). From this configuration one of the C-H bonds of the CH2 group bound
to the support oxygen dissociates to a neighboring O atom of the support (state
v). Thermodynamically, this reaction that results in the formation of adsorbed
acrolein is favorable (E = -75 kJ/mol).
Acrolein is adsorbed two-fold, namely with its CH2 group coordinating to the
Au atom and the oxygen atom of its carbonyl group bridging between Cu and
Mg. Desorption of acrolein, which costs 127 kJ/mol, generates one surface
oxygen vacancy on the support (state vi). The Au atom can then adsorb propene
again, while molecular oxygen adsorbs to the oxygen vacancy (state viii). The
O-O bond distance in adsorbed O2 is elongated from its gas phase value of 1.23
Å to 1.32 Å, suggesting formation of a peroxide O2- species. In this case, the
allylic C-H bond activation results in formation of a hydroperoxy (OOH*)
species (Figure 6.6, state ix). The OOH* group reacts with one of the nearby
OH groups and forms weakly adsorbed water (OOH* + OH* O*...H2O + O*).
Desorption of water is facile and only takes 21 kJ/mol. Similar to the reaction
steps above, the resulting Au-CH2-CH-CH2 species tilts to the support and
cleaves another of its C-H bonds to form adsorbed acrolein (Figure 6.6, state iv),
followed by desorption of acrolein. The catalytic cycle now proceeds by
adsorption of another oxygen molecule and propene, so that structure iv is the
main reaction intermediate. Although initially an oxygen atom of the support is
involved in C-H bond activation, the catalytic cycle proceeds by allylic C-H bond
activation involving adsorbed O2 with a lower barrier of 60 kJ/mol.
The synthesis of PO was also theoretically evaluated via the formation of the
OOH* species in state ix (Figure 6.6), but none of the possible reaction paths
was energetically favorable.
Page 222
Results and discussion. Computational analysis
209
209
Figure 6.6: Complete reaction energy diagram (middle) with elementary reaction steps for the
oxidation of propene to acrolein on the Au1/MgCuCr2O4 model. Source: DFT calculations carried out
in the group of Hensen at Eindhoven University of Technology.
The results of the computational analysis confirm the experimental
observations of this study. The presence of gold nanoparticles is necessary for
the adsorption of propene via the double bond. Furthermore, the fact that the
MgCr2O4 spinel contains Cu is fundamental for the abstraction of the allylic
hydrogen bond that will result in the formation of acrolein. In the experimental
section it was observed that in the absence of AuNP, the selectivity to acrolein
is lower than when they are present. This can be due to the direct adsorption of
propene over the support, where other reactions are promoted.
Page 223
Chapter 6: Selective propene oxidation to acrolein over Au/MgCuCr2O4
210
210
6.4 Conclusions
It can be concluded that gold nanoparticles deposited on a copper-containing
MgCr2O4 spinel can selectively oxidize propene to acrolein. Propene conversions
up to 1.6 % with selectivities to acrolein higher than 80 % were achieved at
temperatures below 240 °C. The presence of gold nanoparticles is necessary to
guarantee the high selectivity to acrolein, while the absence of copper in the
support results in very limited propene conversion. PO was not observed over
this catalyst, since AuNPs without Ti are not capable of epoxidizing propene.
The addition of hydrogen as co-reactant produced the same results as with
oxygen alone, suggesting that the direct oxidation of propene is faster than the
formation of OOH* species over the AuNP. Finally, the computational analysis
supports the experimental observations. According to the DFT calculations,
propene is adsorbed over a gold atom and the allylic hydrogen abstraction
takes place thanks to an oxygen atom coordinated to a Cu or Cr cation. These
calculations also confirmed the preference of acrolein formation vs. propene
epoxidation to PO.
The performance of Au/MgCuCr2O4 in the oxidation of propene in comparison
with other CuAu catalyst in literature can be seen in Table 6.1. It is noticeable
that the conversion values obtained are lower than the ones reported by Sinfelt
et al. [15] with CuAu/SiO2, while the selectivity to acrolein is higher. The
conversion is, on the other hand, higher than the values obtained by Bracey et
al. [1] with oxygen alone. It should be said that, even though both Cu and Au
are contained in all the catalyst mentioned, the copper contained in
Au/MgCuCr2O4 is imbedded in the structure of the support, which may
decrease its availability or the contact with the gold nanoparticles. On the
other hand, the reaction mechanism of the spinel is different to the one of
copper and gold impregnated on SiO2, therefore, a direct comparison is not very
accurate.
6.5 Outlook
Even though Au/MgCuCr2O4 proved to be very selective for the oxidation of
propene to acrolein, the conversion values obtained are not capable of
competing with the bismuth-molybdenum catalyst currently used in industry.
As indicated in the introduction, propene conversions between 93 to 98 % are
typically obtained over the commercial catalyst [2].
Page 224
Outlook
211
211
It should also be noticed that the gold and copper loadings used in the spinel of
this study have been optimized for the oxidation of ethanol to acetaldehyde
[22]. Further work should be done to establish the most suitable Cu/Au ratio
for the oxidation of propene. A detailed study, like the one performed by Belin
et al. [14] would provide more information about the Cu-Au interaction and
their optimum ratio. Additionally, it has been observed that lower oxygen
partial pressures result in higher acrolein selectivities over Au/SBA-15 [10].
Therefore, a kinetic study, analyzing the influence of reactants would help to
determine the best operation range for this type of catalyst.
References
[1] C.L. Bracey, A.F. Carley, J.K. Edwards, P.R. Ellis, G.J. Hutchings, Catal.
Sci. Technol. 1 (2011) 76-85.
[2] W.G. Etzkorn, Acrolein and Derivatives, Kirk-Othmer Encyclopedia of
Chemical Technology, John Wiley & Sons, Inc., 2000.
[3] J.L. Callahan, J.J. Szabo, G. Berthold (Standard Oil Co), US3186955 A,
1965.
[4] M.L. Adams, G.W. Hearne (Shell Dev), US2451485 A, 1948.
[5] C.R. Adams, T.J. Jennings, J. Catal. 3 (1964) 549-558.
[6] W. Su, S. Wang, P. Ying, Z. Feng, C. Li, J. Catal. 268 (2009) 165-174.
[7] O.P.H. Vaughan, G. Kyriakou, N. Macleod, M. Tikhov, R.M. Lambert, J.
Catal. 236 (2005) 401-404.
[8] D. Torres, N. Lopez, F. Illas, R.M. Lambert, J. Am. Chem. Soc. 127 (2005)
10774-10775.
[9] D. Torres, N. Lopez, F. Illas, R.M. Lambert, Angew. Chem., Int. Ed. 46
(2007) 2055-2058.
[10] H. Tuysuz, J.L. Galilea, F. Schuth, Catal. Lett. 131 (2009) 49-53.
[11] J.B. Reitz, E.I. Solomon, J. Am. Chem. Soc. 120 (1998) 11467-11478.
[12] J.R. Monnier, G.W. Hartley, J. Catal. 203 (2001) 253-256.
[13] L.L. Holbrook, H. Wise, J. Catal. 20 (1971) 367-373.
[14] S. Belin, C.L. Bracey, V. Briois, P.R. Ellis, G.J. Hutchings, T.I. Hyde, G.
Sankar, Catal. Sci. Technol. 3 (2013) 2944-2957.
[15] J.H. Sinfelt, A.E. Barnett (Exxon Research And Engineering Company),
US3989674 A, 1976.
Page 225
Chapter 6: Selective propene oxidation to acrolein over Au/MgCuCr2O4
212
212
[16] J. Llorca, M. Dominguez, C. Ledesma, R.J. Chimentao, F. Medina, J.
Sueiras, I. Angurell, M. Seco, O. Rossell, J. Catal. 258 (2008) 187-198.
[17] N.W. Cant, W.K. Hall, J. Phys. Chem. A 75 (1971) 2914-2921.
[18] M. Gasior, B. Grzybowska, K. Samson, A. Ruszel, J. Haber, Catal. Today
91-2 (2004) 131-135.
[19] H. Chu, L. Yang, Q. Zhang, Y. Wang, J. Catal. 241 (2006) 225-228.
[20] Z.H. Suo, M.S. Jin, J.Q. Lu, Z.B. Wei, C. Li, J. Nat. Gas Chem. 17 (2008)
184-190.
[21] J.C. Bauer, G.M. Veith, L.F. Allard, Y. Oyola, S.H. Overbury, S. Dai, ACS
Catalysis 2 (2012) 2537-2546.
[22] P. Liu, E.J.M. Hensen, J. Am. Chem. Soc. 135 (2013) 14032-14035.
[23] R. Zanella, S. Giorgio, C.R. Henry, C. Louis, J. Phys. Chem. B 106 (2002)
7634-7642.
[24] M.C. Kemei, P.T. Barton, S.L. Moffitt, M.W. Gaultois, J.A. Kurzman, R.
Seshadri, M.R. Suchomel, Y.I. Kim, J. Phys. - Condens Mat. 25 (2013).
[25] T.A. Nijhuis, E. Sacaliuc, A.M. Beale, A.M.J. van der Eerden, J.C.
Schouten, B.M. Weckhuysen, J. Catal. 258 (2008) 256-264.
[26] J. Chen, S.J.A. Halin, J.C. Schouten, T.A. Nijhuis, Faraday Discuss. 152
(2011) 321-336.
[27] R.N. Pease, J. Am. Chem. Soc. 45 (1923) 1196-1210.
[28] G.B. Kistiakowsky, J.R. Ruhoff, H.A. Smith, W.E. Vaughan, J. Am. Chem.
Soc. 57 (1935) 876-882.
[29] M.V. Sussman, C. Potter, Ind. Eng. Chem. 46 (1954) 457-465.
[30] T. Hayashi, K. Tanaka, M. Haruta, J. Catal. 178 (1998) 566-575.
[31] V. Duma, D. Hönicke, J. Catal. 191 (2000) 93-104.
[32] W. Song, D.M. Perez Fernandez, P. Liu, T.A. Nijhuis , E.J.M. Hensen,
Unpublished results (2015).
Page 226
7 7.1 Conclusions
Throughout this thesis, different methods for the production of propene oxide
(PO) have been investigated. The first part of the thesis focused on evaluating
the feasibility of an integrated reactor where hydrogen peroxide is produced in
a plasma reactor and used afterwards for the epoxidation of propene. In the
second part of the thesis, the oxidation of propene with molecular oxygen alone
was investigated over gold-containing catalysts.
An integrated process for the epoxidation of propene using hydrogen peroxide
synthesized in a plasma reactor
The two alternatives for the epoxidation of propene (the gas and the liquid
phase reaction) were analyzed individually. Thereafter, the integration with
the plasma reactor for the synthesis of hydrogen peroxide was considered.
Gas phase epoxidation of propene using H2O2 vapor over TS-1 catalyst was
achieved successfully by evaporating in situ H2O2. PO productivities of
10.5 kgPO kgcat-1
h-1 were obtained at GHSV of 450,000 ml gcat
-1 h-1, the highest
GHSV possible in the experimental setup. The reason for this high value is
that, at the temperatures of this study, the reaction is very fast and, even at
Conclusions and
outlook
Page 227
Chapter 7: Conclusions and outlook
214
lower GHSV, the conversion and selectivity remain the same. The conversion of
hydrogen peroxide vapor was 100 % in all the experiments and at all the
conditions tested. The selectivity of H2O2 to propene oxide was around 40% at
different concentrations of peroxide used. In this case, an almost constant ratio
between the partial pressure of peroxide and PO formed was obtained,
implying that both the epoxidation and the decomposition of H2O2, which is the
main side reaction, are of the same order in peroxide. The decomposition of
H2O2 is a surface reaction and is highly dependent on the materials that will be
in contact with the chemical. Therefore, special attention should be paid to the
selection of the working materials for reactor and piping.
In Chapter 3 a microreactor was developed for the epoxidation of propene with
aqueous hydrogen peroxide. Ideally, these microreactors can be combined with
the catalytic direct synthesis of H2O2 in a microreactor or a plasma
microreactor. A TS-1 coated capillary microreactor (CCMR) was developed by
an in situ hydrothermal synthesis. The results of the epoxidation of propene
were compared with a fixed bed microreactor (FBMR) loaded with TS-1 powder.
The coating layer was determined to be TS-1 using SEM and XPS; it reached
productivity values of 1.8 kgPO kgcat-1 h-1. It was found that the key parameter
for the catalyst coating is the incorporation of tetrahedral Ti in the framework
of the zeolite.
In Chapter 4, the plasma reactors developed by Christopher Vasko at the
Department of Applied Physics of Eindhoven University of Technology are
introduced and their integration with the epoxidation of propene is evaluated.
It was shown that hydrogen peroxide can be produced either from mixtures of
hydrogen and oxygen or from water vapor in a plasma. The latter would
significantly reduce the reactant costs in comparison with the anthraquinone
and the direct synthesis processes. The H2O2 synthesized is of high purity,
reducing the downstream separation steps. However, the energy efficiencies of
the sources investigated here are still not high enough for making the plasma
synthesis competitive.
It was concluded that the integrated system is not yet economically feasible for
its industrial implementation for PO production with the processes presented.
The epoxidation of propene with aqueous hydrogen peroxide is a selective
reaction in the liquid phase and has already been implemented industrially.
The combination with the synthesis of hydrogen peroxide in a plasma reactor
would be feasible. Yet, propene oxide is a bulk chemical with low added value,
which makes the benefits obtained from the integrated process economically
Page 228
Conclusions
215
not favorable. On the other hand there is considerable potential for the
combination of the plasma reactor with the synthesis of a chemical with higher
added value, such as pharmaceuticals or fine chemicals that could compensate
for the price of the extra energy required.
One step epoxidation of propene with molecular oxygen over Au-Ti catalyst
A kinetic study was carried out for the epoxidation of propene with molecular
oxygen in the presence of water. The purpose was to understand the reaction
mechanism and improve the PO selectivity. Two types of alkali promoted Au-Ti
catalysts have been tested: Au/TS-1 and Au/Ti-SiO2.
In the case of Au/TS-1, a catalyst screening was carried out, with the aim to
identify the optimum gold and titanium loading, as well as the most suitable
alkali ion for the epoxidation, both with hydrogen-oxygen and with water-
oxygen. It was determined that lower Ti and Au loadings favor the selectivity
to PO and that Cs enhances the gold incorporation in the catalyst, creating
more active sites. The epoxidation with water and oxygen was performed
successfully over Au/TS-1-Cs, with selectivities to PO up to 54 %, with acrolein
as the most important by-product. A kinetic model was developed for the
reaction, including PO and acrolein formation considering two types of active
sites: Au sites, where water and oxygen react, and Ti sites, over which the
epoxidation takes place. Two rate determining steps were considered. The first
one is the formation of OOH* species from oxygen and water over the gold
nanoparticle. The second one is the epoxidation reaction. Acrolein is formed by
the reaction of propene with very active O* species. These species can be
formed in the same Au-Ti sites as PO, via OOH* species, or directly from
oxygen, in gold nanoparticles that are too big or do not contain alkali ions, so
they cannot produce hydroperoxy species.
Gold over Ti-SiO2 was also evaluated and proved to be active for the
epoxidation with hydrogen and oxygen, but only produced acrolein when the
reactants were oxygen and water. The reason for this is, mainly, the absence of
alkali ions in the catalyst. The acrolein rate was equivalent to the one obtained
over Au/SiO2, suggesting that Ti does not play any role in the reaction.
It was concluded that the epoxidation of propene is possible in the presence of
water and that the presence of alkali ions and Ti atoms in the support are
essential. An increase in the concentration of oxygen and water favors the
OOH* formation, thereby enhancing the PO/acrolein ratio.
Page 229
Chapter 7: Conclusions and outlook
216
Acrolein formation over Au/MgCuCr2O4
Finally, the oxidation of propene with O2 over gold nanoparticles deposited on a
copper containing MgCr2O4 spinel was evaluated. The catalyst can selectively
oxidize propene to acrolein. Propene conversions up to 1.6 % with selectivities
to acrolein higher than 80 % were achieved at temperatures below 240 °C. The
presence of gold nanoparticles is necessary to guarantee the high selectivity to
acrolein, while the absence of copper in the support results in a very limited
propene conversion. PO was not observed over this catalyst, since gold
nanoparticles (AuNPs) without Ti are not capable of epoxidizing propene. The
addition of hydrogen as co-reactant produced the same results as with oxygen
alone, suggesting that the direct oxidation of propene is faster than the
formation of OOH* species over the AuNP. A computational analysis supports
the experimental observations. According to DFT calculations, propene is
adsorbed over a gold atom and the allylic hydrogen abstraction takes place
thanks to an oxygen atom coordinated to a Cu or Cr cation. These calculations
also confirmed the preference of acrolein formation vs. propene epoxidation to
PO.
7.2 Outlook
The growing demand of PO requires an efficient and profitable PO-only
process. So far, the alternative technologies studied in this thesis show
promising results and potential for improvement. Nevertheless, certain
limitations hinder their industrial implementation. Higher energy efficiencies
should be obtained when using a plasma reactor for the synthesis of hydrogen
peroxide. In the case of the direct synthesis of PO with O2 alone, a
breakthrough is still needed in catalyst development.
Page 230
217
List of Publications
Journal publications
Song, W., Perez Ferrandez, D.M., Haandel, L., Liu, P., Nijhuis, T.A. & Hensen,
E.J.M., 2014, Selective propylene oxidation to acrolein by gold dispersed on a
Cu-containing MgCr2O4 spinel support. ACS Catal. Submitted.
Truter, L.A., Perez Ferrandez, D.M., Schouten, J.C. & Nijhuis, T.A. (2015). TS-
1 coated microreactor for selective oxidations. Applied Catalysis A: General.,
22, 139-145.
Kertalli, E., Perez Ferrandez, D.M., Schouten, J.C. & Nijhuis, T.A. (2014).
Direct synthesis of propene oxide from propene, hydrogen and oxygen in a
catalytic membrane reactor. Industrial and Engineering Chemistry 53 (42),
16275–16284.
Perez Ferrandez, D.M., Croon, M.H.J.M., Schouten, J.C. & Nijhuis,
T.A. (2013). Gas-phase epoxidation of propene with hydrogen peroxide
vapor. Industrial and Engineering Chemistry Research, 52 (30), 10126-10132.
Chen, J., Halin, S.J.A., Pidko, E.A., Verhoeven, M.W.G.M., Perez Ferrandez,
D.M., Hensen, E.J.M., Schouten, J.C. & Nijhuis, T.A. (2013).Enhancement of
catalyst performance in the direct propene epoxidation: a study into gold-
titanium synergy. ChemCatChem, 5(2), 467-478.
Chen, J., Halin, S.J.A., Perez Ferrandez, D.M., Schouten, J.C. & Nijhuis,
T.A. (2012). Switching off propene hydrogenation in the direct epoxidation of
propene over gold-titania catalysts. Journal of Catalysis, 285 (1), 324-327.
Conference presentations
Oral presentations
Perez Ferrandez, D.M., Croon, M.H.J.M. de, Schouten, J.C. & Nijhuis,
T.A. (2014). Direct epoxidation of propene with molecular oxygen and water.
XVth Netherlands Catalysis and Chemistry Conference, 10-12 March 2014,
Noordwijkerhout, The Netherlands.
Page 231
List of Publications
218
218
Perez Ferrandez, D.M., Croon, M.H.J.M. de, Schouten, J.C. & Nijhuis,
T.A. (2013). Epoxidation and partial oxidation of propene with molecular
oxygen and water over gold-titanium catalysts. AIChE Annual meeting,
November 3-8, 2013, San Francisco, CA, USA.
Perez Ferrandez, D.M., Croon, M.H.J.M. de, Schouten, J.C. & Nijhuis,
T.A. (2013). Gas-phase epoxidation of propylene with vapor hydrogen
peroxide. 9th World Congress of Chemical Engineering (WCCE9), August 18-
23, 2013, Seoul, Korea.
Perez Ferrandez, D.M., Croon, M.H.J.M. de, Schouten, J.C. & Nijhuis,
T.A. (2012). Epoxidation of propylene in a microreactor using hydrogen
peroxide produced in situ in a plasma reactor. 22nd International Symposium
on Chemical Reaction and Engineering (ISCRE 2012), 2-5 September 2012,
Maastricht, The Netherlands.
Posters
Perez Ferrandez, D.M., Croon, M.H.J.M. de, Schouten, J.C. & Nijhuis,
T.A. (2013). Understanding the gas-phase epoxidation of propene with
hydrogen peroxide vapor. AIChE Annual meeting, November 3-8, 2013, San
Francisco, CA, USA.
Perez Ferrandez, D.M., Croon, M.H.J.M. de, Schouten, J.C. & Nijhuis,
T.A. (2013). Epoxidation of propylene with gas-phase hydrogen peroxide. 23rd
North American Catalysis Meeting (NAM23), June 2-7 2013, Louisville,
Kentucky, USA.
Perez Ferrandez, D.M., Croon, M.H.J.M. de, Schouten, J.C. & Nijhuis,
T.A. (2013). Direct epoxidation of propene with vapor hydrogen
peroxide.Proceedings of the 9th European Conference of Chemical Engineering
(ECCE9), 21-25 April 2013, The Hague, The Netherlands.
Perez Ferrandez, D.M., Croon, M.H.J.M. de, Schouten, J.C. & Nijhuis,
T.A. (2013). Gas-phase epoxidation of propylene with vapor hydrogen
peroxide. Proceedings of the XIVth Netherlands Catalysis and Chemistry
Conference, March 11-13, 2013, Noordwijkerhout, The Netherlands.
Perez Ferrandez, D.M., Croon, M.H.J.M. de, Schouten, J.C. & Nijhuis,
T.A. (2012). Epoxidation of propylene in a microreactor using hydrogen
peroxide produced in situ in a plasma reactor. 15th International Congress on
Catalysis (ICC 2012), 1-6 July 2012, Munich, Germany.
Page 232
List of Publications
219
219
Perez Ferrandez, D.M., Croon, M.H.J.M. de, Schouten, J.C. & Nijhuis,
T.A. (2012). Epoxidation of propylene in a microreactorusing hydrogen peroxide
produced in situ in a plasma reactor. Proceedings of the 13th Netherlands
Catalysis and Chemistry Congress (NCCC XIII), 5-7 March 2012,
Noordwijkerhout, The Netherlands.
Perez Ferrandez, D.M., Croon, M.H.J.M. de, Schouten, J.C. & Nijhuis,
T.A. (2011). An integrated microreactor for the epoxidation of propene using a
micro plasma: Epoxidation. Proceedings of the Netherlands' Catalysis and
Chemistry Conference 2011 (NCCC-12), 28 February - 2 March 2011,
Noordwijkerhout, The Netherlands.
Perez Ferrandez, D.M., Croon, M.H.J.M. de, Schouten, J.C. & Nijhuis,
T.A. (2011). Epoxidation of propylene with hydrogen peroxide produced in situ
in a plasma reactor. Netherlands Process Technology Meeting (NPS-11), 24-26
October 2011, Arnhem, The Netherlands.
Perez Ferrandez, D.M., Croon, M.H.J.M. de, Schouten, J.C. & Nijhuis,
T.A. (2010). An Integrated microreactor for the epoxidation of propene using a
micro plasma: Epoxidation. Netherlands Process Technology Meeting (NPS-10),
25-27 October 2010, Veldhoven, The Netherlands.
Page 234
Acknowledgements
Finally, the experiments are done, the results are written down and analyzed
and conclusions have been drawn. The book is ready! That was the final goal
when I decided to start this adventure more than four years ago. But I have
realized that a PhD project is like a pilgrimage, where the important thing is
not only where you go, but also the things you experience during your journey.
Along the way, there are plenty of learning experiences with which you can
grow in many levels. During these years I have crossed paths with several
people that have helped me and made this journey very special. It is thanks to
those people that I have managed to finish this adventure and I want to deeply
thank them in this section.
First of all, I would like to thank my promoter prof.dr.ir. Jaap Schouten. Jaap,
you opened the doors of your group for me, giving me the opportunity to
develop myself and my career in such a privileged environment. I would like to
thank you for trusting me and believing that I could finish this thesis. Thank
you for paying attention to the small details, that are crucial for a better work.
Special thanks to dr.ir. Xander Nijhuis, my daily supervisor. Xander, you
introduced me into the world of PO, in which you have broad experience. I have
learned a lot from you. I appreciate that your door was always open, but you
also encouraged me to make my own decisions, and to be the boss of my own
project. With this, you encouraged me to grow as a researcher. I cannot forget
when, after two years and a half, we had to make difficult decisions regarding
the direction and content of the thesis. You supported me and helped me to
make this possible. Thank you for giving me the opportunity of continuing in
the group as a PostDoc researcher. Now you are going to leave the university
and enter into the company world. I wish you all the best in your new career
step.
I would also like to thank my second supervisor, dr. Mart de Croon. Mart,
thank you for reading this thesis, including the appendices, so carefully. I
really appreciate that you double-checked all my calculations and corrected my
grammar and punctuation. I am still amazed that you even noticed the
misalignment of the hyphens and the commas. However, I still like the font. I
hope you enjoy your long-desired and well-deserved retirement.
Page 235
Acknowledgements
222
222
I also thank the members of the committee, prof.dr. K. Seshan, prof.dr. J.H.
Bitter and prof.dr.ir. G.M.W. Kroesen for taking the time to read this thesis,
giving encouraging comments and being part of my PhD commission.
I really appreciated the collaboration with prof.dr.ir. Emiel Hensen that
resulted in the last chapter of this thesis. Emiel, I enjoyed the discussions we
had and admire your enthusiasm and your deep knowledge of surface science.
My experimental work would not have been possible without the incredible
support of several people. Carlo, your input was indispensable, including the
writing of the Labview code, taking SEM and TEM pictures and many many
more. Thank you also for keeping us safe, even when we complain about safety
rounds and cleaning exercises. I will never forget that ‘eyes are expensive but
glasses are cheap’. I even went to you for tips about running shoes. Marlies,
thank you for being so helpful with the GCs, and not stopping until my
problems, which I had quite some, were solved. Thank you also for caring about
us and sharing stories about your village, Carnival, pottery, etc., making me feel
more at home. Peter, thank you for always being available for helping with
everything, either doing ICP analysis, helping with the gas bottles using a
giant spanner, or trying to find something impossible in a VWR catalogue. You
also encouraged me to learn Dutch and to use it, even when I was making a lot
of mistakes. Those Dutch lunches with Christine in the Kennispoort were very
useful. Erik, with your great ability to make things happen and to find a
solution for any kind of experimental problem (or challenge, depending on how
you look at it) that I could encounter. Your help and patience were crucial,
specially when all my setups were broken or under repair. We are very
fortunate to have such a complete workshop with so talented people. Anton,
Theo, Madan, Dolf, Joris and Joost, thank you for being always willing to help.
My gratitude to Denise, for your invaluable help. From the very first year, with
my tax declaration, to all the administrative steps to prepare this thesis and
defense, including advice to take care of my orchid. You always managed to
help me even when you had a lot of things to do (which was always).
My office, STW 1.24, became my second house, and I have shared it with
various officemates that made it very special. At the beginning, I was between
two Dutch guys that were about to finish. Stijn, it was a pity that we did not
overlap during more than 3 months, but I would have liked to get to know you
better, especially since I heard about the Coffee Integration Program. Joost, the
tall and calm Dutchman, always with his feet on top of the desk. I appreciate
Page 236
Acknowledgements
223
223
your tips and the conversations we had. Kevin, darling, thank you for being my
window to the Netherlands and, between simulation and simulation, explaining
me what was going on around me, including Eurovision. Finally, Emila, we
made the office our home, and we spent so much time there together, working,
talking and talking again, sometimes until 7 in the evening, when the
ventilation went off, and that was the sign that it was time to go home. STW
1.24 also became a kind of common room during the last years, with regular
daily visits from Lara, Violeta, Fer, and other people. The common room status
became official when we decided to buy the Nespresso machine. This was very
nice, even though it proved to be a bit problematic when I had to finish writing
the thesis. I am glad I get to be there one year longer.
I have also spent a lot of time in lab 1.05, and there I was also surrounded by
very nice companions. Serdar, who suddenly, at the end of his PhD realized
that The Netherlands was not such a bad place to live in. Jun, always willing to
help and to chat for a while. Once again, Emila. And last, but not least, Jiaqi,
who was more than a lab colleague. Jiaqi, I want to specially thank you,
because you helped a lot me at the beginning of my PhD, explaining me how to
prepare the catalysts and how to operate the setups. You were generous and
kind, and always had patience to explain me whatever I asked. Thank you also
for always having a supporting word for me.
Thanks to my space-geek physicist friend, Chris. Because we were in this
together, fighting against peroxide decomposition and analysis, struggling to
make it micro and trying to find the best combination of reactors. Because we
have seen that sometimes physicists and chemists do not speak the same
language, even when talking about the same thing. Writing the common
chapter together was challenging but I think it was worth it. I have learned a
lot from working with you, specially how cool and colorful plasmas can be.
I would like to thank my students, Max, Martin and Iranzu, who contributed to
part of the experimental work presented in this thesis. Thank you for your
hard work and for helping me to develop as a supervisor.
I am very grateful to my supervisors for having allowed me and encouraged me
to present my work at several conferences, both from The Netherlands (NCCC,
NPS) and international, like AIChE in San Francisco, WCCE in Seoul or
ISCRE in Maastricht. They were wonderful experiences.
But these years have not only been about work. I have been really lucky to
enter in a very special group. I want to acknowledge all the people of SCR and
Page 237
Acknowledgements
224
224
SFP. To the staff members: John, Volker and Martin. Martin, thank you for the
nice conversations and the tips about music. And to all the PhDs and PostDocs,
those who are still here and those who finished some time ago: Vitaly, Lida,
Serdar, Narendra, Christine, Jiaqi, Marco, Ma’moun, Bruno, Nopi, Fer, Roman,
Frans, Anto, Jovan, Jack, Chattarbir, Joost, Faysal, Halabi, Wim, Carlos,
Michiel van del Stelt, Ivana, Qi, Jun and Tom. To the PhDs from SFP: Lana,
Bhaskar, Minjing, Elnaz, Carlos and more. I have had a lot of fun during the
old and the new times, when we used to go to the F.O.R.T. every Thursday, or
during the birthday borrels, football matches, games evenings, movie nights,
World Cups, Dommelloop, even a couple of concerts of Boo!. Very important for
me were the sometimes endless coffee breaks. Thank you all for making the
west corridor of the first floor of the Helix building a very nice place to work.
I cannot forget about the girls’ dinners, started by the Girls’ mafia. I have had
such a good time during those evenings and I appreciate the luxury of learning
about cuisine from all over the world. It is a pity that I was too lazy to put them
into practice myself. Thank you Anto, Lida, Christine, Ana, Nopi, Ivana, Qi,
Violeta, Paola, Shohreh, Fer, Emila, Lara and Minjing.
When you are far from your country and your loved ones, sometimes you can
get a bit homesick. I was really lucky to find a family in Eindhoven that was
always there for me and made me feel at home. Emila, because I can include
you in almost every single group of this acknowledgements. You have been a
key person since the moment you arrived, covered in one million layers because
you were cold even if it was June. Because we have had so many adventures
together, from the Boom Boom Club in San Francisco, to the streets of Den
Bosch looking for an artist. You have been there to share my hapiness, and, as
important, you have held my hand during the bad moments as well. Sometimes
you can tell things about myself that even I do not realize. The project we did
together was a very nice experience for me. Thank you for being always there.
To Fer, the insightful. How many times have I wondered what to do and the
thing that came to my mind was: ‘I will consult this with Fer’. I could always
count on you, either for advice, support or having a good time. We started the
same day, what seems like ages ago, and went through a lot of things together:
playing domino in a snowy and remote island, doing pilates at the sports
center, learning about surface science in Leiden and, of course, our unique trip
to Seoul. It was a pity I could not go to your wedding, but still you made me feel
part of it. Gracias por ser una constante durante estos años, por ser una amiga
increíble y por hacerme sentir especial. To Lara, Truter. Thank you for always
Page 238
Acknowledgements
225
225
cheering me up and bringing me back to reality. You are a very strong, not only
from waterpolo (which is sometimes a bit scary), but also as a person. Proof of
that is that you survived 3 months in China. I have also enjoyed working with
you and learned a great deal about zeolites from you. Your multitasking skills
will never cease to surprise me, and how you are capable of being in 3 labs at
the same time. To Violeta, thank you for always having a hug ready. I am
always amazed with how many small details from different topics you know. I
could always count on your knowledge about organic chemistry. I have enjoyed
a lot our conversations, including when we shared room a couple of times
during conferences. To the sweet Nopi. Thank you for your delicious cakes and
your smile. I had a very good time in Seoul with Fer and you. To the Fantastic
Four, Slaviša, Shohreh, Paola and Michiel, for always having a smile and for
being always willing to organize activities, sports, movie nights, Sinterklaas,
etc. You are the perfect ambassadors of the slogan ‘Spinning is Winning’. I felt
honored to become the Fifth, even if it was only for a short time.
To Christine, Lida and Anto, for all the dinners, barbeques and weekendjes,
both just us and with the guys. I am very happy that, in spite of following
different paths, we still manage to stay in touch. I consider you very good
friends.
Outside Chemical Engineering I also met very nice people that helped me
realize that there is life outside the Helix building. To Ana, Sahel and Natalia,
who started being my colleagues from the Dutch course and after dinners,
sports center and (Russian) birthdays parties, they became good friends. And
Francesca, with whom I first shared a kitchen and we ended up going to see the
Finals of the World Championships of gymnastics in Antwerp. To my Dutch
teachers, Elly and Leonie, thank you for doing more than just explaining the
language. You managed to transmit the culture with a lot of enthusiasm and I
was looking forward to your lessons every week.
I had the honor of being the president of the NIOK PhD Platform (NPP) for one
year. This was thanks to Jana, who encouraged me to join. I appreciate very
much having been part of the board, together with Roy and Nastya. Thank you
guys, because I learned a lot and enjoyed the organization of the activities.
Thanks also to Irene, because of her efficiency in answering all our questions
and for spreading the word of the NPP activities to all the research groups.
Page 239
Acknowledgements
226
226
I would like to thank the people from Terneuzen, specially Janiene and Jean
Pierre, who adopted us from the beginning. Thanks for inviting us to the cook-
offs that turned into something very sophisticated and a bit competitive.
A mi familia, que ha estado apoyándome incondicionalmente desde la distancia.
A mis padres, Javier y Loli, quienes cada semana por Skype hicieron (y
sufrieron) conmigo el doctorado. Gracias a vosotros estoy donde estoy, siempre
habéis creído en mí y me habéis dado todo lo que necesitaba. No tengo palabras
para agradecéroslo. A mi hermano Iago, por la complicidad que tenemos y
porque, aunque eres el pequeño, siempre estas pendiente de tu hermana loca. A
mi Nini, que es como mi segunda madre. Porque compartimos más que el
nombre, y aunque no hablemos o nos veamos mucho, siempre noto tus ánimos.
Y a mis cuatro abuelos, Federico, Amalia, Marcial y Lolita, porque sé que
sufren al vernos tan poco, pero saben que yo siempre les llevo conmigo vaya a
donde vaya, incluso aunque alguno ya no esté con nosotros. A mis suegros, Geli
y Jose y a Loreto, porque me hacen sentir como una más de la familia y siento
que están siempre pendientes de mí y apoyándome.
Y en especial, esta tesis está dedicada a ti, Pope (Jacobo), porque eres mi roca,
mi motor y mis fuerzas. Sin ti estos años habrían sido casi imposibles. Sabes
entenderme, calmarme y animarme ante cualquier circunstancia. Muchas
gracias por haber soportado mis locuras y por saber poner una sonrisa en mi
cara cada vez que nos vemos o hablamos. Cada momento contigo es especial.
Estoy convencida de que dentro de muy poco conseguiremos la tan ansiada
meta de poder vivir juntos. Te quiero.
Nunca choveu que non escampara
Eindhoven, December 2014
Page 240
227
About the Author
Dulce M. Perez Ferrandez was born on the 14th February 1985 in A Coruña,
Spain. She obtained the degree of Chemical Engineer at Universidad de
Santiago Compostela, Spain, in 2009. She performed her graduation project as
Erasmus student at Newcastle University, United Kingdom, under the
supervision of dr. Clarie Fialips. The topic researched during the
aforementioned project was ‘Chromium remediation by dithionite-reduced Fe-
bearing clay minerals’. After her graduation, she completed a 7-month
internship with a Leonardo da Vinci grant at ArcelorMittal R&D, Ghent,
Belgium. In March 2010 she joined the Laboratory of Chemical Reactor
Engineering of Eindhoven University of Technology (Eindhoven, The
Netherlands) to perform her Ph.D. project under the supervision of dr. Xander
Nijhuis, dr. Mart de Croon and prof.dr.ir. Jaap Schouten. Her work focused on
the study of the alternatives for the production of propene oxide and its results
are presented in this dissertation. Currently, she is working as a researcher at
the Laboratory of Chemical Reactor Engineering of Eindhoven University of
Technology.