180
CONTRACT NO. 94-315 FINAL REPORT December 1997 Alternatives to Perchloroethylene-Based Garment Care: Assessing the Viability of Professional Wet Cleaning
CONTRACT NO 94-315 FINAL REPORT December 1997
Alternatives to Perchloroethylene-Based Garment Care
Assessing the Viability of Professional Wet Cleaning
Alternatives to Perchloroethylene-Based Garment Care Assessing the Viability of Professional Wet Cleaning
Final Report Contract No 94-315
Prepared for
California Air Resources Board Research Division
2020 L Street Sacramento CA 95814
Prepared by
Robert Gottlieb Principal Investigator
Peter Sinsheimer Senior Research Associate
Jessica Goodheart Project Manager
Craig Tranby Research Associate
Laura Bechtel Research Associate
University of California Los Angeles Pollution Prevention Education and Research Center
Boelter Hall Room 7440 Los Angeles CA 90024
December 1997
For more information about the ARBs Research Division its research and activities please visit our Web site
httpwwwarbcagovrdrdhtm
Dedication
This Report is dedicated to the late Julie Roque Through her passionate pursuit of the ideals and goals of pollution prevention which she understood were embedded in the complexities of analysis and the details of evaluation she was always available to work with and assist those seeking to identify pollution prevention solutions We continue to miss her
Disclaimer
The statements and conclusions in this report are those of the Pollution Prevention Education and Research Center and not necessarily those of any institution that has funded this work The mention of commercial products their source or their use in connection with material reported herein is not to be construed as actual or implied endorsements of such products
Acknowledgments
This report required a wide range of input and technical review A number of people provided significant support in terms of information technical review and comments We would especially like to thank among others David Adelman (Wyatt-Bennett Equipment Corp) Lisa Anderson (Metropolitan Water District) Angela Barranca (US Environmental Protection Agency -- Region IX) Chandrashekhar Bhatt (South Coast Air Quality Management District) Jim Bienias (Reliance Water Heater Co) Kurt Chester (Rayne Company) Jenni Cho (Korean Youth and Community Center) Jeananne Coop (California State University Long Beach Apparel Design and Merchandizing) Yoram Cohen (UCLA) Joe Chu (CaIOSHA) Deborah Davis (Owner Cleaner by Nature) Ron Deli (Multirnatic) Claudia Der-Martirosian (Lewis Policy Center UCLA) David DeRosa (Greenpeace) Chris Dolan (Iowa Techniques) Sylvia Ewing-Hoover (Center for Neighborhood Technology) William Eyring (Center for Neighborhood Technology) Ken Faig (International Fabricare Institute) Barry Fine (London Cleaners) Jodean Giese (LA Dept of Water and Power) Ranji George (South Coast Air Quality Management District) Barry Gershenson (Sterling Cleaners former president of California Fabricare lnstitiute) Andrea Gough (California Energy Commission) Steve Green (Carriage Trade Cleaners) Deborah Hanlan (US Environmental Protection Agency) Chris Hayes (Center for Neighborhood Technology) Andres Hernandez (Plant Manager Cleaner by Nature) Elizabeth Hill (Pollution Prevention Education and Research Center) Sharon Howell (California Energy Commission) Christina Huber (Pollution Prevention Education and Research Center) Stewart Ilkowitz (Hi-Stearn Corporation) Sharon Im (Korean Youth and Community Center) Hazel Jackson (Associate Professor California State University Long Beach Apparel Design and Merchandizing) Margaret Johnson (Lewis Policy Center UCLA) Von Kennedy (RJ Cool) Kirn Kenson (California State University Long Beach Apparel Design and Merchandizing) Virginie Leenknecht (UCLA) Greg Leirarn (PROS) Charles Lemke (LA Dept of Water and Power) Deborah Lerner (Pediatric amp Family Medical Center) Hong Mai (LA Bureau of Sanitation) Bob McEntyre (Flourmatic) Traci Minarnide (LA Bureau of Sanitation) Mike Mowry (UCLA) Ung Sin (Mike) Na (past president Korean Dry Cleaners amp Laundry Association) Kari Nelson (California State University Long Beach Apparel Design and Merchandizing) Bruce Nordman (Lawrence Berkeley Laboratories) Gregory Ondich (United States Environmental Protection Agency) Dennis Page (Woods Electric) Gary Parker (RSD Cooling Towers) Bhupendra Patel (LA Bureau of Sanitation) Jo Patton (Center for Neighborhood Technology) Howard A Perlman (US Geographic Survey) Colleen Poteet (California State University Long Beach Apparel Design and Merchandizing) Winston Potts (Air Resources Board) Ralph Propper (California Air Resources Board ) Peter Saarna (Statistical Consultant UCLA) Andy Sandcavage (Metropolitan Water District) Deborah Savage (Tellus Institute) Sam Schwartz (International Fabricare Institute) Rajesh Sharma (Pediatric amp Family Medical Center) Donald Shoup (UCLA) Jodi Siegel (Toxics Use Reduction Institute) Sue Stanley (Area Coordinator California State University Long Beach Apparel Design and Merchandizing) Anthony Star (Center for Neighborhood Technology) Pierre Sycip (South Coast Air Quality Management District) Sojeila Sylva (SEED Loan Fund) Wes Tanaka (Southern California Edison) Warren Teitz (Metropolitan Water District) Steve Trainer (Iowa Techniques) Jim Tranquada (UCLA) Willie Valdez (LA Bureau of Sanitation) Elaine Vaughan (University of California Irvine) Julie Venturini (Energy Resource Center) Belinda Vigil (Lewis Policy Center UCLA) Torn Votta (Tellus Institute) Patrice Wong (Korean Youth and Community Center) Todd Wong (California Air Resources Board)
Support for this report was made available through the United States Environmental Protection Agency Office of Research and Development the South Coast Air Quality Management District the California Air Resources Board the Center for Environmental Risk Reduction UCLA the University of California Toxic Substances Research and Training Program and the Los Angeles County District Attorneys Office Occupational and Environmental Division
Table of Contents
Page Number
Abstract i
Executive Summary ii
Part I Background and Methods
Section 1 Background to the Study 1-1 11 Pollution Prevention and the Gannent Care Industry 1-1
l 1 1 The Pollution Prevention Approach 1-2 112 PCE-Based Dry Cleaning and the Need for a Pollution Prevention Approach 1-3 113 Professional Wet Cleaning as a Pollution Prevention Alternative 1-5 114 Description of the Dry Cleaning and Wet Cleaning Processes 1-6 115 The Development of the Wet Clean Industry 1-7 116 The Demonstration Site Evaluation 1-8
12 Cleaner by Nature A Pollution Prevention Demonstration Site 1-11 121 Description of the Evaluation Period the First Twelve Months ofOperation 1-12 122 Demonstration and Outreach 1-15 123 Conclusion Assessing Viability 1-16
Section 2 Methods for Assessing Viability 2-1 21 General Research Method 2-1 22 Evaluation Criteria for Assessing the Viability of Wet Cleaning 2-2 23 The Study Design for Each Section of the Report 2-3
Part II Results
Section 3 Performance Assessment of Wet Cleaning 3-1 31 Overview 3-1 32 Profile of Customer Gannents 3-3
32 l Volume 3-3 322 Garment Type 3-4 323 Fiber Type 3-5 324 Care Labeling 3-6 325 Garment Profile Summary 3-7
33 Analysis of Problem Gannents 3-8 331 Rejects 3-8 332 Claims and Store Credit 3-9 333 Garments Returned for Additional Work 3-10 334 Summary ofProblem Garments 3-14
Page Number
34 Repeat Clean Test 3-16 341 Dimensional Change Evaluation 3-17 342 General Appearance Evaluation 3-23 343 Color Change Evaluation 3-25 344 Odor Evaluation 3-27 345 Summary of Repeat Clean Test 3-28
35 Wearer Survey 3-29 351 Performance Quality Wet Cleaning and Dry Cleaning 3-29 352 Overall Satisfaction Wet Cleaning and Dry Cleaning 3-31 353 Wearer Survey Summary 3-32
36 Customer Satisfaction with Wet Cleaning 3-33 361 Cleaner by Nature Customer Satisfaction Survey 3-33 362 Cleaner by Nature Customer Satisfaction Survey Summary 3-40 363 Dry Cleaning Customer Survey 3-41 364 Dry Cleaning Customer Survey Summary 3-46
37 Summary Analysis of Performance Assessment 3-48
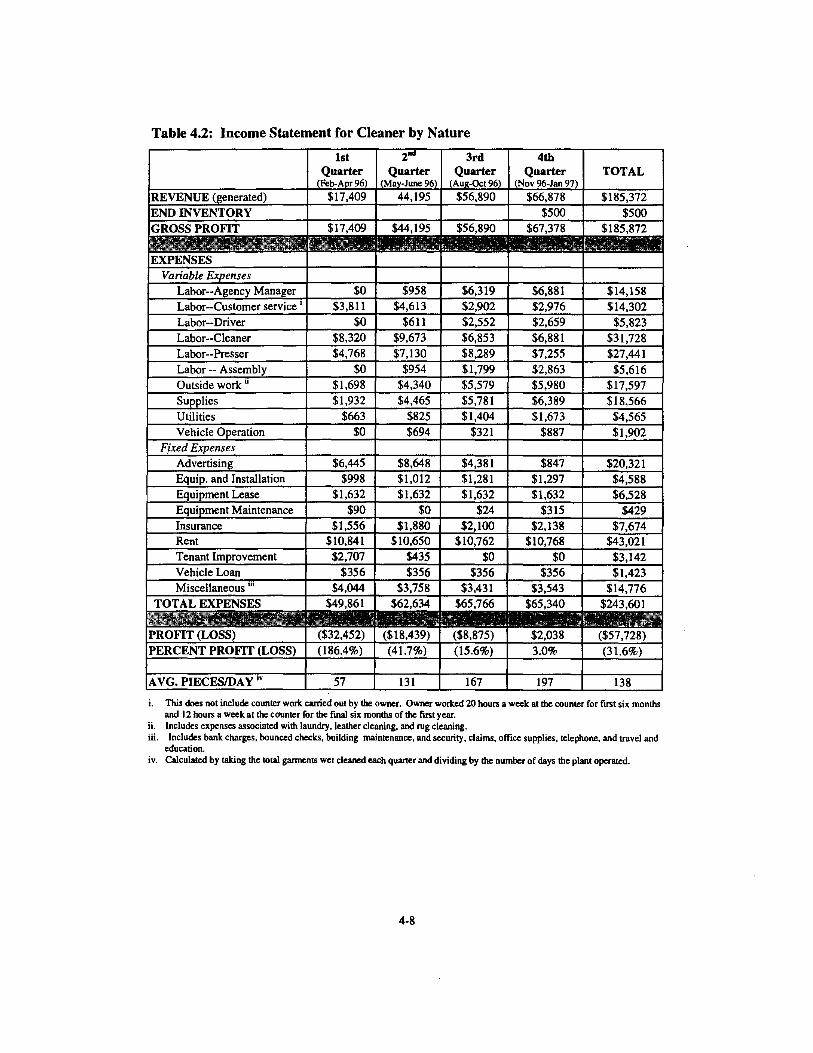
Section 4 Financial Assessment of Wet Cleaning 4-1 41 Overview 4-1 42 Cleaner by Nature Case Study 4-3
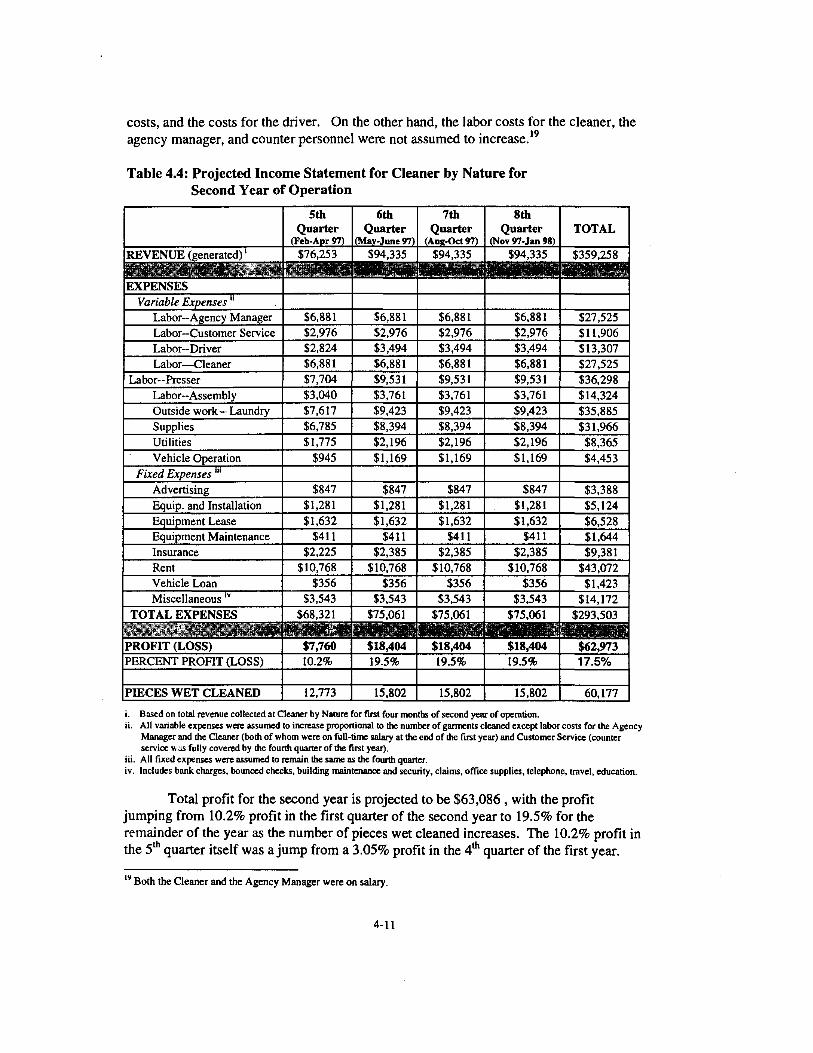
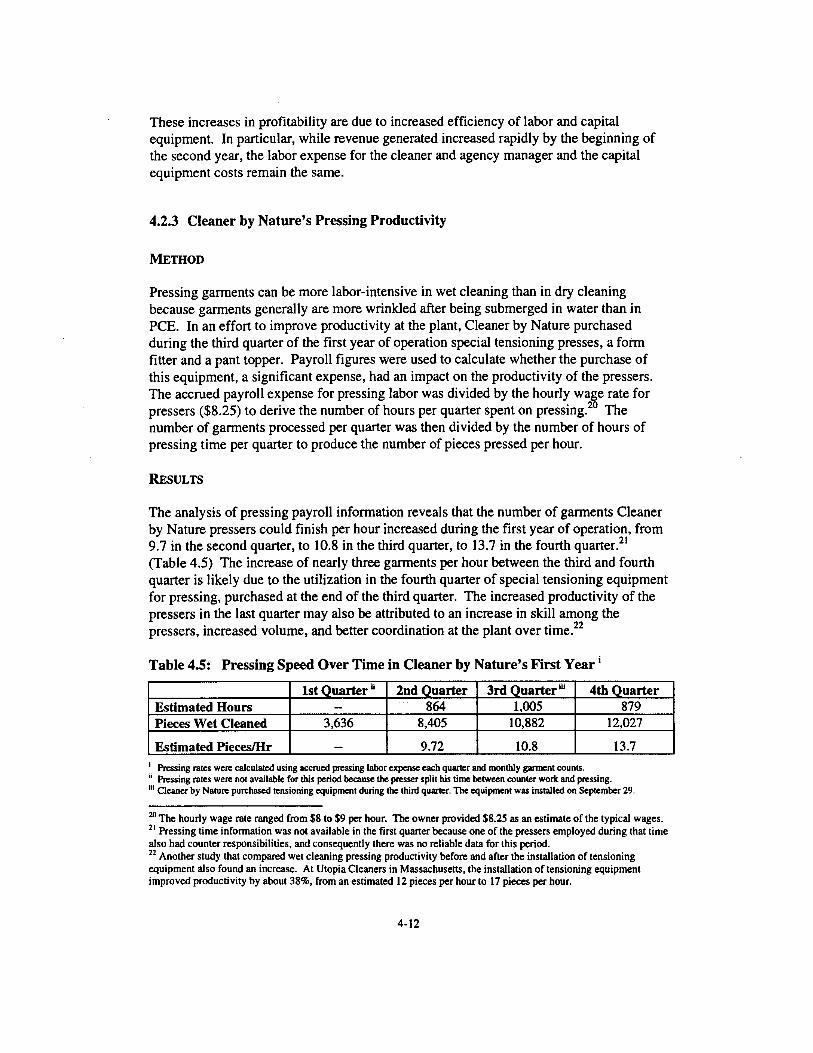
421 Start-Up Costs 4-3 422 Cleaner by Natures Profit and Loss 4-6 423 Cleaner by Natures Pressing Productivity 4-12
43 Cost Comparison of Cleaner by Nature and Dry Cleaning 4-13 431 Equipment Cost Comparison 4-14 432 Pressing Time Comparison 4-18 433 Cost Analysis Cleaner by Nature and Dry Cleaning 4-21
44 Summary Analysis ofFinancial Assessment 4-28
Section 5 Environmental Assessment of Wet Cleaning 5-1 51 Overview 5-1 52 Methods for the Environmental Assessment 5-2 53 Water Inputs and Outputs 5-5
531 Water Use 5-5 532 Water Discharge 5-10
54 Energy Inputs and Outputs 5-15 541 Energy Use 5-15 542 Energy Outputs 5-20
55 Chemical Inputs and Outputs 5-22 551 Chemical Inputs 5-22 552 Chemical Outputs 5-25
56 Summary Analysis of Environmental Assessment 5-31
Page Number
Part III Analysis and Conclusion
Section 6 Contributing Factors for Assessing Viability 6-1 61 Contributing Factors to the Assessment of Performance Viability 6-1 62 Contributing Factors to the Assessment of Financial Viability 6-3 63 Contributing Factors to the Assessment of Environmental Viability 6-6 64 Conclusion Assessing Viability 6-7
Section 7 Recommendations 7-1
Appendices
Order Form
List of Tables Page
Number
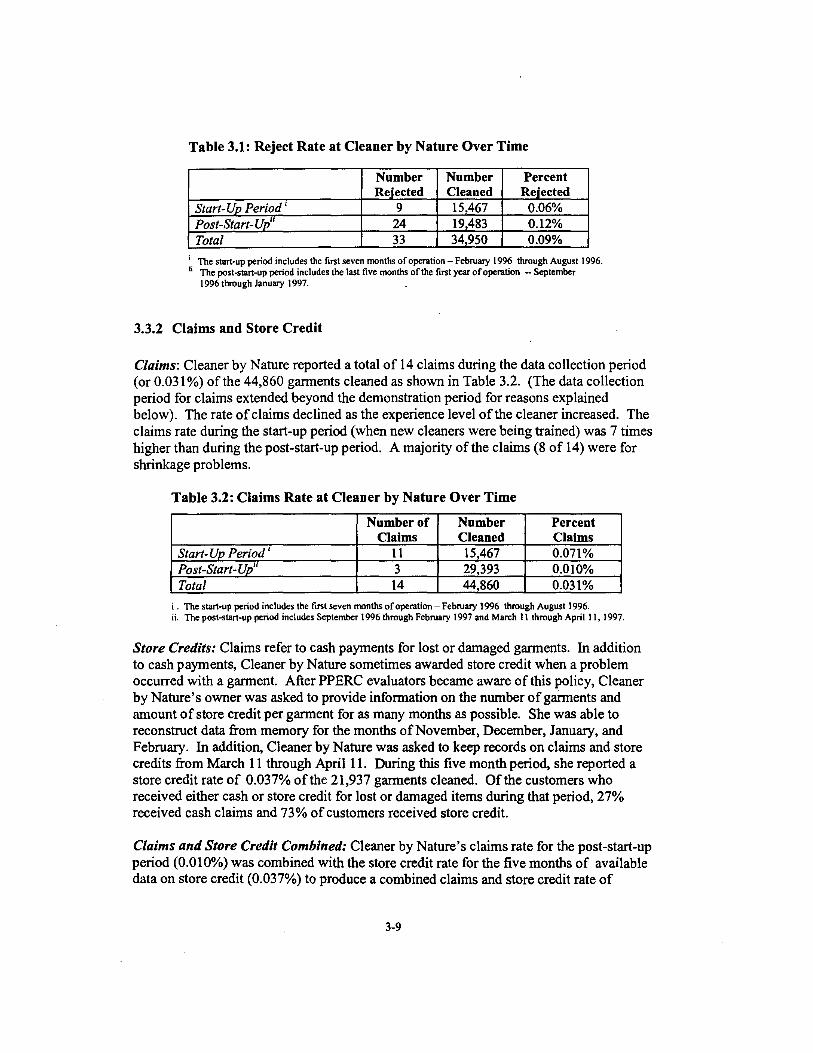
Table 31 Reject Rate at Cleaner by Nature Over Time 3-9
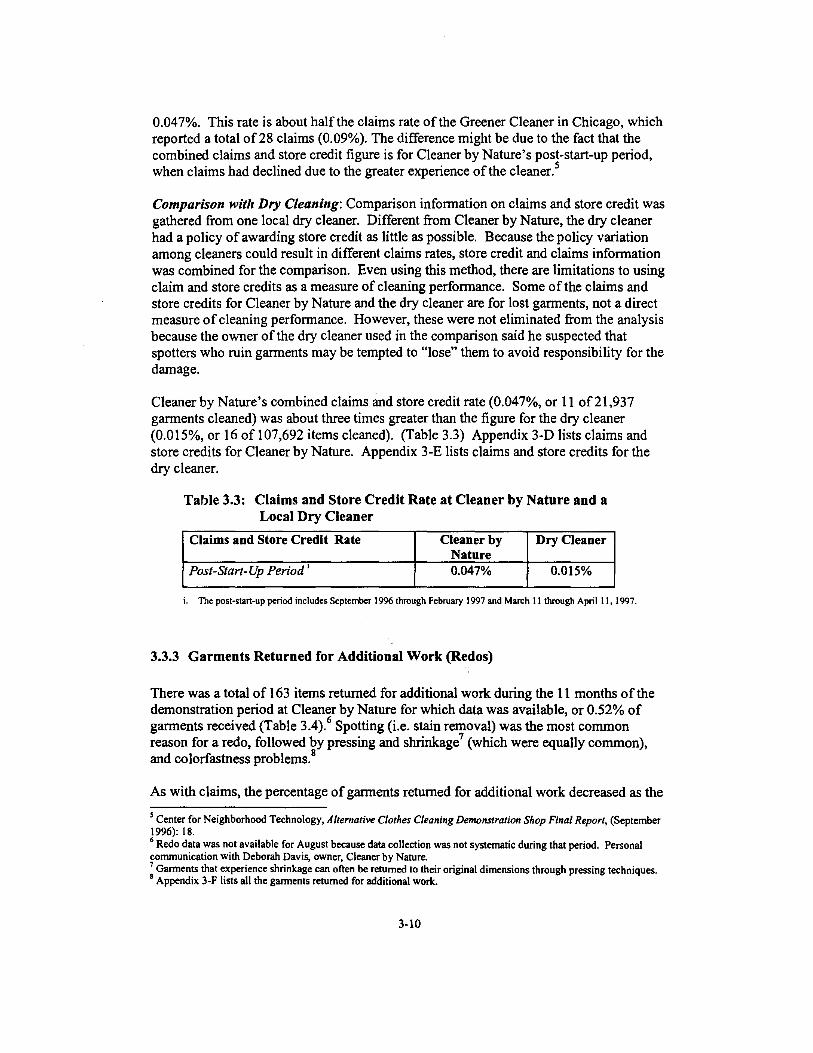
Table 33 Claims and Store Credit Rate at Cleaner by Nature and a Local Dry
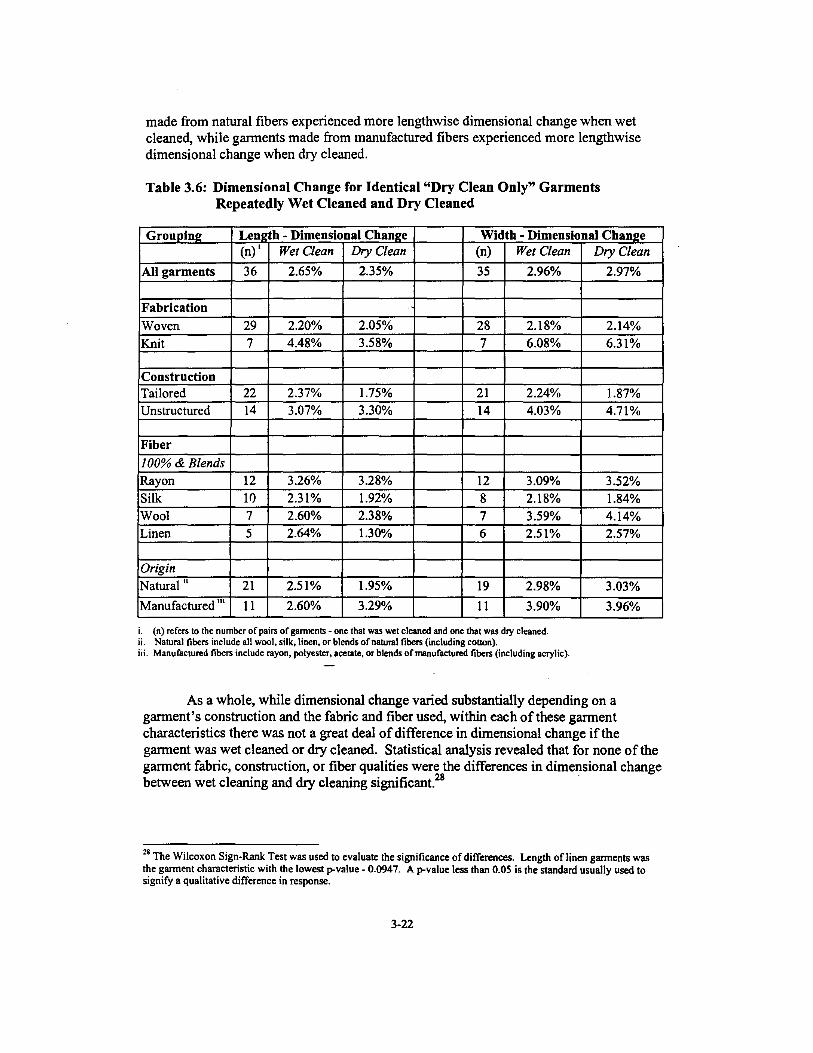
Table 36 Dimensional Change for Identical Dry Clean Only Garments
Table 317 Percent of Wearers Who Thought They Could Identify Wet Cleaned
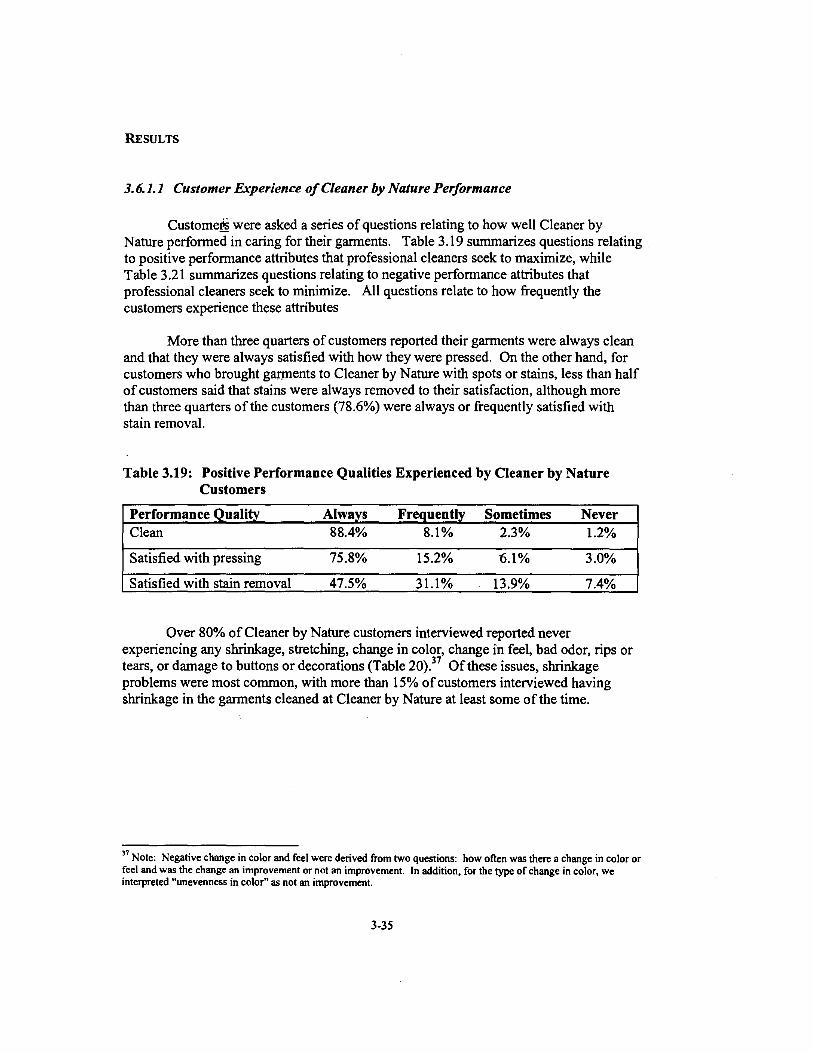
Table 319 Positive Performance Qualities Experienced by Cleaner by Nature
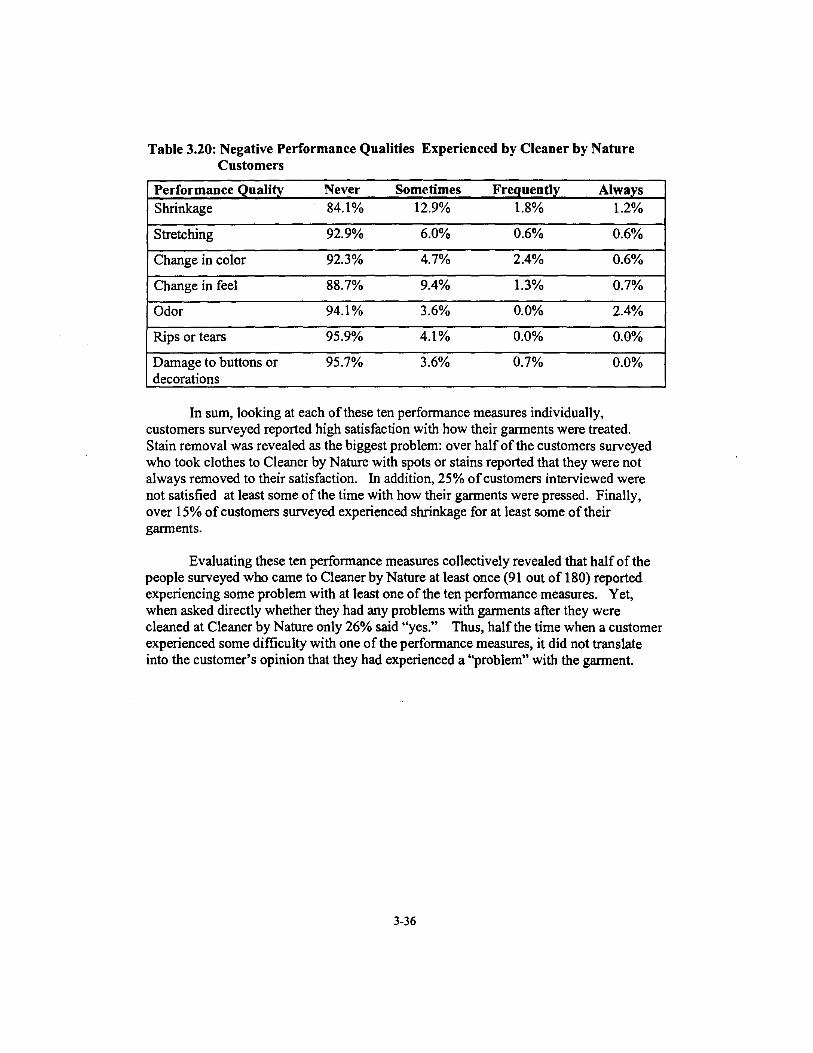
Table 320 Negative Performance Qualities Experienced by Cleaner by Nature
Table 326 Proportion of Garments Cleaner by Nature Customers Take to Dry
Table 327 Primary Reason Why Cleaner by Nature Customers Also Use Dry
Table 329 Positive Performance Qualities Experienced by Cleaner by Nature
Table 330 Negative Performance Qualities Experienced by Cleaner by Nature
Table 331 Customer Rating of Professional Cleaners Cleaner by Nature
Table 32 Claims Rate at Cleaner by Nature Over Time 3-9
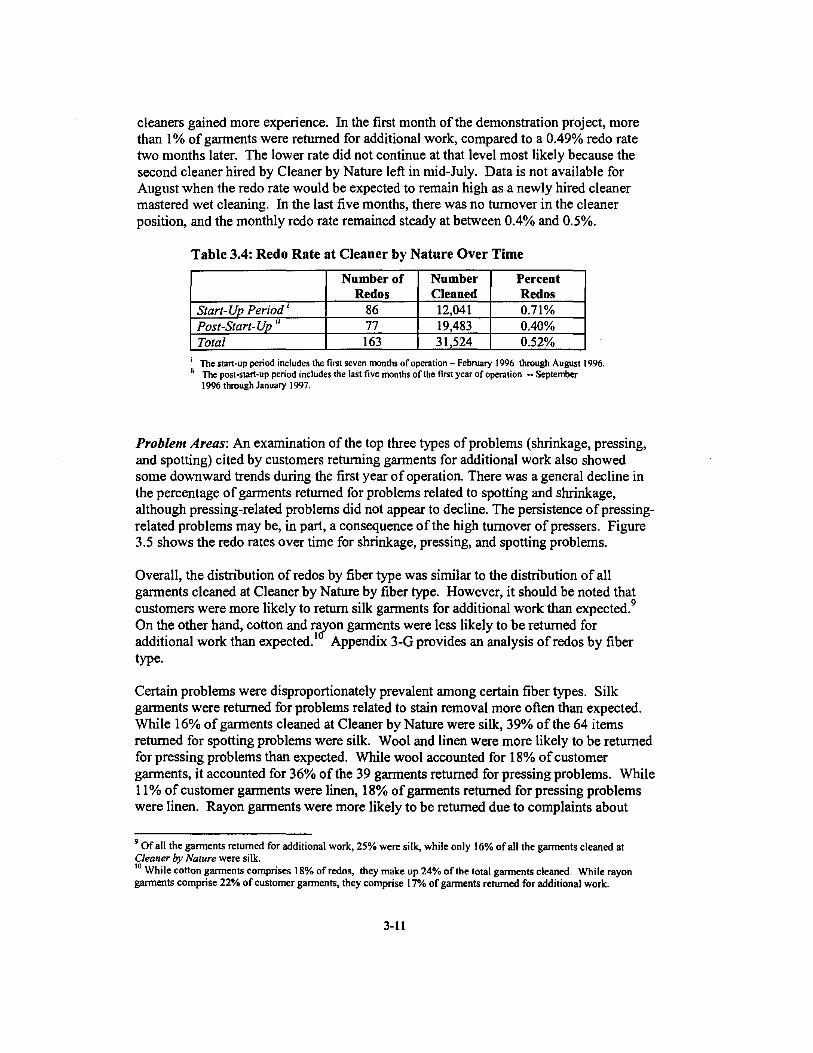
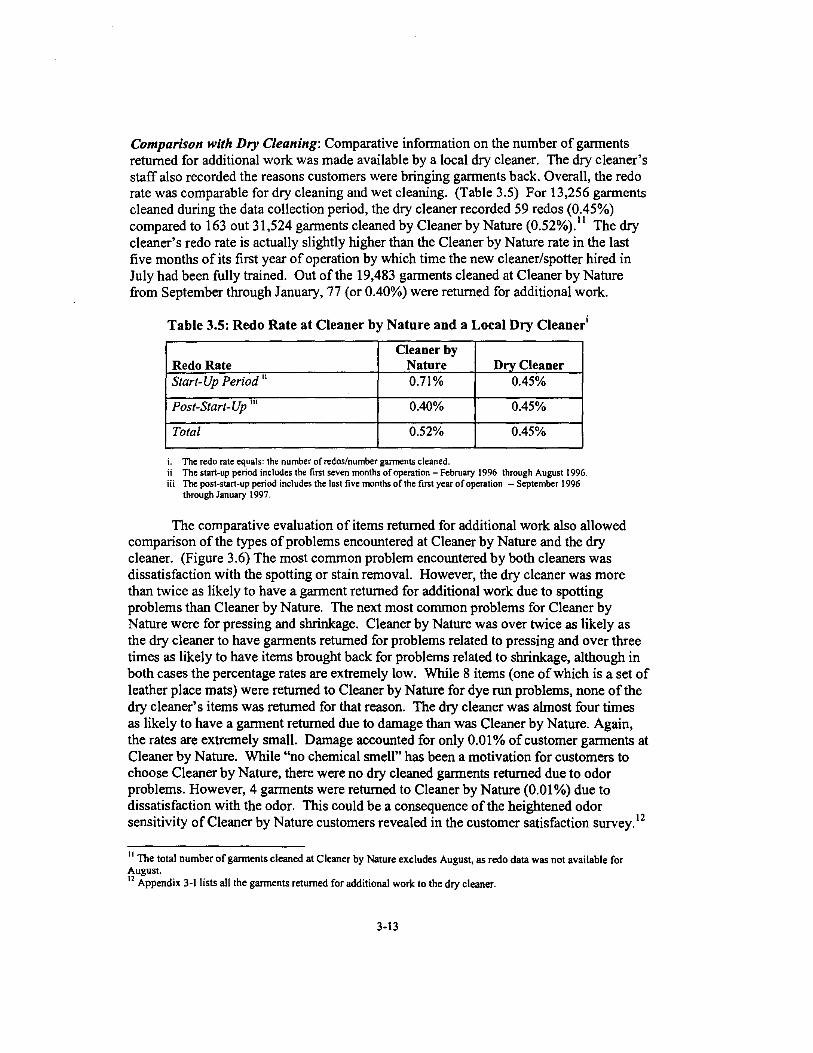
Cleaner 3-10 Table 34 Redo Rate at Cleaner by Nature Over Time 3-11 Table 35 Redo Rate at Cleaner by Nature and a Local Dry Cleaneri 3-13
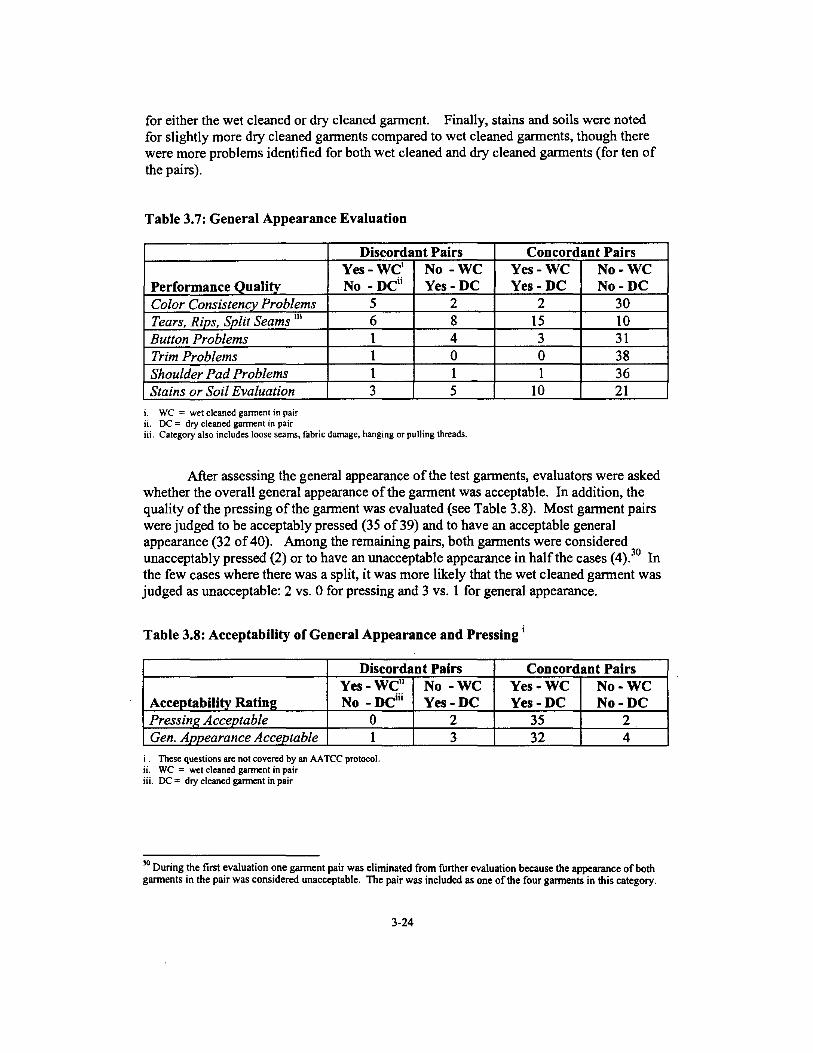
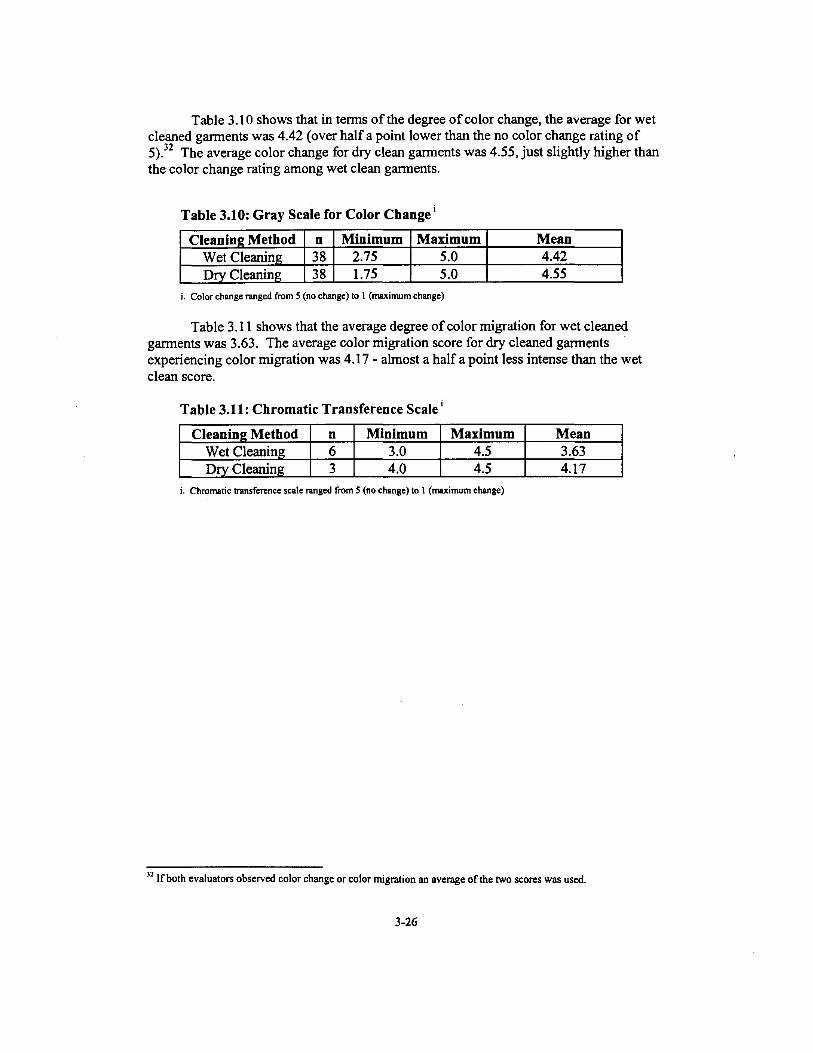
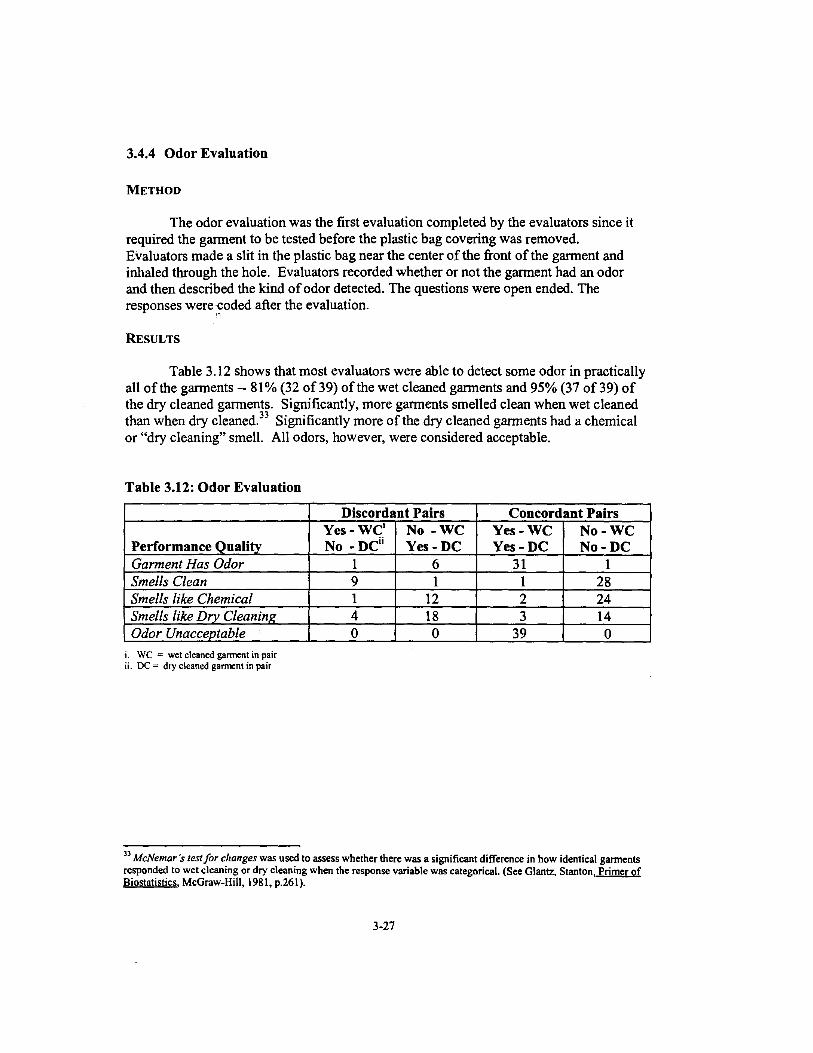
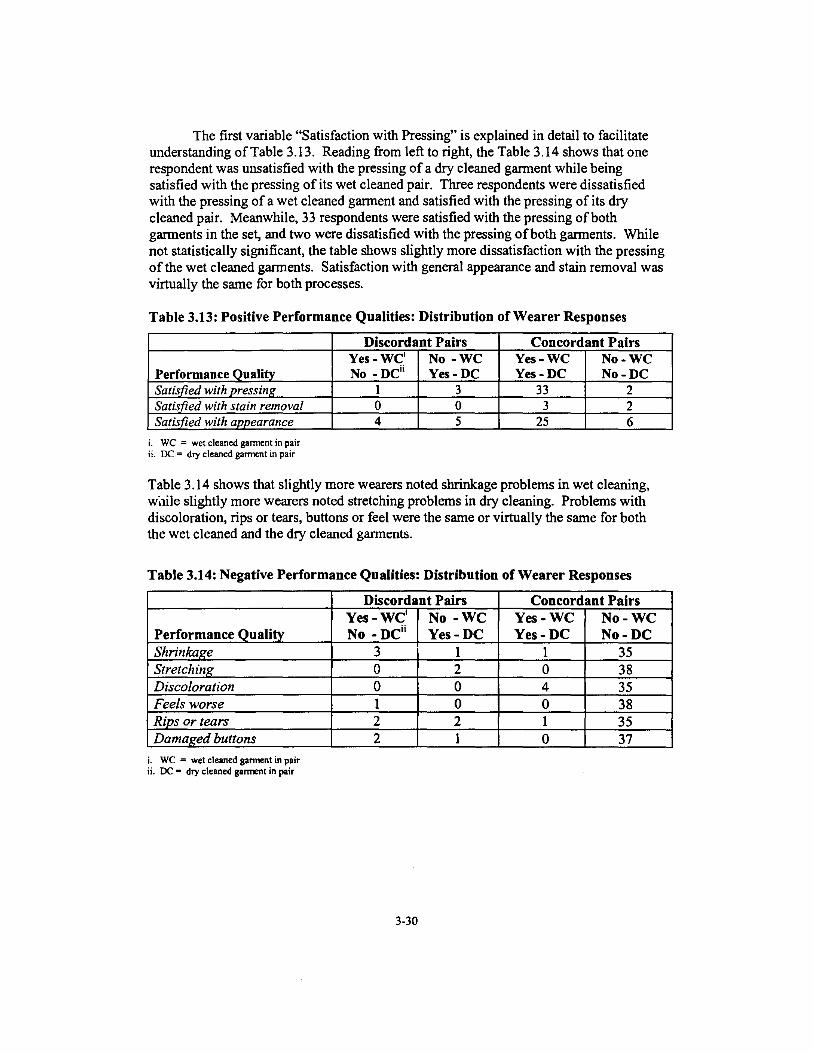
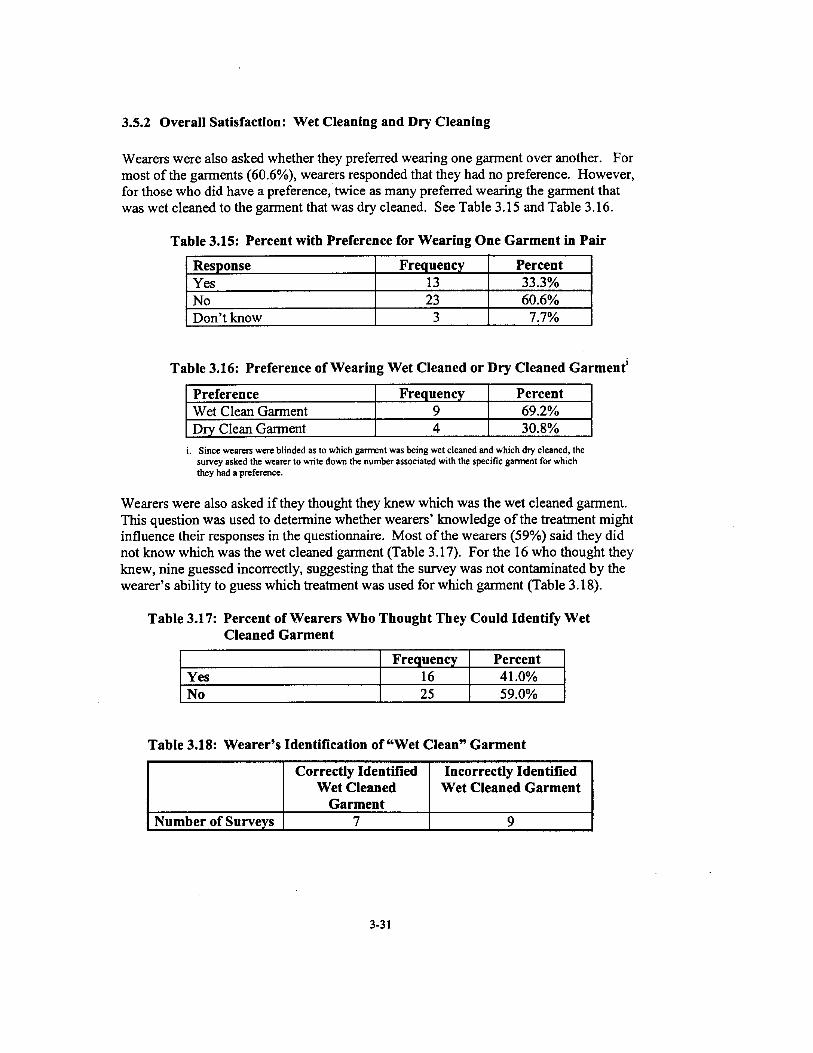
Repeatedly Wet Cleaned and Dry Cleaned 3-22 Table 37 General Appearance Evaluation middot 3-24 Table 38 Acceptability of General Appearance and Pressing 3-24 Table 39 Color Change Evaluation 3-25 Table 310 Gray Scale for Color Change 3-26 Table 3 11 Chromatic Transference Scale 3-26 Table 312 Odor Evaluation 3-27 Table 313 Positive Performance Qualities Distribution of Wearer Responses 3-30 Table 314 Negative Performance Qualities Distribution of Wearer Responses 3-30 Table 315 Percent with Preference for Wearing One Garment in Pair 3-31 Table 316 Preference of Wearing Wet Cleaned or Dry Cleaned Garmenti 3-31
Garment 3-31 Table 318 Wearers Identification ofWet Clean Garment 3-31
Customers 3-35
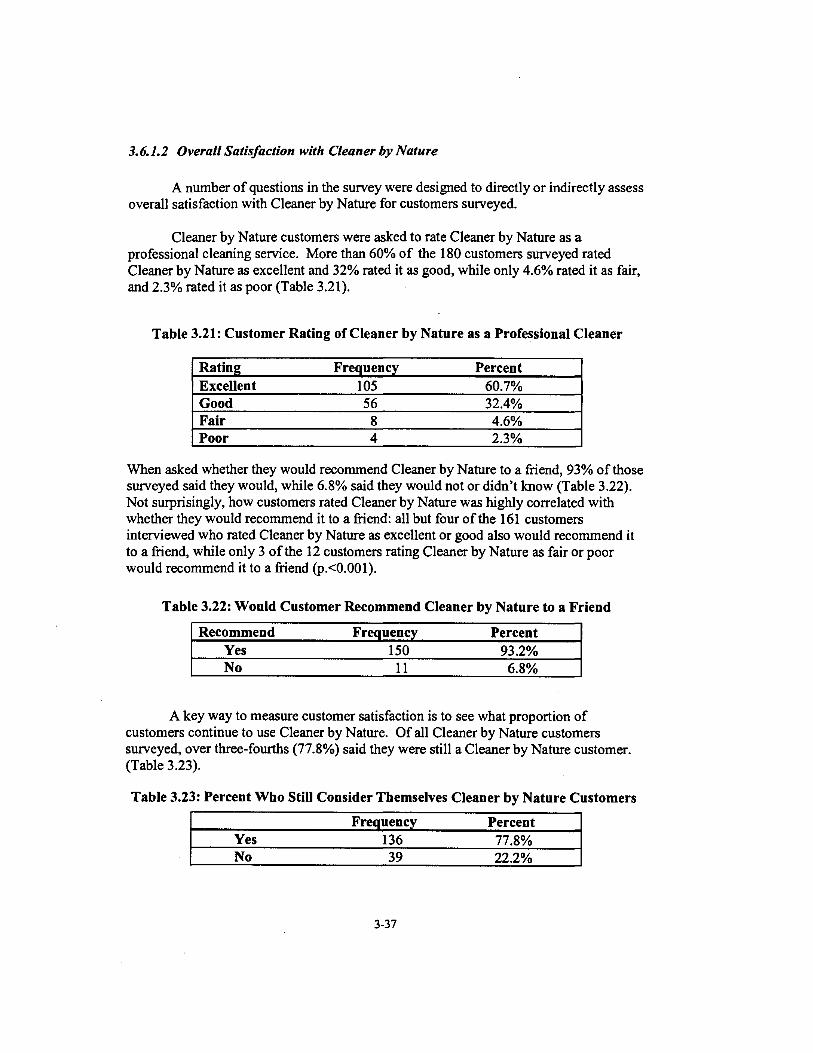
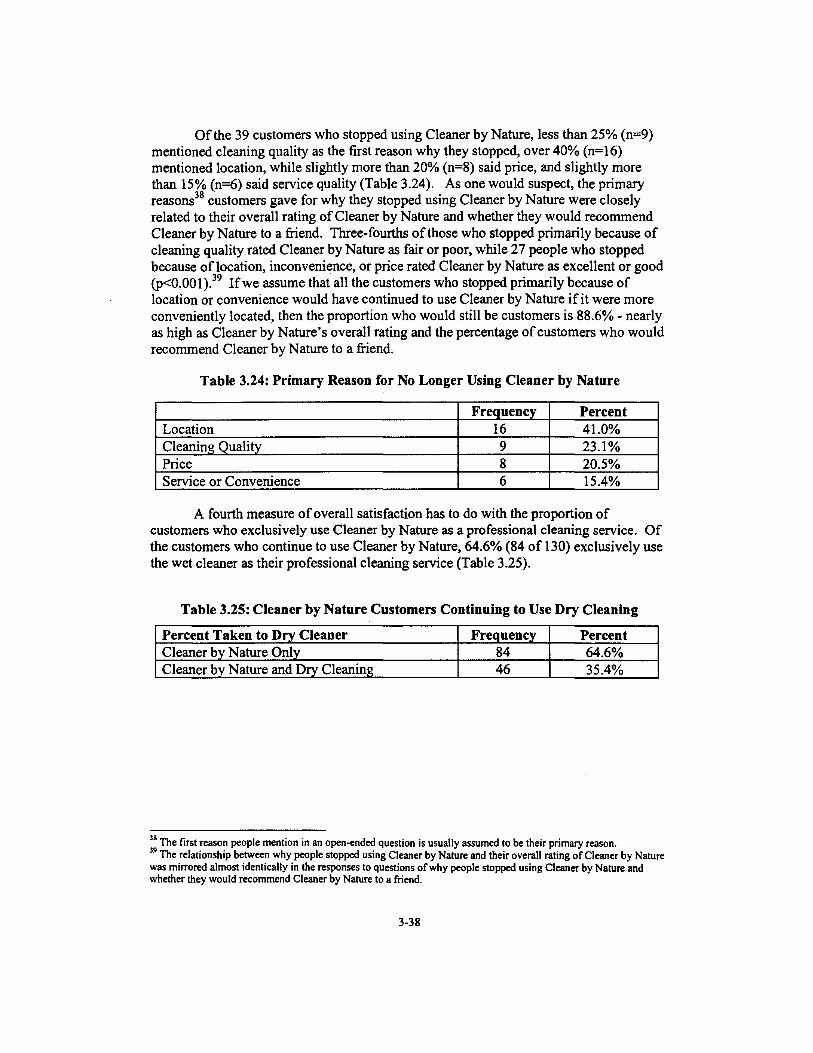
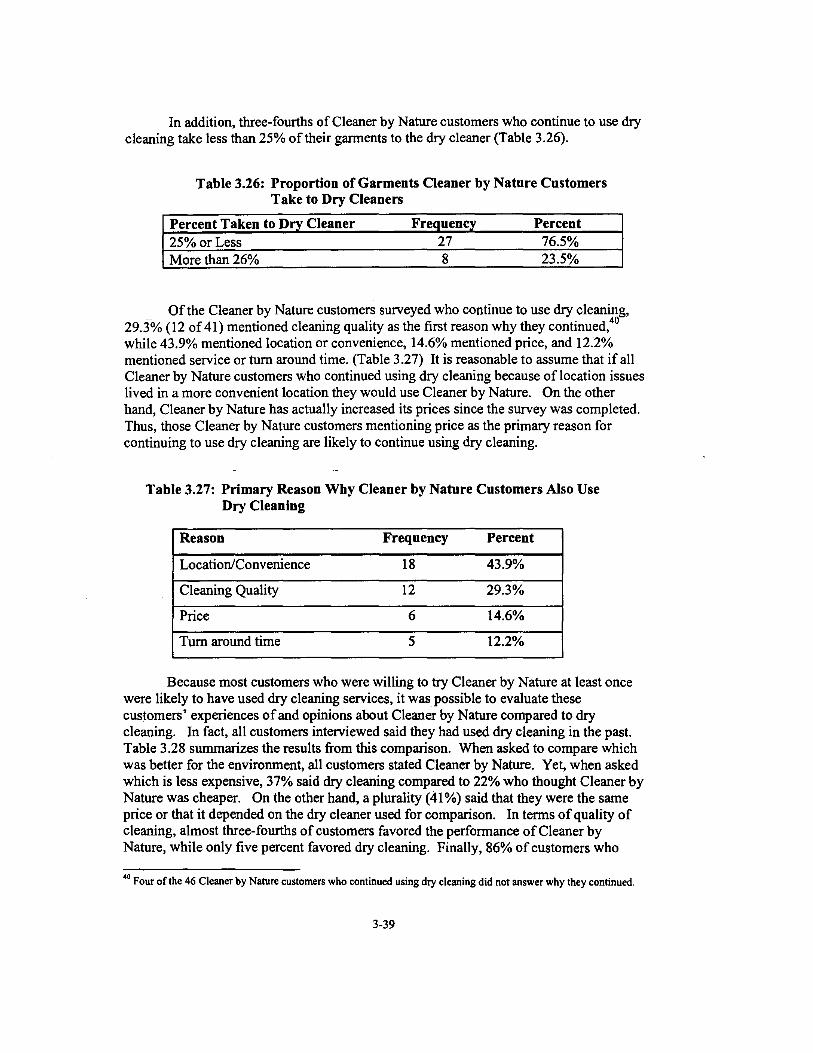
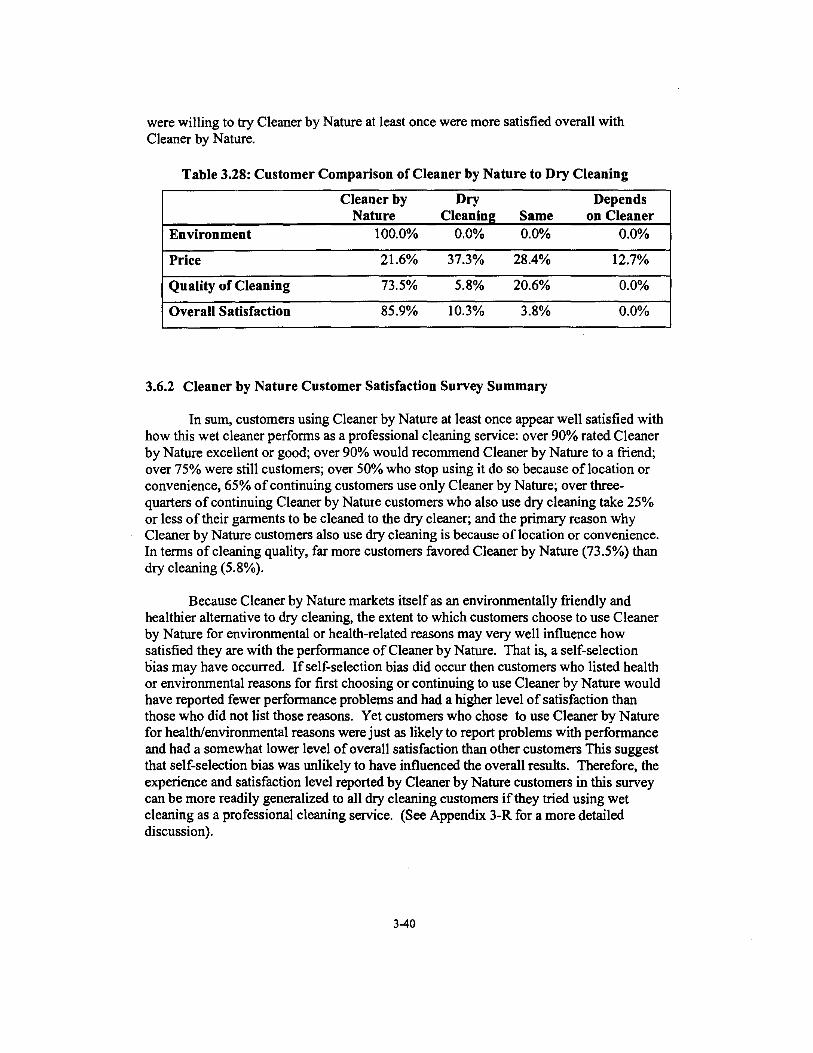
Customers 3-36 Table 321 Customer Rating of Cleaner by Nature as a Professional Cleaner 3-37 Table 322 Would Customer Recommend Cleaner by Nature to a Friend 3-37 Table 323 Percent Who Still Consider Themselves Cleaner by Nature Customers 3-37 Table 324 Primary Reason for No Longer Using Cleaner by Nature 3-38 Table 325 Cleaner by Nature Customers Continuing to Use Dry Cleaning 3-38
Cleaners 3-39
Cleaning 3-39 Table 328 Customer Comparison of Cleaner by Nature to Dry Cleaning 3-40
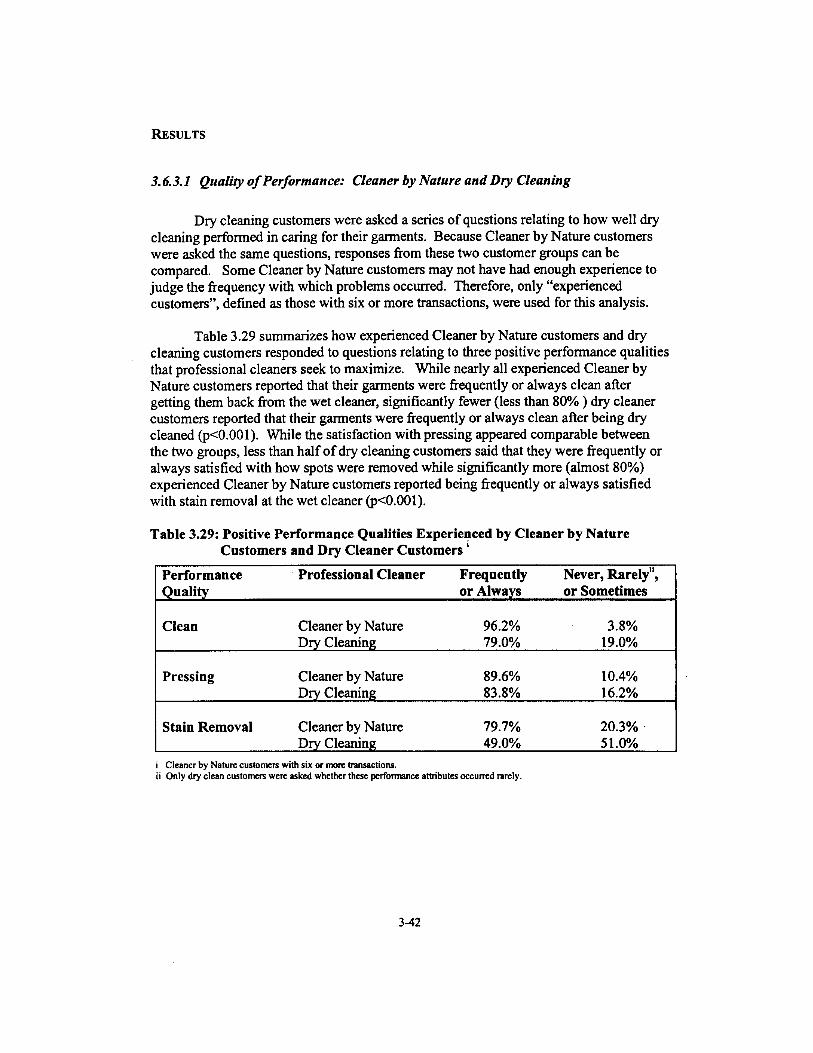
Customers and Dry Cleaner Customers 3-42
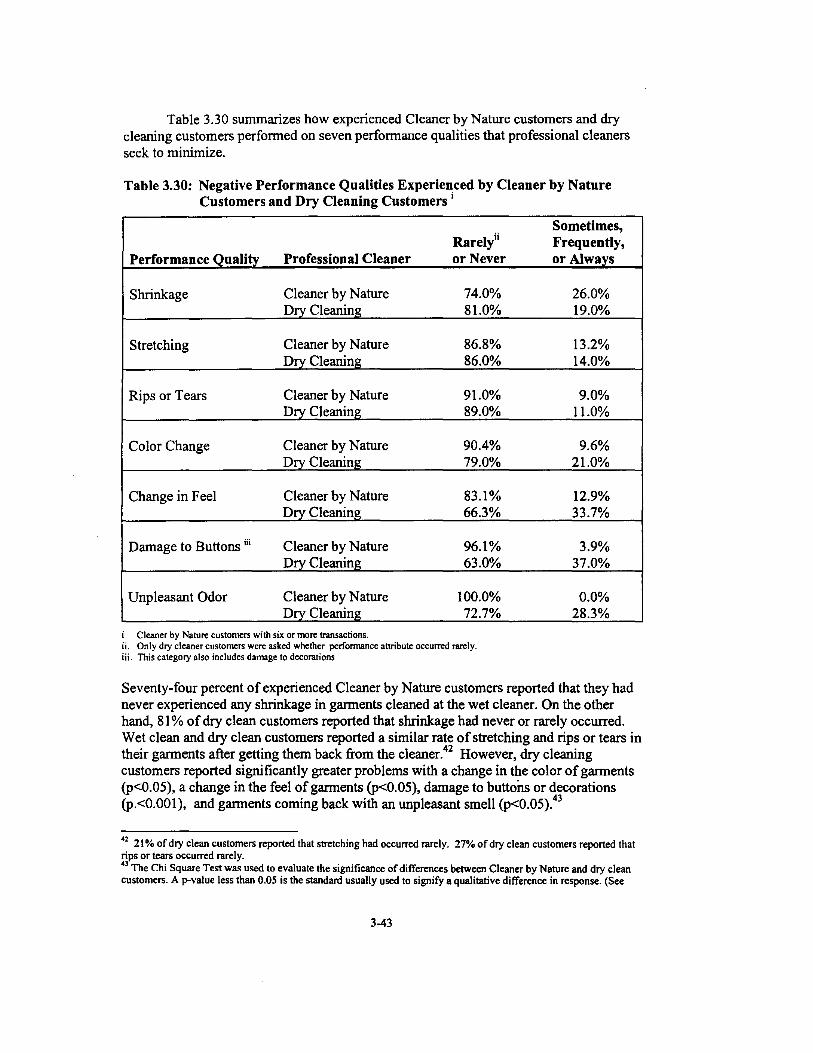
Customers and Dry Cleaning Customers 3-43
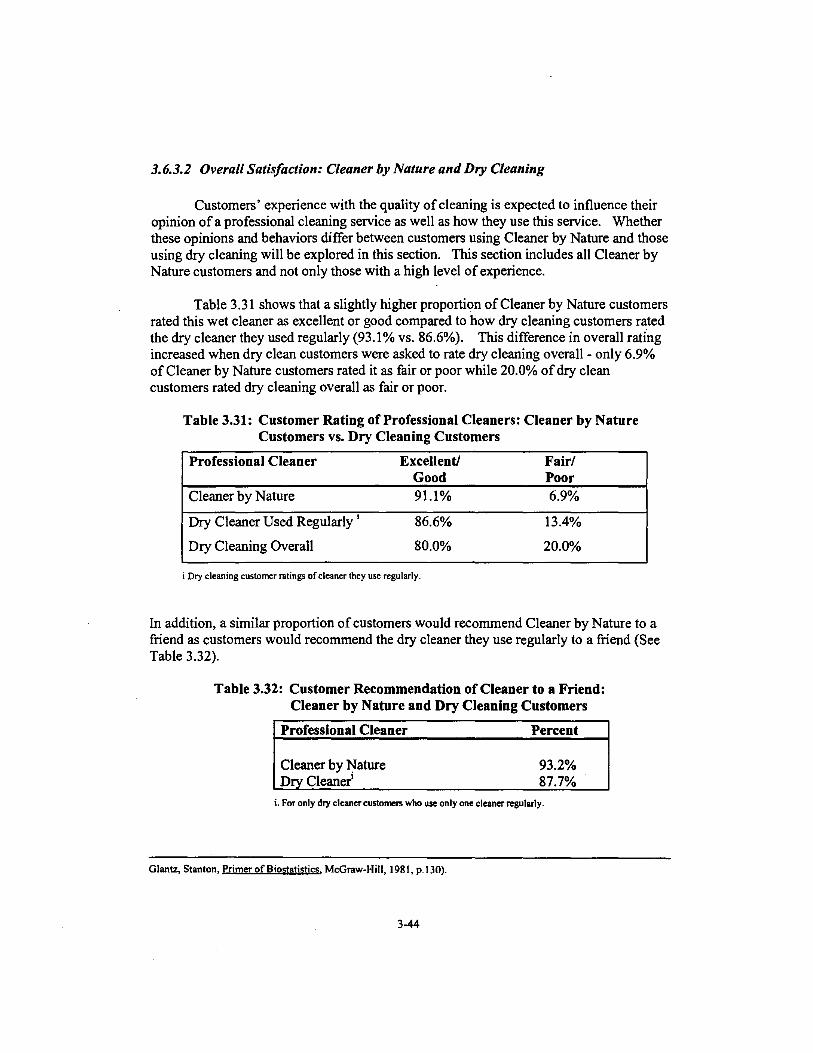
Customers vs Dry Cleaning Customers 3-44
Page Number
Table 332 Customer Recommendation of Cleaner to a Friend Cleaner by 3-44 Nature and Dry Cleaning Customers
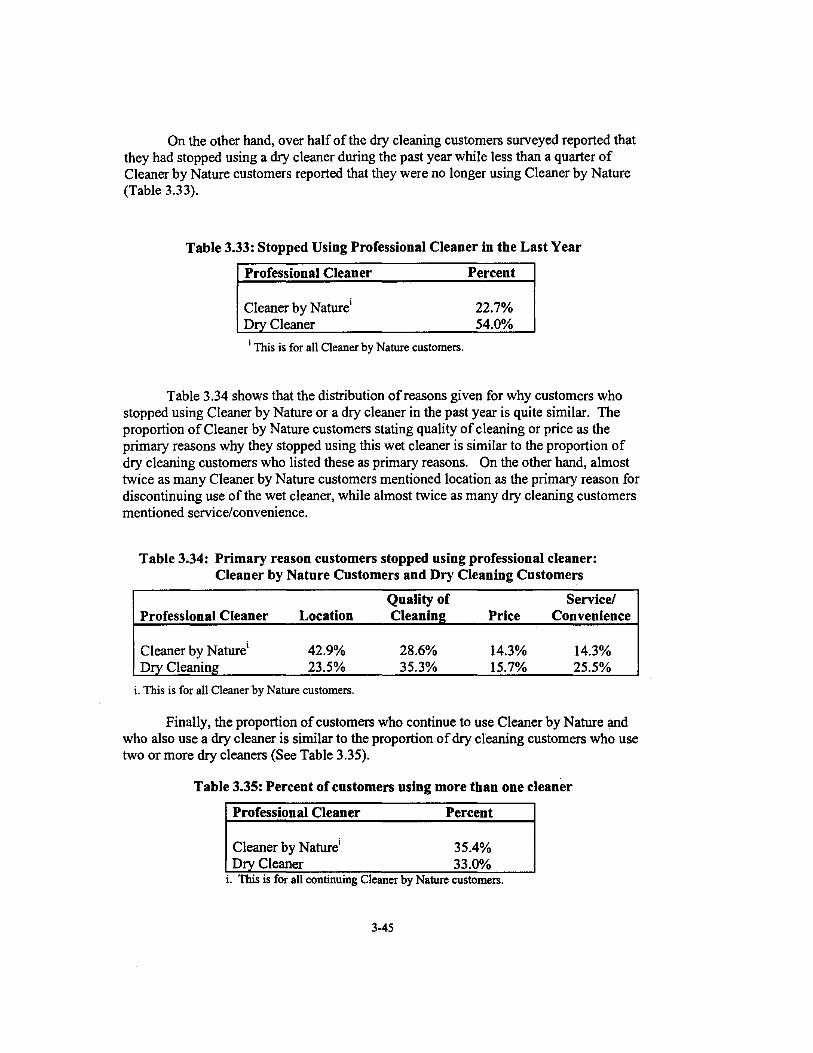
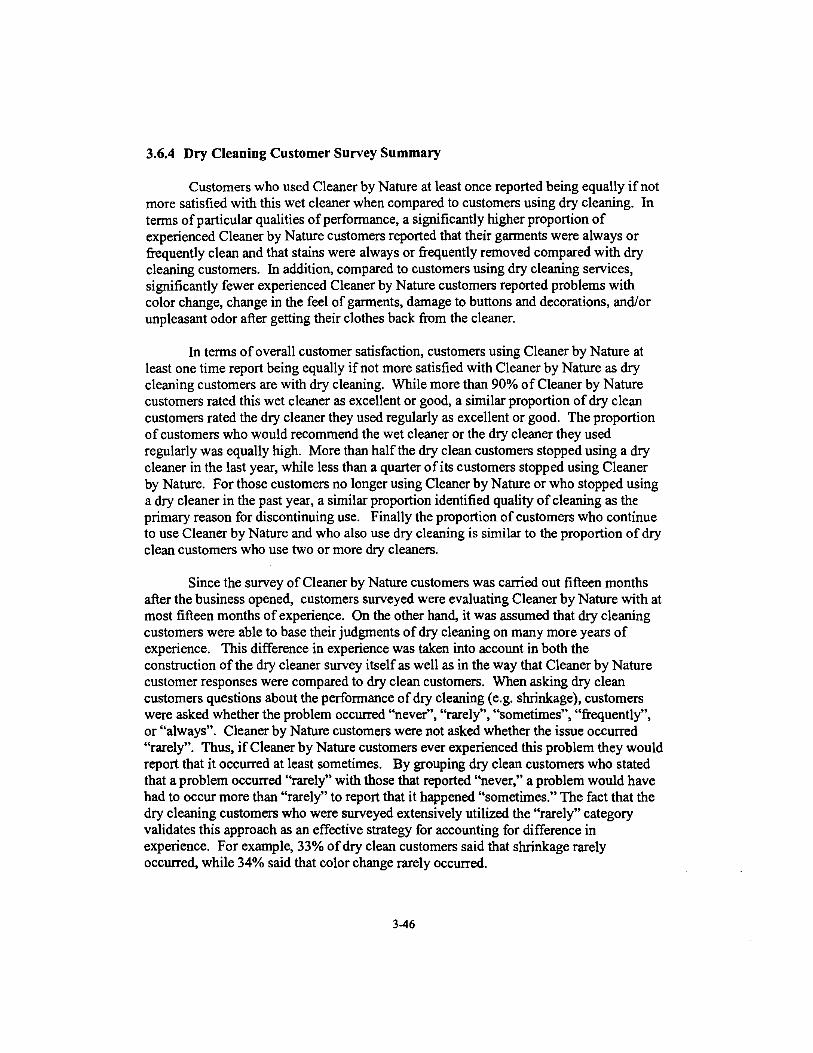
Table 333 Stopped Using Professional Cleaner in the Last Year 3-45 Table 334 Primary reason customers stopped using professional cleaner 3-45
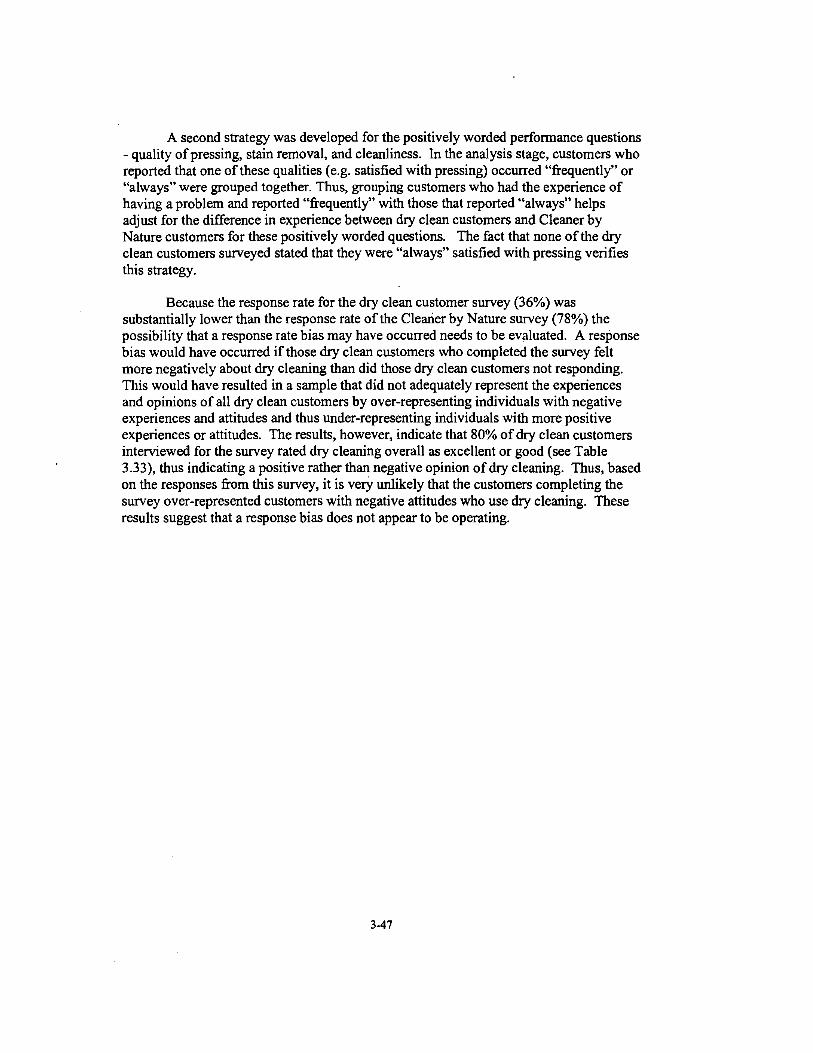
Cleaner by Nature Customers and Dry Cleaning Customers Table 335 Percent ofcustomers using more than one cleaner 3-45
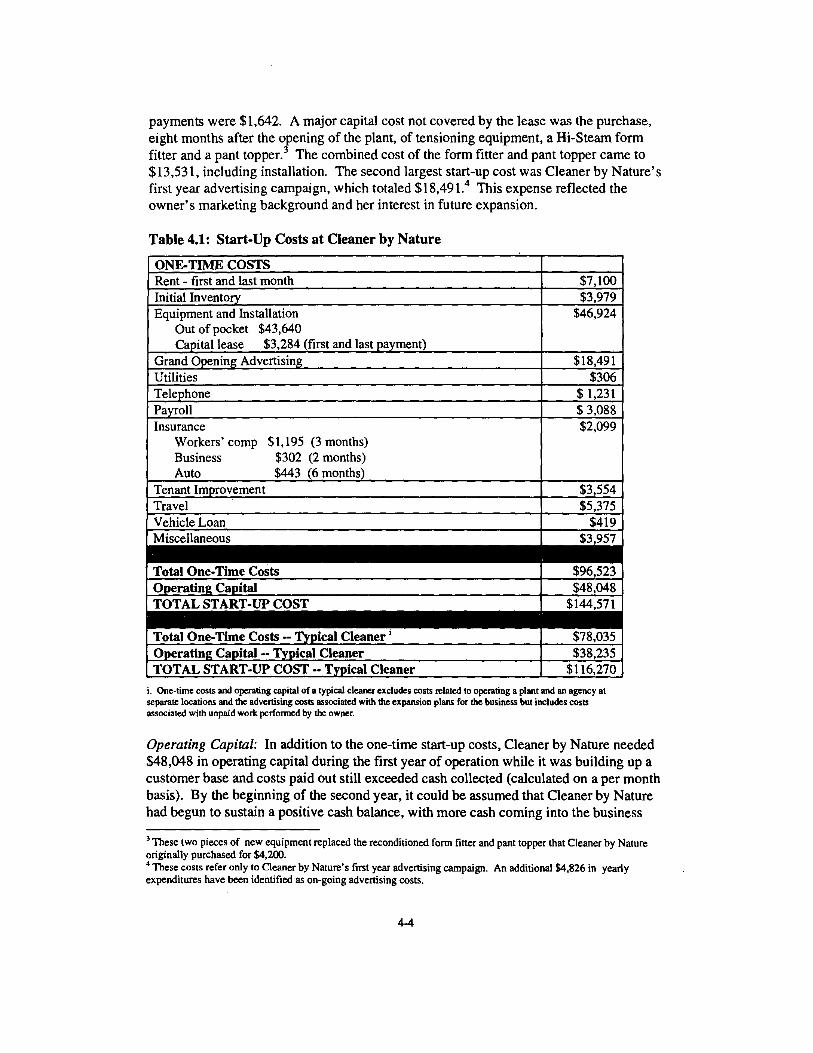
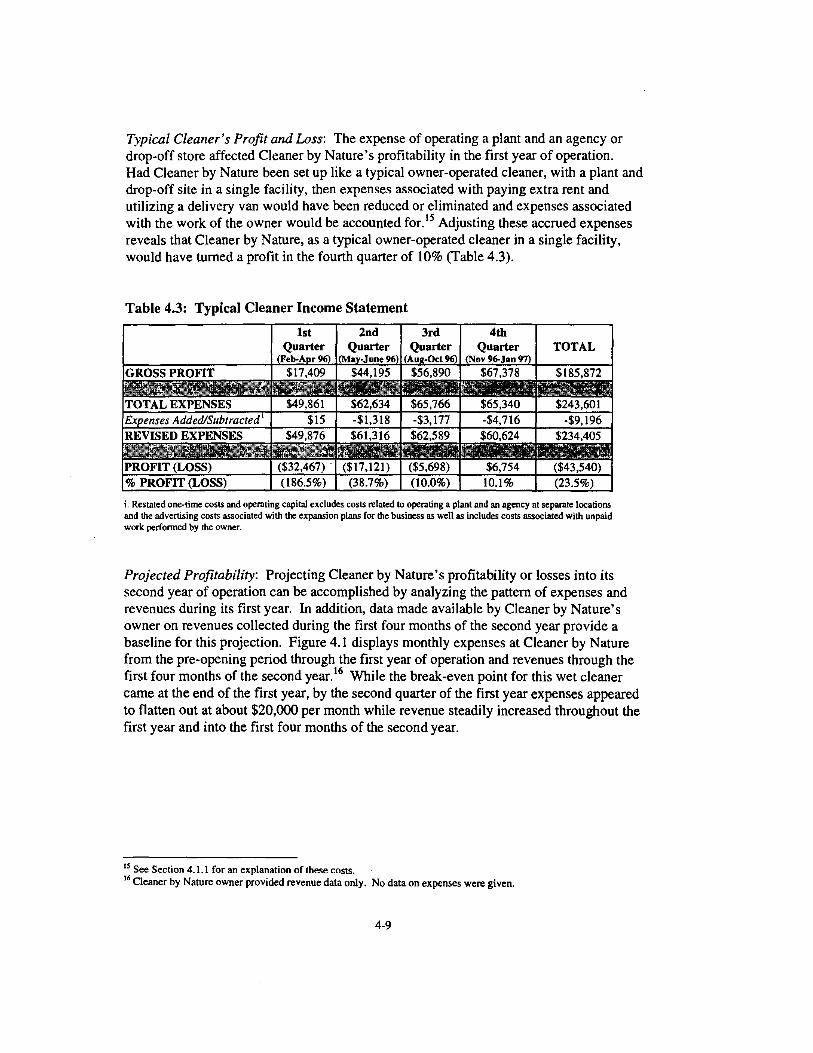
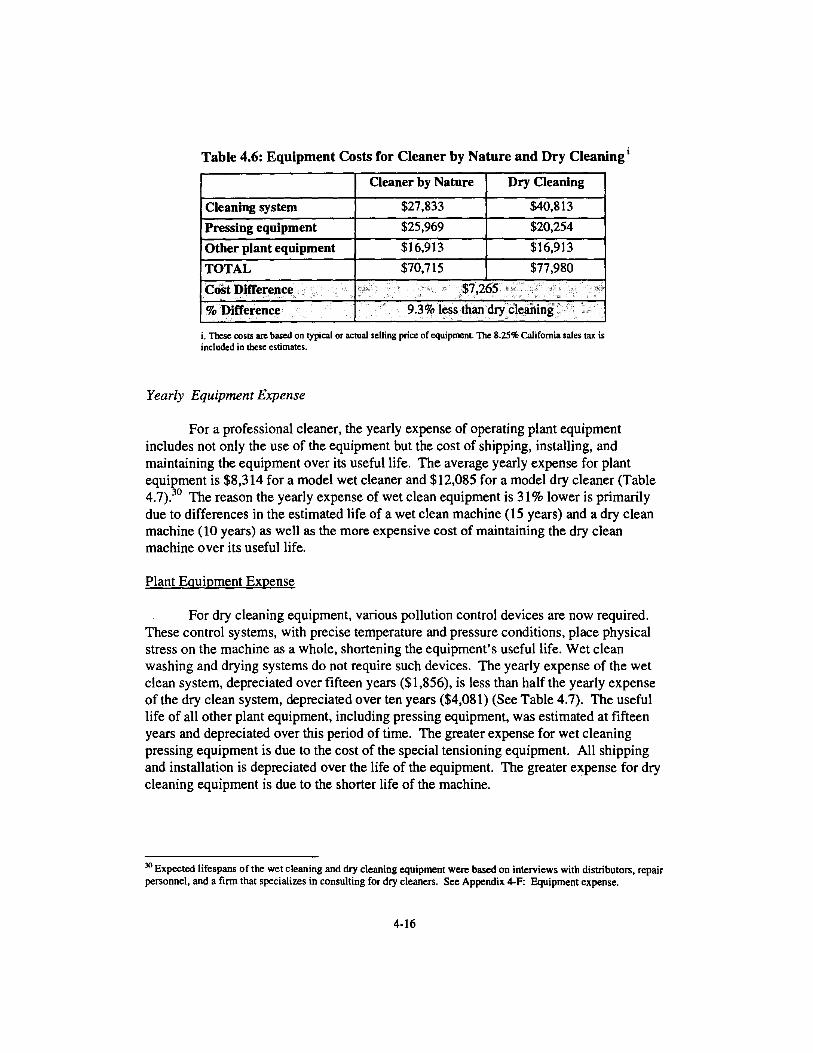
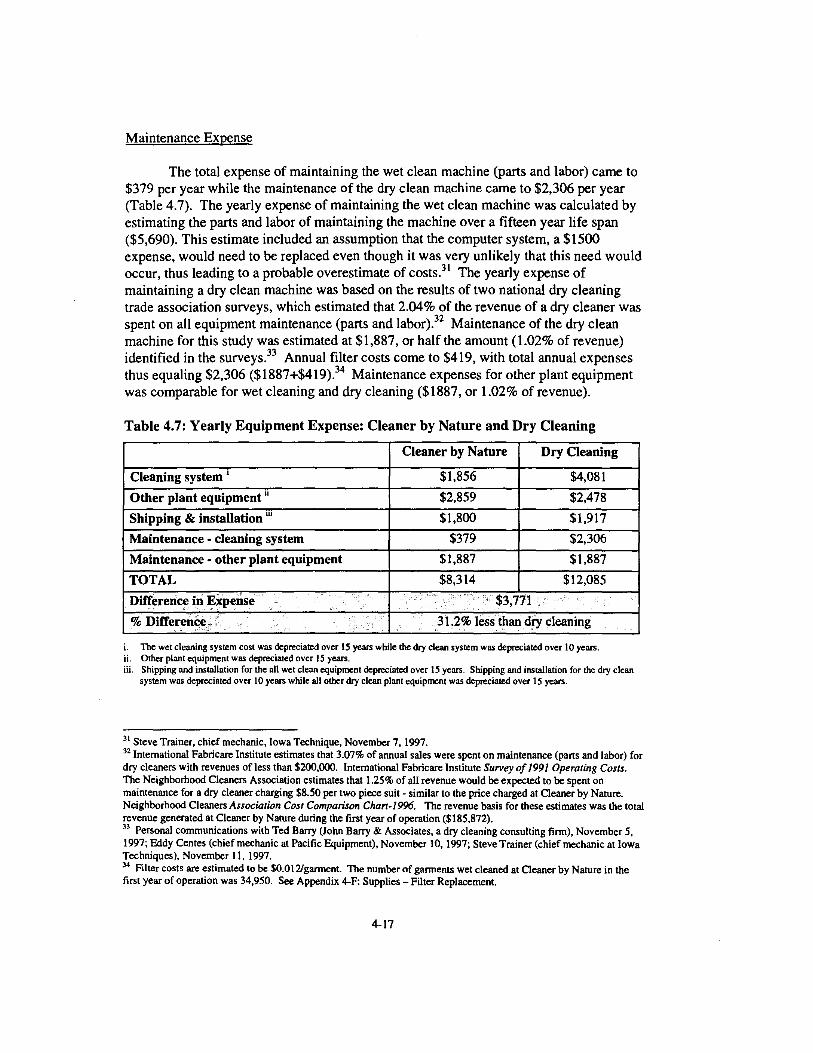
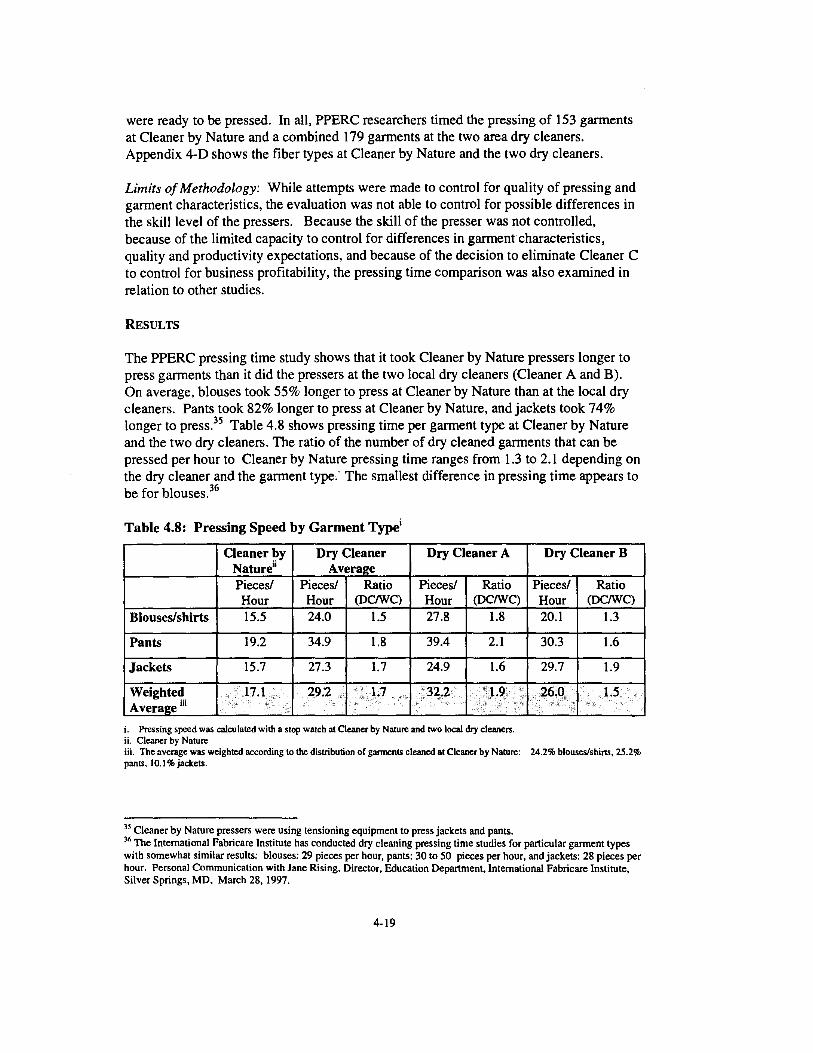
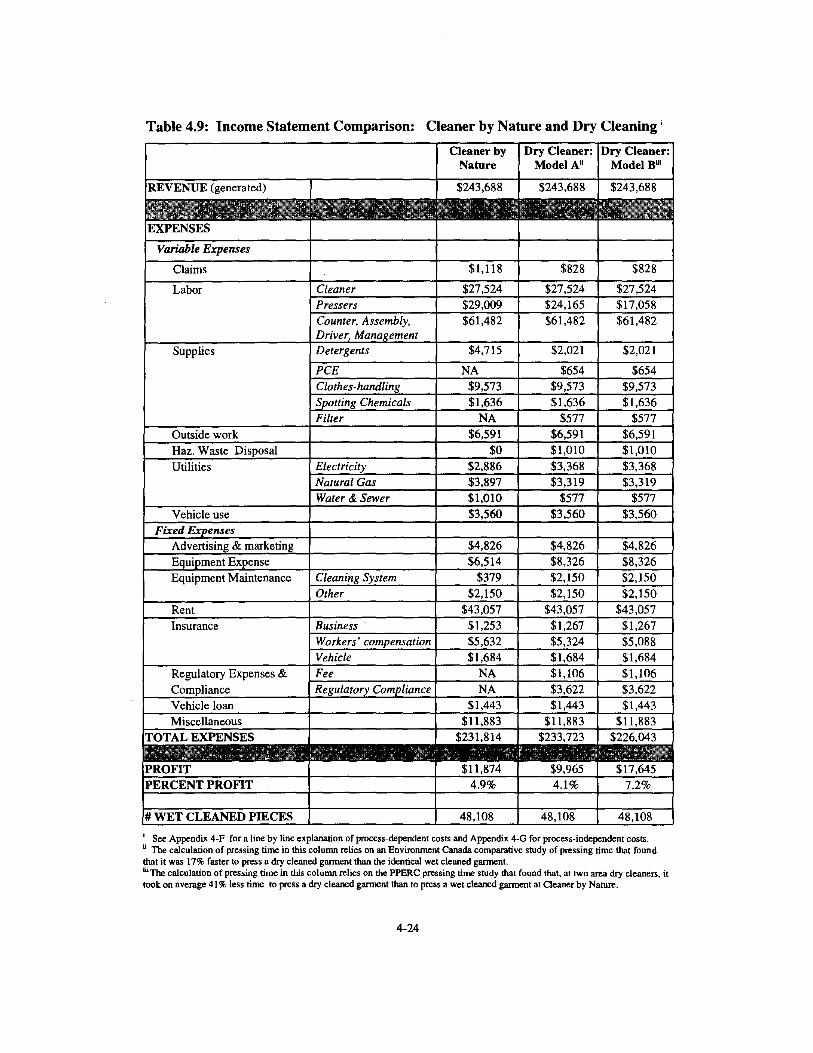
Table 41 Start-Up Costs at Cleaner by Nature 4-4 Table 42 Income Statement for Cleaner by Nature 4-8 Table 43 Typical Cleaner Income Statement 4-9 Table 44 Projected Income Statement for Cleaner by Nature for 4-11 Table 45 Pressing Speed Over Time in Cleaner by Natures First Year 4-12 Table 46 Equipment Costs for Cleaner by Nature and Dry Cleaning 4-16 Table 47 Yearly Equipment Expense Cleaner by Nature and Dry Cleaning 4-17 Table 48 Pressing Speed by Garment Type 4-19 Table 49 Income Statement Comparison Cleaner by Nature and Dry Cleaning 4-24
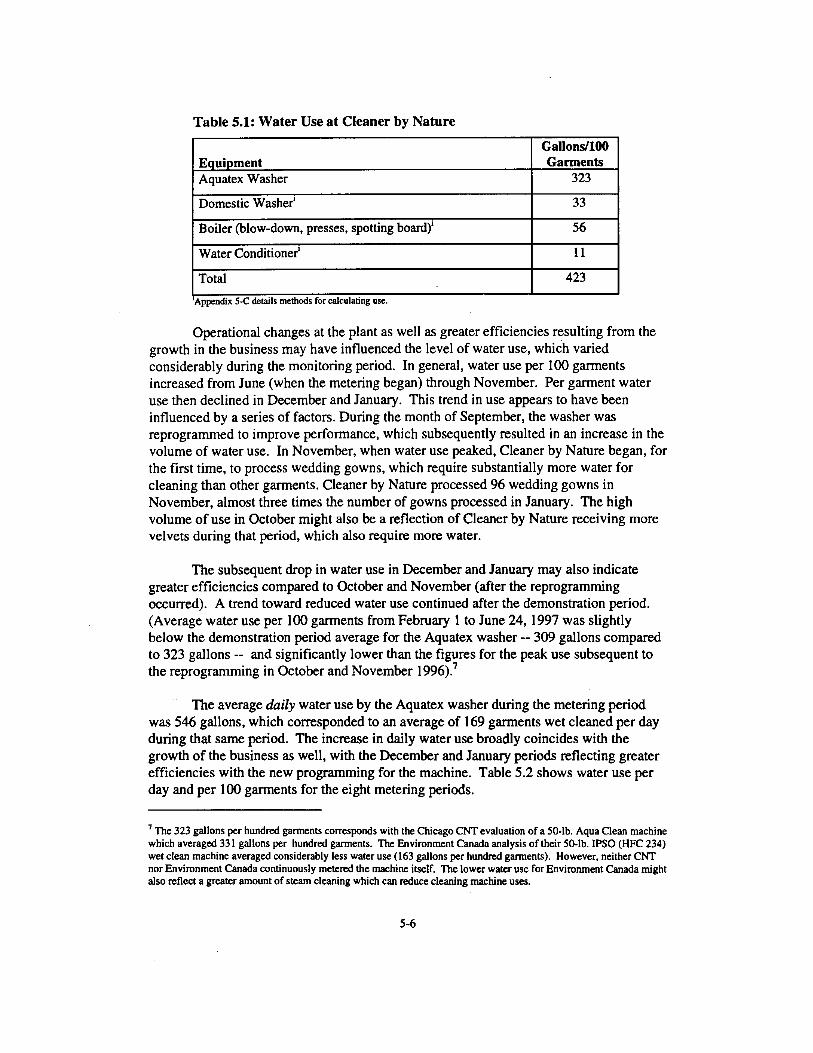
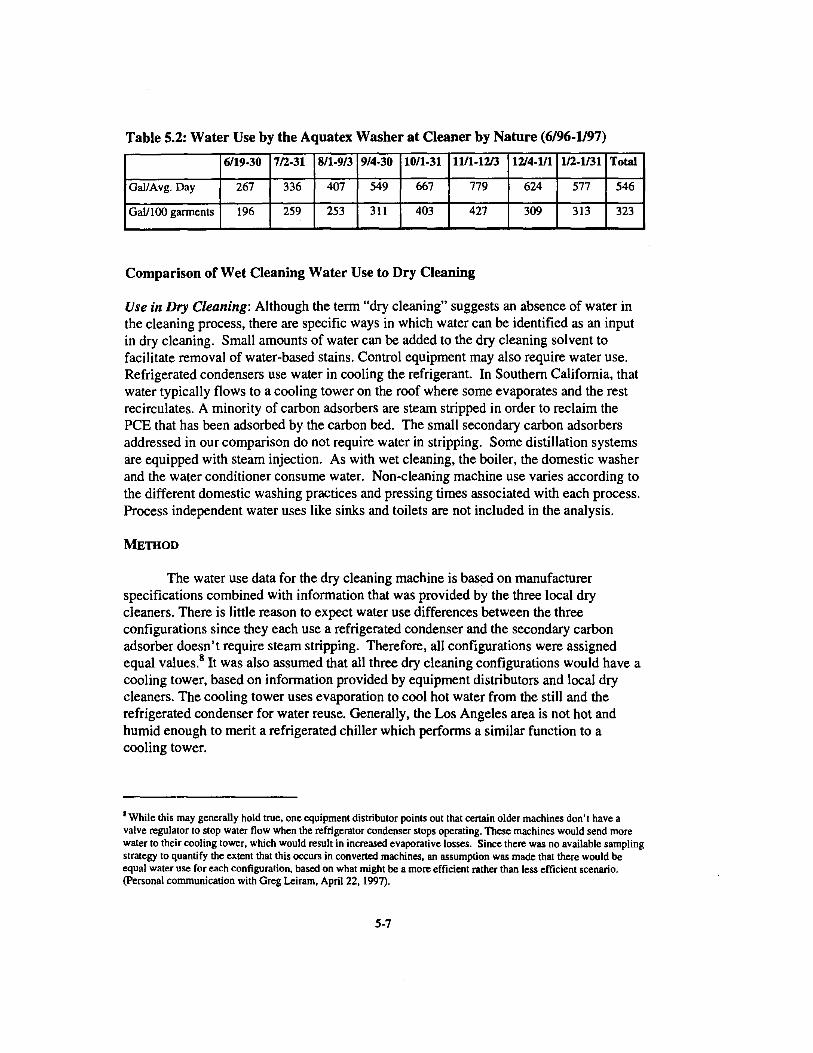
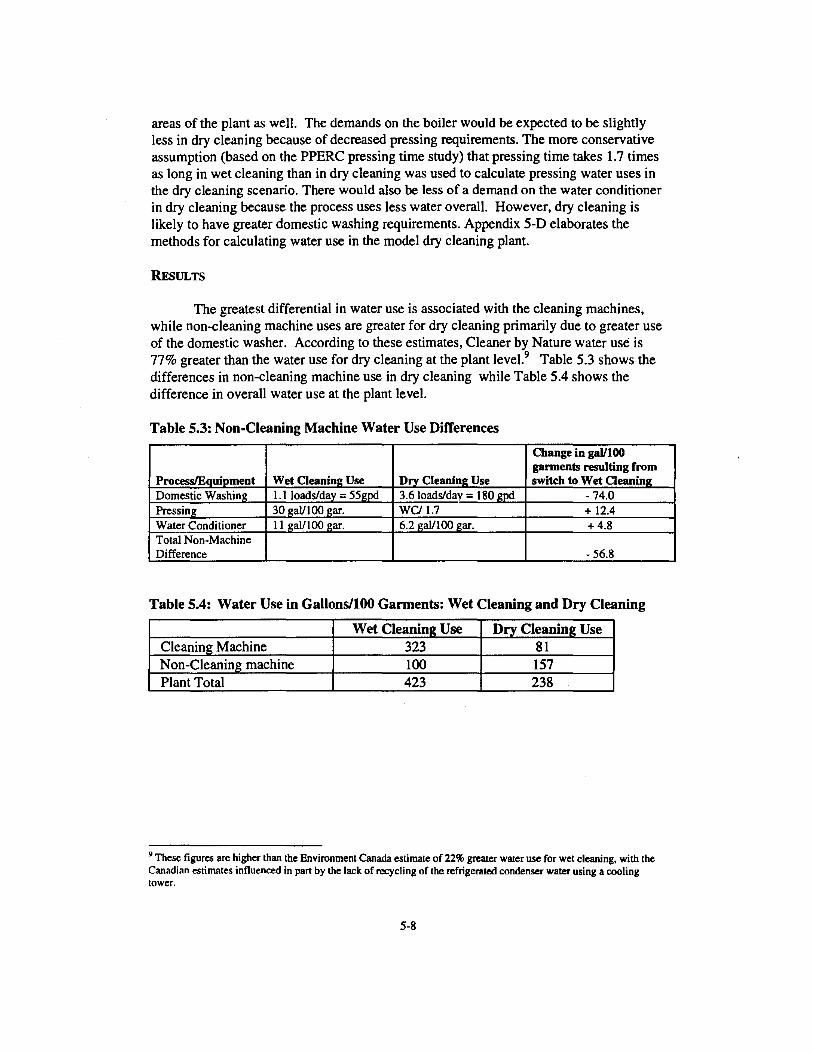
Table 51 Water Use at Cleaner by Nature 5-6 Table 52 Water Use by the Aquatex Washer at Cleaner by Nature (696-197) 5-7 Table 53 Non-Cleaning Machine Water Use Differences 5-8 Table 54 Water Use in Gallons100 Garments Wet Cleaning and Dry Cleaning 5-8 Table 55 Regional Water Uses (in Million Gallons) Comparing Wet Cleaning to 5-9 Table 56 Waste Water Analysis 5-14 Table 57 Month-Level Natural Gas Use at Cleaner by Nature (1996-1997) 5-16 Table 58 Month-Level Electricity Use at Cleaner by Nature 5-16 Table 59 Electricity Use per 100 Garments Dry Cleaning vs Wet Cleaning 5-18 Table 510 Natural Gas Use per 100 Garments Dry Cleaning vs Wet Cleaning 5-18 Table 511 Non-Cleaning Machine Energy Use Wet Cleaning and Dry Cleaning 5-18 Table 512 Regional Electricity Differences (in Million kWh) Posed by Shift
From Dry Cleaning to Wet Cleaning 5-19 Table 513 Regional Natural Gas Use (in Million Therms) Posed by Shift From 5-20 Table 514 Regional Emissions Impact from Energy Generation Posed by 100 5-21
Shift to Wet Cleaning Table 515 PCE Use in Gallons per 100 Garments Plant Level Analysis 5-25 Table 516 Pere Emissions in lbs per 100 Garments Wet Cleaning and Dry
Cleaning 5-26 Table 517 Hazardous Waste Generated in pounds per 100 Garments 5-27 Table 518 Estimated 1998 Regional PCE Emissions in Tons per Day 5-29 Table 519 Estimated Regional Hazardous Wastes from Dry Cleaning 5-30
List of Fi2ures Page
Number
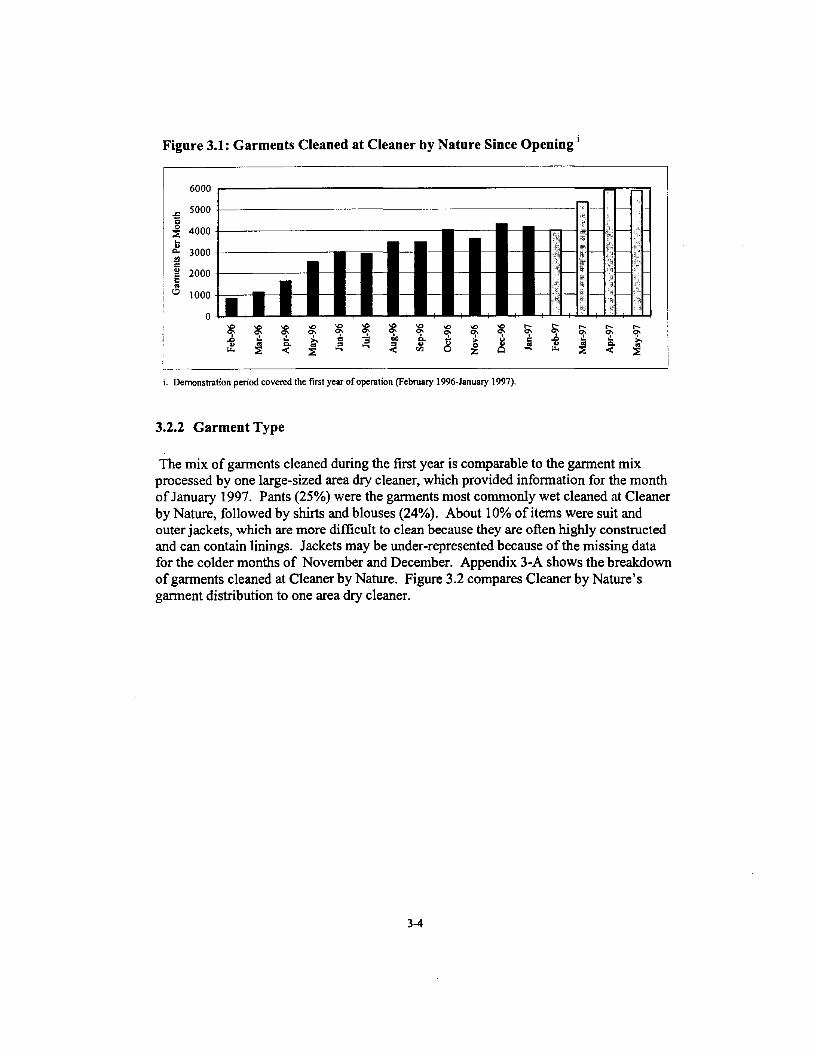
Figure 31 Garments Cleaned at Cleaner by Nature Since Opening 3-4
Dry Cleaner
Operation (February 1996 - January 1997)
Cleaner by Nature During the First Year ofOperation
Nature and an Area Dry Cleaner
Cleaned Garments
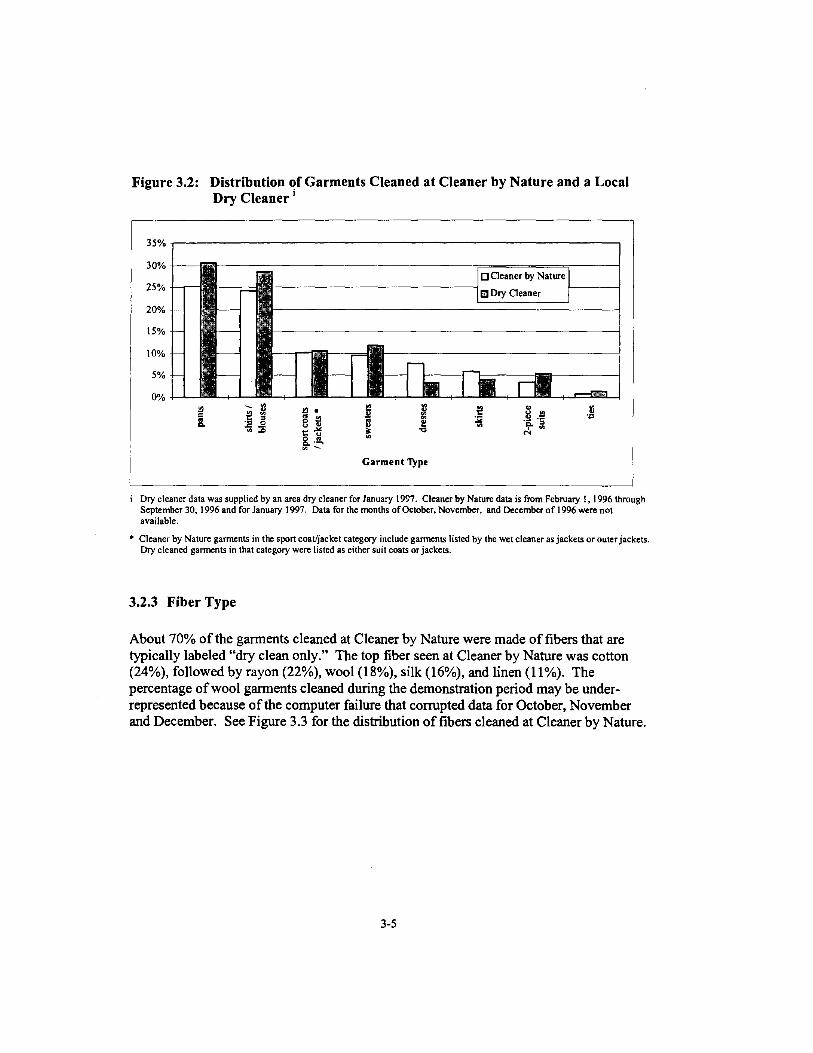
Figure 32 Distribution of Garments Cleaned at Cleaner by Nature and a Local 3-5
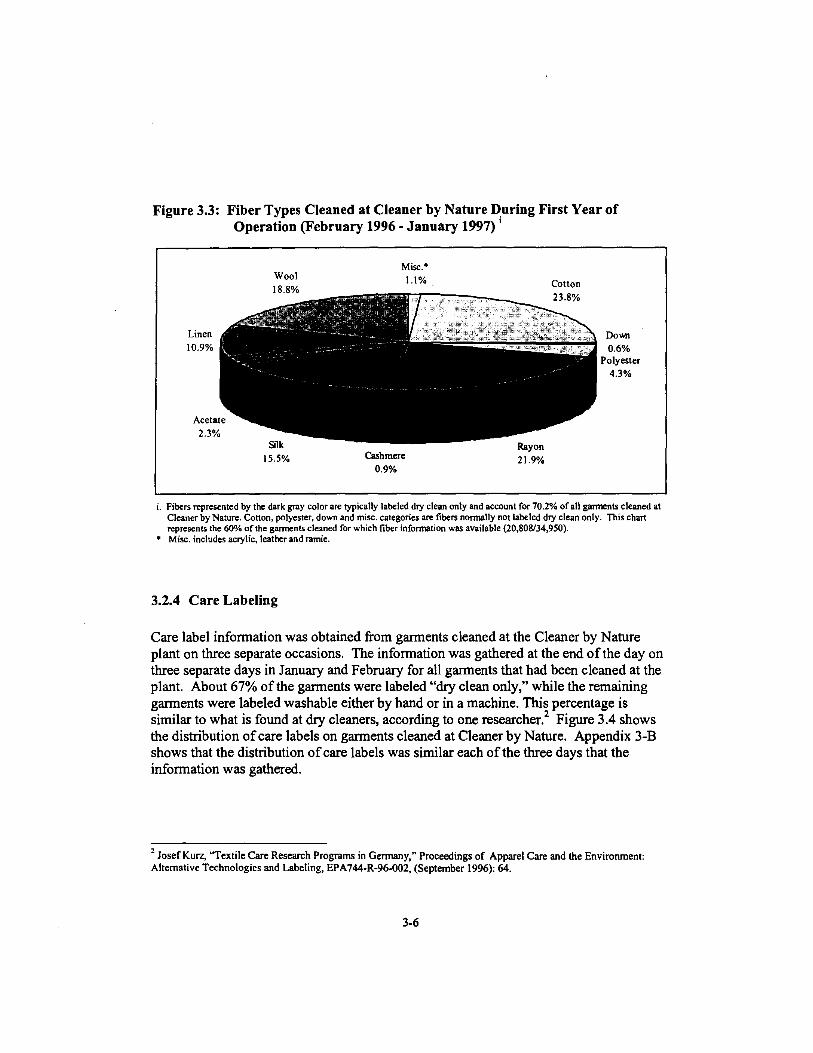
Figure 33 Fiber Types Cleaned at Cleaner by Nature During First Year of 3-6
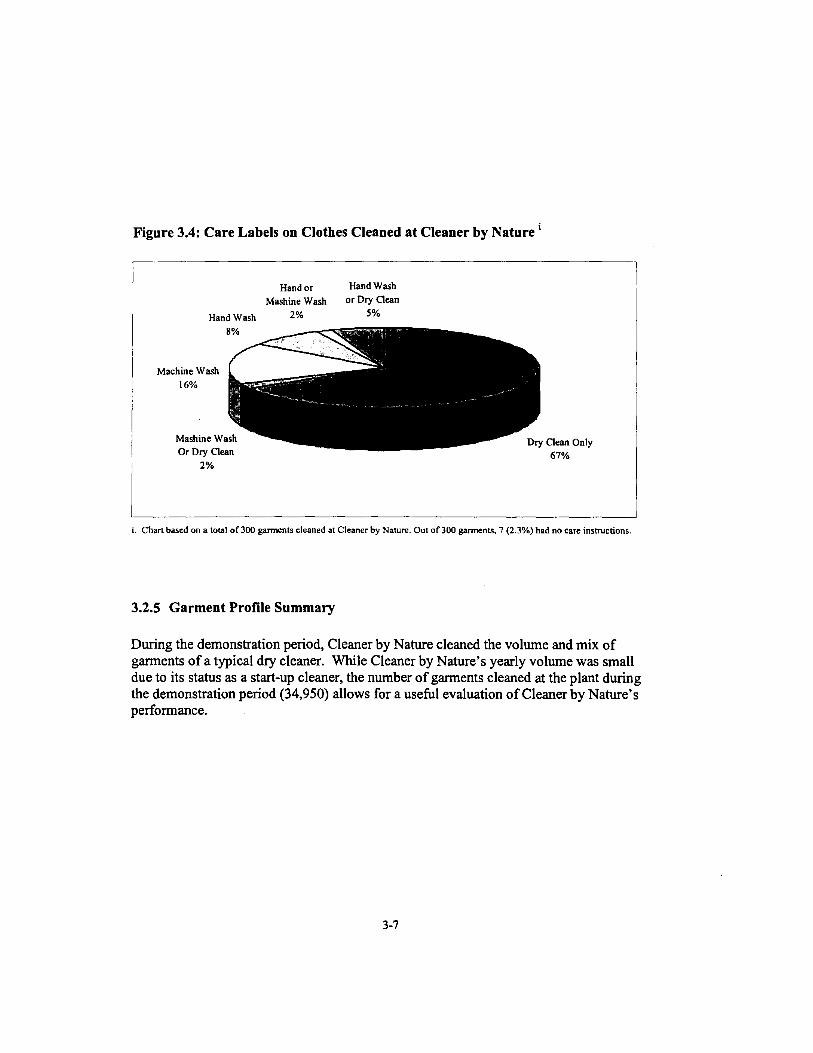
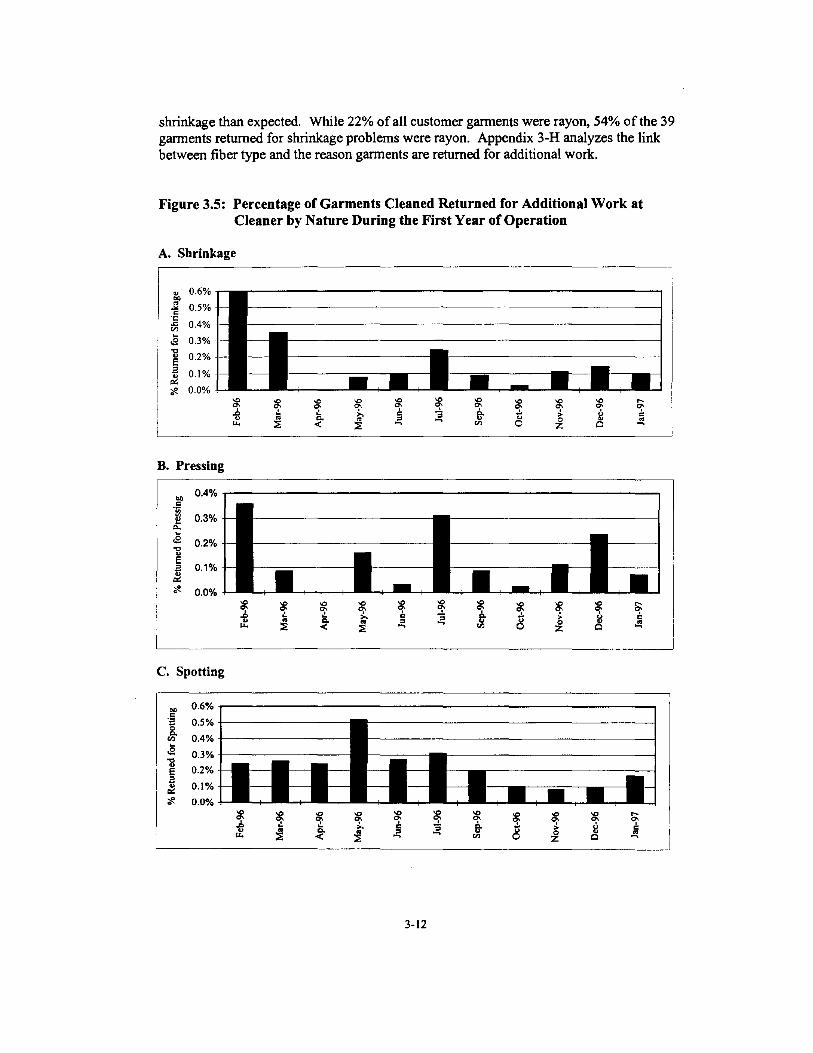
Figure 34 Care Labels on Clothes Cleaned at Cleaner by Nature 3-7 Figure 35 Percentage ofGarments Cleaned Returned for Additional Work at 3-12
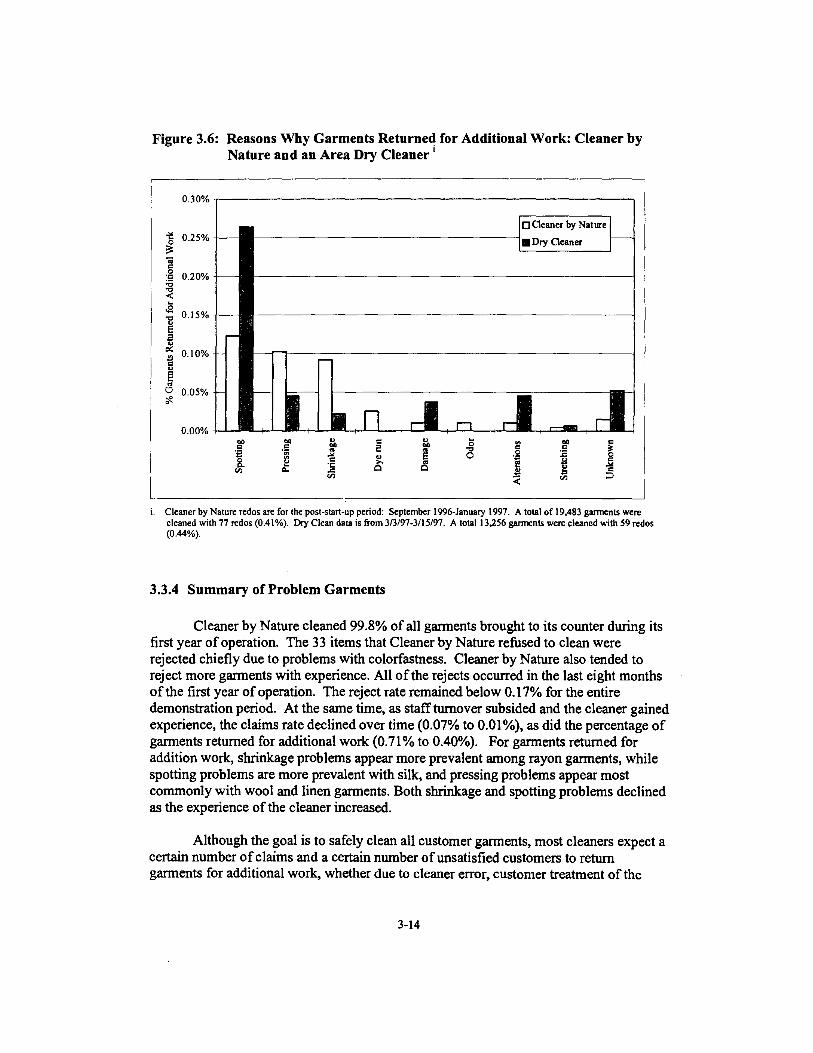
Figure 36 Reasons Why Garments Returned for Additional Work Cleaner by 3-14
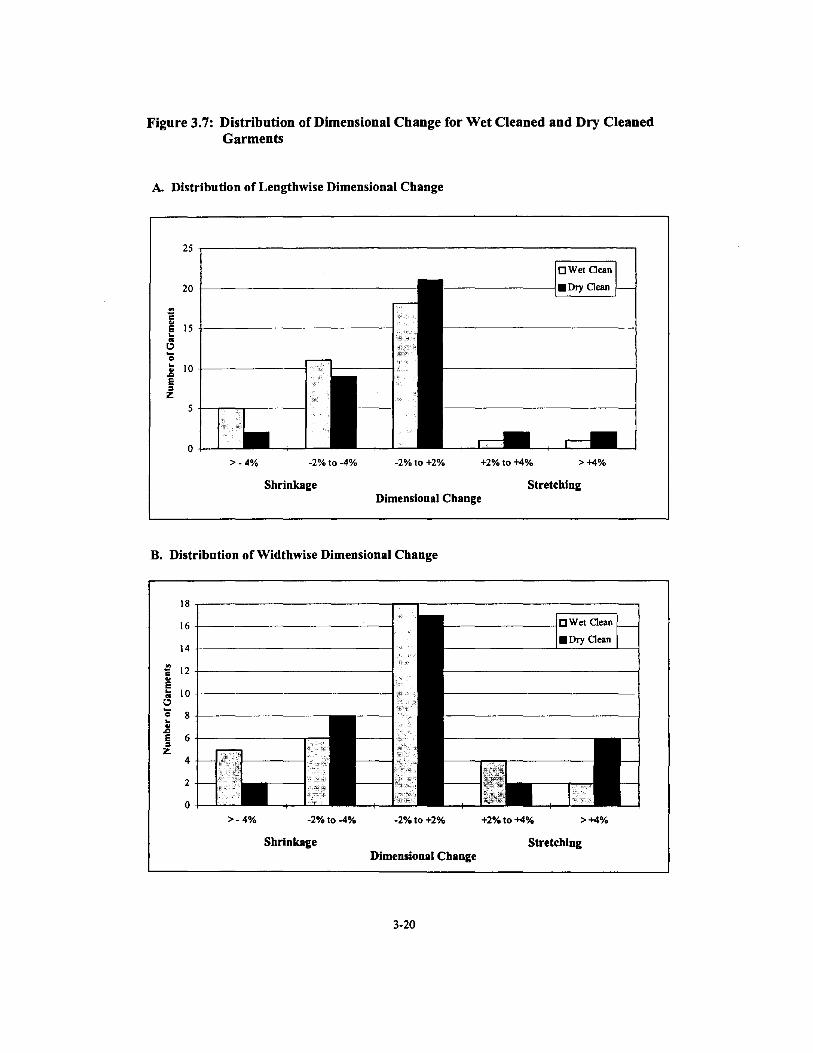
Figure 3 7 Distribution of Dimensional Change for Wet Cleaned and Dry 3-20
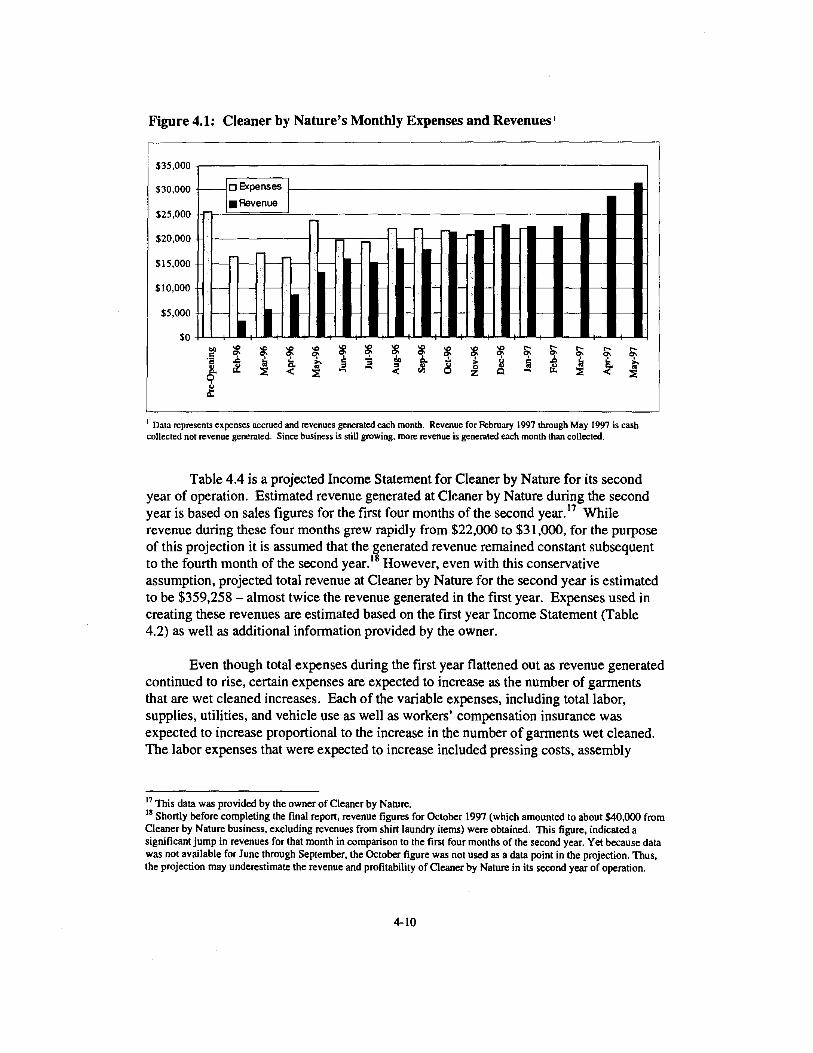
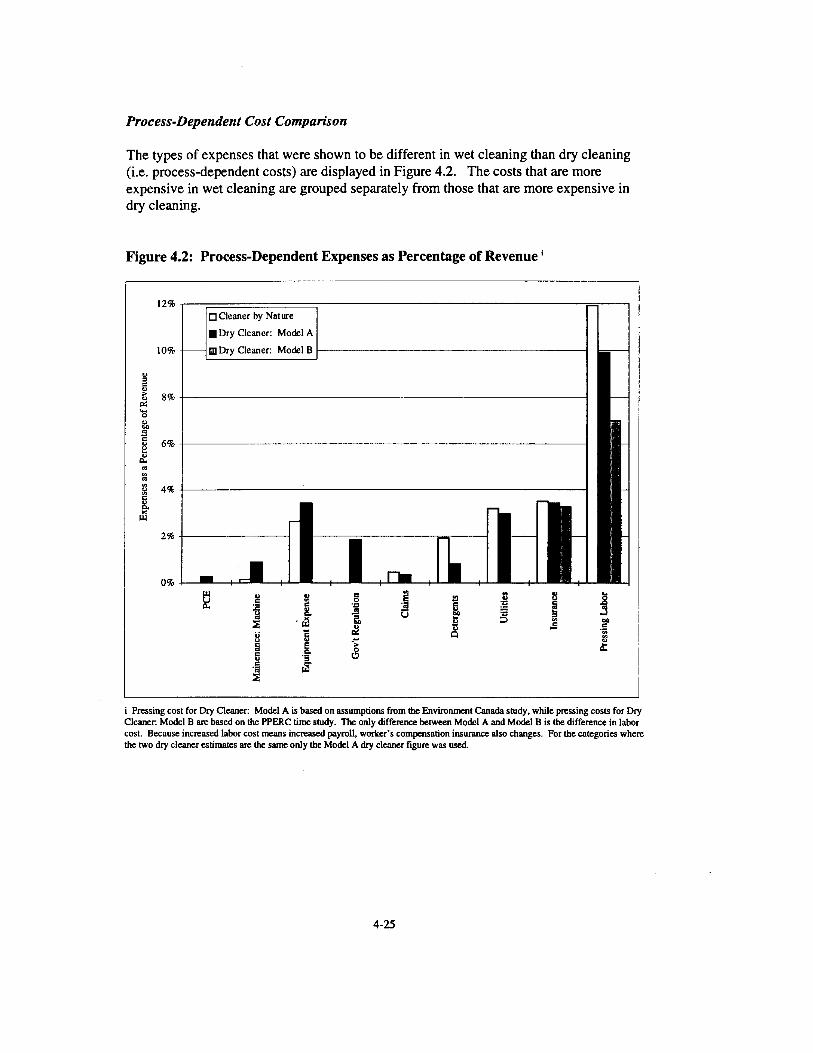
Figure 41 Cleaner by Natures Monthly Expenses and Revenues 4-1 O Figure 42 Process-Dependent Expenses as Percentage ofRevenue 4-25
List of Appendices
Section 1 1-A Partnership Agreement between PPERC and KYCC 1-B Advisory Committee Members 1-C Cleaner by Nature Fact Sheet
Section 3 3-A Gannent Types Cleaned at Cleaner by Nature During First Year of Operation 3-B Distribution of Care Instructions for Three Days of Data Collection at Cleaner by Nature 3-C Gannents Rejected at Cleaner by Nature in First Year of Operation 3-D Claims and Store Credit at Cleaner by Nature 3-E Claims and Store Credit at Dry Cleaner A 3-F Gannents Returned to Cleaner by Nature for Additional Work 3-G Analysis of Gannents Returned by Customers for Additional Work by Fiber Type 3-H Analysis of Gannents Returned by Customers for Additional Work Related to Spotting
Shrinkage or Pressing 3-1 Gannents Returned to Dry Cleaner for Additional Work 3-J List of Gannents Used in the Repeat Clean Test 3-K UCLA Wet Cleaning Demonstration Project Repeat Clean Test Final Evaluation Sheet 3-L Specific Garment Measurements 3-M Methods for Increasing Accuracy in Dimensional Change Evaluation 3-N Dimensional Change in Repeat Clean Test Gannents 3-0 Distribution of Dimensional Change by Gannent Quality 3-P Repeat Clean Test Comparisons 3-Q Telephone Survey of Cleaner by Nature Customer Satisfaction 3-R Analysis of Self-Selection in Cleaner by Nature Customer Satisfaction Survey 3-S Telephone Survey of Dry Cleaning Customer Satisfaction 3-T Center for Neighborhood Technology Repeat Clean Test Raw Data
Section 4 4-A Cash Flow of Cleaner by Nature Through First Year of Operation 4-B Accrued Revenue and Expense Key 4-C Base Prices at Cleaner by Nature and Dry Cleaners Used in the Pressing Time Study 4-D Distribution of Fiber Types Pressed During Evaluation at Cleaner by Nature and Two Local
Dry Cleaners 4-E Environment Canada Pressing Times Study 4-F Process-Dependent Operating Cost Key 4-G Process-Independent Operating Cost Key
Section 5 5-A Methods for Regional Analysis 5-B Two-Day Study Period Cleaner by Nature Water and Energy Use 5-C Water Use at Cleaner by Nature 5-D Water Use in Dry Cleaning 5-E Wastewater Tables 5-F Detailed Energy Use Methodologies 5-G Dry Cleaning Energy Use - Non-Cleaning Machine
5-H Detailed Water and Energy Use Results at Cleaner by Nature 5-1 Spotting Agent Use at Cleaner by Nature 5-J Cleaning Agent Use at Cleaner by Nature
Section 6 6-A State Fees for Reduced Liability Exposures 6-B Provisions for Reduced Liability for State Legislation
Abstract
The report analyzes the viability of Cleaner by Nature a 100 professional wet cleaner and whether professional wet cleaning represents a viable pollution prevention approach in eliminating perchloroethylene (PCE) a chemical solvent used in dry cleaning PCE which has been identified as a toxic air contaminant and probable human carcinogen is heavily regulated in terms of its use in dry cleaning The analysis includes a comprehensive plant level case study and comparative performance financial and environmental assessments of wet cleaning and PCE-based dry cleaning The major issues associated with the viability analyses were identified and specific information was collected in relation to how the clothes were cleaned (a customer garment profile a problem garment analysis a technical evaluation or repeat clean test a wearer survey and customer satisfaction surveys) how wet cleaning did financially (a start-up cost analysis and a profitloss analysis) what environmental impacts were identified (water energy and chemical inputs and outputs) and what contributing factors (technology changes garment manufacturing and labeling and regulatory or legislative actions) influence the viability of professional wet cleaning
Executive Summary
Background
For more than forty years the vast majority of dry cleaners have relied on perchloroethylene (PCE) as the solvent used to clean clothes as part of the dry cleaning process This use has made dry cleaners the single largest market for PCE In recent years however a wide array of scientific studies and federal state and local regulatory actions have focused on PCEs health and environmental risks Costly regulatory and liability actions have created significant economic burdens for cleaners most of whom are small businesses These pressures have prompted a search for alternative cleaning processes
The Research Question
In the past few years computer-controlled washers and dryers have been developed to facilitate the professional cleaning of delicate clothes in water rather than with PCE Though still a small segment of the garment care industry the entry of this wet cleaning process has triggered a widespread debate about its viability and whether it represents an alternative to PCE-based dry cleaning To answer the question of wet cleaning viability the Pollution Prevention Education and Research Center (PPERC)
undertook a 12-montr case study evaluation of a fully operational privately-owned professional wet clean facility This facility called Cleaner by Nature was the first 100 wet clean facility in its region (that is it accepted and professionally wet cleaned the garments that would be cleaned by a typical dry cleaner)
Methods
This report Pollution Prevention in the Garment Care Industry Assessing the Viability of Professional Wet Cleaning analyzes whether Cleaner by Nature has become a viable business It also seeks to analyze whether professional wet cleaning in comparison to dry cleaning represents a viable potential pollution prevention approach The assessment of viability is based on a plant level case study and a comparative analysis of professional wet cleaning and dry cleaning in three key arenas performance (evaluating how clothes were cleaned and customers responded) financial (evaluating start-up costs cash flow and profit and loss) and environmental (identifying and measuring various environmental inputs and outputs) Additional contributing factors such as the risks liabilities and uncertainties of both processes have also been discussed This evaluation of professional wet cleaning was based on facilities that seek to clean all garments brought in for cleaning rather than mixed use facilities where both dry clean and wet clean machines are utilized on site Such an assessment of a mixed use facility would require a different set of methods and data points and would pose different research questions
ii
Results
Performance Assessment In terms of customer satisfaction and technical performance Cleaner by Natures cleaning capability was broadly comparable to that of dry cleaning
During its first year of operation Cleaner by Nature cleaned the full range of garments that are typically taken to a dry cleaner rejecting less than two-tenths of one percent of the 34950 customer garments Cleaner by Nature reported few problems in terms of claims or garments returned for additional work Garments for which Cleaner by Nature compensated customers either with cash or store credit accounted for less than one half of one tenth of one percent of customer garments Problems diminished over time as the wet cleaner gained experience Comparison data on garments returned for additional work showed that Cleaner by Natures performance was comparable to dry cleaning Shrinkage and pressing posed relatively more of a problem for Cleaner by Nature while stain removal was identified as more of a problem for the dry cleaner
A technical performance evaluation compared how wet cleaning and dry cleaning performed on 40 sets of identical garments after repeated cleaning and wear Color consistency and color migration were the areas where slightly greater problems for wet cleaning were most noted although overall changes in color for both wet cleaned and dry cleaned garments were seen as comparable There was slightly greater dimensional change in the length (but not in the width) for wet cleaning although the difference in average length measurement between the two processes (less than one third of one percent) was not statistically significant There were also slightly greater problems in the areas of pressing and general appearance in wet cleaning while there were slightly greater problems for dry cleaning in damage to the fabric or buttons Substantially more evaluators identified a chemical or dry cleaning odor for the dry cleaned garments although all garments had an acceptable odor Volunteers wearing the test garments indicated greater overall satisfaction with the wet cleaned garments with slightly greater detection of shrinkage for wet middotcleaning and of stretching for dry cleaning and slightly greater problems for dry cleaning in stain removal and damage to fabrics or buttons Comparative data on dimensional change from two similar studies showed that for woven garments there was a slightly greater amount of change in the length for wet cleaned garments while the widthwise change was comparable among the wet cleaned and dry cleaned garments For knit garments while there was a substantially greater amount of dimensional change compared to woven garments regardless of the cleaning method this change was barely detectable by volunteer wearers
Customer satisfaction is an important measure of performance in a service industry More than 90 of customers surveyed rated Cleaner by Nature as good or excellent and more than 90 said they would recommend the business to a friend A parallel survey was conducted of dry cleaning customers A comparison of the results showed that customers rated Cleaner by Nature as equal to or better than dry cleaning in nearly all the performance areas with significantly greater satisfaction for wet cleaning in
iii
terms of color feel smell and lack of damage to buttons or decorations There was also continuing growth of new customers for Cleaner by Nature during the year More than three-quarters of customers surveyed who used Cleaner by Nature at least once still considered themselves customers
Financial Assessment In terms of financial viability Cleaner by Nature became profitable by the fourth quarter of its first year of operation while overall costs were comparable between wet cleaning and dry cleaning
Cleaner by Nature built a loyal customer base and significantly increased its revenues during its first year of operation While losses were recorded during its first year Cleaner by Nature succeeded in making a profit of 3 by its fourth quarter By taking into account the fact that Cleaner by Nature has been operating both a plant and a drop-off store as part of its future expansion plans a model plant analysis was developed to evaluate Cleaner by Nature as if it were a typical cleaner operating at a single location This analysis indicated that Cleaner by Nature would have achieved a 10 profit in its fourth quarter Revenues have continued to increase since the demonstration period with profits for the second year projected to be more than 17
The comparative cost analysis of wet cleaning and dry cleaning revealed that Cleaner by Natures equipment costs (both purchase price and maintenance) were lower than those of a similarly configured dry cleaner The purchase costs for the wet cleaning systems including less expensive wet clean machines and more expensive pressing equipment were 9 lower than for the dry cleaning systems Yearly equipment expenses (including use installation and maintenance) were 31 less for wet cleaning than dry cleaning However costs for soaps and labor were higher for wet cleaning than for dry cleaning The higher labor costs for wet cleaning were due to the additional time needed for pressing garments A range of studies including a PPERC pressing time evaluation have identified pressing as more time-consuming for wet cleaning than for dry cleaning Although pressing labor has been identified as a challenge in wet cleaning Cleaner by Natures fourth quarter pressing wages as a percentage of revenue (11 ) were nevertheless close to industry expectations for a profitable cleaner (10) The tradeoff between higher equipment costs for dry cleaning and higher labor costs for wet cleaning meant that overall operating costs for wet cleaning and dry cleaning were similar However dry cleaning expenses would be greater for dry cleaners in those states where dry cleaner-supported liability reduction measures have been enacted and when liability insurance is purchased
Environmental Assessment In terms of the environmental assessment no substantial environmental concerns were raised by the environmental evaluation of wet cleaning while dry cleanings environmental impacts though reduced with new control technologies are still considerable
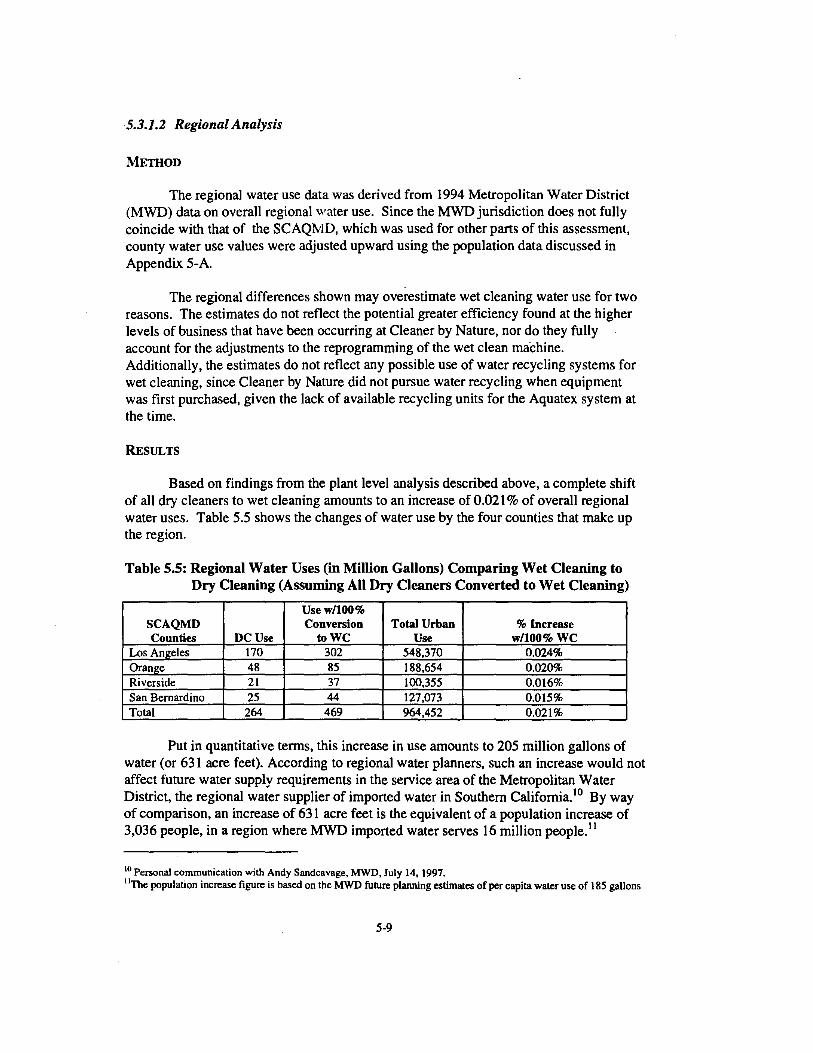
An increase in regional water use has been identified as a possible negative environmental consequence of a switch to professional wet cleaning However this study
iv
indicates that with conservative assumptions regional water demands would increase by only 0021 (equivalent to a population increase in Southern California of 3036 people) if every dry clean facility in the region was converted to professional wet cleaning Such a scenario did not generate concern among regional water planners In addition the Los Angeles Bureau of Sanitations wastewater analysis of Cleaner by Nature indicates that wet cleaning effluent meets all regulatory standards and generates few environmental impacts These findings are confirmed by three prior studies of wet cleaning effluent While regulations and equipment have been developed to reduce the risk of groundwater contamination from PCE dry cleaners the risk of spills or illegal handling of PCEshycontaminated material cannot be eliminated The loss of one small production well from groundwater contamination due to PCE would offset any increases in water use if all dry cleaners in the region converted to professional wet cleaning
Energy use data gathered at Cleaner by Nature and modeled for dry cleaning indicates that energy use is comparable for both processes Wet cleaning uses more natural gas than dry cleaning and less electricity Since natural gas generation produces relatively fewer pollutants than electricity generation wet cleanings lower electricity use offsets its greater use of natural gas
New dry cleaning equipment has improved efficiencies in chemical use and reduced chemical outputs However air emissions of PCE from dry cleaning cannot be eliminated entirely even with the newest technology At the regional level PCE emissions are projected to be 42 tons per day for 1998 assuming full regulatory compliance The generation of hazardous waste is also substantially greater in dry cleaning as a consequence of PCE use Because it eliminates the use of PCE in the garment care process wet cleaning can be considered an environmentally preferable pollution prevention alternative
Finally contributing factors such as technology changes garment manufacturing and care labeling regulatory legal and legislative processes also have significance in terms of the future viability of wet cleaning and dry cleaning Technology innovation and technology costs changes in garment manufacturing and care labeling and marketing factors may have the most influence on wet cleaning while regulatory and liability factors would have the most significant impacts for dry cleaning
Conclusion and Recommendations
In conclusion pollution prevention approaches can help identify viable technologies or processes which eliminate or reduce negative environmental impacts for the community and in the workplace The case study of Cleaner by Nature demonstrates that a professional wet cleaner could make a profit by successfully cleaning customer garments that would have otherwise been dry cleaned While case studies focus on one particular case by systematically comparing wet cleaning and dry cleaning through a model plant analysis and an analysis that scales these results to the regional level and by also undertaking a comparison of the results to other case studies of wet cleaning it is
V
possible to make a judgment about the overall viability of wet cleaning as a business While there remain challenges in cleaning garments for both wet cleaning and dry cleaning (eg shrinkage and color migration in wet cleaning and stretching and spotting in dry cleaning) and while there are financial tradeoffs for both businesses (eg higher labor and detergent costs for wet cleaning and higher equipment and liability costs for dry cleaning) these performance and financial differences remain small On the other hand environmental impacts are significantly greater for dry cleaning due to PCE use as the cleaning solvent in dry cleaning Based on this comparative analysis the study concludes that professional wet cleaning constitutes a viable pollution prevention approach for the garment care industry
The study then identifies a number of policy recommendations These include providing information and technical assistance to cleaners about wet cleaning economic incentives to facilitate a transition to wet cleaning and regulatory action including the designation of wet cleaning as best available control technology
vi
Part I
Background and Methods
Section 1
Background to the Study
1 Background to the Study
11 Pollution Prevention and the Garment Care Industry
Dry cleaning is a widely recognized method for cleaning delicate garments and a convenient service that is offered in nearly every community in the United States For more than forty years the vast majority of dry cleaners have relied on perchloroethylene (PCE) as the solvent used to clean clothes as part of the dry cleaning process This use has made dry cleaners the single largest market for PCE producers representing as much as 60 of all PCE sales 1 In recent years however a wide array of scientific studies and federal state and local regulatory actions have focused on PCE in terms of the health and environmental risks that it poses Costly regulatory and liability actions are becoming increasingly prevalent for this industry and have created significant economic burdens for cleaners most of whom are small businesses These concerns about the health and environmental effects of PCE regulatory pressures and the threat of liability actions have prompted both inside and outside the garment care industry a search for alternative cleaning processes
In the past few years computer-controlled washers and dryers have been developed to facilitate the cleaning of delicate clothes in water rather than with a chemical solvent This process is known as machine or professional wet cleaning Though still a small segment of the garment care industry the entry of professional wet cleaning has triggered a widespread debate about its viability and whether it represents an alternative to PCB-based dry cleaning To answer that threshold question of wet cleaning viability the Pollution Prevention Education and Research Center (PPERC) undertook a 12-month evaluation of a fully operational privately-owned machine wet clean facility The evaluation has been funded by the South Coast Air Quality Management District the California Air Resources Board and the US Environmental Protection Agency
This report Pollution Prevention in the Garment Care Industry Evaluation of the Viability of Professional Wet Cleaning seeks to answer the question regarding the viability of this potential pollution prevention approach which would substitute for the use of PCE in garment care The assessment of viability is based on two sets of evaluations The first analyzes the viability of a single wet cleaner a commercial operation in the Los Angeles area that also served as the demonstration site for the overall study This plant level analysis describes and analyzes the real world conditions of a new start-up wet cleaner at a particular moment in time facing particular conditions in terms of its operation The second set of evaluations analyzes wet cleaning in relation to PCB-based dry cleaning as a potential pollution prevention alternative This comparative analysis describes and evaluates the issues and impacts associated with a shift to wet cleaning from PCB-based dry cleaning This comparison includes a scaled-up regional
1 1992 California Air Resources Board Survey Database of California Dry Cleaners provided by Ted Wong CARB January 13 1997
1-1
analysis where applicable (that is the impacts that would result if all dry cleaning operations were replaced by wet cleaning at the regional level) as well as other types of comparative evaluations between the two processes (for example customer satisfaction surveys a technical performance assessment and a model financial comparison)
The report provides an overview of the methods and procedures for these evaluations by describing the development of the demonstration facility in its first year of operation and providing a comparative evaluation of wet cleaning and PCE-based dry cleaning in three key arenas performance (how clothes were cleaned and customers responded) financial (how wet cleaning performed as a start-up business in its first year of operation in comparison to dry cleaning) and environmental (what kinds of environmental inputs and outputs could be identified and measured in wet cleaning as compared to dry cleaning) The report then discusses and analyzes these various assessments integrating them into a broader perspective on the viability of professional wet cleaning As part of this integration possible trends and influences such as the evolution of a new technology and the risks liabilities and uncertainties of both processes have also been discussed and analyzed The report concludes by answering the two central research questions posed by this study assessing the viability of a specific professional wet cleaner and whether professional wet cleaning constitutes a viable pollution prevention alternative to PCE-based dry cleaning
111 The Pollution Prevention Approach
The current structure of environmental policy primarily focuses on minimizing pollution that is released into the environment and to a lesser extent mitigating workplace or consumer hazards that may result from the use of hazardous materials This approach has an end-of-pipe focus that is controlling or mitigating the pollution after it has been created The end-of-pipe or pollution control approach also emphasizes the use of technologies and proce~ures to control pollution releases such as new equipment monitoring and reporting requirements and proper disposal While this type of regulation may help reduce environmental and occupation health impacts it fails to address the source of the hazard or pollutant
Since the 1980s an alternative policy approach popularly known as pollution prevention has been developed as a way to focus on reducing or eliminating the source of the hazard or pollutant through new technologies process design change andor undertaking various other source reduction-related changes at any stage in a production cycle Such changes can potentially eliminate the need for end-of-pipe regulatory controls entirely Pollution prevention strategies may rely on regulatory tools voluntary action or economic incentives or disincentives Though still in its infancy as a framework for environmental policymaking pollution prevention potentially offers a new paradigm or framework for action for environmental policy and industry decisionshymaking
1-2
To further that framework for action the Pollution Prevention Education and Research Center (PPERC) was established in 1991 as an interdisciplinary research teaching technical assistance and outreach center PPERC faculty and research associates jointly housed at the University of California at Los Angeles and Occidental College are drawn from the fields of public policy planning toxicology law environmental health biology chemical engineering and environmental engineering As part of its mission PPERC has undertaken a series of industry-specific case studies and policy analyses to identify the opportunities and barriers to a pollution prevention approach The garment care industry subject to a protracted and often bitterly debated regulatory process involving end-of-pipe control requirements and liability considerations represents an important example of the need to assess the viability of this new approach in the specific context of a potential pollution prevention alternative Since 1993 PPERC has been involved in an evaluation of pollution prevention and the garment care industry This report represents a culmination of those efforts
112 PCE-Based Dry Cleaning and the Need for a Pollution Prevention Approach
Since the 1950s PCE has become the dominant cleaning agent in garment care a solvent that is currently used by 90 percent of the more than 30000 dry cleaners operating throughout the United States Due to its low flammability and effective cleaning properties PCE was largely able to displace previous non-aqueous-based solvents used in garment care notably carbon tetrachloride (which was banned due to significant health risks) and petroleum (which has suffered from concerns due to potential fire hazards in garment care facilities) During this period the dry cleaning industry also achieved its name and recognition in part by widely promoting its ability to substitute a cleaning solvent such as PCE for water In tum the dry clean only garment care label was established by actions of the Federal Trade Commission for garments that required professional cleaning as opposed to home laundry cleaning or cleaning in water This care labeling process in particular and the evolution of the dry cleaning business in general occurred in the context of dry cleanings ability to clean clothes that broadly met various industry expectations in such areas as dimensional change (shrinkage or stretching) colorfastness (dye bleed) and overall cleaning quality
Though the dry cleaning industry became subject to certain important changes in the garment manufacturing and marketing processes (for example the growth in casual wear) it has evolved since the 1960s as an increasingly mature industry with a proven technology and an effective method for meeting the objective of professionally cleaning certain garments (primarily those labeled dry clean only) Although dry cleaning has not become characterized as a highly profitable business its relatively low start-up costs and labor intensive requirements make it an attractive option for those with limited capital and a willingness to substitute labor for capital (for example by developing a family-run business) Largely due to these characteristics during the 1980s large numbers of first generation Korean immigrants entered the dry cleaning business By the
1-3
late 1990s Korean cleaners constituted a major segment of the industry as much as 50 to 70 in certain large metropolitan areas such as Los Angeles and Chicago2
The issues facing the industry began to change dramatically during the 1970s and 1980s as a wide array of scientific studies began to evaluate perchloroethy Jene for its potential health and environmental risks PCE air emissions trace levels of groundwater and wastewater discharges and occupational exposures all became issues for regulatory concern and intervention PCE came to be listed as a hazardous air pollutant through a complex and lengthy process established by the Clean Air Act Amendments of 1990 (section 7412 of Title 42 of the United States code) In California the California Air Resources Board (CARB) classified PCE in October 1991 as a toxic air contaminant pursuant to section 39655 of the California Health and Safety Code The National Institute for Occupational Safety and Health (NIOSH) also recommended that PCE be treated as a potential human carcinogen and exposure be kept to the lowest feasible limit3 In Southern California in 1995 the South Coast Air Quality Management District adopted Rule 1421 to consolidate federal state and regional air regulations affecting dry cleaners The rule included equipment and record-keeping requirements designed to reduce emissions and encourage good operating practices among PCE dry cleaners It was motivated in part by a SCAQMD survey of dry cleaners in the South Coast basin which had estimated that for the 2457 PCE machines in use in the region in 1994 emissions were 61 tons per day or 60 of total PCE emissions a high number for an industry dominated by small businesses4 While the extent of PCE emissions and contamination had triggered the need for regulations it also became apparent to SCAQMD EPA and other regulators that those regulations affecting dry cleaners would be difficult to enforce in an industry dominated by thousands of small shops and a high percentage of ownership among recent immigrants Nevertheless given the nature and breadth of the health and environmental risks that were reviewed regulations driven by various statutory requirements were promulgated and a range of pollution control equipment requirements for dry cleaners (many of them expensive) were mandated
The financial and operational concerns for dry cleaners stemming from the wave of environmental regulation have been significantly heightened by the uncertainties and risks associated with the liability provisions for contaminated sites in clean-up legislation regulations and legal actions The most prominent of these laws is the Comprehensive Environmental Response Compensation and Liability Act or Superfund which stipulates that clean up of contaminated sites (whose costs could easily amount to
2 The 70 estimate was provided by the late Hank Kim then President of the Korean Dry Cleaners Association and is cited in Coming Clean Elizabeth Hill Pollution Prevention Education and Research Center 1994 the 50 estimate is derived from an inventory of Korean surnames of the South Coast Air Quality Management Districts list of cleaners in the SCAQMD district area conducted by the Korean Youth and Community Center 1996 3 South Coast Air Quality Management District Staff Report to Propose Adoption of Rule 1421 Control of Perchloroethylene Emissions from Dry Cleaning Systems and Repeal Rule 11021 Perchloroethylene Dry Cleaning Systems (Diamond Bar CA December 1994) 1-4 4 SCAQMD 1994 3-4 California Air Resources Board Technical Support Document - Proposed Airborne Toxic Control Measure and Proposed Environmental Training Program for Perchloroethytlene Dry Cleaning Operations (Sacramento CA August 27 1993) 1-8
1-4
hundreds of thousands if not millions of dollars) may be borne by any number of responsible parties associated with the site including dry cleaners as well as property owners or lenders in those places where PCE contamination has been identified For dry cleaners these potential liability considerations have led to significant uncertainties regarding the future of the business as well as new constraints on current operations such as the increasing number of termination notices or the failure to renew leases by owners of mall sites or other locations where cleaners operate
The range of problems and risks for dry cleaners can be defined as an outcome of a pollution control or end-of-pipe system of environmental regulation and management designed to address a specific pollutant problem but only after the pollution has already been created Many cleaners have responded either by attacking or seeking to modify those regulations or by challenging the nature and the use of the scientific information that has been developed with respect to PCEs health and environmental risks However a number of cleaners have begun to explore whether an alternative approach to costly regulatory combat or compliance is possible The most direct path for such an alternative approach is pollution prevention that is defining an alternative to the source of the problem which has been responsible for costly regulatory interventions Since the early 1990s the focus of that exploration has primarily been wet cleaning a new technology and process change that eliminates the use of PCE the source of dry cleaning regulatory intervention
113 Professional Wet Cleaning as a Pollution Prevention Alternative
In the past few years several new cleaning alternatives that substitute for the use of PCE in garment care have been introduced at the experimental or pilot stage5 Of these alternatives machine wet cleaning has become the most widely available commercial substitute to PCE-based dry cleaning
Wet cleaning refers to a series of techniques used to professionally clean garments in water including the use of new specially designed machines Professional wet cleaning is distinct from home laundering as it requires the knowledge and the finishing capabilities of a trained cleaner It is also distinct from commercial laundering the aqueous process used to clean cotton dress shirts linens and other water-washable items Professional wet cleaning refers to water-based processes designed to clean delicate items including those labeled dry clean only There are generally two categories of wet cleaning Multi-process wet cleaning refers to a series of cleaning techniques including hand washing steam cleaning and controlled application of soap and water Machine wet cleaning uses special washing and drying machines designed to clean delicate
One important alternative involves the use of a carbon dioxide-based system one of whose promoters is seeking to market this technology under the name Dry Wash However neither CO2 nor other non-PCE or petroleum-based cleaning systems are yet available commercially PPERC is in the process of developing a Memorandum of Understanding with Hughes Environmental Systems which has been at the forefront of developing CO2 cleaning technology The Hughes-PPERC agreement is based on a future evaluation of the CO2 technology if and when a Beta site (operational technology but not yet fully commercialized) has been developed
1-5
garments in water The machines can be programmed to control for a number of variables including mechanical action water and detergent volume cycle length and dryer moisture level Specially designed soaps and sizing agents are used to prevent dye bleed and give clothes body and shape In this report professional wet cleaning refers only to machine wet cleaning
While there is consensus in the dry cleaning industry that a number of the garments that dry cleaners receive can be processed in water questions remain whether all customer garments can be successfully machine wet cleaned whether such a wet cleaning business is economically viable and what might be the environmental consequences of using a water-based approach These issues have been explored in this evaluation both by an assessment of a specific professional wet cleaning facility as well as through the comparison of wet cleaning to dry cleaning The facility that was evaluated was established as a 100 wet cleaning facility that is it sought to accept all garments brought in for cleaning similar to a 100 dry cleaning operation The evaluation did not include a mixed use facility where both wet clean and dry clean machines are used within the same site Such an assessment of a mixed use facility would require a different set of methods and data points and would pose different research methods
114 Description of the Dry Cleaning and Wet Cleaning Processes
The primary difference between the wet cleaning and dry cleaning process is the cleaning solvent used Wet cleaning uses water while as many as 90 of dry cleaners in the United States rely on PCE Most of the remaining 10 of dry cleaners use petroleum a solvent that is still considered highly flammable although recent innovations have begun to reduce that concern The choice of solvent in tum influences various aspects of the cleaning process including the types of machines and cleaning chemicals used
Wet cleaning and dry cleaning are similar in many ways In both processes garments are inspected and sorted according to color and garment type Stained or heavily soiled garments are sent to the spotting board where stain-removing chemicals are applied The garments are then placed in machines that add solvent and some combination of cleaning detergent sizing agents and finishing agents6 Through the process of chemical interaction and physical agitation of garments in the drum soils and stains are removed into the solvent The dirty solvent is then extracted Once dried garments are pressed often by using specially designed pressing equipment
The choice of solvent results in several important differences between the processes Wet cleaning is relatively less effective in removing oil-based stains and PCE dry cleaning is relatively less effective in combating water-based stains Consequently different types of spotting chemicals may be used in the two processes to compensate for
6 Finishing and sizing agents are used to restore body and shape to the garment
1-6
their respective shortcomings There are also important differences in the machines Because of the hazards associated with PCE and petroleum garments that are dry cleaned are required to be placed in a closed loop system which means that the washing and drying cycle occur in the same machine and clothes do not need to be transferred (Older dry cleaning machines where the cleaner transfers garments from a washer to a dryer which in tum result in significant emissions during the transfer process are being phased out in California and many other locations) Dry-to-dry machines also purify and recycle the solvent after it is extracted from the drum using an assortment of control technologies Any PCB-contaminated water or material must be disposed of as hazardous waste In wet cleaning garments are placed in the wet cleaning washer which releases the dirty water directly int0 the sewer Once cleaned wet cleaned garments are either placed in a special dryer that is equipped with a humidity sensor or hung out to dry After the cleaning garments ar pressed finished and inspected Most of the pressing equipment used in wet cleaning is the same as the pressing equipment used in dry cleaning However wet cleaners who are processing 100 of garments in water may be more inclined to purchase specially-designed pressing equipment that uses tension to increase the quality and speed of the pressing In addition some new approaches to drying and pressing are being developed such as a drying cabinet Those innovations are primarily oriented towards the wet clean market but some of these (eg tensioning equipment) could be utilized by dry cleaners as well
115 The Development of the Wet Clean Industry
In 1992 US EPA undertook an evaluation of a multiprocess wet clean approach that was based on a quasi-laboratory type non-commercial setting At the time there was no commercial wet cleaning activity to speak of in the United States7 although plans had been developed to establish a handful of commercial wet clean facilities on the East Coast where regulatory battles seemed most pronounced Even as a modest commercial market had begun to develop in Europe wet cleaning in this country was relatively unknown to both dry cleaners and regulators However since 1992 wet cleaning especially machine wet cleaning has grown considerably Currently several hundred advanced computershycontrolled wet cleaning systems have been sold in the United States8 Some major new manufacturers such as UniMac have recently begun to enter the market a change which has al ady significantly increased both the supply and reduced the price of professional wet cleaning machines on the market There are currently seven major manufacturers of professional wet clean machines operating in the United States of these three are USshybased companies9
7 A distinction needs to be made between professional dry cleaning services that include gannents washed in water (such as through hand washing or the use of domestic washers) and cleaning that predominantly or exclusively cleans the full range of gannents in water particularly those that use more sophisticated machines with the types of controls that characterize the contemporary wet cleaning process There are more than IOOO Korean-made Daewoo Electronics Co systems that have also been sold that function as a more advanced commercial washer but without the kinds of controls and technology features of the professional wet clean systems These machines nevertheless have become popular because of their low price (about $900 per machine) for cleaners primarily interested in supplementing rather than replacing their dry cleaning operations 9 Center for Neighborhood Technology Wet Cleaning Equipment Report May I 997
1-7
Despite capturing only a modest share of the garment care market professional wet cleaning has become a major focus of debate among dry cleaners Questions have been raised as to whether a professional wet clean operation that cleans the full range of garments that would otherwise be sent to a dry cleaner can truly be successful This includes questions concerning wet cleanings ability to clean dry clean only garments whether it is capable of turning a profit and assessing whether there are additional costs or environmental problems specifically associated with the wet cleaning process Given the recent growth of the professional wet clean business and the high degree of uncertainty and level of regulatory action that has occurred in relation to dry cleaning an evaluation of wet cleaning as a pollution prevention alternative thus becomes particularly timely and compelling
116 The Demonstration Site Evaluation
In 1994 an agreement was reached between Deborah Davis a San Diego entrepreneur interested in establishing a start-up wet clean business and the Pollution Prevention Education and Research Center The agreement called for PPERC to analyze this new business called Cleaner by Nature as a demonstration evaluation site The PPERC evaluation of the Cleaner by Nature demonstration site has three major components which together provide an answer to the central research question about whether professional wet cleaning represents a viable pollution prevention alternative to dry cleaning The evaluation components include
bull A Performance Assessment measured through a technical wear test customer satisfaction surveys an analysis of problem garments and an assessment of the demonstration sites ability to successfully clean a range of garments
bull A Financial Assessment measured by an analysis of start-up costs cash flow and profitability potential
bull An Environmental Assessment measured by an analysis of key environmental inputs and outputs water wastewater energy and chemicals
In addition the analysis seeks to integrate each of the three assessments as part of a broader discussion of the viability of Cleaner by Nature and the comparisons of wet cleaning and dry cleaning These various assessments are also situated in a specific time frame identifying trends and influences that will have occurred or may occur both prior to and after the evaluation These may include for wet cleaning a rapidly evolving technology or for dry cleaning evolving regulatory and liability considerations Within this consideration of the timing of the evaluation the PPERC demonstration evaluation project itself represents the latest and most comprehensive of a series of evaluations or previous studies of professional wet cleaning These other evaluations and studies include
1-8
USEPA Multiprocess Wet Cleaning Study (Washington DC In 1992 the USEPA launched research into aqueous-based cleaning techniques with a cost and performance comparison of multi-process wet cleaning to PCE-based dry cleaning
Environment Canadas Green Clean Project (Ontario) Environment Canada (the Canadian equivalent of the USEPA) conducted an evaluation and demonstration of wet cleaning in October 1994-1995 That study examined machine-based wet cleaning as well as steam cleaning which was used at several plants around Ontario
The Center for Neighborhood Technology (CNT) Alternative Clothes Cleaning Project (Chicago) In 1995-1996 the CNT in Chicago conducted a year-long evaluation and demonstration of machine-based wet cleaning also at a privately-owned demonstration site
Toxics Use Reduction Institutes (TURI) Cleaner Technology Demonstration Site Case Study (Lowell MA) TURI conducted a demonstration of the Daewoo wet cleaning system
Tellus Institute Pollution PreventionWaste Minimization for Dry Cleaners (Boston) middot Tellus Institute for Resource and the Environment conducted financial analyses of dry cleaners that have upgraded their PCE control technology or switched to wet cleaning
Texas Womans University (TWU) Department of Fashion and Textiles TWU is working in partnership with North Carolina State University to evaluate the performance of a range of professional cleaning methods including machine wet cleaning Funded by the USEPA the research team is working to establish a universally acceptable method of evaluating cleaning technologies
International Fabricare Institute (IFI) (Maryland) IFI has set up wet cleaning machines at its headquarters to serve as a testing facility and demonstration site for cleaners IFI and other dry cleaning trade associations now also offer training in wet cleaning techniques to members
Each of these projects has sought to establish a base of information that ultimately can be used to more effectively evaluate the viability of professional wet cleaning The range and breadth of the PPERC evaluation including the comparative analysis of wet cleaning and dry cleaning operations significantly adds to that information
Aside from the evaluation PPERC has undertaken information dissemination outreach and technical assistance efforts aimed at dry cleaners One of those efforts has been made to reach Korean American dry cleaners who comprise an estimated 50 to 70 of Southern California dry cleaners Towards that end PPERC is working in partnership with the Korean Youth and Community Center a Los Angeles communityshybased organization that provides technical assistance to Korean-owned businesses (See
1-9
Appendix 1-A for a copy of the partnership agreement) This important segment of the industry can play a crucial role in pursuing a pollution prevention alternative PPERC is also working with dry cleaning organizations and with individual dry cleaners to identify methods and provide information that would facilitate such a technology transfer
The PPERC evaluation has been guided by a 14-member Advisory Committee that includes representatives from the dry cleaning industry the apparel industry government agencies environmental and occupational health advocates and experts with backgrounds in evaluation methods and textile science The Committee was established in December 1995 to advise and inform the PPERC project team regarding the details of the evaluation The Advisory Committee was convened on several occasions to discuss the different components of the evaluation It then made specific recommendations that were incorporated into the assessment process In addition Committee members have provided assistance on an individual basis such as active participation in garment selection for the Repeat Clean Test as well as the identification of participating dry cleaners in various assessments such as the pressing time evaluation PPERC however takes full responsibility for the analysis and conclusions of the report Appendix 1-B lists the members of the Advisory Committee
1-10
12 Cleaner by Nature A Pollution Prevention Demonstration Site
On February 6 1996 Cleaner by Nature opened its doors at its drop-off store or agency shop at 2407 Wilshire Boulevard in Santa Monica and began operations at its plant at 3317 La Cienega Place in the city of Los Angeles From the moment Cleaner by Nature opened its doors the demonstration evaluation process began with the formal evaluation period extending from February 1996 to January 31 1997 Since the end of the evaluation period additional information has been obtained about Cleaner by Nature operations in order to help further identify continuing trends
Cleaner by Nature operates as a privately-owned professional wet cleaning facility cleaning the full range of garments that would otherwise go to a dry cleaner A contractual arrangement between PPERC and Cleaner by Nature allowed access to middot financial performance and environmental data and use of the facility for periodic tours Cleaner by Nature was paid a monthly fee for access to the facility and its records Compensation was also provided for staff labor time associated with the demonstration project (for example hosting tours) These fees are identified in the financial section but have been excluded from the overall financial analyses
From the outset of its operation Cleaner by Nature has operated as a 100 professional wet cleaner that is Cleaner by Nature wet cleans all of the garments that come over the counter with the exception of cotton dress shirts and other items which are sent to be laundered and most leathers which are sent to a leather specialist Cleaner by Nature functions as a typical small-sized professional cleaner that seeks to attract a diverse clientele including primarily the middle to upper income customers from the area In this way Cleaner by Nature is similar to other dry cleaners that operate in the same immediate neighborhoods in Santa Monica Its location pricing and overall marketing goals distinguish it from the discount cleaners who promote price and speed rather than quality10 But what most distinguishes Cleaner by Nature from nearly all other cleaners is the cleaning process itself its substitution of water for chemicals as the cleaning solvent
Cleaner by Natures wet cleaning process involves the use of a 3050 pound Aquatex washer11 and a 50 pound natural gas-heated Aquatex dryer instead of a PCE machine Shop owner Deborah Davis chose to locate her drop-off facility in Santa Monica because the city is home to a large number of environmentally conscious consumers and professionals who are likely to use professional cleaning services Furthermore she has directly marketed her business as an environmentally preferable
10 It should be noted parenthetically that not all wet cleaners have sought to promote their business as different from dry cleaning particularly those who have been forced to switch to an alternative cleaning technology by realtors or lenders who didnt want a PCB-based dry cleaner operating on their properties 11 The Aquatex washer can be used both as a professional wet cleaning system and a commercial laundry A maximum capacity of 30 pounds per load is recommended for wet cleaning while the drum can hold up to 50 pounds for laundering
1-11
alternative to PCB-based dry cleaning with print advertisements in local newspapers and mailers to select households in a three-mile radius around the shop Cleaner by Nature is priced competitively to other cleaners in the area 12 During the demonstration period the cost of cleaning a suit for example was $875 See Appendix 1-C for a more detailed profile of Cleaner by Nature
121 Description of the Evaluation Period the First Twelve Months of Operation
Growth of the Business In the first twelve months of operation Cleaner by Nature wet cleaned 34950 garments 13 The volume of clothes cleaned per day has steadily increased at Cleaner by Nature since it opened in February 1996 Its strongest period of growth was the fourth (and final) quarter of the evaluation period when Cleaner by Nature processed an average of 197 garments per day compared to 44 garments per day in its first month of operation Since the evaluation period Cleaner by Nature business has continued to expand averaging more than 265 garments per day in March April and May of 1997 See Figure 31 for a month by month account of Cleaner by Natures growth in terms of garments cleaned per day A more detailed analysis of Cleaner by Nature growth in relation to financial performance is provided in Section IV
Profile ofCustomer Base Cleaner by Nature attracted an average of 167 new customers a month during its first twelve months of operation for a total of 2009 customers Significantly Cleaner by Nature has maintained a high retention rate of its customers even though it has been marketing a new technology and has attracted several customers who have traveled significant distances beyond a one-mile radius from the Santa Monica drop-off store location Many of these customers were curious to try Cleaner by Nature on a one-time basis but subsequently discontinued going to Cleaner by Nature because of distance (while still expressing interest in wet cleaning) The customer profile data was recorded both by Cleaner by Natures computerized cash register and through the Cleaner by Nature customer satisfaction survey Cleaner by Nature also attracted an increasing number of new customers each month a trend that continued after the demonstration period The cash register also kept track of the number of transactions per customer an indicator of customer loyalty A more comprehensive analysis of the data related to Cleaner by Nature customers is provided in Section ID (Performance Assessment) of the report
Staff Growth Turnover and Experience Levels The job duties of the Cleaner by Nature staff are similar to those of a small-sized dry cleaner They include working the cash register marking (initial inspection of the garments tagging and preparing for cleaning) spotting or stain removal cleaning pressing and finishing and assembly Cleaner by Nature largely due to its separate drop-off store or agency has a driver on staff to operate the delivery van that transports garments between the plant and the agency and that is also
12 Cleaner by Natures owner conducted a telephone survey of area dry cleaners to determine a competitive price 13 The Cleaner by Nature plant is in operation five days a week The drop-off store is open six days a week
1-12
used for delivery service In keeping with Cleaner by Natures environmental image the van is a low emissions vehicle (natural gas fuel) However by operating a drop-off store and a plant Cleaner by Nature has required a substantially larger staff than the more typical small dry cleaner operating out of a single facility as described below
In the first twelve months of operation the staff grew from three full and part-time employees to as many as eight full and part-time employees There has been significant staff turnover during the demonstration period The owner attributed the level of staff turnover to a generally high turnover rate in the industry and the fact that she has been striving for high quality work among all employees There have been three cleanerspotters (that is the staff person who has functioned as the primary operations person making the decisions about what and how to clean) All three cleaners were hired in the first six months one was fired the second resigned for personal reasons and the third cleaner continues to operate as Cleaner by Natures cleaner The experience level of the three cleaners varied The first two cleaners each had more than ten years of experience working as dry cleaners The third cleaner was hired initially as a presser and was trained on the job to be a wet cleaner and spotter At the end of the demonstration period Cleaner by Nature had one full-time presser and one half-time presser on staff The pressers have all had experience working as pressers at dry cleaners The clerks have had varying levels of retail college and dry cleaning experience In April 1996 two months after the opening of the shop a delivery driver was hired A full-time agency manager was hired in June aided by a part-time clerk Cleaner by Natures owner also initially worked at the counter for an average of 20 hours a week although the amount of time she spent at the counter declined significantly during the demonstration period and thereafter In July 1996 an assembly person was added to the plant staff
Cleaner by Natures employees are diverse in background ethnicity and cleaningshyrelated experience Aside from finding experienced employees the owner has attempted to hire sufficient numbers of employees in order to handle the newness and uncertainties of a new technology The owner has also set wages to be competitive with overall industry wage levels
Plant and Drop-OffStore Planning for Growth One of the key factors related to Cleaner by Natures operation was the owners decision to open both the drop-off store or agency and plant site rather than a single operation where the plant is typically located at the back of the store and the counter (where garments are accepted) is located at the front This decision has had significant implications for both start-up and operating costs (for example higher utility bills labor costs expenses associated with operating a van etc which are more fully discussed in Section IV) Although some dry cleaners operate as a drop-off store and plant they tend to be larger operations often with two or more agencies sending the garments to be cleaned at a single plant As Cleaner by Nature continued to expand its business the owner decided to open a second drop-off store and was negotiating a lease in the Los Angeles area in December 1997 at the time this report was released
1-13
Cleaner by Natures decision to operate at two locations as an agency and plant was based on a series of considerations On the one hand the owner determined that her ability to locate in Santa Monica or an equivalent location in terms of the clientele she wished to attract was limited by price factors and availability of required space that is available space to be leased was not large enough to accommodate a plant plus a drop-off store andor the cost per square foot of space to be leased was too high for anything but a small drop-off store At the same time Cleaner by Natures owner felt that wet cleaning was likely to be an expanding type of business over time which would make the option of opening a second agency (while still using the single plant) an attractive strategy given the potential for greater efficiencies and thus a reduced cost per garment cleaned (and thus a potentially higher margin of profit)
Partly as a consequence of starting the business as a drop-off store and plant the owner initially needed to work full-time in the business dividing her time between administrative work such as accounting and bill paying and work at the shop and plant A significant amount of that time was spent behind the counter in the first several months of operation However as Cleaner by Nature has realized greater efficiencies with a higher level of business the owner has been able to reduce her hours at Cleaner by Nature most notably in terms of store clerk activities
Employee Training The owner and the initial three members of the Cleaner by Nature staff received about five days of training Iowa Techniques the distributor of the Aquatex wet cleaning system sent a trainer to the Cleaner by Nature plant to work with employees for three days In addition Ann Hargrove then manager of the USEPA wet cleaning demonstration site in Chicago led a two-day training session The owner felt the five day of training was appropriate for Cleaner by Nature as a start-up business but that an existing cleaner could make do with two or three days of training After the tensioning equipment was installed in September Hargrove spent a subsequent day at Cleaner by Nature to see if the pressing speed could be improved She also provided spotting tips and advice on handling wedding gowns
Operations As the Cleaner by Nature staff has accustomed itself to the new process there have been several operational changes Initially all garments were measured by the counter and pressing staff to ensure that any shrinkage or stretching was detected and could be corrected during the pressing process At the end of the demonstration period the staff was only measuring knit rayon and spandex-content garments and upholstery In addition the cleaner initially line dried most wool and rayon garments Currently only the rayon garments and sweaters (about 25 of customer clothes) are being line dried After six months of operating the Cleaner by Nature owner decided to purchase tensioning pressing equipment (a form fitter and pants topper) that is being marketed to wet cleaners (as well as dry cleaners) The equipment applies tension to garments to increase the quality and speed of the pressing This equipment appears to have raised productivity by as much as 20
1-14
The Aquatex washer is reprogrammable and Cleaner by Nature has taken advantage of this twice The first change occurred soon after the February opening to use less soap and speed up the wash cycle The decrease in soap was an effort to save money and the shorter cycles to reduce agitation to the clothes In September Aquatex personnel modified the programs again in an effort to improve performance After this visit Cleaner by Nature once again changed the programs to reduce soap and cleaning time
The owner said she has noticed significant improvement in performance since the opening Spotting techniques have been developed to tackle grease stains in silk a challenge in a water-based process The cleaner has learned to properly dry garments to minimize dimensional change The tensioning equipment has improved the speed and quality of the pressing although she expected the speed to increase more than it has The owner also attributed pressing problems to the high turnover rate in that position
122 Demonstration and Outreach
A key component of the Cleaner by NaturePPERC arrangement has been its demonstration aspect This has included lengthy tours and presentations at the plant and meetings and discussions with the media government officials (for example representatives from the Federal Trade Commission) and various stakeholders interested in professional wet cleaning (for example shopping center owners) During the twelve months of demonstration there have been 14 English-language tours and 6 tours in Korean for Korean cleaners arranged in collaboration with the Korean Youth and Community Center In all 200 people toured the facility during the demonstration period most of them dry cleaners Although the demonstration period has concluded there has been continuing interest by various parties in observing the Cleaner by Nature site and PPERC has developed a second phase of the project which includes significant outreachdemonstration activity Several additional tours have occurred since the demonstration period
The Clean~r by Nature owner has also maintained an interest in developing and further elaborating her operation as an environmentally-oriented business Towards that end she has received honorable mention in the Santa Monica Chamber of Commerces Sustainability Award offered to businesses meeting certain environmental criteria in their operations as well as an award for environmental businesses offered by SCAQMD Although the owner had anticipated a higher level of business at the outset of the operation she has been also surprised at the level of growth that the business sustained during its first year She maintains a longer term interest in expanding her operations even beyond her second drop-off store (also to be served by the existing plant) and ultimately to become a leading operator of professional wet clean systems in the southern California region
1-15
123 Conclusion Assessing Viability
The PPERC demonstrationevaluation of Cleaner by Natures wet cleaning agency and plant operation was organized to answer a series of key questions about wet cleaning viability in relation to PCE-based dry cleaning which are described in the following section on Methods Underlying this evaluation has been the goal of identifying for cleaners regulators consumers and other garment care stakeholders the necessary information that would inform choices about possible pollution prevention alternatives This evaluation of professional wet cleaning further builds on and integrates earlier approaches as part of its effort to develop a thorough and comprehensive comparative evaluation Ultimately it seeks to establish a new framework for helping make future choices that can significantly draw upon the information and analysis presented in this report
1-16
Section 2
Methods for Assessing Viability
2 Methods for Assessing Viability
21 General Research Method
The central methodological question for this study is to determine the extent to which professional wet cleaning provides a viable pollution prevention alternative to PCB-based dry cleaning Answering that question requires analyzing how well professional wet cleaning businesses operating under normal market conditions can successfully clean garments that may require professional care generate revenues and become profitable and minimize any environmental impacts that could result from the cleaning process
In order to answer that question the appropriate methods for such a study needed to be selected To begin with when the study was originally designed in 1995 there was no I 00 professional wet cleaning business operating in the Los Angeles area1 Since Cleaner by Nature was the first 100 professional wet cleaner in the region (that is the first professional wet cleaner to clean the full range of garments that would otherwise go to a dry cleaner) the study was thus initially structured as a detailed and comprehensive case study of Cleaner by Natures performance financial and environmental viability as a new untested business
The most significant methodological benefit of using a case study approach is the in-depth knowledge acquired about the subject of the analysis On the other hand the biggest challenge for any case study approach is its ability to generalize with respect to all possible cases In order to generalize about professional wet cleaning for this study the comprehensive evaluation of the viability of Cleaner by Nature was combined with a series of other data sources that were integrated into an overall comparative analysis of the viability of professional wet cleaning as a pollution prevention alternative This included analyzing and integrating the information available through other case studies of wet cleaning (eg the Environment Canada and Chicago CNT studies described earlier) and then developing comparative data about dry cleaning to be able to assess wet cleanings performance its financial situation and its environmental impacts in comparison to dry cleaning Other contributing factors affecting an assessment of viability such as technology and regulatory issues were also discussed as part of this overall comparative evaluation
1 By 1997 several I00 wet cleaning businesses had been established in Los Angeles and Orange counties
2-1
22 Evaluation Criteria for Assessing the Viability of Wet Cleaning
A series of specific criteria were developed (in the form of questions to be answered) that sought to identify the parameters of what constituted professional wet cleaning (or dry cleaning) viability These criteria based on key performance financial and environmental indicators include
Performance Criteria
bull Can a 100 professional wet cleaner function successfully that is accept the range and types of garments that would otherwise go to a professional dry cleaner
bull Can garments be professionally cleaned without significant problems
bull Can garments be professionally cleaned to the customers satisfaction
bull Can a professional cleaning business develop and maintain its customer base in terms of cleaning performance over time
Financial Criteria
bull Are capital costs in a reasonable range for a start-up business particularly for a small professional cleaner
bull Is the business potentially profitable
bull Do the financial risks associated with the cleaning process or other aspects of the business affect future costs or profit potential
Environmental Criteria
bull Can all environmental regulations be met
bull Are the risks of future environmental regulations such that they might require the professional cleaning business to change in a way that makes it no longer viable
bull Are the environmental impacts from a garment care facility acceptable for the community as well as for those who work at the facility
2-2
23 The Study Design for Each Section of the Report
To implement the general study design specific methods were developed both to carry out the case study analysis of wet cleaning at Cleaner by Nature for each component as well as to compare the results from each analysis with comparable information on the performance capability financial capacity and environmental impact of dry cleaning Such a methodological design provides for both an evaluation of the viability of Cleaner by Nature as a case study of professional wet cleaning as well as a comparative evaluation of wet cleaning and dry cleaning
Part II of the report devotes a separate section to performance capability (Section 3) financial capacity (Section 4) and the environmental impact (Section 5) of wet cleaning Part III of the report includes a discussion section (Section 6) which summarizes the results from each major component and discusses these results in light of the broader contributing factors influencing the performance financial and environmental viability of wet cleaning and dry cleaning Based on this discussion conclusions about the viability of Cleaner by Nature and of professional wet cleaning as a pollution prevention alternative are addressed followed by a series of recommendations (Section 7) The methods used for each section of the report are described below
Section 3 Performance Assessment
For the study performance capacity refers to the ability of professional wet cleaning to successfully clean garments that would otherwise be brought to a dry cleaner The methods for assessing performance included
I) A Profile ofCustomer Garments A profile of the customer garments that are cleaned at Cleaner by Nature included information about the care labels of garments (for example whether a garment was labeled dry clean only) the garment type and the fiber type Analyzing this information helped indicate whether Cleaner by Nature cleaned clothes typically processed by a dry cleaner Data on garment and fiber type were tracked by Cleaner by Natures computer cash register Data on care labeling at Cleaner by Nature was gathered through an inventory of a random sample of customer garments
2) A Profile ofProblem Garments An analysis of rejected garments (garments the cleaner refused to clean) redos (garments that are brought back by customers for additional work) and customer claims (money or store credit for ruined or lost garments) provided a quantitative measurement of the extent and type of garments that pose a problem for professional wet cleaning Data on a number of characteristics of garment rejects redos and claims were collected by Cleaner by Nature throughout the demonstration period Data on store credits was collected only for the last five months Comparable data on redos claims and store credits were collected from two established dry cleaners
2-3
3) Repeat Clean Test A technical evaluation known as the repeat clean test compared professional wet cleaning and dry cleaning performance after the repeated wearing and cleaning of dry clean only labeled garments The purpose of this test is to quantitatively measure the effect of repeatedly cleaning delicate garments by wet cleaning in comparison to dry cleaning A total of three sets of 40 dry clean only labeled garments were obtained for the test Of the set of three one was repeatedly wet cleaned six times another repeatedly dry cleaned six times and a third was stored for comparison purposes The garments were worn before each cleaning by volunteers Trained evaluators with textile backgrounds evaluated the garments for dimensional change general appearance color change resiliency stain and soil removal and hand (or feel) of the clothes after cleaning
4) Wearer Survey A survey was undertaken of the volunteers wearing the garments used in the repeat clean test The purpose of the survey was to compare the results from the quantitative measurement of test garments in the Repeat Clean Test with the experience of customers wearing these same garments The volunteer wearers were given a written questionnaire following the fifth (of six) cleanings The Wearer Survey questions mirror those asked in the Repeat Clean Test and the customer satisfaction survey
5) Customer Surveys A random telephone survey of Cleaner by Nature customers measured their experience and level of satisfaction with the professional wet cleaning process A parallel survey of dry cleanirig customers living in the same geographical area as Cleaner by Nature customers was carried out in order to compare customer experiences and attitudes with a wet cleaner to the experience and attitude of customers using dry cleaning
Section 4 Financial Assessment
For this study financial capability refers to the extent to which operating a professional wet cleaning facility can be profitable Like the other components of the evaluation an assessment of financial viability requires a series of analyses Data from Cleaner by Natures first 12 months of operation serves as the basis of this assessment Comparative data on dry cleaning were gathered from industry sources and previous reports
1) Cash Flow Assessment An analysis was undertaken of the monthly cash collected and costs incurred at the wet cleaner The purpose of this assessment was to quantify the start-up costs (including the cost of equipment installation permits and fees) as well as to evaluate at what point the revenue generated was enough to cover costs
2) ProfitLoss Assessment An analysis was undertaken of the revenues generated from garments serviced at Cleaner by Nature each month and the expenses incurred in processing these garments The purpose of this assessment was to evaluate the profitability of Cleaner by Nature and whether revenues exceeded expenses A model plant analysis was developed to evaluate how Cleaner by Nature would have performed
2-4
as a typical owner-operated cleaner at a single facility Projections were also made of Cleaner by Natures second year of operations
3) Cost Comparison ofCleaner by Nature and Dry Cleaning A comparison of the startshyup and operating costs of professional wet cleaning compared to dry cleaning was also undertaken The purpose of this analysis was to assess how the start-up costs and potential profitability of operating a wet cleaner compare to dry cleaning This analysis isolates those costs that are expected to vary in the two processes or the process dependent costs thus identifying the relative costs and savings of operating a professional wet cleaner like Cleaner by Nature compared to a dry cleaner Dry cleaner costs were based on starting up and operating a similar sized facility as Cleaner by Nature This comparative analysis draws on financial data from Cleaner by Natures first year of operation as well as information from industry sources and reports from regulatory agencies
Section 5 Environmental Assessment
For this study environmental impacts refer to the resource use or environmental pollution-inputs and pollution-related outputs associated with the wet and dry cleaning processes The starting point for this study is the viability of professional wet cleaning as a pollution prevention alternative due to its ability to eliminate the use of PCE in the professional cleaning process Substituting wet cleaning for dry cleaning may have other environmental consequences as well Data gathered throughout the demonstration period on resource use (inputs) and the emissions and waste (outputs) generated at Cleaner by Nature served as the basis for the case study of the environmental impacts of wet cleaning Comparative data on dry cleaning were gathered from industry sources and past reports A comparison of inputs and outputs from wet cleaning and dry cleaning at the plant level were used to project the environmental impacts of these two cleaning processes at the regional scale
1) Water Inputs and Outputs A quantitative measurement of water use and a qualitative assessment of water discharge in professional wet cleaning compared to dry cleaning was undertaken To quantify water the use in wet cleaning meters were installed on the wet cleaning washer and read monthly to estimate the water used per 100 garments cleaned To estimate water use per load a more intensive two-day evaluation was undertaken In addition water use was estimated for other related uses such as that of the domestic washer boiler and water conditioner Comparative data on water use in dry cleaning was based on manufacturer specifications combined with information provided by three local dry cleaners These plant level results were projected to the regional level Water discharge in wet cleaning involved sampling and analyzing effluent emitted from the wet clean washer under different load conditions
2) Energy Inputs and Outputs A quantitative assessment of energy inputs and pollution outputs from energy use in wet cleaning compared to dry cleaning was also undertaken Natural gas and electricity meters were installed on the wet clean washer and dryer to
2-5
quantify the energy used per 100 garments cleaned Natural gas and electricity use from all other equipment was estimated through a combination of manufacturer specifications conversations with manufacturers and plant observations Equipment manufacturer specifications provided comparative information on energy use by dry clean machines and other non-cleaning machine-related sources Because wet cleaning and dry cleaning use different amounts of natural gas and electricity the pollution consequences of this differential use were analyzed at the regional level
3) Chemical Inputs and Outputs A quantitative assessment of the chemical inputs and pollution outputs in wet cleaning compared to dry cleaning was the third component of the environmental evaluation Sampling of both cleaning agent and spotting chemical use was carried out at the wet cleaner The toxicity of the spotting agents used at Cleaner by Nature was assessed through material safety data sheets (MSDS) supplied by the manufacturers Comparative analysis with dry cleaning required estimating PCE input and output in dry cleaning PCE use per 100 garments cleaned was quantified based on a California Air Resources Board survey of California dry cleaners PCE emissions and hazardous waste contaminated with PCE per 100 garments cleaned were quantified using a number of regulatory agency reports In addition spotting chemicals used in dry cleaning were quantified through a survey of three local dry cleaners A regional analysis projected the change in PCE emissions and hazardous waste reduction that would result if ail dry cleaners in the region were to convert to professional wet cleaning
Section 6 Summary and Discussion
The results from the performance assessment the financial assessment and the environmental assessment were then discussed in relation to a series of contributing factors influencing the performance financial and environmental viability of wet cleaning and dry cleaning These included
I) Contributing factors influencing performance viability bull Technological changes bull Garment manufacturing issues bull Care labeling
2) Contributing factors influencing financial viability bull Technological costs bull Marketing issues bull Regulatory or legislative costs
3) Contributing factors influencing environmental viability bull Regulations and legislation
2-6
In light of these contributing factors along with the empirical results of the study each of the evaluation criteria described above were answered with respect to the question of viability Based on this analysis a series of recommendations were then developed specific to the following interested parties
bull Garment Care Industry bull Regulatory Agencies bull Stakeholder Groups bull Consumer Groups
Part II then provides the results from that analysis while Part III offers a discussion of the issues a conclusion and the recommendations
2-7
Part II
Results
Section 3
Performance Assessment of Wet Cleaning
3 Performance Assessment of Wet Cleaning
31 Overview
How does professional wet cleaning perform in terms of its ability to professionally clean dry clean only and other delicate garments under normal market conditions To answer that question a number of different approaches were undertaken in this study with each approach providing an important reference point for both the case study of Cleaner by Nature and for the comparative evaluation ofwet cleaning and dry cleaning These approaches and the results from each of the evaluations can be summarized as follows
bull A customer garment profile assessed how closely the types of garments cleaned at Cleaner by Nature mirror a typical dry cleaner
--indicates that Cleaner by Nature cleaned the volume and mix of garments that would be cleaned by a typical dry cleaner
bull A problem garment profile assessed the degree of difficulty experienced at Cleaner by Nature in successfully cleaning garments brought in by customers
--shows the most common problem areas for wet cleaning were in shrinkage colorfastness and pressing Stain removal was the most common problem area for dry cleaning relative to wet cleaning
bull A repeat clean test evaluated the technical performance ofwet cleaning and dry cleaning under normal market conditions through six repeated cleanings of 40 pairs of identical dry clean only garments
--indicates slight but not statistically significant differences between wet cleaning and dry cleaning in specific performance areas These include slightly greater problems for wet cleaning in shrinkage color change pressing and general appearance and slightly greater problems for dry cleaning in damage to the fabric or buttons
bull A survey ofthe volunteer wearers for the repeat clean test assessed whether the experience of wearing a wet cleaned garment differed from the experience ofwearing a dry cleaned garment
--indicates wearer satisfaction with both cleaning processes with slightly greater concerns about shrinkage in wet cleaning and slightly greater concerns about stretching stain removal and damage to the fabric or buttons for dry cleaning Overall differences however were not significant
bull A customer satisfaction survey assessed the opinions and experience of Cleaner by Nature customers through a random telephone survey
-- indicates strong customer satisfaction with wet cleaning with more than 90 of its customers rating Cleaner by Natures performance as good or excellent while more
3-1
than 90 of the customers were willing to recommend the business to a friend
bull A parallel suney ofdry cleaning customers assessed the opinions and experience of dry cleaning customers by a random telephone survey ofpeople residing in the same geographic area as Cleaner by Nature
-- indicates that Cleaner by Nature customer satisfaction was greater than or equivalent to the satisfaction ofdry cleaning customers in nearly all the performance areas surveyed
3-2
32 Profile of Customer Garments
METHOD
A profile of customer garments received at Cleaner by Nature during the demonstration period was undertaken to determine whether Cleaner by Natme was cleaning the volume and type of garments typically brought to a dry cleaner Four types of information were available for the profile of customers garments 1) the volume of garments cleaned 2) the type of garments cleaned (ie pants shirts) 3) the fiber type of garments cleaned 4) and the percentage of customer garments with dry clean only care labels Information on garment and fiber type and volume was-1racked by Cleaner by Natures computer cash register Fiber type and garment type information is missing for the months of October November and December as a result of computer difficulty during that period Nevertheless information for the remaining months provides a reasonable indication of the distribution of garments and fiber types cleaned during the year-long demonstration period Information about care labeling at Cleaner by Nature was gathered through an inventory of a random sample of customer garments The profile of garments received at the shop puts in context information about the number ofproblem garments received at Cleaner by Nature as well as customer satisfaction
RESULTS
321 Volume
In its first year of operation Cleaner by Nature processed 34950 garments The volume of garments processed per day increased over the course of the demonstration period In its first month Cleaner by Nature processed an average of40 garments per day Business peaked in the 11th month ofthe iear-long demonstration period when Cleaner by Nature processed 213 garments per day While Cleaner by Natures volume was small due to its status as a start-up facility the number of garments processed provides a sufficient sample to make claims about Cleaner by Natures performance The demonstration period was also of a sufficient length to track performance over time Figure 31 provides a month by month account of the number of garments cleaned per month at the facility
1 Additional data from Cleaner by Nature shows that volume at Cleaner by Nature continued to increase beyond the end of the demonstration period In May 1997 the average number of garments cleaned per day was 279
3-3
Figure 31 Garments Cleaned at Cleaner by Nature Since Opening
6000
E 5000
~ 4000 ~
0 )
3000 C u 2000e 0 1000
0 r-- r-- r-- r-- 5 I I I
r--I I I Io o gt ~ t gt o o gtil I j il Q Q 0 lt lt 2 z Q ~ lt
i Demonstration period covered the first year ofoperation (February 1996-January I 997)
322 Garment Type
The mix of garments cleaned during the first year is comparable to the garment mix processed by one large-sized area dry cleaner which provided information for the month ofJanuary 1997 Pants (25) were the garments most commonly wet cleaned at Cleaner by Nature followed by shirts and blouses (24) About 10 of items were suit and outer jackets which are more difficult to clean because they are often highly constructed and can contain linings Jackets may be under-represented because of the missing data for the colder months of November and December Appendix 3-A shows the breakdown of garments cleaned at Cleaner by Nature Figure 32 compares Cleaner by Natures garment distribution to one area dry cleaner
3-4
Figure 32 Distribution of Garments Cleaned at Cleaner by Nature and a Local Dry Cleaner
35
30
25
20
15
10
5
0 ) C I
Cleaner by Nature
Ill Dry Cleaner
Garment lype
Dry cleaner data was supplied by an area dry cleaner for January I 997 Cleaner by Nature data is from February I 1996 through September 30 1996 and for January I 997 Data forthe months of October November and December of 1996 were not available
bull Cleaner by Nature garments in the sport coatjacket category include garments listed by the wet cleaner as jackets or outer jackets Dry cleaned garments in that category were listed as either suit coats or jackets
323 Fiber Type
About 70 of the gannents cleaned at Cleaner by Nature were made of fibers that are typically labeled dry clean only The top fiber seen at Cleaner by Nature was cotton (24) followed by rayon (22) wool (18) silk (16) and linen (11) The percentage ofwool gannents cleaned during the demonstration period may be undershyrepresented because of the computer failure that corrupted data for October November and December See Figure 33 for the distribution of fibers cleaned at Cleaner by Nature
3-5
Figure 33 Fiber Types Cleaned at Cleaner by Nature During First Year of Operation (February 1996 - January 1997)
Linen 109
Wool
155
Miscbull II_
Cashmere 09
Cotton
Do11 06
Polyester 43
i Fibers represented by the dark gray color are typically labeled dry clean only and account for 702 of all garments cleaned al Cleaner by Nature Cotton polyester down and misc categories are fibers normally not labeled dry clean only This chart represents the 60 of the garments cleaned for which fiber information was available (20808134950)
bull Misc includes acrylic leather and ramie
324 Care Labeling
Care label information was obtained from garments cleaned at the Cleaner by Nature plant on three separate occasions The information was gathered at the end of the day on three separate days in January and February for all garments that had been cleaned at the plant About 67 of the garments were labeled dry clean only while the remaining garments were labeled washable either by hand or in a machine This percentage is similar to what is found at dry cleaners according to one researcher2 Figure 34 shows the distribution ofcare labels on garments cleaned at Cleaner by Nature Appendix 3-B shows that the distribution ofcare labels was similar each of the three days that the information was gathered
2 Josef Kurz Textile Care Research Programs in Gennany Proceedings of Apparel Care and the Environment
Alternative Technologies and Labeling EPA744-R-96-002 (September 1996) 64
3-6
Figure 34 Care Labels on Clothes Cleaned at Cleaner by Nature i
Hand or Hand Wash Mashine Wash or Dry CTean
Hand Wash 2 5
Machine Wash 16
2 67
i Chart based on a total of 300 garments cleaned at Cleaner by Nature Out of 300 garments 7 (23) had no care instructions
325 Garment Profile Summary
During the demonstration period Cleaner by Nature cleaned the volume and mix of garments of a typical dry cleaner While Cleaner by Natures yearly volume was small due to its status as a start-up cleaner the number of garments cleaned at the plant during the demonstration period (34950) allows for a useful evaluation of Cleaner by Natures performance
3-7
33 Analysis of Problem Garments
METHOD
During the demonstration period Cleaner by Nature kept records on four types of problem garments rejects (garments turned away by the cleaner because they could not be safely cleaned) customer claims (damaged or lost garments that need to be replaced) store credits (store credit awarded for damaged or lost garments) and redos (garments brought back by customers who felt they required additional attention) The rate ofproblems was examined over time to see whether there was a learning curve with this new technology The analysis ofproblem garments compares claims store credit and redo rates with available information for two experienced dry cleaners3 In addition the analysis compares the types ofproblems encountered by Cleaner by Nature to those encountered in dry cleaning The comparative analysis presents limitations for several reasons including the different stages ofdevelopment of the businesses and technologies being studied The comparative problem garment analysis contrasts the performance of Cleaner by Nature a start-up cleaner mastering a still evolving technology with that of well-established dry cleaners using a mature technology The comparison consequently biases in favor of dry cleaning or provides a conservative assessment of the performance of wet cleaning Furthermore the comparison of technologies may confound differences in the skill level or productivity demands of the cleaner with differences in the technologies Nevertheless the data gathered on dry cleaning provides a useful benchmark from which to evaluate Cleaner by Natures performance
RESULTS
331 Rejects There were a total of 33 items that Cleaner by Nature refused to clean during its first year or 009 of garments received Of those more than 90 were rejected because of problems with colorfastness (A cleaner will typically test a suspect garment for colorfastness prior to cleaning it) The percentage of rejects increased over time In fact Cleaner by Nature did not reject any garments in its first four months ofoperation The increase in the percentage of rejects suggests that Cleaner by Nature became more cautious with experience choosing to reject garments rather than risk claims or unsatisfied customers Table 31 shows the reject rate at Cleaner by Nature during the start-up period which is defined as the period when new cleaners were being trained and the post-start-up period Appendix 3-C provides an itemization of garments that were rejected by the cleaner No comparative information on rejects was available for dry cleaning Cleaner by Natures reject rate is comparable to that of the Greener Cleaner the USEP A demonstration site in Chicago which also wet cleaned over 99 of customer
4garments
3 For both Cleaner by Nature and dry cleaner data a 2-piece suit is counted as one claim reject or redo as is a set of pillow cases or _placemats
Center for Neighborhood Technology Alternative Clothes Cleaning Demonstration Shop Final Report (September 1996) 18
3-8
Table 31 Reject Rate at Cleaner by Nature Over Time
Number Reiected
Number Cleaned
Percent Rejected
Start-Up Period 9 15467 006 Post-Start-Up 24 19483 012 Total 33 34950 009
_ The start-up period includes the first seven months of operation - February 1996 through August 1996 The post-start-up period includes the last five months of the first year of operation - September
1996 through January 1997
332 Claims and Store Credit
Claims Cleaner by Nature reported a total of 14 claims during the data collection period (or 0031 ) of the 44860 garments cleaned as shown in Table 32 (The data collection period for claims extended beyond the demonstration period for reasons explained below) The rate of claims declined as the experience level of the cleaner increased The claims rate during the start-up period (when new cleaners were being trained) was 7 times higher than during the post-start-up period A majority of the claims (8 of 14) were for shrinkage problems
Table 32 Claims Rate at Cleaner by Nature Over Time
Number of Claims
Number Cleaned
Percent Claims
Start-UD Period 11 15467 0071 Post-Start-Up 3 29393 0010 Total 14 44860 0031
i The start-up period includes the first seven months of operation - February 1996 through August 1996 ii The post-start-up period includes September 1996 through February 1997 and March 11 through April 11 1997
Store Credits Claims refer to cash payments for lost or damaged garments In addition to cash payments Cleaner by Nature sometimes awarded store credit when a problem occurred with a garment After PPERC evaluators became aware of this policy Cleaner by Natures owner was asked to provide information on the number ofgarments and amount of store credit per garment for as many months as possible She was able to reconstruct data from memory for the months ofNovember December January and February In addition Cleaner by Nature was asked to keep records on claims and store credits from March 11 through April 11 During this five month period she reported a store credit rate of 0037 of the 21937 garments cleaned Of the customers who received either cash or store credit for lost or damaged items during that period 27 received cash claims and 73 of customers received store credit
Claims and Store Credit Combined Cleaner by Natures claims rate for the post-start-up period (0010) was combined with the store credit rate for the five months of available data on store credit (0037) to produce a combined claims and store credit rate of
3-9
0047 This rate is about half the claims rate of the Greener Cleaner in Chicago which reported a total of28 claims (009) The difference might be due to the fact that the combined claims and store credit figure is for Cleaner by Natures post-start-up period when claims had declined due to the greater experience of the cleaner5
Comparison with Dry Cleaning Comparison information on claims and store credit was gathered from one local dry cleaner Different from Cleaner by Nature the dry cleaner had a policy of awarding store credit as little as possible Because the policy variation among cleaners could result in different claims rates store credit and claims information was combined for the comparison Even using this method there are limitations to using claim and store credits as a measure of cleaning performance Some of the claims and store credits for Cleaner by Nature and the dry cleaner are for lost garments not a direct measure ofcleaning performance However these were not eliminated from the analysis because the owner of the dry cleaner used in the comparison said he suspected that spotters who ruin garments may be tempted to lose them to avoid responsibility for the damage
Cleaner by Natures combined claims and store credit rate (0047 or 11 of21937 garments cleaned) was about three times greater than the figure for the dry cleaner (0015 or 16 of 107692 items cleaned) (Table 33) Appendix 3-D lists claims and store credits for Cleaner by Nature Appendix 3-E lists claims and store credits for the dry cleaner
Table 33 Claims and Store Credit Rate at Cleaner by Nature and a Local Dry Cleaner
Claims and Store Credit Rate Cleaner by Nature
Dry Cleaner
Post-Start-Up Period 0047 0015
i The post-start-up period includes September 1996 through February 1997 and March 11 through April 11 1997
333 Garments Returned for Additional Work (Redos)
There was a total of 163 items returned for additional work during the 11 months of the demonstration period at Cleaner by Nature for which data was available or 052 of garments received (Table 34)6 Spotting (ie stain removal) was the most common reason for a redo followed by pressing and shrinkage7 (which were equally common) and colorfastness problems8
As with claims the percentage of garments returned for additional work decreased as the
Center for Neighborhood Technology Alternative Clothes Cleaning Demonstration Shop Final Report (September 1996) 18 6
Redo data was not available for August because data collection was not systematic during that period Personal communication with Deborah Davis owner Cleaner by Nature 7 Garments that experience shrinkage can often be returned to their original dimensions through pressing techniques 8 Appendix 3-F lists all the garments returned for additional work
3-10
cleaners gained more experience In the first month of the demonstration project more than 1 of garments were returned for additional work compared to a 049 redo rate two months later The lower rate did not continue at that level most likely because the second cleaner hired by Cleaner by Nature left in mid-July Data is not available for August when the redo rate would be expected to remain high as a newly hired cleaner mastered wet cleaning In the last five months there was no turnover in the cleaner position and the monthly redo rate remained steady at between 04 and 05
Table 34 Redo Rate at Cleaner by Nature Over Time
Number of Redos
Number Cleaned
Percent Redos
Start-Uv Period 86 12041 071 Post-Start-UD 77 19483 040 Total 163 31524 052
1 The start-up period includes the first seven months of operation - February 1996 through August 1996 The post-start-up period includes the last five months of the first year of operation - September
1996 through January 1997
Problem Areas An examination of the top three types of problems (shrinkage pressing and spotting) cited by customers returning garments for additional work also showed some downward trends during the first year of operation There was a general decline in the percentage of garments returned for problems related to spotting and shrinkage although pressing-related problems did not appear to decline The persistence ofpressingshyrelated problems may be in part a consequence of the high turnover of pressers Figure 35 shows the redo rates over time for shrinkage pressing and spotting problems
Overall the distribution of redos by fiber type was similar to the distribution of all garments cleaned at Cleaner by Nature by fiber type However it should be noted that customers were more likely to return silk garments for additional work than expected9
On the other hand cotton and rwon garments were less likely to be returned for additional work than expected1 Appendix 3-G provides an analysis of redos by fiber type
Certain problems were disproportionately prevalent among certain fiber types Silk garments were returned for problems related to stain removal more often than expected While 16 of garments cleaned at Cleaner by Nature were silk 39 of the 64 items returned for spotting problems were silk Wool and linen were more likely to be returned for pressing problems than expected While wool accounted for 18 ofcustomer garments it accounted for 36 of the 39 garments returned for pressing problems While 11 of customer garments were linen 18 ofgarments returned for pressing problems were linen Rayon garments were more likely to be returned due to complaints about
9 Of all the garments returned for additional work 25 were silk while only 16 of all the garments cleaned at
Cleaner by Nature were silk 10
While cotton garments comprises 18 of redos they make up 24 of the total garments cleaned While rayon garments comprise 22 of customer garments they comprise 17 ofgarments returned for additional work
3-11
shrinkage than expected While 22 of all customer garments were rayon 54 of the 39 garments returned for shrinkage problems were rayon Appendix 3-H analyzes the link between fiber type and the reason garments are returned for additional work
Figure 35 Percentage of Garments Cleaned Returned for Additional Work at Cleaner by Nature During the First Year of Operation
A Shrinkage
06
frac3405
~ 04 -cS 03
] 02 a 01
$ 00
B Pressing
C Spotting
06 -------------------------------~
05 t----------04 +----------03 +---------- 02
01
00
i
3-12
Comparison with Dry Cleaning Comparative information on the number of garments returned for additional work was made available by a local dry cleaner The dry cleaners staff also recorded the reasons customers were bringing garments back Overall the redo rate was comparable for dry cleaning and wet cleaning (Table 35) For 13256 garments cleaned during the data collection period the dry cleaner recorded 59 redos (045) compared to 163 out 31524 garments cleaned by Cleaner by Nature (052) 11 The dry cleaners redo rate is actually slightly higher than the Cleaner by Nature rate in the last five months of its first year of operation by which time the new cleanerspotter hired in July had been fully trained Out of the 19483 garments cleaned at Cleaner by Nature from September through January 77 (or 040) were returned for additional work
Table 35 Redo Rate at Cleaner by Nature and a Local Dry Cleaner
Redo Rate Cleaner by
Nature Dry Cleaner Start-Up Period 11
071 045
Post-Start-Up 111 040 045
Total 052 045
i The redo rate equals the number of redosnumber gannents cleaned ii The start-up period includes the first seven months of operation - February 1996 through August 1996 iii The post-start-up period includes the last five months of the first year of operation - September 1996
through January I 997
The comparative evaluation of items returned for additional work also allowed comparison of the types of problems encountered at Cleaner by Nature and the dry cleaner (Figure 36) The most common problem encountered by both cleaners was dissatisfaction with the spotting or stain removal However the dry cleaner was more than twice as likely to have a garment returned for additional work due to spotting problems than Cleaner by Nature The next most common problems for Cleaner by Nature were for pressing and shrinkage Cleaner by Nature was over twice as likely as the dry cleaner to have garments returned for problems related to pressing and over three times as likely to have items brought back for problems related to shrinkage although in both cases the percentage rates are extremely low While 8 items (one ofwhich is a set of leather place mats) were returned to Cleaner by Nature for dye run problems none of the dry cleaners items was returned for that reason The dry cleaner was almost four times as likely to have a garment returned due to damage than was Cleaner by Nature Again the rates are extremely small Damage accounted for only 001 of customer garments at Cleaner by Nature While no chemical smell has been a motivation for customers to choose Cleaner by Nature there were no dry cleaned garments returned due to odor problems However 4 garments were returned to Cleaner by Nature (001 ) due to dissatisfaction with the odor This could be a consequence of the heightened odor sensitivity of Cleaner by Nature customers revealed in the customer satisfaction survey 12
11 The total number of garments cleaned at Cleaner by Nature excludes August as redo data was not available for
August12 Appendix 3-1 lists all the garments returned for additional work to the dry cleaner
3-13
Figure 36 Reasons Why Garments Returned for Additional Work Cleaner by Nature and an Area Dry Cleaner
030
~ 0250
~ ii 0
020 lt g ~
015 E a 010 ~
e 0 005 ~
000 middotE amp
Cl)
u 2-~ u
gtmiddotc Cl0 c Cl)
u e iS
~
0
0 g
j
Oeaner by Nature
Dry Oeaner
i Cleaner by Nature redos are for the post-start-up period September 1996-January 1997 A toial of 19483 garments were cleaned with 77 redos (041 ) Dry Clean daia is from 33197-31597 A total 13256 garments were cleaned with 59 redos (044)
334 Summary of Problem Garments
Cleaner by Nature cleaned 998 of all gannents brought to its counter during its first year of operation The 33 items that Cleaner by Nature refused to clean were rejected chiefly due to problems with colorfastness Cleaner by Nature also tended to reject more gannents with experience All of the rejects occurred in the last eight months of the first year of operation The reject rate remained below 017 for the entire demonstration period At the same time as staff turnover subsided and the cleaner gained experience the claims rate declined over time (007 to 001 ) as did the percentage of gannents returned for additional work (0 71 to 040) For gannents returned for addition work shrinkage problems appear more prevalent among rayon gannents while spotting problems are more prevalent with silk and pressing problems appear most commonly with wool and linen gannents Both shrinkage and spotting problems declined as the experience of the cleaner increased
Although the goal is to safely clean all customer gannents most cleaners expect a certain number ofclaims and a certain number ofunsatisfied customers to return gannents for additional work whether due to cleaner error customer treatment of the
3-14
garment or manufacturing issues Dry cleanings claims and redo rate were used as a measure of Cleaner by Natures performance Looking at claims and available store credit rates together Cleaner by Natures rate was more than three times higher than the dry cleaners though less than one half of a tenth of one percent Rates at which garments were returned for additional work were comparable Fewer garments were returned to Cleaner by Nature for problems with spot removal compared to the dry cleaner but more were returned to Cleaner by Nature for problems related to shrinkage and pressing
Specific methodological issues associated with these comparisons should also be noted Redos provides a better comparative data than claims and store credit since there is more standard record-keeping for redos In addition redo practices tend to be widely accepted among cleaners while willingness to compensate a customer for a claim of damage may have greater variation Thus data on redos is more likely to reflect the performance problems ofa cleaner than data on claims and store credit which may be a reflection of other variables such as the business practices of a particular professional cleaner
Analyses from the Repeat Clean Test and the customer satisfaction survey presented in the next two sections of this report also presents a more substantial source of data to evaluate and compares compare wet cleaning and dry cleaning performance
3-15
34 Repeat Clean Test
METHOD
The repeat clean test compares the performance ofwet cleaning and dry cleaning on garments labeled dry clean only after repeated cleaning and wear
Study Design A paired comparison design was selected as the most appropriate experimental approach A total of three identical sets of40 dry clean only labeled garments were obtained for the test 13 Ofthese sets one was repeatedly wet cleaned six times another repeatedly dry cleaned six times and a-third was stored for comparison purposes For each pair of identical garments that was either repeatedly wet cleaned or dry cleaned a volunteer was recruited to wear each of the two garments before each of the six cleanings Trained evaluators each with a background in textile science evaluated the garments for dimensional change general appearance color change color migration and odor 14 The test protocol for each of the outcome measures was adapted from the American Association ofTextile Chemists and Colorists (AATCC) Technical Manual The Repeat Clean Test was a triple- blinded study Neither the wet cleaner nor the dry cleaners knew the identity of the test garments At the same time neither the wearers nor the evaluators were informed as to which garments were being dry cleaned and which garments were being wet cleaned15 The test was similar in design to one conducted by the Center for Neighborhood Technology (CNT) in Chicago in 1995-1996
Sample Selection The sample ofdry clean only garments was purposefully selected to represent the garment types and characteristics that represent the greatest challenge to wet cleaning Dry cleaners and textile experts on the Projects Advisory Committee assisted with the sample selection (see Appendix 3-J) There were eight different garment types represented in the sample shirtsblouses pants skirts dresses jackets sweaters vests and ties Fiber types included acetate acrylic cashmere linen polyester rayon silk and wool In addition a representative sample of woven vs knit tailored vs unstructured and light medium and dark colors was chosen
Treatment The identical garments were cleaned six times at Cleaner by Nature and six times at one of three different local dry cleaners These dry cleaners were selected for
tJ Of the 40 sets of three test garments 16 were donated by GAPBanana Republic The rest were purchased from catalogues14 The repeat clean test also assessed resiliency stain and soil removal and hand (or feel) The results from these tests are not reported here It is important to note that wet cleaned and dry cleaned garments performed similarly for each of these tests 15 The repeat clean test was structured to limit any influences independent of the cleaning process Choosing identical pairs of garments meant that the wet cleaned garments and dry cleaned garments were identical in terms of characteristics known to affect the quality of garments - including fabrication fiber and construction Using the same volunteer to wear the identical pair of garments meant that any influence a wearer of a garment may have on its subsequent quality would be similar for the wet cleaned garment and the dry cleaned garment Blinding the cleaners the wearers and the evaluators meant that no knowledge about the identity of the experimental garments would influence how a garment was cleaned worn or evaluated These design features increased the likelihood that any difference detected between the wet cleaned garments and dry cleaned garments was due to how they were cleaned and not to other factors
3-16
their reputation for quality and were also in a similar price range to Cleaner by Nature The presidents of the California Fabricare Institute and the Greater Los Angeles Dry Cleaning Association assisted in the selection All the cleaners participating in the test were informed that test garments would be brought to their facility though none were told which were the test garments
Technical Evaluation ofGarments The evaluation of the garments for the repeat clean test was carried out by professors and graduate students from the Department ofFamily and Consumer Sciences at California State University Long Beach (CSULB) Apparel Design and Merchandising Professors Sue Stanley and Hazel Jackson assisted in garment selection developed the test materials and supervised and participated in the evaluation at the CSULB Apparel Design Laboratory Prior to the intake evaluation the evaluators underwent a one-day training for use of AA TCC test methods William Eyring who supervised the Center for Neighborhood Technologys Repeat Clean Test assisted with the training Each set of garments was evaluated three times -- at intake (before the garments were cleaned) after the first cleaning and after the sixth (and final) cleaning 16
Garments were randomly assigned with each garment evaluated by at least two evaluators Evaluation forms were used to record data on odor general appearance resiliency color change stain and soil removal hand and dimensional change For the final evaluation four questions were added regarding acceptability of general appearance feel and pressing as well as the quality of pressing (see Appendix 3-K)17
341 Dimensional Change Evaluation
This test method quantified the dimensional change of garments after being professionally cleaned Dimensional change refers to the variation in length andor width of a garment after cleaning
METHOD
All garments were measured during the intake evaluation which was done prior to the garments being worn and cleaned and at the final evaluation which took place after the six cleanings Various lengthwise ( or vertical) measurements and widthwise (or horizontal) measurements were taken for each of the eight garment types represented in the sample ( eg length of pants inseam width of dress waist) At least three measurements were taken on each garment for a total of 26 specific garment measurements (See Appendix 3-L) Guidelines similar to the Center for Neighborhood Technologys Repeat Clean Test were used in performing the garment measurements As a check on the reliability of evaluator measurement each garment was measured by two
16 AATCC considers five cleanings sufficient to test a garments performance in a cleaning process Because a minimum of five cleanings is considered standard for a repeat clean test findings from the first evaluation carried out after the first cleaning are not reported here 17
These questions were Is the general appearance of this garment acceptable How well is the garment pressed compared to the identical test garment ls the pressing of this garment acceptable Is the feel of this garment acceptable None of these questions were covered by any of AATCCs protocols
3-17
different evaluators at the intake evaluation as well as at the final evaluation 18
For each garment measurement dimensional change was calculated as the difference between the initial measurement and the final measurement divided by the initial measurement 19 When the final measurement was shorter than the original measurement dimensional change was expressed as a negative percent designating shrinkage When the final measurement was longer than the initial one dimensional change was expressed as a positive percent designating stretching To calculate the total lengthwise and widthwise dimensional change for garments with two length measurements (eg pants inseam and outseam) or two width measurements (egjackets across the shoulder and sleeve circumference) the total amount ofchange between intake and final measurements for the two measures was added together and divided by the total of the two intake measurements20
While there were originally 40 pairs of garments evaluated at intake the dimensional change for 4 lengthwise and 5 widthwise measurements could not be used in the dimensional change analysis21 Thus the dimensional change analysis was based on 36 lengthwise measurements and 35 widthwise measurements
18 See Appendix 3-M for the methods used to increase precision of the measurements used in the repeat clean test Because dimensional change is calculated as a percent for initial measurements that are small slight differences between intake and final resulted in large percent changes that did not correspond with a change in the fit of the garment Garment measurements less than IO centimeters were considered small When these measures were the only lengthwise or widthwise measurement available they were eliminated from the analysis The width of the three ties were the only measurements that needed to be eliminated Because there was little difference between the dimensional change for wet cleaning and dry cleaning for these measures their elimination did not influence the relative difference between wet cleaning and dry cleaning for dimensional change 19 AITCC test method 158-1990 was used as a guide for the dimensional change calculations 20 See Appendix 3-N for a listing all the measurements for the garments21 The four lengthwise measurements that could not be used included One jacket which was eliminated after the first cleaning because of severe color change and fabric damage in both wet cleaning and dry cleaning two pairs of pants that were hemmed after intake to accommodate a wearer yet the re-measurements were lost and one tie in which a large discrepancy between evaluators could not be resolved The five widthwise measurements that could not be used included the jacket which was eliminated after the first cleaning the widths of the three ties which were all smaller than IO centimeters and one pant waist in which a large discrepancy between evaluators could not be resolved
3-18
RESULTS
All Garments
Figure 3 7 shows the distribution of dimensional change for the 36 lengthwise and 35 widthwise measurements22 Half of all wet cleaned garments shrank or stretched less than 2 in both the lengthwise dimension (18 of36) and widthwise dimension (18 of 35) Similarly approximately half of the dry cleaned garments experienced less than 2 dimensional change in length (21 of 36) and width (17 of 35)
Taking the average dimensional change it is possible to evaluate the relative magnitude of dimensional change in comparing the wet cleaned and dry cleaned garments The average lengthwise dimensional change was 265 for wet cleaning and 235 for dry cleaning or 030 greater in wet cleaning (See Table 35) 23 In terms of width of the test garments overall dimensional change was virtually identical 296 in the wet cleaned garments and 297 in the dry cleaned garments There were thus no statistically significant differences in the amount of dimensional change for wet cleaned and dry cleaned garments in either the lengthwise or the widthwise direction 24
22 One lengthwise and one widthwise measure was chosen to represent the length and width of each garment when there were two measurements The middle back measurement represented the lengthwise measure for blouses dresses jackets sweaters and vests The outseam and backseam represented length for pants and skirts With measures were across the shoulder for jackets across the back for vests the wide width of ties 23 For each garment when there were two lengthwise or widthwise measures the dimensional change was a weighted average of the two measures (see METIIOD section above) 24 The Wilcoxon Signed-Rank Test was used to test whether the amount ofdimensional change for a garment that was wet cleaned was significantly different than if the garment was dry cleaned Because the data were both paired and continuous a paired I-test could also have been used Yet the paired I-test assumes that the data are normally distributed - not a necessary assumption when using the Wilcoxon Signed-Rank Test (See Glantz Stanton Primer of Biostatistics McGraw-Hill 1981 p338) There was a sufficient degree of skewness and kurtosis suggesting the data was not normally distributed
3-19
Figure 37 Distribution of Dimensional Change for Wet Cleaned and Dry Cleaned Garments
A Distribution of Lengthwise Dimensional Change
ii ~
E 0 C -E ~
25 ---------------------------------
20 ----------------
Wet Oean
-------------J Dry aean
15 i-----------------1
J 10 -----------
gt-4 -2 to -4
Shrinkage
-2 to +2 +2to +4 gt+4
Stretching Dimensional Change
B Distribution of Widthwise Dimensional Change
18
16 ---------1 Wet Qean
14 Dry aean
i 12 E 10 0-C 8 c E 6 ~
4
2
0
gt-4 -2 lo -4 -210 +2 +2to+4 gt+4
Shrinkage Stretching Dimensional Change
3-20
Garment Characteristics Influencing Dimensional Change
There are a number of qualities of a garment known to influence dimensional change when a garment is cleaned including type of fabrication (woven vs knit) garment construction (tailored vs unstructured) and fiber (eg wool rayon etc) The sample of forty test garments was purposefully selected to reflect a balance of these qualities to both mirror the distribution of garments taken to dry cleaners as well as to provide enou~h garments within each category to provide meaningful analysis of each key category 5 Table 36 also summarizes how these different garment characteristics influenced the dimensional change oftest garments when they were wet cleaned and dry cleaned26
Fabrication For woven garments the average dimensional change in length and width was substantially smaller than for knit garments whether wet cleaned or dry cleaned The difference in dimensional change between wet cleaning and dry cleaning was smaller for woven garments and greater for knit garments in both the lengthwise direction and the widthwise direction
Construction Tailored garments on average experienced substantially less dimensional change in length and width compared to unstructured garments While tailored garments that were wet cleaned experienced more dimensional change in length and width than when the identical garment was dry cleaned unstructured garments experienced more dimensional change in length and width when dry cleaned than when wet cleaned
Fiber21 For rayon garments the average dimensional change in length and width was
substantially greater than the average for all garments while silk and linen garments experienced less dimensional change compared to the sample as a whole regardless of whether the garment was wet cleaned or dry cleaned For wool garments there was less change in length and greater change in width compared to the average for all garments regardless of whether the garment was wet cleaned or dry cleaned When wet cleaned rayon garments experienced less dimensional change while wool garments shrank or stretched more in wet cleaning than in dry cleaning Linen garments had the greatest difference in dimensional change between wet cleaning and dry cleaning Wet cleaned linen garments shrank or stretched over one percent more in the length than when the same linen garments were dry cleaned Finally the origin of the fiber appeared to have some influence on dimensional change Natural fiber garments shrank or stretched less than manufactured fiber garments regardless ofcleaning method In addition garments
Ofthe 40 test garments the distribution of key garment characteristics was as follows Fabrication - 32 pairs of woven (80) and 8 pairs ofknit (20) Construction - 26 pairs of tailored (65) and 14 pairs ofunstructured (35) Fiber- 13 pairs of rayon (325) 11 pairs ofsilk (275) 8 pairs of wool (20) and 6 pairs oflinen (15) Gannents were grouped into the fiber categories based on if the shell was made from only one fiber or based on the predominant fiber for shells made from a fiber blend There were two gannents (a pair of acetaterayon pants and polyesterrayon skirts) where the garment represented the only gannent for the predominant fiber Because 4 lengthwise measures and 5 widthwise measures could not be used in the analysis there may be fewer pairs in each category than in the original sample 26
Appendix 3-0 shows the distribution oftest gannents by fabric construction and origin of fiber 27
It is important to note that a number ofgarments also included a lining which was usually made out of a different fiber than the shell
3-21
made from natural fibers experienced more lengthwise dimensional change when wet cleaned while garments made from manufactured fibers experienced more lengthwise dimensional change when dry cleaned
Table 36 Dimensional Change for Identical Dry Clean Only Garments Repeatedly Wet Cleaned and Dry Cleaned
Groupine Len h - Dimensional Chanee Width - Dimensional Chanee (n)1 Wet Clean Dry Clean (n) Wet Clean Dry Clean
All garments 36 265 235 35 296 297
Fabrication Woven 29 220 205 28 218 214
Knit 7 448 358 7 608 631
Construction Tailored 22 237 175 21 224 187 Unstructured 14 307 330 14 403 471
Fiber JOO amp Blends
Rayon 12 326 328 12 309 352 Silk 1() 231 192 8 218 184 Wool 7 260 238 7 359 414 Linen 5 264 130 6 251 257
Origin
Natural 11 21 251 195 19 298 303
Manufactured 111 11 260 329 11 390 396
i (n refers to the number of pairs of garments- one that was wet cleaned and one that was dry cleaned ii Natural fibers include all wool silk linen or blends ofnatural fibers (including cotton) iii Manufactured fibers include rayon polyester acetate or blends of manufactured fibers (including acrylic)
As a whole while dimensional change varied substantially depending on a garments construction and the fabric and fiber used within each of these garment characteristics there was not a great deal ofdifference in dimensional change if the garment was wet cleaned or dry cleaned Statistical analysis revealed that for none of the garment fabric construction or fiber qualities were the differences in dimensional change between wet cleaning and dry cleaning significant28
middot
28 The Wilcoxon Sign-Rank Test was used to evaluate the significance of differences Length of linen garments was
the garment characteristic with the lowest p-value - 00947 A p-value less than 005 is the standard usually used to signify a qualitative difference in response
3-22
342 General Appearance Evaluation
METHOD
Evaluators were asked to assess the general appearance of the wet cleaned and dry cleaned garments including consistency of garment color tears rips or split seams missing buttons trim shoulder pads and any other appearance factors not otherwise noted Evaluators also assessed the overall appearance of the garment29 During the final evaluation evaluators were asked to judge whether the pressing and the general appearance of the garment was acceptable If one of the evaluators detected a problem with general appearance of the garment it was recorded as a finding However for opinion questions about the acceptability of the garments the garment was considered unacceptable only if both evaluators were in agreement
RESULTS
Table 3 7 shows the distribution of evaluator responses characterizing the overall general appearance ofidenticai garments that had been repeatedly wet cleaned and dry cleaned It identifies cases where a problem was identified with one garment in the pair but not with the other (defined as Discordant Pairs) and cases where the evaluator was either satisfied with both pairs or dissatisfied with both pairs (defined as Concordant Pairs)
The results from the assessment of Color Consistency are explained in detail to facilitate understanding ofTable 37 Reading from left-to right Table 37 shows that 5 pairs of garments were identified in which there was a problem with color consistency for the wet cleaned garment but not the dry cleaned garment of the pair On the other hand there were 2 pairs of garments in which color consistency problems were identified for the dry cleaned but not for the wet cleaned garment In addition 2 pairs were identified as having a color consistency problem for both the wet cleaned and dry cleaned garments Finally there were 30 garment pairs in which no color consistency problems were identified in either the wet cleaned or dry cleaned garment Thus the data shows that for most garment pairs (30 of 39) color consistency was not a problem whether the garment was wet cleaned or dry cleaned For 2 garment pairs there were color consistency problems no matter which cleaning method was used Finally when there was a problem with one of the garments in a pair but not the other more of the problems were associated with the wet cleaned garment in the pair (5 vs 2)
In evaluating garment damage and problems with buttons there were slightly more problems for dry cleaned than for wet cleaned garments It should be noted that damage to garments may be considered a problem for both processes since problems were identified in both the wet cleaned and dry cleaned garment for fifteen of the garment pairs On the other hand there were few problems with the trim or shoulder pads detected
29 When an evaluator described a problem under Other Appearance Factors or Overall Appearance that fit into one
of the more specific categories but was not noted in the specific category the comment was moved to the more specific category See Appendix 3-K
3-23
for either the wet cleaned or dry cleaned garment Finally stains and soils were noted for slightly more dry cleaned garments compared to wet cleaned garments though there were more problems identified for both wet cleaned and dry cleaned garments (for ten of the pairs)
Table 37 General Appearance Evaluation
Discordant Pairs Concordant Pairs
Performance Oualitv Yes-WC No -DCii
No -WC Yes-DC
Yes-WC Yes-DC
No-WC No-DC
Color Consistencv Problems 5 2 2 30 Tears Rips Split Seams 111 6 8 15 10 Button Problems 1 4 3 31 Trim Problems 1 0 0 38 Shoulder Pad Problems 1 1 1 36 Stains or Soil Evaluation 3 5 10 21
i WC = wet cleaned garment in pair ii DC = dry cleaned gannent in pair iii Category also includes loose seams fabric damage hanging or pulling threads
After assessing the general appearance of the test garments evaluators were asked whether the overall general appearance of the garment was acceptable In addition the quality of the pressing of the gamient was evaluated (see Table 38) Most garment pairs were judged to be acceptably pressed (35 of 39) and to have an acceptable general appearance (32 of 40) Among the remaining pairs both garments were considered unacceptably pressed (2) or to have an unacceptable appearance in half the cases (4)30 In the few cases where there was a split it was more likely that the wet cleaned garment was judged as unacceptable 2 vs 0 for pressing and 3 vs 1 for general appearance
Table 38 Acceptability of General Appearance and Pressing i
Discordant Pairs Concordant Pairs
Acceotabilitv Ratine Yes-WC No -DCm
No -WC Yes-DC
Yes-WC Yes-DC
No-WC No-DC
Pressing Acceptable 0 2 35 2 Gen Avvearance Accevtable 1 3 32 4
i These questions are not covered by an AATCC protocol ii WC = wet cleaned garment in pair iii DC= dry cleaned gannent in pair
0 During the first evaluation one garment pair was eliminated from further evaluation because the appearance of both
garments in the pair was considered unacceptable The pair was included as one of the four garments in this category
3-24
343 Color Change Evaluation
METHOD
When viewing each test garment evaluators were asked if they observed a visible change in the color and ifthere was evidence of color migration Ifcolor change or color migration was observed the intensity ofchange andor migration was quantified using the AATCC Gray Scale for Color Change rating and the AATCC Chromatic Transference Scale Evaluators visually compared the color of the wet or dry cleaned garment with the control garment A grade of 5 was given ifthere was no perceived difference in color between the control garments and test garments that had been repeatedly cleaned A grade of 1 was given for maximum change The chromatic transference rating is used to quantify the degree to which color transfer has occurred in garments where color transfer was observed For garments that have exhibited a transfer of color a Chromatic Transference Scale rating (from 5 to 1) was completed31
RESULTS
In over half the garment pairs (21 of39) visible color change was observed in both the wet and dry cleaned garment (Table 39) When there was a visible color change in only one of the garments in a pair it was twice as likely that it was in the wet cleaned garment than in the dry cleaned garment Only for 6 garment pairs was no color change observed in either garment Thu~ there was color change in 69 ofwet cleaned garments (27 of 39) and 62 of dry cleaned garments (24 of 39) indicating color change problems for both cleaning processes On the other hand color migration appears to be more of a problem among the wet cleaned garments While for most pairs (33 of 39) no color migration was observed in either garment for 4 pairs color migration occurred for only the wet cleaned garment while in just one pair was there change in only the dry cleaned garment
Table 39 Color Change Evaluation
Discordant Pairs Concordant Pairs
Performance Quality Yes-WC No -DCii
No -WC Yes-DC
Yes-WC Yes- DC
No-WC No-DC
Visible Color ChanJe 6 3 21 9 Visible Color Miwation 4 1 2 32
i WC = wet cleaned garment in pair ii DC= dry cleaned gannent in pair
31 The gray scale grade of each garment was the average rating given by the two evaluators
3-25
Table 310 shows that in terms of the degree ofcolor change the average for wet cleaned garments was 442 ( over half a point lower than the no color change rating of 5)32 The average color change for dry clean garments was 455 just slightly higher than the color change rating among wet clean garments
Table 310 Gray Scale for Color Change i
Cleanin2 Method n Minimum Maximum Mean Wet Cleaning 38 275 50 442 Drv Cleaning 38 175 50 455
i Color change ranged from 5 (no change) to I (maximum change)
Table 311 shows that the average degree of color migration for wet cleaned garments was 363 The average color migration score for dry cleaned garments experiencing color migration was 417 - almost a half a point less intense than the wet clean score
Table 311 Chromatic Transference Scale i
Cleanin2 Method n Minimum Maximum Mean Wet Cleaning 6 30 45 363 Drv Cleaning 3 40 45 417
i Chromatic transference scale ranged from 5 (no change) to I (maximum change)
32 If both evaluators observed color change or color migration an average of the two scores was used
3-26
344 Odor Evaluation
METHOD
The odor evaluation was the first evaluation completed by the evaluators since it required the garment to be tested before the plastic bag covering was removed Evaluators made a slit in the plastic bag near the center of the front of the garment and inhaled through the hole Evaluators recorded whether or not the garment had an odor and then described the kind ofodor detected The questions were open ended The responses were JOded after the evaluation
RESULTS
Table 312 shows that most evaluators were able to detect some odor in practically all of the garments -- 81 (32 of39) of the wet cleaned garments and 95 (37 of39) of the dry cleaned garments Significantly more garments smelled clean when wet cleaned than when dry cleaned33 Significantly more of the dry cleaned garments had a chemical or dry cleaning smell All odors however were considered acceptable
Table 312 Odor Evaluation
Discordant Pairs Concordant Pairs
Performance Quality Yes-WC No -DCii
No -WC Yes-DC
Yes-WC Yes-DC
No-WC No-DC
Garment Has Odor l 6 31 l Smells Clean 9 l l 28 Smells like Chemical l 12 2 24 Smells like Drv Cleaninf 4 18 3 14 Odor UnaccefJ(able 0 0 39 0
1 WC = wet cleaned garment in pair ii OC = dry cleaned garment in pair
McNemar s test for changes was used to assess whether there was a significant difference in how identical garments responded to wet cleaning or dry cleaning when the response variable was categorical (See Glantz Stanton Primer of Biostatistics McGraw-Hill 1981 p261)
3-27
345 Summary of Repeat Clean Test
The repeat clean test compared how wet cleaning and dry cleaning performed on 40 sets of identical garments after repeated cleaning and wear The average percentage of dimensional change experienced by wet cleaned garments and identical dry cleaned garments was almost identical in a widthwise direction (296 vs 297) In a lengthwise direction wet cleaned garments experience a dimensional change that was 031 greater than for the identical dry cleaned garments (265 vs 235) While the absolute amount of dimensional change varied by garment qualities known to affect dimensional change (eg greater change in knits less change in linen) within each of these subgroups the relative difference between wet cleaned and dry cleaned garments did not vary substantially This subgroup analysis not only provides a check on the internal validity of the data itself(ie factors varying according to expectation) but also suggests that the overall greater lengthwise dimensional change of 031 for wet cleaned garments may be relatively accurate For a garment length of 75 centimeters this difference of 031 is 23 millimeters greater for the wet cleaned garments as compared to the dry clean garments
Color consistency and color migration were the areas where slightly greater problems for wet cleaning were most noted although overall changes in color for both wet clean and dry clean garments were seen as comparable There were also slightly greater problems in the areas ofpressing and general appearance in wet cleaning while there were slightly greater problems for dry cleaning in damage io the fabric or buttons Substantially more evaluators identified a chemical or dry cleaning odor for the dry cleaned garments although all garments had an acceptable odor
Comparison With Other Repeat Clean Tests
The results from the dimensional analysis from this study can be compared to studies undertaken by the Center for Neighborhood Technology (CNT) and Environment Canada which also used the repeat clean test to evaluate the performance ofmachineshybased wet cleaning under market conditions34 Both the comparison of average dimensional change and the comparison of dimensional change greater than 4 revealed consistent results Woven garments that were wet cleaned showed a slightly greater amount of dimensional change in the length compared to identical dry cleaned garments yet the widthwise change was practically the same or slightly less among the garments that had been repeatedly wet cleaned Knit garments experienced more dimensional change when wet cleaned than when the identical garment was dry cleaned Yet wearers of the knit garments which experience a greater than 4 change were for the most part not aware of that change See Appendix 4-N for a detailed discussion of this comparison
34 Center for Neighborhood Technology Alternative Clothes Cleaning Demonstration Shop Final Report (September 1996) Environment Canada Final Report for the Green Gean Project (Sarnia Ontario October 1995)
3-28
35 Wearer Survey
METHOD
A survey of the volunteer wearers who participated in the Repeat Clean Test assessed whether wearing a garment that was wet cleaned differed from the experience ofwearing an identical garment that was dry cleaned This survey serves as a parallel evaluation to the Repeat Clean Test and allows an analysis of the relationship between customer satisfaction and technical performance The 28 volunteer wearers who participated in the Repeat Clean Test were given a written questionnaire in December following the fifth of six cleanings (The questionnaire could not have been easily administered after the sixth cleaning because the garments needed to be immediately taken to the lab for evaluation) Of the 28 volunteers 12 wore two sets of identical garments As with the Repeat Clean Test the experimental design of the Wearer Survey is that of a paired comparison test Like the evaluators for the Repeat Clean Test the wearers were also blinded They identified the garments by codes that were placed on care labels or sewn into the garment
Wearers were recruited among UCLA staff and students though none had any affiliation with PPERC or the project Each volunteer wore no more than two pairs of garments Consequently some wearers filled out questionnaires for two sets of garments Most of the wearers wore the garments throughout the test
The Wearer Survey questions miITOr those asked in the customer satisfaction surveys and the Repeat Clean Test Wearers were asked whether they noticed problems for each of the garments in the pair including problems related to unpleasant odor pressing shrinkage and stretching color change feel stain removal damaged buttons or decoration Wearers were then asked about their overall and relative satisfaction with each of the garments One question was asked to determine whether the customers knew which garment was the wet cleaned garment to determine whether their attitudes about wet cleaning and dry cleaning may have influenced their assessment of the two garments
RESULTS
351 Performance Quality Wet Cleaning and Dry Cleaning
Each wearer was asked to evaluate their experience wearing each of the garments in the pair One set of questions related to a set of positive performance qualities (eg cleanliness satisfaction with pressing) and another related to negative performance qualities (eg shrinkage discoloration) Table 314 shows the distribution ofwearer responses to questions about positive performance qualities while Table 315 shows wearer responses to questions about negative performance qualities The Tables divide the responses to the questions into cases where the wearer was satisfied with one garment in the pair but not with the other (Discordant Pairs) and cases where the wearer was either satisfied with both pairs or dissatisfied with both pairs (Concordant Pairs)
3-29
The first variable Satisfaction with Pressing is explained in detail to facilitate understanding of Table 313 Reading from left to right the Table 3 14 shows that one respondent was unsatisfied with the pressing of a dry cleaned garment while being satisfied with the pressing of its wet cleaned pair Three respondents were dissatisfied with the pressing of a wet cleaned garment and satisfied with the pressing of its dry cleaned pair Meanwhile 33 respondents were satisfied with the pressing ofboth garments in the set and two were dissatisfied with the pressing ofboth garments While not statistically significant the table shows slightly more dissatisfaction with the pressing of the wet cleaned garments Satisfaction with general appearance and stain removal was virtually the same for both processes
Table 313 Positive Performance Qualities Distribution of Wearer Responses
Discordant Pairs Concordant Pairs
Performance Oualitv Yes-WC No -DC
No -WC Yes-DC
Yes-WC Yes-DC
No-WC No-DC
Satisfied with Dressing 1 3 33 2 Satisfied with stain removal 0 0 3 2 Satisfied with annearance 4 5 25 6
i WC = wet cleaned gament in pair ii DC= dry cleaned garment in pair
Table 314 shows that slightly more wearers noted shrinkage problems in wet cleaning w~ule slightly more wearers noted stretching problems in dry cleaning Problems with discoloration rips or tears buttons or feel were the same or virtually the same for both the wet cleaned and the dry cleaned garments
Table 314 Negative Performance Qualities Distribution of Wearer Responses
Discordant Pairs Concordant Pairs
Performance Quality Yes-WC No -DCii
No -WC Yes-DC
Yes-WC Yes-DC
No-WC No-DC
Shrinka~e 3 1 1 35 Stretching 0 2 0 38 Discoloration 0 0 4 35 Feels worse 1 0 0 38 Rips or tears 2 2 1 35 Damaged buttons 2 1 0 37
i WC = wet cleaned garment in pair ii DC= dry cleaned garment in pair
3-30
352 Overall Satisfaction Wet Cleaning and Dry Cleaning
Wearers were also asked whether they preferred wearing one garment over another For most of the garments (606) wearers responded that they had no preference However for those who did have a preference twice as many preferred wearing the garment that was wet cleaned to the garment that was dry cleaned See Table 315 and Table 316
Table 315 Percent with Preference for Wearing One Garment in Pair
Resoonse Freauencv Percent Yes 13 333 No 23 606 Dont know 3 77
Table 316 Preference of Wearing Wet Cleaned or Dry Cleaned Garment
Preference Freauencv Percent Wet Clean Garment 9 692 Drv Clean Garment 4 308
i Since wearers were blinded as to which garment was being wet cleaned and which dry cleaned the survey asked the wearer to Tlte down the number associated with the specific garment for which they had a preference
Wearers were also asked if they thought they knew which was the wet cleaned garment This question was used to determine whether wearers knowledge of the treatment might influence their responses in the questionnaire Most of the wearers (59) said they did not know which was the wet cleaned garment (Table 317) For the 16 who thought they knew nine guessed incorrectly suggesting that the survey was not contaminated by the wearers ability to guess which treatment was used for which garment (Table 318)
Table 317 Percent of Wearers Who Thought They Could Identify Wet Cleaned Garment
Freauencv Percent Yes 16 410 No 25 590
Table 318 Wearers Identification ofWet Clean Garment
Correctly Identified Incorrectly Identified Wet Cleaned Wet Cleaned Garment
Garment Number of Survevs 7 9
3-31
353 Wearer Survey Summary
The wearers did not notice any significant difference between wet cleaned garments and dry cleaned garments in terms of shrinkage stretching pressing color change spot removal odor damage or appearance of the garment More wearers identified more shrinkage and pressing problems in the wet cleaned garments while more wearers identified stretching problems for the dry cleaned garments For the 13 respondents who had a preference twice as many preferred wearing the garment that was wet cleaned over the garment that was dry cleaned
3-32
36 Customer Satisfaction with Wet Cleaning
Because professional garment care is a service industry customer satisfaction is an important measure ofperformance and a key indicator ofperformance viability In order to measure customer satisfaction with Cleaner by Nature two surveys were conducted The first a telephone survey of customers who used Cleaner by Nature at least once is part of the case study of Cleaner by Nature The purpose of the survey was to measure satisfaction with and attitudes toward this professional cleaner The second was a telephone survey ofdry cleaning customers who live in or near Cleaner by Natures market area The purpose of this survey was to assist in evaluating the results of the Cleaner by Nature survey by comparing it with customers satisfaction with dry cleaning
361 Cleaner by Nature Customer Satisfaction Survey
METHOD
A random telephone survey of Cleaner by Nature customers was conducted in March of 1997 to measure their satisfaction with the performance of wet cleaning35 A primary goal of the survey was to gauge customer satisfaction with Cleaner by Nature A secondary goal was to formulate a profile of Cleaner by Nature customers and their motivations for choosing wet cleaning The survey was anonymous and provided customers the privacy to reveal any problems they may have had with the wet cleaning process Since wet cleaning is a new technology even customers motivated by ideological (eg pro-environment) reasons could still be skeptical of this new process The survey instrument was designed to identify whether there is interaction between customer satisfaction with performance and environmental commitment A blocked random sampling methodology discussed below permits generalizing the results to all customers The phone numbers were provided by the Cleaner by Nature cash register which tracks customer information including the number of transactions per customer
Survey Instrument The survey focused on six general areas A question about customers initial motivation for choosing Cleaner by Nature helped to identify customer attitudes toward wet cleaning and dry cleaning including ideological motivations for choosing wet cleaning Another set ofquestions focused on specific cleaning-related problems (ie stain removal shrinkage etc) A third set ofquestions explored customer satisfaction with Cleaner by Nature including questions about whether customers who were continuing to use Cleaner by Nature were also continuing to use dry cleaning Because it was expected that most or all customers would have used dry cleaning some time in the past customers were able to evaluate wet cleaning relative to their experience with dry cleaning A fourth set ofquestions focused on customers standard for judging the quality of cleaning at Cleaner by Nature Because Cleaner by
The survey instrument was designed with input from the projects Advisory Committee and in consultation with Professor Elaine Vaughan of University of California Irvine
3-33
Nature marketed itself as a safer alternative to dry cleaning it became important to explore the link between satisfaction with Cleaner by Nature and pro-environmental attitudes Customers who identified problems with garments after they were cleaned at Cleaner by Nature were asked if they were more or less willing to overlook those problems and why They were also asked if they examined their garments more closely than they would have if they had been dry cleaned A fifth set of questions gauged customer understanding of wet cleaning by asking if they were aware of the use ofwater in the process and how they felt about it A final set of questions established the socioshyeconomic status of customers The survey instrument is included in Appendix 3-Q
Profile ofCustomer Base During its first year Cleaner by Nature served a total of 1966 customers Of those 54 (more than 1000) were recorded as having three or more transactions36 This is a conservative estimate of the proportion of repeat customers since some of those with two recorded transactions are probably also repeat customers Customers may have more than one transaction on a given visit depending on the size of the order or whether some garments are going to be tailored or laundered Consequently a customer could be recorded as having multiple transactions on a first visit Cleaner by Nature also had a large proportion of customers with two or fewer transactions (46) In addition Cleaner by Nature has a group ofloyal customers About 8 of the customers are responsible for 47 of the transactions
Sampling A sample size of 150 was determined adequate to meet the needs of the analysis In all 180 surveys were conducted The sample was selected to be large enough to permit a comparison between those with more experience (three transactions or more) at Cleaner by Nature and those with less (two transactions or fewer) After initial calling it became apparent that the response rate for those with two or fewer transactions was lower than for those with 3 or more There was concern that those with two or fewer transactions might not have returned to Cleaner by Nature because of dissatisfaction and that by under-sampling that population the results would be biased in favor of Cleaner by Nature Consequently the sampling method was changed from a conventional random sampling technique to a blocked random sample Those with two or fewer transactions were over-sampled to compensate for the lower response rate However there was a lag between the time that the customer information was obtained and the implementation of the survey During that time several of those with two or fewer transactions had conducted more transactions This contributed to the fact that those with two or fewer transactions were under-sampled While 46 of customers from the February 1996 through January 1997 database provided by Cleaner by Nature had two or fewer transactions 37 of those who were called in March 1997 had two or fewer transactions according to a database downloaded from the Cleaner by Nature computer cash register in early April
Response Rate The customer response rate to the Cleaner by Nature survey was 78 (180 surveys out of a total of23 l contacts) This response rate is high enough to insure that a representative sample of customers was reached
bullbull Each time a customer came into the cleaner a new transaction was recorded If a customer brought in more than five items at any one time an additional transaction was added for each additional set of five items
3-34
RESULTS
3 611 Customer Experience ofCleaner by Nature Performance
Customesect were asked a series of questions relating to how well Cleaner by Nature performed in caring for their garments Table 319 summarizes questions relating to positive performance attributes that professional cleaners seek to maximize while Table 321 summarizes questions relating to negative performance attributes that professional cleaners seek to minimize All questions relate to how frequently the customers experience these attributes
More than three quarters of customers reported their garments were always clean and that they were always satisfied with how they were pressed On the other hand for customers who brought gannents to Cleaner by Nature with spots or stains less than half of customers said that stains were always removed to their satisfaction although more than three quarters of the customers (786) were always or frequently satisfied with stain removal
Table 319 Positive Performance Qualities Experienced by Cleaner by Nature Customers
Performance Quality Always Frequently Sometimes Never Clean 884 81 23 12
Satisfied with pressing 758 152 61 30
Satisfied with stain removal 475 311 139 74
Over 80 of Cleaner by Nature customers interviewed reported never experiencing any shrinkage stretching change in color change in feel bad odor rips or tears or damage to buttons or decorations (Table 20)37 Of these issues shrinkage problems were most common with more than 15 ofcustomers interviewed having shrinkage in the garments cleaned at Cleaner by Nature at least some of the time
Note Negative change in color and feel were derived from two questions how often was there a change in color or feel and was the change an improvement or not an improvement In addition for the type of change in color we interpreted unevenness in color as not an improvement
3-35
37
Table 320 Negative Performance Qualities Experienced by Cleaner by Nature Customers
Performance Oualitv Never Sometimes FreQuentlv Alwavs Shrinkage 841 129 18 12
Stretching 929 60 06 06
Change in color 923 47 24 06
Change in feel 887 94 13 07
Odor 941 36 00 24
Rips or tears 959 41 00 00
Damage to buttons or decorations
957 36 07 00
In sum looking at each of these ten performance measures individually customers surveyed reported high satisfaction with how their garments were treated Stain removal was revealed as the biggest problem over half of the customers surveyed who took clothes to Cleaner by Nature with spots or stains reported that they were not always removed to their satisfaction In addition 25 ofcustomers interviewed were not satisfied at least some of the time with how their garments were pressed Finally over 15 of customers surveyed experienced shrinkage for at least some of their garments
Evaluating these ten performance measures collectively revealed that half of the people surveyed who came to Cleaner by Nature at least once (91 out of 180) reported experiencing some problem with at least one of the ten performance measures Yet when asked directly whether they had any problems with garments after they were cleaned at Cleaner by Nature only 26 said yes Thus half the time when a customer experienced some difficulty with one of the performance measures it did not translate into the customers opinion that they had experienced a problem with the garment
3-36
3612 Overall Satisfaction with Cleaner by Nature
A number of questions in the survey were designed to directly or indirectly assess overall satisfaction with Cleaner by Nature for customers surveyed
Cleaner by Nature customers were asked to rate Cleaner by Nature as a professional cleaning service More than 60 of the 180 customers surveyed rated Cleaner by Nature as excellent and 32 rated it as good while only 46 rated it as fair and 23 rated it as poor (Table 321)
Table 321 Customer Rating of Cleaner by Nature as a Professional Cleaner
Ratine Frequency Percent Excellent 105 607 Good 56 324 Fair 8 46 Poor 4 23
When asked whether they would recommend Cleaner by Nature to a friend 93 of those surveyed said they would while 68 said they would not or didnt know (Table 322) Not surprisingly how customers rated Cieaner by Nature was highly correlated with whether they would recommend it to a friend all but four of the 161 customers interviewed who rated Cleaner by Nature as excellent or good also would recommend it to a friend while only 3 ofthe 12 customers rating Cleaner by Nature as fair or poor would recommend it to a friend (plt0001)
Table 322 Would Customer Recommend Cleaner by Nature to a Friend
Recommend Frequency Percent Yes 150 932 No 11 68
A key way to measure customer satisfaction is to see what proportion of customers continue to use Cleaner by Nature Of all Cleaner by Nature customers surveyed over three-fourths (778) said they were still a Cleaner by Nature customer (Table 323)
Table 323 Percent Who Still Consider Themselves Cleaner by Nature Customers
Frequency Percent Yes 136 778 No 39 222
3-37
Of the 39 customers who stopped using Cleaner by Nature less than 25 (n=9) mentioned cleaning quality as the first reason why they stopped over 40 (n=16) mentioned location while slightly more than 20 (n=8) said price and slightly more than 15 (n=6) said service quality (Table 324) As one would suspect the primary reasons38 customers gave for why they stopped using Cleaner by Nature were closely related to their overall rating of Cleaner by Nature and whether they would recommend Cleaner by Nature to a friend Three-fourths of those who stopped primarily because of cleaning quality rated Cleaner by Nature as fair or poor while 27 people who stopped because of location inconvenience or price rated Cleaner by Nature as excellent or good (plt0001)39 Ifwe assume that all the customers who stopped primarily because of location or convenience would have continued to use Cleaner by Nature ifit were more conveniently located then the proportion who would still be customers is 886 - nearly as high as Cleaner by Natures overall rating and the percentage ofcustomers who would recommend Cleaner by Nature to a friend
Table 324 Primary Reason for No Longer Using Cleaner by Nature
Freauencv Percent Location 16 410 Cleaning Quality 9 231 Price 8 205 Service or Convenience 6 154
A fourth measure ofoverall satisfaction has to do with the proportion of customers who exclusively use Cleaner by Nature as a professional cleaning service Of the customers who continue to use Cleaner by Nature 646 (84 of 130) exclusively use the wet cleaner as their professional cleaning service (Table 325)
Table 325 Cleaner by Nature Customers Continuing to Use Dry Cleaning
Percent Taken to Dry Cleaner Frequency Percent Cleaner bv Nature Onlv 84 646 Cleaner by Nature and Dry Cleaning 46 354
38 The first reason people mention in an open-ended question is usually assumed to be their primary reason 39 The relationship between why people stopped using Cleaner by Nature and their overall rating of Cleaner by Nature was mirrored almost identically in the responses to questions of why people stopped using Cleaner by Nature and whether they would recommend Cleaner by Nature to a friend
3-38
In addition three-fourths of Cleaner by Nature customers who continue to use dry cleaning take less than 25 of their garments to the dry cleaner (Table 326)
Table 326 Proportion of Garments Cleaner by Nature Customers Take to Dry Cleaners
Percent Taken to Drv Cleaner Freauency Percent 25 or Less 27 765 More than 26 8 235
Of the Cleaner by Nature customers surveyed who continue to use dry cleaning 293 (12 of 41) mentioned cleaning quality as the first reason why they continued40
while 439 mentioned location or convenience 146 mentioned price and 122 mentioned service or tum around time (Table 327) It is reasonable to assume that if all Cleaner by Nature customers who continued using dry cleaning because of location issues lived in a more convenient location they would use Cleaner by Nature On the other hand Cleaner by Nature has actually increased its prices since the survey was completed Thus those Cleaner by Nature customers mentioning price as the primary reason for continuing to use dry cleaning are likely to continue using dry cleaning
Table 327 Primary Reason Why Cleaner by Nature Customers Also Use Dry Cleaning
Reason Frequency Percent
LocationConvenience 18 439
Cleaning Quality 12 293
Price 6 146
Tum around time 5 122
Because most customers who were willing to try Cleaner by Nature at least once were likely to have used dry cleaning services it was possible to evaluate these customers experiences ofand opinions about Cleaner by Nature compared to dry cleaning In fact all customers interviewed said they had used dry cleaning in the past Table 328 summarizes the results from this comparison When asked to compare which was better for the environment all customers stated Cleaner by Nature Yet when asked which is less expensive 37 said dry cleaning compared to 22 who thought Cleaner by Nature was cheaper On the other hand a plurality (41 ) said that they were the same price or that it depended on the dry cleaner used for comparison In terms ofquality of cleaning almost three-fourths of customers favored the performance ofCleaner by Nature while only five percent favored dry cleaning Finally 86 of customers who
bullbull Four of the 46 Cleaner by Nature customers who continued using dry cleaning did not answer why they continued
3-39
were willing to try Cleaner by Nature at least once were more satisfied overall with Cleaner by Nature
Table 328 Customer Comparison of Cleaner by Nature to Dry Cleaning
Cleaner by Dry Depends Nature Cleanine Same on Cleaner
Environment 1000 00 00 00
Price 216 373 284 127
Quality of Cleaning 735 58 206 00
Overall Satisfaction 859 103 38 00
362 Cleaner by Nature Customer Satisfaction Survey Summary
In sum customers using Cleaner by Nature at least once appear well satisfied with how this wet cleaner performs as a professional cleaning service over 90 rated Cleaner by Nature excellent or good over 90 would recommend Cleaner by Nature to a friend over 75 were still customers over 50 who stop using it do so because oflocation or convenience 65 ofcontinuing customers use only Cleaner by Nature over threeshyquarters ofcontinuing Cleaner by Natwe customers who also use dry cleaning take 25 or less of their garments to be cleaned to the dry cleaner and the primary reason why Cleaner by Nature customers also use dry cleaning is because oflocation or convenience In terms of cleaning quality far more customers favored Cleaner by Nature (735) than dry cleaning (58)
Because Cleaner by Nature markets itself as an environmentally friendly and healthier alternative to dry cleaning the extent to which customers choose to use Cleaner by Nature for environmental or health-related reasons may very well influence how satisfied they are with the performance of Cleaner by Nature That is a self-selection liias may have occurred Ifself-selection bias did occur then customers who listed health or environmental reasons for first choosing or continuing to use Cleaner by Nature would have reported fewer performance problems and had a higher level of satisfaction than those who did not list those reasons Yet customers who chose to use Cleaner by Nature for healthenvironmental reasons were just as likely to report problems with performance and had a somewhat lower level of overall satisfaction than other customers This suggest that self-selection bias was unlikely to have influenced the overall results Therefore the experience and satisfaction level reported by Cleaner by Nature customers in this survey can be more readily generalized to all dry cleaning customers if they tried using wet cleaning as a professional cleaning service (See Appendix 3-R for a more detailed discussion)
3-40
363 Dry Cleaning Customer Survey
In order to evaluate how customer satisfaction with Cleaner by Nature compared to satisfaction with dry cleaning
METHOD
The survey conducted in May 1997 provides a baseline from which to analyze the results of the Cleaner by Nature satisfaction survey Like the survey of Cleaner by Nature customers the dry cleaner customer survey was also anonymous The phone numbers used in the survey had the same distribution ofprefixes as the respondents to the Cleaner by Nature survey The last four digits were randomly selected
Survey Instrument As with the Cleaner by Nature survey a series of questions was included to measure respondents overall satisfaction with dry cleaning as well as with the dry cleaner they use regularly In addition the dry cleaner survey included a set of questions about the frequency of specific cleaning-related problems (ie stain removal shrinkage etc) Because respondents were expected to have much greater experience with dry cleaning than Cleaner by Nature customers (and consequently greater opportunity for problems) the response category rarely which is not included in the Cleaner by Nature survey was added to the dry cleaner survey This category was designed to be coupled with never for the analysis so as to avoid a bias against dry cleaning For example the percentage ofcustomers who never or rarely experienced color change in dry cleaning would be compared with those who never experienced color change in wet cleaning In addition one survey question asked customers to identify the price category of the dry cleaners they used This question was included in the questionnaire to see if there is a relationship between satisfaction with dry cleaning and price In this way Cleaner by Nature a moderately priced cleaner could be compared to moderate to high-priced dry cleaners Also a question was included to gauge customers knowledge of the dry cleaning process Customers were asked whether they knew that a chemical solvent was used in dry cleaning while Cleaner by Nature customers had been asked if they knew that water was used at Cleaner by Nature Questions about frequency of use and customers motivations for selecting their dry cleaners served to provide a profile ofrespondents Finally questions were asked about age education income and ethnicity to determine whether the dry cleaning customers had a similar demographic distribution to Cleaner by Nature customers The survey instrument is included in Appendix 3-S
Sample Size A sample size of 100 was determined adequate to meet the needs of a comparative analysis with the Cleaner by Nature survey
Response Rate The customer response rate to the Dry Clean survey was 36 (100 surveys out of a total of250 contacts)41
41 The possibility of a response bias is discussed in 364 (Dry Cleaning Customer Survey Summary)
3-41
RESULTS
3631 Quality ofPerformance Cleaner by Nature and Dry Cleaning
Dry cleaning customers were asked a series of questions relating to how well dry cleaning performed in caring for their garments Because Cleaner by Nature customers were asked the same questions responses from these two customer groups can be compared Some Cleaner by Nature customers may not have had enough experience to judge the frequency with which problems occurred Therefore only experienced customers defined as those with six or more transactions were used for this analysis
Table 329 summarizes how experienced Cleaner by Nature customers and dry cleaning customers responded to questions relating to three positive performance qualities that professional cleaners seek to maximize While nearly all experienced Cleaner by Nature customers reported that their garments were frequently or always clean after getting them back from the wet cleaner significantly fewer (less than 80 ) dry cleaner customers reported that their garments were frequently or always clean after being dry cleaned (plt0001) While the satisfaction with pressing appeared comparable between the two groups less than half of dry cleaning customers said that they were frequently or always satisfied with how spots were removed while significantly more (almost 80) experienced Cleaner by Nature customers reported being frequently or always satisfied with stain removal at the wet cleaner plt0001)
Table 329 Positive Performance Qualities Experie~ced by Cleaner by Nature Customers and Dry Cleaner Customers
Performance Professional Cleaner Frequently Never Rarely Oualitv or Always or Sometimes
Clean Cleaner by Nature 962 38 Drv Cleanim 790 190
Pressing Cleaner by Nature 896 104 Drv Cleaning 838 162
Stain Removal Cleaner by Nature 797 203 middot Drv Cleanine 490 510
i Cleaner by Nature customers with six or more transactions ii Only dry clean customers were asked whether these performance attributes occurred rarely
3-42
Table 330 summarizes how experienced Cleaner by Nature customers and dry cleaning customers performed on seven performance qualities that professional cleaners seek to minimize
Table 330 Negative Performance Qualities Experienced by Cleaner by Nature Customers and Dry Cleaning Customers
Sometimes Rarelyii Frequently
Performance Quality Professional Cleaner or Never or Always
Shrinkage Cleaner by Nature 740 260 Dry Cleaning 810 190
Stretching Cleaner by Nature 868 132 Dry Cleaning 860 140
Rips or Tears Cleaner by Nature 910 90 Dry Cleaning 890 110
Color Change Cleaner by Nature 904 96 Drv Cleaning 790 210
Change in Feel Cleaner by Nature 831 129 Drv Cleaning 663 337
Damage to Buttons iii Cleaner by Nature 961 39 Dry Cleaning 630 370
Unpleasant Odor Cleaner by Nature 1000 00 Drv Cleaning 727 283
Cleaner by Nature customers with six or more transactions ii Only dry cleaner customers were asked whether performance attribute occurred rarely iii This category also includes damage to decorations
Seventy-four percent of experienced Cleaner by Nature customers reported that they had never experienced any shrinkage in garments cleaned at the wet cleaner On the other hand 81 of dry clean customers reported that shrinkage had never or rarely occurred Wet clean and dry clean customers reported a similar rate ofstretching and rips or tears in their garments after getting them back from the cleaner42 However dry cleaning customers reported significantly greater problems with a change in the color of garments (plt005) a change in the feel of garments (plt005) damage to buttons or decorations (plt0001) and garments coming back with an unpleasant smell (plt005)43
42 21 of dry clean customers reported that stretching had occurred rarely 27 of dry clean customers reported that
rips or tears occurred rarely 43
The Chi Square Test was used to evaluate the significance ofdifferences between Cleaner by Nature and dry clean customers A p-value less than 005 is the standard usually used to signify a qualitative difference in response (See
3-43
3632 Overall Satisfaction Cleaner by Nature and Dry Cleaning
Customers experience with the quality of cleaning is expected to influence their opinion of a professional cleaning service as well as how they use this service Whether these opinions and behaviors differ between customers using Cleaner by Nature and those using dry cleaning will be explored in this section This section includes all Cleaner by Nature customers and not only those with a high level of experience
Table 331 shows that a slightly higher proportion of Cleaner by Nature customers rated this wet cleaner as excellent or good compared to how dry cleaning customers rated the dry cleaner they used regularly (931 vs 866) This difference in overall rating increased when dry clean customers were asked to rate dry cleaning overall - only 69 of Cleaner by Nature customers rated it as fair or poor while 200 of dry clean customers rated dry cleaning overall as fair or poor
Table 331 Customer Rating of Professional Cleaners Cleaner by Nature Customers vs Dry Cleaning Customers
Professional Cleaner Excellent Good
Fair Poor
Cleaner by Nature 911 69
Dry Cleaner Used Regularly
Dry Cleaning Overall
866
800
134
200
i Ory cleaning customer ratings of cleaner they use regularly
1n addition a similar proportion ofcustomers would recommend Cleaner by Nature to a friend as customers would recommend the dry cleaner they use regularly to a friend (See Table 332)
Table 332 Customer Recommendation of Cleaner to a Friend Cleaner by Nature and Dry Cleaning Customers
Professional Cleaner Percent
Cleaner by ~ature 932 Drv Cleaner 877
i For only dry cleaner customcn who use only one cleaner regularly
Glantz Stanton Primer of Biostatistics McGraw-Hill 1981 p130)
3-44
On the other hand over half of the dry cleaning customers surveyed reported that they had stopped using a dry cleaner during the past year while less than a quarter of Cleaner by Nature customers reported that they were no longer using Cleaner by Nature (Table 333)
Table 333 Stopped Using Professional Cleaner in the Last Year
Professional Cleaner Percent
Cleaner by Nature 227 Dry Cleaner 540
This is for all Cleaner by Nature customers
Table 334 shows that the distribution ofreasons given for why customers who stopped using Cleaner by Nature or a dry cleaner in the past year is quite similar The proportion of Cleaner by Nature customers stating quality ofcleaning or price as the primary reasons why they stopped using this wet cleaner is similar to the proportion of dry cleaning customers who listed these as primary reasons On the other hand almost twice as many Cleaner by Nature customers mentioned location as the primary reason for discontinuing use of the wet cleaner while almost twice as many dry cleaning customers mentioned serviceconvenience middot
Table 334 Primary reason customers stopped using professional cleaner Cleaner by Nature Customers and Dry Cleaning Customers
Quality of Service Professional Cleaner Location Cleaninl Price Convenience
Cleaner by Nature 429 286 143 143 Dry Cleaning 235 353 157 255
i This is for all Cleaner by Nature customers
Finally the proportion ofcustomers who continue to use Cleaner by Nature and who also use a dry cleaner is similar to the proportion ofdry cleaning customers who use two or more dry cleaners (See Table 335)
Table 335 Percent of customers using more than one cleaner
Professional Cleaner Percent
Cleaner by Nature 354 Drv Cleaner 330
i This is for all continuing Cleaner by Nature customers
3-45
364 Dry Cleaning Customer Survey Summary
Customers who used Cleaner by Nature at least once reported being equally if not more satisfied with this wet cleaner when compared to customers using dry cleaning In terms ofparticular qualities of performance a significantly higher proportion of experienced Cleaner by Nature customers reported that their garments were always or frequently clean and that stains were always or frequently removed compared with dry cleaning customers In addition compared to customers using dry cleaning services significantly fewer experienced Cleaner by Nature customers reported problems with color change change in the feel of garments damage to buttons and decorations andor unpleasant odor after getting their clothes back from the cleaner
In terms ofoverall customer satisfaction customers using Cleaner by Nature at least one time report being equally ifnot more satisfied with Cleaner by Nature as dry cleaning customers are with dry cleaning While more than 90 of Cleaner by Nature customers rated this wet cleaner as excellent or good a similar proportion of dry clean customers rated the dry cleaner they used regularly as excellent or good The proportion of customers who would recommend the wet cleaner or the dry cleaner they used regularly was equally high More than half the dry clean customers stopped using a dry cleaner in the last year while less than a quarter of its customers stopped using Cleaner by Nature For those customers no longer using Cleaner by Nature or who stopped using a dry cleaner in the past year a similar proportion identified quality of cleaning as the primary reason for discontinuing use Finally the proportion ofcustomers who continue to use Cleaner by Nature and who also use dry cleaning is similar to the proportion of dry clean customers who use two or more dry cleaners
Since the survey of Cleaner by Nature customers was carried out fifteen months after the business opened customers surveyed were evaluating Cleaner by Nature with at most fifteen months of experience On the other hand it was assumed that dry cleaning customers were able to base their judgments of dry cleaning on many more years of experience This difference in experience was taken into account in both the construction of the dry cleaner survey itself as well as in the way that Cleaner by Nature customer responses were compared to dry clean customers When asking dry clean customers questions about the performance ofdry cleaning (eg shrinkage) customers were asked whether the problem occurred never rarely sometimes frequently or always Cleaner by Nature customers were not asked whether the issue occurred rarely Thus if Cleaner by Nature customers ever experienced this problem they would report that it occurred at least sometimes By grouping dry clean customers who stated that a problem occurred rarely with those that reported never a problem would have had to occur more than rarely to report that it happened sometimes The fact that the dry cleaning customers who were surveyed extensively utilized the rarely category validates this approach as an effective strategy for accounting for difference in experience For example 33 ofdry clean customers said that shrinkage rarely occurred while 34 said that color change rarely occurred
3-46
A second strategy was developed for the positively worded performance questions - quality ofpressing stain removal and cleanliness In the analysis stage customers who reported that one of these qualities (eg satisfied with pressing) occurred frequently or always were grouped together Thus grouping customers who had the experience of having a problem and reported frequently with those that reported always helps adjust for the difference in experience between dry clean customers and Cleaner by Nature customers for these positively worded questions The fact that none of the dry clean customers surveyed stated that they were always satisfied with pressing verifies this strategy
Because the response rate for the dry clean customer survey (36) was substantially lower than the response rate of the Clearier by Nature survey (78) the possibility that a response rate bias may have occurred needs to be evaluated A response bias would have occurred if those dry clean customers who completed the survey felt more negatively about dry cleaning than did those dry clean customers not responding This would have resulted in a sample that did not adequately represent the experiences and opinions of all dry clean customers by over-representing individuals with negative experiences and attitudes and thus under-representing individuals with more positive experiences or attitudes The results however indicate that 80 of dry clean customers interviewed for the survey rated dry cleaning overall as excellent or good (see Table 333) thus indicating a positive rather than negative opinion of dry cleaning Thus based on the responses from this survey it is very unlikely that the customers completing the survey over-represented customers with negative attitudes who use dry cleaning These results suggest that a response bias does not appear to be operating
3-47
37 Summary Analysis of Performance Assessment
Profile of Customer Garments During the demonstration period Cleaner by Nature cleaned virtually all of the customer garments (998) received When the cleaner rejected garments it was usually due to problems with colorfastness Furthermore the cleaner cleaned the volume and mix of garments of a typical dry cleaner About 67 ofCleaner by Nature garments were labeled dry clean only While Cleaner by Natures yearly volume was small due to its status as a start-up cleaner the number of garments cleaned at the plant during the demonstration period (34950) allowed for an evaluation of Cleaner by Natures performance
Problem Garments During the demonstration period Cleaner by Nature kept records on three types of problem garments aside from the rejected garments mentioned above customer claims (damaged or lost garments that need to be replaced) store credits (store credit awarded for damaged or lost garments) and redos (garments brought back by customers who felt they required additional attention) The combined claim rate and store credit rate for the post-start-up period (0047) was small below one half of one tenth of one percent The rate at which Cleaner by Nature customers returned garments for additional work during the post-start-up period (040) was on par with another local cleaner Cleaner by Nature has become more skilled at avoiding problems over time with greater experience (particularly those related to spotting and shrinkage) either through improved cleaning techniques or by rejecting a larger percentage of garments that may present dye-run problems
Repeat Clean Test A technical performance evaluation compared how wet cleaning and dry cleaning performed on 40 sets of identical garments after repeated cleaning and wear Color consistency and color migration were the areas where slightly greater problems for wet cleaning were most noted although overall changes in color for both wet cleaned and dry cleaned garments were seen as comparable There was slightly greater dimensional change for wet cleaning although the difference in average width and length measurement between the two processes was less than one third of one percent The technical evaluation also found only slight differences in most other performance areas There were also slightly greater problems in the areas ofpressing and general appearance for wet cleaning while there were slightly greater problems for dry cleaning in damage to the fabric or buttons Substantially more evaluators identified a chemical or dry cleaning odor for the dry cleaned garments although all garments had an acceptable odor Volunteers wearing the test garments indicated greater overall satisfaction with the wet cleaned garments with slightly greater shrinkage in wet cleaned garments and slightly greater stretching problems with stain removal and damage to fabrics or buttons in dry cleaned garments
3-48
Customer Satisfaction Surveys Customers who used Cleaner by Nature at least once reported being equally ifnot more satisfied with this wet cleaner when compared to customers using dry cleaning A significantly higher proportion of Cleaner by Nature customers experienced greater satisfaction with how clean their garments were and experienced few problems with stain removal compared to customers who use dry cleaning In addition compared to customers using dry cleaning services significantly fewer experienced Cleaner by Nature customers reported problems with color change change in the feel of garments damage to buttons and decorations andor unpleasant odor after getting their clothes back from the cleaner Shrinkage was the only performance area where a slightly higher proportion ofwet cleaning customers compared to dry cleaning customers experienced problems some of the time but not at a level that was statistically significant
In terms ofoverall customer satisfaction more than 90 of Cleaner by Nature customers rated this wet cleaner as excellent or good slightly more than the percentage of dry cleaning customers who gave the same rating to the dry cleaner they use regularly Similarly about 90 of Cleaner by Nature customers and dry cleaning customers would recommend their cleaner to a friend For those customers no longer using Cleaner by Nature or who stopped using a dry cleaner in the past year a similar proportion identified quality of cleaning as the primary reason for leaving Finally the proportion of customers who continue to use Cleaner by Nature but still use dry cleaning is similar to the proportion ofdry clean customers who use two or more dry cleaners
3-49
Section 4
Financial Assessment of Wet Cleaning
4 Financial Assessment of Wet Cleaning
41 Overview
The second major component of the evaluation is an assessment of the financial viability of professional wet cleaning The evaluation includes a case study of the financial performance of Cleaner by Nature through its first year of operation and a comparative analysis of the equipment and operating costs of wet cleaning and dry cleaning
The analysis and results of the case study include
bull A start-up cost analysis quantifies the costs during its first year related to starting the business
Cleaner by Nature spent $96523 on its first-year one-time start-up costs and needed an additional $48048 in operating capital to reach a positive cash balance Adjusting these costs for a typical owner-operated cleaner in a single facility oneshytime costs would have amounted to $78035 and additional operating costs would have totaled $38235
bull A profitloss analysis measures the profitability of Cleaner by Nature by matching monthly expenses incurred in wet cleaning garments with the revenues generated from cleaning those garments -- Cleaner by Natures financial picture improved significantly during its first year
While losses were recorded for the year as a whole by its fourth quarter Cleaner by Nature was making a profit of 3 Had Cleaner by Nature operated like a typical owner-operated cleaner in a single facility it would have made a 10 profit in its fourth quarter Revenues continued to increase after the first year of operation with profits in the second year projected to be more than 17
bull A pressing productivity analysis assesses the rate at which garments were pressed at Cleaner by Nature during its first year of operation
The number of garments pressed per hour at Cleaner by Nature increased by about 25 after special tensioning equipment was purchased
The second part of the financial assessment is a comparative analysis of the costs of starting up and operating a wet cleaner compared to a dry cleaner This analysis isolates those costs that are expected to vary in the two processes or the processshydependent costs and identifies the relative costs and savings of operating a wet cleaner like Cleaner by Nature For this section a model plant analysis was undertaken that draws on financial data from Cleaner by Natures first year of operation This analysis includes
4-1
bull An equipment cost comparison contrasts the purchase and maintenance costs of the cleaning systems pressing equipment boilers and other equipment used in wet cleaning and dry cleaning -- The cost of purchasing wet clean equipment was 9 less than the purchase cost of
dry cleaning equipment while the yearly expense associated with using and maintaining plant equipment was 31 less for wet cleaning than dry cleaning
bull A pressing time comparison analyzes the pressing productivity at Cleaner by Nature and two area dry cleaners while also comparing that infonnation with other pressing time studies -- It took Cleaner by Natures pressers 13 to 21 times longer to press garments
compared to two local dry cleaners Another pressing time study that was better able to control for key confounding variables indicated a 15 to 25 increase in pressing time for wet cleaning compared to dry cleaning Cleaner by Natures pressing wages as a percentage of revenues however were more in line with industry expectations
bull An overall cost comparison isolates a11 costs central to the operation of a professional cleaner in order to contrast how those costs vary in wet cleaning and dry cleaning -- While labor costs and soap costs were higher in wet cleaning the expenses
associated with purchasing and maintaining equipment and complying with government regulations were greater in dry cleaning Total operating costs were broadly comparable for wet cleaning and dry cleaning Dry cleaning costs can be greater when additional costs associated with reducing chemical-related liability exposure are factored in
Both the case study and the cost comparison focus on single small-sized cleaners A number of economic social and political factors may significantly influence both the start-up and operating costs and potential profitability of a wet cleaner or a dry cleaner These factors include changes in care labeling laws the development of other alternatives to dry cleaning technology changes and their influence on future equipment costs and the potential financial liability associated with PCE dry cleaning These factors are touched upon in this section and explored in more detail in the Discussion Section (Section VI)
4-2
42 Cleaner by Nature Case Study
421 Start-Up Costs
Start-up costs include the one-time costs associated with getting Cleaner by Nature up and running as well as the operating capital necessary to run the business to the point where it begins to generate a positive cash balance (that is there is more cash coming in than going out) 1 One-time costs include all costs paid before the business opened equipment purchases made during the first year and the advertising campaign which ran through the third quarter of the first year In addition to generalize these startshyup costs to reflect what a typical wet cleaner that operates from a single location is likely to pay the start-up cost estimate also removed certain costs particular to Cleaner by Nature (for example rent and insurance for its second location) while adding those costs usually paid by a professional cleaner (including the labor cost for the owner who worked at the counter without pay)
METHOD
Monthly revenues collected and line item costs incurred from the pre-opening period through the first year of operation were assembled from financial records provided by Cleaner by Natures owner Data was collected both from business spread sheets of itemized expenditures and revenues as well as directly from the financial records of the business Copies of lease and loan agreements were provided Computations from raw financial records were carried out to verify the accuracy of information assembled on spread sheets
RESULTS
Cleaner by Nature spent a total of $144571 in start-up costs through its first year of operation This included $96523 in one-time costs related to starting up the business and $48048 in operating capital (Table 41 ) An explanation of these costs is given below
One-Time Costs Related to Start-Up Almost half of the $96523 in start-up costs (or $46924) were associated with the purchase and installation of equipment at the plant and drop-shop2 Most of the plant equipment was obtained through a five-year capital lease which covered the purchase of pressing cleaning and spotting equipment the boiler the water conditioner the air compressor freight and partial installation costs Monthly lease
1 Business Start-Up Guide Dry Cleaning Entrepreneur Business Guide No 1037 Entrepreneur Group 1993 p 1037-145 2 Appendix 4-D provides an inventory of plant equipment
4-3
payments were $1642 A major capital cost not covered by the lease was the purchase eight months after the opening of the plant of tensioning equipment a Hi-Steam form fitter and a pant topper 3 The combined cost of the form fitter and pant topper came to $13531 including installation The second largest start-up cost was Cleaner by Natures first year advertising campaign which totaled$ I84914 This expense reflected the owners marketing background and her interest in future expansion
Table 41 Start-Up Costs at Cleaner by Nature
ONE-TIME COSTS Rent - first and last month Initial lnvento Equipment and Installation
Out of pocket $43640 Ca ital lease $3284 (first and last a ment)
Insurance Workers comp Business Auto
Tenant Im rovement Travel Vehicle Loan Miscellaneous
$1195 (3 months) $302 (2 months) $443 (6 months)
1 Cleaner
$7100 $3979
$46924
$18491 $306
$1231 $3088 $2099
$3554 $5375
$419 $3957
i One-time costs and operating capital of a typical cleaner excludes costs related to operating a plant and an agency at separate locations and the advertising costs associated with the expansion plans for the business but includes costs associated with unpaid wodc performed by the owner
Operating Capital In addition to the one-time start-up costs Cleaner by Nature needed $48048 in operating capital during the first year of operation while it was building up a customer base and costs paid out still exceeded cash collected (calculated on a per month basis) By the beginning of the second year it could be assumed that Cleaner by Nature had begun to sustain a positive cash balance with more cash coming into the business
3 These two pieces of new equipment replaced the reconditioned form fitter and pant topper that Cleaner by Nature originally purchased for $4200 4 These costs refer only to Cleaner by Natures first year advertising campaign An additional $4826 in yearly expenditures have been identified as on-going advertising costs
4-4
than going out While Cleaner by Nature showed a positive cash balance by December 1996 its eleventh month of operation there was a negative cash balance of $4995 in January 1997 (See Appendix 4-A) Januarys negative cash balance was due not to a decline in business but to unusual expenses paid in January This included an extra pay period ($4600) prepaid business insurance covering the whole second year ($920) and auto insurance covering the first six months of the second year ($443) While February 1997 had revenues equivalent to January 1997 (See Figure 41) it had only two (not three) pay periods and no unusual pre-paid costs thus the assumption of a positive cash balance by the beginning of the second year5 In subsequent months past the first year of operation moreover revenues continued to increase
Start-Up Costs for a Typical Cleaner Cleaner by Natures start-up costs are likely to be higher than a wet cleaner whose operations would be similar to a typical comer cleaner Cleaner by Nature had higher payroll costs than a typical comer cleaner because of operating a plant and drop-off site separately Cleaner by Nature has a van and driver on staff expenses that a start-up cleaner with a plant on the premises might not incur Because of the two locations the division of labor is more strict For example a counter person cannot take on assembly responsibilities In addition utility building maintenance and security costs are higher due to this arrangement In order to understand how Cleaner by Nature might have fared if it had been a comer cleaner with a plant on the premises several identifiable costs related to Cleaner by Natures operation of two locations were eliminated6 Those costs included payroll for the driver loan payments and operating costs for the delivery van auto and workers compensation insurance and the extra rent7 In addition the suggested cost of grand opening advertising for a dry cleaner is identified as no greater than $23008 Cleaner by Natures grand opening advertising campaign of $18491 was $16191 greater than expected On the other hand Cleaner by Natures owner (who is not a cleaner) worked at the counter during the first year of operation without being paid9 Adding in this counter labor cost lowering the grand opening advertising and removing certain costs associated with operating at two locations would have lowered by $18488 the one-time start-up costs (to $78035) and the operating capital by $9813 (to $38235) (Table 41) Thus if Cleaner by Nature was set up as a typical comer cleaner with a plant on the premises and normal advertising costs the total start-up costs (one-time costs plus operating capital) would have been $116270
5 In addition this assumes that all other costs remained the same 6 While there are also utility costs and extra labor costs besides the driver associated with operating at two sites these extra costs were difficult to estimate and thus were not included Excluding these costs makes the total estimate of reduced costs conservative 7 These costs added $2297 to one-time start-up costs and $14805 to operating costs Appendix 4A shows the expenses for the driver and van purchase and use Auto insurance for the van was $442 per quarter Reduced worker compensation amounted to $200 for the year The reduction of rent was estimated at $250 per month The combined plant and drop-off site rent was $3550 per month for most of the demonstration period If Cleaner by Nature had operated a 1500 square foot facility at the site of the drop-off shop the cost of rent would have been approximately $3300 bull based on the existing size of the drop-off site and the square foot cost of this site 8 Business Start-Up Guide Dry Cleaning Entrepreneur Business Guide No 1037 Entrepreneur Group I993 p 1037-14S 9 The owner worked at the counter 20 hours per week for the first six months and 12 hours per week for the second half of the first year This would have added $4992 in labor costs if this labor was perfonned by a member of the staff
4-5
422 Cleaner by Natures Profit and Loss
To calculate the profit and loss of a business an accrual method of accounting has been used While the cash basis of accounting (cash flow infonnation) identifies what cash is needed to pay bills on a monthly basis by itself it can present an incomplete and potentially misleading picture of the financial viability of a business 10 The accrual basis of accounting is specifically designed to correct for such problems and thus provides a view of business profitability during the period of time analyzed Cleaner by Natures Income Statement (used to identify profit and loss) uses the accrual method to assess whether the revenues generated from gannents serviced at Cleaner by Nature exceeded the expenses incurred in processing these gannents To assess profitability line items in the cash flow statement which can understate or overstate certain expenses (eg prepayments) and revenues (eg uncollected cash) have been adjusted 11 The accrual method is particularly useful in analyzing pollution prevention investments because the lifetime of costs and benefits associated with the equipment and not just the up-front purchase price needs to be taken into account 12 The Income Statement answers the question of whether over the life of a business opening and operating a 100 wet cleaner is a good financial decision
METHOD
To create the Income Statement (to identify profit and loss) for Cleaner by Nature three categories of adjustments needed to be made to line items in the cash flow statement prepaid expenses accrued expenses and accrued revenue The general method used for adjusting items within each of these categories is outlined below (See Appendix 4-B for a more detailed description of the methods used for each adjustment)
Prepaid expenses -- expenses paid before they are used or consumed bull Supplies Supply inventory was purchased periodically from the start-up and
through the first year of operation To record the portion of supplies used in the processing of gannents each month the total supply cost was calculated and apportioned each month relative to the number of gannents cleaned
bull Insurance The total prepaid insurance covering the first year was spread equally across each month of operation
bull Depreciation Depreciated expense was calculated both for equipment and furniture purchased or covered in the capital lease and vehicle loan While the useful life of plant equipment was assumed to be fifteen years the installation of this equipment was depreciated over ten years -- the length of time the plant lease
IO For example insurance for the second year of operation at Cleaner by Nature was prepaid in the fourth quarter of the first year thus adding an expense not associated with the first year of operation 11 Weygandt Jerry Donald Kieso and Walter Kell Accounting Principles Fourth Edition John Wiley amp Sons 1995 Pdeg 113)2 American Institute for Pollution Prevention A Primer for Financial Analysis of Pollution Prevention Projects
EPA600R-93059 April 1993 p3
4-6
could be extended Equipment and furniture at the drop-shop was depreciated over five years because most of the equipment had a relatively short life span
Accrued expenses -- expenses incurred but not yet paid in cash or recorded bull Salaries Workers were paid every two weeks after work was performed Since
some pay checks overlap two different months the part attributable to the prior month was added to that month and subtracted from the month in which it was paid
bull Utilities Water costs at the plant were paid every other month after the water was used The total utility bill of the month in which each waer bill was paid and the prior month was averaged
Accrued revenue -- revenues earned but not yet received in cash or recorded bull Items cleaned but not paid for at the end of each month There are some items
cleaned in one month but paid for in a subsequent month A computer print-out was created showing garments cleaned each month and revenue generated from those items
RESULTS
Profit and Loss of Cleaner by Nature Table 42 shows the expenses accrued and revenue generated from items serviced at Cleaner by Nature for the four quarters of the first year of operation Cleaner by Nature generated $185372 in total revenues in its first year of operation 13 Accrued revenue i_ncreased steadily as the year progressed from an average of less than $6000 per month in the first quarter to an average of over $20000 per month in the fourth quarter This pattern reflects the increase in the number of pieces cleaned at Cleaner by Nature each quarter Total expenses accrued at Cleaner by Nature from preshyopening through the end of the first year came to $26919814 As expected the variable expenses accrued each quarter closely parallel the number of pieces serviced at Cleaner by Nature
Cleaner by Natures financial performance improved steadily as the year progressed While the business lost almost $58000 in its first year of operation over half of this loss came from expenses accrued in the first quarter of operation when Cleaner by Nature was only processing an average of 57 garments per day By the third quarter Cleaner by Nature was processing 167 garments per day on average and showed a loss of only $8875 By thefourth quarter Cleaner by Nature was processing 197 garments per day on average and was able to turn a profit of 3
13 Revenue generated was almost 5 higher than revenue collected (see Appendix 4A) because it included cash paid after the first year ended for items cleaned within the first year 14 Accrued expenses were almost 19 lower than expenses paid for in this same period mostly due to the fact that equipment costs are viewed as assets which are depreciated over their useful life (See Appendix 4A)
4-7
Table 42 Income Statement for Cleaner by Nature
2 4th Quarter TOTAL
REVENUE (generated) END INVENTORY
EXPENSES Variable Expenses
Labor--Agency Mana er $0 $958 $6319 $6881 $14158 Labor--Customer service $3811 $4613 $2902 $2976 $14302 Labor--Driver $0 $611 $2552 $2659 $5823 Labor--Cleaner $8320 $9673 $6853 $6881 $31728 Labor--Presser $4768 $7130 $8289 $7255 $27441 Labor -- Assembly $0 $954 $1799 $2863 $5616 Outside work 11 $1698 $4340 $5579 $5980 $17597 Supplies $1932 $4465 $5781 $6389 $18566 Utilities $663 $825 $1404 $1673 $4565 Vehicle Operation $0 $694 $321 $887 $1902
F_ixed Expenses Advertising $6445 $8648 $4381 $847 $20321 Equip and Installation $998 $1012 $1281 $1297 $4588 Equipment Lease $1632 $1632 $1632 $1632 $6528 Equipment Maintenance $90 $0 $24 $315 $429 Insurance $1556 $1880 $2100 $2138 $7674 Rent $10841 $10650 $10762 $10768 $43021 Tenant Improvement $2707 $435 $0 $0 $3142 Vehicle Loan $356 $356 $356 $356 $1423 Miscellaneous 111 $4044 $3758 $3431 $14776
PROFIT (LOSS)
$49861
($32452)
$62634
($18439)
$65766
($8875) $2038
$243601
($57728) PERCENT PROFIT (LOSS) (1864) (417) (156) 30 (316)
AVG PIECESDAy IV 57 131 167 197 138
i This does not include counter worlt canied out by the owner Owner worlted 20 hours a week at the counter for first six months and 12 hours a week al the counter for the final six months of the first year
ii Includes expenses associated with laundry leather cleaning and rug cleaning iii Includes bank charges bounced checks building maintenance and security claims office supplies telephone and travel and
education iv Calculated by taking the total garments wet cleaned each quarter and dividing by the number of days the plant operated
4-8
Typical Cleaners Profit and Loss The expense of operating a plant and an agency or drop-off store affected Cleaner by Natures profitability in the first year of operation Had Cleaner by Nature been set up like a typical owner-operated cleaner with a plant and drop-off site in a single facility then expenses associated with paying extra rent and utilizing a delivery van would have been reduced or eliminated and expenses associated with the work of the owner would be accounted for 15 Adjusting these accrued expenses reveals that Cleaner by Nature as a typical owner-operated cleaner in a single facility would have turned a profit in the fourth quarter of 10 (Table 43)
Table 43 Typical Cleaner Income Statement
1st 2nd 3rd 4th TOTAL
i Restated one-time costs and operating capital excludes costs related to operating a plant and an agency at separate locations and the advertising costs associated with the expansion plans for the business as well as includes costs associated with unpaid work performed by the owner
Projected Profitability Projecting Cleaner by Natures profitability or losses into its second year of operation can be accomplished by analyzing the pattern of expenses and revenues during its first year In addition data made available by Cleaner by Natures owner on revenues collected during the first four months of the second year provide a baseline for this projection Figure 41 displays monthly expenses at Cleaner by Nature from the pre-opening period through the first year of operation and revenues through the first four months of the second year 16 While the break-even point for this wet cleaner came at the end of the first year by the second quarter of the first year expenses appeared to flatten out at about $20000 per month while revenue steadily increased throughout the first year and into the first four months of the second year
15 See Section 411 for an explanation of these costs 16 Cleaner by Nature owner provided revenue data only No data on expenses were given
4-9
Figure 41 Cleaner by Natures Monthly Expenses and Revenues
$35000
$30000
$25000
$20000
$15000
$10000
Haamppenses I _ Revenue
-~
f---- - -I- I- -- I- ~ - t--
-
-
-_ I-
- - t-
- f--- I--
t-
-
-
t-
t-
-f---
f---
-
$5000
$0
-bO
middota amp Q
ct
I-
I t D Da at a ~ l
f---
D a Cl
lt
t-
D I
l
f---
~ ~
~ ~
f--- t- t- t- t- f---
D~ ~ It i
~ u 0cgtllt cl z il
r-I
r-I amp
~
r-a
a l
r-t Cl
lt
r-
i l
1 Data represents expenses accrued and revenues generated each month Revenue for February 1997 through May 1997 is cash collected not revenue generated Since business is still growing more revenue is generated each month than collected
Table 44 is a projected Income Statement for Cleaner by Nature for its second year of operation Estimated revenue generated at Cleaner by Nature during the second year is based on sales figures for the first four months of the second year 17 While revenue during these four months grew rapidly from $22000 to $31000 for the purpose of this projection it is assumed that the generated revenue remained constant subsequent to the fourth month of the second year 18 However even with this conservative assumption projected total revenue at Cleaner by Nature for the second year is estimated to be $359258 - almost twice the revenue generated in the first year Expenses used in creating these revenues are estimated based on the first year Income Statement (Table 42) as well as additional information provided by the owner
Even though total expenses during the first year flattened out as revenue generated continued to rise certain expenses are expected to increase as the number of garments that are wet cleaned increases Each of the variable expenses including total labor supplies utilities and vehicle use as well as workers compensation insurance was expected to increase proportional to the increase in the number of garments wet cleaned The labor expenses that were expected to increase included pressing costs assembly
17 This data was provided by the owner of Cleaner by Nature 18 Shonly before completing the final repon revenue figures for October 1997 (which amounted to about $40000 from Cleaner by Nature business excluding revenues from shin laundry items) were obtained This figure indicated a significant jump in revenues for that month in comparison to the first four months of the second year Yet because data was not available for June through September the October figure was not used as a data point in the projection Thus the projection may underestimate the revenue and profitability of Oeaner by Nature in its second year of operation
4-10
costs and the costs for the driver On the other hand the labor costs for the cleaner the agency manager and counter personnel were not assumed to increase19
Table 44 Projected Income Statement for Cleaner by Nature for Second Year of Operation
EXPENSES
5th 6th Quarter
7th 8th TOTAL
Variable Expenses Labor--Agency Manager $6881 $6881 $6881 $6881 $27525 Labor--Customer Service $2976 $2976 $2976 $2976 $11906 Labor--Driver $2824 $3494 $3494 $3494 $13307 Labor-Cleaner $6881 $6881 $6881 $6881 $27525
Labor--Presser $7704 $9531 $9531 $9531 $36298 Labor--Assembly $3040 $3761 $3761 $3761 $14324 Outside work- Laundry $7617 $9423 $9423 $9423 $35885 Supplies $6785 $8394 $8394 $8394 $31966 Utilities $1775 $2196 $2196 $2196 $8365 Vehicle Operation $945 $1169 $1169 $1169 $4453
Fixed Expenses Advertising $847 $847 $847 $847 $3388 Equip and Installation $1281 $1281 $1281 $1281 $5124 Equipment Lease $1632 $1632 $1632 $1632 $6528 Equipment Maintenance $411 $411 $411 $411 $1644 Insurance $2225 $2385 $2385 $2385 $9381 Rent $10768 $10768 $10768 $10768 $43072 Vehicle Loan $356 $356 $356 $356 $1423 Miscellaneous bullbull $3543 $3543 $3543 $3543 $14172
TOTAL EXPENSES
PROFIT (LOSS)
$68321
$7760
$75061
$18404
$75061
$18404
$75061
$18404
$293503
$62973 PERCENT PROFIT (LOSS) 102 195 195 195 175
PIECES WET CLEANED 12773 15802 15802 15802 60177
i Based on total revenue collected at Cleaner by Nature for first four months of second year of operation ii All variable epenses were assumed to increase proportional to lbe number of garments cleaned except labor costs for the Agency
Manager and the Cleaner (both of whom were on full-time salary at the end of the first year) and Customer Service (counter service wJS fully covered by the fourth quarter of the first year)
iii All fixed expenses were assumed to remain the same as the fourth quarter iv Includes bank charges bounced checks building maintenance and security claims office supplies telephone travel education
Total profit for the second year is projected to be $63086 with the profit jumping from 102 profit in the first quarter of the second year to 195 for the remainder of the year as the number of pieces wet cleaned increases The 102 profit in the 5th quarter itself was a jump from a 305 profit in the 4th quarter of the first year
19 Both the Cleaner and the Agency Manager were on salary
4-II
These increases in profitability are due to increased efficiency of labor and capital equipment In particular while revenue generated increased rapidly by the beginning of the second year the labor expense for the cleaner and agency manager and the capital equipment costs remain the same
423 Cleaner by Natures Pressing Productivity
METHOD
Pressing garments can be more labor-intensive in wet cleaning than in dry cleaning because garments generally are more wrinkled after being submerged in water than in PCE In an effort to improve productivity at the plant Cleaner by Nature purchased during the third quarter of the first year of operation special tensioning presses a fotm fitter and a pant topper Payroll figures were used to calculate whether the purchase of this equipment a significant expense had an impact on the productivity of the pressers The accrued payroll expense for pressing labor was divided by the hourly wage rate for pressers ($825) to derive the number of hours per quarter spent on pressing20 The number of garments processed per quarter was then divided by the number of hours of pressing time per quarter to produce the number of pieces pressed per hour
RESULTS
The analysis of pressing payroll information reveals that the number of garments Cleaner by Nature pressers could finish per hour increased during the first year of operation from 97 in the second quarter to 108 in the third quarter to 137 in the fourth quarter21
(Table 45) The increase of nearly three garments per hour between the third and fourth quarter is likely due to the utilization in the fourth quarter of special tensioning equipment for pressing purchased at the end of the third quarter The increased productivity of the pressers in the last quarter may also be attributed to an increase in skill among the pressers increased volume and better coordination at the plant over time22
Table 45 Pressing Speed Over Time in Cleaner by Natures First Year i
1st Quarterbull 2nd Quarter 3rd Quarter iii 4th Quarter Estimated Hours - 864 1005 879 Pieces Wet Cleaned 3636 8405 10882 12027
Estimated PiecesHr - 972 108 137 1 Pressing rates were calculated using accrued pressing labor expense each quarter and 1110nthly garment counts u Pressing rates were not available for this period because the presser split his time between counter worlc and pressing m Cleaner by Nature purchased tensioning equipment during the third quarter The equipment was installed on September 29
20 The hourly wage rate ranged from $8 to $9 per hour The owner provided $825 as an estimate of the typical wages 21 Pressing time information was not available in the first quaner because one of the pressers employed during that time also had counter responsibilities and consequently there was no reliable data for this period 22 Another study that compared wet cleaning pressing productivity before and after the installation of tensioning equipment also found an increase At Utopia Cleaners in Massachusetts the installation of tensioning equipment improved productivity by about 38 from an estimated 12 pieces per hour to 17 pieces per hour
4-12
43 Cost Comparison of Cleaner by Nature and Dry Cleaning
INTRODUCTION
Generalizing from a case study is always bound by factors associated with the particularities of a business There are many cost factors independent of the process used that may affect financial performance A comparative cost analysis of professional wet cleaning and dry cleaning was undertaken so as to isolate those costs that are specific to each process
The cost comparison of wet cleaning and dry cleaning draws on the financial information presented in the case study to analyze the cost differencesbull between Cleaner by Nature and a model dry cleaner The comparative analysis is between a mature technology and a developing technology that is being used in a start-up facility Consequently the cost comparison needs to be viewed as specific to Cleaner by Natures experience and in relation to this point in time in the development of wet cleaning technology The comparison includes three components The first is a comparison of equipment (or capital) costs for Cleaner by Nature and a model dry cleaner the second is a comparison of pressing time at Cleaner by Nature and two area dry cleaners and the third is a comparison of operating costs at Cleaner by Nature and a model dry cleaner
It is assumed that the model dry cleaner is using the most advanced dry cleaning equipment a PCE machine that includes primary and secondary control technology A new dry cleaner opening a plant in the South Coast Air Quality Management District after June 9 1996 would be required to purchase a PCE machine with this configuration A 35-pound PCE machine was chosen for the comparison because it has a similar throughput to a 30-pound Aquatex washer and 50-pound dryer A 30-pound Aquatex system would be expected to process about 387 pounds of clothes in an eight hour day if used at capacity2 while a 35-pound PCE machine would process between 341 pounds and 439 pounds of clothing during the same time period depending on the length of the cycle24
Cleaner by Natures costs were adjusted in four ways to make it more comparable to the model dry cleaner 1) All equipment costs were paid for outright 2) The assumption was made that Cleaner by Nature purchased the tensioning equipment and that the conventional presses they replaced were not purchased 3) Fourth quarter costs
nie wet cleaning calculation assumes that 90 of garments are dried in the moisture control dryer while the remaining I 0 of garments are line dried Because the wet cleaning system is a transfer system one load can be washed while the other is being dried Consequently the system can process a 27 lb load of garments every 30 minutes (the maximum length of the dry cycle) when the washer and dryer are both in operation In an eight hour day the first and last loads of day would occur when one of the two machines is inactive a factor that is also considered in the calculation 24As PCE machines are generally not filled to capacity this calculation assumes that the PCE machine is processing 32 pounds of garments every 35 to 45 minutes in a dry to dry system
4-13
and revenues were often used for the operating cost comparison because Cleaner by Nature was operating at its peak volume during the demonstration period (197 garments per day) and had installed the tensioning equipment 4) The rates for utility and detergent use were based on the calculations from the environmental assessment which is discussed in more detail in Section IV
431 Equipment Cost Comparison
MEIBOD
The most significant capital cost for a start-up cleaner is the purchase of equipment for the plant Both wet cleaners and dry cleaners must purchase a range of items including cleaning systems pressing equipment boilers and spotting boards and pay for their shipment and installation The wet cleaning costs are the actual equipment costs incurred by Cleaner by Nature (tax included) The cost of the wet cleaning system is the price that Cleaner by Nature paid for its Aquatex 30 pound washer and 50 pound natural gas dryer The cost of the pressing equipment is the price paid for presses minus the conventional pant topper and form fitter that became redundant once Cleaner by Nature purchased the tensioning equipment
The dry cleaning system includes the cost of a 35-pound PCE machine a IS-ton water tower and pump a wastewater evaporator a spill containment pan for the PCE machine and a recooper Four different distributors of dry cleaning equipment each provided a price that the equipment is typically sold for rather than the list price which is usually higher 25 The average of these prices including 825 sales tax was taken as the estimate of the cost of the dry clean system The cost of the dry cleaning pressing equipment is the price of Cleaner by Natures pressing equipment prior to the purchase of the tensioning form fitter and pant topper However the analysis assumes that a dry cleaner purchased the conventional presses new rather than reconditioned (as was the case for Cleaner by Nature) to make the costs more comparable to the new tensioning equipment
The actual expense to a professional cleaner of operating this plant equipment includes the cost of purchasing shipping installing and maintaining the equipment over its useful life 26 The estimate of the expected useful life of the wet clean machines was obtained from the distributors of wet clean equipment as well as from personnel repairing wet clean machines The estimate of the expected useful life of the dry clean machines
25 The water tower pump and wastewater evaporator and recooper are control technologies typically used in Southern California A 35-pound PCE machine sells for an average of $32500 The wastewater evaporator which is used to evaporate the wastewater produced by the PCE machine sells for about $1300 1be water tower and pump ($1900) assist in the cooling of the vaporized PCE and can also be substituted for a device called a chiller which is estimated to cost two to three times as much The spill containment pan ($1500) is a trough that is large enough to hold the PCE in the storage tank of the dry cleaning machine An alternative method of spill containment is to modify the floor of the facility 26 See discussion of accrual method of accounting in Section 41
4-14
came from three of the four distributors whose machine prices were used to calculate dry cleaning machine cost from personnel repairing dry clean machines and from a dry cleaning consulting firm An estimate of average yearly equipment maintenance cost of the wet clean machine was generated by adding together all repair costs that could reasonably be expected to occur over the life of the equipment27 Surveys of dry cleaners by two national dry cleaning trade associations were used to estimate the annual cost of maintaining a dry cleaning machine as well as all other plant equipment28 The cost of installing plant equipment at a dry cleaner or a wet cleaner was assumed to be the same
RESULTS
Start-Up Equipment Costs
The total costs of purchasing plant equipment at Cleaner by Nature were 93 lower than that of purchasing dry cleaning equipment (fable 46) The price of the wet cleaning system ($27833) was 312 less expensive than that of a PCE system with a similar capacity ($40813) This difference is due to the fact that a PCE system requires expensive pollution control devices to be built into or added onto the machine The pressing equipment on the other hand cost 28 more for the model wet cleaner ($25969) than for a comparable dry cleaner ($20254) What accounted for the difference was the tensioning pressing equipment The tensioning equipment applies tension to garments to increase the speed and the quality of the pressing The tensioning presses (a form fitter and a pant topper) sold for about $13000 over three times the amount of the reconditioned form fitter and pant topper originally purchased by Cleaner by Nature Wet cleaning installation costs may be less expensive because the equipment is smaller and does not require a concrete slab29 However Cleaner by Natures installer said that there would be little difference between the installation costs for a dry cleaner and a wet cleaner operating in the Cleaner by Nature plant
27 This estimate was provided by Steve Trainer the chief equipment technician at Iowa Techniques which distributes and repairs both dry clean and wet clean equipment Mr Trainer mostly repairs dry clean machines but also repairs Aquatex machines The two dry cleaning association surveys were the Neighborhood Cleaners Association Cost Comparison Chart-1996 and the International Fabricare Institute Survey of 1991 Operating Costs 29 USEPA Office of Pollution Prevention and Toxics Design for Environment Program Making the Most of Your Cleaning Business Dry CleaningWet Cleaning Case Studies and Financial Analysis Worksheets (DRAFI) (March 1997)13
4-15
Table 46 Equipment Costs for Cleaner by Nature and Dry Cleaning i
Cleaner by Nature Dry Cleaning
Cleaning system $27833 $40813
Pressing equipment $25969 $20254
Other plant equipment $16913 $16913
TOTAL $70715 $77980
Cost Difference middotmiddot $7265 +
middot
Difference middot 93 less than dry deaning middotmiddot
i These costs are based on typical or actual selling price of equipment The 825 California sales taX is included in these estimates
Yearly Equipment Expense
For a professional cleaner the yearly expense of operating plant equipment includes not only the use of the equipment but the cost of shipping installing and maintaining the equipment over its useful life The average yearly expense for plant equipment is $8314 for a model wet cleaner and $12085 for a model dry cleaner (Table 47)30 The reason the yearly expense of wet clean equipment is 31 lower is primarily due to differences in the estimated life of a wet clean machine (15 years) and a dry clean machine (10 years) as well as the more expensive cost of maintaining the dry clean machine over its useful life
Plant Equipment Expense
For dry cleaning equipment various pollution control devices are now required These control systems with precise temperature and pressure conditions place physical stress on the machine as a whole shortening the equipments useful life Wet clean washing and drying systems do not require such devices The yearly expense of the wet clean system depreciated over fifteen years ($1856) is less than half the yearly expense of the dry clean system depreciated over ten years ($4081) (See Table 4 7) The useful life of all other plant equipment including pressing equipment was estimated at fifteen years and depreciated over this period of time The greater expense for wet cleaning pressing equipment is due to the cost of the special tensioning equipment All shipping and installation is depreciated over the life of the equipment The greater expense for dry cleaning equipment is due to the shorter life of the machine
30 Expected lifespans of the wet cleaning and dry cleaning equipment were based on interviews with distributors repair personnel and a firm that specializes in consulting for dry cleaners See Appendix 4-F Equipment expense
4-16
Maintenance Expense
The total expense of maintaining the wet clean machine (parts and labor) came to $379 per year while the maintenance of the dry clean machine came to $2306 per year (Table 47) The yearly expense of maintaining the wet clean machine was calculated by estimating the parts and labor of maintaining the machine over a fifteen year life span ($5690) This estimate included an assumption that the computer system a $1S00 expense would need to be replaced even though it was very unlikely that this need would occur thus leading to a probable overestimate of costs31 The yearly expense of maintaining a dry clean machine was based on the results of two national dry cleaning trade association surveys which estimated that 204 of the revenue of a dry cleaner was spent on all equipment maintenance (parts and labor)32 Maintenance of the dry clean machine for this study was estimated at $1887 or half the amount (102 of revenue) identified in the surveys33 Annual filter costs come to $419 with total annual expenses thus equaling $2306 ($1887+$419)34 Maintenance expenses for other plant equipment was comparable for wet cleaning and dry cleaning ($1887 or 102 ofrevenue)
Table 47 Yearly Equipment Expense Cleaner by Nature and Dry Cleaning
Cleaner by Nature Dry Cleaning
Cleaning system 1 $1856 $4081
Other plant equipment $2859 $2478
Shipping amp installation Iii $1800 $1917
Maintenance - cleaning system $379 $2306
Maintenance - other plant equipment $1887 $1887
TOTAL $8314 $12085
Difference in Expense middotmiddot middotmiddotbullmiddot bull middot middotmiddot _
middot $3771 Difference
middotbullbull
middot
middot 312 less than dry cleaning
i The wet cleaning system cost was depreciated over IS years while the dry clean system was depreciated over 10 years ii Other plant equipment was depreciated over IS years iii Shipping and installation for the oil wet clean equipment depreciated over IS years Shipping and installation for the dry clean
system was depreciated over 10 years while all other dry clean plant equipment was depreciated over 15 years
31 Steve Trainer chief mechanic Iowa Technique November 7 1997 32 Intemational Fabricare Institute estimates that 307 of annual sales were spent on maintenance (parts and labor for dry cleaners with revenues of less than $200000 International Fabricare Institute Survey of 1991 Operating Costs The Neighborhood Cleaners Association estimates that 125 of all revenue would be expected to be spent on maintenance for a dry cleaner charging $850 per two piece suit - similar to the price charged at Cleaner by Nature Neighborhood Cleaners Association Cost Comparison Chan-1996 The revenue basis for these estimates was the total revenue generated at Cleaner by Nature during the first year of operation ($185872 33 Personal communications with Ted Barry (John Barry amp Associates a dry cleaning consulting firm November 5 1997 Eddy Centes (chief mechanic at Pacific Equipment November 10 1997 Steve Trainer (chief mechanic at Iowa Techniques) November 11 1997 34 Filter costs are estimated to be $0012garment The number of garments wet cleaned at Cleaner by Nature in the first year of operation was 34950 See Appendix 4-F Supplies - Filter Replacement
4-17
432 Pressing Time Comparison
METHOD
In order to obtain comparison data on the relative pressing labor demands in wet cleaning and dry cleaning an analysis of pressing time was undertaken at Cleaner by Nature and two area dry cleaners In addition Cleaner by Natures quarterly pressing wages were analyzed in relation to wet cleaning revenue and compared to available industry figures
Controlling for Confounding Variables Many factors aside from the choice of cleaning process can influence the speed of pressing They include 1) the speed of the individual presser 2) the level of quality desired by the cleaner 3) the fiber weave and construction of the garment 4) the circumstances when the pressing occurs (for example if a rush job is required 5) the pressing equipment used and 6) the productivity expectations of the management For the pressing time study an attempt was made to control for as many factors as possible with the exception of the pressing equipment Cleaner by Nature pressers used tensioning equipment whereas the dry cleaners relied on traditional dry cleaning equipment which corresponds to the assumptions developed for the overall comparison
Selection ofDry Cleaners for Comparison In an effort to control for quality dry cleaners in a similar price range to Cleaner by Nature were sought for a comparison The two available dry cleaners are slightly more expensive but are still in a similar price range to Cleaner by Nature (See Appendix 4-C) While these were quality cleaners they were also sizable facilities Cleaner A processes about 2 JOO garments per week while Cleaner B processes about 6000 garments per week Cleaner by Nature processed about 1000 garments per week during its fourth quarter of operation
A third cleaner (Cleaner C) initially selected for the pressing time study was later excluded After one visit it appeared that the pressing time at Cleaner C was much slower than pressing time at Cleaner A and Cleaner B and even slower than pressing time at Cleaner by Nature Like Cleaner by Nature Cleaner C was a start-up business Subsequently the owner at Cleaner C indicated that the business had not yet attained profitability as a start-up rather than established business (similar to Cleaner by Nature at the time) and that there had been discussions by Cleaner C about raising prices Since Cleaner by Nature was being compared to profitable businesses (one of the indicators of viability) the decision was made to eliminate Cleaner C from this aspect of the study The decision to eliminate Cleaner C from the comparison was an assumption that could be seen to bias against Cleaner by Nature
Garment Selection The evaluation focused on the three types of garments most commonly taken to professional cleaners blousesjackets and pants In addition an effort was made to include a similar mix of fibers (ie wool silk rayon) for each garment type evaluated at the three cleaners The fiber mix is not identical for the three cleaners that were studied because the PPERC evaluators had to work with whatever garments
4-18
were ready to be pressed In all PPERC researchers timed the pressing of 153 garments at Cleaner by Nature and a combined 179 garments at the two area dry cleaners Appendix 4-D shows the fiber types at Cleaner by Nature and the two dry cleaners
Limits ofMethodology While attempts were made to control for quality of pressing and garment characteristics the evaluation was not able to control for possible differences in the skill level of the pressers Because the skill of the presser was not controlled because of the limited capacity to control for differences in garmentcharacteristics quality and productivity expectations and because of the decision to eliminate Cleaner C to control for business profitability the pressing time comparison was also examined in relation to other studies
RESULTS
The PPERC pressing time study shows that it took Cleaner by Nature pressers longer to press garments than it did the pressers at the two local dry cleaners (Cleaner A and B) On average blouses took 55 longer to press at Cleaner by Nature than at the local dry cleaners Pants took 82 longer to press at Cleaner by Nature and jackets took 74 longer to press35 Table 48 shows pressing time per garment type at Cleaner by Nature and the two dry cleaners The ratio of the number of dry cleaned garments that can be pressed per hour to Cleaner by Nature pressing time ranges from 13 to 21 depending on the dry cleaner and the garment type The smallest difference in pressing time appears to be for blouses36
Table 48 Pressing Speed by Garment Typei
Cleaner ~y Dry Cleaner Dry Cleaner A Dry Cleaner B Nature Averaee Pieces Pieces Ratio Pieces Ratio Pieces Ratio Hour Hour (DCWC Hour (DCWC) Hour (DCWC)
Blousesshirts 155 240 15 278 18 201 13
Pants 192 349 18 394 21 303 16
Jackets 157 273 17 249 16 297 19
Weighted Averaee 111
171 bull
middot 292 7
32_2
119 middot middot bullmiddotmiddot
769 middot middot
Imiddot
15 middot
i Pressing speed was calculated with a stop watch at Oeaner by Nature and two local dry cleaners ii Cleaner by Nature iii The average was weighted according to the distribution of garments cleaned at Cleaner by Nature 242 blousesshirts 252 pants IO I jackets
Cleaner by Nature pressers were using tensioning equipment to press jackets and pants 36 The International Fabricare Institute has conducted dry cleaning pressing time studies for particular garment types with somewhat similar results blouses 29 pieces per hour pants 30 to 50 pieces per hour and jackets 28 pieces per hour Personal Communication with Jane Rising Director Education Department International Fabricare Institute Silver Springs MD March 28 1997
4-19
Other studies that have analyzed pressing time differences were reviewed for comparative purposes given some of the constraints and assumptions of the PPERC pressing time study
Environment Canada The study that most effectively controlled for key confounding variables (including the productivity expectations of the cleaner the types of garments pressed and the skill of the presser) was one conducted by Environment Canada in 199537 Pressing speed for 13 pairs of identical garments was measured at two different mixed facilities for a total of 26 separate comparisons of pressing time At each plant the same presser worked on both the wet cleaned and dry cleaned garment in the pair38
Conventional dry cleaning pressing equipment was used at both cleaners to press wet cleaned and dry cleaned garments At one of the Environment Canada cleaners (a medium to large-scale production facility) it took 15 longer to press a garment when it was wet cleaned At the other plant (a relatively small facility) it took 25 longer to press a garment when wet cleaned 39 Appendix 4-E provides a summary of the results of the Environment Canada study
Utopia Cleaners The Tellus Institute for Resource and Environmental Strategies conducted a study of a Massachusetts dry cleaner who converted a facility to wet cleaning The cleaner sent 20 to 30 of the garments he received at the wet cleaner to his off-site PCE dry cleaner (and accepted 25 to 30 from that dry cleaner at his wet cleaning plant) An 18 increase in pressing time was noted after moving to this new arrangement from 20 pieces per hour in dry cleaning to 17 pieces per hour in wet cleaning40 The wet cleaning pressing was done with tensioning equipment while the dry cleaning pressing time was done with conventional presses
Langley Parisian Limited As part of the Environment Canada study Ken Adamson of Langley Parisian Cleaners recorded total labor costs before and after his plant switched from dry cleaning to wet cleaning The wet cleaning plant processed 61 of the garments it received and sent the remaining 39 to be dry cleaned off-site After the switch to wet cleaning Adamson noted an increase in total labor costs of 3 cents a piece from $107 to $11041
Because it was not possible to adequately control for the skill of the presser the quality and productivity demands of the cleaner the size and established nature of the
37 Environment Canada Final Report for the Green Clean Project (Samia Ontario October 1995) 52-55 38 Personal Communication with Al Ermarora Environment Canada September 3 1997 39 The Environment Canada study concluded that pressing time was actually 50 longer in wet cleaning than in dry cleaning However this finding was based on discussions with dry cleaner rather than on the empirical data from the iressing time study
US Environmental Protection Agency Office of Pollution Prevention and Toxics Design for Environment Program Making the Most of Your Cleaning Business Dry CleaningWet Cleaning Case Studies and Financial Analysis Worksheets DRAFr (March 1997) 6 41 Ken Adamson Exploring rhe Boundaries of Wet Cleaning Professional Textile Care in Canada--A Brief Overview ofa Wet Cleaning Field Study Presented at the International Symposium at Schloss Hohenstein Global Experiences and New Developments in Wet Cleaning Technology Hohenstein Institutes D-74357 Boennigheim (June 17 1996) 18
4-20
business and the differences in the composition of garments at the cleaners in the PPERC study and because prior studies may have more adequately accounted for these factors the relatively greater difference found in this study is likely an artifact of these confounding variables In fact previous studies that have examined relative labor time in wet cleaning and dry cleaning have shown a much smaller difference in pressing time or total labor time between the two processes However all the studies have shown that wet cleaning is associated with increased pressing time42
Pressing Wages as a Percentage ofRevenue While Cleaner by Natures relative pressing productivity is lower than two area dry cleaners the cost of pressing labor seems to be in line with industry expectations According to a study conducted by the Neighborhood Cleaners Association a dry cleaning trade group pressing wages should account for about I0 of the price the cleaner charges for cleaning a garment43 Cleaner by Natures accrued pressing wages in its fourth quarter ($6638) accounted for an estimated 11 of wet cleaning revenue ($60922) only one percentage point more than expected44
433 Cost Analysis Cleaner by Nature and Dry Cleaning
MEIBOD
Many factors affected Cleaner by Natures financial performance in its first year that were independent of the cleaning process used Consequently a comparative analysis was undertaken to focus on those costs that are expected to vary in wet cleaning and dry cleaning (ie process-dependent costs) and how those cost differences are likely to influence the relative profitability of wet cleaning and dry cleaning Cost information was first standardized on a per piece basis Information from the Cleaner by Nature case study (Section 41) was used as a basis for wet cleaning costs Dry cleaning costs were drawn from industry sources Costs unrelated to the process used (ie processshyindependent costs) are assumed to be the same for both processes The cost estimates were then used to calculate the difference in profitability between the two processes over a one year period based on Cleaner by Natures fourth quarter productivity when the plant was processing an average of 197 garments per day The assumptions and data
42 Jt should also be noted that difference in pressing time for dry cleaning and wet cleaning might be accentuated (or minimized) for some garment types For example finishing pleated skins tends to be especially time consuming in wet cleaning because the skins lose their pleats when they are immersed in water Knitted garments which can require very little pressing in both processes were also not included in the time study In addition dry cleaning pressing time can vary considerably Some very high end cleaners reportedly take much longer to finish each garment Likewise discount cleaners would be expected to spend less time on each piece 43 Neighborhood Cleaners Association Cost Comparison Chart-I 996 NCA estimates the percent cost of pressing wages according to the price of a suit The 10 is the estimate for a cleaner that charged $850 for a suit Cleaner by Nature charged $875 but this difference is likely canceled out by inflation Cleaner by Natures total revenue includes revenue received for wet cleaning and revenue for outside work Because of a computer failure wet cleaning revenue (independent from total revenue) was not available for the months of November and December Consequently wet cleaning revenue was estimated based on the assumption that it was 91 of total revenue which is the average percentage for the 9 months with available data
4-21
calculation methods for the comparable cost analysis are included in Appendix 4-F for process-dependent costs and Appendix 4-G for process-independent costs
The costs examined in this section include only the direct costs to the business owner and do not include the more intangible social costs of the cleaning process In the case of dry cleaning those costs could include costs to the public of air pollution pollution from improper hazardous waste disposal contamination of soil and groundwater due to improper handling of chemicals or from leaks and spills and from occupational exposures to those who work in dry cleaning facilities Although these can be important aspects of financial viability these costs are often not directly quantifiable and have not been fully incorporated into the operating cost comparison Likewise this analysis does not include unanticipated or catastrophic costs such as those associated with pollution liability These are analyzed in Section VI Finally the labor costs of complying with regulations (both the amount of labor required to fill out forms and the stresses associated with running a highly regulated business) were also not included
Since pressing labor is such an important aspect of operating cost and there was significant variation in pressing time even among the dry cleaners studied for this report pressing cost is presented as a range reflecting the results of two different studies the PPERC pressing time study and the Environment Canada study The PPERC pressing time study found that on average it took a dry cleaner 41 less time to press a garment than it took at Cleaner by Nature Since the PPERC study may not have adequately controlled for confounding variables that were controlled in the Environment Canada pressing time study (including the skill of the presser the specific garment pressed and the expectations of the cleaners) a figure of 17 faster pressing time in dry cleaning (derived from the Environment Canada study) was also used as a basis for estimating pressing labor costs Both the PPERC and Environment Canada estimates were then used to describe the range in calculating overall operating costs45
45 See Appendix 4-F (Labor - Pressing) for method of convening percent slower pressing time in wet cleaning to percent faster pressing time in dry cleaning
4-22
RESULTS
Overall Profitability ofWet Cleaning and Dry Cleaning
The model plant analysis found that Cleaner by Nature would generate $1 I 87 4 in profit from wet cleaning per year based on the productivity of the wet cleaner in the fourth quarter of its first year of operation (Table 49) Cleaner by Nature was less profitable than a dry cleaner pressing 41 faster (based on the PPERC study) but was more profitable than a dry cleaner pressing 17 faster (based on the Environment Canada study) A dry cleaner pressing 17 faster would generate $9965 in profit -- $1909 less than the wet cleaner A model dry cleaner pressing 4 I faster would generate $17645 in profit -- $5771 more than Cleaner by Nature On a per garment basis Cleaner by Nature spent $481 to wet clean a garment ($23187448 108) while a dry cleaner pressing 17 quicker would spend $486 per garment -- 5 cents more than the wet cleaner Similarly a dry cleaner pressing 41 quicker than a wet cleaner would spend $469 per garment --12 cents less than Cleaner by Nature The profit margin of the wet cleaner came to 49 compared to 41 and 7 2 for the tw9 dry cleaners
The cost comparison and related profit analysis change further when the costs associated with dry cleaner efforts to reduce liability exposure are factored in Those costs which are discussed more fully in Section VI include pollution liability insurance (at a cost of 9 cents per garment) and mandated fees in state legislation (at a cost ranging from about three to twelve cents a garment) When those costs are added to the analysis wet cleaning would be more profitable than dry cleaning when either the Environment Canada or the PPERC numbers are used as the basis for comparison
4-23
Table 49 Income Statement Comparison Cleaner by Nature and Dry Cleaning
EXPENSES
Variable Expenses
Claims
Labor Cleaner Pressers Counter Assembly Driver Mana ement
Supplies Detergents
PCE Clothes-handling
S otting Chemicals Filter
Outside work Haz Waste Disposal Utilities Electricity
Natural Gas
Water amp Sewer
Vehicle use Fixed Expenses
Advertising amp marketing Equipment Expense Equipment Maintenance Cleaning System
Other
Rent Insurance Business middot
Workers compensation Vehicle
Regulatory Expenses amp Fee
Compliance Regulatory Compliance Vehicle loan Miscellaneous
PROFIT PERCENT PROFIT
WET CLEANED PIECES
Cleaner by Nature
$1118
$27524 $29009 $61482
$4715
NA $9573 $1636
NA $6591
$0 $2886 $3897 $1010 $3560
$4826 $6514
$379 $2150
$43057 $1253 $5632 $1684
NA NA
$11874 49
48108
Dry Cleaner Dry Cleaner Model A Model B
$828 $828
$27524 $27524 $24165 $17058 $61482 $61482
$2021 $2021
$654 $654 $9573 $9573 $1636 $1636
$577 $577 $6591 $6591 $1010 $1010 $3368 $3368 $3319 $3319
$577 $577 $3560 $3560
$4826 $4826 $8326 $8326 $2150 $2150 $2150 $2150
$43057 $43057 $1267 $1267 $5324 $5088 $1684 $1684 $1106 $1106 $3622 $3622 $1443 $1443
$11883 $233723
$9965 $17645 41 72
48108 48108
1 See Appendix 4-F for a line by line explanation of process-dependent costs and Appendix 4-G for process-independent costs u Toe calculation of pressing time in this column relies on an Environment Canada comparative study of pressing time that found that it was 17 faster to press a dry cleaned garment than the identical wet cleaned gannent lliThe calculation of pressing time in this column relies on the PPERC pressing time study that found that at two area dry cleaners it took on average 41 less time to press a dry cleaned garment than to press a wet cleaned garment at Cleaner by Nature
4-24
Process-Dependent Cost Comparison
The types of expenses that were shown to be different in wet cleaning than dry cleaning (ie process-dependent costs) are displayed in Figure 42 The costs that are more expensive in wet cleaning are grouped separately from those that are more expensive in dry cleaning
Figure 42 Process-Dependent Expenses as Percentage of Revenue
= =
c ~ = ~ ~
~ ~ = Q
Ill
12 D Cleaner by N nt ure
Dry Cleaner Model A
10 ID Dry Cleaner Model B
8
6
4
2
0
~
~ = e= 0 a = middot= middota i 8 u ul 6l ii C -a E
Cl 8
j J ii middots middot= $
i Pressing cost for Dry Cleaner Model A is based on assumptions from the Environment Canada study while pressing costs for Dry Cleaner Model Bare based on the PPERC time study The only difference between Model A and Model Bis the difference in labor cost Because increased labor cost means increased payroll workers compensation insurance also changes For the categories where the two dry cleaner estimates are the same only the Model A dry cleaner figure was used
4-25
Expenses Greater in Wet Cleaning
Pressing Labor One of the biggest concerns regarding the economic viability of wet cleaning is the greater amount of time it talces to press a garment Pressing labor costs accounted for 119 of revenues at Cleaner by Nature compared to either 99 or 70 for dry cleaning depending on the pressing time evaluation that is used (See Section 422)
Insurance As a result of the greater labor requirements of wet cleaning due to increased pressing workers compensation insurance is more costly for wet cleaning than dry cleaning This increased expense drives up the overall cost of insurance only slightly -35 for wet cleaning compared to 34 for dry cleaning
Utility Costs Overall utility costs for wet cleaning were slightly greater than for dry cleaning - 32 of revenues vs 30 While Cleaner by Natures electricity use is less than that of the model dry cleaner Cleaner by Nature uses more natural gas and water malcing utility expenses more costly for wet cleaning 46
Detergent Costs The wet cleaning agents chosen by Cleaner by Nature accounted for 2 of revenue while the model dry cleaner is expected to spend less than 1 of revenue on detergent47 As with other costs these can vary according to the choice of the business Since the end of the first year of operation Cleaner by Nature has been using a wet cleaning detergent that is about 30 less expensive than the Aquatex detergent that was used during the first year demonstration period
Claims The cost of paying for damaged or lost garments was higher at Cleaner by Nature compared to dry cleaning - 05 of revenue vs 03 of revenue While the claims data for Cleaner by Nature was talcen late in its first year of operation allowing for a learning period data used to calculate the claims rate in dry cleaning was based on a survey of dry cleaners most of whom are likely to have been in business substantially longer than Cleaner by Nature Claims rates for start-up dry cleaners may be higher than the rate for dry cleaners as a whole
46 The Utopia Cleaners demonstration site in Massachusetts had higher utility costs before switching its plant from dry cleaning to wet cleaning Part of the high costs were due to the fact that the shop did not have a water tower which is used to recycle cooling water for the solvent reclamation process US Environmental Protection Agency Office of Pollution Prevention and Toxics Making the Most of Your Cleaning Business Dry CleaningWet Cleaning Case Studies and Financial Analysis Worksheets (Draft) March 1997 9-11 47 The Cleaner by Nature detergent finishing and sizing costs are based on pump tests conducted at Cleaner by Nature which was using Aquatex cleaning agents while the dry cleaning costs have been identified by distributors
4-26
Expenses Greater in Dry Cleaning
PCE While wet cleaning eliminates the need to use PCE the actual cost of PCE to a dry cleaner is relatively small -- 03 of revenue
Equipment Expense Cleaner by Nature is expected to spend 27 of revenue on all plant equipment while a model dry cleaner would expect to spend 34 of revenue on plant equipment This difference is due to lower initial costs as well as to a longer life expectancy of the wet clean machine compared to the dry clean machine (See Section 421)
Machine Maintenance Cleaner by Nature is expected to spend a marginal cost for maintaining the wet clean machine over its fifteen year life (02 of revenue) while maintaining the dry clean machine over a ten year useful life is expected to cost 09 of revenue
Government Regulation While Cleaner by Nature is not expected to spend any money on government regulation and compliance a dry cleaner is likely to spend 246 of revenues in complying with regulations These costs include hazardous waste disposal costs (041 of revenues) filter purchase expenses (021 of revenue) regulatory fees (035 of revenue) and regulatory compliance (149 of revenue)
Process-Independent Costs
More than half of the costs attributed to the model facilities are not related to the process used including rent the cost of outside work and counter and assembly labor (Table 47) Rent a significant expense in this case is assumed to be $39600 per year for a 1500 square foot facility (about 16 of the cost of wet cleaning a garment) Different assumptions about process-independent costs would affect the profitability of the model plants as well as the percentage cost difference between the two processes
For the purposes of this analysis advertising costs are assumed to be the same or process-independent Advertising is really more dependent on business strategy than on the process although it should be noted that wet cleaning does offer some unique marketing opportunities as well as challenges as a non-toxic aqueous-based alternative to PCE dry cleaning
4-27
44 Summary Analysis of Financial Assessment
Case Study
Start-up Cost Analysis The cost of starting up Cleaner by Nature included $96523 in one-time costs and $48048 in additional operating capital paid out during the first year of operation before a positive cash balance could be sustained The start-up costs paid at Cleaner by Nature would have been lower if the wet cleaner was set up as a typical comer cleaner with the plant and drop-shop in the same location These start-up expenses are in line with what a dry cleaner is expected to pay One-time start-up costs for a dry cleaner have been estimated between $110770 and $160580 and operating capital between $40000 and $6500048
ProfitLoss Analysis Cleaner by Natures Income Statement revealed a rapid decline in losses from the first quarter of operation (over $30000) to the third quarter (under $9000) By the fourth quarter Cleaner by Nature had turned a profit of 3 -- revenues generated exceeded expenses accrued in each of the final three months of the wet cleaners first year of operation If Cleaner by Nature had been a typical owner-operated cleaner in a single facility it would have made a profit of 10 in its final quarter of the first year of operation Projecting Cleaner by Natures revenues and expenses into the second year based on increases in revenue that have been identified along with an assumption of increased efficiencies in labor and capital equipment use gives a profit estimated at more than 17 for the year
Pressing Productivity Analysis Because wet cleaning may limit the efficiency of pressing labor an analysis was undertaken of the rate at which garments were pressed at Cleaner by Nature over the first year of operation The efficiency of pressing productivity at the wet cleaner increased in the fourth quarter after new tensioning equipment was purchased
Comparative Analysis
Equipment Cost Comparison The purchase price of plant equipment used at Cleaner by Nature ($70715) was 9 lower than the cost of equipment for a comparably sized dry cleaner While the cost of the cleaning system was less in wet cleaning there were higher costs for its pressing equipment The actual yearly expense of operating wet cleaning equipment was 31 lower for the wet clean equipment This is due to the fact that the wet clean machine is
48 Business Start-Up Guide Dry Cleaning Entrepreneur Business Guide No I 037 Entrepreneur Group 1993 p 1037-145
4-28
expected to last longer than dry clean machines (15 years vs 10 years) and because the cost of maintaining the cleaning equipment over its useful life is substantially lower in wet cleaning
Pressing Time Comparison Pressers at Cleaner by Nature took 70 longer to press a garment that had been wet cleaned than pressers at two nearby dry clean shops Because this study compared pressing time at different businesses it was not able to control for one key factor (skill of the presser) and only partially controlled for the garment characteristics quality and productivity demands of the cleaner Other estimates of pressing time difference which more adequately control for some these variables report a smaller difference A study by Environment Canada which was better able to control for these variables reported that at one cleaner a presser took 15 longer to press a garment that had been wet cleaned than the identical garment that had been dry cleaned At anther cleaner the presser took 25 longer pressing the identical garments Overall pressing labor time was estimated to be 20 and 70 greater in wet cleaning than dry cleaning
Overall Cost Comparison Estimates of greater equipment expenses from dry cleaning and greater pressing labor cost for wet cleaning were used as a basis for estimating how the overall cost of these two cleaning techniques compare and how these costs influence the profitability of wet cleaning relative to dry cleaning Overall wet cleaning was estimated to be more profitable than dry cleaning if the dry cleaner pressed only 17 faster and less profitable than dry cleaning if the dry cleaner pressed 41 faster A line by line analysis of expenses revealed that costs for pressing labor insurance utilities detergent and claims were greater in wet cleaning while expenses for machine purchase machine maintenance and government regulation were greater in dry cleaning Pollution liability insurance currently an option for dry cleaners is an additional expense that costs an average of 9 cents per garment Legislation in several states designed to reduce potential liability for dry cleaners can cost a dry cleaner as little as 3 cents per garment (in Minnesota) to a high of more than 12 cents a garment (in Florida and Kansas)49 A more detailed analysis of liability factors is discussed in Section VI
In sum the case study demonstrated that professional wet cleaning can be a financially viable alternative to dry cleaning The wet cleaner was able to meet its expenses by the end of the first year and make a profit by the fourth quarter of the first year The comparative analysis revealed that while a wet cleaner is likely to pay more than a dry cleaner in labor costs for pressing the dry cleaner is likely to incur more expenses in purchasing and maintaining the cleaning machine and more in government regulation Additionally the emergence of voluntary or mandatory pollution liability insurance has the potential of making wet cleaning a more economically viable alternative to PCB-based dry cleaning
bullbull These costs include surcharges on CE annual fees and gross receipts tax The per piece costs were calculated under the assumption that the model dry cleaner was processing 48 I 08 pieces per year with annual gross receipts of $259904 and consuming 000206 gallons of PCE per garment
4-29
Section 5
Environmental Assessment of Wet Cleaning
5 Environmental Assessment of Wet Cleaning
51 Overview
The pollution prevention benefit of substituting wet cleaning for dry cleaning is that it eliminates the use of PCE in professional cleaning Wet cleaning represents reduced toxic air emissions and occupational exposures reduced potential for water and soil contamination (and thus reduced liabilities) and reduced hazardous waste generation Changes in PCE control technologies available to dry cleaners need to be factored into any environmental assessment given their ability to reduce though not eliminate PCBshyrelated impacts On the other hand concerns have been raised about potential environmental impacts from the wet cleaning process such as increased volume of water use which may represent an environmental burden in a region such as Southern California which is dependent on imported sources of water
In order to determine whether wet cleaning is a viable pollution prevention alternative to dry cleaning the analysis focused on three key environmental inputs and their pollution outputs 1) water 2) energy and 3) chemical For each component the assessment includes a plant level case study of Cleaner by Nature a plant level analysis comparing Cleaner by Nature and dry cleaning and a regional analysis that identifies the environmental impacts from the comparative assessment situated at a regional scale Each of the three sections (water energy and chemical) are organized into three parts the Cleaner by Nature case study the comparison to dry cleaning and the regional analysis
bull The analysis of water use which was based on metering and machine specifications indicated that wet cleaning used 77 more water than dry cleaning That translated into a regional water demand of 631 acre feet equivalent to a population increase of 3036 people if every dry clean facility in the Southern California region were converted to professional dry cleaning This scenario of increased regional use did not generate concern among regional water planners
bull The analysis of water discharges which evaluated the water quality of the effluent from the wet cleaning machines did not identify any significant environmental impacts In Los Angeles it is illegal for dry cleaners to discharge PCB-contaminated wastewater though contamination from spills or other inadvertent discharges may still occur
5-l
Energy
bull The analysis of energy use based on metering and machine specifications indicated that energy use was comparable for both processes Wet cleaning uses more natural gas than dry cleaning but also uses less electricity Since natural gas generation produces fewer pollutants than electricity wet cleanings lower electricity use offsets its greater use of natural gas
Chemical
bull Chemical inputs and outputs measured through agency data sources machine specifications material safety data sheets and in plant surveys indicated no significant chemical uses and outputs for wet cleaning Even when fully complying with current mandated requirements dry cleaning still generates substantial amounts of PCB emissions and hazardous waste
52 Methods for the Environmental Assessment
521 Framework for the Plant Level Analysis
Two equipment categories were used within each of the components cleaning machine use (in the case of Cleaner by Nature the 3050 pound Aquatex washer and 50 pound natural gas dryer) and non-cleaning machine use which covers all other equipment used either at Cleaner by Nature or at an equivalent dry cleaning plant This plant level analysis is based on identifying at the plant level what differences there would be if dry cleaning equipment were used instead of wet cleaning equipment at the Cleaner by Nature demonstration facility for the same volume of business Thus the plant level analysis provides specific real world data comparing a start-up commercial wet clean facility with a similarly-sized dry cleaner
Information regarding Cleaner by Nature was gathered through metering and record-keeping at the plant To establish equivalent comparative data for dry cleaning three different types of dry cleaning equipment were selected These configurations of dry cleaning equipment described below represent the range of machines most likely to be used in this region in the next decade The data from these configurations in turn are derived from equipment specifications (that is estimates provided by the manufacturer) as well as previous studies on wet cleaning and dry cleaning that also include some primary data In addition to their specialized cleaning equipment both wet clean shops and dry clean shops utilize domestic washers and dryers for certain garments Environmental inputs and outputs from the use of these machines also need to be accounted for since their uses may vary in wet cleaning and dry cleaning The three dry cleaning configurations used for the plant level analysis are
5-2
Dry Cleaning Configuration 1 Non-converted closed-loop machine with a refrigerated condenser1 as a primary pollution control device and a carbon absorber2 as a secondary device In the Southern California region every current start-up dry cleaner and every dry cleaner that has not yet complied with South Coast Air Quality Management District (SCAQMD) Rule 1421 3 must choose this configuration in order to operate a PCE machine
Dry Cleaning Configuration 2 Non-converted closed-loop machine that uses only a primary control device (a refrigerated condenser) A total of 63 of all machines in the SCAQMDs boundaries had this configuration in 1994 according to a SCAQMD inventory Since the regulations do not require existing machines with primary controls to change this configuration should still be dominant in the near future
Dry Cleaning Configuration 3 Converted closed-loop machine with a primary pollution control device This is the least stringent configuration of PCE control technology allowable after 1998 in California Comparative data about this machine provide a less conservative estimate of outputs and account for much of the dry cleaning equipment population not represented by the first two configurations
Since environmental inputs and outputs are generated at each stage of the cleaning process quantifying the total amount of each input and output generated in wet cleaning and dry cleaning requires identifying the places in the cleaning process where the resource is used or environmental output generated estimating the level of input or output at each source and summing across the different sources In addition for dry cleaning the amount of each input and output generated depends on the particular equipment configuration as described above The sources of information for the plant level dry cleaning assessment included a survey of three dry cleaners to identify certain input and output information a survey of dry clean equipment manufacturers to establish information based on manufacturer specifications and the 1992 survey of dry cleaners by the California Air Resources l3oard4
522 Framework for the Regional Analysis
While the plant level analysis assists in understanding the impacts of the demonstration site it is also valuable to place that information in a broader context Consequently the plant level comparison was used to generalize to the potential regional impacts if all the dry cleaners in the region were to switch to wet cleaning The region is
1 A refrigerated condenser reclaims PCE vapors created during the drying process turning them back into a liquid 2A carbon adsorber captures PCE not reclaimed by the refrigerated condenser by absorbing PCE to the surface of a bed of activated carbon 3Rule 1421 consolidates the federal state and local regulations affecting dry cleaners in the South Coast Air Quality Management District The three dry cleaners surveyed for the environmental assessment were the same three cleaners used for the Repeat Clean test described in Section Ill The CARB survey database of more than 2000 California dry cleaners was provided to PPERC on January 13 1997
5-3
defined as the SCAQMD jurisdiction which includes most of Los Angeles Orange Riverside and San Bernardino counties This area was selected for analysis due primarily to Cleaner by Natures location as well as to the availability of comparative data from regional and state agencies and the regions concern with water and air quality issues The regional analysis of wet cleanings impacts was drawn from Cleaner by Nature data while two types of sources were used to estimate region-wide dry cleaning impacts region-wide data from regional or state agencies (such as the SCAQMD) and plant-level data (including those based on the three dry cleaning configurations) scaled up to the regional level
In order to project data from the plant-level analysis to the regional level and to use consistent geographic areas the 2457 dry cleaning machines in use in the SCAQMD air basin areas were then correlated with the population data provided by the California Department of Finance Demographic Research Unit for the base year of 19945
Appendix 5-A provides a full explanation of this methodology
As there is variation in resource use and pollution outputs among cleaning facilities there are limitations to generalizing from the environmental performance of one wet cleaner Consequently this evaluation is compared to other case studies that have been conducted Further the comparison of the two processes is based on conservative assumptions which may tend to favor dry cleaning Thus the findings represent the more severe negative impacts resulting from a complete shift from dry cleaning to wet cleaning scaling up from Cleaner by Natures first year of operations Finally some environmental impacts are difficult to quantify such as those associated with PCE spills These are discussed more fully in Section VI
5 The number of dry cleaner in the district was derived from a 1994 SCAQMD survey
5-4
53 Water Inputs and Outputs
531 Water Use Concerns have been raised that since the professional wet cleaning process
substitutes water for chemicals wet cleaning could place a particular burden on regions such as Southern California that are dependent on imported water This section examines the volume and nature of water inputs generated by wet cleaning and dry cleaning systems while also modeling water use for other cleaning related equipment
5311 Plant Level Analysis
Cleaner by Natures Water Use
Use in Wet Cleaning At the Cleaner by Nature plant water is used in the Aquatex washer the pressing equipment the domestic washer the spotting board boiler blowdown and the water conditioner6
METHOD
In order to quantify w2ter use by the Aquatex washer meters were installed and read periodically for the period from June 1996 through January 1997 Garment counts were provided by Cleaner by Natures computer cash register There were a total of eight meter readings which occurred approximately every month To develop a more detailed analysis of water use a more intensive two-day evaluation was undertaken of water use by the Aquatex washer including an examination of water use per load Appendix 5-B provides more detailed information on the two-day evaluation In addition water use was estimated for other related uses including the domestic washer boiler and water conditioner Appendix 5-C details the methods for calculating their use
RESULTS
During the period of the eight meter readings of the Aquatex machine an average of 323 gallons of water was used for every 100 garments wet cleaned The Aquatex washer accounted for more than three quarters of all water use at the Cleaner by Nature plant Table 51 provides a breakdown of water use by source of use
bull Water uses which are independent of the professional cleaning process such as sinks and toilets are not included
5-5
Table 51 Water Use at Cleaner by Nature
Eauioment Gallons100 Garments
Aquatex Washer 323
Domestic Washer 33
Boiler (blow-down presses spotting board) 56
Water Conditioner 11
Total 423
Appendix 5-C deta1ls methods for calculabng use
Operational changes at the plant as well as greater efficiencies resulting from the growth in the business may have influenced the level of water use which varied considerably during the monitoring period In general water use per 100 garments increased from June (when the metering began) through November Per garment water use then declined in December and January This trend in use appears to have been influenced by a series of factors During the month of September the washer was reprogrammed to improve performance which subsequently resulted in an increase in the volume of water use In November when water use peaked Cleaner by Nature began for the first time to process wedding gowns which require substantially more water for cleaning than other garments Cleaner by Nature processed 96 wedding gowns in November almost three times the number of gowns processed in January The high volume of use in October might also be a reflection of Cleaner by Nature receiving more velvets during that period which also require more water
The subsequent drop in water use in December and January may also indicate greater efficiencies compared to October and November (after the reprogramming occurred) A trend toward reduced water use continued after the demonstration period (Average water use per l 00 garments from February 1 to June 24 1997 was slightly below the demonstration period average for the Aquatex washer -- 309 gallons compared to 323 gallons -- and significantly lower than the figures for the peak use subsequent to the reprogramming in October and November 1996)7
The average daily water use by the Aquatex washer during the metering period was 546 gallons which corresponded to an average of 169 garments wet cleaned per day during that same period The increase in daily water use broadly coincides with the growth of the business as well with the December and January periods reflecting greater efficiencies with the new programming for the machine Table 52 shows water use per day and per 100 garments for the eight metering periods
7 The 323 gallons per hundred garments corresponds with the Chicago CNT evaluation of a 50-lb Aqua Clean machine which averaged 331 gallons per hundred garments The Environment Canada analysis of their 50-lb IPSO (HFC 234) wet clean machine averaged considerably less water use (163 gallons per hundred garments) However neither CNT nor Environment Canada continuously metered the machine itself The lower water use for Environment Canada might also reflect a greater amount of steam cleaning which can reduce cleaning machine uses
5-6
Table 52 Water Use by the Aquatex Washer at Cleaner by Nature (696-197)
619-30 72-31 81-93 94-30 101-31 111-123 124-11 12-131 Total
GalAvg Day 267 336 407 549 667 779 624 577 546
Gal100 garments 196 259 253 311 403 427 309 313 323
Comparison of Wet Cleaning Water Use to Dry Cleaning
Use in Dry Cleaning Although the term dry cleaning suggests an absence of water in the cleaning process there are specific ways in which water can be identified as an input in dry cleaning Small amounts of water can be added to the dry cleaning solvent to facilitate removal of water-based stains Control equipment may also require water use Refrigerated condensers use water in cooling the refrigerant In Southern California that water typically flows to a cooling tower on the roof where some evaporates and the rest recirculates A minority of carbon adsorbers are steam stripped in order to reclaim the PCE that has been adsorbed by the carbon bed The small secondary carbon adsorbers addressed in our comparison do not require water in stripping Some distillation systems are equipped with steam injection As with wet cleaning the boiler the domestic washer and the water conditioner consume water Non-cleaning machine use varies according to the different domestic washing practices and pressing times associated with each process Process independent water uses like sinks and toilets are not included in the analysis
MEmOD
The water use data for the dry cleaning machine is based on manufacturer specifications combined with information that was provided by the three local dry cleaners There is little reason to expect water use differences between the three configurations since they each use a refrigerated condenser and the secondary carbon adsorber doesnt require steam stripping Therefore all configurations were assigned equal values8 It was also assumed that all three dry cleaning configurations would have a cooling tower based on information provided by equipment distributors and local dry cleaners The cooling tower uses evaporation to cool hot water from the still and the refrigerated condenser for water reuse Generally the Los Angeles area is not hot and humid enough to merit a refrigerated chiller which performs a similar function to a cooling tower
While this may generally hold true one equipment distributor points out that certain older machines dont have a valve regulator to stop water flow when the refrigerator condenser stops operating These machines would send more water to their cooling tower which would result in increased evaporative losses Since there was no available sampling strategy to quantify the extent that this occurs in converted machines an assumption was made that there would be equal water use for each configuration based on what might be a more efficient rather than less efficient scenario (Personal communication with Greg Leiram April 22 1997)
5-7
areas of the plant as well The demands on the boiler would be expected to be slightly less in dry cleaning because of decreased pressing requirements The more conservative assumption (based on the PPERC pressing time study) that pressing time takes 17 times as long in wet cleaning than in dry cleaning was used to calculate pressing water uses in the dry cleaning scenario There would also be less of a demand on the water conditioner in dry cleaning because the process uses less water overall However dry cleaning is likely to have greater domestic washing requirements Appendix 5-D elaborates the methods for calculating water use in the model dry cleaning plant
RESULTS
The greatest differential in water use is associated with the cleaning machines while non-cleaning machine uses are greater for dry cleaning primarily due to greater use of the domestic washer According to these estimates Cleaner by Nature water use is 77 greater than the water use for dry cleaning at the plant level9 Table 53 shows the differences in non-cleaning machine use in dry cleaning while Table 54 shows the difference in overall water use at the plant level
Table 53 Non-Cleaning Machine Water Use Differences
ProcessEouiument Wet Cleanine Use Drv Cleanine Use
Change in gaVlOO garments resulting from switch to Wet Cleanine
Domestic Washinl 11 Joadsdav =551md 36 loadsday =180 ltgtnd - 740 Pressin2 30 2aVlOO ear WC 17 + 124 Water Conditioner 11 2aVl0()Jar 62 aVlOO Jlar +48 Total Non-Machine Difference - 568
Table 54 Water Use in Gallons100 Garments Wet Cleaning and Dry Cleaning
Wet Cleanin2 Use Drv Cleanine Use Cleaning Machine 323 81 Non-Cleanin_g machine 100 157 Plant Total 423 238
bull These figures are higher than the Environment Canada estimate of 22 greater water use for wet cleaning with the Canadian estimates influenced in part by the lack of recycling of the refrigerated condenser water using a cooling tower
5-8
5312 Regional Analysis
METHOD
The regional water use data was derived from 1994 Metropolitan Water District (MWD) data on overa11 regional water use Since the MWD jurisdiction does not fully coincide with that of the SCAQMD which was used for other parts of this assessment county water use values were adjusted upward using the population data discussed in Appendix 5-A
The regional differences shown may overestimate wet cleaning water use for two reasons The estimates do not reflect the potential greater efficiency found at the higher levels of business that have been occurring at Cleaner by Nature nor do they fully account for the adjustments to the reprogramming of the wet clean machine Additionally the estimates do not reflect any possible use of water recycling systems for wet cleaning since Cleaner by Nature did not pursue water recycling when equipment was first purchased given the lack of available recycling units for the Aquatex system at the time
RESULTS
Based on findings from the plant level analysis described above a complete shift of all dry cleaners to wet cleaning amounts to an increase of 0021 of overall regional water uses Table 55 shows the changes of water use by the four counties that make up the region
Table SS Regional Water Uses (in Million Gallons) Comparing Wet Cleaning to Dry Cleaning (Assuming All Dry Cleaners Converted to Wet Cleaning)
SCAQMD Counties DC Use
Usew100 Conversion
to WC Total Urban
Use Increase
w100 WC Los Angeles 170 302 548370 0024 Orange 48 85 188654 0020 Riverside 21 37 100355 0016 San Bernardino 25 44 127073 0015 Total 264 469 964452 0Q21
Put in quantitative terms this increase in use amounts to 205 million gallons of water ( or 631 acre feet) According to regional water planners such an increase would not affect future water supply requirements in the service area of the Metropolitan Water District the regional water supplier of imported water in Southern California 10 By way of comparison an increase of 631 acre feet is the equivalent of a population increase of 3036 people in a region where MWD imported water serves 16 million people 11
10 Personal communication with Andy Sandcavage MWD July 14 1997 11 The population increase figure is based on the MWD future planning estimates of per capita water use of 185 gallons
5-9
Water supply planners also point to a long standing regional concern in relation to the loss of supply associated with groundwater wells no longer in use due to PCE-related contamination or wells that might be forced to shut down if the level of contamination increased 12 PCE control technology and regulations have been developed to reduce risk of water contamination However spills leakage and incidents of non-compliance can still occur According to MWD water supply planners the loss of one small production well -- that is the amount of water available for use on an annual basis -- would itself be equivalent to or greater than the increase in water use represented by a 100 conversion to wet cleaning MWD officials have identified concerns regarding potential PCE groundwater contamination as greater than their concerns associated with increased water use from a scenario based on a shift of all dry cleaners in this region converting to wet cleaning 13
532 Water Discharge
The focus of the water discharge analysis is a water quality evaluation of the effluent from the Aquatex washer at Cleaner by Nature Dry cleaners have raised concerns that water discharges in wet cleaning might contain contaminants due to either the spotting chemicals used in the wet clean process andor from PCE residue found in garments that had been previously dry cleaned For dry cleaning water discharges have historically been a source of concern in relation to possible groundwater contamination Previous studies including an evaluation of PCE-contaminated wells in Fresno California identified dry cleaning as a source of well contamination This was traced to leaking sewer pipes that were located near dry cleaning facilities and which were receiving water discharge effluents from those same plants However current regulations in many areas including Southern California now preclude any direct water discharges from dry cleaners into the sewer system
5321 Plant Level Analysis
METHOD
To evaluate the quality of the effluent discharged at Cleaner by Nature a series of wastewater samples from the Aquatex washer were collected and analyzed The sampling and analysis was undertaken in conjunction with the Los Angeles Bureau of Sanitation (BoS) the agency responsible for evaluating water discharges in the city of Los Angeles where the Cleaner by Nature plant is located
fer day Personal communication with Warren Teitz MWD June 30 1997 2 PCE-contamination has been detected in 158 wells in the MWD service area The potential loss based on the annual
yield of those wells (that is water available for use over a years period of time) is 94000 acre feet (personal communication with Lisa Anderson MWD June 11 1997) Personal communication with Lisa Anderson MWD June 11 1997
5-10
Sampling procedures included the following
Sampling was undertaken at the wet cleaning machine drain rather than at the primary drain for the plant This sampling approach which focused on the wet cleaning machine enabled Bureau of Sanitation personnel to have easy access to the effluent Other plant equipment that uses water such as boilers domestic washers sinks etc is common to both wet and dry cleaners and was not included in this sampling This was done to eliminate unnecessary sources of variation and focus on the output of the wet cleaning machine itself The machines effluent went directly into a drain behind it allowing for immediate and easy access of sampling personnel and equipment
Load-specific samples In consultation with BoS personnel samples for particular loads were used rather than utilizing an all-day sampling and averaging technique According to Aquatexs own study14 the wet cleaning machine has well-defined discharge events Each discharge was sampled individually A composite sample based on the volume of each discharge was also created An automated periodic sampling technique while potentially capturing samples from a greater number of loads may not provide the valuable weighting representation captured by the load-specific technique
Selection ofload type Once the decision was made to sample specific loads and load segments specific load types to sample from Cleaner by Natures Aquatex machine had to be selected Nearly all the programs use the regular Aquatex detergent and finish while a few use the Aquatex leather detergent and finish During the testing period leather loads were run initially only 1-2 times per week (approximately 3 of all loads) Thus sampling was focused solely on loads using regular detergent and finish Both a two-day survey and the cleaners own evaluation identified Program 8 delicate half-load as a frequently used program 15 Within Program 8 four discharge events were identified two after washing (the first W_$h cycle adds detergent while the second wash cycle rinses detergent out) one after finish and a smaller one during extraction (essentially an extension of the finish discharge but subject to greater force)
Spotting chemicals The impact of spotting chemicals was evaluated by sorting two loads into clothing with and without spotting chemical treatment There is little preshyspotting work done by the Cleaner by Nature cleaner When pre-spotting does occur the cleaner uses only a very small amount of chemicals relying on the wet cleaning machine to do most of the spotting work If spots remain after cleaning then the cleaner will do post-spotting with a wider variety of chemicals The loads therefore represent hypothetical maximum and minimum levels of spotting chemicals in the clothing The cleaner predominantly pre-spots with a mixture of water Streetex Wetspo and Aquatex detergent but does not pre-spot with Pyratex the most toxic spotting agent used at the
14 Iowa Techniques Study of Aquatex Machine Effluent Performed by the Hygienic Laboratory at the University of Iowa 1996 15 Program 8 was also used by Aquatex for their own analysis of wastewater effluent thus providing a comparative data source for the PPERC evaluation
5-11
plant The sorted test load for this evaluation used a wide variety of spotting agents one garment each with Wetspo LPS Scram Blood Ammonia and a few garments with the prespotting mixture
Volatile organics Previous studies have shown volatile and semi-volatile organics to be the primary concern for an environmental assessment of wet cleaning effluent Sampling and analysis therefore placed less focus on heavy metals physical properties pesticides and other contaminants A summary of the sampling procedures used to characterize the quality of the discharges and the areas in which analysis was undertaken to establish overall results is found in Appendix 5-E
Results In summary all of the analyzed samples met the BoS s wastewater effluent standards No PCE TCE dioxin or significant amounts of heavy metals were found The only volatile or semi-volatile organics found were acetone and three phthalates all at levels unlikely to have a significant environmental impact The BoS currently enforces the same standards for septic systems as for sewer effluent and does not allow direct discharge to fresh waterways so these findings are applicable to most areas in southern California These findings correspond to the Chicago CNT wastewater analysis
The following sub-sections discuss the results in relation to the different areas of potential environmental concern These include pH levels heavy metals biochemical oxygen demand suspended solids oil and grease and volatile and semi-volatile organic compounds
pH Results The pH measures the acidity or alkalinity of a solution Neutral solutions have a
pH of 7 which reaches higher levels with increasing alkalinity and declines with greater acidity The pH readings were all within the BoSs acceptable range of 55 to 11 The pH for the load without spotting chemicals was slightly acidic while the pH for the spotting chemical load was slightly alkaline during the detergent cycles slightly acidic during the finish cycles and neutral overall Appendix 5-E provides the pH results
Heavy Metals Results Heavy metals in wastewater can be toxic to aquatic life especially if they are
bioaccumulative When metals become highly concentrated in sludge they can also create a hazardous waste The heavy metals found in the Cleaner by Nature effluent were well below BoS limits (30 to 3000 times less) and frequently below detection limits Additionally the detected metals of copper and zinc may be caused in part by background levels found in the incoming water The BoS provided data on background concentrations of certain contaminants in their system The agency samples at points where commercial and residential concentrations can be isolated in order to develop standards for their industrial users such as dry cleaners For this analysis the background copper levels were almost equal to those found in the Cleaner by Nature effluent while the background zinc levels were equal to about 20 of the levels found in the Cleaner by Nature effluent Results of the heavy metals sampling are found in Appendix 5-E
5-12
Biochemical Oxygen Demand Suspended Solids and Oil amp Grease Biochemical oxygen demand (BOD) suspended solids (SS) and oil and grease
(OampG) all describe physical properties of wastewater BOD is the rate at which organisms use the oxygen in water while stabilizing decomposable matter under aerobic conditions SS and OampG can create visible problems and contribute to oxygen-consuming wastes in a water body Appendix 5-E shows the concentrations found in the PPERC wastewater analysis The Chicago CNT wastewater analysis (whose results broadly correspond with the PPERC findings) found generally higher levels of BOD (264-326 mgL compared to 178 mgL for this study) and OampG (15-66 mgL compared to 171 for this study) and lower levels of SS (21-40 mgL compared to 560 in this study)16 The levels found in the PPERC study are all within permissible limits Background concentrations (from residential and commercial sources) of OampG average 399 mgL which actually exceeds the amount found in the Cleaner by Nature sample
Volatile and Semi-Volatile Organic Compounds
Acetone Acetone is a colorless volatile highly flammable liquid widely used as an organic solvent for cleaning painting and other coatings cellulose acetate and in pharmaceuticals such as for smokeless powder and in cigarettes 17 It can cause signs of illness in humans at 800 ppm in air It is not considered to be a total toxic organic (TTO) under federal law but the BoS tests for it since it is a volatile organic compound The BoS currently has no specific limitations for acetone discharge For the Cleaner by Nature effluent analysis the acetone was found only in the load without spotting chemicals and only during the first two wash segments of that load These findings suggest that it came from a residue perhaps smoke that was washed out of the garments and not from the Aquatex or spotting chemicals The Chicago CNT results pointed to a similar conclusion with acetone detected on only one of the three sampling days Acetone is easily biodegradable in wastewater treatment plants and at the level found in the one PPERCBoS sample did not represent a significant environmental impact The acetone results are found in Appendix 5-E
Phthalates Phthalates are semi-volatile compounds derived from naphthalene and can be used in the manufacture of dyes perfumes medicines and detergents25 They are classified as TTOs under federal law and the BoS is currently developing standards for their discharge All three kinds of phthalates were present in both loads sampled The Chicago CNT study also detected the three phthalates in similar concentrations which points to the detergentfinish as a likely source of the compounds The Aquatex study did not detect the phthalates but used higher quantitation limits which in the PPERCBoS sampling would have eliminated detection of all phthalates but the Bis (2-ethylhexyl) phthalate found in the first load (gt01000) As reported in the Chicago CNT study the same phthalates were found in treatment plants at similar levels to those found in the
16 Chris Hayes The Greener Cleaner WaterWastewater Study Center for Neighborhood Technology Chicago 1996 17 Karel Verschueren Handbook ofEnvironmental Data on Organic Chemicals Van Nostrand Reinhold Company NY 1983
5-13
PPERC evaluation Phthalates at these levels should not pose any problems when discharged to a sanitary sewer or septic system Appendix 5-E has the findings from the phthalates analysis
In sum as Table 56 indicates the wet cleaning water discharge findings did not identify any significant environmental impacts from this output analysis The findings are based on the assumption that significant environmental impacts would be those where the permissible limits established at the plant facility level by the Bureau of Sanitation are exceeded Based on their own sampling BOS concluded that Cleaner by Nature would not require any future permit for its water discharges
Table 56 Waste Water Analysis
Wastewater Measure Cleaner bv Nature Standard pH Level 68 55-11 Oil and Grease (mgL) 171 600 Susoended Solids(mL) 560 205 Biochemical OxvJen Demand (mL) 1780 215 Heavy Metals (mgL) - Arsenic
-Cadmium -Chromium -Lead - Nickel - Silver -Copper -Zinc
lt001 lt0005 lt0015 lt001
lt0015 lt00015 0117 08370
3 15 15 5 12 5 10 25
Comparison of Wet Cleaning Water Discharge to Dry Cleaning
Until recent years PCE-laden separator water from dry cleaning was discharged into the sewer until recent years Today this practice is being phased out in a number of states and regions due to more stringent regulations In the City of Los Angeles it is now illegal to discharge CE-contaminated wastewater into the sewer without a permit and dry cleaners have been encouraged to eliminate any such sources of contamination to forego the need of a permit While regulations and equipment have been developed to reduce the risk of groundwater contamination from PCE dry cleaners the risk of spills equipment malfunctions or improper handling of CE-contaminated material cannot be fully controlled Improperly disposed of PCE can contaminate groundwater through breaks or cracks in sewer pipes or through pipe joints or by migrating through the soil Potential sources of CE-contaminated liquid waste include effluent from the water separators steam stripping of carbon adsorbers spills and illegal dumping However there is a lack of current data on wastewater quality for dry cleaning which precludes a quantitative comparison of dry cleaning water discharge to that of wet cleaning
5-14
54 Energy Inputs and Outputs
541 Energy Use
This section examines energy use at the Cleaner by Nature plant and compares it to that of dry cleaning The regional analysis projects the change in energy use on a regional scale resulting from a switch to wet cleaning In addition the regional analysis examines the relative emissions from the two types of energy sources most commonly used in professional garment cleaning natural gas and electricity
5411 Plant Level Analysis
Cleaner by Natures Energy Use
Use in Wet Cleaning At the Cleaner by Nature plant several sources of energy use have been identified as specific to wet cleaning the Aquatex washer the domestic washer and dryer and the boiler The two sources of energy used at Cleaner by Nature are electricity and natural gas bull Natural Gas Cleaner by Nature has a natural gas heated Aquatex dryer Natural gas is
also used by the boiler to generate steam for pressing and spotting and by a water heater
bull Electricity The Aquatex washer and dryer and the domestic washer and dryer use electricity for mechanical action (Cleaner by Nature does not wet clean with heated water so there are no additional energy sources associated with the Aquatex washer) Electricity provides mechanical action in the pressing process for pant topper and form finisher presses Electricity is also used by the boiler a water conditioner an air compressor a vacuum constant and intermittent lighting a small refrigerator and water cooler office equipment and ventilation equipment
MEmOD
For evaluation puqoses natural gas and electricity meters were installed on the Aquatex washer and dryer 18 Meter readings were combined with Cleaner by Nature garment count data for month day and load level water uses Natural gas and electricity use by the domestic washer and dryer were estimated through manufacturer specifications combined with a more intensive one month record-keeping of load numbers and sizes by the cleaner Natural gas and electricity use from all other equipment was estimated through a combination of manufacturer specifications conversations with manufacturers and plant observations A detailed analysis of the methods used by equipment or machine category is provided in Appendix 5-F
18nte installation was done in conjunction with the Southern California Gas Companys Energy Resource Center and Woods Electric a company that offers electrical metering installation and related electrical services
5-15
The wet cleaning system energy data are based on meter readings that occurred approximately each month The figures for average kilowatt- hours per day were calculated on plant operation days only not weekends or holidays Data for non-cleaning machine uses are spread over the entire period based on plant operation days or garments cleaned depending on the equipment
RESULTS
Cleaner by Nature used an average of 1103000 BTUs of natural gas per 100 garments and an average of 25 kWh of electricity per 100 garments during the demonstration period About 93 of all energy used at the plant was derived from natural gas There was an overall trend towards declining energy use particularly in the area of natural gas This trend continued after the demonstration period when the volume processed at the plant increased substantially (from 197 garments cleaned per day in the fourth quarter of the demonstration period to 279 garments cleaned per day in May 1997) During the period from February through June 1997 natural gas use by the Aquatex dryer declined by 14 from the average during the demonstration period19 In terrns of overall energy equivalent values since natural gas is responsible for nearly all the plants energy use this indicates more efficiencies of use related to a greater volume of business Tables 57 and 58 identify natural gas and electricity use respectively for the plant calculated on a monthly basis
Table 57 Month-Level Natural Gas Use at Cleaner by Nature (1996-1997)
Units Source June July Aue Sept Oct Nov Dec Jan Total NG10011ar M 164 181 166 138 172 161 148 156 160 (IOOOBTU) NCM 1070 1097 966 914 942 890 876 920 943
All 1234 1278 1132 1052 1114 1051 1024 1076 1103
Table 58 Month-Level Electricity Use at Cleaner by Nature
Source June July Aue Sept Oct Nov Dec Jan Total Elec100 gar M 3 3 3 2 4 4 3 3 3 (kWh) NCM 26 27 22 20 22 20 19 20 22
All 29 30 25 22 26 24 22 23 25
19 The natural gas meter was read on June 24 1997 for the period from February 1 1997 to June 24 1997 That number was then divided by the number of gannents cleaned per day during that same period and then multiplied by 100 (to normalize on the basis of 100 gannents cleaned) to obtain the 14 reduction figure for the average natural gas use during the demonstration period
5-16
Comparison of Wet Cleaning Energy Use with Dry Cleaning
Use in Dry Cleaning Both natural gas and electricity are used in the PCE machine to generate heat and mechanical action Electricity uses for the PCE machine however also include PCE control equipment such as refrigerated condensers While there are also similarities with wet cleaning in terms of various non-cleaning machine energy uses differences are associated with variations in pressing times domestic washing practices boiler requirements cooling tower use and the need for wastewater evaporators for dry cleaning 20
METHOD
Equipment manufacturer specifications were used to provide comparative information on energy use by PCE machines and other non-cleaning machine related sources An estimate of the different energy use demands from pressing were based on the pressing evaluation described in Section IV The Energy Resource Center of Southern California Gas Company and Edisons Environmental Applications Department also assisted with the energy evaluation
The energy use data for the dry cleaning machine is based on manufacturer specifications combined with a survey of local small-sized dry cleaners There is little reason to expect significant energy use differences between the three configurations of dry cleaning systems selected for the comparison since they all use a still and refrigerated condenser The addition of a secondary carbon adsorber may coincide with the addition of an exhaust fan which operates briefly at the end of the drying cycle However this may vary and the exhaust fan uses an insignificant amount of energy relative to other cleaning machine uses Certain older machines do not use the heat from the refrigerated condenser to assist drying thus causing more steam energy to be used in the drying process21 While this may occur more for the older converted machines it is difficult to quantify Therefore all configurations were assigned equal values
Machine specifications were acquired from several dry cleaning distributors and three were interviewed concerning their approximately 35-pound capacity machines Adina S-37 Multimatic Shop Star 303 and Flourmatic BT37 All machines use a refrigerated condenser secondary carbon adsorber and filter system The machines used electricity to run pump wash extract fan and compressor motors while using boiler steam to generate heat for the still and drying To estimate energy use the equipment ratings were multiplied by the amount of time each component operates during a typical non-pre-wash load according to the distributor The electricity and natural gas results were then averaged for this comparison The average electricity use per load was 17 kWh while the average natural gas use per load was 13000 BTU (assuming the use of the 95 HP boiler at Cleaner by Nature) Non-cleaning machine estimation methods are
20 Again this might represent a conservative estimate indicating greater water uses for wet cleaning from pressing than the Environment Canada estimate of wet cleaning and dry cleaning pressing times described in Section IV 21 Personal communication with Greg Leiram PROS Minneapolis MN April 2 1997
5-17
provided in Appendix 5-G
RESULTS
Overall wet cleaning uses 23 more natural gas and 24 less electricity than its dry cleaning equivalent The greater natural gas use for wet cleaning stems from the increased natural gas demands of the Aquatex dryer and the boiler as a consequence of the longer pressing time required for wet cleaning (on the other hand lower domestic drying requirements result in a decrease in natural gas use) The wet cleaning systems electricity use is less than that of dry cleaning because it does not require control equipment (the increased pressing time demands for wet cleaning would result in the only increase in electricity demand for wet cleaning) Table 59 and 510 show comparative electricity use and natural gas use for wet cleaning and dry cleaning respectively Table 511 details the differences in energy use for non-cleaning related equipment Detailed resource use data for Cleaner by Nature are provided in Appendix 5-H
Table 59 Electricity Use per 100 Garments Dry Cleaning vs Wet Cleaning
Energy Type Source Wet Cleaning Dry Cleaning
Electricity in Cleaning Machine 31 76
kWh Non-Cleaning Machine 216 248
Total 247 324
Table 510 Natural Gas Use per 100 Garments Dry Cleaning vs Wet Cleaning
Energy Type Source Wet Cleaning Dry Cleaning
Natural Gas in Cleaning Machine 160 58
lOOOBTU Non-Cleaning Machine 943 842
Total 1103 900
Table 511 Non-Cleaning Machine Energy Use Wet Cleaning and Dry Cleaning
ProcessEquipment Wet Cleaning Use Dry Cleaning Use
Change per 100 gar
from switch to WC
kWh lOOOBtu
Domestic Washing
Pressing
Evaporator
Cooling Tower
Total Non Cleaning-Machine
11 loadsday
206 kWh 303 kBTU
Not necessary
Not necessary
36 loadsday
WC17
0165 kWhday 1 hr
24 hrsday 2HPhr
-19
+09
-01
-21
-32
-23
+124
0
0
+101
5-18
5412 Regional Analysis
Energy Use
METHOD
The electricity and natural use estimates for the region were developed from 1995 countyshyspecific data supplied by the California Energy Commission22 The plant level energy use comparison provides the basis for energy use estimates The regional energy estimations for wet and dry cleaning are based on the distribution of machines and projection factors shown in Appendix 5-A
REsULTS
As indicated in the tables below the impacts that would result from all dry cleaners in the region shifting to wet cleaning are quite small for both sources Electricity use would decrease by less than a 100th of a percent while natural gas use would increase by less than a tenth of a percent The larger absolute and relative energy uses of natural gas in wet cleaning can be attributed to the increased steam-generation and drying requirements in wet cleaning Tables 512 and 513 present the comparative energy uses with respect to electricity and natural gas represented by a shift from dry cleaning to wet cleaning in the region
Table 512 Regional Electricity Differences (in Million kWh) Posed by Shift From Dry Cleaning to Wet Cleaning
Relrlonal Use1 Current Use
(wdrv cleanine)
Use with 100 Shift to Wet
Cleanine Total County
Electricity Use Decrease
w100 WC Los Angeles 231 176 57697 00095 Orange 66 50 17192 00093 Riverside 29 22 7341 00095 San Bernardino 34 26 8381 00095 Total 360 274 90611 00095
1Regional use is defined by SCAQMD configured counties
22 Since the SCAQMD does not include all of areas the these counties in its jurisdiction these estimates were adjusted to fully coincide with the counties
5-19
Table 513 Regional Natural Gas Use (in Million Therms) Posed by Shift From Dry Cleaning to Wet Cleaning
Regional Use Current Use with
Dry cleanin11
Use with 100 Shift to wet
cleanin11 Total County
Natural Gas Use Increase
w100 WC Los An11eles 64 78 32736 0043 Oran11e 18 22 6556 0061 Riverside 08 10 2845 0070 San Bernardino 09 II 5136 0039 Total 100 123 47273 0049
542 Energy Outputs
MEIBOD
In order quantify the change in emissions resulting from a switch to wet cleaning data was gathered from utility companies and regulatory agencies about emissions associated with the use of natural gas and energy The regional data was acquired from staff at the South Coast Air Quality Management District Southern California Edison and the Los Angeles Department of Water and Power23 The SCAQMD provided emissions factors for the type of natural gas boilers used in wet or dry cleaning plants The Los Angeles Department of Water and Powers Air Quality Group provided a representative emission factor for NOx emissions as result of electricity generation for the area around the Cleaner by Nature plant Southern California Edison provided electricity emission factors for other criteria pollutants
Local electricity generation comes primarily from plants which use natural gas for fuel These emissions estimates do not account for the use of other more polluting electricity-generating facilities like coal-fired or oil-fired plants which may be more prevalent in other regions or at peak times when the cleanest plants cannot meet demand These facilities may be associated with such negative environmental impacts as the generation of greenhouse gases land use impacts from mining or acid deposition
REsULTS
Since natural gas is less polluting than electricity the increase in natural gas emissions resulting from a switch to wet cleaning would be offset by reductions in electricity emissions The Los Angeles regional extrapolations of electricity-related and natural gas emissions based on a shift of all dry cleaners to wet cleaning are shown in Table 514 Overall the net change in regional emissions for each criteria pollutant
23 Personal Communications with Pridim Sharma Southern California Edison (May 9 1997) Jodean Giese Los Angeles Department of Water and Power (June 20 1997) and Chandrashekhar Bhatt South Coast Air Quality Management District (June 20 1997)
5-20
category would be extremely small (between Oto 2 pounds annually) All categories except NOx and VOCs would decrease under the wet cleaning scenario Even with the conservative assumptions made in these estimates wet cleaning presents fewer emissions-related impacts than dry cleaning in terms of energy use
Table 514 Regional Emissions Impact from Energy Generation Posed by 100 Shift to Wet Cleaning
Pollutant Increase in Natural Gas Emissions Decrease in Electricitv Emissions Total Change in Emissions
Lbs emitted (mill ekWh)
(mill ekWh) (lbs) (kWh) (mill kWh) (lbs) (lbs)
NOx 38 0 13 510 240 -002 -416 094
PMlO I 013 014 20 -002 -035 -021
co 10 013 137 150 -002 -260 -123
voe 2 013 027 10 -002 -017 010
SOx 0 013 000 10 -002 -017 -017
Summary of Energy Inputs and Outputs
In sum natural gas represents 93 of all energy uses and electricity represents only 7 of those uses On a comparative basis wet cleaning uses more natural gas but less electricity per I 00 garments cleaned than dry cleaning Scaled to a regional level those differences are not significant There would be a regional increase in natural gas use of 23 million therms (0049) resulting from a 100 shift to wet cleaning Electricity use would decline by 86 million kilowatt hours (00095) as a result of the shift Trends in natural gas use at Cleaner by Nature suggest that wet cleaning could realize greater efficiencies with a higher volume of business In addition the environmental impacts from electricity use are greater than those associated with natural gas use For this study those impacts were evaluated on the basis of a regional emissions factor In terms of the regional analysis the greater emissions impacts from dry cleaning offset the larger volume of use of natural gas in wet cleaning
5-21
55 Chemical Inputs and Outputs
Chemical inputs and outputs based on solvent use have historically represented the environmental area of most concern in garment care A wide range of pollution control regulations have sought to reduce those impacts Concerns have also been raised by dry cleaners that since chemicals are also used in the wet cleaning process and since PCE residues may still be found on garments sent to wet cleaning an environmental assessment also needs to identify_ wet cleaning chemical inputs and outputs
551 Chemical Inputs
55J1 Plant Level Analysis
Cleaner by Natures Chemical Use
Spotting Chemical
Use in Wet Cleaning An assortment of spotting chemicals is used in wet cleaning to remove difficult stains and soils both before and after cleaning
MEIBOD
Data wlisect gathered through interviews with Cleaner by Natures cleanerspotter and plant observation Spotting agents use was monitored for a one month period (Nov 27 1996 through Jan 2 1997) The use was measured by marking the spotting chemical bottles with tape and measuring change over time The toxicity of the spotting agents used at Cleaner by Nature was assessed through material safety data sheets (MSDS) supplied by the manufacturers
RESULTS
Overall Cleaner by Nature uses a small volume of spotting agents under three ounces per 100 garments The qualitative assessment using MSDS revealed Pyratex to be the most toxic of the 17 spotting chemicals evaluated at Cleaner by Nature The cleaner uses small amounts of Pyratex (003 oz100 garments) always after washing and suctions it off the spotting board to a special container At the end of the demonstration period there was only a small amount of fluid inside the container which did not yet require disposal The cleaner reported that he relies on the Aquatex washer to remove stains before resorting to spotting chemical use The wastewater analysis showed that the spotting chemicals made little impact on the largely benign effluent from the Aquatex washer
Appendix 5-1 shows the amount of spotting agents used at Cleaner by Nature to
5-22
clean 100 garments The amounts shown represent the total of each agent accounting for its use alone and in mixtures24 Not shown in the appendix but constituting additional chemical use at the Cleaner by Nature plant were minuscule amounts of Streetan spotter (not measured due to the unique opaque bottle) Odex for mildewy clothes washed in the domestic washer and Ex-it for deodorizing clothes
Cleaning Agents
Use in Wet Cleaning The Aquatex washer uses detergent finishing sizing leather detergent and leather finishing to clean clothes and give them body and shape Detergents clean while finishes soften the garments Sizing is used to give body to woolens jeans and Dockers
MErnoo
There were three types of cleaning agents used at Cleaner by Nature during the monitoring period detergent sizing and finish Regular Aquatex detergent and finish are used in most loads while the leather detergent and finish are seldom used Cleaner by Nature runs about one leather program per week so one-half of a leather load was inserted into the two-day load mix Data on detergent and finish use was gathered during a two-day monitoring period at which time pump tests were performed on the Aquatex washer (Pumps deliver the detergents and finishes to a wash basin and can be tested for accurate load amounts) Use of sizing which was poured in manually to the washer was measured during a two-week period in January As of February 1997 Cleaner by Nature had largely discontinued the use of the sizing due to dissatisfaction with the way it made garments feel An assessment of the cleaning agents chemical characteristics was made through an evaluation of MSDS
RESULTS
Appendix 5-J shows the amount of cleaning agents used at Cleaner by Nature to clean 100 garments In total 488 oz of cleaning agents are used to clean 100 garments with the regular Aquatex detergent and finish constituting over 90 of the volume The cleaning agents are non-hazardous as evidenced by their MSDS sheets and by the results shown in the wastewater study
Chemical Use Comparison with Dry Cleaning
There are a number of chemical inputs and outputs associated with dry cleaning PCE represents both the largest chemical use and the most substantial environmental impacts associated with such uses Additional chemical inputs and outputs are also associated with spotting chemicals and refrigerants used in dry cleaning
24 Three agents are mixed with water to produce a lighter prespotting mixture The cleaner mixed Streetex Wetspo regular Aquatex detergent and water in a 21 112 ratio
5-23
PCEUse
Use in Dry Cleaning As the primary cleaning solvent PCE continues to be the most heavily used chemical in the dry cleaning process
METHOD
The data for PCE use are based on a CARB survey of over 2000 California dry cleaners published in 1992 Dry cleaners were asked in 1991 about their equipment configurations PCE use volume of garments cleaned and waste disposal practices For this analysis the CARB database was reconfigured to include only 30 to 40 pound closed-loop machines having cleaned at least 10000 pounds of garments for that year These matched the three equipment configurations used in the analysis (ie factory machine with refrigerated condenser only factory machine with refrigerated condenser and carbon adsorber or converted machine with refrigerated condenser)
Since the data was based on information gathered five years prior to this study the numbers were adjusted to exclude all factory machines older than five years and all converted machines older than ten years The resulting data set therefore includes fewer of the older machines but fewer of the newer machines found in the current dry clean machine population as well Records containing extreme outliers (eg zero pounds of clothes cleaned) or blank values were also eliminated
The final data set included 295 factory machines with refrigerated condenser only 8 factory machines with both refrigerated condenser and carbon adsorber and 11 converted machines with refrigerated condenser only CARB staff cautioned that the data do not reflect improved operating practices required by its Airborne Toxic Control Measure (A TCM) but also cautioned that PCE use may be underreported and was not field-audited These factors may be largely offsetting but the analysis also included a 50 garmentspound mileage improvement of the final estimates identified in CARBs projected operation improvements under regulation as a conservative assumption
CARB also conducted a telephone audit of its database and found the pounds of clothes cleaned to be underreported for dry cleaners who originally reported processing 30000 pounds or fewer clothes per year The cleaning volumes for 22 of all records were adjusted upward by 35 to create an overall PCE use reduction factor of 77 for the data set This simple adjustment method results in somewhat lower PCE use than would be found using CARB s method since an entire cross-section of cleaning volumes are adjusted not just those under 30000 lbs (though in effect an equal number of volumes (22) are adjusted under both methods)
As shown the PCE use for the different configurations follows the expected pattern of greater PCE mileage efficiencies factory machines with both refrigerated condenser and carbon adsorber use the least PCE while converted machines use the most
5-24
PCE The data represent weighted-average values from the above-described data sets using a one garmentlb conversion Some PCE could be used in spotting but since that information was not available in the CARB data set all PCE uses are identified as machine -based
RESULTS
Table 515 identifies the PCE use for three dry cleaning configurations each of which are sized equivalent to Cleaner by Nature The most efficient machines are estimated to use two tenths of a gallon of PCE per hundred garments cleaned which translates to about four tenths of a gallon of PCE used each day based on the Cleaner by Nature average number of garments cleaned The least efficient of the three machines used 026 gallons per 100 garments cleaned
Table 515 PCE Use in Gallons per 100 Garments Plant Level Analysis
Factory Machines Converted Machines
Refrigerated Refrigerated Refrigerated Condenser Condenser amp Carbon Condenser only
Adsorber
PCE Use foal) 0206 0238 0265
552 Chemical Outputs
PCEOutputs
bull Emissions
METHOD
The new generation of PCE dry cleaning machines has been designed to reduce fugitive PCE emissions into the atmosphere so as to meet permissible emission levels set by the federal Occupational Safety and Health Administration and Title ill of the 1990 Clean Air Act However the control technology does not eliminate emissions Leaks spills and poorly maintained equipment may raise the level of air emissions Moreover even properly operated machines do not completely eliminate PCE emissions Dry cleaned clothes also release a small amount of PCE into the environment a process known as off-gassing Information derived from CARB and SCAQMD reports have been used to characterize the PCE emissions generated by dry cleaning
5-25
RESULTS
A dry cleaner emits between 18 and 2 pounds of PCE into the atmosphere for every 100 garments cleaned As shown in Table 516 the factory machine with a refrigerated condenser has lower emissions than the more advanced factory machine with the additional carbon adsorber However the more advanced factory machine with the condenser produces less hazardous waste (as shown in Table 517) and as a consequence generates less overall PCE waste discharged onto the land as well as into the ambient environment than the refrigerated-condenser-only machine
Table 516 Pere Emissions in lbs per 100 Garments Wet Cleaning and Dry Cleaning
Factory Machines Converted Machines
Refrigerated Refrigerated Refrigerated Condenser Condenser amp Carbon Condenser only
Adsorber
PCE Use (lbs) 20 18 25
bull Hazardous Waste
METHOD
The main types of hazardous waste generated by dry cleaning are spent carbon or carbon cartridges from carbon adsorption systems filters still bottoms and separator water (which in turn is usually evaporated) This type of hazardous waste is collected by companies that specialize in disposal Like wet cleaning dry cleaning generates a relatively small amount of hazardous waste during the spotting process For dry cleaning the CARB survey of dry cleaners was used to estimate the amount of PCB-related hazardous waste generated per 100 garments It was assumed that estimates of the quantity of spotting chemical-related hazardous waste generated in dry cleaning are broadly equivalent to that of Cleaner by Nature There is some evidence that points to wet cleaning actually involving less spotting than dry cleaning because more stains are water based Consequently the assumption about spotting chemical waste generated by dry cleaners is conservative
REsULTS
As shown in Table 517 the hazardous waste generated for the different configurations follows the expected pattern factory machines with the refrigerated condenser and carbon adsorber produce the least hazardous waste while converted machines generate the most
5-26
Table 517 Hazardous Waste Generated in pounds per 100 Garments Wet Cleaning and Dry Cleaning
Factorv Machines Converted Machines Category Refrigerated
Condenser amp Carbon Adsorber
Refrigerated Condenser only
Refrigerated Condenser
No Cartrid11e Filters 0054 0050 0041 Lbs Muck Powder 0 0058 0 Gal Still Bottoms 0090 0188 0152
Refrigerant Outputs
Use in Dry Cleaning Dry cleaners use refrigerated condensers which assist in reclaiming the PCE vapors during the drying process and turning them back into liquid form for reuse as solvent
METHOD
The character and quantity of refrigerant contained in a dry cleaning system has been evaluated Without available specific information on actual refrigerant replacement it is difficult to quantify potential refrigerant emissions from individual dry cleaning machines
RESULTS
Most of the newer dry cleaning machines use R-22 (HCFC-22) as a refrigerant in the refrigerated condenser This refrigerant still has ozone-depleting potential and will be largely phased out by 2020 Older machines may still contain the now banned CFC- I I or CFC-12 refrigerants which have even higher ozone depleting potential as well as contribute to global warming
All three dry cleaner configurations selected for the comparison use refrigerated condensers Based on conversations with distributors machines that have a 35-lb capacity require about IO pounds of initial refrigerant Most said that amount should usually last the lifetime of the machine with leaks rarely occurring
Spotting Chemicals
Use in Dry Cleaning As with wet cleaning spotting agents are used to remove difficult stains
METHOD
Information regarding spotting agent use for dry cleaners was gathered through a
5-27
survey of three local dry cleaners The findings at Cleaner by Nature have been compared with the data gathered from the survey of three dry cleaners and MSDS for the spotting chemicals used at those facilities Spotting chemical use can vary depending on the cleaner Given the limited nature of the PPERC survey the data should be viewed as preliminary
REsULTS
This preliminary comparison indicated higher levels of rriore toxic chemicals used in dry cleaning than in wet cleaning both in terms of variety of agents (about twice the number) and in terms of combined volume (about three to five times the level) As with wet cleaning the dry cleaning spotting chemicals primarily evaporate or accumulate in the holding container in the spotting board Some dry cleaning spotting agents remain in the garments through the PCE washing and then may get disposed with PCE in filters muck and separator water
Cleaning Agents
Use in Dry Cleaning Dry cleaning systems use two different types of detergents injection and charge Injection detergent is disposed of after each wash while the charge detergent is recycled with the solvent In addition some dry cleaners use sizing
METHOD
The volume of injection and charge detergent used was estimated by dry cleaning distributors
RESULTS
Dry cleaning uses about 019 oz of detergent per garment (based on an average of the injection and charge systems) and about an equal amount of sizing agents
552J Regional Analysis
The regional analysis of changes in chemical use resulting from a scenario based on a switch of all -dry cleaners to wet cleaning within the SCAQMD region focuses on PCE-related emissions and hazardous waste Using secondary data on PCE use collected at the plant level the regional analysis projects the chemical-related impacts on a regional level of a switch from dry cleaning to wet cleaning
5-28
Regional PCE Emissions
METHOD
Projected emissions reductions are based on the scenario of a switch of all dry cleaners in the region to wet cleaning It should be noted that the relationship of emissions to exposure will vary depending on the source (eg dry cleaning as compared to degreasing paints and coatings etc) For example PCE emitted through dry cleaning may come into contact with a larger population than industrial uses due to the typically commercialresidential location of dry cleaners and customer contact with garments (This concern of residential exposure for example has led to new regulations in New York City for dry cleaners who are located in residential buildings)
REsULTS
A switch of all dry cleaners to wet cleaning would result in an estimated 42 tons per day or 60 reduction25 in PCE emissions Table 518 identifies regional emissions estimates for dry cleaning and subsequent regional reductions by county based on a conversion of all dry cleaners to wet cleaning The first column in the table identifies SCAQMD projected emissions for 1998 when all the mandated control technologies need to be fully in place The emissions in 1998 would be lower than current levels due directly to these new equipment and operating practices and due indirectly to the projected retirement of 207 machines each of which are related to regulatory mandates
Table 518 Estimated 1998 Regional PCE Emissions in Tons per Day (with new mandated dry cleaning equipment)
County 1998 Dry Cleaning 1998 Total 1998 Region-wide PCE Emissions Region-wide PCE emissions with 100
Emissions conversion to wet cleaninl Lns AnJeles 2729 4548 1819 OranJe 0772 1287 515 Riverside 0344 0573 229 San Bernardino 0399 0665 266 Total 4244 7073 2829
Regional Hazardous Waste Generationmiddot
METHOD
Estimates of hazardous waste generated by PCE dry cleaning were based on the plant-level findings which were then multiplied by the regional allocation factors To account for different dry cleaning configurations the SCAQMD project equipment population for 1998 was used 7 8 factory machines with refrigerated condenser and
25 The California Air Resources Board (in its Technical Support Document to the proposed ATCM) estimates that dry cleaning accounts for 60 of PCB use
5-29
carbon adsorber 686 factory machines with refrigerated condenser only and 236 converted machines with refrigerated condenser Dry cleaner-generated waste was then compared with all hazardous wastes (most recent year 1993) generated for those counties as indicated by the EPAs Biennial Waste Reporting System (BRS)
RESULTS
A conversion of all dry cleaners in the region to wet cleaning would result in a 21 reduction in PCE-contaminated hazardous waste or 1443 tons per year Table 519 provides regional hazardous waste projections for 1998 and projections with a 100 conversion to wet cleaning As shown the percent of all hazardous wastes generated through dry cleaning is much larger in the less industrial counties (eg Riverside County) than in Los Angles County
Table 519 Estimated Regional Hazardous Wastes from Dry Cleaning in Tons per Year
Current Haz Waste Decrease Based on Generation from Dry Total Regional Haz 100 conversion to Wet
SCAOMD Counties Cleaners Waste Generation Cleanin2 Los An2eles 927 6436 14 Oran2e 263 227 116 Riverside 117 43 272 San Bernardino 136 211 64 Total 1443 6917 21
Summary of Chemical Inputs and Outputs
In sum chemical inputs and outputs from dry cleaning are still substantial even as new mandated equipment has increased PCE mileage (efficiencies in use) and regulations have limited certain disposal options (eg sewer discharge restrictions) PCE air emissions in the Southern California region based on full compliance with required equipment changes for dry cleaners are estimated for 1998 at 42 tons per day (or 1533 tons per year) while PCE hazardous waste generation in the region is estimated for 1998 at 1443 tons per year By eliminating the use of PCE in the garment care process a shift to wet cleaning would offer a substantial pollution prevention benefit Wet cleaning like dry cleaning uses some toxic chemicals in the spotting process This chemical use may represent a concern in terms of worker exposure However spotting occurs in both processes and there is some evidence that smaller quantities of toxic spotting chemicals are used in wet cleaning than in dry cleaning
5-30
56 Summary Analysis of Environmental Assessment
No substantial environmental concerns were raised by the environmental evaluation of wet cleaning An increase in regional water use has been identified as a possible negative environmental consequence of a switch to wet cleaning However this study indicates that under the most conservative worst-case assumptions regional water demands would increase by only 0021 not enough to generate concern among regional water planners In addition the Los Angeles Bureau of Sanitations wastewater analysis of Cleaner by Nature suggests that wet cleaning effluent meets all regulatory standards and generates few environmental impacts These findings are confirmed by three prior studies of wet cleaning effluent While regulations and equipment have been developed to reduce the risk of groundwater contamination from PCE dry cleaners the risk of spills or illegal handling of PCB-contaminated material cannot be eliminated For example water planners note that the loss of one small production well from ground water contamination would offset water use increases stemming from a conversion of all dry cleaners to wet cleaning in the region
Energy use data gathered at Cleaner by Nature and modeled for dry cleaning suggests that energy use is comparable for both processes Wet cleaning uses more natural gas than dry cleaning and relatively less electricity Since natural gas generation produces relatively fewer pollutants than electricity generation wet cleanings lower electricity use offsets the greater use of natural gas
New dry cleaning equipment has improved efficiencies in chemical use and reduced chemical outputs However PCE emissions (projected at the regional level at 42 tons per day for 1998) cannot be eliminated even with the newest technology The generation of hazardous waste represents another significant environmental impact in dry cleaning as a consequence ofPCB use
Because it eliminates the use of PCE in the garment care process wet cleaning should be considered environmentally preferable While wet cleaning uses more water than dry cleaning the small amount of increased use from a switch to wet cleaning is less of a concern to regional water planners than possible PCB-related groundwater contamination problems from dry cleaning
5-31

Alternatives to Perchloroethylene-Based Garment Care Assessing the Viability of Professional Wet Cleaning
Final Report Contract No 94-315
Prepared for
California Air Resources Board Research Division
2020 L Street Sacramento CA 95814
Prepared by
Robert Gottlieb Principal Investigator
Peter Sinsheimer Senior Research Associate
Jessica Goodheart Project Manager
Craig Tranby Research Associate
Laura Bechtel Research Associate
University of California Los Angeles Pollution Prevention Education and Research Center
Boelter Hall Room 7440 Los Angeles CA 90024
December 1997
For more information about the ARBs Research Division its research and activities please visit our Web site
httpwwwarbcagovrdrdhtm
Dedication
This Report is dedicated to the late Julie Roque Through her passionate pursuit of the ideals and goals of pollution prevention which she understood were embedded in the complexities of analysis and the details of evaluation she was always available to work with and assist those seeking to identify pollution prevention solutions We continue to miss her
Disclaimer
The statements and conclusions in this report are those of the Pollution Prevention Education and Research Center and not necessarily those of any institution that has funded this work The mention of commercial products their source or their use in connection with material reported herein is not to be construed as actual or implied endorsements of such products
Acknowledgments
This report required a wide range of input and technical review A number of people provided significant support in terms of information technical review and comments We would especially like to thank among others David Adelman (Wyatt-Bennett Equipment Corp) Lisa Anderson (Metropolitan Water District) Angela Barranca (US Environmental Protection Agency -- Region IX) Chandrashekhar Bhatt (South Coast Air Quality Management District) Jim Bienias (Reliance Water Heater Co) Kurt Chester (Rayne Company) Jenni Cho (Korean Youth and Community Center) Jeananne Coop (California State University Long Beach Apparel Design and Merchandizing) Yoram Cohen (UCLA) Joe Chu (CaIOSHA) Deborah Davis (Owner Cleaner by Nature) Ron Deli (Multirnatic) Claudia Der-Martirosian (Lewis Policy Center UCLA) David DeRosa (Greenpeace) Chris Dolan (Iowa Techniques) Sylvia Ewing-Hoover (Center for Neighborhood Technology) William Eyring (Center for Neighborhood Technology) Ken Faig (International Fabricare Institute) Barry Fine (London Cleaners) Jodean Giese (LA Dept of Water and Power) Ranji George (South Coast Air Quality Management District) Barry Gershenson (Sterling Cleaners former president of California Fabricare lnstitiute) Andrea Gough (California Energy Commission) Steve Green (Carriage Trade Cleaners) Deborah Hanlan (US Environmental Protection Agency) Chris Hayes (Center for Neighborhood Technology) Andres Hernandez (Plant Manager Cleaner by Nature) Elizabeth Hill (Pollution Prevention Education and Research Center) Sharon Howell (California Energy Commission) Christina Huber (Pollution Prevention Education and Research Center) Stewart Ilkowitz (Hi-Stearn Corporation) Sharon Im (Korean Youth and Community Center) Hazel Jackson (Associate Professor California State University Long Beach Apparel Design and Merchandizing) Margaret Johnson (Lewis Policy Center UCLA) Von Kennedy (RJ Cool) Kirn Kenson (California State University Long Beach Apparel Design and Merchandizing) Virginie Leenknecht (UCLA) Greg Leirarn (PROS) Charles Lemke (LA Dept of Water and Power) Deborah Lerner (Pediatric amp Family Medical Center) Hong Mai (LA Bureau of Sanitation) Bob McEntyre (Flourmatic) Traci Minarnide (LA Bureau of Sanitation) Mike Mowry (UCLA) Ung Sin (Mike) Na (past president Korean Dry Cleaners amp Laundry Association) Kari Nelson (California State University Long Beach Apparel Design and Merchandizing) Bruce Nordman (Lawrence Berkeley Laboratories) Gregory Ondich (United States Environmental Protection Agency) Dennis Page (Woods Electric) Gary Parker (RSD Cooling Towers) Bhupendra Patel (LA Bureau of Sanitation) Jo Patton (Center for Neighborhood Technology) Howard A Perlman (US Geographic Survey) Colleen Poteet (California State University Long Beach Apparel Design and Merchandizing) Winston Potts (Air Resources Board) Ralph Propper (California Air Resources Board ) Peter Saarna (Statistical Consultant UCLA) Andy Sandcavage (Metropolitan Water District) Deborah Savage (Tellus Institute) Sam Schwartz (International Fabricare Institute) Rajesh Sharma (Pediatric amp Family Medical Center) Donald Shoup (UCLA) Jodi Siegel (Toxics Use Reduction Institute) Sue Stanley (Area Coordinator California State University Long Beach Apparel Design and Merchandizing) Anthony Star (Center for Neighborhood Technology) Pierre Sycip (South Coast Air Quality Management District) Sojeila Sylva (SEED Loan Fund) Wes Tanaka (Southern California Edison) Warren Teitz (Metropolitan Water District) Steve Trainer (Iowa Techniques) Jim Tranquada (UCLA) Willie Valdez (LA Bureau of Sanitation) Elaine Vaughan (University of California Irvine) Julie Venturini (Energy Resource Center) Belinda Vigil (Lewis Policy Center UCLA) Torn Votta (Tellus Institute) Patrice Wong (Korean Youth and Community Center) Todd Wong (California Air Resources Board)
Support for this report was made available through the United States Environmental Protection Agency Office of Research and Development the South Coast Air Quality Management District the California Air Resources Board the Center for Environmental Risk Reduction UCLA the University of California Toxic Substances Research and Training Program and the Los Angeles County District Attorneys Office Occupational and Environmental Division
Table of Contents
Page Number
Abstract i
Executive Summary ii
Part I Background and Methods
Section 1 Background to the Study 1-1 11 Pollution Prevention and the Gannent Care Industry 1-1
l 1 1 The Pollution Prevention Approach 1-2 112 PCE-Based Dry Cleaning and the Need for a Pollution Prevention Approach 1-3 113 Professional Wet Cleaning as a Pollution Prevention Alternative 1-5 114 Description of the Dry Cleaning and Wet Cleaning Processes 1-6 115 The Development of the Wet Clean Industry 1-7 116 The Demonstration Site Evaluation 1-8
12 Cleaner by Nature A Pollution Prevention Demonstration Site 1-11 121 Description of the Evaluation Period the First Twelve Months ofOperation 1-12 122 Demonstration and Outreach 1-15 123 Conclusion Assessing Viability 1-16
Section 2 Methods for Assessing Viability 2-1 21 General Research Method 2-1 22 Evaluation Criteria for Assessing the Viability of Wet Cleaning 2-2 23 The Study Design for Each Section of the Report 2-3
Part II Results
Section 3 Performance Assessment of Wet Cleaning 3-1 31 Overview 3-1 32 Profile of Customer Gannents 3-3
32 l Volume 3-3 322 Garment Type 3-4 323 Fiber Type 3-5 324 Care Labeling 3-6 325 Garment Profile Summary 3-7
33 Analysis of Problem Gannents 3-8 331 Rejects 3-8 332 Claims and Store Credit 3-9 333 Garments Returned for Additional Work 3-10 334 Summary ofProblem Garments 3-14
Page Number
34 Repeat Clean Test 3-16 341 Dimensional Change Evaluation 3-17 342 General Appearance Evaluation 3-23 343 Color Change Evaluation 3-25 344 Odor Evaluation 3-27 345 Summary of Repeat Clean Test 3-28
35 Wearer Survey 3-29 351 Performance Quality Wet Cleaning and Dry Cleaning 3-29 352 Overall Satisfaction Wet Cleaning and Dry Cleaning 3-31 353 Wearer Survey Summary 3-32
36 Customer Satisfaction with Wet Cleaning 3-33 361 Cleaner by Nature Customer Satisfaction Survey 3-33 362 Cleaner by Nature Customer Satisfaction Survey Summary 3-40 363 Dry Cleaning Customer Survey 3-41 364 Dry Cleaning Customer Survey Summary 3-46
37 Summary Analysis of Performance Assessment 3-48
Section 4 Financial Assessment of Wet Cleaning 4-1 41 Overview 4-1 42 Cleaner by Nature Case Study 4-3
421 Start-Up Costs 4-3 422 Cleaner by Natures Profit and Loss 4-6 423 Cleaner by Natures Pressing Productivity 4-12
43 Cost Comparison of Cleaner by Nature and Dry Cleaning 4-13 431 Equipment Cost Comparison 4-14 432 Pressing Time Comparison 4-18 433 Cost Analysis Cleaner by Nature and Dry Cleaning 4-21
44 Summary Analysis ofFinancial Assessment 4-28
Section 5 Environmental Assessment of Wet Cleaning 5-1 51 Overview 5-1 52 Methods for the Environmental Assessment 5-2 53 Water Inputs and Outputs 5-5
531 Water Use 5-5 532 Water Discharge 5-10
54 Energy Inputs and Outputs 5-15 541 Energy Use 5-15 542 Energy Outputs 5-20
55 Chemical Inputs and Outputs 5-22 551 Chemical Inputs 5-22 552 Chemical Outputs 5-25
56 Summary Analysis of Environmental Assessment 5-31
Page Number
Part III Analysis and Conclusion
Section 6 Contributing Factors for Assessing Viability 6-1 61 Contributing Factors to the Assessment of Performance Viability 6-1 62 Contributing Factors to the Assessment of Financial Viability 6-3 63 Contributing Factors to the Assessment of Environmental Viability 6-6 64 Conclusion Assessing Viability 6-7
Section 7 Recommendations 7-1
Appendices
Order Form
List of Tables Page
Number
Table 31 Reject Rate at Cleaner by Nature Over Time 3-9
Table 33 Claims and Store Credit Rate at Cleaner by Nature and a Local Dry
Table 36 Dimensional Change for Identical Dry Clean Only Garments
Table 317 Percent of Wearers Who Thought They Could Identify Wet Cleaned
Table 319 Positive Performance Qualities Experienced by Cleaner by Nature
Table 320 Negative Performance Qualities Experienced by Cleaner by Nature
Table 326 Proportion of Garments Cleaner by Nature Customers Take to Dry
Table 327 Primary Reason Why Cleaner by Nature Customers Also Use Dry
Table 329 Positive Performance Qualities Experienced by Cleaner by Nature
Table 330 Negative Performance Qualities Experienced by Cleaner by Nature
Table 331 Customer Rating of Professional Cleaners Cleaner by Nature
Table 32 Claims Rate at Cleaner by Nature Over Time 3-9
Cleaner 3-10 Table 34 Redo Rate at Cleaner by Nature Over Time 3-11 Table 35 Redo Rate at Cleaner by Nature and a Local Dry Cleaneri 3-13
Repeatedly Wet Cleaned and Dry Cleaned 3-22 Table 37 General Appearance Evaluation middot 3-24 Table 38 Acceptability of General Appearance and Pressing 3-24 Table 39 Color Change Evaluation 3-25 Table 310 Gray Scale for Color Change 3-26 Table 3 11 Chromatic Transference Scale 3-26 Table 312 Odor Evaluation 3-27 Table 313 Positive Performance Qualities Distribution of Wearer Responses 3-30 Table 314 Negative Performance Qualities Distribution of Wearer Responses 3-30 Table 315 Percent with Preference for Wearing One Garment in Pair 3-31 Table 316 Preference of Wearing Wet Cleaned or Dry Cleaned Garmenti 3-31
Garment 3-31 Table 318 Wearers Identification ofWet Clean Garment 3-31
Customers 3-35
Customers 3-36 Table 321 Customer Rating of Cleaner by Nature as a Professional Cleaner 3-37 Table 322 Would Customer Recommend Cleaner by Nature to a Friend 3-37 Table 323 Percent Who Still Consider Themselves Cleaner by Nature Customers 3-37 Table 324 Primary Reason for No Longer Using Cleaner by Nature 3-38 Table 325 Cleaner by Nature Customers Continuing to Use Dry Cleaning 3-38
Cleaners 3-39
Cleaning 3-39 Table 328 Customer Comparison of Cleaner by Nature to Dry Cleaning 3-40
Customers and Dry Cleaner Customers 3-42
Customers and Dry Cleaning Customers 3-43
Customers vs Dry Cleaning Customers 3-44
Page Number
Table 332 Customer Recommendation of Cleaner to a Friend Cleaner by 3-44 Nature and Dry Cleaning Customers
Table 333 Stopped Using Professional Cleaner in the Last Year 3-45 Table 334 Primary reason customers stopped using professional cleaner 3-45
Cleaner by Nature Customers and Dry Cleaning Customers Table 335 Percent ofcustomers using more than one cleaner 3-45
Table 41 Start-Up Costs at Cleaner by Nature 4-4 Table 42 Income Statement for Cleaner by Nature 4-8 Table 43 Typical Cleaner Income Statement 4-9 Table 44 Projected Income Statement for Cleaner by Nature for 4-11 Table 45 Pressing Speed Over Time in Cleaner by Natures First Year 4-12 Table 46 Equipment Costs for Cleaner by Nature and Dry Cleaning 4-16 Table 47 Yearly Equipment Expense Cleaner by Nature and Dry Cleaning 4-17 Table 48 Pressing Speed by Garment Type 4-19 Table 49 Income Statement Comparison Cleaner by Nature and Dry Cleaning 4-24
Table 51 Water Use at Cleaner by Nature 5-6 Table 52 Water Use by the Aquatex Washer at Cleaner by Nature (696-197) 5-7 Table 53 Non-Cleaning Machine Water Use Differences 5-8 Table 54 Water Use in Gallons100 Garments Wet Cleaning and Dry Cleaning 5-8 Table 55 Regional Water Uses (in Million Gallons) Comparing Wet Cleaning to 5-9 Table 56 Waste Water Analysis 5-14 Table 57 Month-Level Natural Gas Use at Cleaner by Nature (1996-1997) 5-16 Table 58 Month-Level Electricity Use at Cleaner by Nature 5-16 Table 59 Electricity Use per 100 Garments Dry Cleaning vs Wet Cleaning 5-18 Table 510 Natural Gas Use per 100 Garments Dry Cleaning vs Wet Cleaning 5-18 Table 511 Non-Cleaning Machine Energy Use Wet Cleaning and Dry Cleaning 5-18 Table 512 Regional Electricity Differences (in Million kWh) Posed by Shift
From Dry Cleaning to Wet Cleaning 5-19 Table 513 Regional Natural Gas Use (in Million Therms) Posed by Shift From 5-20 Table 514 Regional Emissions Impact from Energy Generation Posed by 100 5-21
Shift to Wet Cleaning Table 515 PCE Use in Gallons per 100 Garments Plant Level Analysis 5-25 Table 516 Pere Emissions in lbs per 100 Garments Wet Cleaning and Dry
Cleaning 5-26 Table 517 Hazardous Waste Generated in pounds per 100 Garments 5-27 Table 518 Estimated 1998 Regional PCE Emissions in Tons per Day 5-29 Table 519 Estimated Regional Hazardous Wastes from Dry Cleaning 5-30
List of Fi2ures Page
Number
Figure 31 Garments Cleaned at Cleaner by Nature Since Opening 3-4
Dry Cleaner
Operation (February 1996 - January 1997)
Cleaner by Nature During the First Year ofOperation
Nature and an Area Dry Cleaner
Cleaned Garments
Figure 32 Distribution of Garments Cleaned at Cleaner by Nature and a Local 3-5
Figure 33 Fiber Types Cleaned at Cleaner by Nature During First Year of 3-6
Figure 34 Care Labels on Clothes Cleaned at Cleaner by Nature 3-7 Figure 35 Percentage ofGarments Cleaned Returned for Additional Work at 3-12
Figure 36 Reasons Why Garments Returned for Additional Work Cleaner by 3-14
Figure 3 7 Distribution of Dimensional Change for Wet Cleaned and Dry 3-20
Figure 41 Cleaner by Natures Monthly Expenses and Revenues 4-1 O Figure 42 Process-Dependent Expenses as Percentage ofRevenue 4-25
List of Appendices
Section 1 1-A Partnership Agreement between PPERC and KYCC 1-B Advisory Committee Members 1-C Cleaner by Nature Fact Sheet
Section 3 3-A Gannent Types Cleaned at Cleaner by Nature During First Year of Operation 3-B Distribution of Care Instructions for Three Days of Data Collection at Cleaner by Nature 3-C Gannents Rejected at Cleaner by Nature in First Year of Operation 3-D Claims and Store Credit at Cleaner by Nature 3-E Claims and Store Credit at Dry Cleaner A 3-F Gannents Returned to Cleaner by Nature for Additional Work 3-G Analysis of Gannents Returned by Customers for Additional Work by Fiber Type 3-H Analysis of Gannents Returned by Customers for Additional Work Related to Spotting
Shrinkage or Pressing 3-1 Gannents Returned to Dry Cleaner for Additional Work 3-J List of Gannents Used in the Repeat Clean Test 3-K UCLA Wet Cleaning Demonstration Project Repeat Clean Test Final Evaluation Sheet 3-L Specific Garment Measurements 3-M Methods for Increasing Accuracy in Dimensional Change Evaluation 3-N Dimensional Change in Repeat Clean Test Gannents 3-0 Distribution of Dimensional Change by Gannent Quality 3-P Repeat Clean Test Comparisons 3-Q Telephone Survey of Cleaner by Nature Customer Satisfaction 3-R Analysis of Self-Selection in Cleaner by Nature Customer Satisfaction Survey 3-S Telephone Survey of Dry Cleaning Customer Satisfaction 3-T Center for Neighborhood Technology Repeat Clean Test Raw Data
Section 4 4-A Cash Flow of Cleaner by Nature Through First Year of Operation 4-B Accrued Revenue and Expense Key 4-C Base Prices at Cleaner by Nature and Dry Cleaners Used in the Pressing Time Study 4-D Distribution of Fiber Types Pressed During Evaluation at Cleaner by Nature and Two Local
Dry Cleaners 4-E Environment Canada Pressing Times Study 4-F Process-Dependent Operating Cost Key 4-G Process-Independent Operating Cost Key
Section 5 5-A Methods for Regional Analysis 5-B Two-Day Study Period Cleaner by Nature Water and Energy Use 5-C Water Use at Cleaner by Nature 5-D Water Use in Dry Cleaning 5-E Wastewater Tables 5-F Detailed Energy Use Methodologies 5-G Dry Cleaning Energy Use - Non-Cleaning Machine
5-H Detailed Water and Energy Use Results at Cleaner by Nature 5-1 Spotting Agent Use at Cleaner by Nature 5-J Cleaning Agent Use at Cleaner by Nature
Section 6 6-A State Fees for Reduced Liability Exposures 6-B Provisions for Reduced Liability for State Legislation
Abstract
The report analyzes the viability of Cleaner by Nature a 100 professional wet cleaner and whether professional wet cleaning represents a viable pollution prevention approach in eliminating perchloroethylene (PCE) a chemical solvent used in dry cleaning PCE which has been identified as a toxic air contaminant and probable human carcinogen is heavily regulated in terms of its use in dry cleaning The analysis includes a comprehensive plant level case study and comparative performance financial and environmental assessments of wet cleaning and PCE-based dry cleaning The major issues associated with the viability analyses were identified and specific information was collected in relation to how the clothes were cleaned (a customer garment profile a problem garment analysis a technical evaluation or repeat clean test a wearer survey and customer satisfaction surveys) how wet cleaning did financially (a start-up cost analysis and a profitloss analysis) what environmental impacts were identified (water energy and chemical inputs and outputs) and what contributing factors (technology changes garment manufacturing and labeling and regulatory or legislative actions) influence the viability of professional wet cleaning
Executive Summary
Background
For more than forty years the vast majority of dry cleaners have relied on perchloroethylene (PCE) as the solvent used to clean clothes as part of the dry cleaning process This use has made dry cleaners the single largest market for PCE In recent years however a wide array of scientific studies and federal state and local regulatory actions have focused on PCEs health and environmental risks Costly regulatory and liability actions have created significant economic burdens for cleaners most of whom are small businesses These pressures have prompted a search for alternative cleaning processes
The Research Question
In the past few years computer-controlled washers and dryers have been developed to facilitate the professional cleaning of delicate clothes in water rather than with PCE Though still a small segment of the garment care industry the entry of this wet cleaning process has triggered a widespread debate about its viability and whether it represents an alternative to PCE-based dry cleaning To answer the question of wet cleaning viability the Pollution Prevention Education and Research Center (PPERC)
undertook a 12-montr case study evaluation of a fully operational privately-owned professional wet clean facility This facility called Cleaner by Nature was the first 100 wet clean facility in its region (that is it accepted and professionally wet cleaned the garments that would be cleaned by a typical dry cleaner)
Methods
This report Pollution Prevention in the Garment Care Industry Assessing the Viability of Professional Wet Cleaning analyzes whether Cleaner by Nature has become a viable business It also seeks to analyze whether professional wet cleaning in comparison to dry cleaning represents a viable potential pollution prevention approach The assessment of viability is based on a plant level case study and a comparative analysis of professional wet cleaning and dry cleaning in three key arenas performance (evaluating how clothes were cleaned and customers responded) financial (evaluating start-up costs cash flow and profit and loss) and environmental (identifying and measuring various environmental inputs and outputs) Additional contributing factors such as the risks liabilities and uncertainties of both processes have also been discussed This evaluation of professional wet cleaning was based on facilities that seek to clean all garments brought in for cleaning rather than mixed use facilities where both dry clean and wet clean machines are utilized on site Such an assessment of a mixed use facility would require a different set of methods and data points and would pose different research questions
ii
Results
Performance Assessment In terms of customer satisfaction and technical performance Cleaner by Natures cleaning capability was broadly comparable to that of dry cleaning
During its first year of operation Cleaner by Nature cleaned the full range of garments that are typically taken to a dry cleaner rejecting less than two-tenths of one percent of the 34950 customer garments Cleaner by Nature reported few problems in terms of claims or garments returned for additional work Garments for which Cleaner by Nature compensated customers either with cash or store credit accounted for less than one half of one tenth of one percent of customer garments Problems diminished over time as the wet cleaner gained experience Comparison data on garments returned for additional work showed that Cleaner by Natures performance was comparable to dry cleaning Shrinkage and pressing posed relatively more of a problem for Cleaner by Nature while stain removal was identified as more of a problem for the dry cleaner
A technical performance evaluation compared how wet cleaning and dry cleaning performed on 40 sets of identical garments after repeated cleaning and wear Color consistency and color migration were the areas where slightly greater problems for wet cleaning were most noted although overall changes in color for both wet cleaned and dry cleaned garments were seen as comparable There was slightly greater dimensional change in the length (but not in the width) for wet cleaning although the difference in average length measurement between the two processes (less than one third of one percent) was not statistically significant There were also slightly greater problems in the areas of pressing and general appearance in wet cleaning while there were slightly greater problems for dry cleaning in damage to the fabric or buttons Substantially more evaluators identified a chemical or dry cleaning odor for the dry cleaned garments although all garments had an acceptable odor Volunteers wearing the test garments indicated greater overall satisfaction with the wet cleaned garments with slightly greater detection of shrinkage for wet middotcleaning and of stretching for dry cleaning and slightly greater problems for dry cleaning in stain removal and damage to fabrics or buttons Comparative data on dimensional change from two similar studies showed that for woven garments there was a slightly greater amount of change in the length for wet cleaned garments while the widthwise change was comparable among the wet cleaned and dry cleaned garments For knit garments while there was a substantially greater amount of dimensional change compared to woven garments regardless of the cleaning method this change was barely detectable by volunteer wearers
Customer satisfaction is an important measure of performance in a service industry More than 90 of customers surveyed rated Cleaner by Nature as good or excellent and more than 90 said they would recommend the business to a friend A parallel survey was conducted of dry cleaning customers A comparison of the results showed that customers rated Cleaner by Nature as equal to or better than dry cleaning in nearly all the performance areas with significantly greater satisfaction for wet cleaning in
iii
terms of color feel smell and lack of damage to buttons or decorations There was also continuing growth of new customers for Cleaner by Nature during the year More than three-quarters of customers surveyed who used Cleaner by Nature at least once still considered themselves customers
Financial Assessment In terms of financial viability Cleaner by Nature became profitable by the fourth quarter of its first year of operation while overall costs were comparable between wet cleaning and dry cleaning
Cleaner by Nature built a loyal customer base and significantly increased its revenues during its first year of operation While losses were recorded during its first year Cleaner by Nature succeeded in making a profit of 3 by its fourth quarter By taking into account the fact that Cleaner by Nature has been operating both a plant and a drop-off store as part of its future expansion plans a model plant analysis was developed to evaluate Cleaner by Nature as if it were a typical cleaner operating at a single location This analysis indicated that Cleaner by Nature would have achieved a 10 profit in its fourth quarter Revenues have continued to increase since the demonstration period with profits for the second year projected to be more than 17
The comparative cost analysis of wet cleaning and dry cleaning revealed that Cleaner by Natures equipment costs (both purchase price and maintenance) were lower than those of a similarly configured dry cleaner The purchase costs for the wet cleaning systems including less expensive wet clean machines and more expensive pressing equipment were 9 lower than for the dry cleaning systems Yearly equipment expenses (including use installation and maintenance) were 31 less for wet cleaning than dry cleaning However costs for soaps and labor were higher for wet cleaning than for dry cleaning The higher labor costs for wet cleaning were due to the additional time needed for pressing garments A range of studies including a PPERC pressing time evaluation have identified pressing as more time-consuming for wet cleaning than for dry cleaning Although pressing labor has been identified as a challenge in wet cleaning Cleaner by Natures fourth quarter pressing wages as a percentage of revenue (11 ) were nevertheless close to industry expectations for a profitable cleaner (10) The tradeoff between higher equipment costs for dry cleaning and higher labor costs for wet cleaning meant that overall operating costs for wet cleaning and dry cleaning were similar However dry cleaning expenses would be greater for dry cleaners in those states where dry cleaner-supported liability reduction measures have been enacted and when liability insurance is purchased
Environmental Assessment In terms of the environmental assessment no substantial environmental concerns were raised by the environmental evaluation of wet cleaning while dry cleanings environmental impacts though reduced with new control technologies are still considerable
An increase in regional water use has been identified as a possible negative environmental consequence of a switch to professional wet cleaning However this study
iv
indicates that with conservative assumptions regional water demands would increase by only 0021 (equivalent to a population increase in Southern California of 3036 people) if every dry clean facility in the region was converted to professional wet cleaning Such a scenario did not generate concern among regional water planners In addition the Los Angeles Bureau of Sanitations wastewater analysis of Cleaner by Nature indicates that wet cleaning effluent meets all regulatory standards and generates few environmental impacts These findings are confirmed by three prior studies of wet cleaning effluent While regulations and equipment have been developed to reduce the risk of groundwater contamination from PCE dry cleaners the risk of spills or illegal handling of PCEshycontaminated material cannot be eliminated The loss of one small production well from groundwater contamination due to PCE would offset any increases in water use if all dry cleaners in the region converted to professional wet cleaning
Energy use data gathered at Cleaner by Nature and modeled for dry cleaning indicates that energy use is comparable for both processes Wet cleaning uses more natural gas than dry cleaning and less electricity Since natural gas generation produces relatively fewer pollutants than electricity generation wet cleanings lower electricity use offsets its greater use of natural gas
New dry cleaning equipment has improved efficiencies in chemical use and reduced chemical outputs However air emissions of PCE from dry cleaning cannot be eliminated entirely even with the newest technology At the regional level PCE emissions are projected to be 42 tons per day for 1998 assuming full regulatory compliance The generation of hazardous waste is also substantially greater in dry cleaning as a consequence of PCE use Because it eliminates the use of PCE in the garment care process wet cleaning can be considered an environmentally preferable pollution prevention alternative
Finally contributing factors such as technology changes garment manufacturing and care labeling regulatory legal and legislative processes also have significance in terms of the future viability of wet cleaning and dry cleaning Technology innovation and technology costs changes in garment manufacturing and care labeling and marketing factors may have the most influence on wet cleaning while regulatory and liability factors would have the most significant impacts for dry cleaning
Conclusion and Recommendations
In conclusion pollution prevention approaches can help identify viable technologies or processes which eliminate or reduce negative environmental impacts for the community and in the workplace The case study of Cleaner by Nature demonstrates that a professional wet cleaner could make a profit by successfully cleaning customer garments that would have otherwise been dry cleaned While case studies focus on one particular case by systematically comparing wet cleaning and dry cleaning through a model plant analysis and an analysis that scales these results to the regional level and by also undertaking a comparison of the results to other case studies of wet cleaning it is
V
possible to make a judgment about the overall viability of wet cleaning as a business While there remain challenges in cleaning garments for both wet cleaning and dry cleaning (eg shrinkage and color migration in wet cleaning and stretching and spotting in dry cleaning) and while there are financial tradeoffs for both businesses (eg higher labor and detergent costs for wet cleaning and higher equipment and liability costs for dry cleaning) these performance and financial differences remain small On the other hand environmental impacts are significantly greater for dry cleaning due to PCE use as the cleaning solvent in dry cleaning Based on this comparative analysis the study concludes that professional wet cleaning constitutes a viable pollution prevention approach for the garment care industry
The study then identifies a number of policy recommendations These include providing information and technical assistance to cleaners about wet cleaning economic incentives to facilitate a transition to wet cleaning and regulatory action including the designation of wet cleaning as best available control technology
vi
Part I
Background and Methods
Section 1
Background to the Study
1 Background to the Study
11 Pollution Prevention and the Garment Care Industry
Dry cleaning is a widely recognized method for cleaning delicate garments and a convenient service that is offered in nearly every community in the United States For more than forty years the vast majority of dry cleaners have relied on perchloroethylene (PCE) as the solvent used to clean clothes as part of the dry cleaning process This use has made dry cleaners the single largest market for PCE producers representing as much as 60 of all PCE sales 1 In recent years however a wide array of scientific studies and federal state and local regulatory actions have focused on PCE in terms of the health and environmental risks that it poses Costly regulatory and liability actions are becoming increasingly prevalent for this industry and have created significant economic burdens for cleaners most of whom are small businesses These concerns about the health and environmental effects of PCE regulatory pressures and the threat of liability actions have prompted both inside and outside the garment care industry a search for alternative cleaning processes
In the past few years computer-controlled washers and dryers have been developed to facilitate the cleaning of delicate clothes in water rather than with a chemical solvent This process is known as machine or professional wet cleaning Though still a small segment of the garment care industry the entry of professional wet cleaning has triggered a widespread debate about its viability and whether it represents an alternative to PCB-based dry cleaning To answer that threshold question of wet cleaning viability the Pollution Prevention Education and Research Center (PPERC) undertook a 12-month evaluation of a fully operational privately-owned machine wet clean facility The evaluation has been funded by the South Coast Air Quality Management District the California Air Resources Board and the US Environmental Protection Agency
This report Pollution Prevention in the Garment Care Industry Evaluation of the Viability of Professional Wet Cleaning seeks to answer the question regarding the viability of this potential pollution prevention approach which would substitute for the use of PCE in garment care The assessment of viability is based on two sets of evaluations The first analyzes the viability of a single wet cleaner a commercial operation in the Los Angeles area that also served as the demonstration site for the overall study This plant level analysis describes and analyzes the real world conditions of a new start-up wet cleaner at a particular moment in time facing particular conditions in terms of its operation The second set of evaluations analyzes wet cleaning in relation to PCB-based dry cleaning as a potential pollution prevention alternative This comparative analysis describes and evaluates the issues and impacts associated with a shift to wet cleaning from PCB-based dry cleaning This comparison includes a scaled-up regional
1 1992 California Air Resources Board Survey Database of California Dry Cleaners provided by Ted Wong CARB January 13 1997
1-1
analysis where applicable (that is the impacts that would result if all dry cleaning operations were replaced by wet cleaning at the regional level) as well as other types of comparative evaluations between the two processes (for example customer satisfaction surveys a technical performance assessment and a model financial comparison)
The report provides an overview of the methods and procedures for these evaluations by describing the development of the demonstration facility in its first year of operation and providing a comparative evaluation of wet cleaning and PCE-based dry cleaning in three key arenas performance (how clothes were cleaned and customers responded) financial (how wet cleaning performed as a start-up business in its first year of operation in comparison to dry cleaning) and environmental (what kinds of environmental inputs and outputs could be identified and measured in wet cleaning as compared to dry cleaning) The report then discusses and analyzes these various assessments integrating them into a broader perspective on the viability of professional wet cleaning As part of this integration possible trends and influences such as the evolution of a new technology and the risks liabilities and uncertainties of both processes have also been discussed and analyzed The report concludes by answering the two central research questions posed by this study assessing the viability of a specific professional wet cleaner and whether professional wet cleaning constitutes a viable pollution prevention alternative to PCE-based dry cleaning
111 The Pollution Prevention Approach
The current structure of environmental policy primarily focuses on minimizing pollution that is released into the environment and to a lesser extent mitigating workplace or consumer hazards that may result from the use of hazardous materials This approach has an end-of-pipe focus that is controlling or mitigating the pollution after it has been created The end-of-pipe or pollution control approach also emphasizes the use of technologies and proce~ures to control pollution releases such as new equipment monitoring and reporting requirements and proper disposal While this type of regulation may help reduce environmental and occupation health impacts it fails to address the source of the hazard or pollutant
Since the 1980s an alternative policy approach popularly known as pollution prevention has been developed as a way to focus on reducing or eliminating the source of the hazard or pollutant through new technologies process design change andor undertaking various other source reduction-related changes at any stage in a production cycle Such changes can potentially eliminate the need for end-of-pipe regulatory controls entirely Pollution prevention strategies may rely on regulatory tools voluntary action or economic incentives or disincentives Though still in its infancy as a framework for environmental policymaking pollution prevention potentially offers a new paradigm or framework for action for environmental policy and industry decisionshymaking
1-2
To further that framework for action the Pollution Prevention Education and Research Center (PPERC) was established in 1991 as an interdisciplinary research teaching technical assistance and outreach center PPERC faculty and research associates jointly housed at the University of California at Los Angeles and Occidental College are drawn from the fields of public policy planning toxicology law environmental health biology chemical engineering and environmental engineering As part of its mission PPERC has undertaken a series of industry-specific case studies and policy analyses to identify the opportunities and barriers to a pollution prevention approach The garment care industry subject to a protracted and often bitterly debated regulatory process involving end-of-pipe control requirements and liability considerations represents an important example of the need to assess the viability of this new approach in the specific context of a potential pollution prevention alternative Since 1993 PPERC has been involved in an evaluation of pollution prevention and the garment care industry This report represents a culmination of those efforts
112 PCE-Based Dry Cleaning and the Need for a Pollution Prevention Approach
Since the 1950s PCE has become the dominant cleaning agent in garment care a solvent that is currently used by 90 percent of the more than 30000 dry cleaners operating throughout the United States Due to its low flammability and effective cleaning properties PCE was largely able to displace previous non-aqueous-based solvents used in garment care notably carbon tetrachloride (which was banned due to significant health risks) and petroleum (which has suffered from concerns due to potential fire hazards in garment care facilities) During this period the dry cleaning industry also achieved its name and recognition in part by widely promoting its ability to substitute a cleaning solvent such as PCE for water In tum the dry clean only garment care label was established by actions of the Federal Trade Commission for garments that required professional cleaning as opposed to home laundry cleaning or cleaning in water This care labeling process in particular and the evolution of the dry cleaning business in general occurred in the context of dry cleanings ability to clean clothes that broadly met various industry expectations in such areas as dimensional change (shrinkage or stretching) colorfastness (dye bleed) and overall cleaning quality
Though the dry cleaning industry became subject to certain important changes in the garment manufacturing and marketing processes (for example the growth in casual wear) it has evolved since the 1960s as an increasingly mature industry with a proven technology and an effective method for meeting the objective of professionally cleaning certain garments (primarily those labeled dry clean only) Although dry cleaning has not become characterized as a highly profitable business its relatively low start-up costs and labor intensive requirements make it an attractive option for those with limited capital and a willingness to substitute labor for capital (for example by developing a family-run business) Largely due to these characteristics during the 1980s large numbers of first generation Korean immigrants entered the dry cleaning business By the
1-3
late 1990s Korean cleaners constituted a major segment of the industry as much as 50 to 70 in certain large metropolitan areas such as Los Angeles and Chicago2
The issues facing the industry began to change dramatically during the 1970s and 1980s as a wide array of scientific studies began to evaluate perchloroethy Jene for its potential health and environmental risks PCE air emissions trace levels of groundwater and wastewater discharges and occupational exposures all became issues for regulatory concern and intervention PCE came to be listed as a hazardous air pollutant through a complex and lengthy process established by the Clean Air Act Amendments of 1990 (section 7412 of Title 42 of the United States code) In California the California Air Resources Board (CARB) classified PCE in October 1991 as a toxic air contaminant pursuant to section 39655 of the California Health and Safety Code The National Institute for Occupational Safety and Health (NIOSH) also recommended that PCE be treated as a potential human carcinogen and exposure be kept to the lowest feasible limit3 In Southern California in 1995 the South Coast Air Quality Management District adopted Rule 1421 to consolidate federal state and regional air regulations affecting dry cleaners The rule included equipment and record-keeping requirements designed to reduce emissions and encourage good operating practices among PCE dry cleaners It was motivated in part by a SCAQMD survey of dry cleaners in the South Coast basin which had estimated that for the 2457 PCE machines in use in the region in 1994 emissions were 61 tons per day or 60 of total PCE emissions a high number for an industry dominated by small businesses4 While the extent of PCE emissions and contamination had triggered the need for regulations it also became apparent to SCAQMD EPA and other regulators that those regulations affecting dry cleaners would be difficult to enforce in an industry dominated by thousands of small shops and a high percentage of ownership among recent immigrants Nevertheless given the nature and breadth of the health and environmental risks that were reviewed regulations driven by various statutory requirements were promulgated and a range of pollution control equipment requirements for dry cleaners (many of them expensive) were mandated
The financial and operational concerns for dry cleaners stemming from the wave of environmental regulation have been significantly heightened by the uncertainties and risks associated with the liability provisions for contaminated sites in clean-up legislation regulations and legal actions The most prominent of these laws is the Comprehensive Environmental Response Compensation and Liability Act or Superfund which stipulates that clean up of contaminated sites (whose costs could easily amount to
2 The 70 estimate was provided by the late Hank Kim then President of the Korean Dry Cleaners Association and is cited in Coming Clean Elizabeth Hill Pollution Prevention Education and Research Center 1994 the 50 estimate is derived from an inventory of Korean surnames of the South Coast Air Quality Management Districts list of cleaners in the SCAQMD district area conducted by the Korean Youth and Community Center 1996 3 South Coast Air Quality Management District Staff Report to Propose Adoption of Rule 1421 Control of Perchloroethylene Emissions from Dry Cleaning Systems and Repeal Rule 11021 Perchloroethylene Dry Cleaning Systems (Diamond Bar CA December 1994) 1-4 4 SCAQMD 1994 3-4 California Air Resources Board Technical Support Document - Proposed Airborne Toxic Control Measure and Proposed Environmental Training Program for Perchloroethytlene Dry Cleaning Operations (Sacramento CA August 27 1993) 1-8
1-4
hundreds of thousands if not millions of dollars) may be borne by any number of responsible parties associated with the site including dry cleaners as well as property owners or lenders in those places where PCE contamination has been identified For dry cleaners these potential liability considerations have led to significant uncertainties regarding the future of the business as well as new constraints on current operations such as the increasing number of termination notices or the failure to renew leases by owners of mall sites or other locations where cleaners operate
The range of problems and risks for dry cleaners can be defined as an outcome of a pollution control or end-of-pipe system of environmental regulation and management designed to address a specific pollutant problem but only after the pollution has already been created Many cleaners have responded either by attacking or seeking to modify those regulations or by challenging the nature and the use of the scientific information that has been developed with respect to PCEs health and environmental risks However a number of cleaners have begun to explore whether an alternative approach to costly regulatory combat or compliance is possible The most direct path for such an alternative approach is pollution prevention that is defining an alternative to the source of the problem which has been responsible for costly regulatory interventions Since the early 1990s the focus of that exploration has primarily been wet cleaning a new technology and process change that eliminates the use of PCE the source of dry cleaning regulatory intervention
113 Professional Wet Cleaning as a Pollution Prevention Alternative
In the past few years several new cleaning alternatives that substitute for the use of PCE in garment care have been introduced at the experimental or pilot stage5 Of these alternatives machine wet cleaning has become the most widely available commercial substitute to PCE-based dry cleaning
Wet cleaning refers to a series of techniques used to professionally clean garments in water including the use of new specially designed machines Professional wet cleaning is distinct from home laundering as it requires the knowledge and the finishing capabilities of a trained cleaner It is also distinct from commercial laundering the aqueous process used to clean cotton dress shirts linens and other water-washable items Professional wet cleaning refers to water-based processes designed to clean delicate items including those labeled dry clean only There are generally two categories of wet cleaning Multi-process wet cleaning refers to a series of cleaning techniques including hand washing steam cleaning and controlled application of soap and water Machine wet cleaning uses special washing and drying machines designed to clean delicate
One important alternative involves the use of a carbon dioxide-based system one of whose promoters is seeking to market this technology under the name Dry Wash However neither CO2 nor other non-PCE or petroleum-based cleaning systems are yet available commercially PPERC is in the process of developing a Memorandum of Understanding with Hughes Environmental Systems which has been at the forefront of developing CO2 cleaning technology The Hughes-PPERC agreement is based on a future evaluation of the CO2 technology if and when a Beta site (operational technology but not yet fully commercialized) has been developed
1-5
garments in water The machines can be programmed to control for a number of variables including mechanical action water and detergent volume cycle length and dryer moisture level Specially designed soaps and sizing agents are used to prevent dye bleed and give clothes body and shape In this report professional wet cleaning refers only to machine wet cleaning
While there is consensus in the dry cleaning industry that a number of the garments that dry cleaners receive can be processed in water questions remain whether all customer garments can be successfully machine wet cleaned whether such a wet cleaning business is economically viable and what might be the environmental consequences of using a water-based approach These issues have been explored in this evaluation both by an assessment of a specific professional wet cleaning facility as well as through the comparison of wet cleaning to dry cleaning The facility that was evaluated was established as a 100 wet cleaning facility that is it sought to accept all garments brought in for cleaning similar to a 100 dry cleaning operation The evaluation did not include a mixed use facility where both wet clean and dry clean machines are used within the same site Such an assessment of a mixed use facility would require a different set of methods and data points and would pose different research methods
114 Description of the Dry Cleaning and Wet Cleaning Processes
The primary difference between the wet cleaning and dry cleaning process is the cleaning solvent used Wet cleaning uses water while as many as 90 of dry cleaners in the United States rely on PCE Most of the remaining 10 of dry cleaners use petroleum a solvent that is still considered highly flammable although recent innovations have begun to reduce that concern The choice of solvent in tum influences various aspects of the cleaning process including the types of machines and cleaning chemicals used
Wet cleaning and dry cleaning are similar in many ways In both processes garments are inspected and sorted according to color and garment type Stained or heavily soiled garments are sent to the spotting board where stain-removing chemicals are applied The garments are then placed in machines that add solvent and some combination of cleaning detergent sizing agents and finishing agents6 Through the process of chemical interaction and physical agitation of garments in the drum soils and stains are removed into the solvent The dirty solvent is then extracted Once dried garments are pressed often by using specially designed pressing equipment
The choice of solvent results in several important differences between the processes Wet cleaning is relatively less effective in removing oil-based stains and PCE dry cleaning is relatively less effective in combating water-based stains Consequently different types of spotting chemicals may be used in the two processes to compensate for
6 Finishing and sizing agents are used to restore body and shape to the garment
1-6
their respective shortcomings There are also important differences in the machines Because of the hazards associated with PCE and petroleum garments that are dry cleaned are required to be placed in a closed loop system which means that the washing and drying cycle occur in the same machine and clothes do not need to be transferred (Older dry cleaning machines where the cleaner transfers garments from a washer to a dryer which in tum result in significant emissions during the transfer process are being phased out in California and many other locations) Dry-to-dry machines also purify and recycle the solvent after it is extracted from the drum using an assortment of control technologies Any PCB-contaminated water or material must be disposed of as hazardous waste In wet cleaning garments are placed in the wet cleaning washer which releases the dirty water directly int0 the sewer Once cleaned wet cleaned garments are either placed in a special dryer that is equipped with a humidity sensor or hung out to dry After the cleaning garments ar pressed finished and inspected Most of the pressing equipment used in wet cleaning is the same as the pressing equipment used in dry cleaning However wet cleaners who are processing 100 of garments in water may be more inclined to purchase specially-designed pressing equipment that uses tension to increase the quality and speed of the pressing In addition some new approaches to drying and pressing are being developed such as a drying cabinet Those innovations are primarily oriented towards the wet clean market but some of these (eg tensioning equipment) could be utilized by dry cleaners as well
115 The Development of the Wet Clean Industry
In 1992 US EPA undertook an evaluation of a multiprocess wet clean approach that was based on a quasi-laboratory type non-commercial setting At the time there was no commercial wet cleaning activity to speak of in the United States7 although plans had been developed to establish a handful of commercial wet clean facilities on the East Coast where regulatory battles seemed most pronounced Even as a modest commercial market had begun to develop in Europe wet cleaning in this country was relatively unknown to both dry cleaners and regulators However since 1992 wet cleaning especially machine wet cleaning has grown considerably Currently several hundred advanced computershycontrolled wet cleaning systems have been sold in the United States8 Some major new manufacturers such as UniMac have recently begun to enter the market a change which has al ady significantly increased both the supply and reduced the price of professional wet cleaning machines on the market There are currently seven major manufacturers of professional wet clean machines operating in the United States of these three are USshybased companies9
7 A distinction needs to be made between professional dry cleaning services that include gannents washed in water (such as through hand washing or the use of domestic washers) and cleaning that predominantly or exclusively cleans the full range of gannents in water particularly those that use more sophisticated machines with the types of controls that characterize the contemporary wet cleaning process There are more than IOOO Korean-made Daewoo Electronics Co systems that have also been sold that function as a more advanced commercial washer but without the kinds of controls and technology features of the professional wet clean systems These machines nevertheless have become popular because of their low price (about $900 per machine) for cleaners primarily interested in supplementing rather than replacing their dry cleaning operations 9 Center for Neighborhood Technology Wet Cleaning Equipment Report May I 997
1-7
Despite capturing only a modest share of the garment care market professional wet cleaning has become a major focus of debate among dry cleaners Questions have been raised as to whether a professional wet clean operation that cleans the full range of garments that would otherwise be sent to a dry cleaner can truly be successful This includes questions concerning wet cleanings ability to clean dry clean only garments whether it is capable of turning a profit and assessing whether there are additional costs or environmental problems specifically associated with the wet cleaning process Given the recent growth of the professional wet clean business and the high degree of uncertainty and level of regulatory action that has occurred in relation to dry cleaning an evaluation of wet cleaning as a pollution prevention alternative thus becomes particularly timely and compelling
116 The Demonstration Site Evaluation
In 1994 an agreement was reached between Deborah Davis a San Diego entrepreneur interested in establishing a start-up wet clean business and the Pollution Prevention Education and Research Center The agreement called for PPERC to analyze this new business called Cleaner by Nature as a demonstration evaluation site The PPERC evaluation of the Cleaner by Nature demonstration site has three major components which together provide an answer to the central research question about whether professional wet cleaning represents a viable pollution prevention alternative to dry cleaning The evaluation components include
bull A Performance Assessment measured through a technical wear test customer satisfaction surveys an analysis of problem garments and an assessment of the demonstration sites ability to successfully clean a range of garments
bull A Financial Assessment measured by an analysis of start-up costs cash flow and profitability potential
bull An Environmental Assessment measured by an analysis of key environmental inputs and outputs water wastewater energy and chemicals
In addition the analysis seeks to integrate each of the three assessments as part of a broader discussion of the viability of Cleaner by Nature and the comparisons of wet cleaning and dry cleaning These various assessments are also situated in a specific time frame identifying trends and influences that will have occurred or may occur both prior to and after the evaluation These may include for wet cleaning a rapidly evolving technology or for dry cleaning evolving regulatory and liability considerations Within this consideration of the timing of the evaluation the PPERC demonstration evaluation project itself represents the latest and most comprehensive of a series of evaluations or previous studies of professional wet cleaning These other evaluations and studies include
1-8
USEPA Multiprocess Wet Cleaning Study (Washington DC In 1992 the USEPA launched research into aqueous-based cleaning techniques with a cost and performance comparison of multi-process wet cleaning to PCE-based dry cleaning
Environment Canadas Green Clean Project (Ontario) Environment Canada (the Canadian equivalent of the USEPA) conducted an evaluation and demonstration of wet cleaning in October 1994-1995 That study examined machine-based wet cleaning as well as steam cleaning which was used at several plants around Ontario
The Center for Neighborhood Technology (CNT) Alternative Clothes Cleaning Project (Chicago) In 1995-1996 the CNT in Chicago conducted a year-long evaluation and demonstration of machine-based wet cleaning also at a privately-owned demonstration site
Toxics Use Reduction Institutes (TURI) Cleaner Technology Demonstration Site Case Study (Lowell MA) TURI conducted a demonstration of the Daewoo wet cleaning system
Tellus Institute Pollution PreventionWaste Minimization for Dry Cleaners (Boston) middot Tellus Institute for Resource and the Environment conducted financial analyses of dry cleaners that have upgraded their PCE control technology or switched to wet cleaning
Texas Womans University (TWU) Department of Fashion and Textiles TWU is working in partnership with North Carolina State University to evaluate the performance of a range of professional cleaning methods including machine wet cleaning Funded by the USEPA the research team is working to establish a universally acceptable method of evaluating cleaning technologies
International Fabricare Institute (IFI) (Maryland) IFI has set up wet cleaning machines at its headquarters to serve as a testing facility and demonstration site for cleaners IFI and other dry cleaning trade associations now also offer training in wet cleaning techniques to members
Each of these projects has sought to establish a base of information that ultimately can be used to more effectively evaluate the viability of professional wet cleaning The range and breadth of the PPERC evaluation including the comparative analysis of wet cleaning and dry cleaning operations significantly adds to that information
Aside from the evaluation PPERC has undertaken information dissemination outreach and technical assistance efforts aimed at dry cleaners One of those efforts has been made to reach Korean American dry cleaners who comprise an estimated 50 to 70 of Southern California dry cleaners Towards that end PPERC is working in partnership with the Korean Youth and Community Center a Los Angeles communityshybased organization that provides technical assistance to Korean-owned businesses (See
1-9
Appendix 1-A for a copy of the partnership agreement) This important segment of the industry can play a crucial role in pursuing a pollution prevention alternative PPERC is also working with dry cleaning organizations and with individual dry cleaners to identify methods and provide information that would facilitate such a technology transfer
The PPERC evaluation has been guided by a 14-member Advisory Committee that includes representatives from the dry cleaning industry the apparel industry government agencies environmental and occupational health advocates and experts with backgrounds in evaluation methods and textile science The Committee was established in December 1995 to advise and inform the PPERC project team regarding the details of the evaluation The Advisory Committee was convened on several occasions to discuss the different components of the evaluation It then made specific recommendations that were incorporated into the assessment process In addition Committee members have provided assistance on an individual basis such as active participation in garment selection for the Repeat Clean Test as well as the identification of participating dry cleaners in various assessments such as the pressing time evaluation PPERC however takes full responsibility for the analysis and conclusions of the report Appendix 1-B lists the members of the Advisory Committee
1-10
12 Cleaner by Nature A Pollution Prevention Demonstration Site
On February 6 1996 Cleaner by Nature opened its doors at its drop-off store or agency shop at 2407 Wilshire Boulevard in Santa Monica and began operations at its plant at 3317 La Cienega Place in the city of Los Angeles From the moment Cleaner by Nature opened its doors the demonstration evaluation process began with the formal evaluation period extending from February 1996 to January 31 1997 Since the end of the evaluation period additional information has been obtained about Cleaner by Nature operations in order to help further identify continuing trends
Cleaner by Nature operates as a privately-owned professional wet cleaning facility cleaning the full range of garments that would otherwise go to a dry cleaner A contractual arrangement between PPERC and Cleaner by Nature allowed access to middot financial performance and environmental data and use of the facility for periodic tours Cleaner by Nature was paid a monthly fee for access to the facility and its records Compensation was also provided for staff labor time associated with the demonstration project (for example hosting tours) These fees are identified in the financial section but have been excluded from the overall financial analyses
From the outset of its operation Cleaner by Nature has operated as a 100 professional wet cleaner that is Cleaner by Nature wet cleans all of the garments that come over the counter with the exception of cotton dress shirts and other items which are sent to be laundered and most leathers which are sent to a leather specialist Cleaner by Nature functions as a typical small-sized professional cleaner that seeks to attract a diverse clientele including primarily the middle to upper income customers from the area In this way Cleaner by Nature is similar to other dry cleaners that operate in the same immediate neighborhoods in Santa Monica Its location pricing and overall marketing goals distinguish it from the discount cleaners who promote price and speed rather than quality10 But what most distinguishes Cleaner by Nature from nearly all other cleaners is the cleaning process itself its substitution of water for chemicals as the cleaning solvent
Cleaner by Natures wet cleaning process involves the use of a 3050 pound Aquatex washer11 and a 50 pound natural gas-heated Aquatex dryer instead of a PCE machine Shop owner Deborah Davis chose to locate her drop-off facility in Santa Monica because the city is home to a large number of environmentally conscious consumers and professionals who are likely to use professional cleaning services Furthermore she has directly marketed her business as an environmentally preferable
10 It should be noted parenthetically that not all wet cleaners have sought to promote their business as different from dry cleaning particularly those who have been forced to switch to an alternative cleaning technology by realtors or lenders who didnt want a PCB-based dry cleaner operating on their properties 11 The Aquatex washer can be used both as a professional wet cleaning system and a commercial laundry A maximum capacity of 30 pounds per load is recommended for wet cleaning while the drum can hold up to 50 pounds for laundering
1-11
alternative to PCB-based dry cleaning with print advertisements in local newspapers and mailers to select households in a three-mile radius around the shop Cleaner by Nature is priced competitively to other cleaners in the area 12 During the demonstration period the cost of cleaning a suit for example was $875 See Appendix 1-C for a more detailed profile of Cleaner by Nature
121 Description of the Evaluation Period the First Twelve Months of Operation
Growth of the Business In the first twelve months of operation Cleaner by Nature wet cleaned 34950 garments 13 The volume of clothes cleaned per day has steadily increased at Cleaner by Nature since it opened in February 1996 Its strongest period of growth was the fourth (and final) quarter of the evaluation period when Cleaner by Nature processed an average of 197 garments per day compared to 44 garments per day in its first month of operation Since the evaluation period Cleaner by Nature business has continued to expand averaging more than 265 garments per day in March April and May of 1997 See Figure 31 for a month by month account of Cleaner by Natures growth in terms of garments cleaned per day A more detailed analysis of Cleaner by Nature growth in relation to financial performance is provided in Section IV
Profile ofCustomer Base Cleaner by Nature attracted an average of 167 new customers a month during its first twelve months of operation for a total of 2009 customers Significantly Cleaner by Nature has maintained a high retention rate of its customers even though it has been marketing a new technology and has attracted several customers who have traveled significant distances beyond a one-mile radius from the Santa Monica drop-off store location Many of these customers were curious to try Cleaner by Nature on a one-time basis but subsequently discontinued going to Cleaner by Nature because of distance (while still expressing interest in wet cleaning) The customer profile data was recorded both by Cleaner by Natures computerized cash register and through the Cleaner by Nature customer satisfaction survey Cleaner by Nature also attracted an increasing number of new customers each month a trend that continued after the demonstration period The cash register also kept track of the number of transactions per customer an indicator of customer loyalty A more comprehensive analysis of the data related to Cleaner by Nature customers is provided in Section ID (Performance Assessment) of the report
Staff Growth Turnover and Experience Levels The job duties of the Cleaner by Nature staff are similar to those of a small-sized dry cleaner They include working the cash register marking (initial inspection of the garments tagging and preparing for cleaning) spotting or stain removal cleaning pressing and finishing and assembly Cleaner by Nature largely due to its separate drop-off store or agency has a driver on staff to operate the delivery van that transports garments between the plant and the agency and that is also
12 Cleaner by Natures owner conducted a telephone survey of area dry cleaners to determine a competitive price 13 The Cleaner by Nature plant is in operation five days a week The drop-off store is open six days a week
1-12
used for delivery service In keeping with Cleaner by Natures environmental image the van is a low emissions vehicle (natural gas fuel) However by operating a drop-off store and a plant Cleaner by Nature has required a substantially larger staff than the more typical small dry cleaner operating out of a single facility as described below
In the first twelve months of operation the staff grew from three full and part-time employees to as many as eight full and part-time employees There has been significant staff turnover during the demonstration period The owner attributed the level of staff turnover to a generally high turnover rate in the industry and the fact that she has been striving for high quality work among all employees There have been three cleanerspotters (that is the staff person who has functioned as the primary operations person making the decisions about what and how to clean) All three cleaners were hired in the first six months one was fired the second resigned for personal reasons and the third cleaner continues to operate as Cleaner by Natures cleaner The experience level of the three cleaners varied The first two cleaners each had more than ten years of experience working as dry cleaners The third cleaner was hired initially as a presser and was trained on the job to be a wet cleaner and spotter At the end of the demonstration period Cleaner by Nature had one full-time presser and one half-time presser on staff The pressers have all had experience working as pressers at dry cleaners The clerks have had varying levels of retail college and dry cleaning experience In April 1996 two months after the opening of the shop a delivery driver was hired A full-time agency manager was hired in June aided by a part-time clerk Cleaner by Natures owner also initially worked at the counter for an average of 20 hours a week although the amount of time she spent at the counter declined significantly during the demonstration period and thereafter In July 1996 an assembly person was added to the plant staff
Cleaner by Natures employees are diverse in background ethnicity and cleaningshyrelated experience Aside from finding experienced employees the owner has attempted to hire sufficient numbers of employees in order to handle the newness and uncertainties of a new technology The owner has also set wages to be competitive with overall industry wage levels
Plant and Drop-OffStore Planning for Growth One of the key factors related to Cleaner by Natures operation was the owners decision to open both the drop-off store or agency and plant site rather than a single operation where the plant is typically located at the back of the store and the counter (where garments are accepted) is located at the front This decision has had significant implications for both start-up and operating costs (for example higher utility bills labor costs expenses associated with operating a van etc which are more fully discussed in Section IV) Although some dry cleaners operate as a drop-off store and plant they tend to be larger operations often with two or more agencies sending the garments to be cleaned at a single plant As Cleaner by Nature continued to expand its business the owner decided to open a second drop-off store and was negotiating a lease in the Los Angeles area in December 1997 at the time this report was released
1-13
Cleaner by Natures decision to operate at two locations as an agency and plant was based on a series of considerations On the one hand the owner determined that her ability to locate in Santa Monica or an equivalent location in terms of the clientele she wished to attract was limited by price factors and availability of required space that is available space to be leased was not large enough to accommodate a plant plus a drop-off store andor the cost per square foot of space to be leased was too high for anything but a small drop-off store At the same time Cleaner by Natures owner felt that wet cleaning was likely to be an expanding type of business over time which would make the option of opening a second agency (while still using the single plant) an attractive strategy given the potential for greater efficiencies and thus a reduced cost per garment cleaned (and thus a potentially higher margin of profit)
Partly as a consequence of starting the business as a drop-off store and plant the owner initially needed to work full-time in the business dividing her time between administrative work such as accounting and bill paying and work at the shop and plant A significant amount of that time was spent behind the counter in the first several months of operation However as Cleaner by Nature has realized greater efficiencies with a higher level of business the owner has been able to reduce her hours at Cleaner by Nature most notably in terms of store clerk activities
Employee Training The owner and the initial three members of the Cleaner by Nature staff received about five days of training Iowa Techniques the distributor of the Aquatex wet cleaning system sent a trainer to the Cleaner by Nature plant to work with employees for three days In addition Ann Hargrove then manager of the USEPA wet cleaning demonstration site in Chicago led a two-day training session The owner felt the five day of training was appropriate for Cleaner by Nature as a start-up business but that an existing cleaner could make do with two or three days of training After the tensioning equipment was installed in September Hargrove spent a subsequent day at Cleaner by Nature to see if the pressing speed could be improved She also provided spotting tips and advice on handling wedding gowns
Operations As the Cleaner by Nature staff has accustomed itself to the new process there have been several operational changes Initially all garments were measured by the counter and pressing staff to ensure that any shrinkage or stretching was detected and could be corrected during the pressing process At the end of the demonstration period the staff was only measuring knit rayon and spandex-content garments and upholstery In addition the cleaner initially line dried most wool and rayon garments Currently only the rayon garments and sweaters (about 25 of customer clothes) are being line dried After six months of operating the Cleaner by Nature owner decided to purchase tensioning pressing equipment (a form fitter and pants topper) that is being marketed to wet cleaners (as well as dry cleaners) The equipment applies tension to garments to increase the quality and speed of the pressing This equipment appears to have raised productivity by as much as 20
1-14
The Aquatex washer is reprogrammable and Cleaner by Nature has taken advantage of this twice The first change occurred soon after the February opening to use less soap and speed up the wash cycle The decrease in soap was an effort to save money and the shorter cycles to reduce agitation to the clothes In September Aquatex personnel modified the programs again in an effort to improve performance After this visit Cleaner by Nature once again changed the programs to reduce soap and cleaning time
The owner said she has noticed significant improvement in performance since the opening Spotting techniques have been developed to tackle grease stains in silk a challenge in a water-based process The cleaner has learned to properly dry garments to minimize dimensional change The tensioning equipment has improved the speed and quality of the pressing although she expected the speed to increase more than it has The owner also attributed pressing problems to the high turnover rate in that position
122 Demonstration and Outreach
A key component of the Cleaner by NaturePPERC arrangement has been its demonstration aspect This has included lengthy tours and presentations at the plant and meetings and discussions with the media government officials (for example representatives from the Federal Trade Commission) and various stakeholders interested in professional wet cleaning (for example shopping center owners) During the twelve months of demonstration there have been 14 English-language tours and 6 tours in Korean for Korean cleaners arranged in collaboration with the Korean Youth and Community Center In all 200 people toured the facility during the demonstration period most of them dry cleaners Although the demonstration period has concluded there has been continuing interest by various parties in observing the Cleaner by Nature site and PPERC has developed a second phase of the project which includes significant outreachdemonstration activity Several additional tours have occurred since the demonstration period
The Clean~r by Nature owner has also maintained an interest in developing and further elaborating her operation as an environmentally-oriented business Towards that end she has received honorable mention in the Santa Monica Chamber of Commerces Sustainability Award offered to businesses meeting certain environmental criteria in their operations as well as an award for environmental businesses offered by SCAQMD Although the owner had anticipated a higher level of business at the outset of the operation she has been also surprised at the level of growth that the business sustained during its first year She maintains a longer term interest in expanding her operations even beyond her second drop-off store (also to be served by the existing plant) and ultimately to become a leading operator of professional wet clean systems in the southern California region
1-15
123 Conclusion Assessing Viability
The PPERC demonstrationevaluation of Cleaner by Natures wet cleaning agency and plant operation was organized to answer a series of key questions about wet cleaning viability in relation to PCE-based dry cleaning which are described in the following section on Methods Underlying this evaluation has been the goal of identifying for cleaners regulators consumers and other garment care stakeholders the necessary information that would inform choices about possible pollution prevention alternatives This evaluation of professional wet cleaning further builds on and integrates earlier approaches as part of its effort to develop a thorough and comprehensive comparative evaluation Ultimately it seeks to establish a new framework for helping make future choices that can significantly draw upon the information and analysis presented in this report
1-16
Section 2
Methods for Assessing Viability
2 Methods for Assessing Viability
21 General Research Method
The central methodological question for this study is to determine the extent to which professional wet cleaning provides a viable pollution prevention alternative to PCB-based dry cleaning Answering that question requires analyzing how well professional wet cleaning businesses operating under normal market conditions can successfully clean garments that may require professional care generate revenues and become profitable and minimize any environmental impacts that could result from the cleaning process
In order to answer that question the appropriate methods for such a study needed to be selected To begin with when the study was originally designed in 1995 there was no I 00 professional wet cleaning business operating in the Los Angeles area1 Since Cleaner by Nature was the first 100 professional wet cleaner in the region (that is the first professional wet cleaner to clean the full range of garments that would otherwise go to a dry cleaner) the study was thus initially structured as a detailed and comprehensive case study of Cleaner by Natures performance financial and environmental viability as a new untested business
The most significant methodological benefit of using a case study approach is the in-depth knowledge acquired about the subject of the analysis On the other hand the biggest challenge for any case study approach is its ability to generalize with respect to all possible cases In order to generalize about professional wet cleaning for this study the comprehensive evaluation of the viability of Cleaner by Nature was combined with a series of other data sources that were integrated into an overall comparative analysis of the viability of professional wet cleaning as a pollution prevention alternative This included analyzing and integrating the information available through other case studies of wet cleaning (eg the Environment Canada and Chicago CNT studies described earlier) and then developing comparative data about dry cleaning to be able to assess wet cleanings performance its financial situation and its environmental impacts in comparison to dry cleaning Other contributing factors affecting an assessment of viability such as technology and regulatory issues were also discussed as part of this overall comparative evaluation
1 By 1997 several I00 wet cleaning businesses had been established in Los Angeles and Orange counties
2-1
22 Evaluation Criteria for Assessing the Viability of Wet Cleaning
A series of specific criteria were developed (in the form of questions to be answered) that sought to identify the parameters of what constituted professional wet cleaning (or dry cleaning) viability These criteria based on key performance financial and environmental indicators include
Performance Criteria
bull Can a 100 professional wet cleaner function successfully that is accept the range and types of garments that would otherwise go to a professional dry cleaner
bull Can garments be professionally cleaned without significant problems
bull Can garments be professionally cleaned to the customers satisfaction
bull Can a professional cleaning business develop and maintain its customer base in terms of cleaning performance over time
Financial Criteria
bull Are capital costs in a reasonable range for a start-up business particularly for a small professional cleaner
bull Is the business potentially profitable
bull Do the financial risks associated with the cleaning process or other aspects of the business affect future costs or profit potential
Environmental Criteria
bull Can all environmental regulations be met
bull Are the risks of future environmental regulations such that they might require the professional cleaning business to change in a way that makes it no longer viable
bull Are the environmental impacts from a garment care facility acceptable for the community as well as for those who work at the facility
2-2
23 The Study Design for Each Section of the Report
To implement the general study design specific methods were developed both to carry out the case study analysis of wet cleaning at Cleaner by Nature for each component as well as to compare the results from each analysis with comparable information on the performance capability financial capacity and environmental impact of dry cleaning Such a methodological design provides for both an evaluation of the viability of Cleaner by Nature as a case study of professional wet cleaning as well as a comparative evaluation of wet cleaning and dry cleaning
Part II of the report devotes a separate section to performance capability (Section 3) financial capacity (Section 4) and the environmental impact (Section 5) of wet cleaning Part III of the report includes a discussion section (Section 6) which summarizes the results from each major component and discusses these results in light of the broader contributing factors influencing the performance financial and environmental viability of wet cleaning and dry cleaning Based on this discussion conclusions about the viability of Cleaner by Nature and of professional wet cleaning as a pollution prevention alternative are addressed followed by a series of recommendations (Section 7) The methods used for each section of the report are described below
Section 3 Performance Assessment
For the study performance capacity refers to the ability of professional wet cleaning to successfully clean garments that would otherwise be brought to a dry cleaner The methods for assessing performance included
I) A Profile ofCustomer Garments A profile of the customer garments that are cleaned at Cleaner by Nature included information about the care labels of garments (for example whether a garment was labeled dry clean only) the garment type and the fiber type Analyzing this information helped indicate whether Cleaner by Nature cleaned clothes typically processed by a dry cleaner Data on garment and fiber type were tracked by Cleaner by Natures computer cash register Data on care labeling at Cleaner by Nature was gathered through an inventory of a random sample of customer garments
2) A Profile ofProblem Garments An analysis of rejected garments (garments the cleaner refused to clean) redos (garments that are brought back by customers for additional work) and customer claims (money or store credit for ruined or lost garments) provided a quantitative measurement of the extent and type of garments that pose a problem for professional wet cleaning Data on a number of characteristics of garment rejects redos and claims were collected by Cleaner by Nature throughout the demonstration period Data on store credits was collected only for the last five months Comparable data on redos claims and store credits were collected from two established dry cleaners
2-3
3) Repeat Clean Test A technical evaluation known as the repeat clean test compared professional wet cleaning and dry cleaning performance after the repeated wearing and cleaning of dry clean only labeled garments The purpose of this test is to quantitatively measure the effect of repeatedly cleaning delicate garments by wet cleaning in comparison to dry cleaning A total of three sets of 40 dry clean only labeled garments were obtained for the test Of the set of three one was repeatedly wet cleaned six times another repeatedly dry cleaned six times and a third was stored for comparison purposes The garments were worn before each cleaning by volunteers Trained evaluators with textile backgrounds evaluated the garments for dimensional change general appearance color change resiliency stain and soil removal and hand (or feel) of the clothes after cleaning
4) Wearer Survey A survey was undertaken of the volunteers wearing the garments used in the repeat clean test The purpose of the survey was to compare the results from the quantitative measurement of test garments in the Repeat Clean Test with the experience of customers wearing these same garments The volunteer wearers were given a written questionnaire following the fifth (of six) cleanings The Wearer Survey questions mirror those asked in the Repeat Clean Test and the customer satisfaction survey
5) Customer Surveys A random telephone survey of Cleaner by Nature customers measured their experience and level of satisfaction with the professional wet cleaning process A parallel survey of dry cleanirig customers living in the same geographical area as Cleaner by Nature customers was carried out in order to compare customer experiences and attitudes with a wet cleaner to the experience and attitude of customers using dry cleaning
Section 4 Financial Assessment
For this study financial capability refers to the extent to which operating a professional wet cleaning facility can be profitable Like the other components of the evaluation an assessment of financial viability requires a series of analyses Data from Cleaner by Natures first 12 months of operation serves as the basis of this assessment Comparative data on dry cleaning were gathered from industry sources and previous reports
1) Cash Flow Assessment An analysis was undertaken of the monthly cash collected and costs incurred at the wet cleaner The purpose of this assessment was to quantify the start-up costs (including the cost of equipment installation permits and fees) as well as to evaluate at what point the revenue generated was enough to cover costs
2) ProfitLoss Assessment An analysis was undertaken of the revenues generated from garments serviced at Cleaner by Nature each month and the expenses incurred in processing these garments The purpose of this assessment was to evaluate the profitability of Cleaner by Nature and whether revenues exceeded expenses A model plant analysis was developed to evaluate how Cleaner by Nature would have performed
2-4
as a typical owner-operated cleaner at a single facility Projections were also made of Cleaner by Natures second year of operations
3) Cost Comparison ofCleaner by Nature and Dry Cleaning A comparison of the startshyup and operating costs of professional wet cleaning compared to dry cleaning was also undertaken The purpose of this analysis was to assess how the start-up costs and potential profitability of operating a wet cleaner compare to dry cleaning This analysis isolates those costs that are expected to vary in the two processes or the process dependent costs thus identifying the relative costs and savings of operating a professional wet cleaner like Cleaner by Nature compared to a dry cleaner Dry cleaner costs were based on starting up and operating a similar sized facility as Cleaner by Nature This comparative analysis draws on financial data from Cleaner by Natures first year of operation as well as information from industry sources and reports from regulatory agencies
Section 5 Environmental Assessment
For this study environmental impacts refer to the resource use or environmental pollution-inputs and pollution-related outputs associated with the wet and dry cleaning processes The starting point for this study is the viability of professional wet cleaning as a pollution prevention alternative due to its ability to eliminate the use of PCE in the professional cleaning process Substituting wet cleaning for dry cleaning may have other environmental consequences as well Data gathered throughout the demonstration period on resource use (inputs) and the emissions and waste (outputs) generated at Cleaner by Nature served as the basis for the case study of the environmental impacts of wet cleaning Comparative data on dry cleaning were gathered from industry sources and past reports A comparison of inputs and outputs from wet cleaning and dry cleaning at the plant level were used to project the environmental impacts of these two cleaning processes at the regional scale
1) Water Inputs and Outputs A quantitative measurement of water use and a qualitative assessment of water discharge in professional wet cleaning compared to dry cleaning was undertaken To quantify water the use in wet cleaning meters were installed on the wet cleaning washer and read monthly to estimate the water used per 100 garments cleaned To estimate water use per load a more intensive two-day evaluation was undertaken In addition water use was estimated for other related uses such as that of the domestic washer boiler and water conditioner Comparative data on water use in dry cleaning was based on manufacturer specifications combined with information provided by three local dry cleaners These plant level results were projected to the regional level Water discharge in wet cleaning involved sampling and analyzing effluent emitted from the wet clean washer under different load conditions
2) Energy Inputs and Outputs A quantitative assessment of energy inputs and pollution outputs from energy use in wet cleaning compared to dry cleaning was also undertaken Natural gas and electricity meters were installed on the wet clean washer and dryer to
2-5
quantify the energy used per 100 garments cleaned Natural gas and electricity use from all other equipment was estimated through a combination of manufacturer specifications conversations with manufacturers and plant observations Equipment manufacturer specifications provided comparative information on energy use by dry clean machines and other non-cleaning machine-related sources Because wet cleaning and dry cleaning use different amounts of natural gas and electricity the pollution consequences of this differential use were analyzed at the regional level
3) Chemical Inputs and Outputs A quantitative assessment of the chemical inputs and pollution outputs in wet cleaning compared to dry cleaning was the third component of the environmental evaluation Sampling of both cleaning agent and spotting chemical use was carried out at the wet cleaner The toxicity of the spotting agents used at Cleaner by Nature was assessed through material safety data sheets (MSDS) supplied by the manufacturers Comparative analysis with dry cleaning required estimating PCE input and output in dry cleaning PCE use per 100 garments cleaned was quantified based on a California Air Resources Board survey of California dry cleaners PCE emissions and hazardous waste contaminated with PCE per 100 garments cleaned were quantified using a number of regulatory agency reports In addition spotting chemicals used in dry cleaning were quantified through a survey of three local dry cleaners A regional analysis projected the change in PCE emissions and hazardous waste reduction that would result if ail dry cleaners in the region were to convert to professional wet cleaning
Section 6 Summary and Discussion
The results from the performance assessment the financial assessment and the environmental assessment were then discussed in relation to a series of contributing factors influencing the performance financial and environmental viability of wet cleaning and dry cleaning These included
I) Contributing factors influencing performance viability bull Technological changes bull Garment manufacturing issues bull Care labeling
2) Contributing factors influencing financial viability bull Technological costs bull Marketing issues bull Regulatory or legislative costs
3) Contributing factors influencing environmental viability bull Regulations and legislation
2-6
In light of these contributing factors along with the empirical results of the study each of the evaluation criteria described above were answered with respect to the question of viability Based on this analysis a series of recommendations were then developed specific to the following interested parties
bull Garment Care Industry bull Regulatory Agencies bull Stakeholder Groups bull Consumer Groups
Part II then provides the results from that analysis while Part III offers a discussion of the issues a conclusion and the recommendations
2-7
Part II
Results
Section 3
Performance Assessment of Wet Cleaning
3 Performance Assessment of Wet Cleaning
31 Overview
How does professional wet cleaning perform in terms of its ability to professionally clean dry clean only and other delicate garments under normal market conditions To answer that question a number of different approaches were undertaken in this study with each approach providing an important reference point for both the case study of Cleaner by Nature and for the comparative evaluation ofwet cleaning and dry cleaning These approaches and the results from each of the evaluations can be summarized as follows
bull A customer garment profile assessed how closely the types of garments cleaned at Cleaner by Nature mirror a typical dry cleaner
--indicates that Cleaner by Nature cleaned the volume and mix of garments that would be cleaned by a typical dry cleaner
bull A problem garment profile assessed the degree of difficulty experienced at Cleaner by Nature in successfully cleaning garments brought in by customers
--shows the most common problem areas for wet cleaning were in shrinkage colorfastness and pressing Stain removal was the most common problem area for dry cleaning relative to wet cleaning
bull A repeat clean test evaluated the technical performance ofwet cleaning and dry cleaning under normal market conditions through six repeated cleanings of 40 pairs of identical dry clean only garments
--indicates slight but not statistically significant differences between wet cleaning and dry cleaning in specific performance areas These include slightly greater problems for wet cleaning in shrinkage color change pressing and general appearance and slightly greater problems for dry cleaning in damage to the fabric or buttons
bull A survey ofthe volunteer wearers for the repeat clean test assessed whether the experience of wearing a wet cleaned garment differed from the experience ofwearing a dry cleaned garment
--indicates wearer satisfaction with both cleaning processes with slightly greater concerns about shrinkage in wet cleaning and slightly greater concerns about stretching stain removal and damage to the fabric or buttons for dry cleaning Overall differences however were not significant
bull A customer satisfaction survey assessed the opinions and experience of Cleaner by Nature customers through a random telephone survey
-- indicates strong customer satisfaction with wet cleaning with more than 90 of its customers rating Cleaner by Natures performance as good or excellent while more
3-1
than 90 of the customers were willing to recommend the business to a friend
bull A parallel suney ofdry cleaning customers assessed the opinions and experience of dry cleaning customers by a random telephone survey ofpeople residing in the same geographic area as Cleaner by Nature
-- indicates that Cleaner by Nature customer satisfaction was greater than or equivalent to the satisfaction ofdry cleaning customers in nearly all the performance areas surveyed
3-2
32 Profile of Customer Garments
METHOD
A profile of customer garments received at Cleaner by Nature during the demonstration period was undertaken to determine whether Cleaner by Natme was cleaning the volume and type of garments typically brought to a dry cleaner Four types of information were available for the profile of customers garments 1) the volume of garments cleaned 2) the type of garments cleaned (ie pants shirts) 3) the fiber type of garments cleaned 4) and the percentage of customer garments with dry clean only care labels Information on garment and fiber type and volume was-1racked by Cleaner by Natures computer cash register Fiber type and garment type information is missing for the months of October November and December as a result of computer difficulty during that period Nevertheless information for the remaining months provides a reasonable indication of the distribution of garments and fiber types cleaned during the year-long demonstration period Information about care labeling at Cleaner by Nature was gathered through an inventory of a random sample of customer garments The profile of garments received at the shop puts in context information about the number ofproblem garments received at Cleaner by Nature as well as customer satisfaction
RESULTS
321 Volume
In its first year of operation Cleaner by Nature processed 34950 garments The volume of garments processed per day increased over the course of the demonstration period In its first month Cleaner by Nature processed an average of40 garments per day Business peaked in the 11th month ofthe iear-long demonstration period when Cleaner by Nature processed 213 garments per day While Cleaner by Natures volume was small due to its status as a start-up facility the number of garments processed provides a sufficient sample to make claims about Cleaner by Natures performance The demonstration period was also of a sufficient length to track performance over time Figure 31 provides a month by month account of the number of garments cleaned per month at the facility
1 Additional data from Cleaner by Nature shows that volume at Cleaner by Nature continued to increase beyond the end of the demonstration period In May 1997 the average number of garments cleaned per day was 279
3-3
Figure 31 Garments Cleaned at Cleaner by Nature Since Opening
6000
E 5000
~ 4000 ~
0 )
3000 C u 2000e 0 1000
0 r-- r-- r-- r-- 5 I I I
r--I I I Io o gt ~ t gt o o gtil I j il Q Q 0 lt lt 2 z Q ~ lt
i Demonstration period covered the first year ofoperation (February 1996-January I 997)
322 Garment Type
The mix of garments cleaned during the first year is comparable to the garment mix processed by one large-sized area dry cleaner which provided information for the month ofJanuary 1997 Pants (25) were the garments most commonly wet cleaned at Cleaner by Nature followed by shirts and blouses (24) About 10 of items were suit and outer jackets which are more difficult to clean because they are often highly constructed and can contain linings Jackets may be under-represented because of the missing data for the colder months of November and December Appendix 3-A shows the breakdown of garments cleaned at Cleaner by Nature Figure 32 compares Cleaner by Natures garment distribution to one area dry cleaner
3-4
Figure 32 Distribution of Garments Cleaned at Cleaner by Nature and a Local Dry Cleaner
35
30
25
20
15
10
5
0 ) C I
Cleaner by Nature
Ill Dry Cleaner
Garment lype
Dry cleaner data was supplied by an area dry cleaner for January I 997 Cleaner by Nature data is from February I 1996 through September 30 1996 and for January I 997 Data forthe months of October November and December of 1996 were not available
bull Cleaner by Nature garments in the sport coatjacket category include garments listed by the wet cleaner as jackets or outer jackets Dry cleaned garments in that category were listed as either suit coats or jackets
323 Fiber Type
About 70 of the gannents cleaned at Cleaner by Nature were made of fibers that are typically labeled dry clean only The top fiber seen at Cleaner by Nature was cotton (24) followed by rayon (22) wool (18) silk (16) and linen (11) The percentage ofwool gannents cleaned during the demonstration period may be undershyrepresented because of the computer failure that corrupted data for October November and December See Figure 33 for the distribution of fibers cleaned at Cleaner by Nature
3-5
Figure 33 Fiber Types Cleaned at Cleaner by Nature During First Year of Operation (February 1996 - January 1997)
Linen 109
Wool
155
Miscbull II_
Cashmere 09
Cotton
Do11 06
Polyester 43
i Fibers represented by the dark gray color are typically labeled dry clean only and account for 702 of all garments cleaned al Cleaner by Nature Cotton polyester down and misc categories are fibers normally not labeled dry clean only This chart represents the 60 of the garments cleaned for which fiber information was available (20808134950)
bull Misc includes acrylic leather and ramie
324 Care Labeling
Care label information was obtained from garments cleaned at the Cleaner by Nature plant on three separate occasions The information was gathered at the end of the day on three separate days in January and February for all garments that had been cleaned at the plant About 67 of the garments were labeled dry clean only while the remaining garments were labeled washable either by hand or in a machine This percentage is similar to what is found at dry cleaners according to one researcher2 Figure 34 shows the distribution ofcare labels on garments cleaned at Cleaner by Nature Appendix 3-B shows that the distribution ofcare labels was similar each of the three days that the information was gathered
2 Josef Kurz Textile Care Research Programs in Gennany Proceedings of Apparel Care and the Environment
Alternative Technologies and Labeling EPA744-R-96-002 (September 1996) 64
3-6
Figure 34 Care Labels on Clothes Cleaned at Cleaner by Nature i
Hand or Hand Wash Mashine Wash or Dry CTean
Hand Wash 2 5
Machine Wash 16
2 67
i Chart based on a total of 300 garments cleaned at Cleaner by Nature Out of 300 garments 7 (23) had no care instructions
325 Garment Profile Summary
During the demonstration period Cleaner by Nature cleaned the volume and mix of garments of a typical dry cleaner While Cleaner by Natures yearly volume was small due to its status as a start-up cleaner the number of garments cleaned at the plant during the demonstration period (34950) allows for a useful evaluation of Cleaner by Natures performance
3-7
33 Analysis of Problem Garments
METHOD
During the demonstration period Cleaner by Nature kept records on four types of problem garments rejects (garments turned away by the cleaner because they could not be safely cleaned) customer claims (damaged or lost garments that need to be replaced) store credits (store credit awarded for damaged or lost garments) and redos (garments brought back by customers who felt they required additional attention) The rate ofproblems was examined over time to see whether there was a learning curve with this new technology The analysis ofproblem garments compares claims store credit and redo rates with available information for two experienced dry cleaners3 In addition the analysis compares the types ofproblems encountered by Cleaner by Nature to those encountered in dry cleaning The comparative analysis presents limitations for several reasons including the different stages ofdevelopment of the businesses and technologies being studied The comparative problem garment analysis contrasts the performance of Cleaner by Nature a start-up cleaner mastering a still evolving technology with that of well-established dry cleaners using a mature technology The comparison consequently biases in favor of dry cleaning or provides a conservative assessment of the performance of wet cleaning Furthermore the comparison of technologies may confound differences in the skill level or productivity demands of the cleaner with differences in the technologies Nevertheless the data gathered on dry cleaning provides a useful benchmark from which to evaluate Cleaner by Natures performance
RESULTS
331 Rejects There were a total of 33 items that Cleaner by Nature refused to clean during its first year or 009 of garments received Of those more than 90 were rejected because of problems with colorfastness (A cleaner will typically test a suspect garment for colorfastness prior to cleaning it) The percentage of rejects increased over time In fact Cleaner by Nature did not reject any garments in its first four months ofoperation The increase in the percentage of rejects suggests that Cleaner by Nature became more cautious with experience choosing to reject garments rather than risk claims or unsatisfied customers Table 31 shows the reject rate at Cleaner by Nature during the start-up period which is defined as the period when new cleaners were being trained and the post-start-up period Appendix 3-C provides an itemization of garments that were rejected by the cleaner No comparative information on rejects was available for dry cleaning Cleaner by Natures reject rate is comparable to that of the Greener Cleaner the USEP A demonstration site in Chicago which also wet cleaned over 99 of customer
4garments
3 For both Cleaner by Nature and dry cleaner data a 2-piece suit is counted as one claim reject or redo as is a set of pillow cases or _placemats
Center for Neighborhood Technology Alternative Clothes Cleaning Demonstration Shop Final Report (September 1996) 18
3-8
Table 31 Reject Rate at Cleaner by Nature Over Time
Number Reiected
Number Cleaned
Percent Rejected
Start-Up Period 9 15467 006 Post-Start-Up 24 19483 012 Total 33 34950 009
_ The start-up period includes the first seven months of operation - February 1996 through August 1996 The post-start-up period includes the last five months of the first year of operation - September
1996 through January 1997
332 Claims and Store Credit
Claims Cleaner by Nature reported a total of 14 claims during the data collection period (or 0031 ) of the 44860 garments cleaned as shown in Table 32 (The data collection period for claims extended beyond the demonstration period for reasons explained below) The rate of claims declined as the experience level of the cleaner increased The claims rate during the start-up period (when new cleaners were being trained) was 7 times higher than during the post-start-up period A majority of the claims (8 of 14) were for shrinkage problems
Table 32 Claims Rate at Cleaner by Nature Over Time
Number of Claims
Number Cleaned
Percent Claims
Start-UD Period 11 15467 0071 Post-Start-Up 3 29393 0010 Total 14 44860 0031
i The start-up period includes the first seven months of operation - February 1996 through August 1996 ii The post-start-up period includes September 1996 through February 1997 and March 11 through April 11 1997
Store Credits Claims refer to cash payments for lost or damaged garments In addition to cash payments Cleaner by Nature sometimes awarded store credit when a problem occurred with a garment After PPERC evaluators became aware of this policy Cleaner by Natures owner was asked to provide information on the number ofgarments and amount of store credit per garment for as many months as possible She was able to reconstruct data from memory for the months ofNovember December January and February In addition Cleaner by Nature was asked to keep records on claims and store credits from March 11 through April 11 During this five month period she reported a store credit rate of 0037 of the 21937 garments cleaned Of the customers who received either cash or store credit for lost or damaged items during that period 27 received cash claims and 73 of customers received store credit
Claims and Store Credit Combined Cleaner by Natures claims rate for the post-start-up period (0010) was combined with the store credit rate for the five months of available data on store credit (0037) to produce a combined claims and store credit rate of
3-9
0047 This rate is about half the claims rate of the Greener Cleaner in Chicago which reported a total of28 claims (009) The difference might be due to the fact that the combined claims and store credit figure is for Cleaner by Natures post-start-up period when claims had declined due to the greater experience of the cleaner5
Comparison with Dry Cleaning Comparison information on claims and store credit was gathered from one local dry cleaner Different from Cleaner by Nature the dry cleaner had a policy of awarding store credit as little as possible Because the policy variation among cleaners could result in different claims rates store credit and claims information was combined for the comparison Even using this method there are limitations to using claim and store credits as a measure of cleaning performance Some of the claims and store credits for Cleaner by Nature and the dry cleaner are for lost garments not a direct measure ofcleaning performance However these were not eliminated from the analysis because the owner of the dry cleaner used in the comparison said he suspected that spotters who ruin garments may be tempted to lose them to avoid responsibility for the damage
Cleaner by Natures combined claims and store credit rate (0047 or 11 of21937 garments cleaned) was about three times greater than the figure for the dry cleaner (0015 or 16 of 107692 items cleaned) (Table 33) Appendix 3-D lists claims and store credits for Cleaner by Nature Appendix 3-E lists claims and store credits for the dry cleaner
Table 33 Claims and Store Credit Rate at Cleaner by Nature and a Local Dry Cleaner
Claims and Store Credit Rate Cleaner by Nature
Dry Cleaner
Post-Start-Up Period 0047 0015
i The post-start-up period includes September 1996 through February 1997 and March 11 through April 11 1997
333 Garments Returned for Additional Work (Redos)
There was a total of 163 items returned for additional work during the 11 months of the demonstration period at Cleaner by Nature for which data was available or 052 of garments received (Table 34)6 Spotting (ie stain removal) was the most common reason for a redo followed by pressing and shrinkage7 (which were equally common) and colorfastness problems8
As with claims the percentage of garments returned for additional work decreased as the
Center for Neighborhood Technology Alternative Clothes Cleaning Demonstration Shop Final Report (September 1996) 18 6
Redo data was not available for August because data collection was not systematic during that period Personal communication with Deborah Davis owner Cleaner by Nature 7 Garments that experience shrinkage can often be returned to their original dimensions through pressing techniques 8 Appendix 3-F lists all the garments returned for additional work
3-10
cleaners gained more experience In the first month of the demonstration project more than 1 of garments were returned for additional work compared to a 049 redo rate two months later The lower rate did not continue at that level most likely because the second cleaner hired by Cleaner by Nature left in mid-July Data is not available for August when the redo rate would be expected to remain high as a newly hired cleaner mastered wet cleaning In the last five months there was no turnover in the cleaner position and the monthly redo rate remained steady at between 04 and 05
Table 34 Redo Rate at Cleaner by Nature Over Time
Number of Redos
Number Cleaned
Percent Redos
Start-Uv Period 86 12041 071 Post-Start-UD 77 19483 040 Total 163 31524 052
1 The start-up period includes the first seven months of operation - February 1996 through August 1996 The post-start-up period includes the last five months of the first year of operation - September
1996 through January 1997
Problem Areas An examination of the top three types of problems (shrinkage pressing and spotting) cited by customers returning garments for additional work also showed some downward trends during the first year of operation There was a general decline in the percentage of garments returned for problems related to spotting and shrinkage although pressing-related problems did not appear to decline The persistence ofpressingshyrelated problems may be in part a consequence of the high turnover of pressers Figure 35 shows the redo rates over time for shrinkage pressing and spotting problems
Overall the distribution of redos by fiber type was similar to the distribution of all garments cleaned at Cleaner by Nature by fiber type However it should be noted that customers were more likely to return silk garments for additional work than expected9
On the other hand cotton and rwon garments were less likely to be returned for additional work than expected1 Appendix 3-G provides an analysis of redos by fiber type
Certain problems were disproportionately prevalent among certain fiber types Silk garments were returned for problems related to stain removal more often than expected While 16 of garments cleaned at Cleaner by Nature were silk 39 of the 64 items returned for spotting problems were silk Wool and linen were more likely to be returned for pressing problems than expected While wool accounted for 18 ofcustomer garments it accounted for 36 of the 39 garments returned for pressing problems While 11 of customer garments were linen 18 ofgarments returned for pressing problems were linen Rayon garments were more likely to be returned due to complaints about
9 Of all the garments returned for additional work 25 were silk while only 16 of all the garments cleaned at
Cleaner by Nature were silk 10
While cotton garments comprises 18 of redos they make up 24 of the total garments cleaned While rayon garments comprise 22 of customer garments they comprise 17 ofgarments returned for additional work
3-11
shrinkage than expected While 22 of all customer garments were rayon 54 of the 39 garments returned for shrinkage problems were rayon Appendix 3-H analyzes the link between fiber type and the reason garments are returned for additional work
Figure 35 Percentage of Garments Cleaned Returned for Additional Work at Cleaner by Nature During the First Year of Operation
A Shrinkage
06
frac3405
~ 04 -cS 03
] 02 a 01
$ 00
B Pressing
C Spotting
06 -------------------------------~
05 t----------04 +----------03 +---------- 02
01
00
i
3-12
Comparison with Dry Cleaning Comparative information on the number of garments returned for additional work was made available by a local dry cleaner The dry cleaners staff also recorded the reasons customers were bringing garments back Overall the redo rate was comparable for dry cleaning and wet cleaning (Table 35) For 13256 garments cleaned during the data collection period the dry cleaner recorded 59 redos (045) compared to 163 out 31524 garments cleaned by Cleaner by Nature (052) 11 The dry cleaners redo rate is actually slightly higher than the Cleaner by Nature rate in the last five months of its first year of operation by which time the new cleanerspotter hired in July had been fully trained Out of the 19483 garments cleaned at Cleaner by Nature from September through January 77 (or 040) were returned for additional work
Table 35 Redo Rate at Cleaner by Nature and a Local Dry Cleaner
Redo Rate Cleaner by
Nature Dry Cleaner Start-Up Period 11
071 045
Post-Start-Up 111 040 045
Total 052 045
i The redo rate equals the number of redosnumber gannents cleaned ii The start-up period includes the first seven months of operation - February 1996 through August 1996 iii The post-start-up period includes the last five months of the first year of operation - September 1996
through January I 997
The comparative evaluation of items returned for additional work also allowed comparison of the types of problems encountered at Cleaner by Nature and the dry cleaner (Figure 36) The most common problem encountered by both cleaners was dissatisfaction with the spotting or stain removal However the dry cleaner was more than twice as likely to have a garment returned for additional work due to spotting problems than Cleaner by Nature The next most common problems for Cleaner by Nature were for pressing and shrinkage Cleaner by Nature was over twice as likely as the dry cleaner to have garments returned for problems related to pressing and over three times as likely to have items brought back for problems related to shrinkage although in both cases the percentage rates are extremely low While 8 items (one ofwhich is a set of leather place mats) were returned to Cleaner by Nature for dye run problems none of the dry cleaners items was returned for that reason The dry cleaner was almost four times as likely to have a garment returned due to damage than was Cleaner by Nature Again the rates are extremely small Damage accounted for only 001 of customer garments at Cleaner by Nature While no chemical smell has been a motivation for customers to choose Cleaner by Nature there were no dry cleaned garments returned due to odor problems However 4 garments were returned to Cleaner by Nature (001 ) due to dissatisfaction with the odor This could be a consequence of the heightened odor sensitivity of Cleaner by Nature customers revealed in the customer satisfaction survey 12
11 The total number of garments cleaned at Cleaner by Nature excludes August as redo data was not available for
August12 Appendix 3-1 lists all the garments returned for additional work to the dry cleaner
3-13
Figure 36 Reasons Why Garments Returned for Additional Work Cleaner by Nature and an Area Dry Cleaner
030
~ 0250
~ ii 0
020 lt g ~
015 E a 010 ~
e 0 005 ~
000 middotE amp
Cl)
u 2-~ u
gtmiddotc Cl0 c Cl)
u e iS
~
0
0 g
j
Oeaner by Nature
Dry Oeaner
i Cleaner by Nature redos are for the post-start-up period September 1996-January 1997 A toial of 19483 garments were cleaned with 77 redos (041 ) Dry Clean daia is from 33197-31597 A total 13256 garments were cleaned with 59 redos (044)
334 Summary of Problem Garments
Cleaner by Nature cleaned 998 of all gannents brought to its counter during its first year of operation The 33 items that Cleaner by Nature refused to clean were rejected chiefly due to problems with colorfastness Cleaner by Nature also tended to reject more gannents with experience All of the rejects occurred in the last eight months of the first year of operation The reject rate remained below 017 for the entire demonstration period At the same time as staff turnover subsided and the cleaner gained experience the claims rate declined over time (007 to 001 ) as did the percentage of gannents returned for additional work (0 71 to 040) For gannents returned for addition work shrinkage problems appear more prevalent among rayon gannents while spotting problems are more prevalent with silk and pressing problems appear most commonly with wool and linen gannents Both shrinkage and spotting problems declined as the experience of the cleaner increased
Although the goal is to safely clean all customer gannents most cleaners expect a certain number ofclaims and a certain number ofunsatisfied customers to return gannents for additional work whether due to cleaner error customer treatment of the
3-14
garment or manufacturing issues Dry cleanings claims and redo rate were used as a measure of Cleaner by Natures performance Looking at claims and available store credit rates together Cleaner by Natures rate was more than three times higher than the dry cleaners though less than one half of a tenth of one percent Rates at which garments were returned for additional work were comparable Fewer garments were returned to Cleaner by Nature for problems with spot removal compared to the dry cleaner but more were returned to Cleaner by Nature for problems related to shrinkage and pressing
Specific methodological issues associated with these comparisons should also be noted Redos provides a better comparative data than claims and store credit since there is more standard record-keeping for redos In addition redo practices tend to be widely accepted among cleaners while willingness to compensate a customer for a claim of damage may have greater variation Thus data on redos is more likely to reflect the performance problems ofa cleaner than data on claims and store credit which may be a reflection of other variables such as the business practices of a particular professional cleaner
Analyses from the Repeat Clean Test and the customer satisfaction survey presented in the next two sections of this report also presents a more substantial source of data to evaluate and compares compare wet cleaning and dry cleaning performance
3-15
34 Repeat Clean Test
METHOD
The repeat clean test compares the performance ofwet cleaning and dry cleaning on garments labeled dry clean only after repeated cleaning and wear
Study Design A paired comparison design was selected as the most appropriate experimental approach A total of three identical sets of40 dry clean only labeled garments were obtained for the test 13 Ofthese sets one was repeatedly wet cleaned six times another repeatedly dry cleaned six times and a-third was stored for comparison purposes For each pair of identical garments that was either repeatedly wet cleaned or dry cleaned a volunteer was recruited to wear each of the two garments before each of the six cleanings Trained evaluators each with a background in textile science evaluated the garments for dimensional change general appearance color change color migration and odor 14 The test protocol for each of the outcome measures was adapted from the American Association ofTextile Chemists and Colorists (AATCC) Technical Manual The Repeat Clean Test was a triple- blinded study Neither the wet cleaner nor the dry cleaners knew the identity of the test garments At the same time neither the wearers nor the evaluators were informed as to which garments were being dry cleaned and which garments were being wet cleaned15 The test was similar in design to one conducted by the Center for Neighborhood Technology (CNT) in Chicago in 1995-1996
Sample Selection The sample ofdry clean only garments was purposefully selected to represent the garment types and characteristics that represent the greatest challenge to wet cleaning Dry cleaners and textile experts on the Projects Advisory Committee assisted with the sample selection (see Appendix 3-J) There were eight different garment types represented in the sample shirtsblouses pants skirts dresses jackets sweaters vests and ties Fiber types included acetate acrylic cashmere linen polyester rayon silk and wool In addition a representative sample of woven vs knit tailored vs unstructured and light medium and dark colors was chosen
Treatment The identical garments were cleaned six times at Cleaner by Nature and six times at one of three different local dry cleaners These dry cleaners were selected for
tJ Of the 40 sets of three test garments 16 were donated by GAPBanana Republic The rest were purchased from catalogues14 The repeat clean test also assessed resiliency stain and soil removal and hand (or feel) The results from these tests are not reported here It is important to note that wet cleaned and dry cleaned garments performed similarly for each of these tests 15 The repeat clean test was structured to limit any influences independent of the cleaning process Choosing identical pairs of garments meant that the wet cleaned garments and dry cleaned garments were identical in terms of characteristics known to affect the quality of garments - including fabrication fiber and construction Using the same volunteer to wear the identical pair of garments meant that any influence a wearer of a garment may have on its subsequent quality would be similar for the wet cleaned garment and the dry cleaned garment Blinding the cleaners the wearers and the evaluators meant that no knowledge about the identity of the experimental garments would influence how a garment was cleaned worn or evaluated These design features increased the likelihood that any difference detected between the wet cleaned garments and dry cleaned garments was due to how they were cleaned and not to other factors
3-16
their reputation for quality and were also in a similar price range to Cleaner by Nature The presidents of the California Fabricare Institute and the Greater Los Angeles Dry Cleaning Association assisted in the selection All the cleaners participating in the test were informed that test garments would be brought to their facility though none were told which were the test garments
Technical Evaluation ofGarments The evaluation of the garments for the repeat clean test was carried out by professors and graduate students from the Department ofFamily and Consumer Sciences at California State University Long Beach (CSULB) Apparel Design and Merchandising Professors Sue Stanley and Hazel Jackson assisted in garment selection developed the test materials and supervised and participated in the evaluation at the CSULB Apparel Design Laboratory Prior to the intake evaluation the evaluators underwent a one-day training for use of AA TCC test methods William Eyring who supervised the Center for Neighborhood Technologys Repeat Clean Test assisted with the training Each set of garments was evaluated three times -- at intake (before the garments were cleaned) after the first cleaning and after the sixth (and final) cleaning 16
Garments were randomly assigned with each garment evaluated by at least two evaluators Evaluation forms were used to record data on odor general appearance resiliency color change stain and soil removal hand and dimensional change For the final evaluation four questions were added regarding acceptability of general appearance feel and pressing as well as the quality of pressing (see Appendix 3-K)17
341 Dimensional Change Evaluation
This test method quantified the dimensional change of garments after being professionally cleaned Dimensional change refers to the variation in length andor width of a garment after cleaning
METHOD
All garments were measured during the intake evaluation which was done prior to the garments being worn and cleaned and at the final evaluation which took place after the six cleanings Various lengthwise ( or vertical) measurements and widthwise (or horizontal) measurements were taken for each of the eight garment types represented in the sample ( eg length of pants inseam width of dress waist) At least three measurements were taken on each garment for a total of 26 specific garment measurements (See Appendix 3-L) Guidelines similar to the Center for Neighborhood Technologys Repeat Clean Test were used in performing the garment measurements As a check on the reliability of evaluator measurement each garment was measured by two
16 AATCC considers five cleanings sufficient to test a garments performance in a cleaning process Because a minimum of five cleanings is considered standard for a repeat clean test findings from the first evaluation carried out after the first cleaning are not reported here 17
These questions were Is the general appearance of this garment acceptable How well is the garment pressed compared to the identical test garment ls the pressing of this garment acceptable Is the feel of this garment acceptable None of these questions were covered by any of AATCCs protocols
3-17
different evaluators at the intake evaluation as well as at the final evaluation 18
For each garment measurement dimensional change was calculated as the difference between the initial measurement and the final measurement divided by the initial measurement 19 When the final measurement was shorter than the original measurement dimensional change was expressed as a negative percent designating shrinkage When the final measurement was longer than the initial one dimensional change was expressed as a positive percent designating stretching To calculate the total lengthwise and widthwise dimensional change for garments with two length measurements (eg pants inseam and outseam) or two width measurements (egjackets across the shoulder and sleeve circumference) the total amount ofchange between intake and final measurements for the two measures was added together and divided by the total of the two intake measurements20
While there were originally 40 pairs of garments evaluated at intake the dimensional change for 4 lengthwise and 5 widthwise measurements could not be used in the dimensional change analysis21 Thus the dimensional change analysis was based on 36 lengthwise measurements and 35 widthwise measurements
18 See Appendix 3-M for the methods used to increase precision of the measurements used in the repeat clean test Because dimensional change is calculated as a percent for initial measurements that are small slight differences between intake and final resulted in large percent changes that did not correspond with a change in the fit of the garment Garment measurements less than IO centimeters were considered small When these measures were the only lengthwise or widthwise measurement available they were eliminated from the analysis The width of the three ties were the only measurements that needed to be eliminated Because there was little difference between the dimensional change for wet cleaning and dry cleaning for these measures their elimination did not influence the relative difference between wet cleaning and dry cleaning for dimensional change 19 AITCC test method 158-1990 was used as a guide for the dimensional change calculations 20 See Appendix 3-N for a listing all the measurements for the garments21 The four lengthwise measurements that could not be used included One jacket which was eliminated after the first cleaning because of severe color change and fabric damage in both wet cleaning and dry cleaning two pairs of pants that were hemmed after intake to accommodate a wearer yet the re-measurements were lost and one tie in which a large discrepancy between evaluators could not be resolved The five widthwise measurements that could not be used included the jacket which was eliminated after the first cleaning the widths of the three ties which were all smaller than IO centimeters and one pant waist in which a large discrepancy between evaluators could not be resolved
3-18
RESULTS
All Garments
Figure 3 7 shows the distribution of dimensional change for the 36 lengthwise and 35 widthwise measurements22 Half of all wet cleaned garments shrank or stretched less than 2 in both the lengthwise dimension (18 of36) and widthwise dimension (18 of 35) Similarly approximately half of the dry cleaned garments experienced less than 2 dimensional change in length (21 of 36) and width (17 of 35)
Taking the average dimensional change it is possible to evaluate the relative magnitude of dimensional change in comparing the wet cleaned and dry cleaned garments The average lengthwise dimensional change was 265 for wet cleaning and 235 for dry cleaning or 030 greater in wet cleaning (See Table 35) 23 In terms of width of the test garments overall dimensional change was virtually identical 296 in the wet cleaned garments and 297 in the dry cleaned garments There were thus no statistically significant differences in the amount of dimensional change for wet cleaned and dry cleaned garments in either the lengthwise or the widthwise direction 24
22 One lengthwise and one widthwise measure was chosen to represent the length and width of each garment when there were two measurements The middle back measurement represented the lengthwise measure for blouses dresses jackets sweaters and vests The outseam and backseam represented length for pants and skirts With measures were across the shoulder for jackets across the back for vests the wide width of ties 23 For each garment when there were two lengthwise or widthwise measures the dimensional change was a weighted average of the two measures (see METIIOD section above) 24 The Wilcoxon Signed-Rank Test was used to test whether the amount ofdimensional change for a garment that was wet cleaned was significantly different than if the garment was dry cleaned Because the data were both paired and continuous a paired I-test could also have been used Yet the paired I-test assumes that the data are normally distributed - not a necessary assumption when using the Wilcoxon Signed-Rank Test (See Glantz Stanton Primer of Biostatistics McGraw-Hill 1981 p338) There was a sufficient degree of skewness and kurtosis suggesting the data was not normally distributed
3-19
Figure 37 Distribution of Dimensional Change for Wet Cleaned and Dry Cleaned Garments
A Distribution of Lengthwise Dimensional Change
ii ~
E 0 C -E ~
25 ---------------------------------
20 ----------------
Wet Oean
-------------J Dry aean
15 i-----------------1
J 10 -----------
gt-4 -2 to -4
Shrinkage
-2 to +2 +2to +4 gt+4
Stretching Dimensional Change
B Distribution of Widthwise Dimensional Change
18
16 ---------1 Wet Qean
14 Dry aean
i 12 E 10 0-C 8 c E 6 ~
4
2
0
gt-4 -2 lo -4 -210 +2 +2to+4 gt+4
Shrinkage Stretching Dimensional Change
3-20
Garment Characteristics Influencing Dimensional Change
There are a number of qualities of a garment known to influence dimensional change when a garment is cleaned including type of fabrication (woven vs knit) garment construction (tailored vs unstructured) and fiber (eg wool rayon etc) The sample of forty test garments was purposefully selected to reflect a balance of these qualities to both mirror the distribution of garments taken to dry cleaners as well as to provide enou~h garments within each category to provide meaningful analysis of each key category 5 Table 36 also summarizes how these different garment characteristics influenced the dimensional change oftest garments when they were wet cleaned and dry cleaned26
Fabrication For woven garments the average dimensional change in length and width was substantially smaller than for knit garments whether wet cleaned or dry cleaned The difference in dimensional change between wet cleaning and dry cleaning was smaller for woven garments and greater for knit garments in both the lengthwise direction and the widthwise direction
Construction Tailored garments on average experienced substantially less dimensional change in length and width compared to unstructured garments While tailored garments that were wet cleaned experienced more dimensional change in length and width than when the identical garment was dry cleaned unstructured garments experienced more dimensional change in length and width when dry cleaned than when wet cleaned
Fiber21 For rayon garments the average dimensional change in length and width was
substantially greater than the average for all garments while silk and linen garments experienced less dimensional change compared to the sample as a whole regardless of whether the garment was wet cleaned or dry cleaned For wool garments there was less change in length and greater change in width compared to the average for all garments regardless of whether the garment was wet cleaned or dry cleaned When wet cleaned rayon garments experienced less dimensional change while wool garments shrank or stretched more in wet cleaning than in dry cleaning Linen garments had the greatest difference in dimensional change between wet cleaning and dry cleaning Wet cleaned linen garments shrank or stretched over one percent more in the length than when the same linen garments were dry cleaned Finally the origin of the fiber appeared to have some influence on dimensional change Natural fiber garments shrank or stretched less than manufactured fiber garments regardless ofcleaning method In addition garments
Ofthe 40 test garments the distribution of key garment characteristics was as follows Fabrication - 32 pairs of woven (80) and 8 pairs ofknit (20) Construction - 26 pairs of tailored (65) and 14 pairs ofunstructured (35) Fiber- 13 pairs of rayon (325) 11 pairs ofsilk (275) 8 pairs of wool (20) and 6 pairs oflinen (15) Gannents were grouped into the fiber categories based on if the shell was made from only one fiber or based on the predominant fiber for shells made from a fiber blend There were two gannents (a pair of acetaterayon pants and polyesterrayon skirts) where the garment represented the only gannent for the predominant fiber Because 4 lengthwise measures and 5 widthwise measures could not be used in the analysis there may be fewer pairs in each category than in the original sample 26
Appendix 3-0 shows the distribution oftest gannents by fabric construction and origin of fiber 27
It is important to note that a number ofgarments also included a lining which was usually made out of a different fiber than the shell
3-21
made from natural fibers experienced more lengthwise dimensional change when wet cleaned while garments made from manufactured fibers experienced more lengthwise dimensional change when dry cleaned
Table 36 Dimensional Change for Identical Dry Clean Only Garments Repeatedly Wet Cleaned and Dry Cleaned
Groupine Len h - Dimensional Chanee Width - Dimensional Chanee (n)1 Wet Clean Dry Clean (n) Wet Clean Dry Clean
All garments 36 265 235 35 296 297
Fabrication Woven 29 220 205 28 218 214
Knit 7 448 358 7 608 631
Construction Tailored 22 237 175 21 224 187 Unstructured 14 307 330 14 403 471
Fiber JOO amp Blends
Rayon 12 326 328 12 309 352 Silk 1() 231 192 8 218 184 Wool 7 260 238 7 359 414 Linen 5 264 130 6 251 257
Origin
Natural 11 21 251 195 19 298 303
Manufactured 111 11 260 329 11 390 396
i (n refers to the number of pairs of garments- one that was wet cleaned and one that was dry cleaned ii Natural fibers include all wool silk linen or blends ofnatural fibers (including cotton) iii Manufactured fibers include rayon polyester acetate or blends of manufactured fibers (including acrylic)
As a whole while dimensional change varied substantially depending on a garments construction and the fabric and fiber used within each of these garment characteristics there was not a great deal ofdifference in dimensional change if the garment was wet cleaned or dry cleaned Statistical analysis revealed that for none of the garment fabric construction or fiber qualities were the differences in dimensional change between wet cleaning and dry cleaning significant28
middot
28 The Wilcoxon Sign-Rank Test was used to evaluate the significance of differences Length of linen garments was
the garment characteristic with the lowest p-value - 00947 A p-value less than 005 is the standard usually used to signify a qualitative difference in response
3-22
342 General Appearance Evaluation
METHOD
Evaluators were asked to assess the general appearance of the wet cleaned and dry cleaned garments including consistency of garment color tears rips or split seams missing buttons trim shoulder pads and any other appearance factors not otherwise noted Evaluators also assessed the overall appearance of the garment29 During the final evaluation evaluators were asked to judge whether the pressing and the general appearance of the garment was acceptable If one of the evaluators detected a problem with general appearance of the garment it was recorded as a finding However for opinion questions about the acceptability of the garments the garment was considered unacceptable only if both evaluators were in agreement
RESULTS
Table 3 7 shows the distribution of evaluator responses characterizing the overall general appearance ofidenticai garments that had been repeatedly wet cleaned and dry cleaned It identifies cases where a problem was identified with one garment in the pair but not with the other (defined as Discordant Pairs) and cases where the evaluator was either satisfied with both pairs or dissatisfied with both pairs (defined as Concordant Pairs)
The results from the assessment of Color Consistency are explained in detail to facilitate understanding ofTable 37 Reading from left-to right Table 37 shows that 5 pairs of garments were identified in which there was a problem with color consistency for the wet cleaned garment but not the dry cleaned garment of the pair On the other hand there were 2 pairs of garments in which color consistency problems were identified for the dry cleaned but not for the wet cleaned garment In addition 2 pairs were identified as having a color consistency problem for both the wet cleaned and dry cleaned garments Finally there were 30 garment pairs in which no color consistency problems were identified in either the wet cleaned or dry cleaned garment Thus the data shows that for most garment pairs (30 of 39) color consistency was not a problem whether the garment was wet cleaned or dry cleaned For 2 garment pairs there were color consistency problems no matter which cleaning method was used Finally when there was a problem with one of the garments in a pair but not the other more of the problems were associated with the wet cleaned garment in the pair (5 vs 2)
In evaluating garment damage and problems with buttons there were slightly more problems for dry cleaned than for wet cleaned garments It should be noted that damage to garments may be considered a problem for both processes since problems were identified in both the wet cleaned and dry cleaned garment for fifteen of the garment pairs On the other hand there were few problems with the trim or shoulder pads detected
29 When an evaluator described a problem under Other Appearance Factors or Overall Appearance that fit into one
of the more specific categories but was not noted in the specific category the comment was moved to the more specific category See Appendix 3-K
3-23
for either the wet cleaned or dry cleaned garment Finally stains and soils were noted for slightly more dry cleaned garments compared to wet cleaned garments though there were more problems identified for both wet cleaned and dry cleaned garments (for ten of the pairs)
Table 37 General Appearance Evaluation
Discordant Pairs Concordant Pairs
Performance Oualitv Yes-WC No -DCii
No -WC Yes-DC
Yes-WC Yes-DC
No-WC No-DC
Color Consistencv Problems 5 2 2 30 Tears Rips Split Seams 111 6 8 15 10 Button Problems 1 4 3 31 Trim Problems 1 0 0 38 Shoulder Pad Problems 1 1 1 36 Stains or Soil Evaluation 3 5 10 21
i WC = wet cleaned garment in pair ii DC = dry cleaned gannent in pair iii Category also includes loose seams fabric damage hanging or pulling threads
After assessing the general appearance of the test garments evaluators were asked whether the overall general appearance of the garment was acceptable In addition the quality of the pressing of the gamient was evaluated (see Table 38) Most garment pairs were judged to be acceptably pressed (35 of 39) and to have an acceptable general appearance (32 of 40) Among the remaining pairs both garments were considered unacceptably pressed (2) or to have an unacceptable appearance in half the cases (4)30 In the few cases where there was a split it was more likely that the wet cleaned garment was judged as unacceptable 2 vs 0 for pressing and 3 vs 1 for general appearance
Table 38 Acceptability of General Appearance and Pressing i
Discordant Pairs Concordant Pairs
Acceotabilitv Ratine Yes-WC No -DCm
No -WC Yes-DC
Yes-WC Yes-DC
No-WC No-DC
Pressing Acceptable 0 2 35 2 Gen Avvearance Accevtable 1 3 32 4
i These questions are not covered by an AATCC protocol ii WC = wet cleaned garment in pair iii DC= dry cleaned gannent in pair
0 During the first evaluation one garment pair was eliminated from further evaluation because the appearance of both
garments in the pair was considered unacceptable The pair was included as one of the four garments in this category
3-24
343 Color Change Evaluation
METHOD
When viewing each test garment evaluators were asked if they observed a visible change in the color and ifthere was evidence of color migration Ifcolor change or color migration was observed the intensity ofchange andor migration was quantified using the AATCC Gray Scale for Color Change rating and the AATCC Chromatic Transference Scale Evaluators visually compared the color of the wet or dry cleaned garment with the control garment A grade of 5 was given ifthere was no perceived difference in color between the control garments and test garments that had been repeatedly cleaned A grade of 1 was given for maximum change The chromatic transference rating is used to quantify the degree to which color transfer has occurred in garments where color transfer was observed For garments that have exhibited a transfer of color a Chromatic Transference Scale rating (from 5 to 1) was completed31
RESULTS
In over half the garment pairs (21 of39) visible color change was observed in both the wet and dry cleaned garment (Table 39) When there was a visible color change in only one of the garments in a pair it was twice as likely that it was in the wet cleaned garment than in the dry cleaned garment Only for 6 garment pairs was no color change observed in either garment Thu~ there was color change in 69 ofwet cleaned garments (27 of 39) and 62 of dry cleaned garments (24 of 39) indicating color change problems for both cleaning processes On the other hand color migration appears to be more of a problem among the wet cleaned garments While for most pairs (33 of 39) no color migration was observed in either garment for 4 pairs color migration occurred for only the wet cleaned garment while in just one pair was there change in only the dry cleaned garment
Table 39 Color Change Evaluation
Discordant Pairs Concordant Pairs
Performance Quality Yes-WC No -DCii
No -WC Yes-DC
Yes-WC Yes- DC
No-WC No-DC
Visible Color ChanJe 6 3 21 9 Visible Color Miwation 4 1 2 32
i WC = wet cleaned garment in pair ii DC= dry cleaned gannent in pair
31 The gray scale grade of each garment was the average rating given by the two evaluators
3-25
Table 310 shows that in terms of the degree ofcolor change the average for wet cleaned garments was 442 ( over half a point lower than the no color change rating of 5)32 The average color change for dry clean garments was 455 just slightly higher than the color change rating among wet clean garments
Table 310 Gray Scale for Color Change i
Cleanin2 Method n Minimum Maximum Mean Wet Cleaning 38 275 50 442 Drv Cleaning 38 175 50 455
i Color change ranged from 5 (no change) to I (maximum change)
Table 311 shows that the average degree of color migration for wet cleaned garments was 363 The average color migration score for dry cleaned garments experiencing color migration was 417 - almost a half a point less intense than the wet clean score
Table 311 Chromatic Transference Scale i
Cleanin2 Method n Minimum Maximum Mean Wet Cleaning 6 30 45 363 Drv Cleaning 3 40 45 417
i Chromatic transference scale ranged from 5 (no change) to I (maximum change)
32 If both evaluators observed color change or color migration an average of the two scores was used
3-26
344 Odor Evaluation
METHOD
The odor evaluation was the first evaluation completed by the evaluators since it required the garment to be tested before the plastic bag covering was removed Evaluators made a slit in the plastic bag near the center of the front of the garment and inhaled through the hole Evaluators recorded whether or not the garment had an odor and then described the kind ofodor detected The questions were open ended The responses were JOded after the evaluation
RESULTS
Table 312 shows that most evaluators were able to detect some odor in practically all of the garments -- 81 (32 of39) of the wet cleaned garments and 95 (37 of39) of the dry cleaned garments Significantly more garments smelled clean when wet cleaned than when dry cleaned33 Significantly more of the dry cleaned garments had a chemical or dry cleaning smell All odors however were considered acceptable
Table 312 Odor Evaluation
Discordant Pairs Concordant Pairs
Performance Quality Yes-WC No -DCii
No -WC Yes-DC
Yes-WC Yes-DC
No-WC No-DC
Garment Has Odor l 6 31 l Smells Clean 9 l l 28 Smells like Chemical l 12 2 24 Smells like Drv Cleaninf 4 18 3 14 Odor UnaccefJ(able 0 0 39 0
1 WC = wet cleaned garment in pair ii OC = dry cleaned garment in pair
McNemar s test for changes was used to assess whether there was a significant difference in how identical garments responded to wet cleaning or dry cleaning when the response variable was categorical (See Glantz Stanton Primer of Biostatistics McGraw-Hill 1981 p261)
3-27
345 Summary of Repeat Clean Test
The repeat clean test compared how wet cleaning and dry cleaning performed on 40 sets of identical garments after repeated cleaning and wear The average percentage of dimensional change experienced by wet cleaned garments and identical dry cleaned garments was almost identical in a widthwise direction (296 vs 297) In a lengthwise direction wet cleaned garments experience a dimensional change that was 031 greater than for the identical dry cleaned garments (265 vs 235) While the absolute amount of dimensional change varied by garment qualities known to affect dimensional change (eg greater change in knits less change in linen) within each of these subgroups the relative difference between wet cleaned and dry cleaned garments did not vary substantially This subgroup analysis not only provides a check on the internal validity of the data itself(ie factors varying according to expectation) but also suggests that the overall greater lengthwise dimensional change of 031 for wet cleaned garments may be relatively accurate For a garment length of 75 centimeters this difference of 031 is 23 millimeters greater for the wet cleaned garments as compared to the dry clean garments
Color consistency and color migration were the areas where slightly greater problems for wet cleaning were most noted although overall changes in color for both wet clean and dry clean garments were seen as comparable There were also slightly greater problems in the areas ofpressing and general appearance in wet cleaning while there were slightly greater problems for dry cleaning in damage io the fabric or buttons Substantially more evaluators identified a chemical or dry cleaning odor for the dry cleaned garments although all garments had an acceptable odor
Comparison With Other Repeat Clean Tests
The results from the dimensional analysis from this study can be compared to studies undertaken by the Center for Neighborhood Technology (CNT) and Environment Canada which also used the repeat clean test to evaluate the performance ofmachineshybased wet cleaning under market conditions34 Both the comparison of average dimensional change and the comparison of dimensional change greater than 4 revealed consistent results Woven garments that were wet cleaned showed a slightly greater amount of dimensional change in the length compared to identical dry cleaned garments yet the widthwise change was practically the same or slightly less among the garments that had been repeatedly wet cleaned Knit garments experienced more dimensional change when wet cleaned than when the identical garment was dry cleaned Yet wearers of the knit garments which experience a greater than 4 change were for the most part not aware of that change See Appendix 4-N for a detailed discussion of this comparison
34 Center for Neighborhood Technology Alternative Clothes Cleaning Demonstration Shop Final Report (September 1996) Environment Canada Final Report for the Green Gean Project (Sarnia Ontario October 1995)
3-28
35 Wearer Survey
METHOD
A survey of the volunteer wearers who participated in the Repeat Clean Test assessed whether wearing a garment that was wet cleaned differed from the experience ofwearing an identical garment that was dry cleaned This survey serves as a parallel evaluation to the Repeat Clean Test and allows an analysis of the relationship between customer satisfaction and technical performance The 28 volunteer wearers who participated in the Repeat Clean Test were given a written questionnaire in December following the fifth of six cleanings (The questionnaire could not have been easily administered after the sixth cleaning because the garments needed to be immediately taken to the lab for evaluation) Of the 28 volunteers 12 wore two sets of identical garments As with the Repeat Clean Test the experimental design of the Wearer Survey is that of a paired comparison test Like the evaluators for the Repeat Clean Test the wearers were also blinded They identified the garments by codes that were placed on care labels or sewn into the garment
Wearers were recruited among UCLA staff and students though none had any affiliation with PPERC or the project Each volunteer wore no more than two pairs of garments Consequently some wearers filled out questionnaires for two sets of garments Most of the wearers wore the garments throughout the test
The Wearer Survey questions miITOr those asked in the customer satisfaction surveys and the Repeat Clean Test Wearers were asked whether they noticed problems for each of the garments in the pair including problems related to unpleasant odor pressing shrinkage and stretching color change feel stain removal damaged buttons or decoration Wearers were then asked about their overall and relative satisfaction with each of the garments One question was asked to determine whether the customers knew which garment was the wet cleaned garment to determine whether their attitudes about wet cleaning and dry cleaning may have influenced their assessment of the two garments
RESULTS
351 Performance Quality Wet Cleaning and Dry Cleaning
Each wearer was asked to evaluate their experience wearing each of the garments in the pair One set of questions related to a set of positive performance qualities (eg cleanliness satisfaction with pressing) and another related to negative performance qualities (eg shrinkage discoloration) Table 314 shows the distribution ofwearer responses to questions about positive performance qualities while Table 315 shows wearer responses to questions about negative performance qualities The Tables divide the responses to the questions into cases where the wearer was satisfied with one garment in the pair but not with the other (Discordant Pairs) and cases where the wearer was either satisfied with both pairs or dissatisfied with both pairs (Concordant Pairs)
3-29
The first variable Satisfaction with Pressing is explained in detail to facilitate understanding of Table 313 Reading from left to right the Table 3 14 shows that one respondent was unsatisfied with the pressing of a dry cleaned garment while being satisfied with the pressing of its wet cleaned pair Three respondents were dissatisfied with the pressing of a wet cleaned garment and satisfied with the pressing of its dry cleaned pair Meanwhile 33 respondents were satisfied with the pressing ofboth garments in the set and two were dissatisfied with the pressing ofboth garments While not statistically significant the table shows slightly more dissatisfaction with the pressing of the wet cleaned garments Satisfaction with general appearance and stain removal was virtually the same for both processes
Table 313 Positive Performance Qualities Distribution of Wearer Responses
Discordant Pairs Concordant Pairs
Performance Oualitv Yes-WC No -DC
No -WC Yes-DC
Yes-WC Yes-DC
No-WC No-DC
Satisfied with Dressing 1 3 33 2 Satisfied with stain removal 0 0 3 2 Satisfied with annearance 4 5 25 6
i WC = wet cleaned gament in pair ii DC= dry cleaned garment in pair
Table 314 shows that slightly more wearers noted shrinkage problems in wet cleaning w~ule slightly more wearers noted stretching problems in dry cleaning Problems with discoloration rips or tears buttons or feel were the same or virtually the same for both the wet cleaned and the dry cleaned garments
Table 314 Negative Performance Qualities Distribution of Wearer Responses
Discordant Pairs Concordant Pairs
Performance Quality Yes-WC No -DCii
No -WC Yes-DC
Yes-WC Yes-DC
No-WC No-DC
Shrinka~e 3 1 1 35 Stretching 0 2 0 38 Discoloration 0 0 4 35 Feels worse 1 0 0 38 Rips or tears 2 2 1 35 Damaged buttons 2 1 0 37
i WC = wet cleaned garment in pair ii DC= dry cleaned garment in pair
3-30
352 Overall Satisfaction Wet Cleaning and Dry Cleaning
Wearers were also asked whether they preferred wearing one garment over another For most of the garments (606) wearers responded that they had no preference However for those who did have a preference twice as many preferred wearing the garment that was wet cleaned to the garment that was dry cleaned See Table 315 and Table 316
Table 315 Percent with Preference for Wearing One Garment in Pair
Resoonse Freauencv Percent Yes 13 333 No 23 606 Dont know 3 77
Table 316 Preference of Wearing Wet Cleaned or Dry Cleaned Garment
Preference Freauencv Percent Wet Clean Garment 9 692 Drv Clean Garment 4 308
i Since wearers were blinded as to which garment was being wet cleaned and which dry cleaned the survey asked the wearer to Tlte down the number associated with the specific garment for which they had a preference
Wearers were also asked if they thought they knew which was the wet cleaned garment This question was used to determine whether wearers knowledge of the treatment might influence their responses in the questionnaire Most of the wearers (59) said they did not know which was the wet cleaned garment (Table 317) For the 16 who thought they knew nine guessed incorrectly suggesting that the survey was not contaminated by the wearers ability to guess which treatment was used for which garment (Table 318)
Table 317 Percent of Wearers Who Thought They Could Identify Wet Cleaned Garment
Freauencv Percent Yes 16 410 No 25 590
Table 318 Wearers Identification ofWet Clean Garment
Correctly Identified Incorrectly Identified Wet Cleaned Wet Cleaned Garment
Garment Number of Survevs 7 9
3-31
353 Wearer Survey Summary
The wearers did not notice any significant difference between wet cleaned garments and dry cleaned garments in terms of shrinkage stretching pressing color change spot removal odor damage or appearance of the garment More wearers identified more shrinkage and pressing problems in the wet cleaned garments while more wearers identified stretching problems for the dry cleaned garments For the 13 respondents who had a preference twice as many preferred wearing the garment that was wet cleaned over the garment that was dry cleaned
3-32
36 Customer Satisfaction with Wet Cleaning
Because professional garment care is a service industry customer satisfaction is an important measure ofperformance and a key indicator ofperformance viability In order to measure customer satisfaction with Cleaner by Nature two surveys were conducted The first a telephone survey of customers who used Cleaner by Nature at least once is part of the case study of Cleaner by Nature The purpose of the survey was to measure satisfaction with and attitudes toward this professional cleaner The second was a telephone survey ofdry cleaning customers who live in or near Cleaner by Natures market area The purpose of this survey was to assist in evaluating the results of the Cleaner by Nature survey by comparing it with customers satisfaction with dry cleaning
361 Cleaner by Nature Customer Satisfaction Survey
METHOD
A random telephone survey of Cleaner by Nature customers was conducted in March of 1997 to measure their satisfaction with the performance of wet cleaning35 A primary goal of the survey was to gauge customer satisfaction with Cleaner by Nature A secondary goal was to formulate a profile of Cleaner by Nature customers and their motivations for choosing wet cleaning The survey was anonymous and provided customers the privacy to reveal any problems they may have had with the wet cleaning process Since wet cleaning is a new technology even customers motivated by ideological (eg pro-environment) reasons could still be skeptical of this new process The survey instrument was designed to identify whether there is interaction between customer satisfaction with performance and environmental commitment A blocked random sampling methodology discussed below permits generalizing the results to all customers The phone numbers were provided by the Cleaner by Nature cash register which tracks customer information including the number of transactions per customer
Survey Instrument The survey focused on six general areas A question about customers initial motivation for choosing Cleaner by Nature helped to identify customer attitudes toward wet cleaning and dry cleaning including ideological motivations for choosing wet cleaning Another set ofquestions focused on specific cleaning-related problems (ie stain removal shrinkage etc) A third set ofquestions explored customer satisfaction with Cleaner by Nature including questions about whether customers who were continuing to use Cleaner by Nature were also continuing to use dry cleaning Because it was expected that most or all customers would have used dry cleaning some time in the past customers were able to evaluate wet cleaning relative to their experience with dry cleaning A fourth set ofquestions focused on customers standard for judging the quality of cleaning at Cleaner by Nature Because Cleaner by
The survey instrument was designed with input from the projects Advisory Committee and in consultation with Professor Elaine Vaughan of University of California Irvine
3-33
Nature marketed itself as a safer alternative to dry cleaning it became important to explore the link between satisfaction with Cleaner by Nature and pro-environmental attitudes Customers who identified problems with garments after they were cleaned at Cleaner by Nature were asked if they were more or less willing to overlook those problems and why They were also asked if they examined their garments more closely than they would have if they had been dry cleaned A fifth set of questions gauged customer understanding of wet cleaning by asking if they were aware of the use ofwater in the process and how they felt about it A final set of questions established the socioshyeconomic status of customers The survey instrument is included in Appendix 3-Q
Profile ofCustomer Base During its first year Cleaner by Nature served a total of 1966 customers Of those 54 (more than 1000) were recorded as having three or more transactions36 This is a conservative estimate of the proportion of repeat customers since some of those with two recorded transactions are probably also repeat customers Customers may have more than one transaction on a given visit depending on the size of the order or whether some garments are going to be tailored or laundered Consequently a customer could be recorded as having multiple transactions on a first visit Cleaner by Nature also had a large proportion of customers with two or fewer transactions (46) In addition Cleaner by Nature has a group ofloyal customers About 8 of the customers are responsible for 47 of the transactions
Sampling A sample size of 150 was determined adequate to meet the needs of the analysis In all 180 surveys were conducted The sample was selected to be large enough to permit a comparison between those with more experience (three transactions or more) at Cleaner by Nature and those with less (two transactions or fewer) After initial calling it became apparent that the response rate for those with two or fewer transactions was lower than for those with 3 or more There was concern that those with two or fewer transactions might not have returned to Cleaner by Nature because of dissatisfaction and that by under-sampling that population the results would be biased in favor of Cleaner by Nature Consequently the sampling method was changed from a conventional random sampling technique to a blocked random sample Those with two or fewer transactions were over-sampled to compensate for the lower response rate However there was a lag between the time that the customer information was obtained and the implementation of the survey During that time several of those with two or fewer transactions had conducted more transactions This contributed to the fact that those with two or fewer transactions were under-sampled While 46 of customers from the February 1996 through January 1997 database provided by Cleaner by Nature had two or fewer transactions 37 of those who were called in March 1997 had two or fewer transactions according to a database downloaded from the Cleaner by Nature computer cash register in early April
Response Rate The customer response rate to the Cleaner by Nature survey was 78 (180 surveys out of a total of23 l contacts) This response rate is high enough to insure that a representative sample of customers was reached
bullbull Each time a customer came into the cleaner a new transaction was recorded If a customer brought in more than five items at any one time an additional transaction was added for each additional set of five items
3-34
RESULTS
3 611 Customer Experience ofCleaner by Nature Performance
Customesect were asked a series of questions relating to how well Cleaner by Nature performed in caring for their garments Table 319 summarizes questions relating to positive performance attributes that professional cleaners seek to maximize while Table 321 summarizes questions relating to negative performance attributes that professional cleaners seek to minimize All questions relate to how frequently the customers experience these attributes
More than three quarters of customers reported their garments were always clean and that they were always satisfied with how they were pressed On the other hand for customers who brought gannents to Cleaner by Nature with spots or stains less than half of customers said that stains were always removed to their satisfaction although more than three quarters of the customers (786) were always or frequently satisfied with stain removal
Table 319 Positive Performance Qualities Experienced by Cleaner by Nature Customers
Performance Quality Always Frequently Sometimes Never Clean 884 81 23 12
Satisfied with pressing 758 152 61 30
Satisfied with stain removal 475 311 139 74
Over 80 of Cleaner by Nature customers interviewed reported never experiencing any shrinkage stretching change in color change in feel bad odor rips or tears or damage to buttons or decorations (Table 20)37 Of these issues shrinkage problems were most common with more than 15 ofcustomers interviewed having shrinkage in the garments cleaned at Cleaner by Nature at least some of the time
Note Negative change in color and feel were derived from two questions how often was there a change in color or feel and was the change an improvement or not an improvement In addition for the type of change in color we interpreted unevenness in color as not an improvement
3-35
37
Table 320 Negative Performance Qualities Experienced by Cleaner by Nature Customers
Performance Oualitv Never Sometimes FreQuentlv Alwavs Shrinkage 841 129 18 12
Stretching 929 60 06 06
Change in color 923 47 24 06
Change in feel 887 94 13 07
Odor 941 36 00 24
Rips or tears 959 41 00 00
Damage to buttons or decorations
957 36 07 00
In sum looking at each of these ten performance measures individually customers surveyed reported high satisfaction with how their garments were treated Stain removal was revealed as the biggest problem over half of the customers surveyed who took clothes to Cleaner by Nature with spots or stains reported that they were not always removed to their satisfaction In addition 25 ofcustomers interviewed were not satisfied at least some of the time with how their garments were pressed Finally over 15 of customers surveyed experienced shrinkage for at least some of their garments
Evaluating these ten performance measures collectively revealed that half of the people surveyed who came to Cleaner by Nature at least once (91 out of 180) reported experiencing some problem with at least one of the ten performance measures Yet when asked directly whether they had any problems with garments after they were cleaned at Cleaner by Nature only 26 said yes Thus half the time when a customer experienced some difficulty with one of the performance measures it did not translate into the customers opinion that they had experienced a problem with the garment
3-36
3612 Overall Satisfaction with Cleaner by Nature
A number of questions in the survey were designed to directly or indirectly assess overall satisfaction with Cleaner by Nature for customers surveyed
Cleaner by Nature customers were asked to rate Cleaner by Nature as a professional cleaning service More than 60 of the 180 customers surveyed rated Cleaner by Nature as excellent and 32 rated it as good while only 46 rated it as fair and 23 rated it as poor (Table 321)
Table 321 Customer Rating of Cleaner by Nature as a Professional Cleaner
Ratine Frequency Percent Excellent 105 607 Good 56 324 Fair 8 46 Poor 4 23
When asked whether they would recommend Cleaner by Nature to a friend 93 of those surveyed said they would while 68 said they would not or didnt know (Table 322) Not surprisingly how customers rated Cieaner by Nature was highly correlated with whether they would recommend it to a friend all but four of the 161 customers interviewed who rated Cleaner by Nature as excellent or good also would recommend it to a friend while only 3 ofthe 12 customers rating Cleaner by Nature as fair or poor would recommend it to a friend (plt0001)
Table 322 Would Customer Recommend Cleaner by Nature to a Friend
Recommend Frequency Percent Yes 150 932 No 11 68
A key way to measure customer satisfaction is to see what proportion of customers continue to use Cleaner by Nature Of all Cleaner by Nature customers surveyed over three-fourths (778) said they were still a Cleaner by Nature customer (Table 323)
Table 323 Percent Who Still Consider Themselves Cleaner by Nature Customers
Frequency Percent Yes 136 778 No 39 222
3-37
Of the 39 customers who stopped using Cleaner by Nature less than 25 (n=9) mentioned cleaning quality as the first reason why they stopped over 40 (n=16) mentioned location while slightly more than 20 (n=8) said price and slightly more than 15 (n=6) said service quality (Table 324) As one would suspect the primary reasons38 customers gave for why they stopped using Cleaner by Nature were closely related to their overall rating of Cleaner by Nature and whether they would recommend Cleaner by Nature to a friend Three-fourths of those who stopped primarily because of cleaning quality rated Cleaner by Nature as fair or poor while 27 people who stopped because of location inconvenience or price rated Cleaner by Nature as excellent or good (plt0001)39 Ifwe assume that all the customers who stopped primarily because of location or convenience would have continued to use Cleaner by Nature ifit were more conveniently located then the proportion who would still be customers is 886 - nearly as high as Cleaner by Natures overall rating and the percentage ofcustomers who would recommend Cleaner by Nature to a friend
Table 324 Primary Reason for No Longer Using Cleaner by Nature
Freauencv Percent Location 16 410 Cleaning Quality 9 231 Price 8 205 Service or Convenience 6 154
A fourth measure ofoverall satisfaction has to do with the proportion of customers who exclusively use Cleaner by Nature as a professional cleaning service Of the customers who continue to use Cleaner by Nature 646 (84 of 130) exclusively use the wet cleaner as their professional cleaning service (Table 325)
Table 325 Cleaner by Nature Customers Continuing to Use Dry Cleaning
Percent Taken to Dry Cleaner Frequency Percent Cleaner bv Nature Onlv 84 646 Cleaner by Nature and Dry Cleaning 46 354
38 The first reason people mention in an open-ended question is usually assumed to be their primary reason 39 The relationship between why people stopped using Cleaner by Nature and their overall rating of Cleaner by Nature was mirrored almost identically in the responses to questions of why people stopped using Cleaner by Nature and whether they would recommend Cleaner by Nature to a friend
3-38
In addition three-fourths of Cleaner by Nature customers who continue to use dry cleaning take less than 25 of their garments to the dry cleaner (Table 326)
Table 326 Proportion of Garments Cleaner by Nature Customers Take to Dry Cleaners
Percent Taken to Drv Cleaner Freauency Percent 25 or Less 27 765 More than 26 8 235
Of the Cleaner by Nature customers surveyed who continue to use dry cleaning 293 (12 of 41) mentioned cleaning quality as the first reason why they continued40
while 439 mentioned location or convenience 146 mentioned price and 122 mentioned service or tum around time (Table 327) It is reasonable to assume that if all Cleaner by Nature customers who continued using dry cleaning because of location issues lived in a more convenient location they would use Cleaner by Nature On the other hand Cleaner by Nature has actually increased its prices since the survey was completed Thus those Cleaner by Nature customers mentioning price as the primary reason for continuing to use dry cleaning are likely to continue using dry cleaning
Table 327 Primary Reason Why Cleaner by Nature Customers Also Use Dry Cleaning
Reason Frequency Percent
LocationConvenience 18 439
Cleaning Quality 12 293
Price 6 146
Tum around time 5 122
Because most customers who were willing to try Cleaner by Nature at least once were likely to have used dry cleaning services it was possible to evaluate these customers experiences ofand opinions about Cleaner by Nature compared to dry cleaning In fact all customers interviewed said they had used dry cleaning in the past Table 328 summarizes the results from this comparison When asked to compare which was better for the environment all customers stated Cleaner by Nature Yet when asked which is less expensive 37 said dry cleaning compared to 22 who thought Cleaner by Nature was cheaper On the other hand a plurality (41 ) said that they were the same price or that it depended on the dry cleaner used for comparison In terms ofquality of cleaning almost three-fourths of customers favored the performance ofCleaner by Nature while only five percent favored dry cleaning Finally 86 of customers who
bullbull Four of the 46 Cleaner by Nature customers who continued using dry cleaning did not answer why they continued
3-39
were willing to try Cleaner by Nature at least once were more satisfied overall with Cleaner by Nature
Table 328 Customer Comparison of Cleaner by Nature to Dry Cleaning
Cleaner by Dry Depends Nature Cleanine Same on Cleaner
Environment 1000 00 00 00
Price 216 373 284 127
Quality of Cleaning 735 58 206 00
Overall Satisfaction 859 103 38 00
362 Cleaner by Nature Customer Satisfaction Survey Summary
In sum customers using Cleaner by Nature at least once appear well satisfied with how this wet cleaner performs as a professional cleaning service over 90 rated Cleaner by Nature excellent or good over 90 would recommend Cleaner by Nature to a friend over 75 were still customers over 50 who stop using it do so because oflocation or convenience 65 ofcontinuing customers use only Cleaner by Nature over threeshyquarters ofcontinuing Cleaner by Natwe customers who also use dry cleaning take 25 or less of their garments to be cleaned to the dry cleaner and the primary reason why Cleaner by Nature customers also use dry cleaning is because oflocation or convenience In terms of cleaning quality far more customers favored Cleaner by Nature (735) than dry cleaning (58)
Because Cleaner by Nature markets itself as an environmentally friendly and healthier alternative to dry cleaning the extent to which customers choose to use Cleaner by Nature for environmental or health-related reasons may very well influence how satisfied they are with the performance of Cleaner by Nature That is a self-selection liias may have occurred Ifself-selection bias did occur then customers who listed health or environmental reasons for first choosing or continuing to use Cleaner by Nature would have reported fewer performance problems and had a higher level of satisfaction than those who did not list those reasons Yet customers who chose to use Cleaner by Nature for healthenvironmental reasons were just as likely to report problems with performance and had a somewhat lower level of overall satisfaction than other customers This suggest that self-selection bias was unlikely to have influenced the overall results Therefore the experience and satisfaction level reported by Cleaner by Nature customers in this survey can be more readily generalized to all dry cleaning customers if they tried using wet cleaning as a professional cleaning service (See Appendix 3-R for a more detailed discussion)
3-40
363 Dry Cleaning Customer Survey
In order to evaluate how customer satisfaction with Cleaner by Nature compared to satisfaction with dry cleaning
METHOD
The survey conducted in May 1997 provides a baseline from which to analyze the results of the Cleaner by Nature satisfaction survey Like the survey of Cleaner by Nature customers the dry cleaner customer survey was also anonymous The phone numbers used in the survey had the same distribution ofprefixes as the respondents to the Cleaner by Nature survey The last four digits were randomly selected
Survey Instrument As with the Cleaner by Nature survey a series of questions was included to measure respondents overall satisfaction with dry cleaning as well as with the dry cleaner they use regularly In addition the dry cleaner survey included a set of questions about the frequency of specific cleaning-related problems (ie stain removal shrinkage etc) Because respondents were expected to have much greater experience with dry cleaning than Cleaner by Nature customers (and consequently greater opportunity for problems) the response category rarely which is not included in the Cleaner by Nature survey was added to the dry cleaner survey This category was designed to be coupled with never for the analysis so as to avoid a bias against dry cleaning For example the percentage ofcustomers who never or rarely experienced color change in dry cleaning would be compared with those who never experienced color change in wet cleaning In addition one survey question asked customers to identify the price category of the dry cleaners they used This question was included in the questionnaire to see if there is a relationship between satisfaction with dry cleaning and price In this way Cleaner by Nature a moderately priced cleaner could be compared to moderate to high-priced dry cleaners Also a question was included to gauge customers knowledge of the dry cleaning process Customers were asked whether they knew that a chemical solvent was used in dry cleaning while Cleaner by Nature customers had been asked if they knew that water was used at Cleaner by Nature Questions about frequency of use and customers motivations for selecting their dry cleaners served to provide a profile ofrespondents Finally questions were asked about age education income and ethnicity to determine whether the dry cleaning customers had a similar demographic distribution to Cleaner by Nature customers The survey instrument is included in Appendix 3-S
Sample Size A sample size of 100 was determined adequate to meet the needs of a comparative analysis with the Cleaner by Nature survey
Response Rate The customer response rate to the Dry Clean survey was 36 (100 surveys out of a total of250 contacts)41
41 The possibility of a response bias is discussed in 364 (Dry Cleaning Customer Survey Summary)
3-41
RESULTS
3631 Quality ofPerformance Cleaner by Nature and Dry Cleaning
Dry cleaning customers were asked a series of questions relating to how well dry cleaning performed in caring for their garments Because Cleaner by Nature customers were asked the same questions responses from these two customer groups can be compared Some Cleaner by Nature customers may not have had enough experience to judge the frequency with which problems occurred Therefore only experienced customers defined as those with six or more transactions were used for this analysis
Table 329 summarizes how experienced Cleaner by Nature customers and dry cleaning customers responded to questions relating to three positive performance qualities that professional cleaners seek to maximize While nearly all experienced Cleaner by Nature customers reported that their garments were frequently or always clean after getting them back from the wet cleaner significantly fewer (less than 80 ) dry cleaner customers reported that their garments were frequently or always clean after being dry cleaned (plt0001) While the satisfaction with pressing appeared comparable between the two groups less than half of dry cleaning customers said that they were frequently or always satisfied with how spots were removed while significantly more (almost 80) experienced Cleaner by Nature customers reported being frequently or always satisfied with stain removal at the wet cleaner plt0001)
Table 329 Positive Performance Qualities Experie~ced by Cleaner by Nature Customers and Dry Cleaner Customers
Performance Professional Cleaner Frequently Never Rarely Oualitv or Always or Sometimes
Clean Cleaner by Nature 962 38 Drv Cleanim 790 190
Pressing Cleaner by Nature 896 104 Drv Cleaning 838 162
Stain Removal Cleaner by Nature 797 203 middot Drv Cleanine 490 510
i Cleaner by Nature customers with six or more transactions ii Only dry clean customers were asked whether these performance attributes occurred rarely
3-42
Table 330 summarizes how experienced Cleaner by Nature customers and dry cleaning customers performed on seven performance qualities that professional cleaners seek to minimize
Table 330 Negative Performance Qualities Experienced by Cleaner by Nature Customers and Dry Cleaning Customers
Sometimes Rarelyii Frequently
Performance Quality Professional Cleaner or Never or Always
Shrinkage Cleaner by Nature 740 260 Dry Cleaning 810 190
Stretching Cleaner by Nature 868 132 Dry Cleaning 860 140
Rips or Tears Cleaner by Nature 910 90 Dry Cleaning 890 110
Color Change Cleaner by Nature 904 96 Drv Cleaning 790 210
Change in Feel Cleaner by Nature 831 129 Drv Cleaning 663 337
Damage to Buttons iii Cleaner by Nature 961 39 Dry Cleaning 630 370
Unpleasant Odor Cleaner by Nature 1000 00 Drv Cleaning 727 283
Cleaner by Nature customers with six or more transactions ii Only dry cleaner customers were asked whether performance attribute occurred rarely iii This category also includes damage to decorations
Seventy-four percent of experienced Cleaner by Nature customers reported that they had never experienced any shrinkage in garments cleaned at the wet cleaner On the other hand 81 of dry clean customers reported that shrinkage had never or rarely occurred Wet clean and dry clean customers reported a similar rate ofstretching and rips or tears in their garments after getting them back from the cleaner42 However dry cleaning customers reported significantly greater problems with a change in the color of garments (plt005) a change in the feel of garments (plt005) damage to buttons or decorations (plt0001) and garments coming back with an unpleasant smell (plt005)43
42 21 of dry clean customers reported that stretching had occurred rarely 27 of dry clean customers reported that
rips or tears occurred rarely 43
The Chi Square Test was used to evaluate the significance ofdifferences between Cleaner by Nature and dry clean customers A p-value less than 005 is the standard usually used to signify a qualitative difference in response (See
3-43
3632 Overall Satisfaction Cleaner by Nature and Dry Cleaning
Customers experience with the quality of cleaning is expected to influence their opinion of a professional cleaning service as well as how they use this service Whether these opinions and behaviors differ between customers using Cleaner by Nature and those using dry cleaning will be explored in this section This section includes all Cleaner by Nature customers and not only those with a high level of experience
Table 331 shows that a slightly higher proportion of Cleaner by Nature customers rated this wet cleaner as excellent or good compared to how dry cleaning customers rated the dry cleaner they used regularly (931 vs 866) This difference in overall rating increased when dry clean customers were asked to rate dry cleaning overall - only 69 of Cleaner by Nature customers rated it as fair or poor while 200 of dry clean customers rated dry cleaning overall as fair or poor
Table 331 Customer Rating of Professional Cleaners Cleaner by Nature Customers vs Dry Cleaning Customers
Professional Cleaner Excellent Good
Fair Poor
Cleaner by Nature 911 69
Dry Cleaner Used Regularly
Dry Cleaning Overall
866
800
134
200
i Ory cleaning customer ratings of cleaner they use regularly
1n addition a similar proportion ofcustomers would recommend Cleaner by Nature to a friend as customers would recommend the dry cleaner they use regularly to a friend (See Table 332)
Table 332 Customer Recommendation of Cleaner to a Friend Cleaner by Nature and Dry Cleaning Customers
Professional Cleaner Percent
Cleaner by ~ature 932 Drv Cleaner 877
i For only dry cleaner customcn who use only one cleaner regularly
Glantz Stanton Primer of Biostatistics McGraw-Hill 1981 p130)
3-44
On the other hand over half of the dry cleaning customers surveyed reported that they had stopped using a dry cleaner during the past year while less than a quarter of Cleaner by Nature customers reported that they were no longer using Cleaner by Nature (Table 333)
Table 333 Stopped Using Professional Cleaner in the Last Year
Professional Cleaner Percent
Cleaner by Nature 227 Dry Cleaner 540
This is for all Cleaner by Nature customers
Table 334 shows that the distribution ofreasons given for why customers who stopped using Cleaner by Nature or a dry cleaner in the past year is quite similar The proportion of Cleaner by Nature customers stating quality ofcleaning or price as the primary reasons why they stopped using this wet cleaner is similar to the proportion of dry cleaning customers who listed these as primary reasons On the other hand almost twice as many Cleaner by Nature customers mentioned location as the primary reason for discontinuing use of the wet cleaner while almost twice as many dry cleaning customers mentioned serviceconvenience middot
Table 334 Primary reason customers stopped using professional cleaner Cleaner by Nature Customers and Dry Cleaning Customers
Quality of Service Professional Cleaner Location Cleaninl Price Convenience
Cleaner by Nature 429 286 143 143 Dry Cleaning 235 353 157 255
i This is for all Cleaner by Nature customers
Finally the proportion ofcustomers who continue to use Cleaner by Nature and who also use a dry cleaner is similar to the proportion ofdry cleaning customers who use two or more dry cleaners (See Table 335)
Table 335 Percent of customers using more than one cleaner
Professional Cleaner Percent
Cleaner by Nature 354 Drv Cleaner 330
i This is for all continuing Cleaner by Nature customers
3-45
364 Dry Cleaning Customer Survey Summary
Customers who used Cleaner by Nature at least once reported being equally if not more satisfied with this wet cleaner when compared to customers using dry cleaning In terms ofparticular qualities of performance a significantly higher proportion of experienced Cleaner by Nature customers reported that their garments were always or frequently clean and that stains were always or frequently removed compared with dry cleaning customers In addition compared to customers using dry cleaning services significantly fewer experienced Cleaner by Nature customers reported problems with color change change in the feel of garments damage to buttons and decorations andor unpleasant odor after getting their clothes back from the cleaner
In terms ofoverall customer satisfaction customers using Cleaner by Nature at least one time report being equally ifnot more satisfied with Cleaner by Nature as dry cleaning customers are with dry cleaning While more than 90 of Cleaner by Nature customers rated this wet cleaner as excellent or good a similar proportion of dry clean customers rated the dry cleaner they used regularly as excellent or good The proportion of customers who would recommend the wet cleaner or the dry cleaner they used regularly was equally high More than half the dry clean customers stopped using a dry cleaner in the last year while less than a quarter of its customers stopped using Cleaner by Nature For those customers no longer using Cleaner by Nature or who stopped using a dry cleaner in the past year a similar proportion identified quality of cleaning as the primary reason for discontinuing use Finally the proportion ofcustomers who continue to use Cleaner by Nature and who also use dry cleaning is similar to the proportion of dry clean customers who use two or more dry cleaners
Since the survey of Cleaner by Nature customers was carried out fifteen months after the business opened customers surveyed were evaluating Cleaner by Nature with at most fifteen months of experience On the other hand it was assumed that dry cleaning customers were able to base their judgments of dry cleaning on many more years of experience This difference in experience was taken into account in both the construction of the dry cleaner survey itself as well as in the way that Cleaner by Nature customer responses were compared to dry clean customers When asking dry clean customers questions about the performance ofdry cleaning (eg shrinkage) customers were asked whether the problem occurred never rarely sometimes frequently or always Cleaner by Nature customers were not asked whether the issue occurred rarely Thus if Cleaner by Nature customers ever experienced this problem they would report that it occurred at least sometimes By grouping dry clean customers who stated that a problem occurred rarely with those that reported never a problem would have had to occur more than rarely to report that it happened sometimes The fact that the dry cleaning customers who were surveyed extensively utilized the rarely category validates this approach as an effective strategy for accounting for difference in experience For example 33 ofdry clean customers said that shrinkage rarely occurred while 34 said that color change rarely occurred
3-46
A second strategy was developed for the positively worded performance questions - quality ofpressing stain removal and cleanliness In the analysis stage customers who reported that one of these qualities (eg satisfied with pressing) occurred frequently or always were grouped together Thus grouping customers who had the experience of having a problem and reported frequently with those that reported always helps adjust for the difference in experience between dry clean customers and Cleaner by Nature customers for these positively worded questions The fact that none of the dry clean customers surveyed stated that they were always satisfied with pressing verifies this strategy
Because the response rate for the dry clean customer survey (36) was substantially lower than the response rate of the Clearier by Nature survey (78) the possibility that a response rate bias may have occurred needs to be evaluated A response bias would have occurred if those dry clean customers who completed the survey felt more negatively about dry cleaning than did those dry clean customers not responding This would have resulted in a sample that did not adequately represent the experiences and opinions of all dry clean customers by over-representing individuals with negative experiences and attitudes and thus under-representing individuals with more positive experiences or attitudes The results however indicate that 80 of dry clean customers interviewed for the survey rated dry cleaning overall as excellent or good (see Table 333) thus indicating a positive rather than negative opinion of dry cleaning Thus based on the responses from this survey it is very unlikely that the customers completing the survey over-represented customers with negative attitudes who use dry cleaning These results suggest that a response bias does not appear to be operating
3-47
37 Summary Analysis of Performance Assessment
Profile of Customer Garments During the demonstration period Cleaner by Nature cleaned virtually all of the customer garments (998) received When the cleaner rejected garments it was usually due to problems with colorfastness Furthermore the cleaner cleaned the volume and mix of garments of a typical dry cleaner About 67 ofCleaner by Nature garments were labeled dry clean only While Cleaner by Natures yearly volume was small due to its status as a start-up cleaner the number of garments cleaned at the plant during the demonstration period (34950) allowed for an evaluation of Cleaner by Natures performance
Problem Garments During the demonstration period Cleaner by Nature kept records on three types of problem garments aside from the rejected garments mentioned above customer claims (damaged or lost garments that need to be replaced) store credits (store credit awarded for damaged or lost garments) and redos (garments brought back by customers who felt they required additional attention) The combined claim rate and store credit rate for the post-start-up period (0047) was small below one half of one tenth of one percent The rate at which Cleaner by Nature customers returned garments for additional work during the post-start-up period (040) was on par with another local cleaner Cleaner by Nature has become more skilled at avoiding problems over time with greater experience (particularly those related to spotting and shrinkage) either through improved cleaning techniques or by rejecting a larger percentage of garments that may present dye-run problems
Repeat Clean Test A technical performance evaluation compared how wet cleaning and dry cleaning performed on 40 sets of identical garments after repeated cleaning and wear Color consistency and color migration were the areas where slightly greater problems for wet cleaning were most noted although overall changes in color for both wet cleaned and dry cleaned garments were seen as comparable There was slightly greater dimensional change for wet cleaning although the difference in average width and length measurement between the two processes was less than one third of one percent The technical evaluation also found only slight differences in most other performance areas There were also slightly greater problems in the areas ofpressing and general appearance for wet cleaning while there were slightly greater problems for dry cleaning in damage to the fabric or buttons Substantially more evaluators identified a chemical or dry cleaning odor for the dry cleaned garments although all garments had an acceptable odor Volunteers wearing the test garments indicated greater overall satisfaction with the wet cleaned garments with slightly greater shrinkage in wet cleaned garments and slightly greater stretching problems with stain removal and damage to fabrics or buttons in dry cleaned garments
3-48
Customer Satisfaction Surveys Customers who used Cleaner by Nature at least once reported being equally ifnot more satisfied with this wet cleaner when compared to customers using dry cleaning A significantly higher proportion of Cleaner by Nature customers experienced greater satisfaction with how clean their garments were and experienced few problems with stain removal compared to customers who use dry cleaning In addition compared to customers using dry cleaning services significantly fewer experienced Cleaner by Nature customers reported problems with color change change in the feel of garments damage to buttons and decorations andor unpleasant odor after getting their clothes back from the cleaner Shrinkage was the only performance area where a slightly higher proportion ofwet cleaning customers compared to dry cleaning customers experienced problems some of the time but not at a level that was statistically significant
In terms ofoverall customer satisfaction more than 90 of Cleaner by Nature customers rated this wet cleaner as excellent or good slightly more than the percentage of dry cleaning customers who gave the same rating to the dry cleaner they use regularly Similarly about 90 of Cleaner by Nature customers and dry cleaning customers would recommend their cleaner to a friend For those customers no longer using Cleaner by Nature or who stopped using a dry cleaner in the past year a similar proportion identified quality of cleaning as the primary reason for leaving Finally the proportion of customers who continue to use Cleaner by Nature but still use dry cleaning is similar to the proportion ofdry clean customers who use two or more dry cleaners
3-49
Section 4
Financial Assessment of Wet Cleaning
4 Financial Assessment of Wet Cleaning
41 Overview
The second major component of the evaluation is an assessment of the financial viability of professional wet cleaning The evaluation includes a case study of the financial performance of Cleaner by Nature through its first year of operation and a comparative analysis of the equipment and operating costs of wet cleaning and dry cleaning
The analysis and results of the case study include
bull A start-up cost analysis quantifies the costs during its first year related to starting the business
Cleaner by Nature spent $96523 on its first-year one-time start-up costs and needed an additional $48048 in operating capital to reach a positive cash balance Adjusting these costs for a typical owner-operated cleaner in a single facility oneshytime costs would have amounted to $78035 and additional operating costs would have totaled $38235
bull A profitloss analysis measures the profitability of Cleaner by Nature by matching monthly expenses incurred in wet cleaning garments with the revenues generated from cleaning those garments -- Cleaner by Natures financial picture improved significantly during its first year
While losses were recorded for the year as a whole by its fourth quarter Cleaner by Nature was making a profit of 3 Had Cleaner by Nature operated like a typical owner-operated cleaner in a single facility it would have made a 10 profit in its fourth quarter Revenues continued to increase after the first year of operation with profits in the second year projected to be more than 17
bull A pressing productivity analysis assesses the rate at which garments were pressed at Cleaner by Nature during its first year of operation
The number of garments pressed per hour at Cleaner by Nature increased by about 25 after special tensioning equipment was purchased
The second part of the financial assessment is a comparative analysis of the costs of starting up and operating a wet cleaner compared to a dry cleaner This analysis isolates those costs that are expected to vary in the two processes or the processshydependent costs and identifies the relative costs and savings of operating a wet cleaner like Cleaner by Nature For this section a model plant analysis was undertaken that draws on financial data from Cleaner by Natures first year of operation This analysis includes
4-1
bull An equipment cost comparison contrasts the purchase and maintenance costs of the cleaning systems pressing equipment boilers and other equipment used in wet cleaning and dry cleaning -- The cost of purchasing wet clean equipment was 9 less than the purchase cost of
dry cleaning equipment while the yearly expense associated with using and maintaining plant equipment was 31 less for wet cleaning than dry cleaning
bull A pressing time comparison analyzes the pressing productivity at Cleaner by Nature and two area dry cleaners while also comparing that infonnation with other pressing time studies -- It took Cleaner by Natures pressers 13 to 21 times longer to press garments
compared to two local dry cleaners Another pressing time study that was better able to control for key confounding variables indicated a 15 to 25 increase in pressing time for wet cleaning compared to dry cleaning Cleaner by Natures pressing wages as a percentage of revenues however were more in line with industry expectations
bull An overall cost comparison isolates a11 costs central to the operation of a professional cleaner in order to contrast how those costs vary in wet cleaning and dry cleaning -- While labor costs and soap costs were higher in wet cleaning the expenses
associated with purchasing and maintaining equipment and complying with government regulations were greater in dry cleaning Total operating costs were broadly comparable for wet cleaning and dry cleaning Dry cleaning costs can be greater when additional costs associated with reducing chemical-related liability exposure are factored in
Both the case study and the cost comparison focus on single small-sized cleaners A number of economic social and political factors may significantly influence both the start-up and operating costs and potential profitability of a wet cleaner or a dry cleaner These factors include changes in care labeling laws the development of other alternatives to dry cleaning technology changes and their influence on future equipment costs and the potential financial liability associated with PCE dry cleaning These factors are touched upon in this section and explored in more detail in the Discussion Section (Section VI)
4-2
42 Cleaner by Nature Case Study
421 Start-Up Costs
Start-up costs include the one-time costs associated with getting Cleaner by Nature up and running as well as the operating capital necessary to run the business to the point where it begins to generate a positive cash balance (that is there is more cash coming in than going out) 1 One-time costs include all costs paid before the business opened equipment purchases made during the first year and the advertising campaign which ran through the third quarter of the first year In addition to generalize these startshyup costs to reflect what a typical wet cleaner that operates from a single location is likely to pay the start-up cost estimate also removed certain costs particular to Cleaner by Nature (for example rent and insurance for its second location) while adding those costs usually paid by a professional cleaner (including the labor cost for the owner who worked at the counter without pay)
METHOD
Monthly revenues collected and line item costs incurred from the pre-opening period through the first year of operation were assembled from financial records provided by Cleaner by Natures owner Data was collected both from business spread sheets of itemized expenditures and revenues as well as directly from the financial records of the business Copies of lease and loan agreements were provided Computations from raw financial records were carried out to verify the accuracy of information assembled on spread sheets
RESULTS
Cleaner by Nature spent a total of $144571 in start-up costs through its first year of operation This included $96523 in one-time costs related to starting up the business and $48048 in operating capital (Table 41 ) An explanation of these costs is given below
One-Time Costs Related to Start-Up Almost half of the $96523 in start-up costs (or $46924) were associated with the purchase and installation of equipment at the plant and drop-shop2 Most of the plant equipment was obtained through a five-year capital lease which covered the purchase of pressing cleaning and spotting equipment the boiler the water conditioner the air compressor freight and partial installation costs Monthly lease
1 Business Start-Up Guide Dry Cleaning Entrepreneur Business Guide No 1037 Entrepreneur Group 1993 p 1037-145 2 Appendix 4-D provides an inventory of plant equipment
4-3
payments were $1642 A major capital cost not covered by the lease was the purchase eight months after the opening of the plant of tensioning equipment a Hi-Steam form fitter and a pant topper 3 The combined cost of the form fitter and pant topper came to $13531 including installation The second largest start-up cost was Cleaner by Natures first year advertising campaign which totaled$ I84914 This expense reflected the owners marketing background and her interest in future expansion
Table 41 Start-Up Costs at Cleaner by Nature
ONE-TIME COSTS Rent - first and last month Initial lnvento Equipment and Installation
Out of pocket $43640 Ca ital lease $3284 (first and last a ment)
Insurance Workers comp Business Auto
Tenant Im rovement Travel Vehicle Loan Miscellaneous
$1195 (3 months) $302 (2 months) $443 (6 months)
1 Cleaner
$7100 $3979
$46924
$18491 $306
$1231 $3088 $2099
$3554 $5375
$419 $3957
i One-time costs and operating capital of a typical cleaner excludes costs related to operating a plant and an agency at separate locations and the advertising costs associated with the expansion plans for the business but includes costs associated with unpaid wodc performed by the owner
Operating Capital In addition to the one-time start-up costs Cleaner by Nature needed $48048 in operating capital during the first year of operation while it was building up a customer base and costs paid out still exceeded cash collected (calculated on a per month basis) By the beginning of the second year it could be assumed that Cleaner by Nature had begun to sustain a positive cash balance with more cash coming into the business
3 These two pieces of new equipment replaced the reconditioned form fitter and pant topper that Cleaner by Nature originally purchased for $4200 4 These costs refer only to Cleaner by Natures first year advertising campaign An additional $4826 in yearly expenditures have been identified as on-going advertising costs
4-4
than going out While Cleaner by Nature showed a positive cash balance by December 1996 its eleventh month of operation there was a negative cash balance of $4995 in January 1997 (See Appendix 4-A) Januarys negative cash balance was due not to a decline in business but to unusual expenses paid in January This included an extra pay period ($4600) prepaid business insurance covering the whole second year ($920) and auto insurance covering the first six months of the second year ($443) While February 1997 had revenues equivalent to January 1997 (See Figure 41) it had only two (not three) pay periods and no unusual pre-paid costs thus the assumption of a positive cash balance by the beginning of the second year5 In subsequent months past the first year of operation moreover revenues continued to increase
Start-Up Costs for a Typical Cleaner Cleaner by Natures start-up costs are likely to be higher than a wet cleaner whose operations would be similar to a typical comer cleaner Cleaner by Nature had higher payroll costs than a typical comer cleaner because of operating a plant and drop-off site separately Cleaner by Nature has a van and driver on staff expenses that a start-up cleaner with a plant on the premises might not incur Because of the two locations the division of labor is more strict For example a counter person cannot take on assembly responsibilities In addition utility building maintenance and security costs are higher due to this arrangement In order to understand how Cleaner by Nature might have fared if it had been a comer cleaner with a plant on the premises several identifiable costs related to Cleaner by Natures operation of two locations were eliminated6 Those costs included payroll for the driver loan payments and operating costs for the delivery van auto and workers compensation insurance and the extra rent7 In addition the suggested cost of grand opening advertising for a dry cleaner is identified as no greater than $23008 Cleaner by Natures grand opening advertising campaign of $18491 was $16191 greater than expected On the other hand Cleaner by Natures owner (who is not a cleaner) worked at the counter during the first year of operation without being paid9 Adding in this counter labor cost lowering the grand opening advertising and removing certain costs associated with operating at two locations would have lowered by $18488 the one-time start-up costs (to $78035) and the operating capital by $9813 (to $38235) (Table 41) Thus if Cleaner by Nature was set up as a typical comer cleaner with a plant on the premises and normal advertising costs the total start-up costs (one-time costs plus operating capital) would have been $116270
5 In addition this assumes that all other costs remained the same 6 While there are also utility costs and extra labor costs besides the driver associated with operating at two sites these extra costs were difficult to estimate and thus were not included Excluding these costs makes the total estimate of reduced costs conservative 7 These costs added $2297 to one-time start-up costs and $14805 to operating costs Appendix 4A shows the expenses for the driver and van purchase and use Auto insurance for the van was $442 per quarter Reduced worker compensation amounted to $200 for the year The reduction of rent was estimated at $250 per month The combined plant and drop-off site rent was $3550 per month for most of the demonstration period If Cleaner by Nature had operated a 1500 square foot facility at the site of the drop-off shop the cost of rent would have been approximately $3300 bull based on the existing size of the drop-off site and the square foot cost of this site 8 Business Start-Up Guide Dry Cleaning Entrepreneur Business Guide No 1037 Entrepreneur Group I993 p 1037-14S 9 The owner worked at the counter 20 hours per week for the first six months and 12 hours per week for the second half of the first year This would have added $4992 in labor costs if this labor was perfonned by a member of the staff
4-5
422 Cleaner by Natures Profit and Loss
To calculate the profit and loss of a business an accrual method of accounting has been used While the cash basis of accounting (cash flow infonnation) identifies what cash is needed to pay bills on a monthly basis by itself it can present an incomplete and potentially misleading picture of the financial viability of a business 10 The accrual basis of accounting is specifically designed to correct for such problems and thus provides a view of business profitability during the period of time analyzed Cleaner by Natures Income Statement (used to identify profit and loss) uses the accrual method to assess whether the revenues generated from gannents serviced at Cleaner by Nature exceeded the expenses incurred in processing these gannents To assess profitability line items in the cash flow statement which can understate or overstate certain expenses (eg prepayments) and revenues (eg uncollected cash) have been adjusted 11 The accrual method is particularly useful in analyzing pollution prevention investments because the lifetime of costs and benefits associated with the equipment and not just the up-front purchase price needs to be taken into account 12 The Income Statement answers the question of whether over the life of a business opening and operating a 100 wet cleaner is a good financial decision
METHOD
To create the Income Statement (to identify profit and loss) for Cleaner by Nature three categories of adjustments needed to be made to line items in the cash flow statement prepaid expenses accrued expenses and accrued revenue The general method used for adjusting items within each of these categories is outlined below (See Appendix 4-B for a more detailed description of the methods used for each adjustment)
Prepaid expenses -- expenses paid before they are used or consumed bull Supplies Supply inventory was purchased periodically from the start-up and
through the first year of operation To record the portion of supplies used in the processing of gannents each month the total supply cost was calculated and apportioned each month relative to the number of gannents cleaned
bull Insurance The total prepaid insurance covering the first year was spread equally across each month of operation
bull Depreciation Depreciated expense was calculated both for equipment and furniture purchased or covered in the capital lease and vehicle loan While the useful life of plant equipment was assumed to be fifteen years the installation of this equipment was depreciated over ten years -- the length of time the plant lease
IO For example insurance for the second year of operation at Cleaner by Nature was prepaid in the fourth quarter of the first year thus adding an expense not associated with the first year of operation 11 Weygandt Jerry Donald Kieso and Walter Kell Accounting Principles Fourth Edition John Wiley amp Sons 1995 Pdeg 113)2 American Institute for Pollution Prevention A Primer for Financial Analysis of Pollution Prevention Projects
EPA600R-93059 April 1993 p3
4-6
could be extended Equipment and furniture at the drop-shop was depreciated over five years because most of the equipment had a relatively short life span
Accrued expenses -- expenses incurred but not yet paid in cash or recorded bull Salaries Workers were paid every two weeks after work was performed Since
some pay checks overlap two different months the part attributable to the prior month was added to that month and subtracted from the month in which it was paid
bull Utilities Water costs at the plant were paid every other month after the water was used The total utility bill of the month in which each waer bill was paid and the prior month was averaged
Accrued revenue -- revenues earned but not yet received in cash or recorded bull Items cleaned but not paid for at the end of each month There are some items
cleaned in one month but paid for in a subsequent month A computer print-out was created showing garments cleaned each month and revenue generated from those items
RESULTS
Profit and Loss of Cleaner by Nature Table 42 shows the expenses accrued and revenue generated from items serviced at Cleaner by Nature for the four quarters of the first year of operation Cleaner by Nature generated $185372 in total revenues in its first year of operation 13 Accrued revenue i_ncreased steadily as the year progressed from an average of less than $6000 per month in the first quarter to an average of over $20000 per month in the fourth quarter This pattern reflects the increase in the number of pieces cleaned at Cleaner by Nature each quarter Total expenses accrued at Cleaner by Nature from preshyopening through the end of the first year came to $26919814 As expected the variable expenses accrued each quarter closely parallel the number of pieces serviced at Cleaner by Nature
Cleaner by Natures financial performance improved steadily as the year progressed While the business lost almost $58000 in its first year of operation over half of this loss came from expenses accrued in the first quarter of operation when Cleaner by Nature was only processing an average of 57 garments per day By the third quarter Cleaner by Nature was processing 167 garments per day on average and showed a loss of only $8875 By thefourth quarter Cleaner by Nature was processing 197 garments per day on average and was able to turn a profit of 3
13 Revenue generated was almost 5 higher than revenue collected (see Appendix 4A) because it included cash paid after the first year ended for items cleaned within the first year 14 Accrued expenses were almost 19 lower than expenses paid for in this same period mostly due to the fact that equipment costs are viewed as assets which are depreciated over their useful life (See Appendix 4A)
4-7
Table 42 Income Statement for Cleaner by Nature
2 4th Quarter TOTAL
REVENUE (generated) END INVENTORY
EXPENSES Variable Expenses
Labor--Agency Mana er $0 $958 $6319 $6881 $14158 Labor--Customer service $3811 $4613 $2902 $2976 $14302 Labor--Driver $0 $611 $2552 $2659 $5823 Labor--Cleaner $8320 $9673 $6853 $6881 $31728 Labor--Presser $4768 $7130 $8289 $7255 $27441 Labor -- Assembly $0 $954 $1799 $2863 $5616 Outside work 11 $1698 $4340 $5579 $5980 $17597 Supplies $1932 $4465 $5781 $6389 $18566 Utilities $663 $825 $1404 $1673 $4565 Vehicle Operation $0 $694 $321 $887 $1902
F_ixed Expenses Advertising $6445 $8648 $4381 $847 $20321 Equip and Installation $998 $1012 $1281 $1297 $4588 Equipment Lease $1632 $1632 $1632 $1632 $6528 Equipment Maintenance $90 $0 $24 $315 $429 Insurance $1556 $1880 $2100 $2138 $7674 Rent $10841 $10650 $10762 $10768 $43021 Tenant Improvement $2707 $435 $0 $0 $3142 Vehicle Loan $356 $356 $356 $356 $1423 Miscellaneous 111 $4044 $3758 $3431 $14776
PROFIT (LOSS)
$49861
($32452)
$62634
($18439)
$65766
($8875) $2038
$243601
($57728) PERCENT PROFIT (LOSS) (1864) (417) (156) 30 (316)
AVG PIECESDAy IV 57 131 167 197 138
i This does not include counter worlt canied out by the owner Owner worlted 20 hours a week at the counter for first six months and 12 hours a week al the counter for the final six months of the first year
ii Includes expenses associated with laundry leather cleaning and rug cleaning iii Includes bank charges bounced checks building maintenance and security claims office supplies telephone and travel and
education iv Calculated by taking the total garments wet cleaned each quarter and dividing by the number of days the plant operated
4-8
Typical Cleaners Profit and Loss The expense of operating a plant and an agency or drop-off store affected Cleaner by Natures profitability in the first year of operation Had Cleaner by Nature been set up like a typical owner-operated cleaner with a plant and drop-off site in a single facility then expenses associated with paying extra rent and utilizing a delivery van would have been reduced or eliminated and expenses associated with the work of the owner would be accounted for 15 Adjusting these accrued expenses reveals that Cleaner by Nature as a typical owner-operated cleaner in a single facility would have turned a profit in the fourth quarter of 10 (Table 43)
Table 43 Typical Cleaner Income Statement
1st 2nd 3rd 4th TOTAL
i Restated one-time costs and operating capital excludes costs related to operating a plant and an agency at separate locations and the advertising costs associated with the expansion plans for the business as well as includes costs associated with unpaid work performed by the owner
Projected Profitability Projecting Cleaner by Natures profitability or losses into its second year of operation can be accomplished by analyzing the pattern of expenses and revenues during its first year In addition data made available by Cleaner by Natures owner on revenues collected during the first four months of the second year provide a baseline for this projection Figure 41 displays monthly expenses at Cleaner by Nature from the pre-opening period through the first year of operation and revenues through the first four months of the second year 16 While the break-even point for this wet cleaner came at the end of the first year by the second quarter of the first year expenses appeared to flatten out at about $20000 per month while revenue steadily increased throughout the first year and into the first four months of the second year
15 See Section 411 for an explanation of these costs 16 Cleaner by Nature owner provided revenue data only No data on expenses were given
4-9
Figure 41 Cleaner by Natures Monthly Expenses and Revenues
$35000
$30000
$25000
$20000
$15000
$10000
Haamppenses I _ Revenue
-~
f---- - -I- I- -- I- ~ - t--
-
-
-_ I-
- - t-
- f--- I--
t-
-
-
t-
t-
-f---
f---
-
$5000
$0
-bO
middota amp Q
ct
I-
I t D Da at a ~ l
f---
D a Cl
lt
t-
D I
l
f---
~ ~
~ ~
f--- t- t- t- t- f---
D~ ~ It i
~ u 0cgtllt cl z il
r-I
r-I amp
~
r-a
a l
r-t Cl
lt
r-
i l
1 Data represents expenses accrued and revenues generated each month Revenue for February 1997 through May 1997 is cash collected not revenue generated Since business is still growing more revenue is generated each month than collected
Table 44 is a projected Income Statement for Cleaner by Nature for its second year of operation Estimated revenue generated at Cleaner by Nature during the second year is based on sales figures for the first four months of the second year 17 While revenue during these four months grew rapidly from $22000 to $31000 for the purpose of this projection it is assumed that the generated revenue remained constant subsequent to the fourth month of the second year 18 However even with this conservative assumption projected total revenue at Cleaner by Nature for the second year is estimated to be $359258 - almost twice the revenue generated in the first year Expenses used in creating these revenues are estimated based on the first year Income Statement (Table 42) as well as additional information provided by the owner
Even though total expenses during the first year flattened out as revenue generated continued to rise certain expenses are expected to increase as the number of garments that are wet cleaned increases Each of the variable expenses including total labor supplies utilities and vehicle use as well as workers compensation insurance was expected to increase proportional to the increase in the number of garments wet cleaned The labor expenses that were expected to increase included pressing costs assembly
17 This data was provided by the owner of Cleaner by Nature 18 Shonly before completing the final repon revenue figures for October 1997 (which amounted to about $40000 from Cleaner by Nature business excluding revenues from shin laundry items) were obtained This figure indicated a significant jump in revenues for that month in comparison to the first four months of the second year Yet because data was not available for June through September the October figure was not used as a data point in the projection Thus the projection may underestimate the revenue and profitability of Oeaner by Nature in its second year of operation
4-10
costs and the costs for the driver On the other hand the labor costs for the cleaner the agency manager and counter personnel were not assumed to increase19
Table 44 Projected Income Statement for Cleaner by Nature for Second Year of Operation
EXPENSES
5th 6th Quarter
7th 8th TOTAL
Variable Expenses Labor--Agency Manager $6881 $6881 $6881 $6881 $27525 Labor--Customer Service $2976 $2976 $2976 $2976 $11906 Labor--Driver $2824 $3494 $3494 $3494 $13307 Labor-Cleaner $6881 $6881 $6881 $6881 $27525
Labor--Presser $7704 $9531 $9531 $9531 $36298 Labor--Assembly $3040 $3761 $3761 $3761 $14324 Outside work- Laundry $7617 $9423 $9423 $9423 $35885 Supplies $6785 $8394 $8394 $8394 $31966 Utilities $1775 $2196 $2196 $2196 $8365 Vehicle Operation $945 $1169 $1169 $1169 $4453
Fixed Expenses Advertising $847 $847 $847 $847 $3388 Equip and Installation $1281 $1281 $1281 $1281 $5124 Equipment Lease $1632 $1632 $1632 $1632 $6528 Equipment Maintenance $411 $411 $411 $411 $1644 Insurance $2225 $2385 $2385 $2385 $9381 Rent $10768 $10768 $10768 $10768 $43072 Vehicle Loan $356 $356 $356 $356 $1423 Miscellaneous bullbull $3543 $3543 $3543 $3543 $14172
TOTAL EXPENSES
PROFIT (LOSS)
$68321
$7760
$75061
$18404
$75061
$18404
$75061
$18404
$293503
$62973 PERCENT PROFIT (LOSS) 102 195 195 195 175
PIECES WET CLEANED 12773 15802 15802 15802 60177
i Based on total revenue collected at Cleaner by Nature for first four months of second year of operation ii All variable epenses were assumed to increase proportional to lbe number of garments cleaned except labor costs for the Agency
Manager and the Cleaner (both of whom were on full-time salary at the end of the first year) and Customer Service (counter service wJS fully covered by the fourth quarter of the first year)
iii All fixed expenses were assumed to remain the same as the fourth quarter iv Includes bank charges bounced checks building maintenance and security claims office supplies telephone travel education
Total profit for the second year is projected to be $63086 with the profit jumping from 102 profit in the first quarter of the second year to 195 for the remainder of the year as the number of pieces wet cleaned increases The 102 profit in the 5th quarter itself was a jump from a 305 profit in the 4th quarter of the first year
19 Both the Cleaner and the Agency Manager were on salary
4-II
These increases in profitability are due to increased efficiency of labor and capital equipment In particular while revenue generated increased rapidly by the beginning of the second year the labor expense for the cleaner and agency manager and the capital equipment costs remain the same
423 Cleaner by Natures Pressing Productivity
METHOD
Pressing garments can be more labor-intensive in wet cleaning than in dry cleaning because garments generally are more wrinkled after being submerged in water than in PCE In an effort to improve productivity at the plant Cleaner by Nature purchased during the third quarter of the first year of operation special tensioning presses a fotm fitter and a pant topper Payroll figures were used to calculate whether the purchase of this equipment a significant expense had an impact on the productivity of the pressers The accrued payroll expense for pressing labor was divided by the hourly wage rate for pressers ($825) to derive the number of hours per quarter spent on pressing20 The number of garments processed per quarter was then divided by the number of hours of pressing time per quarter to produce the number of pieces pressed per hour
RESULTS
The analysis of pressing payroll information reveals that the number of garments Cleaner by Nature pressers could finish per hour increased during the first year of operation from 97 in the second quarter to 108 in the third quarter to 137 in the fourth quarter21
(Table 45) The increase of nearly three garments per hour between the third and fourth quarter is likely due to the utilization in the fourth quarter of special tensioning equipment for pressing purchased at the end of the third quarter The increased productivity of the pressers in the last quarter may also be attributed to an increase in skill among the pressers increased volume and better coordination at the plant over time22
Table 45 Pressing Speed Over Time in Cleaner by Natures First Year i
1st Quarterbull 2nd Quarter 3rd Quarter iii 4th Quarter Estimated Hours - 864 1005 879 Pieces Wet Cleaned 3636 8405 10882 12027
Estimated PiecesHr - 972 108 137 1 Pressing rates were calculated using accrued pressing labor expense each quarter and 1110nthly garment counts u Pressing rates were not available for this period because the presser split his time between counter worlc and pressing m Cleaner by Nature purchased tensioning equipment during the third quarter The equipment was installed on September 29
20 The hourly wage rate ranged from $8 to $9 per hour The owner provided $825 as an estimate of the typical wages 21 Pressing time information was not available in the first quaner because one of the pressers employed during that time also had counter responsibilities and consequently there was no reliable data for this period 22 Another study that compared wet cleaning pressing productivity before and after the installation of tensioning equipment also found an increase At Utopia Cleaners in Massachusetts the installation of tensioning equipment improved productivity by about 38 from an estimated 12 pieces per hour to 17 pieces per hour
4-12
43 Cost Comparison of Cleaner by Nature and Dry Cleaning
INTRODUCTION
Generalizing from a case study is always bound by factors associated with the particularities of a business There are many cost factors independent of the process used that may affect financial performance A comparative cost analysis of professional wet cleaning and dry cleaning was undertaken so as to isolate those costs that are specific to each process
The cost comparison of wet cleaning and dry cleaning draws on the financial information presented in the case study to analyze the cost differencesbull between Cleaner by Nature and a model dry cleaner The comparative analysis is between a mature technology and a developing technology that is being used in a start-up facility Consequently the cost comparison needs to be viewed as specific to Cleaner by Natures experience and in relation to this point in time in the development of wet cleaning technology The comparison includes three components The first is a comparison of equipment (or capital) costs for Cleaner by Nature and a model dry cleaner the second is a comparison of pressing time at Cleaner by Nature and two area dry cleaners and the third is a comparison of operating costs at Cleaner by Nature and a model dry cleaner
It is assumed that the model dry cleaner is using the most advanced dry cleaning equipment a PCE machine that includes primary and secondary control technology A new dry cleaner opening a plant in the South Coast Air Quality Management District after June 9 1996 would be required to purchase a PCE machine with this configuration A 35-pound PCE machine was chosen for the comparison because it has a similar throughput to a 30-pound Aquatex washer and 50-pound dryer A 30-pound Aquatex system would be expected to process about 387 pounds of clothes in an eight hour day if used at capacity2 while a 35-pound PCE machine would process between 341 pounds and 439 pounds of clothing during the same time period depending on the length of the cycle24
Cleaner by Natures costs were adjusted in four ways to make it more comparable to the model dry cleaner 1) All equipment costs were paid for outright 2) The assumption was made that Cleaner by Nature purchased the tensioning equipment and that the conventional presses they replaced were not purchased 3) Fourth quarter costs
nie wet cleaning calculation assumes that 90 of garments are dried in the moisture control dryer while the remaining I 0 of garments are line dried Because the wet cleaning system is a transfer system one load can be washed while the other is being dried Consequently the system can process a 27 lb load of garments every 30 minutes (the maximum length of the dry cycle) when the washer and dryer are both in operation In an eight hour day the first and last loads of day would occur when one of the two machines is inactive a factor that is also considered in the calculation 24As PCE machines are generally not filled to capacity this calculation assumes that the PCE machine is processing 32 pounds of garments every 35 to 45 minutes in a dry to dry system
4-13
and revenues were often used for the operating cost comparison because Cleaner by Nature was operating at its peak volume during the demonstration period (197 garments per day) and had installed the tensioning equipment 4) The rates for utility and detergent use were based on the calculations from the environmental assessment which is discussed in more detail in Section IV
431 Equipment Cost Comparison
MEIBOD
The most significant capital cost for a start-up cleaner is the purchase of equipment for the plant Both wet cleaners and dry cleaners must purchase a range of items including cleaning systems pressing equipment boilers and spotting boards and pay for their shipment and installation The wet cleaning costs are the actual equipment costs incurred by Cleaner by Nature (tax included) The cost of the wet cleaning system is the price that Cleaner by Nature paid for its Aquatex 30 pound washer and 50 pound natural gas dryer The cost of the pressing equipment is the price paid for presses minus the conventional pant topper and form fitter that became redundant once Cleaner by Nature purchased the tensioning equipment
The dry cleaning system includes the cost of a 35-pound PCE machine a IS-ton water tower and pump a wastewater evaporator a spill containment pan for the PCE machine and a recooper Four different distributors of dry cleaning equipment each provided a price that the equipment is typically sold for rather than the list price which is usually higher 25 The average of these prices including 825 sales tax was taken as the estimate of the cost of the dry clean system The cost of the dry cleaning pressing equipment is the price of Cleaner by Natures pressing equipment prior to the purchase of the tensioning form fitter and pant topper However the analysis assumes that a dry cleaner purchased the conventional presses new rather than reconditioned (as was the case for Cleaner by Nature) to make the costs more comparable to the new tensioning equipment
The actual expense to a professional cleaner of operating this plant equipment includes the cost of purchasing shipping installing and maintaining the equipment over its useful life 26 The estimate of the expected useful life of the wet clean machines was obtained from the distributors of wet clean equipment as well as from personnel repairing wet clean machines The estimate of the expected useful life of the dry clean machines
25 The water tower pump and wastewater evaporator and recooper are control technologies typically used in Southern California A 35-pound PCE machine sells for an average of $32500 The wastewater evaporator which is used to evaporate the wastewater produced by the PCE machine sells for about $1300 1be water tower and pump ($1900) assist in the cooling of the vaporized PCE and can also be substituted for a device called a chiller which is estimated to cost two to three times as much The spill containment pan ($1500) is a trough that is large enough to hold the PCE in the storage tank of the dry cleaning machine An alternative method of spill containment is to modify the floor of the facility 26 See discussion of accrual method of accounting in Section 41
4-14
came from three of the four distributors whose machine prices were used to calculate dry cleaning machine cost from personnel repairing dry clean machines and from a dry cleaning consulting firm An estimate of average yearly equipment maintenance cost of the wet clean machine was generated by adding together all repair costs that could reasonably be expected to occur over the life of the equipment27 Surveys of dry cleaners by two national dry cleaning trade associations were used to estimate the annual cost of maintaining a dry cleaning machine as well as all other plant equipment28 The cost of installing plant equipment at a dry cleaner or a wet cleaner was assumed to be the same
RESULTS
Start-Up Equipment Costs
The total costs of purchasing plant equipment at Cleaner by Nature were 93 lower than that of purchasing dry cleaning equipment (fable 46) The price of the wet cleaning system ($27833) was 312 less expensive than that of a PCE system with a similar capacity ($40813) This difference is due to the fact that a PCE system requires expensive pollution control devices to be built into or added onto the machine The pressing equipment on the other hand cost 28 more for the model wet cleaner ($25969) than for a comparable dry cleaner ($20254) What accounted for the difference was the tensioning pressing equipment The tensioning equipment applies tension to garments to increase the speed and the quality of the pressing The tensioning presses (a form fitter and a pant topper) sold for about $13000 over three times the amount of the reconditioned form fitter and pant topper originally purchased by Cleaner by Nature Wet cleaning installation costs may be less expensive because the equipment is smaller and does not require a concrete slab29 However Cleaner by Natures installer said that there would be little difference between the installation costs for a dry cleaner and a wet cleaner operating in the Cleaner by Nature plant
27 This estimate was provided by Steve Trainer the chief equipment technician at Iowa Techniques which distributes and repairs both dry clean and wet clean equipment Mr Trainer mostly repairs dry clean machines but also repairs Aquatex machines The two dry cleaning association surveys were the Neighborhood Cleaners Association Cost Comparison Chart-1996 and the International Fabricare Institute Survey of 1991 Operating Costs 29 USEPA Office of Pollution Prevention and Toxics Design for Environment Program Making the Most of Your Cleaning Business Dry CleaningWet Cleaning Case Studies and Financial Analysis Worksheets (DRAFI) (March 1997)13
4-15
Table 46 Equipment Costs for Cleaner by Nature and Dry Cleaning i
Cleaner by Nature Dry Cleaning
Cleaning system $27833 $40813
Pressing equipment $25969 $20254
Other plant equipment $16913 $16913
TOTAL $70715 $77980
Cost Difference middotmiddot $7265 +
middot
Difference middot 93 less than dry deaning middotmiddot
i These costs are based on typical or actual selling price of equipment The 825 California sales taX is included in these estimates
Yearly Equipment Expense
For a professional cleaner the yearly expense of operating plant equipment includes not only the use of the equipment but the cost of shipping installing and maintaining the equipment over its useful life The average yearly expense for plant equipment is $8314 for a model wet cleaner and $12085 for a model dry cleaner (Table 47)30 The reason the yearly expense of wet clean equipment is 31 lower is primarily due to differences in the estimated life of a wet clean machine (15 years) and a dry clean machine (10 years) as well as the more expensive cost of maintaining the dry clean machine over its useful life
Plant Equipment Expense
For dry cleaning equipment various pollution control devices are now required These control systems with precise temperature and pressure conditions place physical stress on the machine as a whole shortening the equipments useful life Wet clean washing and drying systems do not require such devices The yearly expense of the wet clean system depreciated over fifteen years ($1856) is less than half the yearly expense of the dry clean system depreciated over ten years ($4081) (See Table 4 7) The useful life of all other plant equipment including pressing equipment was estimated at fifteen years and depreciated over this period of time The greater expense for wet cleaning pressing equipment is due to the cost of the special tensioning equipment All shipping and installation is depreciated over the life of the equipment The greater expense for dry cleaning equipment is due to the shorter life of the machine
30 Expected lifespans of the wet cleaning and dry cleaning equipment were based on interviews with distributors repair personnel and a firm that specializes in consulting for dry cleaners See Appendix 4-F Equipment expense
4-16
Maintenance Expense
The total expense of maintaining the wet clean machine (parts and labor) came to $379 per year while the maintenance of the dry clean machine came to $2306 per year (Table 47) The yearly expense of maintaining the wet clean machine was calculated by estimating the parts and labor of maintaining the machine over a fifteen year life span ($5690) This estimate included an assumption that the computer system a $1S00 expense would need to be replaced even though it was very unlikely that this need would occur thus leading to a probable overestimate of costs31 The yearly expense of maintaining a dry clean machine was based on the results of two national dry cleaning trade association surveys which estimated that 204 of the revenue of a dry cleaner was spent on all equipment maintenance (parts and labor)32 Maintenance of the dry clean machine for this study was estimated at $1887 or half the amount (102 of revenue) identified in the surveys33 Annual filter costs come to $419 with total annual expenses thus equaling $2306 ($1887+$419)34 Maintenance expenses for other plant equipment was comparable for wet cleaning and dry cleaning ($1887 or 102 ofrevenue)
Table 47 Yearly Equipment Expense Cleaner by Nature and Dry Cleaning
Cleaner by Nature Dry Cleaning
Cleaning system 1 $1856 $4081
Other plant equipment $2859 $2478
Shipping amp installation Iii $1800 $1917
Maintenance - cleaning system $379 $2306
Maintenance - other plant equipment $1887 $1887
TOTAL $8314 $12085
Difference in Expense middotmiddot middotmiddotbullmiddot bull middot middotmiddot _
middot $3771 Difference
middotbullbull
middot
middot 312 less than dry cleaning
i The wet cleaning system cost was depreciated over IS years while the dry clean system was depreciated over 10 years ii Other plant equipment was depreciated over IS years iii Shipping and installation for the oil wet clean equipment depreciated over IS years Shipping and installation for the dry clean
system was depreciated over 10 years while all other dry clean plant equipment was depreciated over 15 years
31 Steve Trainer chief mechanic Iowa Technique November 7 1997 32 Intemational Fabricare Institute estimates that 307 of annual sales were spent on maintenance (parts and labor for dry cleaners with revenues of less than $200000 International Fabricare Institute Survey of 1991 Operating Costs The Neighborhood Cleaners Association estimates that 125 of all revenue would be expected to be spent on maintenance for a dry cleaner charging $850 per two piece suit - similar to the price charged at Cleaner by Nature Neighborhood Cleaners Association Cost Comparison Chan-1996 The revenue basis for these estimates was the total revenue generated at Cleaner by Nature during the first year of operation ($185872 33 Personal communications with Ted Barry (John Barry amp Associates a dry cleaning consulting firm November 5 1997 Eddy Centes (chief mechanic at Pacific Equipment November 10 1997 Steve Trainer (chief mechanic at Iowa Techniques) November 11 1997 34 Filter costs are estimated to be $0012garment The number of garments wet cleaned at Cleaner by Nature in the first year of operation was 34950 See Appendix 4-F Supplies - Filter Replacement
4-17
432 Pressing Time Comparison
METHOD
In order to obtain comparison data on the relative pressing labor demands in wet cleaning and dry cleaning an analysis of pressing time was undertaken at Cleaner by Nature and two area dry cleaners In addition Cleaner by Natures quarterly pressing wages were analyzed in relation to wet cleaning revenue and compared to available industry figures
Controlling for Confounding Variables Many factors aside from the choice of cleaning process can influence the speed of pressing They include 1) the speed of the individual presser 2) the level of quality desired by the cleaner 3) the fiber weave and construction of the garment 4) the circumstances when the pressing occurs (for example if a rush job is required 5) the pressing equipment used and 6) the productivity expectations of the management For the pressing time study an attempt was made to control for as many factors as possible with the exception of the pressing equipment Cleaner by Nature pressers used tensioning equipment whereas the dry cleaners relied on traditional dry cleaning equipment which corresponds to the assumptions developed for the overall comparison
Selection ofDry Cleaners for Comparison In an effort to control for quality dry cleaners in a similar price range to Cleaner by Nature were sought for a comparison The two available dry cleaners are slightly more expensive but are still in a similar price range to Cleaner by Nature (See Appendix 4-C) While these were quality cleaners they were also sizable facilities Cleaner A processes about 2 JOO garments per week while Cleaner B processes about 6000 garments per week Cleaner by Nature processed about 1000 garments per week during its fourth quarter of operation
A third cleaner (Cleaner C) initially selected for the pressing time study was later excluded After one visit it appeared that the pressing time at Cleaner C was much slower than pressing time at Cleaner A and Cleaner B and even slower than pressing time at Cleaner by Nature Like Cleaner by Nature Cleaner C was a start-up business Subsequently the owner at Cleaner C indicated that the business had not yet attained profitability as a start-up rather than established business (similar to Cleaner by Nature at the time) and that there had been discussions by Cleaner C about raising prices Since Cleaner by Nature was being compared to profitable businesses (one of the indicators of viability) the decision was made to eliminate Cleaner C from this aspect of the study The decision to eliminate Cleaner C from the comparison was an assumption that could be seen to bias against Cleaner by Nature
Garment Selection The evaluation focused on the three types of garments most commonly taken to professional cleaners blousesjackets and pants In addition an effort was made to include a similar mix of fibers (ie wool silk rayon) for each garment type evaluated at the three cleaners The fiber mix is not identical for the three cleaners that were studied because the PPERC evaluators had to work with whatever garments
4-18
were ready to be pressed In all PPERC researchers timed the pressing of 153 garments at Cleaner by Nature and a combined 179 garments at the two area dry cleaners Appendix 4-D shows the fiber types at Cleaner by Nature and the two dry cleaners
Limits ofMethodology While attempts were made to control for quality of pressing and garment characteristics the evaluation was not able to control for possible differences in the skill level of the pressers Because the skill of the presser was not controlled because of the limited capacity to control for differences in garmentcharacteristics quality and productivity expectations and because of the decision to eliminate Cleaner C to control for business profitability the pressing time comparison was also examined in relation to other studies
RESULTS
The PPERC pressing time study shows that it took Cleaner by Nature pressers longer to press garments than it did the pressers at the two local dry cleaners (Cleaner A and B) On average blouses took 55 longer to press at Cleaner by Nature than at the local dry cleaners Pants took 82 longer to press at Cleaner by Nature and jackets took 74 longer to press35 Table 48 shows pressing time per garment type at Cleaner by Nature and the two dry cleaners The ratio of the number of dry cleaned garments that can be pressed per hour to Cleaner by Nature pressing time ranges from 13 to 21 depending on the dry cleaner and the garment type The smallest difference in pressing time appears to be for blouses36
Table 48 Pressing Speed by Garment Typei
Cleaner ~y Dry Cleaner Dry Cleaner A Dry Cleaner B Nature Averaee Pieces Pieces Ratio Pieces Ratio Pieces Ratio Hour Hour (DCWC Hour (DCWC) Hour (DCWC)
Blousesshirts 155 240 15 278 18 201 13
Pants 192 349 18 394 21 303 16
Jackets 157 273 17 249 16 297 19
Weighted Averaee 111
171 bull
middot 292 7
32_2
119 middot middot bullmiddotmiddot
769 middot middot
Imiddot
15 middot
i Pressing speed was calculated with a stop watch at Oeaner by Nature and two local dry cleaners ii Cleaner by Nature iii The average was weighted according to the distribution of garments cleaned at Cleaner by Nature 242 blousesshirts 252 pants IO I jackets
Cleaner by Nature pressers were using tensioning equipment to press jackets and pants 36 The International Fabricare Institute has conducted dry cleaning pressing time studies for particular garment types with somewhat similar results blouses 29 pieces per hour pants 30 to 50 pieces per hour and jackets 28 pieces per hour Personal Communication with Jane Rising Director Education Department International Fabricare Institute Silver Springs MD March 28 1997
4-19
Other studies that have analyzed pressing time differences were reviewed for comparative purposes given some of the constraints and assumptions of the PPERC pressing time study
Environment Canada The study that most effectively controlled for key confounding variables (including the productivity expectations of the cleaner the types of garments pressed and the skill of the presser) was one conducted by Environment Canada in 199537 Pressing speed for 13 pairs of identical garments was measured at two different mixed facilities for a total of 26 separate comparisons of pressing time At each plant the same presser worked on both the wet cleaned and dry cleaned garment in the pair38
Conventional dry cleaning pressing equipment was used at both cleaners to press wet cleaned and dry cleaned garments At one of the Environment Canada cleaners (a medium to large-scale production facility) it took 15 longer to press a garment when it was wet cleaned At the other plant (a relatively small facility) it took 25 longer to press a garment when wet cleaned 39 Appendix 4-E provides a summary of the results of the Environment Canada study
Utopia Cleaners The Tellus Institute for Resource and Environmental Strategies conducted a study of a Massachusetts dry cleaner who converted a facility to wet cleaning The cleaner sent 20 to 30 of the garments he received at the wet cleaner to his off-site PCE dry cleaner (and accepted 25 to 30 from that dry cleaner at his wet cleaning plant) An 18 increase in pressing time was noted after moving to this new arrangement from 20 pieces per hour in dry cleaning to 17 pieces per hour in wet cleaning40 The wet cleaning pressing was done with tensioning equipment while the dry cleaning pressing time was done with conventional presses
Langley Parisian Limited As part of the Environment Canada study Ken Adamson of Langley Parisian Cleaners recorded total labor costs before and after his plant switched from dry cleaning to wet cleaning The wet cleaning plant processed 61 of the garments it received and sent the remaining 39 to be dry cleaned off-site After the switch to wet cleaning Adamson noted an increase in total labor costs of 3 cents a piece from $107 to $11041
Because it was not possible to adequately control for the skill of the presser the quality and productivity demands of the cleaner the size and established nature of the
37 Environment Canada Final Report for the Green Clean Project (Samia Ontario October 1995) 52-55 38 Personal Communication with Al Ermarora Environment Canada September 3 1997 39 The Environment Canada study concluded that pressing time was actually 50 longer in wet cleaning than in dry cleaning However this finding was based on discussions with dry cleaner rather than on the empirical data from the iressing time study
US Environmental Protection Agency Office of Pollution Prevention and Toxics Design for Environment Program Making the Most of Your Cleaning Business Dry CleaningWet Cleaning Case Studies and Financial Analysis Worksheets DRAFr (March 1997) 6 41 Ken Adamson Exploring rhe Boundaries of Wet Cleaning Professional Textile Care in Canada--A Brief Overview ofa Wet Cleaning Field Study Presented at the International Symposium at Schloss Hohenstein Global Experiences and New Developments in Wet Cleaning Technology Hohenstein Institutes D-74357 Boennigheim (June 17 1996) 18
4-20
business and the differences in the composition of garments at the cleaners in the PPERC study and because prior studies may have more adequately accounted for these factors the relatively greater difference found in this study is likely an artifact of these confounding variables In fact previous studies that have examined relative labor time in wet cleaning and dry cleaning have shown a much smaller difference in pressing time or total labor time between the two processes However all the studies have shown that wet cleaning is associated with increased pressing time42
Pressing Wages as a Percentage ofRevenue While Cleaner by Natures relative pressing productivity is lower than two area dry cleaners the cost of pressing labor seems to be in line with industry expectations According to a study conducted by the Neighborhood Cleaners Association a dry cleaning trade group pressing wages should account for about I0 of the price the cleaner charges for cleaning a garment43 Cleaner by Natures accrued pressing wages in its fourth quarter ($6638) accounted for an estimated 11 of wet cleaning revenue ($60922) only one percentage point more than expected44
433 Cost Analysis Cleaner by Nature and Dry Cleaning
MEIBOD
Many factors affected Cleaner by Natures financial performance in its first year that were independent of the cleaning process used Consequently a comparative analysis was undertaken to focus on those costs that are expected to vary in wet cleaning and dry cleaning (ie process-dependent costs) and how those cost differences are likely to influence the relative profitability of wet cleaning and dry cleaning Cost information was first standardized on a per piece basis Information from the Cleaner by Nature case study (Section 41) was used as a basis for wet cleaning costs Dry cleaning costs were drawn from industry sources Costs unrelated to the process used (ie processshyindependent costs) are assumed to be the same for both processes The cost estimates were then used to calculate the difference in profitability between the two processes over a one year period based on Cleaner by Natures fourth quarter productivity when the plant was processing an average of 197 garments per day The assumptions and data
42 Jt should also be noted that difference in pressing time for dry cleaning and wet cleaning might be accentuated (or minimized) for some garment types For example finishing pleated skins tends to be especially time consuming in wet cleaning because the skins lose their pleats when they are immersed in water Knitted garments which can require very little pressing in both processes were also not included in the time study In addition dry cleaning pressing time can vary considerably Some very high end cleaners reportedly take much longer to finish each garment Likewise discount cleaners would be expected to spend less time on each piece 43 Neighborhood Cleaners Association Cost Comparison Chart-I 996 NCA estimates the percent cost of pressing wages according to the price of a suit The 10 is the estimate for a cleaner that charged $850 for a suit Cleaner by Nature charged $875 but this difference is likely canceled out by inflation Cleaner by Natures total revenue includes revenue received for wet cleaning and revenue for outside work Because of a computer failure wet cleaning revenue (independent from total revenue) was not available for the months of November and December Consequently wet cleaning revenue was estimated based on the assumption that it was 91 of total revenue which is the average percentage for the 9 months with available data
4-21
calculation methods for the comparable cost analysis are included in Appendix 4-F for process-dependent costs and Appendix 4-G for process-independent costs
The costs examined in this section include only the direct costs to the business owner and do not include the more intangible social costs of the cleaning process In the case of dry cleaning those costs could include costs to the public of air pollution pollution from improper hazardous waste disposal contamination of soil and groundwater due to improper handling of chemicals or from leaks and spills and from occupational exposures to those who work in dry cleaning facilities Although these can be important aspects of financial viability these costs are often not directly quantifiable and have not been fully incorporated into the operating cost comparison Likewise this analysis does not include unanticipated or catastrophic costs such as those associated with pollution liability These are analyzed in Section VI Finally the labor costs of complying with regulations (both the amount of labor required to fill out forms and the stresses associated with running a highly regulated business) were also not included
Since pressing labor is such an important aspect of operating cost and there was significant variation in pressing time even among the dry cleaners studied for this report pressing cost is presented as a range reflecting the results of two different studies the PPERC pressing time study and the Environment Canada study The PPERC pressing time study found that on average it took a dry cleaner 41 less time to press a garment than it took at Cleaner by Nature Since the PPERC study may not have adequately controlled for confounding variables that were controlled in the Environment Canada pressing time study (including the skill of the presser the specific garment pressed and the expectations of the cleaners) a figure of 17 faster pressing time in dry cleaning (derived from the Environment Canada study) was also used as a basis for estimating pressing labor costs Both the PPERC and Environment Canada estimates were then used to describe the range in calculating overall operating costs45
45 See Appendix 4-F (Labor - Pressing) for method of convening percent slower pressing time in wet cleaning to percent faster pressing time in dry cleaning
4-22
RESULTS
Overall Profitability ofWet Cleaning and Dry Cleaning
The model plant analysis found that Cleaner by Nature would generate $1 I 87 4 in profit from wet cleaning per year based on the productivity of the wet cleaner in the fourth quarter of its first year of operation (Table 49) Cleaner by Nature was less profitable than a dry cleaner pressing 41 faster (based on the PPERC study) but was more profitable than a dry cleaner pressing 17 faster (based on the Environment Canada study) A dry cleaner pressing 17 faster would generate $9965 in profit -- $1909 less than the wet cleaner A model dry cleaner pressing 4 I faster would generate $17645 in profit -- $5771 more than Cleaner by Nature On a per garment basis Cleaner by Nature spent $481 to wet clean a garment ($23187448 108) while a dry cleaner pressing 17 quicker would spend $486 per garment -- 5 cents more than the wet cleaner Similarly a dry cleaner pressing 41 quicker than a wet cleaner would spend $469 per garment --12 cents less than Cleaner by Nature The profit margin of the wet cleaner came to 49 compared to 41 and 7 2 for the tw9 dry cleaners
The cost comparison and related profit analysis change further when the costs associated with dry cleaner efforts to reduce liability exposure are factored in Those costs which are discussed more fully in Section VI include pollution liability insurance (at a cost of 9 cents per garment) and mandated fees in state legislation (at a cost ranging from about three to twelve cents a garment) When those costs are added to the analysis wet cleaning would be more profitable than dry cleaning when either the Environment Canada or the PPERC numbers are used as the basis for comparison
4-23
Table 49 Income Statement Comparison Cleaner by Nature and Dry Cleaning
EXPENSES
Variable Expenses
Claims
Labor Cleaner Pressers Counter Assembly Driver Mana ement
Supplies Detergents
PCE Clothes-handling
S otting Chemicals Filter
Outside work Haz Waste Disposal Utilities Electricity
Natural Gas
Water amp Sewer
Vehicle use Fixed Expenses
Advertising amp marketing Equipment Expense Equipment Maintenance Cleaning System
Other
Rent Insurance Business middot
Workers compensation Vehicle
Regulatory Expenses amp Fee
Compliance Regulatory Compliance Vehicle loan Miscellaneous
PROFIT PERCENT PROFIT
WET CLEANED PIECES
Cleaner by Nature
$1118
$27524 $29009 $61482
$4715
NA $9573 $1636
NA $6591
$0 $2886 $3897 $1010 $3560
$4826 $6514
$379 $2150
$43057 $1253 $5632 $1684
NA NA
$11874 49
48108
Dry Cleaner Dry Cleaner Model A Model B
$828 $828
$27524 $27524 $24165 $17058 $61482 $61482
$2021 $2021
$654 $654 $9573 $9573 $1636 $1636
$577 $577 $6591 $6591 $1010 $1010 $3368 $3368 $3319 $3319
$577 $577 $3560 $3560
$4826 $4826 $8326 $8326 $2150 $2150 $2150 $2150
$43057 $43057 $1267 $1267 $5324 $5088 $1684 $1684 $1106 $1106 $3622 $3622 $1443 $1443
$11883 $233723
$9965 $17645 41 72
48108 48108
1 See Appendix 4-F for a line by line explanation of process-dependent costs and Appendix 4-G for process-independent costs u Toe calculation of pressing time in this column relies on an Environment Canada comparative study of pressing time that found that it was 17 faster to press a dry cleaned garment than the identical wet cleaned gannent lliThe calculation of pressing time in this column relies on the PPERC pressing time study that found that at two area dry cleaners it took on average 41 less time to press a dry cleaned garment than to press a wet cleaned garment at Cleaner by Nature
4-24
Process-Dependent Cost Comparison
The types of expenses that were shown to be different in wet cleaning than dry cleaning (ie process-dependent costs) are displayed in Figure 42 The costs that are more expensive in wet cleaning are grouped separately from those that are more expensive in dry cleaning
Figure 42 Process-Dependent Expenses as Percentage of Revenue
= =
c ~ = ~ ~
~ ~ = Q
Ill
12 D Cleaner by N nt ure
Dry Cleaner Model A
10 ID Dry Cleaner Model B
8
6
4
2
0
~
~ = e= 0 a = middot= middota i 8 u ul 6l ii C -a E
Cl 8
j J ii middots middot= $
i Pressing cost for Dry Cleaner Model A is based on assumptions from the Environment Canada study while pressing costs for Dry Cleaner Model Bare based on the PPERC time study The only difference between Model A and Model Bis the difference in labor cost Because increased labor cost means increased payroll workers compensation insurance also changes For the categories where the two dry cleaner estimates are the same only the Model A dry cleaner figure was used
4-25
Expenses Greater in Wet Cleaning
Pressing Labor One of the biggest concerns regarding the economic viability of wet cleaning is the greater amount of time it talces to press a garment Pressing labor costs accounted for 119 of revenues at Cleaner by Nature compared to either 99 or 70 for dry cleaning depending on the pressing time evaluation that is used (See Section 422)
Insurance As a result of the greater labor requirements of wet cleaning due to increased pressing workers compensation insurance is more costly for wet cleaning than dry cleaning This increased expense drives up the overall cost of insurance only slightly -35 for wet cleaning compared to 34 for dry cleaning
Utility Costs Overall utility costs for wet cleaning were slightly greater than for dry cleaning - 32 of revenues vs 30 While Cleaner by Natures electricity use is less than that of the model dry cleaner Cleaner by Nature uses more natural gas and water malcing utility expenses more costly for wet cleaning 46
Detergent Costs The wet cleaning agents chosen by Cleaner by Nature accounted for 2 of revenue while the model dry cleaner is expected to spend less than 1 of revenue on detergent47 As with other costs these can vary according to the choice of the business Since the end of the first year of operation Cleaner by Nature has been using a wet cleaning detergent that is about 30 less expensive than the Aquatex detergent that was used during the first year demonstration period
Claims The cost of paying for damaged or lost garments was higher at Cleaner by Nature compared to dry cleaning - 05 of revenue vs 03 of revenue While the claims data for Cleaner by Nature was talcen late in its first year of operation allowing for a learning period data used to calculate the claims rate in dry cleaning was based on a survey of dry cleaners most of whom are likely to have been in business substantially longer than Cleaner by Nature Claims rates for start-up dry cleaners may be higher than the rate for dry cleaners as a whole
46 The Utopia Cleaners demonstration site in Massachusetts had higher utility costs before switching its plant from dry cleaning to wet cleaning Part of the high costs were due to the fact that the shop did not have a water tower which is used to recycle cooling water for the solvent reclamation process US Environmental Protection Agency Office of Pollution Prevention and Toxics Making the Most of Your Cleaning Business Dry CleaningWet Cleaning Case Studies and Financial Analysis Worksheets (Draft) March 1997 9-11 47 The Cleaner by Nature detergent finishing and sizing costs are based on pump tests conducted at Cleaner by Nature which was using Aquatex cleaning agents while the dry cleaning costs have been identified by distributors
4-26
Expenses Greater in Dry Cleaning
PCE While wet cleaning eliminates the need to use PCE the actual cost of PCE to a dry cleaner is relatively small -- 03 of revenue
Equipment Expense Cleaner by Nature is expected to spend 27 of revenue on all plant equipment while a model dry cleaner would expect to spend 34 of revenue on plant equipment This difference is due to lower initial costs as well as to a longer life expectancy of the wet clean machine compared to the dry clean machine (See Section 421)
Machine Maintenance Cleaner by Nature is expected to spend a marginal cost for maintaining the wet clean machine over its fifteen year life (02 of revenue) while maintaining the dry clean machine over a ten year useful life is expected to cost 09 of revenue
Government Regulation While Cleaner by Nature is not expected to spend any money on government regulation and compliance a dry cleaner is likely to spend 246 of revenues in complying with regulations These costs include hazardous waste disposal costs (041 of revenues) filter purchase expenses (021 of revenue) regulatory fees (035 of revenue) and regulatory compliance (149 of revenue)
Process-Independent Costs
More than half of the costs attributed to the model facilities are not related to the process used including rent the cost of outside work and counter and assembly labor (Table 47) Rent a significant expense in this case is assumed to be $39600 per year for a 1500 square foot facility (about 16 of the cost of wet cleaning a garment) Different assumptions about process-independent costs would affect the profitability of the model plants as well as the percentage cost difference between the two processes
For the purposes of this analysis advertising costs are assumed to be the same or process-independent Advertising is really more dependent on business strategy than on the process although it should be noted that wet cleaning does offer some unique marketing opportunities as well as challenges as a non-toxic aqueous-based alternative to PCE dry cleaning
4-27
44 Summary Analysis of Financial Assessment
Case Study
Start-up Cost Analysis The cost of starting up Cleaner by Nature included $96523 in one-time costs and $48048 in additional operating capital paid out during the first year of operation before a positive cash balance could be sustained The start-up costs paid at Cleaner by Nature would have been lower if the wet cleaner was set up as a typical comer cleaner with the plant and drop-shop in the same location These start-up expenses are in line with what a dry cleaner is expected to pay One-time start-up costs for a dry cleaner have been estimated between $110770 and $160580 and operating capital between $40000 and $6500048
ProfitLoss Analysis Cleaner by Natures Income Statement revealed a rapid decline in losses from the first quarter of operation (over $30000) to the third quarter (under $9000) By the fourth quarter Cleaner by Nature had turned a profit of 3 -- revenues generated exceeded expenses accrued in each of the final three months of the wet cleaners first year of operation If Cleaner by Nature had been a typical owner-operated cleaner in a single facility it would have made a profit of 10 in its final quarter of the first year of operation Projecting Cleaner by Natures revenues and expenses into the second year based on increases in revenue that have been identified along with an assumption of increased efficiencies in labor and capital equipment use gives a profit estimated at more than 17 for the year
Pressing Productivity Analysis Because wet cleaning may limit the efficiency of pressing labor an analysis was undertaken of the rate at which garments were pressed at Cleaner by Nature over the first year of operation The efficiency of pressing productivity at the wet cleaner increased in the fourth quarter after new tensioning equipment was purchased
Comparative Analysis
Equipment Cost Comparison The purchase price of plant equipment used at Cleaner by Nature ($70715) was 9 lower than the cost of equipment for a comparably sized dry cleaner While the cost of the cleaning system was less in wet cleaning there were higher costs for its pressing equipment The actual yearly expense of operating wet cleaning equipment was 31 lower for the wet clean equipment This is due to the fact that the wet clean machine is
48 Business Start-Up Guide Dry Cleaning Entrepreneur Business Guide No I 037 Entrepreneur Group 1993 p 1037-145
4-28
expected to last longer than dry clean machines (15 years vs 10 years) and because the cost of maintaining the cleaning equipment over its useful life is substantially lower in wet cleaning
Pressing Time Comparison Pressers at Cleaner by Nature took 70 longer to press a garment that had been wet cleaned than pressers at two nearby dry clean shops Because this study compared pressing time at different businesses it was not able to control for one key factor (skill of the presser) and only partially controlled for the garment characteristics quality and productivity demands of the cleaner Other estimates of pressing time difference which more adequately control for some these variables report a smaller difference A study by Environment Canada which was better able to control for these variables reported that at one cleaner a presser took 15 longer to press a garment that had been wet cleaned than the identical garment that had been dry cleaned At anther cleaner the presser took 25 longer pressing the identical garments Overall pressing labor time was estimated to be 20 and 70 greater in wet cleaning than dry cleaning
Overall Cost Comparison Estimates of greater equipment expenses from dry cleaning and greater pressing labor cost for wet cleaning were used as a basis for estimating how the overall cost of these two cleaning techniques compare and how these costs influence the profitability of wet cleaning relative to dry cleaning Overall wet cleaning was estimated to be more profitable than dry cleaning if the dry cleaner pressed only 17 faster and less profitable than dry cleaning if the dry cleaner pressed 41 faster A line by line analysis of expenses revealed that costs for pressing labor insurance utilities detergent and claims were greater in wet cleaning while expenses for machine purchase machine maintenance and government regulation were greater in dry cleaning Pollution liability insurance currently an option for dry cleaners is an additional expense that costs an average of 9 cents per garment Legislation in several states designed to reduce potential liability for dry cleaners can cost a dry cleaner as little as 3 cents per garment (in Minnesota) to a high of more than 12 cents a garment (in Florida and Kansas)49 A more detailed analysis of liability factors is discussed in Section VI
In sum the case study demonstrated that professional wet cleaning can be a financially viable alternative to dry cleaning The wet cleaner was able to meet its expenses by the end of the first year and make a profit by the fourth quarter of the first year The comparative analysis revealed that while a wet cleaner is likely to pay more than a dry cleaner in labor costs for pressing the dry cleaner is likely to incur more expenses in purchasing and maintaining the cleaning machine and more in government regulation Additionally the emergence of voluntary or mandatory pollution liability insurance has the potential of making wet cleaning a more economically viable alternative to PCB-based dry cleaning
bullbull These costs include surcharges on CE annual fees and gross receipts tax The per piece costs were calculated under the assumption that the model dry cleaner was processing 48 I 08 pieces per year with annual gross receipts of $259904 and consuming 000206 gallons of PCE per garment
4-29
Section 5
Environmental Assessment of Wet Cleaning
5 Environmental Assessment of Wet Cleaning
51 Overview
The pollution prevention benefit of substituting wet cleaning for dry cleaning is that it eliminates the use of PCE in professional cleaning Wet cleaning represents reduced toxic air emissions and occupational exposures reduced potential for water and soil contamination (and thus reduced liabilities) and reduced hazardous waste generation Changes in PCE control technologies available to dry cleaners need to be factored into any environmental assessment given their ability to reduce though not eliminate PCBshyrelated impacts On the other hand concerns have been raised about potential environmental impacts from the wet cleaning process such as increased volume of water use which may represent an environmental burden in a region such as Southern California which is dependent on imported sources of water
In order to determine whether wet cleaning is a viable pollution prevention alternative to dry cleaning the analysis focused on three key environmental inputs and their pollution outputs 1) water 2) energy and 3) chemical For each component the assessment includes a plant level case study of Cleaner by Nature a plant level analysis comparing Cleaner by Nature and dry cleaning and a regional analysis that identifies the environmental impacts from the comparative assessment situated at a regional scale Each of the three sections (water energy and chemical) are organized into three parts the Cleaner by Nature case study the comparison to dry cleaning and the regional analysis
bull The analysis of water use which was based on metering and machine specifications indicated that wet cleaning used 77 more water than dry cleaning That translated into a regional water demand of 631 acre feet equivalent to a population increase of 3036 people if every dry clean facility in the Southern California region were converted to professional dry cleaning This scenario of increased regional use did not generate concern among regional water planners
bull The analysis of water discharges which evaluated the water quality of the effluent from the wet cleaning machines did not identify any significant environmental impacts In Los Angeles it is illegal for dry cleaners to discharge PCB-contaminated wastewater though contamination from spills or other inadvertent discharges may still occur
5-l
Energy
bull The analysis of energy use based on metering and machine specifications indicated that energy use was comparable for both processes Wet cleaning uses more natural gas than dry cleaning but also uses less electricity Since natural gas generation produces fewer pollutants than electricity wet cleanings lower electricity use offsets its greater use of natural gas
Chemical
bull Chemical inputs and outputs measured through agency data sources machine specifications material safety data sheets and in plant surveys indicated no significant chemical uses and outputs for wet cleaning Even when fully complying with current mandated requirements dry cleaning still generates substantial amounts of PCB emissions and hazardous waste
52 Methods for the Environmental Assessment
521 Framework for the Plant Level Analysis
Two equipment categories were used within each of the components cleaning machine use (in the case of Cleaner by Nature the 3050 pound Aquatex washer and 50 pound natural gas dryer) and non-cleaning machine use which covers all other equipment used either at Cleaner by Nature or at an equivalent dry cleaning plant This plant level analysis is based on identifying at the plant level what differences there would be if dry cleaning equipment were used instead of wet cleaning equipment at the Cleaner by Nature demonstration facility for the same volume of business Thus the plant level analysis provides specific real world data comparing a start-up commercial wet clean facility with a similarly-sized dry cleaner
Information regarding Cleaner by Nature was gathered through metering and record-keeping at the plant To establish equivalent comparative data for dry cleaning three different types of dry cleaning equipment were selected These configurations of dry cleaning equipment described below represent the range of machines most likely to be used in this region in the next decade The data from these configurations in turn are derived from equipment specifications (that is estimates provided by the manufacturer) as well as previous studies on wet cleaning and dry cleaning that also include some primary data In addition to their specialized cleaning equipment both wet clean shops and dry clean shops utilize domestic washers and dryers for certain garments Environmental inputs and outputs from the use of these machines also need to be accounted for since their uses may vary in wet cleaning and dry cleaning The three dry cleaning configurations used for the plant level analysis are
5-2
Dry Cleaning Configuration 1 Non-converted closed-loop machine with a refrigerated condenser1 as a primary pollution control device and a carbon absorber2 as a secondary device In the Southern California region every current start-up dry cleaner and every dry cleaner that has not yet complied with South Coast Air Quality Management District (SCAQMD) Rule 1421 3 must choose this configuration in order to operate a PCE machine
Dry Cleaning Configuration 2 Non-converted closed-loop machine that uses only a primary control device (a refrigerated condenser) A total of 63 of all machines in the SCAQMDs boundaries had this configuration in 1994 according to a SCAQMD inventory Since the regulations do not require existing machines with primary controls to change this configuration should still be dominant in the near future
Dry Cleaning Configuration 3 Converted closed-loop machine with a primary pollution control device This is the least stringent configuration of PCE control technology allowable after 1998 in California Comparative data about this machine provide a less conservative estimate of outputs and account for much of the dry cleaning equipment population not represented by the first two configurations
Since environmental inputs and outputs are generated at each stage of the cleaning process quantifying the total amount of each input and output generated in wet cleaning and dry cleaning requires identifying the places in the cleaning process where the resource is used or environmental output generated estimating the level of input or output at each source and summing across the different sources In addition for dry cleaning the amount of each input and output generated depends on the particular equipment configuration as described above The sources of information for the plant level dry cleaning assessment included a survey of three dry cleaners to identify certain input and output information a survey of dry clean equipment manufacturers to establish information based on manufacturer specifications and the 1992 survey of dry cleaners by the California Air Resources l3oard4
522 Framework for the Regional Analysis
While the plant level analysis assists in understanding the impacts of the demonstration site it is also valuable to place that information in a broader context Consequently the plant level comparison was used to generalize to the potential regional impacts if all the dry cleaners in the region were to switch to wet cleaning The region is
1 A refrigerated condenser reclaims PCE vapors created during the drying process turning them back into a liquid 2A carbon adsorber captures PCE not reclaimed by the refrigerated condenser by absorbing PCE to the surface of a bed of activated carbon 3Rule 1421 consolidates the federal state and local regulations affecting dry cleaners in the South Coast Air Quality Management District The three dry cleaners surveyed for the environmental assessment were the same three cleaners used for the Repeat Clean test described in Section Ill The CARB survey database of more than 2000 California dry cleaners was provided to PPERC on January 13 1997
5-3
defined as the SCAQMD jurisdiction which includes most of Los Angeles Orange Riverside and San Bernardino counties This area was selected for analysis due primarily to Cleaner by Natures location as well as to the availability of comparative data from regional and state agencies and the regions concern with water and air quality issues The regional analysis of wet cleanings impacts was drawn from Cleaner by Nature data while two types of sources were used to estimate region-wide dry cleaning impacts region-wide data from regional or state agencies (such as the SCAQMD) and plant-level data (including those based on the three dry cleaning configurations) scaled up to the regional level
In order to project data from the plant-level analysis to the regional level and to use consistent geographic areas the 2457 dry cleaning machines in use in the SCAQMD air basin areas were then correlated with the population data provided by the California Department of Finance Demographic Research Unit for the base year of 19945
Appendix 5-A provides a full explanation of this methodology
As there is variation in resource use and pollution outputs among cleaning facilities there are limitations to generalizing from the environmental performance of one wet cleaner Consequently this evaluation is compared to other case studies that have been conducted Further the comparison of the two processes is based on conservative assumptions which may tend to favor dry cleaning Thus the findings represent the more severe negative impacts resulting from a complete shift from dry cleaning to wet cleaning scaling up from Cleaner by Natures first year of operations Finally some environmental impacts are difficult to quantify such as those associated with PCE spills These are discussed more fully in Section VI
5 The number of dry cleaner in the district was derived from a 1994 SCAQMD survey
5-4
53 Water Inputs and Outputs
531 Water Use Concerns have been raised that since the professional wet cleaning process
substitutes water for chemicals wet cleaning could place a particular burden on regions such as Southern California that are dependent on imported water This section examines the volume and nature of water inputs generated by wet cleaning and dry cleaning systems while also modeling water use for other cleaning related equipment
5311 Plant Level Analysis
Cleaner by Natures Water Use
Use in Wet Cleaning At the Cleaner by Nature plant water is used in the Aquatex washer the pressing equipment the domestic washer the spotting board boiler blowdown and the water conditioner6
METHOD
In order to quantify w2ter use by the Aquatex washer meters were installed and read periodically for the period from June 1996 through January 1997 Garment counts were provided by Cleaner by Natures computer cash register There were a total of eight meter readings which occurred approximately every month To develop a more detailed analysis of water use a more intensive two-day evaluation was undertaken of water use by the Aquatex washer including an examination of water use per load Appendix 5-B provides more detailed information on the two-day evaluation In addition water use was estimated for other related uses including the domestic washer boiler and water conditioner Appendix 5-C details the methods for calculating their use
RESULTS
During the period of the eight meter readings of the Aquatex machine an average of 323 gallons of water was used for every 100 garments wet cleaned The Aquatex washer accounted for more than three quarters of all water use at the Cleaner by Nature plant Table 51 provides a breakdown of water use by source of use
bull Water uses which are independent of the professional cleaning process such as sinks and toilets are not included
5-5
Table 51 Water Use at Cleaner by Nature
Eauioment Gallons100 Garments
Aquatex Washer 323
Domestic Washer 33
Boiler (blow-down presses spotting board) 56
Water Conditioner 11
Total 423
Appendix 5-C deta1ls methods for calculabng use
Operational changes at the plant as well as greater efficiencies resulting from the growth in the business may have influenced the level of water use which varied considerably during the monitoring period In general water use per 100 garments increased from June (when the metering began) through November Per garment water use then declined in December and January This trend in use appears to have been influenced by a series of factors During the month of September the washer was reprogrammed to improve performance which subsequently resulted in an increase in the volume of water use In November when water use peaked Cleaner by Nature began for the first time to process wedding gowns which require substantially more water for cleaning than other garments Cleaner by Nature processed 96 wedding gowns in November almost three times the number of gowns processed in January The high volume of use in October might also be a reflection of Cleaner by Nature receiving more velvets during that period which also require more water
The subsequent drop in water use in December and January may also indicate greater efficiencies compared to October and November (after the reprogramming occurred) A trend toward reduced water use continued after the demonstration period (Average water use per l 00 garments from February 1 to June 24 1997 was slightly below the demonstration period average for the Aquatex washer -- 309 gallons compared to 323 gallons -- and significantly lower than the figures for the peak use subsequent to the reprogramming in October and November 1996)7
The average daily water use by the Aquatex washer during the metering period was 546 gallons which corresponded to an average of 169 garments wet cleaned per day during that same period The increase in daily water use broadly coincides with the growth of the business as well with the December and January periods reflecting greater efficiencies with the new programming for the machine Table 52 shows water use per day and per 100 garments for the eight metering periods
7 The 323 gallons per hundred garments corresponds with the Chicago CNT evaluation of a 50-lb Aqua Clean machine which averaged 331 gallons per hundred garments The Environment Canada analysis of their 50-lb IPSO (HFC 234) wet clean machine averaged considerably less water use (163 gallons per hundred garments) However neither CNT nor Environment Canada continuously metered the machine itself The lower water use for Environment Canada might also reflect a greater amount of steam cleaning which can reduce cleaning machine uses
5-6
Table 52 Water Use by the Aquatex Washer at Cleaner by Nature (696-197)
619-30 72-31 81-93 94-30 101-31 111-123 124-11 12-131 Total
GalAvg Day 267 336 407 549 667 779 624 577 546
Gal100 garments 196 259 253 311 403 427 309 313 323
Comparison of Wet Cleaning Water Use to Dry Cleaning
Use in Dry Cleaning Although the term dry cleaning suggests an absence of water in the cleaning process there are specific ways in which water can be identified as an input in dry cleaning Small amounts of water can be added to the dry cleaning solvent to facilitate removal of water-based stains Control equipment may also require water use Refrigerated condensers use water in cooling the refrigerant In Southern California that water typically flows to a cooling tower on the roof where some evaporates and the rest recirculates A minority of carbon adsorbers are steam stripped in order to reclaim the PCE that has been adsorbed by the carbon bed The small secondary carbon adsorbers addressed in our comparison do not require water in stripping Some distillation systems are equipped with steam injection As with wet cleaning the boiler the domestic washer and the water conditioner consume water Non-cleaning machine use varies according to the different domestic washing practices and pressing times associated with each process Process independent water uses like sinks and toilets are not included in the analysis
MEmOD
The water use data for the dry cleaning machine is based on manufacturer specifications combined with information that was provided by the three local dry cleaners There is little reason to expect water use differences between the three configurations since they each use a refrigerated condenser and the secondary carbon adsorber doesnt require steam stripping Therefore all configurations were assigned equal values8 It was also assumed that all three dry cleaning configurations would have a cooling tower based on information provided by equipment distributors and local dry cleaners The cooling tower uses evaporation to cool hot water from the still and the refrigerated condenser for water reuse Generally the Los Angeles area is not hot and humid enough to merit a refrigerated chiller which performs a similar function to a cooling tower
While this may generally hold true one equipment distributor points out that certain older machines dont have a valve regulator to stop water flow when the refrigerator condenser stops operating These machines would send more water to their cooling tower which would result in increased evaporative losses Since there was no available sampling strategy to quantify the extent that this occurs in converted machines an assumption was made that there would be equal water use for each configuration based on what might be a more efficient rather than less efficient scenario (Personal communication with Greg Leiram April 22 1997)
5-7
areas of the plant as well The demands on the boiler would be expected to be slightly less in dry cleaning because of decreased pressing requirements The more conservative assumption (based on the PPERC pressing time study) that pressing time takes 17 times as long in wet cleaning than in dry cleaning was used to calculate pressing water uses in the dry cleaning scenario There would also be less of a demand on the water conditioner in dry cleaning because the process uses less water overall However dry cleaning is likely to have greater domestic washing requirements Appendix 5-D elaborates the methods for calculating water use in the model dry cleaning plant
RESULTS
The greatest differential in water use is associated with the cleaning machines while non-cleaning machine uses are greater for dry cleaning primarily due to greater use of the domestic washer According to these estimates Cleaner by Nature water use is 77 greater than the water use for dry cleaning at the plant level9 Table 53 shows the differences in non-cleaning machine use in dry cleaning while Table 54 shows the difference in overall water use at the plant level
Table 53 Non-Cleaning Machine Water Use Differences
ProcessEouiument Wet Cleanine Use Drv Cleanine Use
Change in gaVlOO garments resulting from switch to Wet Cleanine
Domestic Washinl 11 Joadsdav =551md 36 loadsday =180 ltgtnd - 740 Pressin2 30 2aVlOO ear WC 17 + 124 Water Conditioner 11 2aVl0()Jar 62 aVlOO Jlar +48 Total Non-Machine Difference - 568
Table 54 Water Use in Gallons100 Garments Wet Cleaning and Dry Cleaning
Wet Cleanin2 Use Drv Cleanine Use Cleaning Machine 323 81 Non-Cleanin_g machine 100 157 Plant Total 423 238
bull These figures are higher than the Environment Canada estimate of 22 greater water use for wet cleaning with the Canadian estimates influenced in part by the lack of recycling of the refrigerated condenser water using a cooling tower
5-8
5312 Regional Analysis
METHOD
The regional water use data was derived from 1994 Metropolitan Water District (MWD) data on overa11 regional water use Since the MWD jurisdiction does not fully coincide with that of the SCAQMD which was used for other parts of this assessment county water use values were adjusted upward using the population data discussed in Appendix 5-A
The regional differences shown may overestimate wet cleaning water use for two reasons The estimates do not reflect the potential greater efficiency found at the higher levels of business that have been occurring at Cleaner by Nature nor do they fully account for the adjustments to the reprogramming of the wet clean machine Additionally the estimates do not reflect any possible use of water recycling systems for wet cleaning since Cleaner by Nature did not pursue water recycling when equipment was first purchased given the lack of available recycling units for the Aquatex system at the time
RESULTS
Based on findings from the plant level analysis described above a complete shift of all dry cleaners to wet cleaning amounts to an increase of 0021 of overall regional water uses Table 55 shows the changes of water use by the four counties that make up the region
Table SS Regional Water Uses (in Million Gallons) Comparing Wet Cleaning to Dry Cleaning (Assuming All Dry Cleaners Converted to Wet Cleaning)
SCAQMD Counties DC Use
Usew100 Conversion
to WC Total Urban
Use Increase
w100 WC Los Angeles 170 302 548370 0024 Orange 48 85 188654 0020 Riverside 21 37 100355 0016 San Bernardino 25 44 127073 0015 Total 264 469 964452 0Q21
Put in quantitative terms this increase in use amounts to 205 million gallons of water ( or 631 acre feet) According to regional water planners such an increase would not affect future water supply requirements in the service area of the Metropolitan Water District the regional water supplier of imported water in Southern California 10 By way of comparison an increase of 631 acre feet is the equivalent of a population increase of 3036 people in a region where MWD imported water serves 16 million people 11
10 Personal communication with Andy Sandcavage MWD July 14 1997 11 The population increase figure is based on the MWD future planning estimates of per capita water use of 185 gallons
5-9
Water supply planners also point to a long standing regional concern in relation to the loss of supply associated with groundwater wells no longer in use due to PCE-related contamination or wells that might be forced to shut down if the level of contamination increased 12 PCE control technology and regulations have been developed to reduce risk of water contamination However spills leakage and incidents of non-compliance can still occur According to MWD water supply planners the loss of one small production well -- that is the amount of water available for use on an annual basis -- would itself be equivalent to or greater than the increase in water use represented by a 100 conversion to wet cleaning MWD officials have identified concerns regarding potential PCE groundwater contamination as greater than their concerns associated with increased water use from a scenario based on a shift of all dry cleaners in this region converting to wet cleaning 13
532 Water Discharge
The focus of the water discharge analysis is a water quality evaluation of the effluent from the Aquatex washer at Cleaner by Nature Dry cleaners have raised concerns that water discharges in wet cleaning might contain contaminants due to either the spotting chemicals used in the wet clean process andor from PCE residue found in garments that had been previously dry cleaned For dry cleaning water discharges have historically been a source of concern in relation to possible groundwater contamination Previous studies including an evaluation of PCE-contaminated wells in Fresno California identified dry cleaning as a source of well contamination This was traced to leaking sewer pipes that were located near dry cleaning facilities and which were receiving water discharge effluents from those same plants However current regulations in many areas including Southern California now preclude any direct water discharges from dry cleaners into the sewer system
5321 Plant Level Analysis
METHOD
To evaluate the quality of the effluent discharged at Cleaner by Nature a series of wastewater samples from the Aquatex washer were collected and analyzed The sampling and analysis was undertaken in conjunction with the Los Angeles Bureau of Sanitation (BoS) the agency responsible for evaluating water discharges in the city of Los Angeles where the Cleaner by Nature plant is located
fer day Personal communication with Warren Teitz MWD June 30 1997 2 PCE-contamination has been detected in 158 wells in the MWD service area The potential loss based on the annual
yield of those wells (that is water available for use over a years period of time) is 94000 acre feet (personal communication with Lisa Anderson MWD June 11 1997) Personal communication with Lisa Anderson MWD June 11 1997
5-10
Sampling procedures included the following
Sampling was undertaken at the wet cleaning machine drain rather than at the primary drain for the plant This sampling approach which focused on the wet cleaning machine enabled Bureau of Sanitation personnel to have easy access to the effluent Other plant equipment that uses water such as boilers domestic washers sinks etc is common to both wet and dry cleaners and was not included in this sampling This was done to eliminate unnecessary sources of variation and focus on the output of the wet cleaning machine itself The machines effluent went directly into a drain behind it allowing for immediate and easy access of sampling personnel and equipment
Load-specific samples In consultation with BoS personnel samples for particular loads were used rather than utilizing an all-day sampling and averaging technique According to Aquatexs own study14 the wet cleaning machine has well-defined discharge events Each discharge was sampled individually A composite sample based on the volume of each discharge was also created An automated periodic sampling technique while potentially capturing samples from a greater number of loads may not provide the valuable weighting representation captured by the load-specific technique
Selection ofload type Once the decision was made to sample specific loads and load segments specific load types to sample from Cleaner by Natures Aquatex machine had to be selected Nearly all the programs use the regular Aquatex detergent and finish while a few use the Aquatex leather detergent and finish During the testing period leather loads were run initially only 1-2 times per week (approximately 3 of all loads) Thus sampling was focused solely on loads using regular detergent and finish Both a two-day survey and the cleaners own evaluation identified Program 8 delicate half-load as a frequently used program 15 Within Program 8 four discharge events were identified two after washing (the first W_$h cycle adds detergent while the second wash cycle rinses detergent out) one after finish and a smaller one during extraction (essentially an extension of the finish discharge but subject to greater force)
Spotting chemicals The impact of spotting chemicals was evaluated by sorting two loads into clothing with and without spotting chemical treatment There is little preshyspotting work done by the Cleaner by Nature cleaner When pre-spotting does occur the cleaner uses only a very small amount of chemicals relying on the wet cleaning machine to do most of the spotting work If spots remain after cleaning then the cleaner will do post-spotting with a wider variety of chemicals The loads therefore represent hypothetical maximum and minimum levels of spotting chemicals in the clothing The cleaner predominantly pre-spots with a mixture of water Streetex Wetspo and Aquatex detergent but does not pre-spot with Pyratex the most toxic spotting agent used at the
14 Iowa Techniques Study of Aquatex Machine Effluent Performed by the Hygienic Laboratory at the University of Iowa 1996 15 Program 8 was also used by Aquatex for their own analysis of wastewater effluent thus providing a comparative data source for the PPERC evaluation
5-11
plant The sorted test load for this evaluation used a wide variety of spotting agents one garment each with Wetspo LPS Scram Blood Ammonia and a few garments with the prespotting mixture
Volatile organics Previous studies have shown volatile and semi-volatile organics to be the primary concern for an environmental assessment of wet cleaning effluent Sampling and analysis therefore placed less focus on heavy metals physical properties pesticides and other contaminants A summary of the sampling procedures used to characterize the quality of the discharges and the areas in which analysis was undertaken to establish overall results is found in Appendix 5-E
Results In summary all of the analyzed samples met the BoS s wastewater effluent standards No PCE TCE dioxin or significant amounts of heavy metals were found The only volatile or semi-volatile organics found were acetone and three phthalates all at levels unlikely to have a significant environmental impact The BoS currently enforces the same standards for septic systems as for sewer effluent and does not allow direct discharge to fresh waterways so these findings are applicable to most areas in southern California These findings correspond to the Chicago CNT wastewater analysis
The following sub-sections discuss the results in relation to the different areas of potential environmental concern These include pH levels heavy metals biochemical oxygen demand suspended solids oil and grease and volatile and semi-volatile organic compounds
pH Results The pH measures the acidity or alkalinity of a solution Neutral solutions have a
pH of 7 which reaches higher levels with increasing alkalinity and declines with greater acidity The pH readings were all within the BoSs acceptable range of 55 to 11 The pH for the load without spotting chemicals was slightly acidic while the pH for the spotting chemical load was slightly alkaline during the detergent cycles slightly acidic during the finish cycles and neutral overall Appendix 5-E provides the pH results
Heavy Metals Results Heavy metals in wastewater can be toxic to aquatic life especially if they are
bioaccumulative When metals become highly concentrated in sludge they can also create a hazardous waste The heavy metals found in the Cleaner by Nature effluent were well below BoS limits (30 to 3000 times less) and frequently below detection limits Additionally the detected metals of copper and zinc may be caused in part by background levels found in the incoming water The BoS provided data on background concentrations of certain contaminants in their system The agency samples at points where commercial and residential concentrations can be isolated in order to develop standards for their industrial users such as dry cleaners For this analysis the background copper levels were almost equal to those found in the Cleaner by Nature effluent while the background zinc levels were equal to about 20 of the levels found in the Cleaner by Nature effluent Results of the heavy metals sampling are found in Appendix 5-E
5-12
Biochemical Oxygen Demand Suspended Solids and Oil amp Grease Biochemical oxygen demand (BOD) suspended solids (SS) and oil and grease
(OampG) all describe physical properties of wastewater BOD is the rate at which organisms use the oxygen in water while stabilizing decomposable matter under aerobic conditions SS and OampG can create visible problems and contribute to oxygen-consuming wastes in a water body Appendix 5-E shows the concentrations found in the PPERC wastewater analysis The Chicago CNT wastewater analysis (whose results broadly correspond with the PPERC findings) found generally higher levels of BOD (264-326 mgL compared to 178 mgL for this study) and OampG (15-66 mgL compared to 171 for this study) and lower levels of SS (21-40 mgL compared to 560 in this study)16 The levels found in the PPERC study are all within permissible limits Background concentrations (from residential and commercial sources) of OampG average 399 mgL which actually exceeds the amount found in the Cleaner by Nature sample
Volatile and Semi-Volatile Organic Compounds
Acetone Acetone is a colorless volatile highly flammable liquid widely used as an organic solvent for cleaning painting and other coatings cellulose acetate and in pharmaceuticals such as for smokeless powder and in cigarettes 17 It can cause signs of illness in humans at 800 ppm in air It is not considered to be a total toxic organic (TTO) under federal law but the BoS tests for it since it is a volatile organic compound The BoS currently has no specific limitations for acetone discharge For the Cleaner by Nature effluent analysis the acetone was found only in the load without spotting chemicals and only during the first two wash segments of that load These findings suggest that it came from a residue perhaps smoke that was washed out of the garments and not from the Aquatex or spotting chemicals The Chicago CNT results pointed to a similar conclusion with acetone detected on only one of the three sampling days Acetone is easily biodegradable in wastewater treatment plants and at the level found in the one PPERCBoS sample did not represent a significant environmental impact The acetone results are found in Appendix 5-E
Phthalates Phthalates are semi-volatile compounds derived from naphthalene and can be used in the manufacture of dyes perfumes medicines and detergents25 They are classified as TTOs under federal law and the BoS is currently developing standards for their discharge All three kinds of phthalates were present in both loads sampled The Chicago CNT study also detected the three phthalates in similar concentrations which points to the detergentfinish as a likely source of the compounds The Aquatex study did not detect the phthalates but used higher quantitation limits which in the PPERCBoS sampling would have eliminated detection of all phthalates but the Bis (2-ethylhexyl) phthalate found in the first load (gt01000) As reported in the Chicago CNT study the same phthalates were found in treatment plants at similar levels to those found in the
16 Chris Hayes The Greener Cleaner WaterWastewater Study Center for Neighborhood Technology Chicago 1996 17 Karel Verschueren Handbook ofEnvironmental Data on Organic Chemicals Van Nostrand Reinhold Company NY 1983
5-13
PPERC evaluation Phthalates at these levels should not pose any problems when discharged to a sanitary sewer or septic system Appendix 5-E has the findings from the phthalates analysis
In sum as Table 56 indicates the wet cleaning water discharge findings did not identify any significant environmental impacts from this output analysis The findings are based on the assumption that significant environmental impacts would be those where the permissible limits established at the plant facility level by the Bureau of Sanitation are exceeded Based on their own sampling BOS concluded that Cleaner by Nature would not require any future permit for its water discharges
Table 56 Waste Water Analysis
Wastewater Measure Cleaner bv Nature Standard pH Level 68 55-11 Oil and Grease (mgL) 171 600 Susoended Solids(mL) 560 205 Biochemical OxvJen Demand (mL) 1780 215 Heavy Metals (mgL) - Arsenic
-Cadmium -Chromium -Lead - Nickel - Silver -Copper -Zinc
lt001 lt0005 lt0015 lt001
lt0015 lt00015 0117 08370
3 15 15 5 12 5 10 25
Comparison of Wet Cleaning Water Discharge to Dry Cleaning
Until recent years PCE-laden separator water from dry cleaning was discharged into the sewer until recent years Today this practice is being phased out in a number of states and regions due to more stringent regulations In the City of Los Angeles it is now illegal to discharge CE-contaminated wastewater into the sewer without a permit and dry cleaners have been encouraged to eliminate any such sources of contamination to forego the need of a permit While regulations and equipment have been developed to reduce the risk of groundwater contamination from PCE dry cleaners the risk of spills equipment malfunctions or improper handling of CE-contaminated material cannot be fully controlled Improperly disposed of PCE can contaminate groundwater through breaks or cracks in sewer pipes or through pipe joints or by migrating through the soil Potential sources of CE-contaminated liquid waste include effluent from the water separators steam stripping of carbon adsorbers spills and illegal dumping However there is a lack of current data on wastewater quality for dry cleaning which precludes a quantitative comparison of dry cleaning water discharge to that of wet cleaning
5-14
54 Energy Inputs and Outputs
541 Energy Use
This section examines energy use at the Cleaner by Nature plant and compares it to that of dry cleaning The regional analysis projects the change in energy use on a regional scale resulting from a switch to wet cleaning In addition the regional analysis examines the relative emissions from the two types of energy sources most commonly used in professional garment cleaning natural gas and electricity
5411 Plant Level Analysis
Cleaner by Natures Energy Use
Use in Wet Cleaning At the Cleaner by Nature plant several sources of energy use have been identified as specific to wet cleaning the Aquatex washer the domestic washer and dryer and the boiler The two sources of energy used at Cleaner by Nature are electricity and natural gas bull Natural Gas Cleaner by Nature has a natural gas heated Aquatex dryer Natural gas is
also used by the boiler to generate steam for pressing and spotting and by a water heater
bull Electricity The Aquatex washer and dryer and the domestic washer and dryer use electricity for mechanical action (Cleaner by Nature does not wet clean with heated water so there are no additional energy sources associated with the Aquatex washer) Electricity provides mechanical action in the pressing process for pant topper and form finisher presses Electricity is also used by the boiler a water conditioner an air compressor a vacuum constant and intermittent lighting a small refrigerator and water cooler office equipment and ventilation equipment
MEmOD
For evaluation puqoses natural gas and electricity meters were installed on the Aquatex washer and dryer 18 Meter readings were combined with Cleaner by Nature garment count data for month day and load level water uses Natural gas and electricity use by the domestic washer and dryer were estimated through manufacturer specifications combined with a more intensive one month record-keeping of load numbers and sizes by the cleaner Natural gas and electricity use from all other equipment was estimated through a combination of manufacturer specifications conversations with manufacturers and plant observations A detailed analysis of the methods used by equipment or machine category is provided in Appendix 5-F
18nte installation was done in conjunction with the Southern California Gas Companys Energy Resource Center and Woods Electric a company that offers electrical metering installation and related electrical services
5-15
The wet cleaning system energy data are based on meter readings that occurred approximately each month The figures for average kilowatt- hours per day were calculated on plant operation days only not weekends or holidays Data for non-cleaning machine uses are spread over the entire period based on plant operation days or garments cleaned depending on the equipment
RESULTS
Cleaner by Nature used an average of 1103000 BTUs of natural gas per 100 garments and an average of 25 kWh of electricity per 100 garments during the demonstration period About 93 of all energy used at the plant was derived from natural gas There was an overall trend towards declining energy use particularly in the area of natural gas This trend continued after the demonstration period when the volume processed at the plant increased substantially (from 197 garments cleaned per day in the fourth quarter of the demonstration period to 279 garments cleaned per day in May 1997) During the period from February through June 1997 natural gas use by the Aquatex dryer declined by 14 from the average during the demonstration period19 In terrns of overall energy equivalent values since natural gas is responsible for nearly all the plants energy use this indicates more efficiencies of use related to a greater volume of business Tables 57 and 58 identify natural gas and electricity use respectively for the plant calculated on a monthly basis
Table 57 Month-Level Natural Gas Use at Cleaner by Nature (1996-1997)
Units Source June July Aue Sept Oct Nov Dec Jan Total NG10011ar M 164 181 166 138 172 161 148 156 160 (IOOOBTU) NCM 1070 1097 966 914 942 890 876 920 943
All 1234 1278 1132 1052 1114 1051 1024 1076 1103
Table 58 Month-Level Electricity Use at Cleaner by Nature
Source June July Aue Sept Oct Nov Dec Jan Total Elec100 gar M 3 3 3 2 4 4 3 3 3 (kWh) NCM 26 27 22 20 22 20 19 20 22
All 29 30 25 22 26 24 22 23 25
19 The natural gas meter was read on June 24 1997 for the period from February 1 1997 to June 24 1997 That number was then divided by the number of gannents cleaned per day during that same period and then multiplied by 100 (to normalize on the basis of 100 gannents cleaned) to obtain the 14 reduction figure for the average natural gas use during the demonstration period
5-16
Comparison of Wet Cleaning Energy Use with Dry Cleaning
Use in Dry Cleaning Both natural gas and electricity are used in the PCE machine to generate heat and mechanical action Electricity uses for the PCE machine however also include PCE control equipment such as refrigerated condensers While there are also similarities with wet cleaning in terms of various non-cleaning machine energy uses differences are associated with variations in pressing times domestic washing practices boiler requirements cooling tower use and the need for wastewater evaporators for dry cleaning 20
METHOD
Equipment manufacturer specifications were used to provide comparative information on energy use by PCE machines and other non-cleaning machine related sources An estimate of the different energy use demands from pressing were based on the pressing evaluation described in Section IV The Energy Resource Center of Southern California Gas Company and Edisons Environmental Applications Department also assisted with the energy evaluation
The energy use data for the dry cleaning machine is based on manufacturer specifications combined with a survey of local small-sized dry cleaners There is little reason to expect significant energy use differences between the three configurations of dry cleaning systems selected for the comparison since they all use a still and refrigerated condenser The addition of a secondary carbon adsorber may coincide with the addition of an exhaust fan which operates briefly at the end of the drying cycle However this may vary and the exhaust fan uses an insignificant amount of energy relative to other cleaning machine uses Certain older machines do not use the heat from the refrigerated condenser to assist drying thus causing more steam energy to be used in the drying process21 While this may occur more for the older converted machines it is difficult to quantify Therefore all configurations were assigned equal values
Machine specifications were acquired from several dry cleaning distributors and three were interviewed concerning their approximately 35-pound capacity machines Adina S-37 Multimatic Shop Star 303 and Flourmatic BT37 All machines use a refrigerated condenser secondary carbon adsorber and filter system The machines used electricity to run pump wash extract fan and compressor motors while using boiler steam to generate heat for the still and drying To estimate energy use the equipment ratings were multiplied by the amount of time each component operates during a typical non-pre-wash load according to the distributor The electricity and natural gas results were then averaged for this comparison The average electricity use per load was 17 kWh while the average natural gas use per load was 13000 BTU (assuming the use of the 95 HP boiler at Cleaner by Nature) Non-cleaning machine estimation methods are
20 Again this might represent a conservative estimate indicating greater water uses for wet cleaning from pressing than the Environment Canada estimate of wet cleaning and dry cleaning pressing times described in Section IV 21 Personal communication with Greg Leiram PROS Minneapolis MN April 2 1997
5-17
provided in Appendix 5-G
RESULTS
Overall wet cleaning uses 23 more natural gas and 24 less electricity than its dry cleaning equivalent The greater natural gas use for wet cleaning stems from the increased natural gas demands of the Aquatex dryer and the boiler as a consequence of the longer pressing time required for wet cleaning (on the other hand lower domestic drying requirements result in a decrease in natural gas use) The wet cleaning systems electricity use is less than that of dry cleaning because it does not require control equipment (the increased pressing time demands for wet cleaning would result in the only increase in electricity demand for wet cleaning) Table 59 and 510 show comparative electricity use and natural gas use for wet cleaning and dry cleaning respectively Table 511 details the differences in energy use for non-cleaning related equipment Detailed resource use data for Cleaner by Nature are provided in Appendix 5-H
Table 59 Electricity Use per 100 Garments Dry Cleaning vs Wet Cleaning
Energy Type Source Wet Cleaning Dry Cleaning
Electricity in Cleaning Machine 31 76
kWh Non-Cleaning Machine 216 248
Total 247 324
Table 510 Natural Gas Use per 100 Garments Dry Cleaning vs Wet Cleaning
Energy Type Source Wet Cleaning Dry Cleaning
Natural Gas in Cleaning Machine 160 58
lOOOBTU Non-Cleaning Machine 943 842
Total 1103 900
Table 511 Non-Cleaning Machine Energy Use Wet Cleaning and Dry Cleaning
ProcessEquipment Wet Cleaning Use Dry Cleaning Use
Change per 100 gar
from switch to WC
kWh lOOOBtu
Domestic Washing
Pressing
Evaporator
Cooling Tower
Total Non Cleaning-Machine
11 loadsday
206 kWh 303 kBTU
Not necessary
Not necessary
36 loadsday
WC17
0165 kWhday 1 hr
24 hrsday 2HPhr
-19
+09
-01
-21
-32
-23
+124
0
0
+101
5-18
5412 Regional Analysis
Energy Use
METHOD
The electricity and natural use estimates for the region were developed from 1995 countyshyspecific data supplied by the California Energy Commission22 The plant level energy use comparison provides the basis for energy use estimates The regional energy estimations for wet and dry cleaning are based on the distribution of machines and projection factors shown in Appendix 5-A
REsULTS
As indicated in the tables below the impacts that would result from all dry cleaners in the region shifting to wet cleaning are quite small for both sources Electricity use would decrease by less than a 100th of a percent while natural gas use would increase by less than a tenth of a percent The larger absolute and relative energy uses of natural gas in wet cleaning can be attributed to the increased steam-generation and drying requirements in wet cleaning Tables 512 and 513 present the comparative energy uses with respect to electricity and natural gas represented by a shift from dry cleaning to wet cleaning in the region
Table 512 Regional Electricity Differences (in Million kWh) Posed by Shift From Dry Cleaning to Wet Cleaning
Relrlonal Use1 Current Use
(wdrv cleanine)
Use with 100 Shift to Wet
Cleanine Total County
Electricity Use Decrease
w100 WC Los Angeles 231 176 57697 00095 Orange 66 50 17192 00093 Riverside 29 22 7341 00095 San Bernardino 34 26 8381 00095 Total 360 274 90611 00095
1Regional use is defined by SCAQMD configured counties
22 Since the SCAQMD does not include all of areas the these counties in its jurisdiction these estimates were adjusted to fully coincide with the counties
5-19
Table 513 Regional Natural Gas Use (in Million Therms) Posed by Shift From Dry Cleaning to Wet Cleaning
Regional Use Current Use with
Dry cleanin11
Use with 100 Shift to wet
cleanin11 Total County
Natural Gas Use Increase
w100 WC Los An11eles 64 78 32736 0043 Oran11e 18 22 6556 0061 Riverside 08 10 2845 0070 San Bernardino 09 II 5136 0039 Total 100 123 47273 0049
542 Energy Outputs
MEIBOD
In order quantify the change in emissions resulting from a switch to wet cleaning data was gathered from utility companies and regulatory agencies about emissions associated with the use of natural gas and energy The regional data was acquired from staff at the South Coast Air Quality Management District Southern California Edison and the Los Angeles Department of Water and Power23 The SCAQMD provided emissions factors for the type of natural gas boilers used in wet or dry cleaning plants The Los Angeles Department of Water and Powers Air Quality Group provided a representative emission factor for NOx emissions as result of electricity generation for the area around the Cleaner by Nature plant Southern California Edison provided electricity emission factors for other criteria pollutants
Local electricity generation comes primarily from plants which use natural gas for fuel These emissions estimates do not account for the use of other more polluting electricity-generating facilities like coal-fired or oil-fired plants which may be more prevalent in other regions or at peak times when the cleanest plants cannot meet demand These facilities may be associated with such negative environmental impacts as the generation of greenhouse gases land use impacts from mining or acid deposition
REsULTS
Since natural gas is less polluting than electricity the increase in natural gas emissions resulting from a switch to wet cleaning would be offset by reductions in electricity emissions The Los Angeles regional extrapolations of electricity-related and natural gas emissions based on a shift of all dry cleaners to wet cleaning are shown in Table 514 Overall the net change in regional emissions for each criteria pollutant
23 Personal Communications with Pridim Sharma Southern California Edison (May 9 1997) Jodean Giese Los Angeles Department of Water and Power (June 20 1997) and Chandrashekhar Bhatt South Coast Air Quality Management District (June 20 1997)
5-20
category would be extremely small (between Oto 2 pounds annually) All categories except NOx and VOCs would decrease under the wet cleaning scenario Even with the conservative assumptions made in these estimates wet cleaning presents fewer emissions-related impacts than dry cleaning in terms of energy use
Table 514 Regional Emissions Impact from Energy Generation Posed by 100 Shift to Wet Cleaning
Pollutant Increase in Natural Gas Emissions Decrease in Electricitv Emissions Total Change in Emissions
Lbs emitted (mill ekWh)
(mill ekWh) (lbs) (kWh) (mill kWh) (lbs) (lbs)
NOx 38 0 13 510 240 -002 -416 094
PMlO I 013 014 20 -002 -035 -021
co 10 013 137 150 -002 -260 -123
voe 2 013 027 10 -002 -017 010
SOx 0 013 000 10 -002 -017 -017
Summary of Energy Inputs and Outputs
In sum natural gas represents 93 of all energy uses and electricity represents only 7 of those uses On a comparative basis wet cleaning uses more natural gas but less electricity per I 00 garments cleaned than dry cleaning Scaled to a regional level those differences are not significant There would be a regional increase in natural gas use of 23 million therms (0049) resulting from a 100 shift to wet cleaning Electricity use would decline by 86 million kilowatt hours (00095) as a result of the shift Trends in natural gas use at Cleaner by Nature suggest that wet cleaning could realize greater efficiencies with a higher volume of business In addition the environmental impacts from electricity use are greater than those associated with natural gas use For this study those impacts were evaluated on the basis of a regional emissions factor In terms of the regional analysis the greater emissions impacts from dry cleaning offset the larger volume of use of natural gas in wet cleaning
5-21
55 Chemical Inputs and Outputs
Chemical inputs and outputs based on solvent use have historically represented the environmental area of most concern in garment care A wide range of pollution control regulations have sought to reduce those impacts Concerns have also been raised by dry cleaners that since chemicals are also used in the wet cleaning process and since PCE residues may still be found on garments sent to wet cleaning an environmental assessment also needs to identify_ wet cleaning chemical inputs and outputs
551 Chemical Inputs
55J1 Plant Level Analysis
Cleaner by Natures Chemical Use
Spotting Chemical
Use in Wet Cleaning An assortment of spotting chemicals is used in wet cleaning to remove difficult stains and soils both before and after cleaning
MEIBOD
Data wlisect gathered through interviews with Cleaner by Natures cleanerspotter and plant observation Spotting agents use was monitored for a one month period (Nov 27 1996 through Jan 2 1997) The use was measured by marking the spotting chemical bottles with tape and measuring change over time The toxicity of the spotting agents used at Cleaner by Nature was assessed through material safety data sheets (MSDS) supplied by the manufacturers
RESULTS
Overall Cleaner by Nature uses a small volume of spotting agents under three ounces per 100 garments The qualitative assessment using MSDS revealed Pyratex to be the most toxic of the 17 spotting chemicals evaluated at Cleaner by Nature The cleaner uses small amounts of Pyratex (003 oz100 garments) always after washing and suctions it off the spotting board to a special container At the end of the demonstration period there was only a small amount of fluid inside the container which did not yet require disposal The cleaner reported that he relies on the Aquatex washer to remove stains before resorting to spotting chemical use The wastewater analysis showed that the spotting chemicals made little impact on the largely benign effluent from the Aquatex washer
Appendix 5-1 shows the amount of spotting agents used at Cleaner by Nature to
5-22
clean 100 garments The amounts shown represent the total of each agent accounting for its use alone and in mixtures24 Not shown in the appendix but constituting additional chemical use at the Cleaner by Nature plant were minuscule amounts of Streetan spotter (not measured due to the unique opaque bottle) Odex for mildewy clothes washed in the domestic washer and Ex-it for deodorizing clothes
Cleaning Agents
Use in Wet Cleaning The Aquatex washer uses detergent finishing sizing leather detergent and leather finishing to clean clothes and give them body and shape Detergents clean while finishes soften the garments Sizing is used to give body to woolens jeans and Dockers
MErnoo
There were three types of cleaning agents used at Cleaner by Nature during the monitoring period detergent sizing and finish Regular Aquatex detergent and finish are used in most loads while the leather detergent and finish are seldom used Cleaner by Nature runs about one leather program per week so one-half of a leather load was inserted into the two-day load mix Data on detergent and finish use was gathered during a two-day monitoring period at which time pump tests were performed on the Aquatex washer (Pumps deliver the detergents and finishes to a wash basin and can be tested for accurate load amounts) Use of sizing which was poured in manually to the washer was measured during a two-week period in January As of February 1997 Cleaner by Nature had largely discontinued the use of the sizing due to dissatisfaction with the way it made garments feel An assessment of the cleaning agents chemical characteristics was made through an evaluation of MSDS
RESULTS
Appendix 5-J shows the amount of cleaning agents used at Cleaner by Nature to clean 100 garments In total 488 oz of cleaning agents are used to clean 100 garments with the regular Aquatex detergent and finish constituting over 90 of the volume The cleaning agents are non-hazardous as evidenced by their MSDS sheets and by the results shown in the wastewater study
Chemical Use Comparison with Dry Cleaning
There are a number of chemical inputs and outputs associated with dry cleaning PCE represents both the largest chemical use and the most substantial environmental impacts associated with such uses Additional chemical inputs and outputs are also associated with spotting chemicals and refrigerants used in dry cleaning
24 Three agents are mixed with water to produce a lighter prespotting mixture The cleaner mixed Streetex Wetspo regular Aquatex detergent and water in a 21 112 ratio
5-23
PCEUse
Use in Dry Cleaning As the primary cleaning solvent PCE continues to be the most heavily used chemical in the dry cleaning process
METHOD
The data for PCE use are based on a CARB survey of over 2000 California dry cleaners published in 1992 Dry cleaners were asked in 1991 about their equipment configurations PCE use volume of garments cleaned and waste disposal practices For this analysis the CARB database was reconfigured to include only 30 to 40 pound closed-loop machines having cleaned at least 10000 pounds of garments for that year These matched the three equipment configurations used in the analysis (ie factory machine with refrigerated condenser only factory machine with refrigerated condenser and carbon adsorber or converted machine with refrigerated condenser)
Since the data was based on information gathered five years prior to this study the numbers were adjusted to exclude all factory machines older than five years and all converted machines older than ten years The resulting data set therefore includes fewer of the older machines but fewer of the newer machines found in the current dry clean machine population as well Records containing extreme outliers (eg zero pounds of clothes cleaned) or blank values were also eliminated
The final data set included 295 factory machines with refrigerated condenser only 8 factory machines with both refrigerated condenser and carbon adsorber and 11 converted machines with refrigerated condenser only CARB staff cautioned that the data do not reflect improved operating practices required by its Airborne Toxic Control Measure (A TCM) but also cautioned that PCE use may be underreported and was not field-audited These factors may be largely offsetting but the analysis also included a 50 garmentspound mileage improvement of the final estimates identified in CARBs projected operation improvements under regulation as a conservative assumption
CARB also conducted a telephone audit of its database and found the pounds of clothes cleaned to be underreported for dry cleaners who originally reported processing 30000 pounds or fewer clothes per year The cleaning volumes for 22 of all records were adjusted upward by 35 to create an overall PCE use reduction factor of 77 for the data set This simple adjustment method results in somewhat lower PCE use than would be found using CARB s method since an entire cross-section of cleaning volumes are adjusted not just those under 30000 lbs (though in effect an equal number of volumes (22) are adjusted under both methods)
As shown the PCE use for the different configurations follows the expected pattern of greater PCE mileage efficiencies factory machines with both refrigerated condenser and carbon adsorber use the least PCE while converted machines use the most
5-24
PCE The data represent weighted-average values from the above-described data sets using a one garmentlb conversion Some PCE could be used in spotting but since that information was not available in the CARB data set all PCE uses are identified as machine -based
RESULTS
Table 515 identifies the PCE use for three dry cleaning configurations each of which are sized equivalent to Cleaner by Nature The most efficient machines are estimated to use two tenths of a gallon of PCE per hundred garments cleaned which translates to about four tenths of a gallon of PCE used each day based on the Cleaner by Nature average number of garments cleaned The least efficient of the three machines used 026 gallons per 100 garments cleaned
Table 515 PCE Use in Gallons per 100 Garments Plant Level Analysis
Factory Machines Converted Machines
Refrigerated Refrigerated Refrigerated Condenser Condenser amp Carbon Condenser only
Adsorber
PCE Use foal) 0206 0238 0265
552 Chemical Outputs
PCEOutputs
bull Emissions
METHOD
The new generation of PCE dry cleaning machines has been designed to reduce fugitive PCE emissions into the atmosphere so as to meet permissible emission levels set by the federal Occupational Safety and Health Administration and Title ill of the 1990 Clean Air Act However the control technology does not eliminate emissions Leaks spills and poorly maintained equipment may raise the level of air emissions Moreover even properly operated machines do not completely eliminate PCE emissions Dry cleaned clothes also release a small amount of PCE into the environment a process known as off-gassing Information derived from CARB and SCAQMD reports have been used to characterize the PCE emissions generated by dry cleaning
5-25
RESULTS
A dry cleaner emits between 18 and 2 pounds of PCE into the atmosphere for every 100 garments cleaned As shown in Table 516 the factory machine with a refrigerated condenser has lower emissions than the more advanced factory machine with the additional carbon adsorber However the more advanced factory machine with the condenser produces less hazardous waste (as shown in Table 517) and as a consequence generates less overall PCE waste discharged onto the land as well as into the ambient environment than the refrigerated-condenser-only machine
Table 516 Pere Emissions in lbs per 100 Garments Wet Cleaning and Dry Cleaning
Factory Machines Converted Machines
Refrigerated Refrigerated Refrigerated Condenser Condenser amp Carbon Condenser only
Adsorber
PCE Use (lbs) 20 18 25
bull Hazardous Waste
METHOD
The main types of hazardous waste generated by dry cleaning are spent carbon or carbon cartridges from carbon adsorption systems filters still bottoms and separator water (which in turn is usually evaporated) This type of hazardous waste is collected by companies that specialize in disposal Like wet cleaning dry cleaning generates a relatively small amount of hazardous waste during the spotting process For dry cleaning the CARB survey of dry cleaners was used to estimate the amount of PCB-related hazardous waste generated per 100 garments It was assumed that estimates of the quantity of spotting chemical-related hazardous waste generated in dry cleaning are broadly equivalent to that of Cleaner by Nature There is some evidence that points to wet cleaning actually involving less spotting than dry cleaning because more stains are water based Consequently the assumption about spotting chemical waste generated by dry cleaners is conservative
REsULTS
As shown in Table 517 the hazardous waste generated for the different configurations follows the expected pattern factory machines with the refrigerated condenser and carbon adsorber produce the least hazardous waste while converted machines generate the most
5-26
Table 517 Hazardous Waste Generated in pounds per 100 Garments Wet Cleaning and Dry Cleaning
Factorv Machines Converted Machines Category Refrigerated
Condenser amp Carbon Adsorber
Refrigerated Condenser only
Refrigerated Condenser
No Cartrid11e Filters 0054 0050 0041 Lbs Muck Powder 0 0058 0 Gal Still Bottoms 0090 0188 0152
Refrigerant Outputs
Use in Dry Cleaning Dry cleaners use refrigerated condensers which assist in reclaiming the PCE vapors during the drying process and turning them back into liquid form for reuse as solvent
METHOD
The character and quantity of refrigerant contained in a dry cleaning system has been evaluated Without available specific information on actual refrigerant replacement it is difficult to quantify potential refrigerant emissions from individual dry cleaning machines
RESULTS
Most of the newer dry cleaning machines use R-22 (HCFC-22) as a refrigerant in the refrigerated condenser This refrigerant still has ozone-depleting potential and will be largely phased out by 2020 Older machines may still contain the now banned CFC- I I or CFC-12 refrigerants which have even higher ozone depleting potential as well as contribute to global warming
All three dry cleaner configurations selected for the comparison use refrigerated condensers Based on conversations with distributors machines that have a 35-lb capacity require about IO pounds of initial refrigerant Most said that amount should usually last the lifetime of the machine with leaks rarely occurring
Spotting Chemicals
Use in Dry Cleaning As with wet cleaning spotting agents are used to remove difficult stains
METHOD
Information regarding spotting agent use for dry cleaners was gathered through a
5-27
survey of three local dry cleaners The findings at Cleaner by Nature have been compared with the data gathered from the survey of three dry cleaners and MSDS for the spotting chemicals used at those facilities Spotting chemical use can vary depending on the cleaner Given the limited nature of the PPERC survey the data should be viewed as preliminary
REsULTS
This preliminary comparison indicated higher levels of rriore toxic chemicals used in dry cleaning than in wet cleaning both in terms of variety of agents (about twice the number) and in terms of combined volume (about three to five times the level) As with wet cleaning the dry cleaning spotting chemicals primarily evaporate or accumulate in the holding container in the spotting board Some dry cleaning spotting agents remain in the garments through the PCE washing and then may get disposed with PCE in filters muck and separator water
Cleaning Agents
Use in Dry Cleaning Dry cleaning systems use two different types of detergents injection and charge Injection detergent is disposed of after each wash while the charge detergent is recycled with the solvent In addition some dry cleaners use sizing
METHOD
The volume of injection and charge detergent used was estimated by dry cleaning distributors
RESULTS
Dry cleaning uses about 019 oz of detergent per garment (based on an average of the injection and charge systems) and about an equal amount of sizing agents
552J Regional Analysis
The regional analysis of changes in chemical use resulting from a scenario based on a switch of all -dry cleaners to wet cleaning within the SCAQMD region focuses on PCE-related emissions and hazardous waste Using secondary data on PCE use collected at the plant level the regional analysis projects the chemical-related impacts on a regional level of a switch from dry cleaning to wet cleaning
5-28
Regional PCE Emissions
METHOD
Projected emissions reductions are based on the scenario of a switch of all dry cleaners in the region to wet cleaning It should be noted that the relationship of emissions to exposure will vary depending on the source (eg dry cleaning as compared to degreasing paints and coatings etc) For example PCE emitted through dry cleaning may come into contact with a larger population than industrial uses due to the typically commercialresidential location of dry cleaners and customer contact with garments (This concern of residential exposure for example has led to new regulations in New York City for dry cleaners who are located in residential buildings)
REsULTS
A switch of all dry cleaners to wet cleaning would result in an estimated 42 tons per day or 60 reduction25 in PCE emissions Table 518 identifies regional emissions estimates for dry cleaning and subsequent regional reductions by county based on a conversion of all dry cleaners to wet cleaning The first column in the table identifies SCAQMD projected emissions for 1998 when all the mandated control technologies need to be fully in place The emissions in 1998 would be lower than current levels due directly to these new equipment and operating practices and due indirectly to the projected retirement of 207 machines each of which are related to regulatory mandates
Table 518 Estimated 1998 Regional PCE Emissions in Tons per Day (with new mandated dry cleaning equipment)
County 1998 Dry Cleaning 1998 Total 1998 Region-wide PCE Emissions Region-wide PCE emissions with 100
Emissions conversion to wet cleaninl Lns AnJeles 2729 4548 1819 OranJe 0772 1287 515 Riverside 0344 0573 229 San Bernardino 0399 0665 266 Total 4244 7073 2829
Regional Hazardous Waste Generationmiddot
METHOD
Estimates of hazardous waste generated by PCE dry cleaning were based on the plant-level findings which were then multiplied by the regional allocation factors To account for different dry cleaning configurations the SCAQMD project equipment population for 1998 was used 7 8 factory machines with refrigerated condenser and
25 The California Air Resources Board (in its Technical Support Document to the proposed ATCM) estimates that dry cleaning accounts for 60 of PCB use
5-29
carbon adsorber 686 factory machines with refrigerated condenser only and 236 converted machines with refrigerated condenser Dry cleaner-generated waste was then compared with all hazardous wastes (most recent year 1993) generated for those counties as indicated by the EPAs Biennial Waste Reporting System (BRS)
RESULTS
A conversion of all dry cleaners in the region to wet cleaning would result in a 21 reduction in PCE-contaminated hazardous waste or 1443 tons per year Table 519 provides regional hazardous waste projections for 1998 and projections with a 100 conversion to wet cleaning As shown the percent of all hazardous wastes generated through dry cleaning is much larger in the less industrial counties (eg Riverside County) than in Los Angles County
Table 519 Estimated Regional Hazardous Wastes from Dry Cleaning in Tons per Year
Current Haz Waste Decrease Based on Generation from Dry Total Regional Haz 100 conversion to Wet
SCAOMD Counties Cleaners Waste Generation Cleanin2 Los An2eles 927 6436 14 Oran2e 263 227 116 Riverside 117 43 272 San Bernardino 136 211 64 Total 1443 6917 21
Summary of Chemical Inputs and Outputs
In sum chemical inputs and outputs from dry cleaning are still substantial even as new mandated equipment has increased PCE mileage (efficiencies in use) and regulations have limited certain disposal options (eg sewer discharge restrictions) PCE air emissions in the Southern California region based on full compliance with required equipment changes for dry cleaners are estimated for 1998 at 42 tons per day (or 1533 tons per year) while PCE hazardous waste generation in the region is estimated for 1998 at 1443 tons per year By eliminating the use of PCE in the garment care process a shift to wet cleaning would offer a substantial pollution prevention benefit Wet cleaning like dry cleaning uses some toxic chemicals in the spotting process This chemical use may represent a concern in terms of worker exposure However spotting occurs in both processes and there is some evidence that smaller quantities of toxic spotting chemicals are used in wet cleaning than in dry cleaning
5-30
56 Summary Analysis of Environmental Assessment
No substantial environmental concerns were raised by the environmental evaluation of wet cleaning An increase in regional water use has been identified as a possible negative environmental consequence of a switch to wet cleaning However this study indicates that under the most conservative worst-case assumptions regional water demands would increase by only 0021 not enough to generate concern among regional water planners In addition the Los Angeles Bureau of Sanitations wastewater analysis of Cleaner by Nature suggests that wet cleaning effluent meets all regulatory standards and generates few environmental impacts These findings are confirmed by three prior studies of wet cleaning effluent While regulations and equipment have been developed to reduce the risk of groundwater contamination from PCE dry cleaners the risk of spills or illegal handling of PCB-contaminated material cannot be eliminated For example water planners note that the loss of one small production well from ground water contamination would offset water use increases stemming from a conversion of all dry cleaners to wet cleaning in the region
Energy use data gathered at Cleaner by Nature and modeled for dry cleaning suggests that energy use is comparable for both processes Wet cleaning uses more natural gas than dry cleaning and relatively less electricity Since natural gas generation produces relatively fewer pollutants than electricity generation wet cleanings lower electricity use offsets the greater use of natural gas
New dry cleaning equipment has improved efficiencies in chemical use and reduced chemical outputs However PCE emissions (projected at the regional level at 42 tons per day for 1998) cannot be eliminated even with the newest technology The generation of hazardous waste represents another significant environmental impact in dry cleaning as a consequence ofPCB use
Because it eliminates the use of PCE in the garment care process wet cleaning should be considered environmentally preferable While wet cleaning uses more water than dry cleaning the small amount of increased use from a switch to wet cleaning is less of a concern to regional water planners than possible PCB-related groundwater contamination problems from dry cleaning
5-31