19
Altice USA Q2 2021 Results July 28, 2021

Altice USAQ2 2021 ResultsJuly 28, 2021
2
Disclaimer
FORWARD-LOOKING STATEMENTS
Certain statements in this presentation constitute forward-looking statements within the meaning of the Private Securities Litigation Reform Act of 1995, including the information under the heading "Financial Outlook". These forward-looking
statements include, but are not limited to, all statements other than statements of historical facts contained in this presentation, including, without limitation, those regarding our intentions, beliefs or current expectations concerning, among other
things: our future financial conditions and performance, results of operations and liquidity; our strategy, plans, objectives, prospects, growth, goals and targets; our ability to achieve operational performance improvements; and future developments
in the markets in which we participate or are seeking to participate. These forward-looking statements can be identified by the use of forward-looking terminology, including the terms "anticipate", "believe", "could", "estimate", "expect", "forecast",
"intend", "may", "plan", "project", "should", "target", or "will" or, in each case, their negative, or other variations or comparable terminology. Where, in any forward-looking statement, we express an expectation or belief as to future results or events,
such expectation or belief is expressed in good faith and believed to have a reasonable basis, but there can be no assurance that the expectation or belief will result or be achieved or accomplished. To the extent that statements in this presentation
are not recitations of historical fact, such statements constitute forward-looking statements, which, by definition, involve risks and uncertainties that could cause actual results to differ materially from those expressed or implied by such statements
including risks referred to in our Annual Report on Form 10-K and our Quarterly Report on Form 10-Q. You are cautioned to not place undue reliance on Altice USA’s forward-looking statements. Any forward-looking statement speaks only as of
the date on which it was made. Altice USA specifically disclaims any obligation to publicly update or revise any forward-looking statement, as of any future date.
NON-GAAP FINANCIAL MEASURES
We define Adjusted EBITDA, which is a non-GAAP financial measure, as net income (loss) excluding income taxes, non-operating income or expenses, loss on extinguishment of debt and write-off of deferred financing costs, gain (loss) on interest
rate swap contracts, gain (loss) on derivative contracts, gain (loss) on investments and sale of affiliate interests, interest expense, interest income, depreciation and amortization (including impairments), share-based compensation expense or
benefit, restructuring expense or credits and transaction expenses.
We believe Adjusted EBITDA is an appropriate measure for evaluating the operating performance of the Company. Adjusted EBITDA and similar measures with similar titles are common performance measures used by investors, analysts and
peers to compare performance in our industry. Internally, we use revenue and Adjusted EBITDA measures as important indicators of our business performance, and evaluate management’s effectiveness with specific reference to these indicators.
We believe Adjusted EBITDA provides management and investors a useful measure for period-to-period comparisons of our core business and operating results by excluding items that are not comparable across reporting periods or that do not
otherwise relate to the Company’s ongoing operating results. Adjusted EBITDA should be viewed as a supplement to and not a substitute for operating income (loss), net income (loss), and other measures of performance presented in accordance
with GAAP. Since Adjusted EBITDA is not a measure of performance calculated in accordance with GAAP, this measure may not be comparable to similar measures with similar titles used by other companies.
We also use Adjusted EBITDA less cash Capital Expenditures, or Operating Free Cash Flow (“OpFCF”), and Free Cash Flow (defined as net cash flows from operating activities, less cash capital expenditures) as an indicator of the Company’s
financial performance. We believe these measures are two of several benchmarks used by investors, analysts and peers for comparison of performance in the Company’s industry, although they may not be directly comparable to similar measures
reported by other companies.
For an explanation of why Altice USA uses these measures and a reconciliation of these non-GAAP measures, please see the Second Quarter 2021 earnings release for Altice USA posted on the Altice USA website.
3
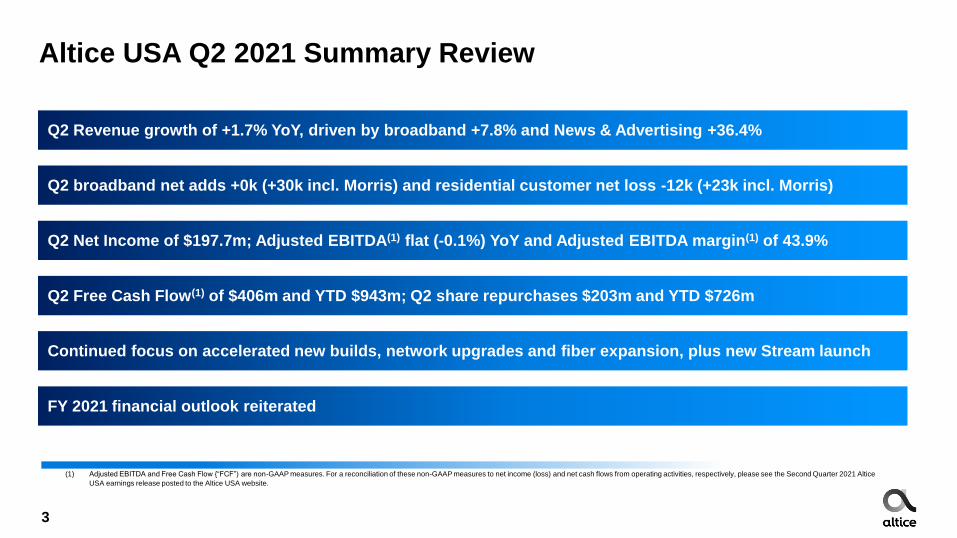
Q2 Revenue growth of +1.7% YoY, driven by broadband +7.8% and News & Advertising +36.4%
Q2 Net Income of $197.7m; Adjusted EBITDA(1) flat (-0.1%) YoY and Adjusted EBITDA margin(1) of 43.9%
(1) Adjusted EBITDA and Free Cash Flow {“FCF”) are non-GAAP measures. For a reconciliation of these non-GAAP measures to net income (loss) and net cash flows from operating activities, respectively, please see the Second Quarter 2021 Altice
USA earnings release posted to the Altice USA website.
Q2 Free Cash Flow(1) of $406m and YTD $943m; Q2 share repurchases $203m and YTD $726m
Q2 broadband net adds +0k (+30k incl. Morris) and residential customer net loss -12k (+23k incl. Morris)
Altice USA Q2 2021 Summary Review
Continued focus on accelerated new builds, network upgrades and fiber expansion, plus new Stream launch
FY 2021 financial outlook reiterated

1,990 1,988
366 372
97 132 23 24 2,475 2,516
Q2-20 Q2-21
4
Revenue growth YoY
Revenue GrowthQ2 revenue growth driven by News & Advertising and Business Services
(1) Other includes mobile revenues of $20.7 million in Q2 2021 and $19.9 million in Q2 2020.
Q2-21 vs. Q2-20
($m)
YoY Growth Q2-21
Total Revenue +1.7%
Residential -0.1%
Business Services +1.8%
News & Advertising (N&A) +36.4%
Residential
Business Services
News & Advertising
Other1
+1.7%
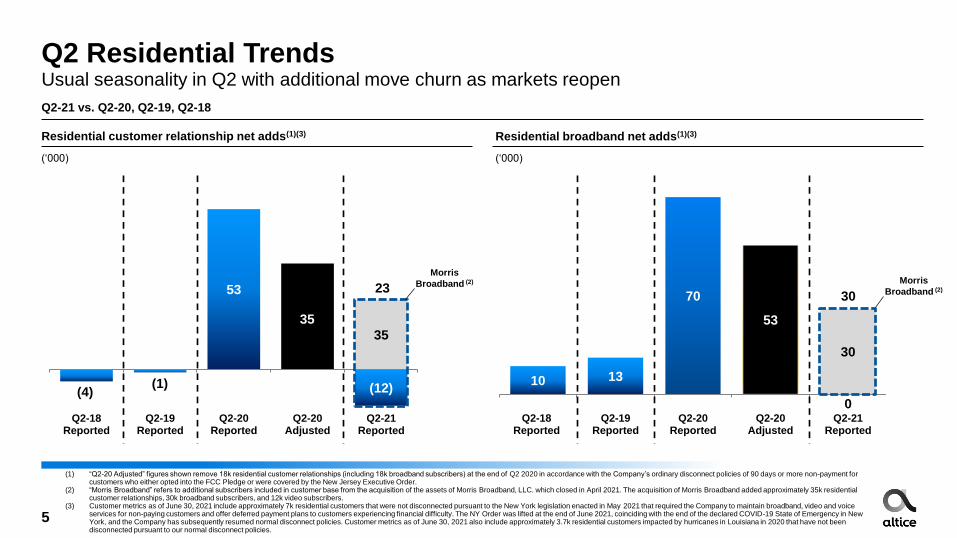
(1) “Q2-20 Adjusted” figures shown remove 18k residential customer relationships (including 18k broadband subscribers) at the end of Q2 2020 in accordance with the Company’s ordinary disconnect policies of 90 days or more non-payment for customers who either opted into the FCC Pledge or were covered by the New Jersey Executive Order.
(2) “Morris Broadband” refers to additional subscribers included in customer base from the acquisition of the assets of Morris Broadband, LLC. which closed in April 2021. The acquisition of Morris Broadband added approximately 35k residential customer relationships, 30k broadband subscribers, and 12k video subscribers.
(3) Customer metrics as of June 30, 2021 include approximately 7k residential customers that were not disconnected pursuant to the New York legislation enacted in May 2021 that required the Company to maintain broadband, video and voice services for non-paying customers and offer deferred payment plans to customers experiencing financial difficulty. The NY Order was lifted at the end of June 2021, coinciding with the end of the declared COVID-19 State of Emergency in New York, and the Company has subsequently resumed normal disconnect policies. Customer metrics as of June 30, 2021 also include approximately 3.7k residential customers impacted by hurricanes in Louisiana in 2020 that have not been disconnected pursuant to our normal disconnect policies.
(4)
53
35
(12)
35
Q2-18Reported
Q2-19Reported
Q2-20Reported
Q2-20Adjusted
Q2-21Reported
10 13
70
53
0
30
Q2-18Reported
Q2-19Reported
Q2-20Reported
Q2-20Adjusted
Q2-21Reported
5
Q2-21 vs. Q2-20, Q2-19, Q2-18
Q2 Residential TrendsUsual seasonality in Q2 with additional move churn as markets reopen
Residential customer relationship net adds(1)(3)
(‘000)
Residential broadband net adds(1)(3)
(‘000)
(1)
2330
Morris
Broadband (2) Morris
Broadband (2)
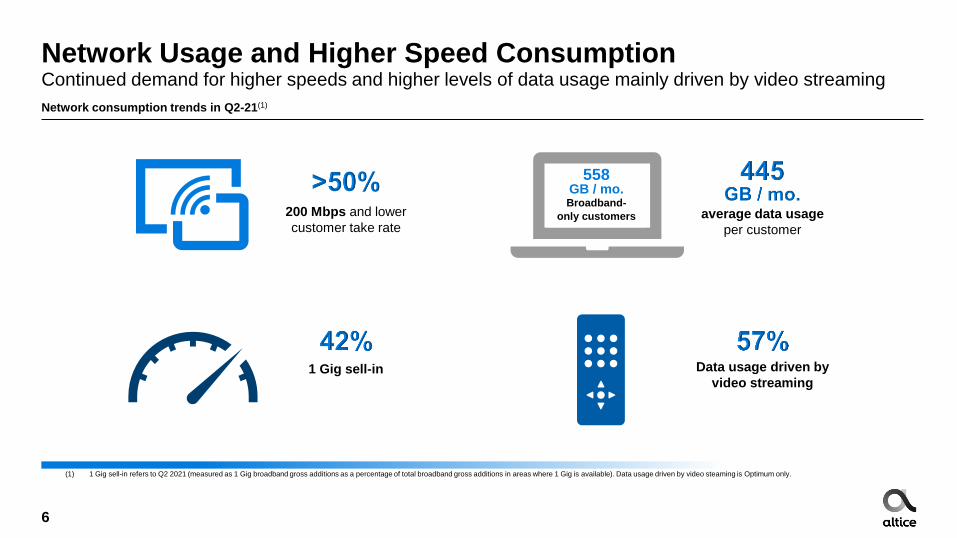
Network consumption trends in Q2-21(1)
200 Mbps and lower
customer take rateaverage data usage
per customer
1 Gig sell-in
6
Network Usage and Higher Speed ConsumptionContinued demand for higher speeds and higher levels of data usage mainly driven by video streaming
(1) 1 Gig sell-in refers to Q2 2021 (measured as 1 Gig broadband gross additions as a percentage of total broadband gross additions in areas where 1 Gig is available). Data usage driven by video steaming is Optimum only.
558GB / mo.Broadband-
only customers
Data usage driven by
video streaming
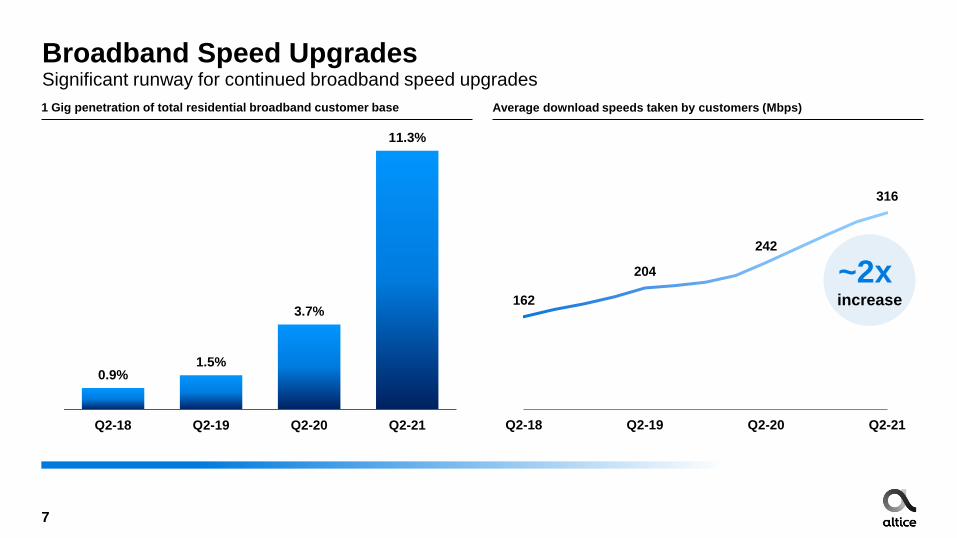
0.9%1.5%
3.7%
11.3%
Q2-18 Q2-19 Q2-20 Q2-21
162
204
242
316
Q2-18 Q2-19 Q2-20 Q2-21
7
Broadband Speed UpgradesSignificant runway for continued broadband speed upgrades
~2x increase
Average download speeds taken by customers (Mbps) 1 Gig penetration of total residential broadband customer base

8
Accelerated New Builds, Network Upgrades, and Fiber RolloutNetwork edge-outs and upgrades, including bolt-on M&A and FTTH investment, to drive customer growth
New homes passed and acquired homes Fiber (FTTH) homes passed and penetration
115 119149 150+
6789
115 119
216
~240+
-
50.0
100.0
150.0
200.0
250.0
FY-18 FY-19 FY-20 FY-21 Target
Organic New Homes Passed Acquired Homes Passed
(‘000)
880923
9591,003
1,093
1.0%1.8%
2.7%
3.6%
4.3%
0.0%
1.0%
2.0%
3.0%
4.0%
5.0%
6.0%
7.0%
8.0%
9.0%
10.0%
0
200
400
600
800
1000
1200
Q2-20 Q3-20 Q4-20 Q1-21 Q2-21
Fiber Homes Passed Fiber Penetration
+43k +36k +45kNew
fiber
homes
+108k +90k
(1) Acquired homes passed refer to Service Electric Cable T.V. of New Jersey and Morris Broadband in FY-20 and FY-21 respectively.
9
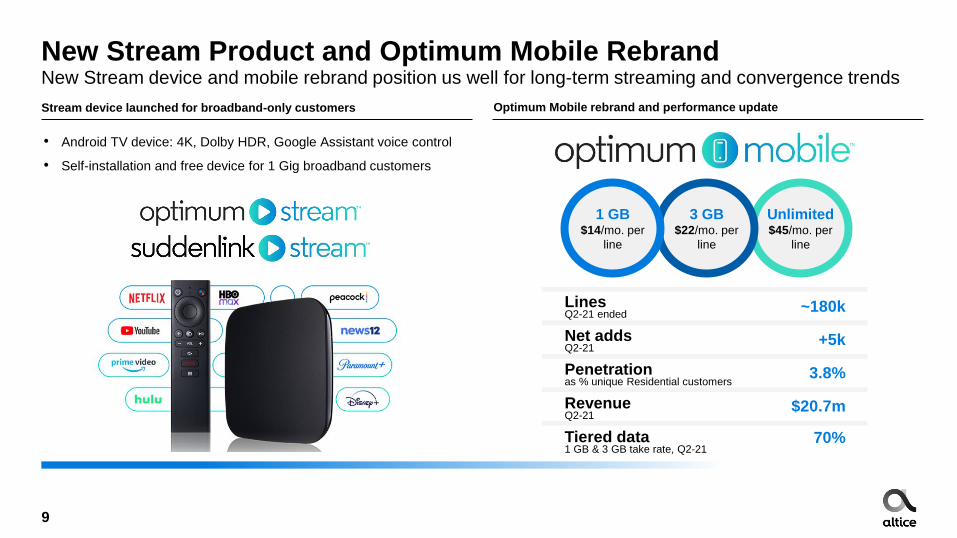
New Stream Product and Optimum Mobile RebrandNew Stream device and mobile rebrand position us well for long-term streaming and convergence trends
• Android TV device: 4K, Dolby HDR, Google Assistant voice control
• Self-installation and free device for 1 Gig broadband customers
~180k
+5k
3.8%
$20.7m
LinesQ2-21 ended
Net addsQ2-21
Penetrationas % unique Residential customers
RevenueQ2-21
Tiered data1 GB & 3 GB take rate, Q2-21
70%
Unlimited$45/mo. per
line
3 GB$22/mo. per
line
1 GB$14/mo. per
line
Stream device launched for broadband-only customers Optimum Mobile rebrand and performance update
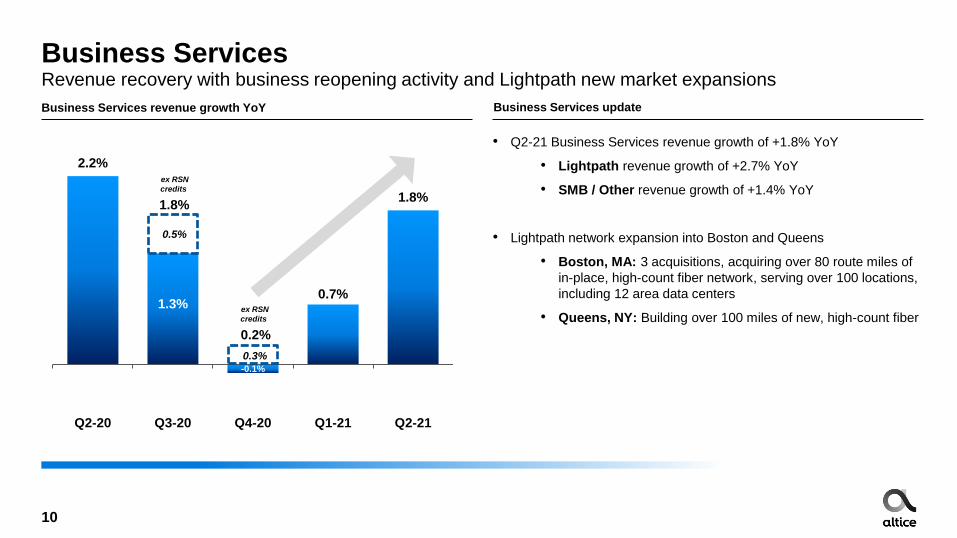
2.2%
1.3%
-0.1%
0.7%
1.8%
Q2-20 Q3-20 Q4-20 Q1-21 Q2-21
10
Business ServicesRevenue recovery with business reopening activity and Lightpath new market expansions
• Q2-21 Business Services revenue growth of +1.8% YoY
• Lightpath revenue growth of +2.7% YoY
• SMB / Other revenue growth of +1.4% YoY
• Lightpath network expansion into Boston and Queens
• Boston, MA: 3 acquisitions, acquiring over 80 route miles of
in-place, high-count fiber network, serving over 100 locations,
including 12 area data centers
• Queens, NY: Building over 100 miles of new, high-count fiber
1.8%
0.2%
0.5%
0.3%
ex RSN
credits
ex RSN
credits
Business Services revenue growth YoY Business Services update

13.0%
2.8%
-15.6%
36.4%
Q2-18 Q2-19 Q2-20 Q2-21
11
News & AdvertisingStrong recovery in Local, Regional, and National with additional Political revenue
• News & Advertising Q2 revenue grew 36.4% YoY
• Local, regional, national and branded advertising showed strong
recovery compared to pandemic-related trough in Q2-20
• Strong political revenue trends in Q2 driven by NY mayoral and NJ
gubernatorial races
News & Advertising quarterly revenue growth YoY News & Advertising trends

12
(1) Adjusted EBITDA and Operating Free Cash Flow (“OpFCF”) are non-GAAP measures. For a reconciliation of these non-GAAP measures to net income (loss) and net cash flows from operating activities, respectively, please see the Second
Quarter 2021 Altice USA earnings release posted to the Altice USA website.
(2) Adjusted EBITDA includes approximately $13.3m of losses related to Altice USA’s mobile business in the current period and $18 .8m in the year-ago period ($5.3m of losses in Q2-19).
Margin TrendsQ2 2021 margins in line with 2019 levels
Adjusted EBITDA and Operating Free Cash Flow (OpFCF) margins(1)
42.7% 42.5%
44.0% 44.7% 43.9%
33.8%32.4% 31.1%
35.4%
31.1%
Q2-17 Q2-18 Q2-19 Q2-20 Q2-21
Adjusted EBITDA margin OpFCF margin
45.8%
ex-mobile(2)44.8%
ex-mobile(2)44.2%
ex-mobile(2)
Benefitted from
one-time savings
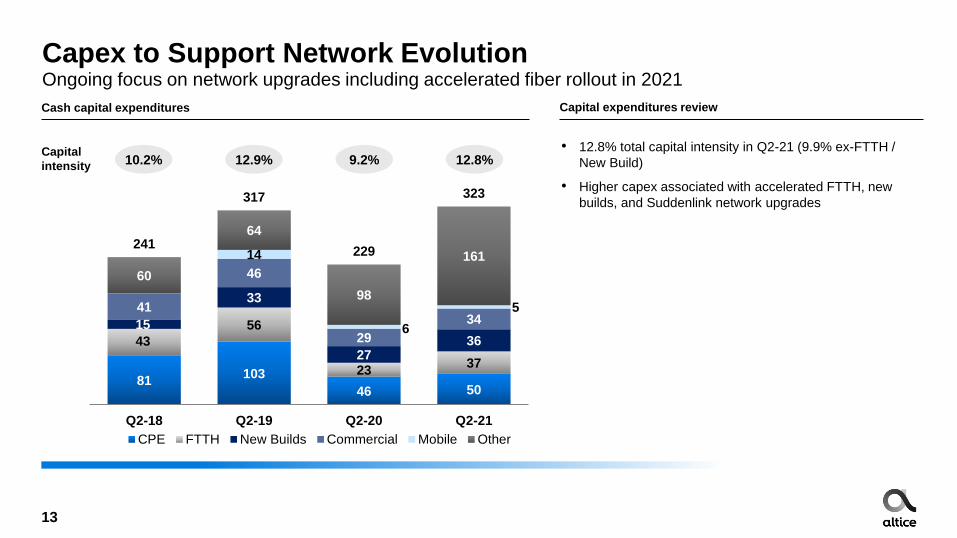
Capex to Support Network Evolution Ongoing focus on network upgrades including accelerated fiber rollout in 2021
• 12.8% total capital intensity in Q2-21 (9.9% ex-FTTH /
New Build)
• Higher capex associated with accelerated FTTH, new
builds, and Suddenlink network upgrades
13
10.2% 12.9% 9.2% 12.8%Capital
intensity
81103
46 50
43
56
2337
15
33
2736
41
46
29
34
14
6
5
60
64
98
161241
317
229
323
Q2-18 Q2-19 Q2-20 Q2-21
CPE FTTH New Builds Commercial Mobile Other
Cash capital expenditures Capital expenditures review

14
Q2 Free Cash Flow GenerationStrong Q2 and YTD Free Cash Flow
1,105
(323)
781
(275)(97) (2)
406
(344)(62)
1
AdjustedEBITDA
Cashcapex
OperatingFree Cash
Flow
Cashinterest
Cashtaxes
Otheroperating
cash flows
Free CashFlow
Otherinvestingactivities
Financingactivities &
FX
Net changein cash
Share
Repurchases:
$222 million
Morris
Broadband
Acquisition:
$312 million
$406m FCF in Q2-21; $943m FCF YTD
Q2-21 Free Cash Flow (FCF) and net change in cash bridge(1)
($m)
(1) Adjusted EBITDA, Operating Free Cash Flow (“OpFCF”), and Free Cash Flow (“FCF”) are non-GAAP measures. For a reconciliation of these non-GAAP measures to net income (loss) and net cash flows from operating activities, respectively,
please see the Second Quarter 2021 Altice USA earnings release posted to the Altice USA website.
(2) Financing activities & FX includes ($222m) of share repurchases, $190m of net borrowing activity, and ($30m) of other financing activities.
(2)

15
Altice USA Consolidated Debt Maturity Profile Long-dated maturities following proactive refinancing activity
Altice USA maturity profile
5.71.0 0.7 0.1 1.2 2.8 1.2 5.1 2.5 1.8 3.0
2021 2022 2023 2024 2025 2026 2027 2028 2029 2030 2031
CSC Term Loans CSC Guaranteed Notes CSC Senior Unsecured Notes
Lightpath Term Loans Lightpath Senior Secured Lightpath Senior Unsecured Notes
Revolver
WACD: 4.7%
WAL: 6.6 years
Fixed rate % of debt: 80%
Liquidity: $2.3bn
Altice USA Consolidated as of 6/30/2021
($bn)
16
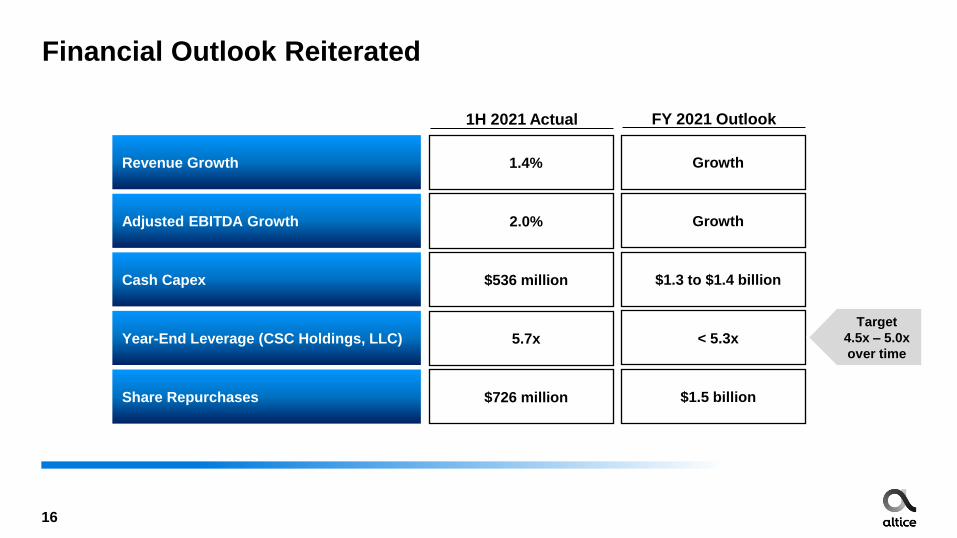
Financial Outlook Reiterated
Revenue Growth
Adjusted EBITDA Growth
Cash Capex
Year-End Leverage (CSC Holdings, LLC)
Share Repurchases
FY 2021 Outlook
Growth
Growth
$1.3 to $1.4 billion
< 5.3x
$1.5 billion
Target
4.5x – 5.0x
over time
1H 2021 Actual
1.4%
2.0%
$536 million
5.7x
$726 million
Q&A
17

Appendix
18
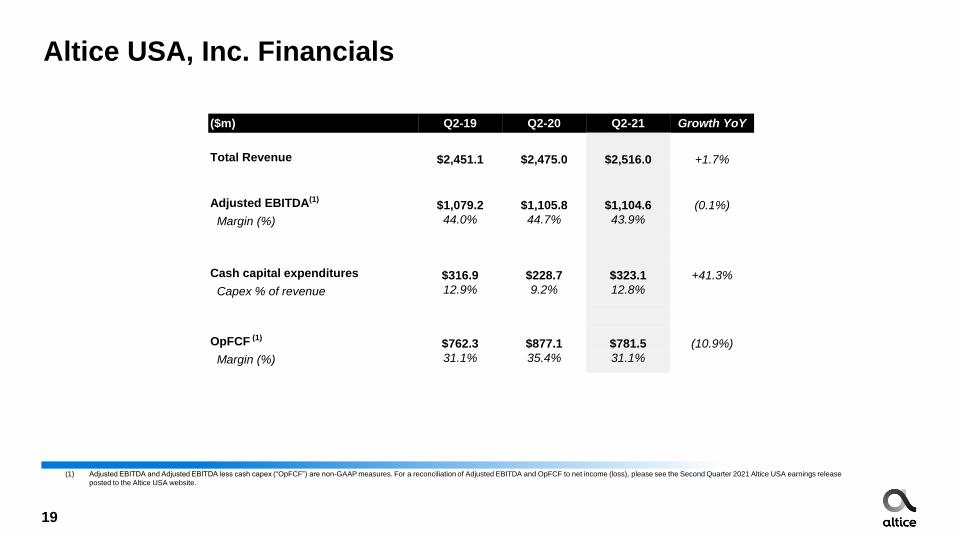
Altice USA, Inc. Financials
($m) Q2-19 Q2-20 Q2-21 Growth YoY
Total Revenue $2,451.1 $2,475.0 $2,516.0 +1.7%
Adjusted EBITDA(1)$1,079.2 $1,105.8 $1,104.6 (0.1%)
Margin (%) 44.0% 44.7% 43.9%
Cash capital expenditures $316.9 $228.7 $323.1 +41.3%
Capex % of revenue 12.9% 9.2% 12.8%
OpFCF (1)$762.3 $877.1 $781.5 (10.9%)
Margin (%) 31.1% 35.4% 31.1%
(1) Adjusted EBITDA and Adjusted EBITDA less cash capex (“OpFCF”) are non-GAAP measures. For a reconciliation of Adjusted EBITDA and OpFCF to net income (loss), please see the Second Quarter 2021 Altice USA earnings release
posted to the Altice USA website.
19


