(Mark One) ANNUAL REPORT PURSUANT TO SECTION 13 OR 15(d) OF THE SECURITIES EXCHANGE
ACT OF 1934 FOR THE FISCAL YEAR ENDED DECEMBER 31, 2013
OR
� � � � TRANSITION REPORT PURSUANT TO SECTION 13 OR 15(d) OF THE SECURITIES EXCHANGE ACT OF 1934 FOR THE TRANSITION PERIOD FROM TO
Commission File Number: 001-34354
Altisource Portfolio Solutions S.A. (Exact name of registrant as specified in its charter)
40, avenue Monterey L-2163 Luxembourg
Grand Duchy of Luxembourg (352) 24 69 79 00
(Address and telephone number, including area code, of registrant’s principal executive offices)
Securities registered pursuant to Section 12(b) of the Act:
Securities registered pursuant to Section 12(g) of the Act:
None
Indicate by check mark if the Registrant is a well-known seasoned issuer, as defined in Rule 405 of the Securities Act. Yes No � Indicate by check mark if the Registrant is not required to file reports pursuant to Section 13 or Section 15(d) of the Act. Yes � No Indicate by check mark whether the Registrant (1) has filed all reports required to be filed by Section 13 or 15(d) of the Securities Exchange
Act of 1934 during the preceding 12 months (or for such shorter period that the Registrant was required to file such reports), and (2) has been subject to such filing requirements for the past 90 days. Yes No �
Indicate by check mark whether the Registrant has submitted electronically and posted on its corporate Website, if any, every Interactive
Data File required to be submitted and posted pursuant to Rule 405 of Regulations S-T (§232.405 of this chapter) during the preceding 12 months (or for such shorter period that the registrant was required to submit and post such files). Yes No �
Indicate by check mark if disclosure of delinquent filers pursuant to Item 405 of Regulation S-K (§229.405 of this chapter) is not contained
herein and will not be contained, to the best of the Registrant’s knowledge, in the definitive proxy or information statements incorporated by reference in Part III of this Form 10-K or any amendment to this Form 10-K.
Indicate by check mark whether the Registrant is a large accelerated filer, an accelerated filer, a non-accelerated filer or a smaller reporting
company. See the definitions of “large accelerated filer,” “accelerated filer” and “smaller reporting company” in Rule 12b-2 of the Exchange Act.
Indicate by check mark whether the Registrant is a shell company (as defined in Rule 12b-2 of the Act). Yes � No The aggregate market value of the voting stock held by nonaffiliates of the registrant as of June 30, 2013 was $1,602,571,543 based on the
Luxembourg (State or other jurisdiction of incorporation or organization)
98-0554932
(I.R.S. Employer Identification No.)
Title of each class Name of each exchange on which registered
Common Stock, $1.00 par value
NASDAQ Global Select Market
Large accelerated filer
Accelerated filer �
Non-accelerated filer �
(Do not check if a smaller reporting company) Smaller reporting company �
closing share price as quoted on the NASDAQ Global Market on that day and the assumption that all directors and executive officers of the Company, and their families, are affiliates. This determination of affiliate status is not necessarily a conclusive determination for any other purpose.
As of January 31, 2014, there were 22,628,618 outstanding shares of the Registrant’s shares of beneficial interest (excluding 2,784,130
shares held as treasury stock).
DOCUMENTS INCORPORATED BY REFERENCE
Portions of the registrant’s Definitive Proxy Statement to be filed subsequent to the date hereof with the Securities and Exchange Commission pursuant to Regulation 14A in connection with the registrant’s Annual Meeting of Stockholders to be held on May 21, 2014 are incorporated by reference into Part III of this Report. Such Definitive Proxy Statement will be filed with the Securities and Exchange Commission not later than 120 days after the conclusion of the registrant’s fiscal year ended December 31, 2013.
Table of Contents
TABLE OF CO NTENTS
Page PART I
ITEM 1. BUSINESS
3
ITEM 1A. RISK FACTORS
9 ITEM 1B. UNRESOLVED STAFF COMMENTS
17
ITEM 2. PROPERTIES
18 ITEM 3. LEGAL PROCEEDINGS
18
ITEM 4. MINE SAFETY DISCLOSURES
18 PART II
ITEM 5. MARKET FOR REGISTRANT’S COMMON EQUITY, RELATED STOCKHOLDER MATTERS AND ISSUER
PURCHASES OF EQUITY SECURITIES
19 ITEM 6. SELECTED FINANCIAL DATA
22
ITEM 7. MANAGEMENT’S DISCUSSION AND ANALYSIS OF FINANCIAL CONDITION AND RESULTS OF OPERATIONS
23 ITEM 7A. QUANTITATIVE AND QUALITATIVE DISCLOSURES ABOUT MARKET RISK
45
ITEM 8. FINANCIAL STATEMENTS AND SUPPLEMENTARY DATA
46 ITEM 9. CHANGES IN AND DISAGREEMENTS WITH ACCOUNTANTS ON ACCOUNTING AND FINANCIAL
DISCLOSURE
81 ITEM 9A. CONTROLS AND PROCEDURES
81
ITEM 9B. OTHER INFORMATION
81 PART III
ITEM 10. DIRECTORS, EXECUTIVE OFFICERS AND CORPORATE GOVERNANCE
82
ITEM 11. EXECUTIVE COMPENSATION
82 ITEM 12. SECURITY OWNERSHIP OF CERTAIN BENEFICIAL OWNERS AND MANAGEMENT AND RELATED
STOCKHOLDER MATTERS
82 ITEM 13. CERTAIN RELATIONSHIPS AND RELATED TRANSACTIONS, AND DIRECTOR INDEPENDENCE
82
ITEM 14. PRINCIPAL ACCOUNTING FEES AND SERVICES
82 PART IV
ITEM 15. EXHIBITS, FINANCIAL STATEMENT SCHEDULES
83
SIGNATURES
89
Table of Contents
FORWARD-LOOKING STATEMENTS
This Annual Report on Form 10-K and certain information incorporated herein by reference contain forward-looking statements within the safe harbor provisions of the Private Securities Litigation Reform Act of 1995. These statements may relate to, among other things, future events or our future performance or financial condition. Words such as “anticipate,” “intend,” “expect,” “may,” “could,” “should,” “would,” “plan,” “estimate,” “believe,” “predict,” “potential,” or “ continue” or the negative of these terms and comparable terminology are intended to identify such forward-looking statements. Forward-looking statements are not guarantees of future performance and involve a number of assumptions, risks and uncertainties that could cause actual results to differ materially. Important factors that could cause actual results to differ materially from those suggested by the forward-looking statements include, but are not limited to, the risks discussed in Item 1A of Part I “Risk Factors.” We caution you not to place undue reliance on these forward-looking statements which reflect our view only as of the date of this report. We are under no obligation (and expressly disclaim any obligation) to update or alter any forward-looking statements contained herein to reflect any change in our expectations with regard thereto or change in events, conditions or circumstances on which any such statement is based.
PART I
Except as otherwise indicated or unless the context requires otherwise, “Altisource,” “we,” “us,” “our” and the “Company” refer to Altisource Portfolio Solutions S.A., a Luxembourg société anonyme, or public limited company, and its wholly-owned subsidiaries. ITEM 1. BUSINESS The Company Altisource , together with its subsidiaries, is a premier marketplace and transaction solutions provider for the real estate, mortgage and consumer debt industries offering both distribution and content. We leverage proprietary business process, vendor and electronic payment management software and behavioral science based analytics to improve outcomes for marketplace participants. We are publicly traded on the NASDAQ Global Select Market under the symbol “ASPS.” We are incorporated under the laws of Luxembourg. On August 10, 2009, we became a stand-alone public company in connection with our separation from Ocwen Financial Corporation (“Ocwen”) (the “Separation from Ocwen”). Prior to our Separation from Ocwen , our businesses were wholly-owned subsidiaries of Ocwen. 2013 Highlights Our 2013 highlights include:
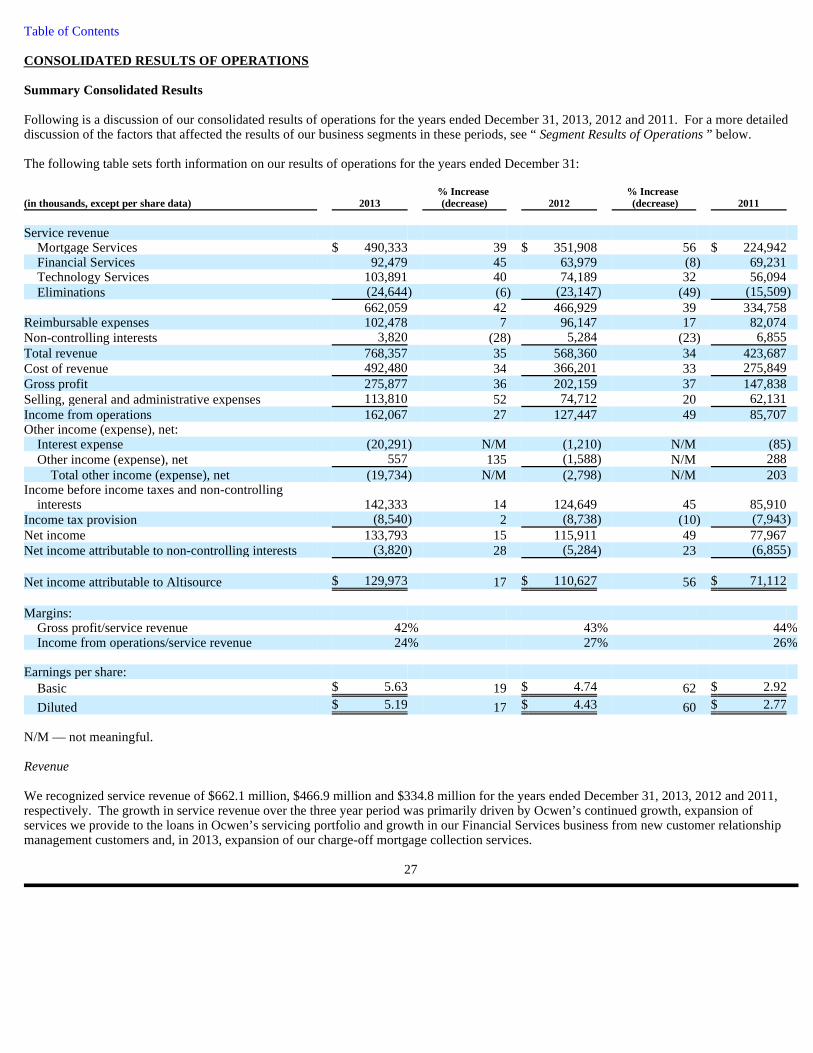
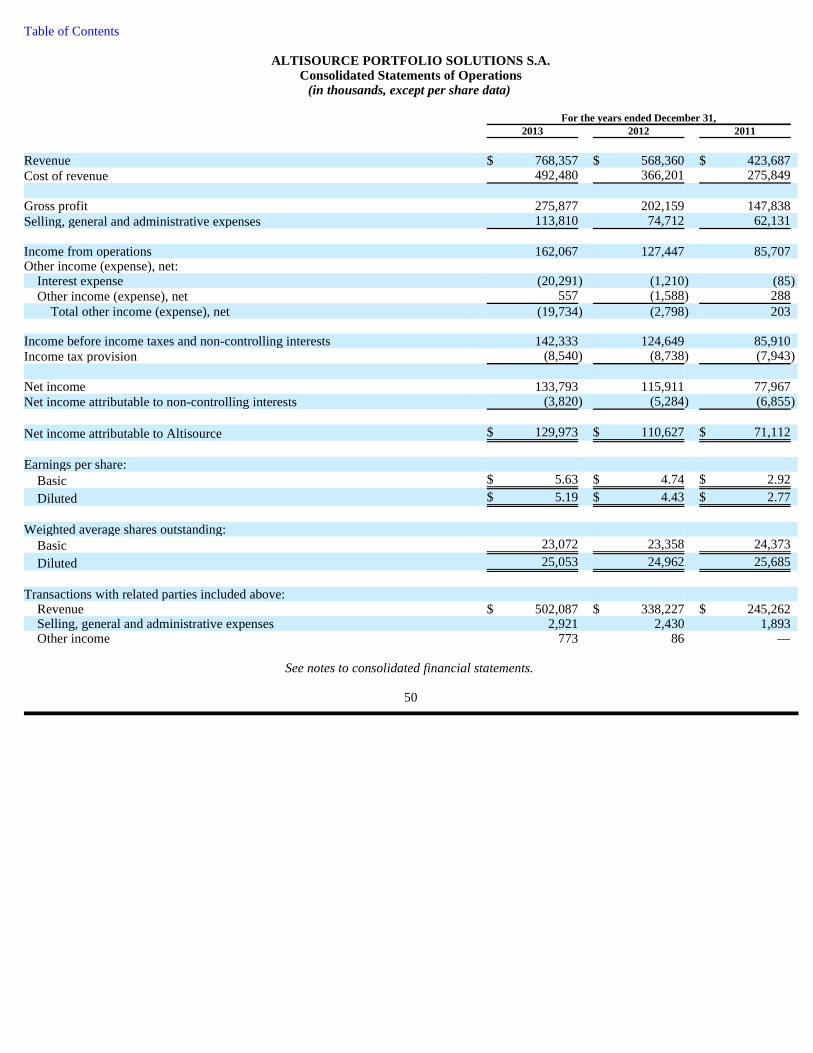
• Recognized revenue of $768.4 million, a 35% increase compared to the year ended December 31, 2012; • Recognized service revenue of $662.1 million, a 42% increase compared to the year ended December 31, 2012; • Recognized diluted earnings per share of $5.19, a 17% increase compared to the year ended December 31, 2012; • Generated cash flows from operations of $185.5 million, a 59% increase compared to the year ended December 31, 2012; • The average number of loans serviced by Ocwen on REALServicing totaled 1.2 million, a 57% increase compared to the year ended
December 31, 2012; • On November 15, 2013, we acquired Equator, LLC (“Equator”), a national leader in mortgage and real estate related business process
management solutions, for an initial purchase price of $63.4 million plus 3
®
®
Table of Contents contingent earn-out consideration of up to an additional $80 million over three years, subject to Equator achieving annual performance targets;
• On March 29, 2013, we completed the acquisition of the Homeward Residential, Inc. (“Homeward”) fee-based businesses from Ocwen
for an aggregate purchase price of $75.8 million; • On April 12, 2013, we completed the Residential Capital, LLC (“ResCap”) fee-based business transaction with Ocwen for an aggregate
purchase price of $128.8 million; • On May 7, 2013, we increased borrowings under our senior secured term loan agreement to $400 million. Furthermore, on
December 9, 2013, we refinanced the senior secured term loan which included, among other changes, lowering the interest rate of the term loans and
• We repurchased 1.2 million shares of our common stock under our stock repurchase program during the year ended December 31,
2013 at an average price of $116.99 per share.
Reportable Segments We classify our businesses into the following three reportable segments: Mortgage Services : Provides services that span the mortgage and real estate lifecycle and are typically outsourced by loan servicers, originators and investors in single family homes. We provide these services primarily for loan portfolios serviced by Ocwen. We also have longstanding relationships with some of the leading capital markets firms, commercial banks, hedge funds, insurance companies and mortgage bankers. Within the Mortgage Services segment, we provide the following services:
Asset management — Asset management services principally include property preservation, property inspection, real estate owned (“REO”) asset management, our consumer real estate portal - Hubzu and REO brokerage services. We also provide property management, lease management and renovation management services for single family rental properties.
Insurance services — Insurance services include an array of title insurance services, including pre-foreclosure and REO title searches,
title commitments, settlement and escrow services and other title insurance services including title insurance for loan originations. We also provide insurance program management and insurance agency and brokerage services applicable to lenders and residential loan servicers.
Residential property valuation — Residential property valuation services principally include traditional appraisal products through our
licensed appraisal management company and alternative valuation products primarily through our network of real estate professionals. We generally provide these services for loan servicers, lenders and investors in single family homes.
Default management services — Default management services principally include foreclosure trustee services for loan servicers and
non-legal processing and related services for and under the supervision of foreclosure, bankruptcy and eviction attorneys. Origination management services — Origination management services principally include Mortgage Partnership of America, L.L.C.
(“MPA”) and our contract underwriting and quality control businesses. MPA serves as the manager of Best Partners Mortgage Cooperative, Inc. (“BPMC”), which is referred to as the Lenders One Mortgage Cooperative (“Lenders One”), a national alliance of independent mortgage bankers that provides its members with education and training along with revenue enhancing, cost reducing and market share expanding opportunities. We provide other origination related services in the residential property valuation business. In addition, some of the origination related reseller businesses, including the flood certification business, are included in the Technology Services REALSuite business.
4
®
Table of Contents
Financial Services : Provides collection and customer relationship management services primarily to debt originators and servicers (e.g., credit card, auto lending, retail credit and mortgage) and the utility and insurance industries. Within the Financial Services segment, we provide the following services:
Asset recovery management — Asset recovery management principally includes post-charge-off debt collection services on a contingency fee basis.
Customer relationship management — Customer relationship management principally includes customer care and early stage
collections services as well as insurance and claims processing, call center services and analytical support.
Technology Services : Comprises our REALSuite of software applications, Equator’s software applications and our information technology (“IT”) infrastructure services. We currently provide our IT infrastructure services to Ocwen and its subsidiaries, Home Loan Servicing Solutions, Ltd. (“HLSS”), Altisource Residential Corporation (“Residential”), Altisource Asset Management Company (“AAMC”) and our other segments. The REALSuite platform provides a fully integrated set of software applications and technologies that manage the end-to-end lifecycle for residential and commercial mortgage loan servicing including the automated management and payment of a distributed network of vendors. A brief description of the key REALSuite and Equator’s software products is below:
REALServicing — An enterprise residential mortgage loan servicing product that offers an efficient and effective platform for loan servicing including default administration. This technology solution features automated workflows and robust reporting capabilities. The solution spans the loan servicing lifecycle from loan boarding to satisfaction including all collections, payment processing and reporting. We also offer the REALSynergy enterprise commercial loan servicing system.
REALTrans — A patented electronic business-to-business exchange that automates and simplifies the ordering, tracking and fulfilling
of vendor provided services principally related to mortgages. This technology solution, whether web-based or integrated into a servicing system, connects multiple service providers through a single platform and forms an efficient method for managing a large scale network of vendors.
REALRemit — A patented electronic invoicing and payment system that provides vendors with the ability to submit invoices
electronically for payment and to have invoice payments deposited directly to their respective bank accounts.
REALDoc — A correspondence management platform that extracts, stores and generates correspondence and is capable of integrating with commercially available servicing, origination and process management applications.
Equator’s Solutions — The EQ Workstation , EQ Marketplace , EQ Midsource and EQ Portal™ platforms can be used a la carte
or together as an end-to-end solution. EQ Workstation provides comprehensive, end-to-end workflow and transaction services to manage real estate related activities. EQ Marketplace provides a coordinated means of purchasing a variety of real estate services from vendors including realtors, title, closing, inspection and valuation. EQ Midsource allows users of EQ Workstation to outsource all or specific components of real estate related activities. EQ Portal provides realtors direct access to process real estate transactions with secure exchange of data and documents along with realtor marketing, training and certification.
5
®
®
®
®
®
® ® ®
Table of Contents
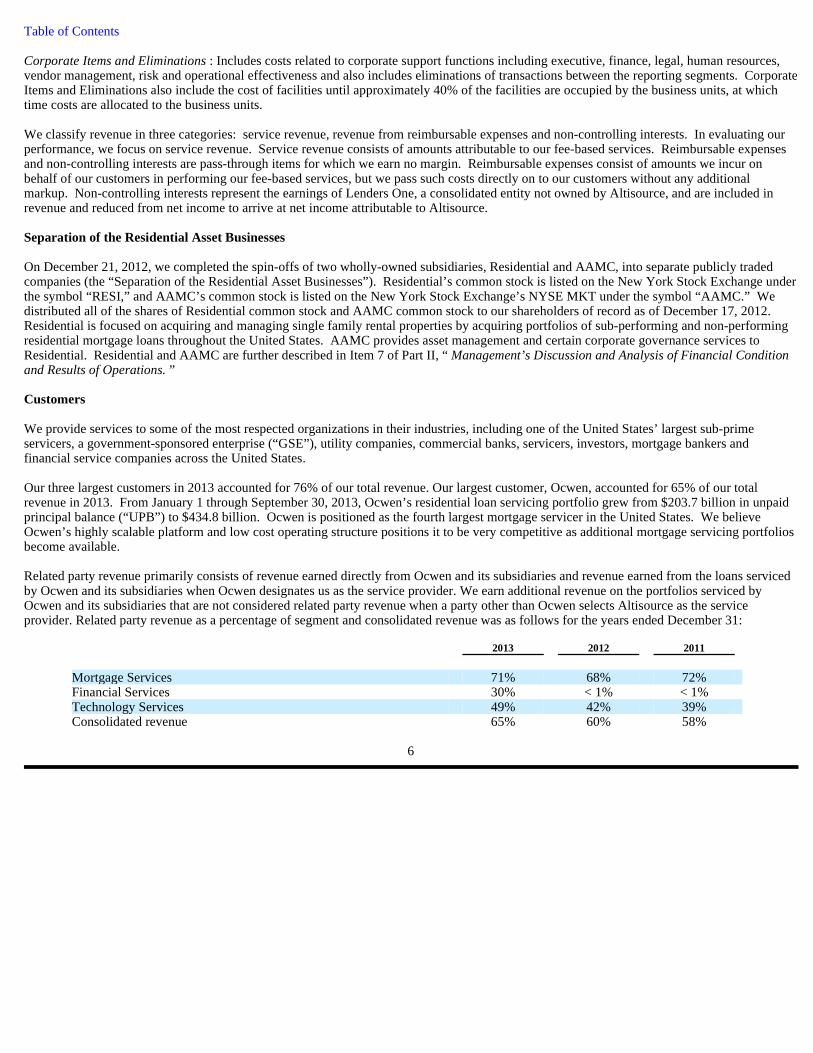
Corporate Items and Eliminations : Includes costs related to corporate support functions including executive, finance, legal, human resources, vendor management, risk and operational effectiveness and also includes eliminations of transactions between the reporting segments. Corporate Items and Eliminations also include the cost of facilities until approximately 40% of the facilities are occupied by the business units, at which time costs are allocated to the business units. We classify revenue in three categories: service revenue, revenue from reimbursable expenses and non-controlling interests. In evaluating our performance, we focus on service revenue. Service revenue consists of amounts attributable to our fee-based services. Reimbursable expenses and non-controlling interests are pass-through items for which we earn no margin. Reimbursable expenses consist of amounts we incur on behalf of our customers in performing our fee-based services, but we pass such costs directly on to our customers without any additional markup. Non-controlling interests represent the earnings of Lenders One, a consolidated entity not owned by Altisource, and are included in revenue and reduced from net income to arrive at net income attributable to Altisource. Separation of the Residential Asset Businesses On December 21, 2012, we completed the spin-offs of two wholly-owned subsidiaries, Residential and AAMC, into separate publicly traded companies (the “Separation of the Residential Asset Businesses”). Residential’s common stock is listed on the New York Stock Exchange under the symbol “RESI,” and AAMC’s common stock is listed on the New York Stock Exchange’s NYSE MKT under the symbol “AAMC.” We distributed all of the shares of Residential common stock and AAMC common stock to our shareholders of record as of December 17, 2012. Residential is focused on acquiring and managing single family rental properties by acquiring portfolios of sub-performing and non-performing residential mortgage loans throughout the United States. AAMC provides asset management and certain corporate governance services to Residential. Residential and AAMC are further described in Item 7 of Part II, “ Management’s Discussion and Analysis of Financial Condition and Results of Operations. ” Customers We provide services to some of the most respected organizations in their industries, including one of the United States’ largest sub-prime servicers, a government-sponsored enterprise (“GSE”), utility companies, commercial banks, servicers, investors, mortgage bankers and financial service companies across the United States. Our three largest customers in 2013 accounted for 76% of our total revenue. Our largest customer, Ocwen, accounted for 65% of our total revenue in 2013. From January 1 through September 30, 2013, Ocwen’s residential loan servicing portfolio grew from $203.7 billion in unpaid principal balance (“UPB”) to $434.8 billion. Ocwen is positioned as the fourth largest mortgage servicer in the United States. We believe Ocwen’s highly scalable platform and low cost operating structure positions it to be very competitive as additional mortgage servicing portfolios become available. Related party revenue primarily consists of revenue earned directly from Ocwen and its subsidiaries and revenue earned from the loans serviced by Ocwen and its subsidiaries when Ocwen designates us as the service provider. We earn additional revenue on the portfolios serviced by Ocwen and its subsidiaries that are not considered related party revenue when a party other than Ocwen selects Altisource as the service provider. Related party revenue as a percentage of segment and consolidated revenue was as follows for the years ended December 31:
6
2013 2012
2011
Mortgage Services
71% 68%
72%
Financial Services 30%
< 1% < 1%
Technology Services
49% 42%
39%
Consolidated revenue 65%
60% 58%
Table of Contents
We record revenue we earn from Ocwen and its subsidiaries under various long-term servicing contracts at rates we believe to be market rates as they are consistent with one or more of the following: the fees we charge to other customers for comparable services; the fees Ocwen pays to other service providers; and fees charged by our competitors. Our services are provided to customers primarily located in the United States. Financial information for our segments can be found in Note 22 to our consolidated financial statements. Sales and Marketing We have experienced sales personnel and relationship managers with subject matter expertise. These individuals maintain relationships throughout the industry sectors we serve and play an important role in generating new client leads as well as identifying opportunities to expand our services with existing clients. Additional leads are also generated through requests for proposal processes from key industry participants. Our sales team works collaboratively and is compensated principally with a base salary and commission for sales generated. Our primary sales and marketing focus is supporting the growth of Ocwen and its subsidiaries, expanding relationships with MPA’s members and Equator customers and targeting new customers that could have a material positive impact on our results of operations. Given the highly concentrated nature of the industries we serve, the time and effort spent in expanding relationships or winning new relationships is significant. Intellectual Property We rely on a combination of contractual restrictions, internal security practices, patents, trademarks, copyrights, trade secrets and other intellectual property to establish and protect our software, technology and expertise. We also own or, as necessary and appropriate, have obtained licenses from third parties to intellectual property relating to our services, processes and business. These intellectual property rights are important factors in the success of our businesses. As of December 31, 2013, we have been awarded one patent that expires in 2023, three patents that expire in 2024, six patents that expire in 2025, one patent that expires in 2027 and one patent that expires in 2030. In addition, we have registered trademarks, or recently filed applications for registration of trademarks, in a number of countries or groups of countries including the United States, the European Community, India and in eight other countries or groups of countries. These trademarks generally can be renewed indefinitely, provided they are being used. We actively protect our rights and intend to continue our policy of taking all measures we deem reasonable and necessary to develop and protect our patents, trademarks, copyrights, trade secrets and other intellectual property rights. Industry and Competition The industry verticals in which we engage are highly competitive and generally consist of a few national vendors as well as a large number of regional, local and in-house providers resulting in a fragmented market with disparate service offerings. From an overall perspective, we compete with global business process outsourcing firms. Our Mortgage Services segment competes with national and regional third party service providers and in-house servicing operations of large mortgage lenders and servicers. Our Financial Services segment competes with other large receivables management companies as well as a fragmented group of smaller companies and law firms focused on collections. Our Technology Services segment competes with data processing and software development companies and in-house technology and software operations of other loan servicers. Given the diverse nature of services we and our competitors offer, we cannot determine our position in the market with certainty, but we believe we represent only a small portion of very large-sized markets. Given our size, some of our competitors may offer more diversified services, operate in broader geographic markets or have greater financial resources than we do. In addition, some of our larger customers retain multiple providers and continuously evaluate our performance against our competitors.
7
Table of Contents
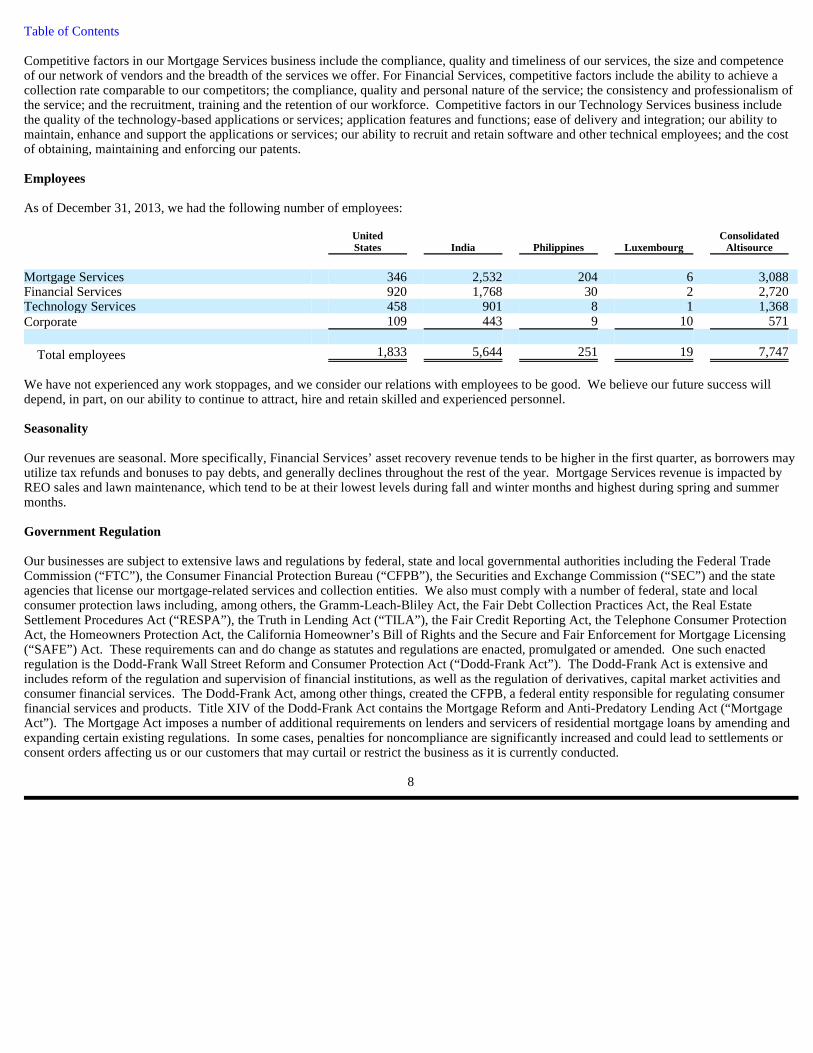
Competitive factors in our Mortgage Services business include the compliance, quality and timeliness of our services, the size and competence of our network of vendors and the breadth of the services we offer. For Financial Services, competitive factors include the ability to achieve a collection rate comparable to our competitors; the compliance, quality and personal nature of the service; the consistency and professionalism of the service; and the recruitment, training and the retention of our workforce. Competitive factors in our Technology Services business include the quality of the technology-based applications or services; application features and functions; ease of delivery and integration; our ability to maintain, enhance and support the applications or services; our ability to recruit and retain software and other technical employees; and the cost of obtaining, maintaining and enforcing our patents. Employees As of December 31, 2013, we had the following number of employees:
We have not experienced any work stoppages, and we consider our relations with employees to be good. We believe our future success will depend, in part, on our ability to continue to attract, hire and retain skilled and experienced personnel. Seasonality Our revenues are seasonal. More specifically, Financial Services’ asset recovery revenue tends to be higher in the first quarter, as borrowers may utilize tax refunds and bonuses to pay debts, and generally declines throughout the rest of the year. Mortgage Services revenue is impacted by REO sales and lawn maintenance, which tend to be at their lowest levels during fall and winter months and highest during spring and summer months. Government Regulation Our businesses are subject to extensive laws and regulations by federal, state and local governmental authorities including the Federal Trade Commission (“FTC”), the Consumer Financial Protection Bureau (“CFPB”), the Securities and Exchange Commission (“SEC”) and the state agencies that license our mortgage-related services and collection entities. We also must comply with a number of federal, state and local consumer protection laws including, among others, the Gramm-Leach-Bliley Act, the Fair Debt Collection Practices Act, the Real Estate Settlement Procedures Act (“RESPA”), the Truth in Lending Act (“TILA”), the Fair Credit Reporting Act, the Telephone Consumer Protection Act, the Homeowners Protection Act, the California Homeowner’s Bill of Rights and the Secure and Fair Enforcement for Mortgage Licensing (“SAFE”) Act. These requirements can and do change as statutes and regulations are enacted, promulgated or amended. One such enacted regulation is the Dodd-Frank Wall Street Reform and Consumer Protection Act (“Dodd-Frank Act”). The Dodd-Frank Act is extensive and includes reform of the regulation and supervision of financial institutions, as well as the regulation of derivatives, capital market activities and consumer financial services. The Dodd-Frank Act, among other things, created the CFPB, a federal entity responsible for regulating consumer financial services and products. Title XIV of the Dodd-Frank Act contains the Mortgage Reform and Anti-Predatory Lending Act (“Mortgage Act”). The Mortgage Act imposes a number of additional requirements on lenders and servicers of residential mortgage loans by amending and expanding certain existing regulations. In some cases, penalties for noncompliance are significantly increased and could lead to settlements or consent orders affecting us or our customers that may curtail or restrict the business as it is currently conducted.
8
United Consolidated
States
India Philippines
Luxembourg Altisource
Mortgage Services
346 2,532
204 6
3,088
Financial Services 920
1,768 30
2 2,720
Technology Services
458 901
8 1
1,368
Corporate 109
443 9
10 571
Total employees 1,833
5,644 251
19 7,747
Table of Contents
We are subject to certain federal, state and local consumer protection provisions. We are also subject to licensing and regulation as a mortgage service provider and/or debt collector in a number of states. We are subject to audits and examinations that are conducted by the states. Our employees may be required to be licensed by various state commissions for the particular type of service delivered and to participate in regular continuing education programs. From time to time, we receive requests from state and other agencies for records, documents and information regarding our policies, procedures and practices regarding our mortgage services and debt collection business activities. We are also subject to the requirements of the Foreign Corrupt Practices Act (“FCPA”) and comparable foreign laws, due to our activities in foreign jurisdictions. Available Information We file Annual Reports on Form 10-K, Quarterly Reports on Form 10-Q, Current Reports on Form 8-K and other information with the SEC. These filings are available to the public over the Internet at the SEC’s website at http://www.sec.gov . You may also read and copy any document we file at the SEC’s public reference room located at 100 F Street, N.E., Washington, DC 20549. Please call the SEC at 1-800-SEC-0330 for further information on the public reference room. Our principal Internet address is www.altisource.com and we encourage investors to use it as a way of easily finding information about us. We promptly make the reports we file or furnish with the SEC, corporate governance information (including our Code of Business Conduct and Ethics), select press releases and other related information available on this website. The contents of our website are available for informational purposes only and shall not be deemed incorporated by reference in this report. ITEM 1A. RISK FACTORS The following risk factors and other information included in this Annual Report on Form 10-K should be carefully considered. The risks and uncertainties described below are not the only ones we face. Additional risks and uncertainties not presently known to us or that we presently deem less significant may also impair our business operations. If any of the following risks actually occur, our business, operating results and financial condition could be materially adversely affected. Risks Related to Our Business and Industry Our continuing relationship with Ocwen may inhibit our ability to obtain and retain other customers that compete with Ocwen. As of December 31, 2013, our Chairman owns or controls more than 13% of Ocwen’s common stock and 26% of our common stock. We derived 65% of our 2013 revenue from Ocwen and its subsidiaries. Given this close and continuing relationship with Ocwen, we may encounter difficulties in obtaining and retaining other customers who compete with Ocwen. Should these and other potential customers view Altisource as part of Ocwen or as too closely related to or dependent upon Ocwen, they may be unwilling to utilize our services, and our growth could be inhibited as a result. We are dependent on a certain key customer relationship, the loss of which or reduction in the size of which could affect our business and results of operations. We currently generate approximately 65% of our revenue from Ocwen and its subsidiaries. Ocwen is contractually obligated to purchase certain services from our Mortgage Services, Financial Services and Technology Services segments under service agreements that extend through August 2025 subject to termination under certain provisions. The loss of Ocwen as a customer or their failure to pay us would significantly reduce our revenue and adversely affect our results of operations. Further, Ocwen has grown significantly in recent years through acquisitions of mortgage servicing rights and acquisitions of companies with mortgage servicing rights and mortgage origination platforms. As a result of Ocwen’s growth, we have grown. If Ocwen does not continue to acquire mortgage
9
Table of Contents servicing rights or does not grow its mortgage origination business, our business and results of operations could be negatively impacted. Significant regulatory scrutiny of foreclosure practices of the servicing industry has resulted in settlements between banks and servicers and government entities, on-going monitoring of banks and servicers by regulatory authorities, investigations of banks and servicers and private lawsuits. If Ocwen were to be negatively impacted in a significant way by this regulatory scrutiny or other actions, Altisource’s business and results of operations could be negatively impacted. We have key customer relationships, other than Ocwen, the loss of which could affect our business and results of operations. While no individual client, other than Ocwen, represents more than 10% of our consolidated revenue, we are exposed to customer concentration. Most of our customers are not contractually obligated to continue to use our services at historical levels or at all. The loss of any of these key customers or their failure to pay us could reduce our revenue and adversely affect results of operations. The strength of the economy and the housing market can affect demand for our services. The performance and growth of our origination services business is dependent on the volume of loan originations by third parties. In the event of an economic slowdown, increase in interest rates or any other factor that would likely lead to a decrease in the level of origination transactions, including refinancing transactions, our origination services growth prospects could be adversely affected. Further, in the event that adverse economic conditions or other factors lead to a decline in levels of home ownership and a reduction in the aggregate number of United States mortgage loans outstanding, our revenues from our software applications could be adversely affected. Our business is subject to substantial competition. The markets for our services are very competitive. Our competitors vary in size and in the scope and breadth of the services they offer. We compete for existing and new customers against both third parties and the in-house capabilities of our customers. Some of our competitors have substantial resources and some have widely used technology platforms which they seek to use as a competitive advantage to drive sales of other products and services. In addition, we expect the markets in which we compete will continue to attract new competitors and new technologies. These new technologies may render our existing technologies obsolete, resulting in operating inefficiencies and increased competitive pressure. There can be no assurance we will be able to compete successfully against current or future competitors or that competitive pressures we face in the markets in which we operate will not materially adversely affect our business, financial condition and results of operations.
Our intellectual property rights are valuable and any inability to protect them or challenges to our right to use them could reduce the value of our services or increase our costs. Our patents, trademarks, trade secrets, copyrights and other intellectual property rights are important assets. The efforts we have taken to protect these proprietary rights may not be sufficient or effective. The unauthorized use of our intellectual property or significant impairment of our intellectual property rights could harm our business, make it more expensive to do business or hurt our ability to compete. Protecting our intellectual property rights is costly and time consuming. Although we seek to obtain patent protection for our innovations, it is possible we may not be able to protect some of these innovations. Changes in patent law, such as changes in the law regarding patentable subject matter, can also impact our ability to obtain patent protection for our innovations. In addition, given the costs of obtaining patent protection, we may choose not to protect certain innovations that later turn out to be important. Furthermore, there is always the possibility, despite our efforts, that the scope of the protection gained will be insufficient or an issued patent may be deemed invalid or unenforceable.
10
Table of Contents
Further, as our technology solutions and services develop, we may become increasingly subject to infringement claims by others. Any claims, whether with or without merit, could:
• be expensive and time-consuming to defend; • cause us to cease making, licensing or using technology solutions that incorporate the challenged intellectual property; • require us to redesign our technology solutions, if feasible; • divert management’s attention and resources and/or • require us to enter into royalty or licensing agreements in order to obtain the right to use necessary technologies.
Technology failures or defects, development delays or installation difficulties could damage our business operations and increase our costs. Disruptions, failures or defects in our technology or delays in the development of, or installation difficulties with, our next generation technology may interrupt or delay our ability to provide services to our customers. Any sustained and repeated disruptions in these services may have an adverse impact on our and our customers’ results of operations. As part of our business and operation of our technology, we electronically receive, process, store and transmit confidential and sensitive business information of our customers. In addition, we collect personal consumer data such as names and addresses, social security numbers, driver’s license numbers and payment history records. The secure transmission of this information over the Internet is essential to maintaining consumer confidence. Security breaches and acts of vandalism could result in a compromise or breach of the technology we use to protect our customers’ business and personal information and transaction data and could result in the assessment of penalties or could otherwise cause interruptions in our operations. Furthermore, Congress or individual states could enact new laws regulating electronic commerce that could adversely affect us and our results of operations. We have a long sales cycle for many of our services and technology solutions and if we fail to close sales after expending significant time and resources to do so, our business, financial condition and results of operations may be adversely affected. We may experience a long sales cycle for developing certain services. We may expend significant time and resources in pursuing a particular service or customer that does not generate revenue. In addition, many of our services in the Technology Services segment are based on sophisticated software and computing systems with long sales cycles. We may encounter delays when developing new technology solutions and services. We may experience difficulties in installing or integrating our technologies on platforms used by our customers. Further, defects in our technology solutions, errors or delays in the processing of electronic transactions or other difficulties could result in interruption of business operations, delay in market acceptance, additional development and remediation costs, loss of customers, negative publicity or exposure to liability claims. Delays due to the length of our sales cycle or costs incurred that do not result in sales could have a material adverse effect on our business, financial condition or results of operations. Our business is subject to extensive regulation, and failure to comply with existing or new regulations may adversely impact us. Our business is subject to extensive regulation by federal, state and local governmental authorities including the FTC, the CFPB, the SEC and the state and local agencies that license or oversee certain of our mortgage related services, including insurance services, and collection services. We also must comply with a number of federal, state and local consumer protection laws including, among others, the Gramm-Leach-Bliley Act, the Fair Debt Collection Practices Act, RESPA, TILA, the Fair Credit Reporting Act, the Telephone Consumer Protection Act, the Homeowners Protection Act, the California Homeowner’s Bill of Rights, the SAFE Act, the Mortgage Act and the FCPA. These requirements can and do change as statutes and regulations are enacted, promulgated or amended.
11
Table of Contents
The ongoing economic uncertainty and troubled housing market have resulted in increased regulatory scrutiny of all participants involved in the mortgage industry. This scrutiny has included federal and state governmental agency review of all aspects of the mortgage lending and servicing industries, including an increased legislative and regulatory focus on consumer protection practices. One such enacted regulation is the Dodd-Frank Act (see further description in the “ Government Regulation” section in Item 1 of Part I, “Business” ). In some cases, penalties for noncompliance are significantly increased and could lead to settlements or consent orders on us, or our customers, that may curtail or restrict our business as it is currently conducted. We are subject to certain additional federal, state and local consumer protection regulations. We also are subject to licensing and regulation as a mortgage services provider, mortgage origination underwriter, valuation provider, appraisal management company, asset manager, property manager, title insurance agency, other insurance related services, agent and provider, real estate broker and/or debt collector in a number of states. We are subject to audits and examinations that are conducted by the states in which we do business. Our employees and subsidiaries may be required to be licensed by various state commissions for the particular type of service sold and to participate in regular continuing education programs. From time to time, we receive requests from state and other agencies for records, documents and information regarding our policies, procedures and practices for our mortgage services and debt collection business activities. We incur significant ongoing costs to comply with governmental regulations. As a result of increased federal and state governmental scrutiny of the mortgage industry, legislation has been enacted to address the mortgage market, with particular focus on loans that are in default. In addition, national servicing standards have been implemented that, among other things, require very specific loan modification and foreclosure procedures to be followed. This legislation and these standards have further reduced the number of loans entering the foreclosure process and have negatively impacted our default services revenue and profit. It is unclear when or if volumes will increase in the future. The volume of new or modified laws and regulations has increased in recent years and, in addition, some individual municipalities have begun to enact laws that restrict mortgage services activities. If regulators impose new or more restrictive requirements, we may incur significant additional costs to comply with such requirements which could further adversely affect our results of operations or financial condition. In addition, our failure to comply with these laws and regulations can possibly lead to civil and criminal liability, loss of licensure, damage to our reputation in the industry, fines and penalties and litigation, including class action lawsuits or administrative enforcement actions. Any of these outcomes could harm our results of operations or financial condition. If we fail to comply with privacy regulations imposed on providers of services to financial institutions, our business could be harmed. As a provider of services to financial institutions, we are bound by the same limitations on disclosure of the information we receive from their customers that apply to the financial institutions themselves. If we fail to comply with these regulations, we could be exposed to lawsuits or to governmental proceedings, our customer relationships and reputation could be harmed and we could be inhibited in our ability to obtain new customers. In addition, the adoption of more restrictive privacy laws or rules in the future on the federal or state level could have an adverse impact on us by increasing our costs or requiring changes in our services. Our customers are subject to government regulation, requiring our customers to, among other things, oversee their vendors and maintain documentation that demonstrates their oversight. If our performance does not meet our customers’ standards, our results of operations could be adversely affected. Our customers are subject to a variety of government regulations, including those promulgated by the CFPB. Certain regulations require our customers to oversee their vendors and document the procedures performed to demonstrate that oversight. Altisource, as a vendor, is subject to oversight by our customers. If we do not meet the standards established by our customers or if any other oversight procedures result in a negative outcome for Altisource, we may lose customers or may no longer be granted referrals for certain services, negatively impacting our business and results of operations.
12
Table of Contents
We rely on third party vendors for many aspects of our business. If our vendor oversight process is ineffective or we face difficulties managing our relationships with third party vendors, our results of operations could be adversely affected. We rely on third party vendors to provide goods and services in relation to many aspects of our operations. Our dependence on these vendors makes our operations vulnerable to such third parties’ failure to perform adequately under our contracts with them. In addition, where a vendor provides services that we are required to provide under a contract with a client, we are responsible for such performance and could be held accountable by the client for any failure of performance by our vendors. We evaluate the competency and solvency of our third party vendors. Additionally, we perform ongoing vendor oversight activities to identify any performance or other issues related to these vendors. If a vendor fails to provide the services that we require or expect, or fails to meet contractual requirements, such as service levels or compliance with applicable laws, the failure could negatively impact our business by adversely affecting our ability to serve our customers and/or subjecting us to litigation and regulatory risk for ineffective vendor oversight. Such a failure could adversely affect the reliability and quality of the services we provide our customers and could adversely affect our results of operations. If financial institutions at which we hold escrow and trust funds fail, it could have a material adverse impact on our company. We hold customers’ assets in escrow and trust accounts at various financial institutions, pending completion of certain real estate activities. We also hold cash in trust accounts at various financial institutions where contractual obligations mandate maintaining dedicated bank accounts for Financial Services collections. These amounts are held in escrow and trust accounts for limited periods of time and are not included in the accompanying consolidated balance sheets. We may become liable for funds owed to third parties as a result of the failure of one or more of these financial institutions, and there is no guarantee we would recover the funds deposited, whether through Federal Deposit Insurance Corporation coverage, private insurance or otherwise.
We may be subject to claims of legal violations or wrongful conduct which may cause us to pay unexpected litigation costs or damages or modify our products or processes. From time to time, we may be subject to costly and time-consuming legal proceedings that claim legal violations or wrongful conduct. These lawsuits may involve clients, our clients’ customers, vendors, competitors and/or other large groups of plaintiffs and, if resulting in findings of violations, could result in substantial damages. Alternatively, we may be forced to settle some claims out of court and change existing company practices, services and processes that are currently revenue generating. This could lead to unexpected costs or a loss of revenue. Our debt makes us more sensitive to the effects of economic change; our level of debt and provisions in our debt agreements could limit our ability to react to changes in the economy or our industry. Our debt makes us more vulnerable to changes in our results of operations because a portion of our cash flows from operations is dedicated to servicing our debt and is not available for other purposes. Additionally, increases in interest rates will negatively impact our cash flows as the interest on our debt is variable. The provisions of our debt agreement could have other negative consequences to us including the following:
• limiting our ability to borrow money for our working capital, capital expenditure, debt service requirements or other general corporate purposes;
• limiting our flexibility in planning for, or reacting to, changes in our operations, our business or the industry in which we compete and • placing us at a competitive disadvantage by limiting our ability to invest in the business.
Our ability to make payments on our indebtedness depends on our ability to generate cash in the future. If we do not generate sufficient cash flows to meet our debt service and working capital requirements, we may need to seek additional financing or sell assets. This may make it more difficult for us to obtain financing on terms that are acceptable to us, or at all. Without any such financing, we could be forced to sell assets to make up for any shortfall
13
Table of Contents
in our payment obligations under unfavorable circumstances. If necessary, we may not be able to sell assets quickly enough or for sufficient amounts to enable us to meet our obligations.
In addition, our debt agreement contains covenants that limit our flexibility in planning for or reacting to changes in our business and our industry including limitations on incurring additional indebtedness, making investments, granting liens and merging or consolidating with other companies. Complying with these covenants may impair our ability to finance our future operations or capital needs or to engage in other favorable business activities. Our failure to comply with the covenants contained in our debt agreement, including as a result of events beyond our control, could result in an event of default which could materially and adversely affect our operating results and our financial condition. Our debt agreement requires us to comply with various operational, reporting and other covenants that limit us from engaging in certain types of transactions. If there were an event of default under our debt agreement that was not cured or waived, the holders of the defaulted debt could cause all amounts outstanding with respect to that debt to be immediately due and payable. We cannot assure you that our assets or cash flows would be sufficient to fully repay borrowings under our outstanding debt instruments, either upon maturity or if accelerated, upon an event of default or that we would be able to refinance or restructure the payments on those debt instruments. Our failure to maintain certain debt to EBITDA ratios contained in our debt agreement could result in required payments to the lenders of a percentage of our excess cash flow, which could materially and adversely affect our ability to use our excess cash flow for other purposes. Our debt agreement requires us to distribute 50% of our excess cash flow, as defined in the debt agreement, if our debt to EBITDA ratio exceeds 3.50 to 1.00 and 25% of our excess cash flow if our debt to EBITDA ratio is 3.50 to 1.00 or less, but greater than 2.75 to 1.00. If we were required to distribute a portion of our excess cash flow to our lenders, we may be limited in our ability to grow our business through acquisitions or investments in technology and we may be limited in our ability to repurchase our common stock. We cannot assure you that we will maintain debt to EBITDA ratios at levels that will not require us to distribute a portion of our excess cash flow to lenders. Risks Related to our Growth Strategy
Our ability to grow is affected by our ability to retain and expand our existing client relationships and our ability to attract new customers. Our ability to retain existing customers and expand those relationships and attract new customers is subject to a number of risks including the risk that we do not:
• maintain or improve the compliance and quality of services we provide to our customers; • meet or exceed the expectations of our customers; • successfully leverage our existing client relationships to sell additional services and • attract other servicers and non-distressed home sellers as new customers.
If our efforts to retain and expand our client relationships and to attract new customers do not prove effective, it could have a material adverse effect on our business and results of operations and our ability to grow our operations. Our ability to expand existing relationships and attract new customers is also affected by broader economic factors and the strength of the overall housing market, which can reduce demand for our services and increase competition for each customer’s business. See “ The strength of the economy and the housing market can affect demand for our services. ”
14
Table of Contents
If we do not adapt our services to changes in technology or in the marketplace, or if our ongoing efforts to upgrade our technology and particularly our efforts to complete development of our next generation technology are not successful, we could lose customers and have difficulty attracting new customers for our services. The markets for our services are characterized by constant technological change, frequent introduction of new services and evolving industry standards. We are currently in the process of developing and introducing our next generation technology. Our future success will be significantly affected by our ability to complete our current efforts and in the future enhance, primarily through use of automation, econometrics and behavioral science principles, our services and develop and introduce new services that address the increasingly sophisticated needs of our customers and their customers. These initiatives carry the risks associated with any new service development effort including cost overruns, delays in delivery and performance effectiveness. There can be no assurance that we will be successful in developing, marketing and selling new services that meet these changing demands or completing the development of our next generation technology. In addition, we may experience difficulties that could delay or prevent the successful development, introduction and marketing of these services. Finally, our services and their enhancements may not adequately meet the demands of the marketplace and achieve market acceptance. Any of these results would have a negative impact on our financial condition and results of operations and our ability to grow our operations. Our growth objectives are dependent on the timing and market acceptance of our new service offerings. Our ability to grow may be adversely affected by difficulties or delays in service development or the inability to gain market acceptance of new services to existing and new customers. There are no guarantees that new services will prove to be commercially successful. Our business is dependent on the trend towards outsourcing. Our continued growth at historical rates is dependent on the industry trend towards outsourced services. There can be no assurance this trend will continue, as organizations may elect to perform such services themselves or may be prevented from outsourcing services. A significant change in this trend could have a materially adverse effect on our continued growth. Our strategy to make acquisitions to accelerate growth initiatives involves potential risks. During 2013, we acquired fee-based businesses from Ocwen and acquired Equator. We intend to continue to consider acquisitions of other businesses that could complement our business. In addition to considering acquisitions that could offer us greater access in our current markets, we also consider acquisitions of entities offering greater access and expertise in other asset types and markets that are related to ours but we do not currently serve. As we acquire businesses, we may face a number of risks including a loss of focus on our daily operations, the need for additional management, constraints on operating resources, constraints on financial resources from integration and system conversion costs, the inability to maintain key pre-acquisition relationships with customers, suppliers and employees and other integration risks. Moreover, any acquisition may result in the incurrence of additional amortization expense of related intangible assets which could reduce our profitability.
We may be unable to achieve some or all of the benefits we expect from the continued relationship with Residential following the Separation of the Residential Asset Businesses. We may not be able to fully achieve the strategic and financial benefits we expect from our relationship with Residential following the Separation of the Residential Asset Businesses, or such benefits may be delayed. These outcomes may occur if, among other things, Residential is not successful in fully executing its strategy to acquire non-performing loan portfolios with a portion of the portfolios converting to single family rental assets or if Residential is not successful in continuing to raise equity and debt to support its growth. Risks Related to International Business Our international operations subject us to additional risks which could have an adverse effect on our results of operations.
15
Table of Contents
We have reduced our operating expenses by utilizing lower cost labor in foreign countries such as India and the Philippines. As of December 31, 2013, 5,895 of our employees were based in India and the Philippines. These countries are subject to relatively higher degrees of political and social instability and may lack the infrastructure to withstand political unrest or natural disasters. Such disruptions can decrease efficiency and increase our costs in these countries. Weakness of the United States dollar in relation to the currencies used in these foreign countries may also reduce the savings achievable through this strategy. Furthermore, the practice of utilizing labor based in foreign countries has come under increased scrutiny in the United States and, as a result, some of our customers may require us to use labor based in the United States. We may not be able to pass on the increased costs of higher-priced United States-based labor to our customers which ultimately could have an adverse effect on our results of operations. In many foreign countries, particularly in those with developing economies, it is common to engage in business practices that are prohibited by laws and regulations applicable to us, such as the FCPA. Any violations of the FCPA or local anti-corruption laws by us, our subsidiaries or our local agents, could have an adverse effect on our business and reputation and result in substantial financial penalties or other sanctions. Any political or economic instability in these countries could result in our having to replace or reduce these labor sources which may increase our labor costs and have an adverse impact on our results of operations. Altisource is a Luxembourg company and it may be difficult to enforce judgments against it or its directors and executive officers. Altisource is a public limited company organized under the laws of Luxembourg. As a result, Luxembourg law and the articles of incorporation govern the rights of shareholders. The rights of shareholders under Luxembourg law may differ from the rights of shareholders of companies incorporated in other jurisdictions. A significant portion of the assets of Altisource are located outside the United States. It may be difficult for investors to enforce, in the United States, judgments obtained in United States courts against Altisource or its directors based on the civil liability provisions of the United States securities laws or to enforce, in Luxembourg, judgments obtained in other jurisdictions including the United States. A significant change of the Luxembourg tax regime or of its interpretation by the Luxembourg tax authorities could adversely affect our results of operations. Altisource is organized under the laws of, and headquartered in, Luxembourg. This allows Altisource to benefit from a favorable tax treatment. It is possible that changes in Luxembourg taxation statutes, administrative practice or applicable regulations may cause a reduction in, or an elimination of, the benefits we receive under the existing Luxembourg tax treatment, which could result in a significant increase to our income tax expense and adversely affect our results of operations.
Risks Related to Our Employees Our success depends on our directors, executive officers and key personnel. Our success is dependent on the efforts and abilities of our directors, executive officers and other key employees many of whom have significant experience in the real estate and mortgage, financial services and technology industries. In particular we are dependent on the services of William C. Erbey, our Chairman of the Board, and William B. Shepro, our Chief Executive Officer, as well as the services of key personnel at each of our segments. The loss of the services of any of these directors, executives or key personnel, for any reason, could have a material adverse effect upon our business, results of operations and financial condition. Our inability to attract and retain skilled employees may adversely impact our business. Our business is labor intensive and places significant importance on our ability to recruit, train and retain skilled employees. Additionally, demand for qualified technical and software professionals conversant in certain technologies may exceed supply as new and additional skills are required to keep pace with evolving computer
16
Table of Contents
technology. Our ability to locate and train employees is critical to achieving our growth objective. Our inability to attract and retain skilled employees or an increase in wages or other costs of attracting, training or retaining skilled employees could have a materially adverse effect on our business, financial condition and results of operations. Risks Related to Our Relationships We could have conflicts of interest with Ocwen, HLSS, Residential, AAMC, our Chairman, our CEO or management due to his, her or their relationship with Ocwen, HLSS, Residential or AAMC, which may be resolved in a manner adverse to us. We do a substantial amount of business with Ocwen, Residential and AAMC and provide certain services to HLSS. Conflicts may arise between Ocwen, HLSS, Residential or AAMC and us because of our ongoing agreements with them and because of the nature of our respective businesses. Our Chairman is also the Chairman of Ocwen, HLSS, Residential and AAMC. As a result, he has obligations to us as well as to these other entities and could have conflicts of interest with respect to matters potentially or actually involving or affecting us and Ocwen, HLSS, Residential or AAMC, as the case may be. Our Chairman also has substantial investments in Ocwen, HLSS, Residential and AAMC, and certain of our other officers and directors own stock or options in one or more of Ocwen, HLSS, Residential and AAMC. Such ownership interests could create, or appear to create, conflicts of interest with respect to matters potentially or actually involving or affecting us and Ocwen, HLSS, Residential and AAMC, as the case may be. We follow policies, procedures and practices to avoid potential conflicts with respect to our dealings with Ocwen, HLSS, AAMC and Residential, including our Chairman recusing himself from negotiations regarding, and approvals of, transactions with these entities. We also manage potential conflicts of interest through oversight by independent members of our Board of Directors (independent directors constitute a majority of our Board of Directors), and we will also seek to manage these potential conflicts through dispute resolution and other provisions of our agreements with Ocwen, HLSS, Residential and AAMC. There can be no assurance that such measures will be effective, that we will be able to resolve all conflicts with Ocwen, HLSS, Residential or AAMC or that the resolution of any such conflicts will be no less favorable to us than if we were dealing with a third party that had none of the connections we have with these businesses. ITEM 1B. UNRESOLVED STAFF COMMENTS Not applicable.
17
Table of Contents ITEM 2. PROPERTIES Our principal executive offices are located in leased office space in Luxembourg, Grand Duchy of Luxembourg. A summary of our principal leased office space as of December 31, 2013 and the segments primarily occupying each location is as follows:
We do not own any real property. We consider these facilities to be suitable and adequate for the management and operations of our business.
ITEM 3. LEGAL PROCEEDINGS From time to time, we are involved in legal proceedings arising in the ordinary course of business. We record a liability for litigation if an unfavorable outcome is probable and the amount of loss can be reasonably estimated, including expected insurance coverage. For proceedings where a range of loss is determined, we record a best estimate of loss within the range. When legal proceedings are material, we disclose the nature of the litigation, and to the extent possible, the estimate of loss or range of loss. In the opinion of management, after consultation with legal counsel and considering insurance coverage where applicable, the outcome of current legal proceedings, both individually and in the aggregate, will not have a material impact on our financial condition, results of operations or cash flows. Our businesses are also subject to extensive regulation which may result in regulatory proceedings against us. See Item 1A of Part I, “ Risk Factors ” above. ITEM 4. MINE SAFETY DISCLOSURES Not applicable.
18
Mortgage Services
Financial Services
Technology
Services
Corporate and Support Services
Luxembourg
X X
X X
United States
Atlanta, GA X
X X
X Boston, MA
X
Dallas, TX X
Irvine, CA X
X
Los Angeles, CA
X
Louisville, KY X
X
Plano, TX
X
Sacramento, CA
X
Seattle, WA
X
St. Louis, MO X
Tempe, AZ
X
Vestal, NY
X
Winston-Salem, NC
X
X Pasay City, Philippines
X X
X X
India
Bangalore X
X X
X Goa
X
Mumbai X
X X
X
Table of Contents
PART II
ITEM 5. MARKET FOR REGISTRANT’S COMMON EQUITY, RELATED STOC KHOLDER MATTERS AND ISSUER PURCHASES OF EQUITY SECURITIES
Market Information Our common stock is listed on the NASDAQ Global Select Market under the symbol “ASPS.” The following table sets forth the high and low close of day sales prices for our common stock, for the periods indicated, as reported by the NASDAQ Global Select Market:
The number of holders of record of our common stock as of January 31, 2014 was 70. The number of beneficial stockholders is substantially greater than the number of holders as a large portion of our common stock is held through brokerage firms. Dividends We have never declared or paid cash dividends on our common stock, and we do not anticipate paying any cash dividends in the foreseeable future. Additionally, the payment of cash dividends may be limited by Luxembourg law and by covenants in our debt agreement.
19
2013
Quarter ended Low
High
March 31
$ 67.35 $ 96.02
June 30
69.43 100.15
September 30
95.22 142.30
December 31
132.88 170.19
2012
Quarter ended Low
High
March 31
$ 48.55 $ 64.78
June 30
52.35 73.23
September 30
70.70 91.06
December 31
84.56 124.33
Table of Contents
Stock Performance Graph The graph below compares the cumulative total stockholder return on our common stock with the cumulative total return on the S&P’s 500 Index for the period commencing on August 10, 2009, the first trading day of our common stock, and ending on December 31, 2013. The graph assumes an investment of $100 at the beginning of this period and does not include the effects of the post-distribution values of Residential and AAMC, which were distributed to Altisource shareholders in December 2012. The comparisons in the graphs below are based upon historical data and are not indicative of, nor intended to forecast, future performance of our common stock.
20
08/10/09 12/31/09
06/30/10 12/31/10
06/30/11 12/31/11
06/30/12 12/31/12
06/30/13 12/31/13
Altisource
$ 100.00 $ 172.05
$ 202.79 $ 235.33
$ 301.64 $ 411.31
$ 600.25 $ 710.25
$ 772.95 $ 1,300.25
S&P 500
100.00 110.72
102.34 124.88
131.13 124.87
135.26 141.46
159.50 183.53
NASDAQ
Composite 100.00
113.90 105.87
133.16 139.22
130.76 147.32
151.56 170.83
209.64
Table of Contents
Securities Authorized for Issuance under Equity Compensation Plans The information required by this item is incorporated herein by reference to our definitive proxy statement in connection with our 2014 annual meeting of shareholders to be filed pursuant to Regulation 14A under the Securities Exchange Act of 1934. Issuer Purchases of Equity Securities In May 2012, our shareholders approved a new stock repurchase program, which replaced the previous stock repurchase program. Under the program, we are authorized to purchase up to 3.5 million shares of our common stock in the open market in addition to amounts previously purchased under the prior program. From authorization of the previous program in May 2010 through December 31, 2013, we have purchased approximately 3.7 million shares of our common stock in the open market at an average price of $63.04 per share. We purchased 1.2 million shares of common stock at an average price of $116.99 per share during the year ended December 31, 2013 and 0.3 million shares at an average price of $63.25 per share during the year ended December 31, 2012. As of December 31, 2013, approximately 2.3 million shares of common stock remain available for repurchase under the program. Luxembourg law limits share repurchases to approximately the balance of Altisource Portfolio Solutions S.A. (unconsolidated parent company) retained earnings, less shares repurchased. As of December 31, 2013, approximately $14 million was available to repurchase our common stock under Luxembourg law. Our senior secured term loan also limits the amount we can spend on share repurchases in any year and may prevent repurchases in certain circumstances. As of December 31, 2013, approximately $55 million was available to repurchase our common stock under our senior secured term loan. The following table presents information related to our repurchases of our equity securities during the three months ended December 31, 2013:
(1) Includes shares withheld from employees to satisfy tax withholding obligations that arose from the exercise of stock options. (2) In May 2012, our shareholders authorized us to purchase up to 3.5 million shares of our common stock in the open market. The provisions of our senior secured term loan agreement, as amended, limit, among other things, our ability to incur additional debt, pay dividends and repurchase stock.
21
Period
Total number of
shares purchased(1)
Weighted average
price paid per share
Total number of shares
purchased as part of publicly
announced plans or
programs(2)
Maximum number of shares that may yet be purchased
under the plans or programs
Common stock:
October 1 — 31, 2013
79,172 $ 148.13
79,172 2,572,335
November 1 — 30, 2013
280,405 149.02
280,405 2,291,930
December 1 — 31, 2013
— —
— 2,291,930
Total shares of common stock
359,577 $ 148.82
359,577 2,291,930
Table of Contents
ITEM 6. SELECTED FINANCIAL DATA The following selected financial data as of and for the years ended December 31, 2013, 2012, 2011, 2010 and 2009 has been derived from our audited consolidated financial statements. The historical results presented below may not be indicative of our future performance and do not necessarily reflect what our financial position as of December 31, 2009 and results of operations for the year ended December 31, 2009 would have been had we operated as a separate, stand-alone entity for the period prior to the Separation from Ocwen. The selected consolidated financial data should be read in conjunction with the information contained in Item 7 of Part II, “ Management’s Discussion and Analysis of Financial Condition and Results of Operations ” and our consolidated financial statements and notes thereto in Item 8 of Part II, “ Financial Statements and Supplementary Data. ”
22
For the years ended December 31,
(in thousands, except per share data) 2013
2012 2011
2010 2009
Revenue
$ 768,357 $ 568,360
$ 423,687 $ 301,378
$ 202,812
Cost of revenue 492,480
366,201 275,849
189,059 126,797
Gross profit
275,877 202,159
147,838 112,319
76,015
Selling, general and administrative expenses 113,810
Total other income (expense), net (19,734 ) (2,798 ) 203
804 1,034
Income before income taxes and non-controlling
interests 142,333
124,649 85,910
55,771 37,576
Income tax (provision) benefit
(8,540 ) (8,738 ) (7,943 ) 403 (11,605 )
Net income 133,793
115,911 77,967
56,174 25,971
Net income attributable to non-controlling interests
(3,820 ) (5,284 ) (6,855 ) (6,903 ) —
Net income attributable to Altisource
$ 129,973 $ 110,627
$ 71,112 $ 49,271
$ 25,971
Earnings per share:
Basic
$ 5.63 $ 4.74
$ 2.92 $ 1.96
$ 1.08
Diluted $ 5.19
$ 4.43 $ 2.77
$ 1.88 $ 1.07
Transactions with related parties included above:
Revenue
$ 502,087 $ 338,227
$ 245,262 $ 154,988
$ 94,897
Selling, general and administrative expenses 2,921
2,430 1,893
1,056 4,308
Other income (expense)
773 86
— —
(1,290 )
Table of Contents
Note: Significant events affecting our historical earnings trends in 2011 through 2013, including acquisitions, are described in Item 7 of Part II,
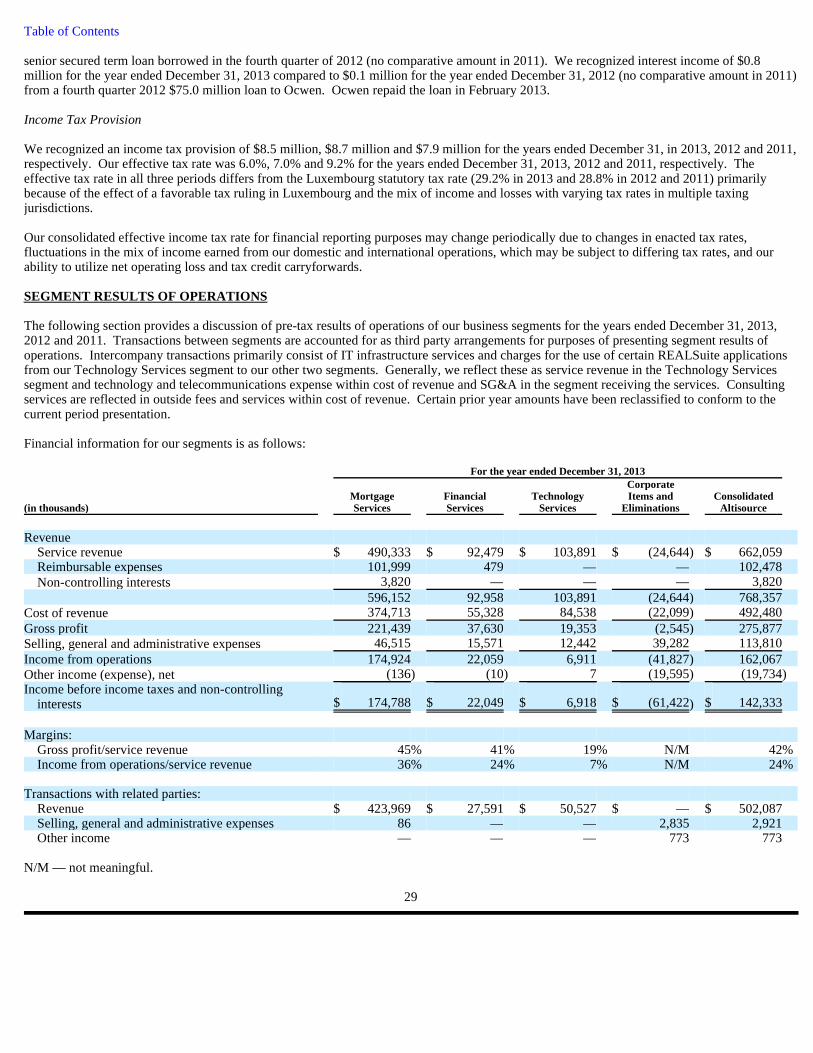
“ Management’s Discussion and Analysis of Financial Condition and Results of Operations .” ITEM 7. MANAGEMENT’S DISCUSSION AND ANALYSIS OF FINANCIAL C ONDITION AND RESULTS OF OPERATIONS Management’s discussion and analysis of financial condition and results of operations (“MD&A”) is a supplement to the accompanying consolidated financial statements and is intended to provide a reader of our financial statements with a narrative from the perspective of management on our businesses, current developments, financial condition, results of operations and liquidity. Significant sections of MD&A are as follows:
Overview. This section, beginning on page 24, provides a description of recent developments we believe are important in understanding our results of operations and financial condition as well as understanding anticipated future trends. It also provides a brief description of significant transactions and events that affect the comparability of financial results and a discussion of the progress being made on our growth initiatives. Consolidated Results of Operations. This section, beginning on page 27, provides an analysis of our consolidated results of operations for the three years ended December 31, 2013. Segment Results of Operations. This section, beginning on page 29, provides an analysis of each business segment for the three years ended December 31, 2013 as well as Corporate Items and Eliminations. In addition, we discuss significant transactions, events and trends that may affect the comparability of the results being analyzed. Liquidity and Capital Resources . This section, beginning on page 37, provides an analysis of our cash flows for the three years ended December 31, 2013. We also discuss restrictions on cash movements, future commitments and capital resources. Critical Accounting Policies. This section, beginning on page 40, identifies those accounting principles we believe are most important to our financial results and that require significant judgment and estimates on the part of management in application. We provide all of our significant accounting policies in Note 2 to the accompanying consolidated financial statements. Other Matters. This section, beginning on page 43, provides a discussion of off-balance sheet arrangements to the extent they exist. In addition, we provide a tabular discussion of contractual obligations and discuss any significant commitments or contingencies.
23
December 31,
(in thousands) 2013
2012 2011
2010 2009
Cash and cash equivalents
$ 130,324 $ 105,502
$ 32,125 $ 22,134
$ 30,456
Accounts receivable, net 101,297
88,955 52,005
53,495 30,497
Premises and equipment, net
87,252 50,399
25,600 17,493
11,408
Intangible assets, net 276,162
56,586 64,950
72,428 33,719
Goodwill
97,375 14,915
14,915 11,836
9,324
Loan to Ocwen —
75,000 —
— —
Total assets
724,838 429,226
224,159 197,800
120,556
Long term debt, net 395,256
198,027 —
— —
Capital lease obligations
— 233
836 1,532
664
Total liabilities 567,097
269,397 58,216
45,902 34,208
Table of Contents
OVERVIEW Our Business We, through our subsidiaries, are a premier marketplace and transaction solutions provider for the real estate, mortgage and consumer debt industries offering both distribution and content. We leverage proprietary business process, vendor and electronic payment management software and behavioral science based analytics to improve outcomes for marketplace participants.
Our business segments are based upon our organizational structure, which focuses primarily on the services offered, and are consistent with the internal reporting used by our Chief Executive Officer to evaluate operating performance and to assess the allocation of our resources. We classify our business into three reportable segments. The Mortgage Services segment provides services that span the mortgage and real estate lifecycle and are typically outsourced by loan servicers, loan originators and investors in single family homes. The Financial Services segment provides collection and customer relationship management services primarily to debt originators and servicers (e.g., credit card, auto lending, retail credit and mortgage) and the utility and insurance industries. The Technology Services segment principally consists of our REALSuite software applications, Equator’s software applications as well as our IT infrastructure services. The REALSuite platform provides a fully integrated set of software applications and technologies that manage the end-to-end lifecycle for residential and commercial mortgage loan servicing including the automated management and payment of a distributed network of vendors. Equator’s software applications provide comprehensive, end-to-end workflow and transaction services to manage real estate related activities and purchase related services from vendors. In addition, Corporate Items and Eliminations include eliminations of transactions between the reporting segments and costs related to corporate support functions including executive, finance, legal, human resources, vendor management, risk and operational effectiveness. We classify revenue in three categories: service revenue, revenue from reimbursable expenses and non-controlling interests. In evaluating our performance, we focus on service revenue. Service revenue consists of amounts attributable to our fee-based services. Reimbursable expenses and non-controlling interests are pass-through items for which we earn no margin. Reimbursable expenses consist of amounts we incur on behalf of our customers in performing our fee-based services, but we pass such costs directly on to our customers without any additional markup. Non-controlling interests represent the earnings of Lenders One, a consolidated entity not owned by Altisource and are included in revenue and reduced from net income to arrive at net income attributable to Altisource. We have prepared our consolidated financial statements in accordance with accounting principles generally accepted in the United States of America (“GAAP”). Altisource’s Vision and Growth Initiatives Since our separation from Ocwen, Altisource has become a company providing a full suite of mortgage, real estate and consumer debt services, leveraging our technology and global operations. Our relationship with Ocwen provided a foundation on which we built our business and remains an important priority for us. Altisource’s vision has evolved to become the premier provider of real estate and mortgage marketplaces offering both distribution and content. Within these industries, we are facilitating transactions related to home sales, home rentals, home maintenance, mortgage origination and mortgage servicing. The Equator acquisition, with its marketplace, real estate and servicing transaction solutions, is in line with this vision and accelerates our evolution and growth. We believe there are significant growth opportunities for Altisource in the real estate and mortgage markets, leveraging our distribution and transaction solutions. Our strategic growth initiatives are: Real estate market:
• supporting Ocwen’s growth • deploying Hubzu to other institutions and the non-distressed home sales market
24
Table of Contents
• providing property management, lease management and renovation management services to the single family rental market Mortgage market:
• maintaining and growing our services provided to Ocwen as it continues to grow its residential loan servicing portfolio • growing our origination related services by providing services to the members of Lenders One and Ocwen’s origination platform • developing our next generation REALServicing technology
Distribution and transaction solutions:
• developing our next generation vendor, invoice and document management technologies through REALTrans, REALRemit and REALDoc
Stock Repurchase Plan In May 2012, our shareholders approved a new stock repurchase program, which replaced the previous stock repurchase program. Under the program, we are authorized to purchase up to 3.5 million shares of our common stock in the open market in addition to amounts previously purchased under the prior program. From authorization of the previous program in May 2010 through December 31, 2013, we have purchased approximately 3.7 million shares of our common stock in the open market at an average price of $63.04 per share. We purchased 1.2 million shares of common stock at an average price of $116.99 per share during the year ended December 31, 2013 and 0.3 million shares at an average price of $63.25 per share during the year ended December 31, 2012. As of December 31, 2013, approximately 2.3 million shares of common stock remain available for repurchase under the program. Luxembourg law limits share repurchases to approximately the balance of Altisource Portfolio Solutions S.A. (unconsolidated parent company) retained earnings, less shares repurchased. As of December 31, 2013, approximately $14 million was available to repurchase our common stock under Luxembourg law. Our senior secured term loan also limits the amount we can spend on share repurchases in any year and may prevent repurchases in certain circumstances. As of December 31, 2013, approximately $55 million was available to repurchase our common stock under our senior secured term loan. Separation of Residential Asset Businesses On December 21, 2012, we completed the capitalization and distribution of Residential and AAMC to our shareholders. See “ Separation of the Residential Asset Businesses ” in Item 1 of Part I, “ Business. ” On December 24, 2012, the shares of Residential and AAMC were distributed to our shareholders of record as of December 17, 2012, in the form of a taxable pro rata stock distribution. Our shareholders received a pro rata distribution of:
• one share of Residential common stock for every three shares of Altisource common stock held; • one share of AAMC common stock for every 10 shares of Altisource common stock held and • cash in lieu of fractional Residential and AAMC shares.
Residential is focused on acquiring and managing single family rental properties by acquiring portfolios of sub-performing and non-performing residential mortgage loans throughout the United States. AAMC provides asset management and certain corporate governance services to Residential. We are providing property management, lease management and renovation management services to Residential. Prior to the separation, we capitalized Residential with $100 million of cash and AAMC with $5 million of cash. We eliminated the assets and liabilities of Residential and AAMC from our consolidated balance sheet effective at the close of business on December 21, 2012. As Residential and AAMC were development stage companies and had not yet commenced operations at the time of separation, these entities had no historical results of operations. We do not expect any negative impact on our future operations other than interest expense on the debt we borrowed in November 2012 to capitalize these entities.
25
Table of Contents
The carrying value of net assets transferred by Altisource was as follows:
Factors affecting comparability The following additional items may impact the comparability of our results:
• The average number of loans serviced by Ocwen on REALServicing totaled 1.2 million for the year ended December 31, 2013 compared to 0.7 million and 0.5 million for the years ended December 31, 2012 and 2011, respectively. The average number of delinquent non-Government-Sponsored Enterprise (“non-GSE”) loans serviced by Ocwen on REALServicing totaled 296 thousand for the year ended December 31, 2013 compared to 211 thousand and 137 thousand for the years ended December 31, 2012 and 2011, respectively;
• On November 15, 2013, we acquired Equator for an initial purchase price of $63.4 million plus contingent consideration of up to an
additional $80 million over three years, subject to Equator achieving annual performance targets; • On March 29, 2013, we completed the acquisition of the Homeward fee-based businesses from Ocwen for an aggregate purchase price
of $75.8 million; • On April 12, 2013, we completed the ResCap fee-based business transaction with Ocwen for an aggregate purchase price of $128.8
million; • In November 2012, we borrowed $200 million under a senior secured term loan agreement and increased our borrowings to $400
million on May 7, 2013. On December 9, 2013, we refinanced the senior secured term loan which included, among other changes, lowering the interest rate of the term loans. Interest expense totaled $20.3 million for the year ended December 31, 2013 compared to $1.2 million for the year ended December 31, 2012 (no comparative amount in 2011);
• We repurchased 1.2 million shares of our common stock under our stock repurchase program during the year ended December 31,
2013 compared to 0.3 million shares and 1.6 million shares during the years ended December 31, 2012 and 2011, respectively; • In April 2011, we acquired Springhouse, LLC, an appraisal management company that utilizes a nationwide panel of appraisers to
provide real estate appraisals principally to mortgage originators, including the members of Lenders One, and real estate asset managers and
• In July 2011, we acquired the assembled workforce of Tracmail, a sub-contractor in India that performs asset recovery services.
26
(in thousands) Residential
AAMC Total
Cash
$ 100,000 $ 5,000
$ 105,000
Reduction in Altisource retained earnings
$ 100,000 $ 5,000
$ 105,000
Table of Contents CONSOLIDATED RESULTS OF OPERATIONS Summary Consolidated Results Following is a discussion of our consolidated results of operations for the years ended December 31, 2013, 2012 and 2011. For a more detailed discussion of the factors that affected the results of our business segments in these periods, see “ Segment Results of Operations ” below. The following table sets forth information on our results of operations for the years ended December 31:
N/M — not meaningful. Revenue We recognized service revenue of $662.1 million, $466.9 million and $334.8 million for the years ended December 31, 2013, 2012 and 2011, respectively. The growth in service revenue over the three year period was primarily driven by Ocwen’s continued growth, expansion of services we provide to the loans in Ocwen’s servicing portfolio and growth in our Financial Services business from new customer relationship management customers and, in 2013, expansion of our charge-off mortgage collection services.
27
(in thousands, except per share data) 2013
% Increase (decrease)
2012
% Increase (decrease)
2011
Service revenue
Mortgage Services
$ 490,333 39
$ 351,908 56
$ 224,942
Financial Services 92,479
45 63,979
(8 ) 69,231
Technology Services 103,891
40 74,189
32 56,094
Eliminations
(24,644 ) (6 ) (23,147 ) (49 ) (15,509 ) 662,059
42 466,929
39 334,758
Reimbursable expenses
102,478 7
96,147 17
82,074
Non-controlling interests 3,820
(28 ) 5,284 (23 ) 6,855
Total revenue
768,357 35
568,360 34
423,687
Cost of revenue 492,480
34 366,201
33 275,849
Gross profit
275,877 36
202,159 37
147,838
Selling, general and administrative expenses 113,810
52 74,712
20 62,131
Income from operations
162,067 27
127,447 49
85,707
Other income (expense), net:
Interest expense (20,291 ) N/M
(1,210 ) N/M (85 )
Other income (expense), net 557
135 (1,588 ) N/M
288
Total other income (expense), net (19,734 ) N/M
(2,798 ) N/M 203
Income before income taxes and non-controlling
interests 142,333
14 124,649
45 85,910
Income tax provision
(8,540 ) 2 (8,738 ) (10 ) (7,943 )
Net income 133,793
15 115,911
49 77,967
Net income attributable to non-controlling interests
(3,820 ) 28 (5,284 ) 23
(6,855 ) Net income attributable to Altisource
$ 129,973 17
$ 110,627 56
$ 71,112
Margins:
Gross profit/service revenue
42 % 43 %
44 % Income from operations/service revenue
24 % 27 %
26 % Earnings per share:
Basic
$ 5.63 19
$ 4.74 62
$ 2.92
Diluted $ 5.19
17 $ 4.43
60 $ 2.77
Table of Contents The increase in revenue from reimbursable expenses during the three year period is due primarily to the growth of Ocwen’s loan servicing portfolio, although reimbursable expenses can vary significantly from year to year based on the mix of services ordered. Cost of Revenue and Gross Profit Cost of revenue principally includes payroll and employee benefits associated with personnel employed in customer service and operations roles, fees paid to external providers related to the provision of services, reimbursable expenses, technology and telecommunications expenses as well as depreciation and amortization of operating assets. We recognized cost of revenue of $492.5 million, $366.2 million and $275.8 million for the years ended December 31, 2013, 2012 and 2011, respectively. The increase in cost of revenue during the three year period is primarily attributable to the growth in Ocwen’s loan servicing portfolio and higher costs in our Technology Services segment as we continue to invest in the development of our next generation technology and infrastructure to support our growth. Additionally, we have been carrying excess staff in the Mortgage Services segment since late 2012 in anticipation of the ResCap and Homeward non-GSE loans, the majority of which were boarded in 2013. Gross profit as a percentage of service revenue was 42%, 43% and 44% for the years ended December 31, 2013, 2012 and 2011, respectively. The decreases in gross margin percentages during this period are primarily attributable to the mix of service revenue, the timing of investments in new services and technology and the timing of boarding new loans. In 2013, we experienced higher growth in the lower margin property inspection and preservation services from the initial referrals from the Homeward and ResCap portfolios and higher costs in our Technology Services segment as we continue to invest in the development of our next generation technology to support our growth initiatives, partially offset by improved performance in our Financial Services segment from the growth of higher margin mortgage charge-off and customer relationship management services. In 2012, we reported higher costs in our Technology Services segment from investments in the development of our next generation technology, costs incurred to develop the rental property management business and the growth of the lower margin origination services business. Selling, General and Administrative Expenses and Income from Operations Selling, general and administrative expenses (“SG&A”) includes payroll for personnel employed in executive, finance, legal, human resources, vendor management, risk and operational effectiveness roles. This category also includes occupancy costs, professional fees, depreciation on non-operating assets and amortization of intangible assets. We recognized SG&A of $113.8 million, $74.7 million and $62.1 million for the years ended December 31, 2013, 2012 and 2011, respectively. The increase in SG&A during the three year period includes expansion of some of our corporate functions, including occupancy costs, to support Altisource’s growth, and higher marketing costs related to Hubzu. In 2013, amortization expense was $23.1 million higher than 2012 from the 2013 Homeward, ResCap and Equator transactions. In 2012, we reported higher professional services primarily from expenses incurred in connection with the Separation of the Residential Asset Businesses. Income from operations as a percentage of service revenue was 24%, 27% and 26% for the years ended December 31, 2013, 2012 and 2011, respectively. Income from operations as a percentage of service revenue declined in 2013 compared to 2012 as a result of the mix of service revenue, the timing of investments in new services and technology, the timing of boarding new loans and increases in amortization expense from the Homeward and ResCap fee-based business acquisitions and the Equator acquisition. Income from operations as a percentage of service revenue increased in 2012 compared to 2011 because SG&A grew at a slower pace than service revenue, partially offset by costs associated with the Separation of the Residential Asset Businesses. Other Income (Expense), net Other income (expense), net principally includes interest expense and interest income. Interest expense for the year ended December 31, 2013 increased by $19.1 million compared to the year ended December 31, 2012 from the
28
Table of Contents senior secured term loan borrowed in the fourth quarter of 2012 (no comparative amount in 2011). We recognized interest income of $0.8 million for the year ended December 31, 2013 compared to $0.1 million for the year ended December 31, 2012 (no comparative amount in 2011) from a fourth quarter 2012 $75.0 million loan to Ocwen. Ocwen repaid the loan in February 2013. Income Tax Provision We recognized an income tax provision of $8.5 million, $8.7 million and $7.9 million for the years ended December 31, in 2013, 2012 and 2011, respectively. Our effective tax rate was 6.0%, 7.0% and 9.2% for the years ended December 31, 2013, 2012 and 2011, respectively. The effective tax rate in all three periods differs from the Luxembourg statutory tax rate (29.2% in 2013 and 28.8% in 2012 and 2011) primarily because of the effect of a favorable tax ruling in Luxembourg and the mix of income and losses with varying tax rates in multiple taxing jurisdictions. Our consolidated effective income tax rate for financial reporting purposes may change periodically due to changes in enacted tax rates, fluctuations in the mix of income earned from our domestic and international operations, which may be subject to differing tax rates, and our ability to utilize net operating loss and tax credit carryforwards. SEGMENT RESULTS OF OPERATIONS The following section provides a discussion of pre-tax results of operations of our business segments for the years ended December 31, 2013, 2012 and 2011. Transactions between segments are accounted for as third party arrangements for purposes of presenting segment results of operations. Intercompany transactions primarily consist of IT infrastructure services and charges for the use of certain REALSuite applications from our Technology Services segment to our other two segments. Generally, we reflect these as service revenue in the Technology Services segment and technology and telecommunications expense within cost of revenue and SG&A in the segment receiving the services. Consulting services are reflected in outside fees and services within cost of revenue. Certain prior year amounts have been reclassified to conform to the current period presentation. Financial information for our segments is as follows:
N/M — not meaningful.
29
For the year ended December 31, 2013
Corporate
Mortgage Financial
Technology Items and
Consolidated
(in thousands) Services
Services Services
Eliminations Altisource
Revenue
Service revenue
$ 490,333 $ 92,479
$ 103,891 $ (24,644 ) $ 662,059
Reimbursable expenses
101,999 479
— —
102,478
Non-controlling interests 3,820
— —
— 3,820
596,152
92,958 103,891
(24,644 ) 768,357
Cost of revenue 374,713
55,328 84,538
(22,099 ) 492,480
Gross profit 221,439
37,630 19,353
(2,545 ) 275,877
Selling, general and administrative expenses 46,515
15,571 12,442
39,282 113,810
Income from operations
174,924 22,059
6,911 (41,827 ) 162,067
Other income (expense), net
(136 ) (10 ) 7 (19,595 ) (19,734 )
Income before income taxes and non-controlling interests
$ 174,788 $ 22,049
$ 6,918 $ (61,422 ) $ 142,333
Margins:
Gross profit/service revenue
45 % 41 % 19 % N/M 42 %
Income from operations/service revenue 36 % 24 % 7 % N/M
24 % Transactions with related parties:
Revenue
$ 423,969 $ 27,591
$ 50,527 $ —
$ 502,087
Selling, general and administrative expenses 86
— —
2,835 2,921
Other income
— —
— 773
773
Table of Contents
N/M — not meaningful.
N/M — not meaningful.
30
For the year ended December 31, 2012
Corporate
Mortgage Financial
Technology Items and
Consolidated
(in thousands) Services
Services Services
Eliminations Altisource
Revenue
Service revenue
$ 351,908 $ 63,979
$ 74,189 $ (23,147 ) $ 466,929
Reimbursable expenses
95,604 543
— —
96,147
Non-controlling interests 5,284
— —
— 5,284
452,796
64,522 74,189
(23,147 ) 568,360
Cost of revenue 285,586
46,737 54,634
(20,756 ) 366,201
Gross profit 167,210
17,785 19,555
(2,391 ) 202,159
Selling, general and administrative expenses 25,099
13,415 8,888
27,310 74,712
Income from operations
142,111 4,370
10,667 (29,701 ) 127,447
Other income (expense), net
(1,713 ) (27 ) (25 ) (1,033 ) (2,798 ) Income before income taxes and non-controlling
interests $ 140,398
$ 4,343 $ 10,642
$ (30,734 ) $ 124,649
Margins:
Gross profit/service revenue
48 % 28 % 26 % N/M 43 %
Income from operations/service revenue 40 % 7 % 14 % N/M
27 % Transactions with related parties:
Revenue
$ 306,774 $ 208
$ 31,245 $ —
$ 338,227
Selling, general and administrative expenses 57
— —
2,373 2,430
Other income
— —
— 86
86
For the year ended December 31, 2011
Corporate
Mortgage Financial
Technology Items and
Consolidated
(in thousands) Services
Services Services
Eliminations Altisource
Revenue
Service revenue
$ 224,942 $ 69,231
$ 56,094 $ (15,509 ) $ 334,758
Reimbursable expenses
80,124 1,950
— —
82,074
Non-controlling interests 6,855
— —
— 6,855
311,921
71,181 56,094
(15,509 ) 423,687
Cost of revenue 202,035
51,096 36,874
(14,156 ) 275,849
Gross profit 109,886
20,085 19,220
(1,353 ) 147,838
Selling, general and administrative expenses 15,278
15,634 4,867
26,352 62,131
Income from operations
94,608 4,451
14,353 (27,705 ) 85,707
Other income (expense), net
248 (34 ) (49 ) 38
203
Income before income taxes and non-controlling interests
$ 94,856 $ 4,417
$ 14,304 $ (27,667 ) $ 85,910
Margins:
Gross profit/service revenue
49 % 29 % 34 % N/M 44 %
Income from operations/service revenue 42 % 6 % 26 % N/M
26 % Transactions with related parties:
Revenue
$ 223,184 $ 266
$ 21,812 $ —
$ 245,262
Selling, general and administrative expenses —
— —
1,893 1,893
Table of Contents
Mortgage Services Revenue Revenue by service line was as follows for the years ended December 31:
N/M — not meaningful.
We recognized service revenue of $490.3 million for the year ended December 31, 2013, a 39% increase compared to the year ended December 31, 2012. The growth in all business lines, except default management services and origination management services, is primarily driven by Ocwen’s growth as loans from its servicing platform acquisitions are boarded on REALServicing. During 2013, we assisted Ocwen with the boarding of 1.1 million loans onto REALServicing from Ocwen’s acquisitions of Homeward, ResCap and OneWest Bank FSB servicing rights. Typically, the initial services ordered immediately following loan boardings are lower margin property inspection and preservation services, which is a significant driver of the 84% growth of asset management service revenue. Asset management service revenue also increased from new services introduced in 2013, from expanding the percentage of homes sold through auction on Hubzu and from capturing referrals for certain services before the loans were boarded on REALServicing. Growth in the insurance services and residential property valuation businesses also reflects Ocwen’s larger loan portfolio, but doesn’t yet reflect the normalized referral volume we expect from the new portfolios. Default management services revenue was lower as one of Ocwen’s subservicing customers is continuing its temporary moratorium on the foreclosure of its loans, the requirements under the “Making Homes Affordable” program limit servicers’ ability to initiate a foreclosure while pursuing other avenues of resolution and a greater percentage of loans pending foreclosure actions are being placed on hold for modification
31
(in thousands) 2013
% Increase (decrease)
2012
% Increase (decrease)
2011
Service revenue
Asset management services
$ 197,999 84
$ 107,480 65
$ 64,975
Insurance services 119,835
40 85,601
52 56,496
Residential property valuation
103,300 29
80,322 55
51,785
Default management services 41,812
(17 ) 50,224 52
32,975
Origination management services 27,387
(3 ) 28,281 51
18,711
Total service revenue 490,333
39 351,908
56 224,942
Reimbursable expenses:
Asset management services
96,944 4
92,992 22
76,511
Default management services 3,177
N/M 426
(88 ) 3,497
Insurance services 1,647
(25 ) 2,186 N/M
116
Origination management services 231
N/M —
N/M —
Total reimbursable expenses
101,999 7
95,604 19
80,124
Non-controlling interests
3,820 (28 ) 5,284
(23 ) 6,855
Total revenue
$ 596,152 32
$ 452,796 45
$ 311,921
Transactions with related parties:
Asset management services
$ 264,350 45
$ 181,948 33
$ 136,685
Residential property valuation 98,959
35 73,406
51 48,734
Insurance services
42,483 12
37,849 42
26,733
Default management services 16,452
21 13,548
23 11,032
Origination management services
1,725 N/M
23 N/M
—
Total
$ 423,969 38
$ 306,774 37
$ 223,184
Table of Contents
consideration or stopped due to modification. Origination management service revenue only declined 3% in 2013 over 2012, despite the estimated 14% decline in overall U.S. origination volume.
We recognized service revenue of $351.9 million for the year ended December 31, 2012, a 56% increase compared to the year ended December 31, 2011. This growth in all of the business lines, except origination management services, was driven by the growth in Ocwen’s loan servicing portfolio and expansion in services provided. A portion of the growth is from a higher capture rate of REO sales on Hubzu sold through auction resulting in a higher percentage commission and an increase in the average REO sales price. The higher origination management services revenue in 2012 is due to higher overall originations volume, the increase in the number of Lenders One members and the incremental roll-out and capture of origination related services to the members. The number of Lenders One members as of December 31, 2013, 2012 and 2011 were 271 members, 241 members and 214 members, respectively. Certain of our Mortgage Services businesses are impacted by seasonality. REO sales and lawn maintenance services are generally lowest during the fall and winter months and highest during the spring and summer months. Cost of Revenue and Gross Profit Cost of revenue consists of the following for the years ended December 31:
Cost of revenue for the year ended December 31, 2013 of $374.7 million increased by 31% compared to the year ended December 31, 2012, driven primarily by the growth of Ocwen’s loan servicing portfolio. Outside fees and services increased at a greater rate than service revenue due to revenue mix, primarily the higher level of property inspection and preservation referrals. Compensation and benefits increased at a lower rate than service revenue as we began to experience the benefit of our workforce efficiency initiatives on higher referral volumes even after carrying excess employees for a part of the year to support Mortgage Services’ anticipated growth. Cost of revenue for the year ended December 31, 2012 of $285.6 million increased by 41% compared to the year ended December 31, 2011, driven primarily by the growth of Ocwen’s loan servicing portfolio and the development of closing and title services in 2011, new origination related services in 2012 and new rental property management services in 2012. Gross profit as a percentage of service revenue was 45%, 48% and 49% for the years ended December 31, 2013, 2012 and 2011, respectively. The decreases in gross margin percentages during this period are primarily attributable to revenue mix of services delivered and the timing of boarding new loans. In 2013, we experienced higher growth in the lower margin property inspection and preservation services from the early referrals from the Homeward and ResCap portfolios, partially offset by lower compensation and benefits costs as a percentage of service revenue from process efficiencies and higher utilization. Property inspections are generally higher following the boarding of a new portfolio. Generally, we have been able to maintain our margins in a period of accelerated growth, and we anticipate that, going forward, we will improve margins as we receive referrals for the full suite of default related services on newly boarded loans, reduce employee and vendor costs as a percent of service revenue through our workforce efficiency initiatives, displace vendors with internal personnel at a lower cost and deploy vendor, process and payment management technologies. In 2012, the most significant factors impacting gross profit as a percent of
32
(in thousands) 2013
% Increase (decrease)
2012
% Increase (decrease)
2011
Compensation and benefits
$ 64,644 20
$ 53,842 44
$ 37,264
Outside fees and services 187,139
61 116,323
57 73,888
Reimbursable expenses
101,999 7
95,604 19
80,124
Technology and telecommunications 19,150
3 18,509
82 10,150
Depreciation and amortization
1,781 36
1,308 115
609
Cost of revenue
$ 374,713 31
$ 285,586 41
$ 202,035
Table of Contents service revenue were the mix of services provided, including growth of the lower margin origination related appraisals. We also incurred costs in 2012 to develop the rental property management business, including the Separation of the Residential Asset Businesses. Our margins can vary substantially depending upon when servicing rights are acquired and boarded to REALServicing by Ocwen. Typically, compensation and benefits will increase in anticipation of a boarding as we hire and train personnel to deliver services in advance of the actual boarding of loans. Subsequently, as new loans are boarded, for the initial months post-boarding, we tend to deliver an elevated level of lower margin valuations and property inspection and preservation services. Selling, General and Administrative Expenses and Income from Operations We recognized SG&A of $46.5 million, $25.1 million and $15.3 million for the years ended December 31, 2013, 2012 and 2011, respectively. The increase in SG&A from 2012 to 2013 primarily relates to an $18.4 million increase in amortization expense from the 2013 acquisitions of the Homeward and ResCap fee-based businesses. In 2012, we incurred higher professional services costs primarily as a result of the Separation of the Residential Asset Businesses. Income from operations as a percentage of service revenue was 36%, 40% and 42% for the years ended December 31, 2013, 2012 and 2011, respectively. Income from operations as a percentage of service revenue declined in 2013 as a result of lower gross margins and higher amortization expense from the 2013 Homeward and ResCap fee-based business acquisitions. In 2012, income from operations as a percentage of service revenue declined as gross margins declined and SG&A grew at a higher pace than service revenue due to the 2012 costs associated with the Separation of the Residential Asset Businesses. Financial Services Revenue Revenue by service line was as follows for the years ended December 31:
N/M — not meaningful. We recognized service revenue of $92.5 million for the year ended December 31, 2013, a 45% increase compared to the year ended December 31, 2012 primarily due to increased charge-off mortgage collections and growth in customer relationship management revenues from the addition of two new clients during 2013 and expansion of services provided to existing clients. The increases were partially offset by lower credit card charge-off placements
33
% Increase % Increase
(in thousands)
2013 (decrease)
2012 (decrease)
2011
Service revenue
Asset recovery management
$ 46,799 58
$ 29,582 (21 ) $ 37,371
Customer relationship management
45,680 33
34,397 8
31,860
Total service revenue 92,479
45 63,979
(8 ) 69,231
Reimbursable expenses:
Asset recovery management
479 (12 ) 543
(72 ) 1,950
Total reimbursable expenses 479
(12 ) 543 (72 ) 1,950
Total revenue $ 92,958
44 $ 64,522
(9 ) $ 71,181
Transactions with related parties:
Asset recovery management
$ 27,591 N/M
$ 208 (22 ) $ 266
Table of Contents
from the continuing record low credit card delinquency rates. With respect to the charge-off mortgage business, we expanded our capabilities in connection with the ResCap fee-based business transaction, and in the second quarter of 2013, we began providing these services to the ResCap loans serviced by Ocwen and a greater portion of the other loans in the Ocwen portfolio. We recognized service revenue of $64.0 million for the year ended December 31, 2012, an 8% decrease compared to the year ended December 31, 2011 due to a decline in service revenue from asset recovery management services. The decline was primarily due to the shift of existing services for one of the segment’s largest customers to a lower cost geography with corresponding lower fees from our customer for these services and a decline in total placements as a result of lower credit card delinquencies. Partially offsetting this decline, service revenue in customer relationship management increased over the same periods. Our global delivery platform consists of highly trained specialists in various geographic regions. The use of specialists in certain countries may result in lower commission rates paid by clients but results in higher margins principally due to the lower employee cost structure. Certain of our Financial Services businesses are impacted by seasonality. Asset recovery management revenue tends to be higher in the first quarter of each year as borrowers utilize tax refunds and bonuses to pay debts. Cost of Revenue and Gross Profit Cost of revenue consists of the following for the years ended December 31:
N/M — not meaningful. Cost of revenue for the year ended December 31, 2013 of $55.3 million increased by 18% compared to the year ended December 31, 2012, driven primarily by higher mortgage charge-off and customer relationship management employees in connection with new business. These increases were partially offset by lower outside fees and services. Cost of revenue for the year ended December 31, 2012 of $46.7 million decreased by 9% compared to the year ended December 31, 2011, driven primarily by lower outside fees and services due to the reduction in account placements. In July 2011, we purchased the assembled workforce of a sub-contractor in India that performs asset recovery services. For periods prior to the acquisition, the costs paid to the sub-contractor were included in outside fees and services. Subsequent to the acquisition, these costs have been recorded according to the nature of the expenses and are included in compensation and benefits and technology and telecommunications expenses (included in cost of revenue ) or occupancy related costs and other (included in SG&A). Gross profit as a percentage of service revenue was 41%, 28% and 29% for the years ended December 31, 2013, 2012 and 2011, respectively. In 2013, gross profit as a percentage of service revenue increased due to growth of higher margin mortgage charge-off and customer relationship management services. In 2012, gross profit as a percentage of service revenue remained flat compared to 2011 as we actively worked to manage our cost structure in that period of declining revenue. We principally managed our cost structure through a reduction in compensation and benefit costs both through a reduction in overall headcount as well as expanding our use of our global workforce.
34
% Increase % Increase
(in thousands)
2013 (decrease)
2012 (decrease)
2011
Compensation and benefits
$ 41,800 28
$ 32,700 10
$ 29,764
Outside fees and services 4,401
(21 ) 5,598 (52 ) 11,587
Reimbursable expenses
479 (12 ) 543
(72 ) 1,950
Technology and telecommunications 7,704
7 7,221
(7 ) 7,784
Depreciation and amortization 944
40 675
N/M 11
Cost of revenue
$ 55,328 18
$ 46,737 (9 ) $ 51,096
Table of Contents
Selling, General and Administrative Expenses and Income from Operations We recognized SG&A of $15.6 million, $13.4 million and $15.6 million for the years ended December 31, 2013, 2012 and 2011, respectively. SG&A increased in 2013 principally from a $3.8 million increase in amortization expense from the acquisition of the ResCap fee-based businesses. In 2012, SG&A expenses decreased principally from lower costs as a result of shifting work in our global delivery platform and from lower depreciation and amortization expense related to assets no longer utilized by Financial Services. Income from operations as a percentage of service revenue was 24%, 7% and 6% for the years ended December 31, 2013, 2012 and 2011, respectively. Income from operations as a percentage of service revenue increased in 2013 due to higher gross margins and slower SG&A growth, despite the increase in amortization expense from the acquisition of the ResCap fee-based business. In 2012, income from operations as a percentage of service revenue increased as lower SG&A more than offset decreased gross margins. Technology Services Revenue Revenue by service line was as follows for the years ended December 31:
We recognized service revenue of $103.9 million for the year ended December 31, 2013, a 40% increase compared to the year ended December 31, 2012 primarily due to growth in Ocwen’s loan servicing portfolio on REALServicing. Revenue also increased from the November 15, 2013 acquisition of Equator. Equator’s revenue for the period from November 15, 2013 through December 31, 2013 is included in the Technology Services segment. IT infrastructure services revenue increased in 2013 due to an increase in cost to support strategic initiatives and headcount growth at both Ocwen and Altisource. IT infrastructure services are billed on a cost plus basis. As such, the increase in cost to support headcount growth in both Altisource and Ocwen resulted in a corresponding increase in revenue in the Technology Services segment. We recognized service revenue of $74.2 million for the year ended December 31, 2012, a 32% increase compared to the year ended December 31, 2011 due to the growth in Ocwen’s loan servicing portfolio on REALServicing. An increase in flood certification services to Lenders One members also contributed to the increase in 2012 compared to 2011. We began offering flood certification services in early 2011. The increase in IT infrastructure services revenue in 2012 reflects the growth experienced by our Mortgage Services segment and by Ocwen. Services provided to our other segments are eliminated in consolidation but are included as revenue in the Technology Services segment and as technology and telecommunications expense, a component of cost of revenue, in our other segments.
35
% Increase % Increase
(in thousands)
2013 (decrease)
2012 (decrease)
2011
Revenue:
REALSuite and Equator
$ 67,319 41
$ 47,773 25
$ 38,336
IT infrastructure services 36,572
38 26,416
49 17,758
Total revenue $ 103,891
40 $ 74,189
32 $ 56,094
Transactions with related parties:
REALSuite and Equator
$ 34,032 63
$ 20,894 38
$ 15,165
IT infrastructure services 16,495
59 10,351
56 6,647
Total $ 50,527
62 $ 31,245
43 $ 21,812
Table of Contents
Cost of Revenue and Gross Profit Cost of revenue consists of the following for the years ended December 31:
Cost of revenue for the year ended December 31, 2013 of $84.5 million increased by 55% compared to the year ended December 31, 2012 primarily due to hiring more and higher cost personnel to support the development of our next generation REALSuite software. We expect cost of revenue in the Technology Services segment to increase as we continue to invest in personnel to support our development and growth initiatives. In addition, we acquired Equator on November 15, 2013 and recognized Equator’s cost of revenue from the date of acquisition. Depreciation and amortization increased in 2013 primarily as a result of our 2012 investment in a disaster recovery center. Outside fees and services and technology and telecommunications also increased consistent with the growth in headcount. Cost of revenue for the year ended December 31, 2012 of $54.6 million increased by 48% compared to the year ended December 31, 2011, driven primarily by hiring more and higher cost personnel to support the development of our next generation REALSuite software, increased technology and telecommunications costs from the addition of new facilities and the expansion of existing facilities. Outside fees and services increased in 2012 as a result of the increase in flood certification services provided to Lenders One members. Technology and telecommunications costs increased principally due to the addition of new facilities, expansion of existing facilities and increased licensing fees for software to support our growth. Gross profit as a percentage of service revenue was 19%, 26% and 34% for the years ended December 31, 2013, 2012 and 2011, respectively. In 2013, gross profit as a percentage of service revenue declined as we continued to invest in the development of our next generation technologies. Gross profit as a percentage of service revenue declined in 2012 as we experienced faster growth in the lower margin IT infrastructure services and incurred higher costs in the development of our next generation technology. We invest in the development of our next generation technologies to support our continued expansion and growth initiatives. Selling, General and Administrative Expenses and Income from Operations We recognized SG&A of $12.4 million, $8.9 million and $4.9 million for the years ended December 31, 2013, 2012 and 2011, respectively. SG&A increased in 2013 principally from a $1.0 million increase in amortization expense from the 2013 acquisitions of the Homeward and ResCap fee-based businesses and Equator, higher administrative employee costs and increased depreciation from increased administrative assets. In 2012, SG&A expenses increased primarily due to an increase in occupancy costs. Income from operations as a percentage of service revenue was 7%, 14% and 26% for the years ended December 31, 2013, 2012 and 2011, respectively. Income from operations as a percentage of service revenue decreased in 2013 and 2012 due to lower gross margins and higher SG&A as described above.
36
% Increase % Increase
(in thousands)
2013 (decrease)
2012 (decrease)
2011
Compensation and benefits
$ 50,368 89
$ 26,602 71
$ 15,519
Outside fees and services 1,926
14 1,690
132 727
Technology and telecommunications
20,546 13
18,159 21
14,994
Depreciation and amortization 11,698
43 8,183
45 5,634
Cost of revenue
$ 84,538 55
$ 54,634 48
$ 36,874
Table of Contents
Corporate Items and Eliminations Corporate Items and Eliminations include costs recognized by us related to corporate support functions including executive, finance, legal, human resources, vendor management, risk, operational effectiveness and interest expense. It also includes eliminations of transactions between the reporting segments. Corporate costs for the year ended December 31, 2013 increased compared to the year ended December 31, 2012 primarily due to higher compensation and employee-related costs, consulting, depreciation and amortization, lease costs and interest expense. We incurred higher compensation and employee-related costs as we expanded certain corporate functions in 2013 to support our continued growth. The higher depreciation and amortization and lease costs relate to the build out of new facilities to support our continued expansion. We reflect initial lease and other facility-related costs in our Corporate segment until the facilities are approximately 40% occupied by the business units, at which time the cost is reflected in the respective segment’s financial statements. Corporate costs increased for the year ended December 31, 2012 compared to the year ended December 31, 2011 primarily as a result of the build-out of new facilities to support our growth. Interest expense for the year ended December 31, 2013 increased by $19.1 million from the $200 million senior secured term loan borrowed in the fourth quarter of 2012 and increased to $400 million on May 7, 2013. Interest expense in 2012 related to the senior secured term loan was recorded from the date of borrowing on November 27, 2012 (no comparative amount in 2011). We recognized interest income of $0.8 million for the year ended December 31, 2013 compared to $0.1 million for the year ended December 31, 2012 (no comparative amount in 2011) from a fourth quarter 2012 $75.0 million loan to Ocwen. Ocwen repaid the loan in February 2013. The amount of intercompany revenue eliminated in consolidation increased over the three year period ended December 31, 2013 due to growth in our operations over the same period. These intercompany transactions primarily consisted of IT infrastructure services as well as charges for the use of certain REALSuite applications from our Technology Service segment to our other two business segments. While the expenses are recognized in the Mortgage Services and Financial Services segments above, the elimination of these expenses are reflected in Corporate Items and Eliminations. LIQUIDITY AND CAPITAL RESOURCES Liquidity Our primary source of liquidity is cash flows from operations. We seek to deploy excess cash generated in a disciplined manner. Principally, we intend to use excess cash to develop complementary services and businesses that we believe will generate attractive margins in line with our core capabilities. Further, we evaluate potential acquisitions that are aligned with our vision and can accelerate the achievement of our strategic objectives. We also intend to use excess cash to repurchase shares of our common stock. Senior Secured Term Loan On November 27, 2012, we entered into a seven-year senior secured term loan agreement with Bank of America, N.A., as administrative agent, and certain lenders, pursuant to which we borrowed $200 million. On May 7, 2013, we amended the senior secured term loan agreement to increase the principal amount of the senior secured term loan by $200 million and to provide additional share repurchase capacity, among other changes. Under the terms of the senior secured term loan, as amended, we have the ability to borrow an additional $200 million under an accordion provision. On December 9, 2013, we entered into Amendment No. 2 (“Second Amendment”) to the senior secured term loan agreement in which we incurred indebtedness in the form of Refinancing Debt (as defined in the senior secured term loan agreement), the proceeds of which were used to refinance, in full, the $397.5 million of term loans outstanding under the senior secured term loan agreement immediately prior to the effectiveness of the Second Amendment. The Refinancing Debt bears interest at lower rates and has a maturity date approximately one year
37
Table of Contents
later than the prior term loans. Generally, the margin applied to either the Adjusted Eurodollar rate or the Base Rate, as defined in the senior secured term loan agreement, was reduced by 1 percentage point and the floor was reduced by 0.25 percentage points. The Second Amendment further modified the senior secured term loan agreement to, among other changes, increase the maximum permitted amount of Restricted Junior Payments (as defined in the senior secured term loan agreement), including share repurchases by the Company. The refinanced term loans under the senior secured term loan agreement must be repaid in equal consecutive quarterly principal installments of $1.0 million commencing on December 31, 2013, with the balance due at maturity. After giving effect to the Second Amendment, all amounts outstanding under the senior secured term loan agreement will become due on the earlier of (i) December 9, 2020, being the seventh anniversary of the closing date of the Second Amendment and (ii) the date on which the loans are declared to be due and owing by the administrative agent at the request (or with the consent) of the Required Lenders (as defined in the senior secured term loan agreement) upon the occurrence of any event of default under the senior secured term loan agreement. However, if leverage ratios, as defined in the senior secured term loan agreement, exceed 2.75 to 1.00, a percentage of cash flow must be used to repay principal. No mandatory prepayments were owed for the year ended December 31, 2013. We are permitted to make voluntary prepayments without penalty after June 9, 2014. If prepayments are made prior to June 9, 2014, 1.0% of the principal amount of the prepaid term loan will be incurred. Interest payments are due monthly. The interest rate as of December 31, 2013 was 4.50%. The debt covenants in the senior secured term loan agreement limit, among other things, our ability to incur additional debt, pay dividends and repurchase stock. In the event we require additional liquidity, our ability to obtain it may be limited by the senior secured term loan. Cash Flows The following table presents our cash flows for the years ended December 31:
N/M — not meaningful.
Cash Flows from Operating Activities Cash flows from operating activities generally consist of the cash effects of transactions and events that factor into the determination of net income. For the year ended December 31, 2013, we generated $185.5 million of cash flows from operations, or approximately $0.28 for every dollar of service revenue compared to $116.5 million of cash flows from operations, or approximately $0.25 per dollar of service revenue in 2012 and $111.6 million of cash flows from operations, or approximately $0.33 per dollar of service revenue in 2011. The increase in cash flows from operating activities during 2013 compared to 2012 is primarily due to the increase in net income, after adding back depreciation and amortization, including amortization of intangible assets and favorable changes in working capital. The increase in cash flows from operating activities during 2012 compared to 2011 is primarily due to the increase in net income, after adding back depreciation and amortization, substantially offset by a decline in working capital principally due to higher accounts receivable.
38
% %
Increase
Increase
(dollars in thousands) 2013
(decrease) 2012
(decrease) 2011
Net income adjusted for non-cash items
$ 190,655 31
$ 145,672 51
$ 96,657
Working capital (5,181 ) 82
(29,143 ) N/M 14,954
Net cash flows provided by operating activities
185,474 59
116,529 4
111,611
Net cash flows used in investing activities (215,944 ) (95 ) (110,563 ) (234 ) (33,070 )
Net cash flows provided by (used in) financing activities
55,292 (18 ) 67,411
198 (68,550 )
Net change in cash 24,822
(66 ) 73,377 N/M
9,991
Cash and cash equivalents at beginning of period 105,502
228 32,125
45 22,134
Cash and cash equivalents at end of period
$ 130,324 24
$ 105,502 228
$ 32,125
Table of Contents
In periods of growth, operating cash flows per service revenue dollar can be negatively impacted because of the nature of some of our services. Certain services are performed immediately following or shortly after the referral, but the collection of the receivable does not occur until a specific event occurs (i.e., the foreclosure is complete, the REO asset is sold, etc.). As we continue to grow, our receivables will also grow and our cash flows from operations may be negatively impacted when comparing one period to another. Cash Flows from Investing Activities On March 29, 2013, we acquired the Homeward fee-based business from Ocwen for $75.8 million, after a working capital and net income adjustment. On April 12, 2013, we entered into an agreement with Ocwen to establish additional terms related to the existing servicing arrangements between Altisource and Ocwen in connection with Ocwen’s acquisition of certain mortgage servicing platform assets of ResCap. The cash consideration paid by Altisource to Ocwen under the ResCap agreement totaled $128.8 million. On November 15, 2013, we acquired Equator for initial consideration of $63.4 million and up to $80 million in potential additional consideration (the “Earn Out”). On February 15, 2013, Ocwen repaid the $75.0 million loan that was borrowed from us in December 2012. Capital expenditures for the years ended December 31, 2013, 2012 and 2011 were $34.1 million, $35.6 million and $16.4 million, respectively. Capital expenditures in 2013, 2012 and 2011 primarily related to facility build-outs and investments in infrastructure and the next generation of our REALSuite software applications. Capital expenditures in 2012 also included investments in a disaster recovery center that continued, to a lesser degree, in 2013. On March 31, 2013, we sold our 49% interest in Correspondent One S.A. (“Correspondent One”) to Ocwen for $12.6 million. During 2011, we invested $15.0 million in Correspondent One. Cash Flows from Financing Activities Cash flows from financing activities for the year ended December 31, 2013 primarily included activity associated with debt proceeds, debt issuance costs, share repurchases, stock option exercises and payments to non-controlling interests. On May 7, 2013, we amended our senior secured term loan agreement to increase the principal amount of the senior secured term loan by $200 million and received $201.0 million, including a $1.0 million original issue premium. We also incurred debt issuance costs of $2.4 million in connection with the amendment. On December 9, 2013, we entered into the Second Amendment, the proceeds of which were used to refinance, in full, the $397.5 million of term loans outstanding and included an original issue discount of $0.5 million. We incurred an additional $0.8 million of debt issuance costs in connection with the Second Amendment. In 2013, we spent $141.0 million to repurchase our common stock and stock option exercises provided proceeds of $6.9 million. Also during 2013, we repaid $3.5 million of the borrowings under the senior secured term loan and distributed $4.2 million to non-controlling interests. Cash flows from financing activities for the year ended December 31, 2012 primarily included activity associated with debt proceeds, debt issuance costs, the distribution of cash in connection with the Separation of the Residential Asset Businesses, share repurchases, stock option exercises and payments to non-controlling interests. On November 27, 2012, we entered into a $200 million senior secured term loan, which included an original issue discount of $2.0 million, and incurred related debt issuance costs of $4.3 million. A total of $105.0 million of the senior secured term loan proceeds were distributed in December 2012 in connection with the Separation of the Residential Asset Businesses. In 2012, we spent $16.8 million to repurchase our common stock and stock option exercises provided proceeds of $3.2 million. Also during 2012, we distributed $7.1 million to non-controlling interests. Cash flows from financing activities for the year ended December 31, 2011 primarily included activity associated with share repurchases, stock option exercises and payments to non-controlling interests. In 2011, we spent $62.2 million to repurchase our common stock, and stock option exercises provided proceeds of $1.0 million. Also during 2011, we distributed $6.8 million to non-controlling interests.
39
Table of Contents Liquidity Requirements after December 31, 2013 On November 15, 2013, we completed the acquisition of Equator and paid $63.4 million at closing in cash (net of closing working capital adjustments), subject to certain post-closing adjustments based on current assets and current liabilities of Equator at closing, to be settled within 90 days of the closing date. Additionally, the Purchase and Sale Agreement (the “Purchase Agreement”) provides for the payment of up to $80 million in potential additional consideration determined based on Equator Adjusted EBITA (as defined in the Purchase Agreement) in the three consecutive 12-month periods following closing. Up to $22.5 million of this potential additional consideration can be earned in each of the first two 12-month periods, and up to $35.0 million can be earned in the third 12-month period. Any amounts earned upon the achievement of Adjusted EBITA thresholds are payable through 2017. We may, in our discretion, pay up to 20% of each payment of any of this potential additional consideration in shares of Company restricted stock, with the balance to be paid in cash. During the first quarter of 2014, we expect to distribute $0.7 million to the Lenders One members representing non-controlling interests. Management is not aware of any other trends or events, commitments or uncertainties which have not otherwise been disclosed that will or are likely to impact liquidity in a material way (see also “ Contractual Obligations, Commitments and Contingencies ” below). We believe that we will generate sufficient cash flows to fund operations, capital expenditures, required debt, interest and Earn Out payments. Were we to need additional capital, we believe that we have adequate access to both debt and equity capital markets. CRITICAL ACCOUNTING POLICIES AND RECENT ACCOUNTING PRONOUNCEMENTS We prepare our consolidated financial statements in accordance with GAAP. In applying many of these accounting principles, we need to make assumptions, estimates and judgments that affect the reported amounts of assets, liabilities, revenue and expenses in our consolidated financial statements. We base our estimates and judgments on historical experience and other assumptions that we believe are reasonable under the circumstances. These assumptions, estimates and judgments, however, are often subjective. Actual results may be affected negatively based on changing circumstances. If actual amounts are ultimately different from our estimates, the revisions are included in our results of operations for the period in which the actual amounts become known. We have identified the critical accounting policies and estimates addressed below. We also have other key accounting policies, which involve the use of assumptions, estimates and judgments that are significant to understanding our results. For additional information, see Note 2 to the consolidated financial statements. Although we believe that our assumptions, estimates and judgments are reasonable, they are based upon information presently available. Actual results may differ significantly from these estimates under different assumptions, judgments or conditions. Revenue Recognition We recognize revenue from the services we provide in accordance with the Financial Accounting Standards Board’s (“FASB”) Accounting Standards Codification Topic 605, Revenue Recognition (“ASC Topic 605”). ASC Topic 605 sets forth guidance as to when revenue is realized or realizable and earned which is generally when all of the following criteria are met: (1) persuasive evidence of an arrangement exists; (2) delivery has occurred or services have been performed; (3) the seller’s price to the buyer is fixed or determinable; and (4) collectability is reasonably assured. Generally, the contract terms for these services are relatively short in duration, and we recognize revenue as the services are performed either on a per unit or a fixed price basis. At Mortgage Services, we recognize revenue for the majority of the services we provide in this segment on completion of the service to our customers. For default processing services and certain property preservation services, we recognize revenue over the period during which we perform the related services, with full recognition on completion of the related foreclosure filing or on closing of the related real estate transaction. We record revenue associated with real estate sales on a net basis as we perform services as an agent without assuming the risks and rewards of ownership of the asset and the commission earned on the sale is a fixed percentage.
40
Table of Contents
At Financial Services, we generally earn our fees for asset recovery management services as a percentage of the amount we collect on delinquent consumer receivables and charged-off mortgages on behalf of our clients and recognize revenue upon collection from the debtors. We also earn fees for packaging and selling charged-off mortgages and recognize revenue after the sale of the notes and once the risks and rewards of the mortgage notes are transferred to the purchasers. In addition, we provide customer relationship management services for which we earn and recognize revenue on a per-call, per-person or per-minute basis as the related services are performed. At Technology Services, we charge fees for our REALSuite platform based on the number of our clients’ loans processed on the system or on a per-transaction basis. We record transactional revenue when the service is provided and other revenue monthly based on the number of loans processed, employees serviced or services provided. We provide IT infrastructure services to Ocwen and its subsidiaries, HLSS, Residential and AAMC and charge for these services primarily based on the number of employees that are using the applicable systems and the number and type of licensed products used by Ocwen and its subsidiaries, HLSS, Residential and AAMC. We record revenue associated with implementation services upon completion and maintenance ratably over the related service period. For Equator’s software applications, we recognize revenue from arrangements with multiple deliverables in accordance with ASC Subtopic 605-25, Revenue Recognition: Multiple-Element Arrangements (“ASC 605-25”), and Securities and Exchange Commission Staff Accounting Bulletin Topic 13, Revenue Recognition (“SAB Topic 13”). ASC 605-25 and SAB Topic 13 require each deliverable within a multiple-deliverable revenue arrangement to be accounted for as a separate unit if both of the following criteria are met: (1) the delivered item or items have value to the customer on a standalone basis and (2) for an arrangement that includes a general right of return relative to the delivered item(s), delivery or performance of the undelivered item(s) is considered probable and substantially in the seller’s control. Deliverables not meeting the criteria for accounting treatment as a separate unit are combined with a deliverable that meets that criterion. Equator derives its revenue from platform services fees, professional services fees and other services. Equator does not begin to recognize revenue for platform services fees until these fees become billable, as the services fees are not fixed and determinable until such time. Platform services fees are recognized ratably over the shorter of the term of the contract with the customer or the minimum cancellation period. Professional services fees consist primarily of configuration services related to customizing the platform for individual customers and are generally billed as the hours are worked. Due to the essential and specialized nature of the configuration services, these services do not qualify as separate units of accounting separate from the platform services as the delivered services do not have value to the customer on a standalone basis. Therefore, the related fees are recorded as deferred revenue until the project configuration is complete and then recognized ratably over the longer of the term of the agreement or the estimated expected customer life. Other services consist primarily of training, including agent certification, and consulting services. These services are generally sold separately and are recognized as revenue as the services are performed and earned. Significant areas of judgment include the period over which we recognize property preservation revenue, certain default management services revenue, certain insurance program management fees and the determination of fair value for certain IT infrastructure services we provide Ocwen and its subsidiaries, HLSS, Residential and AAMC. Management considers historical information and other third party objective evidence on a periodic basis in determining the appropriate revenue recognition. Goodwill and Identifiable Intangible Assets Goodwill We evaluate goodwill for impairment annually during the fourth quarter or more frequently when an event occurs or circumstances change that indicates the carrying value may not be recoverable. We first assess qualitative factors to determine whether it is more likely than not that the fair value of a reporting unit is less than its carrying value as a basis for determining whether we need to perform the quantitative two-step goodwill impairment test. Only if we determine, based on qualitative assessment, that it is more likely than not that a reporting unit’s fair value is less than its carrying value will we calculate the fair value of the reporting unit. We would then test goodwill for impairment by first comparing the book value of net assets to the fair value of the reporting units. If the fair value is determined to be less than the book value, a second step is performed to compute the amount of impairment as the difference between the estimated fair value of goodwill and the carrying value. We estimate the fair value of the reporting units using discounted cash flows. Forecasts of future cash flows are based on our estimate of future sales and operating expenses, based primarily on estimated pricing, sales volumes, market segment share, cost trends and
41
Table of Contents
general economic conditions. Certain estimates of discounted cash flows involve businesses with limited financial history and developing revenue models. Based on the fourth quarter 2013, 2012 and 2011 qualitative and quantitative analyses, management concluded no impairment was indicated given that the fair value for the associated reporting units was substantially in excess of the book value and n o impairments of goodwill were recorded for the years ended December 31, 2013, 2012 and 2011. Identifiable Intangible Assets Identified intangible assets consist primarily of customer relationships, acquired trade names and trademarks. We perform tests for impairment if conditions exist that indicate the carrying value may not be recoverable. When facts and circumstances indicate that the carrying value of intangible assets determined to have definite lives may not be recoverable, management assesses the recoverability of the carrying value by preparing estimates of cash flows of discrete intangible assets consistent with models utilized for internal planning purposes. If the sum of the undiscounted expected future cash flows is less than the carrying value, we would recognize an impairment to the extent the carrying amount exceeds fair value. Based on the fourth quarter 2013, 2012 and 2011 cash flow analyses prepared by management for certain of the intangible assets, no impairments of intangible assets were recorded for the years ended December 31, 2013, 2012 and 2011. Acquisitions For those acquisitions that meet the definition of a business combination, we allocate the purchase price, including any contingent consideration, to the assets acquired and the liabilities assumed at their estimated fair values as of the date of the acquisition with any excess of the purchase price paid over the estimated fair value of net assets acquired recorded as goodwill. The fair value of the assets acquired and liabilities assumed is typically determined by using either estimates of replacement costs or discounted cash flow valuation methods. When determining the fair value of tangible assets acquired, we estimate the cost to replace the asset with a new asset taking into consideration such factors as age, condition and the economic useful life of the asset. When determining the fair value of intangible assets acquired, we estimate the applicable discount rate and the timing and amount of future cash flows, including rate and terms of renewal and attrition. The determination of the final purchase price and the fair values on the acquisition date of the identifiable assets acquired and liabilities assumed may extend over more than one period and result in adjustments to the preliminary estimate recognized. Accounting for Income Taxes We are subject to income taxes principally in Luxembourg, the United States, India and the Philippines. Significant judgment is required in evaluating our tax positions and determining our provision for income taxes. During the ordinary course of business, there are many transactions and estimates for which the ultimate tax determination may vary from year to year. For example, our effective tax rates could be adversely affected by lower than anticipated earnings in countries where we have lower statutory rates and higher than anticipated earnings in countries where we have higher statutory rates, by changes in foreign currency exchange rates or by changes in the relevant tax, accounting and other laws, regulations, principles and interpretations. We are subject to audits in various taxing jurisdictions, and such jurisdictions may assess additional income tax during an examination. Although we believe our tax balances are sufficient to support our future tax liabilities, the final determination of tax audits and any related litigation could differ from the balances we have accrued. Recent Accounting Pronouncement Effective January 1, 2012, the Company adopted new guidance on goodwill impairment testing that simplifies how an entity tests goodwill for impairment. This new guidance allows an entity to first assess qualitative factors to determine whether it is more likely than not that the fair value of a reporting unit is less than its carrying value as a basis for determining whether it needs to perform the quantitative two-step goodwill impairment test. Only if an entity determines, based on qualitative assessment, that it is more likely than not that a reporting unit’s fair value is less than its carrying value will it be required to calculate the fair value of the reporting unit. The qualitative
42
Table of Contents
assessment is optional and the Company is permitted to bypass it for any reporting unit in any period and begin its impairment analysis with the quantitative calculation. In 2013, the Company determined that, based upon the qualitative assessment, the fair value of its reporting units’ goodwill was not less than the carrying values. The Company is permitted to perform the qualitative assessment in any subsequent period. Future Adoption of New Accounting Pronouncement In July 2013, the FASB issued guidance on the disclosure requirements for unrecognized tax benefits, or a portion of an unrecognized tax benefit. This new guidance requires the Company to present an unrecognized tax benefit as a reduction to a deferred tax asset for a net operating loss carryforward, a similar tax loss, or a tax credit carryforward, with some exceptions. This new guidance is effective for fiscal years, and interim periods within those years, beginning after December 15, 2013. We do not anticipate a material impact on our consolidated financial statements as a result of this guidance. OTHER MATTERS Off-Balance Sheet Arrangements Our off-balance sheet arrangements consist of escrow and trust arrangements and operating leases. We hold customers’ assets in escrow and trust accounts at various financial institutions pending completion of certain real estate activities. We also hold cash in trust accounts at various financial institutions where contractual obligations mandate maintaining dedicated bank accounts for Financial Services collections. These amounts are held in escrow and trust accounts for limited periods of time and are not included in the accompanying consolidated balance sheets. Amounts held in escrow and trust accounts were $71.8 million and $47.2 million at December 31, 2013 and 2012, respectively. Contractual Obligations, Commitments and Contingencies Our long-term contractual obligations generally include our long-term debt and operating lease payments on certain of our property and equipment. The following table sets forth information relating to our contractual obligations as of December 31, 2013:
Represents estimated future interest payments on our senior secured term loan based on applicable interest rates as of December 31, 2013. For further information, see Notes 13 and 21 to the consolidated financial statements.
43
Payments due by period
(in thousands) Total
Less than
1 year 1-3 years
3-5 years
More than 5 years
Non-cancelable operating lease obligations
$ 34,408 $ 9,142
$ 15,594 $ 9,534
$ 138
Long-term debt 396,503
3,975 7,950
7,950 376,628
Contractual interest payments
119,702 17,776
35,014 34,299
32,613
Total
$ 550,613 $ 30,893
$ 58,558 $ 51,783
$ 409,379
(1)
(1)
Table of Contents
Related Parties Ocwen For the years ended December 31, 2013, 2012 and 2011, we generated Mortgage Services segment revenue from Ocwen and its subsidiaries of $424.0 million, $306.8 million and $223.2 million, respectively. For the years ended December 31, 2013, 2012 and 2011, we generated Financial Services segment revenue from Ocwen and its subsidiaries of $27.6 million, $0.2 million and $0.3 million, respectively. Also, for the years ended December 31, 2013, 2012 and 2011, we generated Technology Services segment revenue from Ocwen and its subsidiaries of $50.5 million, $31.2 million and $21.8 million, respectively. Services provided to Ocwen and its subsidiaries during this period included residential property valuation, real estate asset management and sales, trustee management services, property inspection and preservation, insurance services, charge-off mortgage collections, core technology back office support and multiple business technologies including our REALSuite of products. We provided all services at rates we believe to be comparable to market rates. For the years ended December 31, 2013, 2012 and 2011, we billed Ocwen and its subsidiaries $2.6 million, $2.7 million and $2.6 million, respectively, and Ocwen and its subsidiaries billed us $2.9 million, $2.4 million and $1.9 million, respectively, for support services such as human resources, vendor management, corporate services, operational effectiveness, quality assurance, quantitative analytics and treasury. See Note 4 to the consolidated financial statements for further information. These amounts are reflected as components of SG&A in the consolidated statements of operations. On December 27, 2012, we entered into a senior unsecured term loan agreement with Ocwen pursuant to which we loaned $75.0 million to Ocwen. Interest income related to this loan for the years ended December 31, 2013 and 2012 was $0.8 million and $0.1 million, respectively (no comparative amount in 2011). On February 15, 2013, Ocwen repaid the entire outstanding principal amount of this loan plus all accrued and unpaid interest and the term loan was terminated. The interest rate at December 31, 2012 was 8.25%. See Note 4 to the consolidated financial statements for further information. On January 31, 2013, we entered into non-binding letters of intent with Ocwen to acquire certain fee-based businesses associated with Ocwen’s acquisitions of the Homeward and the ResCap servicing portfolios. Ocwen acquired the Homeward servicing portfolio on December 27, 2012 and the ResCap servicing portfolio on February 15, 2013. Altisource acquired the Homeward fee-based businesses from Ocwen on March 29, 2013 for $75.8 million, after a working capital and net income adjustment. Altisource entered into an agreement with Ocwen on April 12, 2013 to establish additional terms related to our services in connection with the ResCap fee-based businesses and paid Ocwen $128.8 million for the ResCap fee-based businesses. See Note 5 to the consolidated financial statements for further information. Correspondent One and HLSS In July 2011, we acquired an equity interest in Correspondent One. On March 31, 2013, we sold our 49% interest in Correspondent One to Ocwen for $12.6 million. For the years ended December 31, 2013, 2012 and 2011, we billed Correspondent One less than $0.1 million, $0.4 million and $0.1 million, respectively. We also provided certain origination related services to Correspondent One. We earned revenue of $0.1 million and $0.3 million for the years ended December 31, 2013 and 2012, respectively, for these services (no comparative amount in 2011). For the years ended December 31, 2013 and 2012, we billed HLSS $0.7 million and $0.6 million, respectively (no comparative amount in 2011) for services under a support services agreement. These amounts are reflected as a component of SG&A in the consolidated statements of operations. Residential and AAMC Residential and AAMC were established, capitalized and their equity was distributed to our shareholders on December 21, 2012 and each are separate publicly traded companies (the “ Separation of the Residential Asset Businesses ”). For the year ended December 31, 2013, we billed Residential $2.6 million, and we billed AAMC less than $0.1 million under services and support services agreements (no comparative amounts in 2012 and 2011).
44
Table of Contents
ITEM 7A. QUANTITATIVE AND QUALITATIVE DISCLOSURES ABOUT MARK ET RISK Market Risk Our financial market risk consists primarily of interest rate risk and foreign currency exchange risk. Interest Rate Risk As of December 31, 2013, the interest rate charged on the senior secured term loan was 4.50%. The interest rate is calculated based on the Adjusted Eurodollar Rate (as defined in the senior secured term loan agreement) with a minimum floor of 1.00% plus 3.5%. Based on the principal amount outstanding at December 31, 2013, a 1 percentage point increase in the Eurodollar rate would increase our annual interest expense by approximately $0.7 million, based on the December 31, 2013 Adjusted Eurodollar Rate. Foreign Currency Exchange Risk We are exposed to currency risk from potential changes in currency values of our foreign currency denominated assets, liabilities and cash flows. Our most significant foreign currency exposures relate to the Euro and Indian Rupee; however, the balances in Euros and Indian Rupees on our consolidated balance sheets are immaterial.
45
Table of Contents
ITEM 8. FINANCIAL STATEMENTS AND SUPPLEMENTARY DAT A INDEX TO CONSOLIDATED FINANCIAL STATEMENTS
46
Page Reports of Independent Registered Certified Public Accounting Firm
47 Consolidated Balance Sheets as of December 31, 2013 and 2012
49 Consolidated Statements of Operations for the years ended December 31, 2013, 2012 and 2011
50 Consolidated Statements of Equity for the years ended December 31, 2013, 2012 and 2011
51 Consolidated Statements of Cash Flows for the years ended December 31, 2013, 2012 and 2011
52 Notes to Consolidated Financial Statements
53
Table of Contents
REPORT OF INDEPENDENT REGISTERED PUBLIC ACCOUNTING FIRM
To the Board of Directors and Stockholders of Altisource Portfolio Solutions S.A.: We have audited the accompanying consolidated balance sheets of Altisource Portfolio Solutions S.A. and subsidiaries (the “Company”) as of December 31, 2013 and 2012, and the related consolidated statements of operations, consolidated statements of equity, and cash flows for each of the three years in the period ended December 31, 2013. These financial statements are the responsibility of the Company’s management. Our responsibility is to express an opinion on these financial statements based on our audits. We conducted our audits in accordance with the standards of the Public Company Accounting Oversight Board (United States). Those standards require that we plan and perform the audit to obtain reasonable assurance about whether the financial statements are free of material misstatement. An audit includes examining, on a test basis, evidence supporting the amounts and disclosures in the financial statements. An audit also includes assessing the accounting principles used and significant estimates made by management, as well as evaluating the overall financial statement presentation. We believe that our audits provide a reasonable basis for our opinion. In our opinion, such consolidated financial statements referred to above present fairly, in all material respects, the financial position of Altisource Portfolio Solutions S.A. and subsidiaries as of December 31, 2013 and 2012, and the results of their operations and their cash flows for each of the three years in the period ended December 31, 2013, in conformity with accounting principles generally accepted in the United States of America. As discussed in Note 4 to the consolidated financial statements, the Company has entered into significant transactions with Ocwen Financial Corporation, a related party. We have also audited, in accordance with the standards of the Public Company Accounting Oversight Board (United States), the Company’s internal control over financial reporting as of December 31, 2013, based on the criteria established in Internal Control—Integrated Framework issued by the Committee of Sponsoring Organizations of the Treadway Commission and our report dated February 13, 2014 expressed an unqualified opinion on the Company’s internal control over financial reporting.
47
/s/ Deloitte & Touche LLP
Atlanta, Georgia
February 13, 2014
Table of Contents
REPORT OF INDEPENDENT REGISTERED PUBLIC ACCOUNTING FIRM
To the Board of Directors and Stockholders of Altisource Portfolio Solutions S.A.: We have audited the internal control over financial reporting of Altisource Portfolio Solutions S.A. and subsidiaries (the “Company”) as of December 31, 2013, based on criteria established in Internal Control — Integrated Framework issued by the Committee of Sponsoring Organizations of the Treadway Commission. The Company’s management is responsible for maintaining effective internal control over financial reporting and for its assessment of the effectiveness of internal control over financial reporting, included in the accompanying Management Report on Internal Control over Financial Reporting. Our responsibility is to express an opinion on the Company’s internal control over financial reporting based on our audits. As described in Management’s Report on Internal Control over Financial Reporting , management excluded from its assessment the internal control over financial reporting at Equator, LLC, which was acquired on November 15, 2013 and whose financial statements constitute 17% of total assets and less than 1% of revenues and net income attributable to Altisource of the consolidated financial statement amounts as of and for the year ended December 31, 2013. Accordingly, our audit did not include the internal control over financial reporting at Equator, LLC. We conducted our audit in accordance with the standards of the Public Company Accounting Oversight Board (United States). Those standards require that we plan and perform the audit to obtain reasonable assurance about whether effective internal control over financial reporting was maintained in all material respects. Our audit included obtaining an understanding of internal control over financial reporting, assessing the risk that a material weakness exists, and testing and evaluating the design and operating effectiveness of internal control based on the assessed risk, and performing such other procedures as we considered necessary in the circumstances. We believe that our audit provides a reasonable basis for our opinions. A company’s internal control over financial reporting is a process designed by, or under the supervision of, the company’s principal executive and principal financial officers, or persons performing similar functions, and effected by the company’s board of directors, management, and other personnel to provide reasonable assurance regarding the reliability of financial reporting and the preparation of financial statements for external purposes in accordance with generally accepted accounting principles. A company’s internal control over financial reporting includes those policies and procedures that (1) pertain to the maintenance of records that, in reasonable detail, accurately and fairly reflect the transactions and dispositions of the assets of the company; (2) provide reasonable assurance that transactions are recorded as necessary to permit preparation of financial statements in accordance with generally accepted accounting principles, and that receipts and expenditures of the company are being made only in accordance with authorizations of management and directors of the company; and (3) provide reasonable assurance regarding prevention or timely detection of unauthorized acquisition, use, or disposition of the company’s assets that could have a material effect on the consolidated financial statements. Because of the inherent limitations of internal control over financial reporting, including the possibility of collusion or improper management override of controls, material misstatements due to error or fraud may not be prevented or detected on a timely basis. Also, projections of any evaluation of the effectiveness of the internal control over financial reporting to future periods are subject to the risk that the controls may become inadequate because of changes in conditions, or that the degree of compliance with the policies or procedures may deteriorate. In our opinion, the Company maintained, in all material respects, effective internal control over financial reporting as of December 31, 2013, based on the criteria established in Internal Control — Integrated Framework issued by the Committee of Sponsoring Organizations of the Treadway Commission . We have also audited, in accordance with the standards of the Public Company Accounting Oversight Board (United States), the consolidated financial statements as of and for the year ended December 31, 2013 of the Company and our report dated February 13, 2014 expressed an unqualified opinion on those financial statements and included an explanatory paragraph regarding significant transactions with Ocwen Financial Corporation, a related party.
Distribution of cash in connection with the Separation of the Residential Asset Businesses
— (105,000 ) —
Debt issuance costs
(3,200 ) (4,317 ) —
Principal payments on capital lease obligations (233 ) (603 ) (696 )
Proceeds from stock option exercises 6,885
3,214 1,024
Purchases of treasury stock
(141,018 ) (16,781 ) (62,151 ) Contributions from non-controlling interests
28 43
49
Distributions to non-controlling interests (4,176 ) (7,145 ) (6,776 )
Net cash flows provided by (used in) financing activities 55,292
67,411 (68,550 )
Net increase in cash and cash equivalents
24,822 73,377
9,991
Cash and cash equivalents at the beginning of the period 105,502
32,125 22,134
Cash and cash equivalents at the end of the period
$ 130,324 $ 105,502
$ 32,125
Supplemental cash flow information:
Interest paid
$ 19,325 $ 1,134
$ 83
Income taxes paid (refunded), net 3,671
4,912 (1,956 )
Non-cash investing and financing activities:
Amortization of tax-deductible goodwill
— 3,334
3,367
Premises and equipment purchased on account 4,552
2,457 —
Table of Contents
ALTISOURCE PORTFOLIO SOLUTIONS S.A. Notes to Consolidated Financial Statements
1. ORGANIZATION AND BASIS OF PRESENTATION Altisource Portfolio Solutions S.A., together with its subsidiaries, (which may be referred to as “Altisource,” the “Company,” “we,” “us” or “our”) is a premier marketplace and transaction solutions provider for the real estate, mortgage and consumer debt industries offering both distribution and content. We leverage proprietary business process, vendor and electronic payment management software and behavioral science based analytics to improve outcomes for marketplace participants. We conduct our operations through three reporting segments: Mortgage Services, Financial Services and Technology Services. In addition, we report our corporate related expenditures and eliminations as a separate segment (see Note 22 for a description of our business segments). Basis of Presentation — Our consolidated financial statements include the assets, liabilities, revenue and expenses directly attributable to our operations. All significant intercompany and inter-segment transactions and accounts have been eliminated in consolidation. 2. SUMMARY OF SIGNIFICANT ACCOUNTING POLICIES Basis of Accounting — The consolidated financial statements are prepared in accordance with accounting principles generally accepted in the United States of America (“GAAP”). Principles of Consolidation — The financial statements include the accounts of the Company, its wholly-owned subsidiaries and those entities in which we have a variable interest and are the primary beneficiary. Intercompany balances and transactions have been eliminated. The Mortgage Partnership of America, L.L.C. (“MPA”), a wholly-owned subsidiary of Altisource, serves as the manager of Best Partners Mortgage Cooperative, Inc. (“BPMC”) doing business as Lenders One Mortgage Cooperative (“Lenders One”). MPA provides services to Lenders One under a management agreement that ends on December 31, 2025. MPA acts on behalf of Lenders One and its members principally to provide its members with education and training along with revenue enhancing, cost reducing and market share expanding opportunities. For providing these services, MPA receives payments from Lenders One, and in some instances the vendors, based upon the benefits achieved for the members. The management agreement provides MPA with broad powers such as recruiting members for Lenders One, collection of fees and other obligations from members of Lenders One, processing of all rebates owed to Lenders One, day-to-day operation of Lenders One and negotiation of contracts with vendors including signing contracts on behalf of Lenders One. The management agreement between MPA and Lenders One, pursuant to which MPA is the management company of Lenders One, represents a variable interest in a variable interest entity. MPA is the primary beneficiary of Lenders One as it has the power to direct the activities that most significantly impact Lenders One’s economic performance and the obligation to absorb losses or the right to receive benefits from Lenders One. As a result, Lenders One is presented in the accompanying consolidated financial statements on a consolidated basis with the interests of the members reflected as non-controlling interests. At December 31, 2013, Lenders One had total assets of $4.6 million and liabilities of $3.5 million. At December 31, 2012, Lenders One had total assets of $2.3 million and liabilities of $1.0 million. Use of Estimates — The preparation of financial statements in conformity with GAAP requires estimates and assumptions that affect the reported amounts of assets and liabilities, revenue and expenses, and related disclosures of contingent liabilities in the consolidated financial statements and accompanying notes. Estimates are used for, but not limited to, determining share-based compensation, income taxes, collectability of receivables, valuation of acquired intangibles and goodwill, depreciable lives of fixed assets and contingencies. Actual results could differ materially from those estimates. Cash and Cash Equivalents — We classify all highly liquid instruments with an original maturity of three months or less at the time of purchase as cash equivalents.
53
Table of Contents
ALTISOURCE PORTFOLIO SOLUTIONS S.A. Notes to Consolidated Financial Statements (Continued)
Accounts Receivable, Net — Accounts receivable are net of an allowance for doubtful accounts that represents an amount that we estimate to be uncollectible. We have estimated the allowance for doubtful accounts based on our historical write-offs, our analysis of past due accounts based on the contractual terms of the receivables and our assessment of the economic status of our customers, if known. The carrying value of accounts receivable, net, approximates fair value. Premises and Equipment, Net — We report premises and equipment, net at cost or estimated fair value at acquisition and depreciate these assets over their estimated useful lives using the straight-line method as follows:
Maintenance and repair costs are expensed as incurred. We capitalize expenditures for significant improvements and new equipment and depreciate the assets over the shorter of the capitalized asset’s life or the life of the lease. We review premises and equipment for impairment whenever events or changes in circumstances indicate that the carrying amount of an asset or asset group may not be recoverable. We measure recoverability of assets to be held and used by comparison of the carrying amount of an asset or asset group to estimated undiscounted future cash flows expected to be generated by the asset or asset group. If the carrying amount of an asset or asset group exceeds its estimated future cash flows, we recognize an impairment charge for the amount that the carrying value of the assets exceeds the fair value of the asset or asset group. Computer software includes the fair value of software acquired in business combinations and purchased software. Purchased software is recorded at cost and amortized using the straight-line method over its estimated useful life. Software acquired in business combinations is recorded at its fair value and amortized using the straight-line method over its estimated useful life, ranging from two to three years. Business Combinations — We account for acquisitions using the purchase method of accounting in accordance with the Financial Accounting Standards Board’s Accounting Standards Codification (“ASC”) Topic 805, Business Combinations . The purchase price of an acquisition is allocated to the assets acquired and liabilities assumed using the fair values as of the acquisition date. Investment in Equity Affiliates — We utilize the equity method to account for investments in equity securities where we have the ability to exercise significant influence over operating and financial policies of the investee. We include a proportionate share of losses of equity method investees in equity losses of affiliates, net which is included in other income (expense), net in the consolidated statements of operations. We review investments in equity affiliates for an other than temporary impairment whenever events or circumstances indicate that the carrying value is greater than the value of the investment and the loss is other than a temporary decline. Goodwill — Goodwill represents the excess cost of an acquired business over the fair value of the identifiable tangible and intangible assets acquired and liabilities assumed in a business combination. We evaluate goodwill for impairment annually or more frequently when an event occurs or circumstances change that indicate that the carrying value may not be recoverable. We first assess qualitative factors to determine whether it is more likely than not that the fair value of a reporting unit is less than its carrying value as a basis for determining whether we need to perform the quantitative two-step goodwill impairment test. Only if we determine, based on our qualitative assessment, that it is more likely than not that a reporting unit’s fair value is less than its carrying value will we calculate the fair value of the reporting unit. We test goodwill for impairment by first comparing the book value of net assets to the fair value of the reporting units. If the fair value is determined to be less than the book value, a second step is performed to compute the amount of impairment as the difference between the estimated fair value of goodwill and the carrying value. We estimate the fair value of the reporting units using discounted cash flows. Forecasts of future cash flows are based on our estimate of future sales and operating expenses, based primarily on estimated pricing, sales volumes, market segment share, cost trends and general economic conditions.
54
Furniture and fixtures
5 years
Office equipment 5 years
Computer hardware
5 years
Computer software 3-7 years
Leasehold improvements
Shorter of useful life, 10 years or the term of the lease
Table of Contents
ALTISOURCE PORTFOLIO SOLUTIONS S.A. Notes to Consolidated Financial Statements (Continued)
We conduct our annual impairment assessment as of November 30 each year. No impairments of goodwill were recorded for the years ended December 31, 2013, 2012 and 2011. Intangible Assets, Net — Identifiable intangible assets acquired in business combinations are recorded based on their fair values at the date of acquisition. We determine the useful lives of our identifiable intangible assets after considering the specific facts and circumstances related to each intangible asset. Factors we consider when determining useful lives include the contractual term of any arrangements, the history of the asset, our long-term strategy for use of the asset and other economic factors. We amortize intangible assets that we deem to have definite lives on a straight-line basis over their useful lives, generally ranging from 5 to 20 years. We perform tests for impairment if conditions exist that indicate the carrying value may not be recoverable. When facts and circumstances indicate that the carrying value of intangible assets determined to have definite lives may not be recoverable, management assesses the recoverability of the carrying value by preparing estimates of cash flows of discrete intangible assets consistent with models utilized for internal planning purposes. If the sum of the undiscounted expected future cash flows is less than the carrying value, we would recognize an impairment to the extent the carrying amount exceeds fair value. Based on the fourth quarter 2013, 2012 and 2011 cash flow analyses prepared by management for certain of the intangible assets, no impairments of intangible assets were recorded for the years ended December 31, 2013, 2012 and 2011. Debt Issuance Costs — Debt issuance costs are capitalized and amortized to interest expense through maturity of the related debt using the effective interest method. Long-Term Debt — Long-term debt is reported net of applicable discount. The debt discount is amortized to interest expense through maturity of the related debt using the effective interest method. Fair Value Measurements — Our financial assets and liabilities primarily include cash and cash equivalents, restricted cash, long-term debt and acquisition-related contingent consideration. Cash and cash equivalents and restricted cash are carried at amounts that approximate their fair value due to the short-term nature of these instruments. The fair value was determined by level 1 of the three level hierarchy established by ASC Topic 820, Fair Value Measurement , using quoted prices in active markets for identical assets. The carrying amount of long-term debt approximates fair value due to the variable interest rate. The fair value was determined by level 2 of the three level hierarchy in ASC Topic 820 using inputs other than quoted prices that are observable, either directly or indirectly. The carrying amount of acquisition-related contingent consideration, related to the acquisition of Equator, LLC (“Equator”) on November 15, 2013 (see Note 5), approximates fair value due to the recent closing of the transaction and purchase price allocation calculations. The fair value was determined by level 3 of the three level hierarchy in ASC Topic 820 using unobservable inputs that are supported by little or no market activity and that are significant to the fair value of the assets or liabilities. The Company may be required to pay up to $80 million in potential additional consideration under the terms of the Equator Purchase and Sale Agreement based on Equator Adjusted EBITA (as defined in the Purchase and Sale Agreement) in the three consecutive 12-month periods following closing. Acquisition-related contingent consideration was initially measured and recorded at fair value as an element of consideration paid in connection with an acquisition, with any subsequent adjustments recognized in operating expenses in the consolidated statements of operations. The Company determines the fair value of acquisition-related contingent consideration, and any subsequent changes in fair value, using a discounted probability-weighted approach. This approach takes into consideration level 3 unobservable inputs including probability assessments of expected future cash flows over the period in which the obligation is expected to be settled and applies a discount factor that captures the uncertainties associated with the obligation. Changes in these unobservable inputs could significantly impact the fair value of the liabilities recorded in the accompanying consolidated balance sheets and operating expenses in the consolidated statements of operations. As of December 31, 2013, the Company estimates the value of the Equator acquisition-related contingent consideration required payments to be $46.0 million. Functional Currency — The currency of the primary economic environment in which our operations are conducted is the United States dollar. Therefore, the United States dollar has been determined to be our functional and reporting currency. Non-United States dollar transactions and balances have been measured in United States dollars in accordance with ASC Topic 830, Foreign Currency Matters . All transaction gains and losses from the
55
Table of Contents
ALTISOURCE PORTFOLIO SOLUTIONS S.A. Notes to Consolidated Financial Statements (Continued)
measurement of monetary balance sheet items denominated in non-United States dollar currencies are reflected in the statement of operations as income or expenses, as appropriate. Defined Contribution 401(k) Plan — Some of our employees currently participate in a defined contribution 401(k) plan under which we may make matching contributions equal to a discretionary percentage determined by us. We recorded expense of $0.4 million, $0.2 million and $0.1 million for the years ended December 31, 2013, 2012 and 2011, respectively, related to our discretionary amounts contributed. Share-Based Compensation — Share-based compensation is accounted for under the provisions of ASC Topic 718, Compensation — Stock Compensation . Under ASC Topic 718, the cost of employee services received in exchange for an award of equity instruments is generally measured based on the grant-date fair value of the award. Share-based awards that do not require future service are expensed immediately. Share-based employee awards that require future service are recognized over the relevant service period. Further, as required under ASC Topic 718, we estimate forfeitures for share-based awards that are not expected to vest. Earnings Per Share — We compute earnings per share (“EPS”) in accordance with ASC Topic 260, Earnings Per Share . Basic net income per share is computed by dividing net income attributable to Altisource by the weighted average number of shares of common stock outstanding for the period. Diluted net income per share reflects the assumed conversion of all dilutive securities. Revenue Recognition — We recognize revenue from the services we provide in accordance with ASC Topic 605, Revenue Recognition . ASC Topic 605 sets forth guidance as to when revenue is realized or realizable and earned, which is generally when all of the following criteria are met: (1) persuasive evidence of an arrangement exists; (2) delivery has occurred or services have been performed; (3) the seller’s price to the buyer is fixed or determinable; and (4) collectability is reasonably assured. Generally, the contract terms for these services are relatively short in duration, and we recognize revenue as the services are performed either on a per unit or a fixed price basis. Specific policies for each of our reportable segments are as follows:
Mortgage Services : We recognize revenue for the majority of the services we provide in this segment on completion of the service to our customers. For default processing services and certain property preservation services, we recognize revenue over the period during which we perform the related services, with full recognition on completion of the related foreclosure filing or on closing of the related real estate transaction. We record revenue associated with real estate sales on a net basis as we perform services as an agent without assuming the risks and rewards of ownership of the asset and the commission earned on the sale is a fixed percentage. Reimbursable expenses of $102.0 million, $95.6 million and $80.1 million incurred for the years ended December 31, 2013, 2012 and 2011, respectively, are included in revenue with an equal offsetting expense included in cost of revenue primarily related to our property preservation and default processing services. These amounts are recognized on a gross basis, principally because we have complete control over selection of vendors and the vendor relationship is with us, rather than with our customers. Financial Services : We generally earn our fees for asset recovery management services as a percentage of the amount we collect on delinquent consumer receivables and charged-off mortgages on behalf of our clients and recognize revenue upon collection from the debtors. We also earn fees for packaging and selling charged-off mortgages and recognize revenue after the sale of the notes and once the risks and rewards of the mortgage notes are transferred to the purchasers. In addition, we provide customer relationship management services for which we earn and recognize revenue on a per-call, per-person or per-minute basis as the related services are performed. Technology Services : For our REALSuite platform, we charge based on the number of our clients’ loans processed on the system or on a per-transaction basis. We record transactional revenue when the service is provided and other revenue monthly based on the number of loans processed, employees serviced or services provided. Furthermore, we provide information technology (“IT”) infrastructure services to Ocwen Financial Corporation (“Ocwen”) and its subsidiaries, Home Loan Servicing Solutions, Ltd. (“HLSS”), Altisource Residential Corporation (“Residential”) and Altisource Asset Management Corporation (“AAMC”) and charge for these services primarily based on the number of employees that are using the applicable systems and the number and type of licensed products used by Ocwen and its subsidiaries, HLSS, Residential and AAMC. We
56
Table of Contents
ALTISOURCE PORTFOLIO SOLUTIONS S.A. Notes to Consolidated Financial Statements (Continued)
record revenue associated with implementation services upon completion and maintenance ratably over the related service period.
For Equator’s software applications, we recognize revenue from arrangements with multiple deliverables in accordance with ASC Subtopic 605-25, Revenue Recognition: Multiple-Element Arrangements (“ASC 605-25”), and Securities and Exchange Commission Staff Accounting Bulletin Topic 13, Revenue Recognition (“SAB Topic 13”). ASC 605-25 and SAB Topic 13 require each deliverable within a multiple-deliverable revenue arrangement to be accounted for as a separate unit if both of the following criteria are met: (1) the delivered item or items have value to the customer on a standalone basis and (2) for an arrangement that includes a general right of return relative to the delivered item(s), delivery or performance of the undelivered item(s) is considered probable and substantially in the seller’s control. Deliverables not meeting the criteria for accounting treatment as a separate unit are combined with a deliverable that meets that criterion. Equator derives its revenue from platform services fees, professional services fees and other services. Equator does not begin to recognize revenue for platform services fees until these fees become billable, as the services fees are not fixed and determinable until such time. Platform services fees are recognized ratably over the shorter of the term of the contract with the customer or the minimum cancellation period. Professional services fees consist primarily of configuration services related to customizing the platform for individual customers and are generally billed as the hours are worked. Due to the essential and specialized nature of the configuration services, these services do not qualify as separate units of accounting separate from the platform services as the delivered services do not have value to the customer on a standalone basis. Therefore, the related fees are recorded as deferred revenue until the project configuration is complete and then recognized ratably over the longer of the term of the agreement or the estimated expected customer life. Other services consist primarily of training, including agent certification, and consulting services. These services are generally sold separately and are recognized as revenue as the services are performed and earned.
Income Taxes — We account for certain income and expense items differently for financial purposes and income tax purposes. We recognize deferred income tax assets and liabilities for these differences between the financial reporting basis and the tax basis of our assets and liabilities as well as expected benefits of utilizing net operating loss and credit carryforwards. The most significant temporary differences relate to accrued compensation, amortization and loss and credit carryforwards. We measure deferred income tax assets and liabilities using enacted tax rates expected to apply to taxable income in the years in which we anticipate recovery or settlement of those temporary differences. The effect on deferred tax assets and liabilities of a change in tax rates is recognized in income in the period when the change is enacted. Deferred tax assets are reduced by a valuation allowance when it is more likely than not that some portion or all of the deferred assets will not be realized. Tax laws are complex and subject to different interpretations by the taxpayer and respective governmental taxing authorities. Significant judgment is required in determining tax expense and in evaluating tax positions including evaluating uncertainties under ASC Topic 740, Income Taxes . Adoption of New Accounting Pronouncement Effective January 1, 2012, the Company adopted new guidance on goodwill impairment testing that simplifies how an entity tests goodwill for impairment. This new guidance allows an entity to first assess qualitative factors to determine whether it is more likely than not that the fair value of a reporting unit is less than its carrying value as a basis for determining whether it needs to perform the quantitative two-step goodwill impairment test. Only if an entity determines, based on qualitative assessment, that it is more likely than not that a reporting unit’s fair value is less than its carrying value will it be required to calculate the fair value of the reporting unit. The qualitative assessment is optional and the Company is permitted to bypass it for any reporting unit in any period and begin its impairment analysis with the quantitative calculation. In 2013, the Company determined that, based upon the qualitative assessment, the fair value of its reporting units’ goodwill was not less than the carrying values. The Company is permitted to perform the qualitative assessment in any subsequent period. Future Adoption of New Accounting Pronouncement In July 2013, the Financial Accounting Standards Board issued guidance on the disclosure requirements for unrecognized tax benefits, or a portion of an unrecognized tax benefit. This new guidance requires the Company to present an unrecognized tax benefit as a reduction to a deferred tax asset for a net operating loss carryforward, a
57
Table of Contents
ALTISOURCE PORTFOLIO SOLUTIONS S.A. Notes to Consolidated Financial Statements (Continued)
similar tax loss, or a tax credit carryforward, with some exceptions. This new guidance is effective for fiscal years, and interim periods within those years, beginning after December 15, 2013. We do not anticipate a material impact on our consolidated financial statements as a result of this guidance. 3. SEPARATION OF RESIDENTIAL ASSET BUSINESSES On December 21, 2012, we completed the spin-offs of two wholly-owned subsidiaries, AAMC and Residential, into separate publicly traded companies (the “Separation of the Residential Asset Businesses”). Altisource shareholders of record as of December 17, 2012 received a pro rata distribution of:
• one share of Residential common stock for every three shares of Altisource common stock held; • one share of AAMC common stock for every ten shares of Altisource common stock held and • received cash in lieu of Residential and AAMC fractional shares.
We eliminated the assets and liabilities of Residential and AAMC from our consolidated balance sheet effective at the close of business on December 21, 2012. As Residential and AAMC were development stage companies and had not commenced operations at the date of separation, these entities had no historical results of operations. The carrying value of the net assets transferred by Altisource was as follows:
We incurred $2.7 million of expenses for the year ended December 31, 2012 representing salaries of certain employees who became employees of AAMC after the separation (included in cost of revenue) and advisory expenses (included in selling, general and administrative expenses) incurred in connection with the Separation of the Residential Asset Businesses. These expenses are included in our Mortgage Services segment. Impact on Share-Based Compensation The exercise price of each outstanding stock option of Altisource was adjusted to reflect the value of Residential and AAMC common stock distributed to Altisource shareholders. On the separation date, all holders of Altisource stock options received the following:
• stock options (issued by Residential and AAMC) to acquire the number of shares of Residential or AAMC common stock equal to the product of (a) the number of Altisource stock options held on the separation date and (b) the distribution ratio of 1 share of Residential common stock for every 3 shares of Altisource common stock and 1 share of AAMC stock for every 10 shares of Altisource common stock and
• an adjusted Altisource stock option, with a reduced exercise price per stock option.
4. TRANSACTIONS WITH RELATED PARTIES Ocwen Ocwen, together with its subsidiaries, is our largest customer. Our Chairman is also the Chairman of Ocwen. Ocwen is contractually obligated to purchase certain mortgage services and technology services from us through August 2025 under the terms of a master services agreement and amendments to the master services agreement (collectively, the “Service Agreements”). In connection with our acquisition from
58
(in thousands) Residential
AAMC Total
Cash
$ 100,000 $ 5,000
$ 105,000
Reduction in Altisource retained earnings
$ 100,000 $ 5,000
$ 105,000
Table of Contents
ALTISOURCE PORTFOLIO SOLUTIONS S.A. Notes to Consolidated Financial Statements (Continued)
Ocwen of the fee-based businesses of Homeward Residential, Inc. (“Homeward”) that closed on March 29, 2013 and the acquisition from Ocwen related to the fee-based businesses of Residential Capital, LLC (“ResCap”) that closed on April 12, 2013 (see Note 5), our Service Agreements with Ocwen were amended to extend the term from 2020 to 2025. Further, as part of the amendments, we are the exclusive provider of services to Ocwen with respect to the Homeward and ResCap servicing portfolios, and Ocwen agreed not to establish similar fee-based businesses that would directly or indirectly compete with Altisource’s services with respect to the Homeward and ResCap businesses. We settle amounts with Ocwen on a daily, weekly or monthly basis depending upon the nature of the service and when the service is provided. Related party revenue consists of revenue earned directly from Ocwen and its subsidiaries and revenue earned from the loans serviced by Ocwen and its subsidiaries when Ocwen designates us as the service provider. We earn additional revenue on the portfolios serviced by Ocwen and its subsidiaries that are not considered related party revenue when a party other than Ocwen selects Altisource as the service provider. Related party revenue as a percentage of segment and consolidated revenue was as follows for the years ended December 31:
We record revenue we earn from Ocwen and its subsidiaries under various long-term servicing contracts at rates we believe to be market rates as they are consistent with one or more of the following: the fees we charge to other customers for comparable services, the fees Ocwen pays to other service providers and fees charged by our competitors. Support Services We have support services agreements with Ocwen and its subsidiaries. These services include such areas as human resources, vendor management, corporate services, operational effectiveness, quality assurance, quantitative analytics and treasury. Payment for the services provided is based on the fully-allocated cost of providing the service based on an estimate of the time and expense of providing the service. For the years ended December 31, 2013, 2012 and 2011, we billed Ocwen and its subsidiaries $2.6 million, $2.7 million and $2.6 million, respectively, and Ocwen and its subsidiaries billed us $2.9 million, $2.4 million and $1.9 million, respectively, for services provided under these agreements. These amounts are reflected as a component of selling, general and administrative expenses in the consolidated statements of operations. Unsecured Term Loan On December 27, 2012, we entered into a senior unsecured term loan agreement with Ocwen under which we loaned $75.0 million to Ocwen. Payments of interest were due quarterly at a rate per annum equal to the Eurodollar Rate (as defined in the agreement) plus 6.75%, provided that the Eurodollar Rate shall at no time be less than 1.50%. On February 15, 2013, Ocwen repaid the outstanding principal amount of $75.0 million, plus all accrued and unpaid interest and the term loan was terminated. Interest income related to this loan was $0.8 million and $0.1 million for the years ended December 31, 2013 and 2012, respectively (no comparative amount for 2011). Transactions Related to Fee-Based Businesses On January 31, 2013, we entered into non-binding letters of intent with Ocwen to acquire certain fee-based businesses associated with Ocwen’s acquisitions of the Homeward and ResCap servicing portfolios. Ocwen acquired the Homeward servicing portfolio on December 27, 2012 and the ResCap servicing portfolio on February 15, 2013. Altisource acquired the Homeward fee-based businesses from Ocwen on March 29, 2013 (see Note 5). Altisource entered into an agreement with Ocwen on April 12, 2013 to establish additional terms related to our services in connection with the ResCap fee-based businesses (see Note 5).
59
2013 2012
2011
Mortgage Services
71% 68%
72%
Financial Services 30%
< 1% < 1%
Technology Services
49% 42%
39%
Consolidated revenue 65%
60% 58%
Table of Contents
ALTISOURCE PORTFOLIO SOLUTIONS S.A. Notes to Consolidated Financial Statements (Continued)
Correspondent One and HLSS In July 2011, we acquired an equity interest in Correspondent One S.A. (“Correspondent One”) (see Note 10). Correspondent One purchased closed conforming and government guaranteed residential mortgages from approved mortgage bankers. On March 31, 2013, we sold our 49% interest in Correspondent One to Ocwen for $12.6 million. Under a support services agreement, we provided Correspondent One certain finance, human resources, legal support, facilities, technology, vendor management and risk management services. For the years ended December 31, 2013, 2012 and 2011, we billed Correspondent One less than $0.1 million, $0.4 million and $0.1 million, respectively. We also provided certain origination related services to Correspondent One. We earned revenue of $0.1 million and $0.3 million for the years ended December 31, 2013 and 2012, respectively, for these services (no comparative amount in 2011). HLSS is a publicly traded company whose primary objective is the acquisition of mortgage servicing rights and advances. In connection with the February 2012 HLSS initial public offering and subsequent thereto, HLSS acquired mortgage servicing related assets from Ocwen. Our Chairman is also the Chairman of HLSS. Under a support services agreement, we provide HLSS certain finance, human resources and legal support services. For the years ended December 31, 2013 and 2012, we billed HLSS $0.7 million and $0.6 million, respectively (no comparative amount in 2011). These amounts are reflected as a component of selling, general and administrative expenses in the consolidated statements of operations. Residential and AAMC Residential and AAMC were established, capitalized and their equity was distributed to our shareholders on December 21, 2012 and are each separate publicly traded companies. Residential is focused on acquiring and managing single family rental properties by acquiring portfolios of sub-performing and non-performing residential mortgage loans throughout the United States. AAMC is an asset management company providing portfolio management and corporate governance services to Residential. Our Chairman is also the Chairman of Residential and AAMC. For purposes of governing certain ongoing relationships between Altisource, Residential and AAMC after the Separation of the Residential Asset Businesses, and to provide for an orderly transition, we entered into certain agreements with Residential and AAMC. We have agreements to provide Residential with renovation management, lease management and property management services. In addition, we have agreements with Residential and AAMC to provide support services such as finance, human resources, legal support, facilities, technology, vendor management and risk management. Further, we have separate agreements for certain services related to income tax matters, trademark licenses and technology products and services. For the year ended December 31, 2013, we billed Residential $2.6 million, and we billed AAMC less than $0.1 million, under these agreements (no comparative amounts in 2012 and 2011). 5. ACQUISITIONS Homeward Fee-Based Businesses On March 29, 2013, we acquired certain fee-based businesses associated with Ocwen’s acquisition of Homeward. As part of the acquisition, Ocwen agreed not to develop similar fee-based businesses that would directly or indirectly compete with services provided by Altisource relative to the Homeward servicing portfolio. Additionally, the terms of our service agreements with Ocwen were amended to extend the term from 2020 to 2025 (see Note 4). We paid $75.8 million, after a working capital and net income adjustment of $11.1 million, for the Homeward fee-based businesses. From the acquisition date through December 31, 2013, we recorded service revenue of $108.8 million and we estimate pre-tax income is $24.3 million related to these businesses. Since the acquisition date, management adjusted the preliminary purchase price allocation and assigned associated asset lives based upon information that has become available. In addition to the working capital adjustment, we also reduced premises and equipment by $1.2 million based on a post-acquisition detailed analysis of software licenses received. The purchase price allocation and assessment of asset lives will continue to be revised as additional
60
® ™
Table of Contents
ALTISOURCE PORTFOLIO SOLUTIONS S.A. Notes to Consolidated Financial Statements (Continued)
information about the fair value of assets and liabilities becomes available. Such assessment must be completed within 12 months from the acquisition date. The preliminary adjusted allocation of the purchase price is estimated as follows:
ResCap Fee-Based Businesses On April 12, 2013, we entered into an agreement with Ocwen to establish additional terms related to the existing servicing arrangements between Altisource and Ocwen in connection with certain mortgage servicing platform assets of ResCap (the “ResCap Business”). The Service Agreements provide that (i) Altisource will be the exclusive provider, except as prohibited by applicable law, to Ocwen of certain services related to the ResCap Business, (ii) Ocwen will not establish similar fee-based businesses that would directly or indirectly compete with Altisource’s services as they relate to the ResCap Business and (iii) Ocwen will market and promote the utilization of Altisource’s services to their various third party relationships. Additionally, the parties agreed to use commercially reasonable best efforts to ensure that the loans associated with the ResCap Business are boarded onto Altisource’s mortgage servicing platform. We paid $128.8 million ($80.0 million on April 12, 2013 and $48.8 million on May 10, 2013) for the ResCap fee-based businesses. From the acquisition date through December 31, 2013, we recorded service revenue of $59.4 million and we estimate pre-tax income is $19.9 million related to these businesses. We acquired no tangible assets and assumed no liabilities in connection with the acquisition. However, certain employees as well as practices and processes developed to support the ResCap servicing portfolio were components of the transaction. We accounted for this transaction as a business combination in accordance with ASC Topic 805. Management prepared a final purchase price allocation and assigned associated asset lives based upon available information at the time of the agreement and through the date of filing. The agreement consideration of $128.8 million was fully allocated to the customer relationship intangible asset with an estimated average useful life of 7 years. Equator Acquisition On November 15, 2013, we completed the acquisition of all of the outstanding limited liability company interests of Equator pursuant to the previously reported Purchase and Sale Agreement dated as of August 19, 2013 (the “Purchase Agreement”). Pursuant to the terms of the Purchase Agreement, we paid $63.4 million at closing in cash (net of closing working capital adjustments), subject to certain post-closing adjustments based on current assets and current liabilities of Equator at closing, to be settled within 90 days of the closing date. Additionally, the Purchase Agreement provides for the payment of up to $80 million in potential additional consideration (the “Earn Out”). The Earn Out consideration is determined based on Equator Adjusted EBITA (as defined in the Purchase Agreement) in the three consecutive 12-month periods following closing. Up to $22.5 million of the Earn Out consideration can be earned in each of the first two 12-month periods, and up to $35.0 million can be earned in the third 12-month period.
61
(in thousands)
Premises and equipment
$ 1,559
Customer relationship 75,609
77,168
Accounts payable and accrued expenses
(1,351 ) Purchase price
$ 75,817
Estimated life
(in years)
Premises & equipment
3 - 5
Customer relationship 7
Table of Contents
ALTISOURCE PORTFOLIO SOLUTIONS S.A. Notes to Consolidated Financial Statements (Continued)
Any amounts earned upon the achievement of Adjusted EBITA thresholds are payable through 2017. We may, in our discretion, pay up to 20% of each payment of any Earn Out consideration in shares of Company restricted stock, with the balance to be paid in cash. From the acquisition date through December 31, 2013, we recorded service revenue of $7.5 million, and pre-tax loss is $1.0 million. The preliminary adjusted allocation of the purchase price is estimated as follows:
The following tables present the unaudited pro forma consolidated results of operations as if the Homeward, ResCap Business and Equator transactions had occurred at the beginning of the earliest period presented.
The unaudited pro forma information presents the combined operating results of Altisource and the Homeward, ResCap Business and Equator transactions. The Homeward, ResCap Business and Equator operating results were derived from their historical financial statements for the most comparable periods available. The results prior to the
62
(in thousands)
Accounts receivable
$ 9,293
Prepaid expenses and other current assets 954
Premises and equipment
16,974
Customer relationships and trade names 43,393
Goodwill
82,460
Other non-current assets 242
Assets acquired
153,316
Accounts payable and accrued expenses (7,232 )
Deferred revenue (36,689 )
Liabilities assumed (43,921 )
Purchase price
$ 109,395
The Equator purchase price includes the fair value of the Earn Out of $46.0 million, determined based on the present value of future estimated Earn Out payments.
Estimated life
(in years)
Premises and equipment (excluding internally developed software)
3 - 5
Internally developed software (included in premises and equipment) 7
Customer relationships
7 - 15
Trade names 4
Year ended
December 31, 2013
(in thousands, except per share amounts) As reported
Pro forma
Revenue $ 768,357
$ 854,098
Net income attributable to Altisource 129,973
132,907
Earnings per share — diluted 5.19
5.31
Year ended
December 31, 2012
(in thousands, except per share amounts) As reported
Pro forma
Revenue $ 568,360
$ 781,834
Net income attributable to Altisource 110,627
129,229
Earnings per share — diluted 4.43
5.18
Table of Contents
ALTISOURCE PORTFOLIO SOLUTIONS S.A. Notes to Consolidated Financial Statements (Continued)
acquisition dates have been adjusted to include the pro forma impact of the adjustment of amortization of the acquired intangible assets based on the preliminary purchase price allocations, the adjustment of interest expense reflecting the portion of our $200 million senior secured term loan, increased to $400 million on May 7, 2013, and Amendment No. 2 to the senior secured term loan agreement dated as of December 9, 2013 used in the Homeward, ResCap Business and Equator transactions and to reflect the impact of income taxes on the pro forma adjustments utilizing Altisource’s effective income tax rate in each period presented. The unaudited pro forma results are presented for illustrative purposes only and do not reflect additional revenue opportunities, the realization of any potential cost savings and any related integration costs. Certain revenue opportunities and cost savings may result from the transactions and the conversion to the Altisource model; however, there can be no assurance that these revenue opportunities and cost savings will be achieved. These pro forma results do not purport to be indicative of the results that would have actually been obtained if the transactions occurred as of the beginning of each of the periods presented, nor is the pro forma data intended to be a projection of results that may be obtained in the future. 6. ACCOUNTS RECEIVABLE, NET Accounts receivable, net consists of the following as of December 31:
Unbilled fees consist primarily of asset management and default management services for which we recognize revenues over the service delivery period but bill following completion of the service.
63
(in thousands) 2013
2012
Billed
Non-related parties
$ 39,588 $ 25,950
Ocwen
11,410 19,817
Correspondent One
— 27
HLSS
83 163
AAMC
1,347 14
Residential
547 —
Other receivables
1,642 353
54,617
46,324
Unbilled
Non-related parties 42,284
39,496
Ocwen 10,027
6,377
Correspondent One —
32
106,928 92,229
Allowance for doubtful accounts
(5,631 ) (3,274 ) Total
$ 101,297 $ 88,955
Table of Contents
ALTISOURCE PORTFOLIO SOLUTIONS S.A. Notes to Consolidated Financial Statements (Continued)
A summary of the allowance for doubtful accounts, net of recoveries, for the years ended December 31, 2013, 2012 and 2011 is as follows:
7. PREPAID EXPENSES AND OTHER CURRENT ASSETS Prepaid expenses and other current assets consist of the following as of December 31:
8. PREMISES AND EQUIPMENT, NET Premises and equipment, net, which include amounts recorded under capital leases, consists of the following as of December 31:
Depreciation and amortization expense, inclusive of capital lease obligations, amounted to $19.1 million, $12.8 million and $8.4 million for the years ended December 31, 2013, 2012 and 2011, respectively, and is included in cost of revenue for operating assets and in selling, general and administrative expenses for non-operating assets in the accompanying consolidated statements of operations.
64
(in thousands)
Balance, January 1, 2011
$ 2,132
Bad debt expense 967
Recoveries
(54 ) Write-offs
(998 ) Balance, December 31, 2011
2,047
Bad debt expense 3,049
Recoveries
(21 ) Write-offs
(1,801 ) Balance, December 31, 2012
3,274
Bad debt expense 2,549
Recoveries
(21 ) Write-offs
(171 ) Balance, December 31, 2013
$ 5,631
(in thousands) 2013
2012
Maintenance agreements, current portion
$ 4,600 $ 3,636
Income taxes receivable
1,645 1,814
Prepaid expenses
4,191 1,640
Other current assets
953 528
Total
$ 11,389 $ 7,618
(in thousands) 2013
2012
Computer hardware and software
$ 103,400 $ 68,329
Office equipment and other
28,057 15,592
Furniture and fixtures
8,391 5,344
Leasehold improvements
17,574 12,982
157,422
102,247
Less: Accumulated depreciation and amortization (70,170 ) (51,848 )
Total
$ 87,252 $ 50,399
Table of Contents
ALTISOURCE PORTFOLIO SOLUTIONS S.A. Notes to Consolidated Financial Statements (Continued)
9. GOODWILL AND INTANGIBLE ASSETS, NET Goodwill Goodwill primarily relates to the acquisitions of Equator, MPA, Springhouse, LLC and Tracmail. Changes in goodwill during the years ended December 31, 2013 and 2012 are summarized below:
Intangible Assets, Net Intangible assets relate to our acquisitions of the Homeward and ResCap fee-based businesses, Equator, MPA and Nationwide Credit, Inc. (“NCI”) (see Note 5). No impairment charges were taken during the periods presented. Intangible assets, net consist of the following as of December 31, 2013 and 2012:
(a) Prior to our acquisition of NCI in 2007, NCI completed an acquisition which created tax-deductible goodwill that amortizes for tax purposes over time. When we acquired NCI in 2007, we recorded a lesser amount of goodwill for financial reporting purposes than what had previously been recorded at NCI for tax purposes. This difference between the amount of goodwill recorded for financial reporting purposes and the amount recorded for taxes is referred to as “Component 2” goodwill and resulted in our recording periodic reductions first to our book goodwill balance in our consolidated financial statements. As our book goodwill balance was fully written off at December 31, 2010, we continued to amortize the remaining Component 2 goodwill for United States tax purposes by reducing certain intangible assets by the remaining tax benefits of the Component 2 goodwill as they are realized in our tax returns. The reduction in intangible assets was $3.3 million and $3.4 million for the years ended December 31, 2012 and 2011, respectively. Component 2 goodwill was fully amortized in 2012.
Amortization expense for definite lived intangible assets was $28.2 million, $5.0 million and $5.3 million for the years ended December 31, 2013, 2012 and 2011, respectively. Expected annual amortization for 2014 through 2018, is $44.2 million, $40.3 million, $34.4 million, $29.1 million and $24.0 million, respectively.
65
Mortgage Financial
Technology
(in thousands) Services
Services Services
Total
Balance, January 1, 2012 and December 31, 2012
$ 10,919 $ 2,378
$ 1,618 $ 14,915
Acquisition of Equator
— —
82,460 82,460
Balance, December 31, 2013
$ 10,919 $ 2,378
$ 84,078 $ 97,375
Weighted
average
estimated Accumulated
useful life
Gross carrying amount amortization
Net book value
(dollars in thousands) (years)
2013 2012
2013 2012
2013 2012
Definite lived intangible assets
Trademarks
14 $ 12,249
$ 10,614 $ (4,534 ) $ (4,060 ) $ 7,715
$ 6,554
Customer-related intangible assets 10
284,484 38,366
(44,208 ) (18,567 )(a) 240,276 19,799
Operating agreement
20 35,000
35,000 (6,854 ) (5,104 ) 28,146
29,896
Non-compete agreement 4
1,300 1,300
(1,275 ) (963 ) 25 337
Total $ 333,033
$ 85,280 $ (56,871 ) $ (28,694 ) $ 276,162
$ 56,586
Table of Contents
ALTISOURCE PORTFOLIO SOLUTIONS S.A. Notes to Consolidated Financial Statements (Continued)
10. INVESTMENT IN EQUITY AFFILIATES Correspondent One purchased closed conforming and government guaranteed residential mortgages from approved mortgage bankers. Prior to the sale of our interest in Correspondent One to Ocwen on March 31, 2013 (see Note 4), we had significant influence over the general operations of Correspondent One consistent with our 49% ownership level, and therefore, accounted for our investment under the equity method. On March 31, 2013, we sold our 49% interest in Correspondent One to Ocwen for $12.6 million. Our loss in equity affiliates was $0.2 million, $1.2 million and $0.5 million for the years ended December 31, 2013, 2012 and 2011, respectively. In the first quarter of 2013, we anticipated entering into an agreement to sell all of our equity interest in Correspondent One to Ocwen for approximately $12.7 million. As a result, we recorded a $0.6 million impairment loss as of December 31, 2012, representing the difference between the expected sales price and the carrying value as of December 31, 2012. The loss was included within loss in equity affiliates in other income (expense), net in the consolidated statements of operations. 11. OTHER ASSETS Other assets consist of the following as of December 31:
Debt issuance costs of $3.2 million and $4.3 million were capitalized for the years ended December 31, 2013 and 2012, respectively, in connection with issuing and refinancing our long-term debt (see Note 13). In connection with the acquisition of Equator (see Note 5), we executed a standby letter of credit in the amount of $1.5 million, secured by a restricted cash balance. 12. ACCOUNTS PAYABLE, ACCRUED EXPENSES AND OTHER CURRENT LIABILITIES Accounts payable and accrued expenses consist of the following as of December 31:
66
(in thousands) 2013
2012
Security deposits, net
$ 7,291 $ 5,019
Debt issuance costs, net
6,687 4,260
Maintenance agreements, non-current portion
1,465 1,614
Restricted cash
1,620 158
Other
517 623
Total
$ 17,580 $ 11,674
(in thousands) 2013
2012
Accounts payable
$ 11,600 $ 5,079
Accrued expenses - general
21,547 16,528
Accrued salaries and benefits
29,805 19,613
Income taxes payable
11,211 8,750
Payable to Ocwen
5,322 8,865
Payable to AAMC
7 141
Total
$ 79,492 $ 58,976
Table of Contents
ALTISOURCE PORTFOLIO SOLUTIONS S.A. Notes to Consolidated Financial Statements (Continued)
Other current liabilities consist of the following as of December 31:
13. LONG-TERM DEBT Long-term debt consists of the following as of December 31:
On November 27, 2012, we entered into a senior secured term loan agreement, as subsequently amended, with Bank of America, N.A., as administrative agent, and certain lenders, pursuant to which we borrowed $200 million. The senior secured term loan was issued with a 1.0% original issue discount of $2.0 million, resulting in net proceeds of $198.0 million (the “Initial Proceeds”), with the Company and certain wholly-owned subsidiaries acting as guarantors (collectively, the “Guarantors”). The Initial Proceeds were used to capitalize Residential and AAMC (see Note 3), and also to pay certain fees, commissions and expenses in connection with the senior secured term loan agreement. The Initial Proceeds were also used for general corporate purposes, including acquisitions and investments permitted under the senior secured term loan agreement. On May 7, 2013, we amended the senior secured term loan agreement to increase the principal amount of the senior secured term loan by $200 million (the “Incremental Term Loan”), which was issued with a $1.0 million original issue premium, resulting in gross proceeds to the Company of $201.0 million. The Incremental Term Loan was used to fund a portion of the Company’s previously announced transaction with Ocwen related to the ResCap servicing portfolio (see Note 5), with the remainder to be used for stock repurchases and for general corporate purposes, including additional acquisitions. The Incremental Term Loan was also used to pay certain fees, commissions and expenses in connection with the Incremental Term Loan. The Company paid costs associated with the Incremental Term Loan of $2.4 million, which were recorded as debt issuance costs in other assets in the accompanying consolidated balance sheets. Additionally, the Incremental Term Loan amended the senior secured term loan agreement to, among other changes, provide for an additional $200 million incremental term loan facility accordion borrowings and increase the maximum amount of Restricted Payments (as defined in the senior secured term loan) that may be made by us, including increasing the amount of Company share repurchases permitted. On December 9, 2013, we entered into an Amendment No. 2 (“Second Amendment”) to the senior secured term loan agreement in which we incurred indebtedness in the form of Refinancing Debt (as defined in the senior secured term loan agreement), the proceeds of which were used to refinance, in full, the $397.5 million of term loans outstanding under the senior secured term loan agreement immediately prior to the effectiveness of the Second Amendment. The Refinancing Debt bears interest at lower rates and has a maturity date approximately one year
67
(in thousands) 2013
2012
Book overdrafts
$ 4,232 $ 5,229
Other
5,899 2,712
Total
$ 10,131 $ 7,941
(in thousands) 2013
2012
Senior secured term loan
$ 396,503 $ 200,000
Less: unamortized discount, net
(1,247 ) (1,973 ) Net long-term debt
395,256 198,027
Less: current portion
(3,975 ) (2,000 ) Long-term debt, less current portion
$ 391,281 $ 196,027
Table of Contents
ALTISOURCE PORTFOLIO SOLUTIONS S.A. Notes to Consolidated Financial Statements (Continued)
later than the prior term loans. The Second Amendment further modified the senior secured term loan agreement to, among other changes, increase the maximum permitted amount of Restricted Junior Payments (as defined in the senior secured term loan agreement), including share repurchases by the Company.
The refinanced term loans under the senior secured term loan agreement must be repaid in equal consecutive quarterly principal installments of $1.0 million commencing on December 31, 2013, with the balance due at maturity. After giving effect to the Second Amendment, all amounts outstanding under the senior secured term loan agreement will become due on the earlier of (i) December 9, 2020, being the seventh anniversary of the closing date of the Second Amendment and (ii) the date on which the loans are declared to be due and owing by the administrative agent at the request (or with the consent) of the Required Lenders (as defined in the senior secured term loan agreement) upon the occurrence of any event of default under the senior secured term loan agreement. In addition to the scheduled principal payments, the Refinanced Debt is (with certain exceptions) subject to mandatory prepayment upon issuances of debt, casualty and condemnation events and sales of assets, as well as from a percentage of excess cash flow (as defined in the senior secured term loan agreement) if the leverage ratio (as defined in the senior secured term loan agreement) is greater than 2.75 to 1.00. No mandatory prepayments were owed for the year ended December 31, 2013. We are permitted to make voluntary prepayments without penalty after June 9, 2014. If prepayments are made prior to June 9, 2014, a fee of 1.0% of the principal amount of the prepaid term loans will be incurred. After giving effect to the Second Amendment, all of the term loans outstanding under the senior secured term loan bear interest at rates based upon, at our option, the Adjusted Eurodollar Rate or the Base Rate (each as defined in the senior secured term loan agreement). Adjusted Eurodollar Rate loans bear interest at a rate per annum equal to the sum of (i) the greater of (x) the Adjusted Eurodollar Rate for the applicable interest period and (y) 1.00% plus (ii) a 3.50% margin. Base Rate loans bear interest at a rate per annum equal to the sum of (i) the greater of (x) the Base Rate and (y) 2.00% plus (ii) a 2.50% margin. The interest rate at December 31, 2013 was 4.50%. Payments under the senior secured term loan agreement are guaranteed by the Guarantors and are secured by a pledge of all equity interests of certain subsidiaries, as well as a lien on substantially all of the assets of Altisource Solutions S.à r.l., a wholly-owned subsidiary of Altisource, and the Guarantors, subject to certain exceptions. The senior secured term loan agreement includes covenants that restrict or limit, among other things, our ability to: create liens and encumbrances; incur additional indebtedness; sell, transfer or dispose of assets; change lines of business; amend material debt agreements or other material contracts; engage in certain transactions with affiliates; enter into sale/leaseback transactions; grant negative pledges or agree to such other restrictions relating to subsidiary dividends and distributions; make changes to its fiscal year and engage in mergers and consolidations. The senior secured term loan agreement contains certain events of default, including (i) failure to pay principal when due or interest or any other amount owing on any other obligation under the senior secured term loan agreement within 5 days of becoming due, (ii) material incorrectness of representations and warranties when made, (iii) breach of covenants, (iv) failure to pay principal or interest on any other debt that equals or exceeds $40.0 million when due, (v) default on any other debt that equals or exceeds $40.0 million that causes, or gives the holder or holders of such debt the ability to cause, an acceleration of such debt, (vi) occurrence of a Change in Control (as defined in the senior secured term loan agreement), (vii) bankruptcy and insolvency events (as defined in the senior secured term loan agreement), (viii) entry by a court of one or more judgments against us (as defined in the senior secured term loan agreement) in an amount in excess of $40.0 million that remain unbonded, undischarged or unstayed for a certain number of days after the entry thereof, (ix) the occurrence of certain ERISA events and (x) the failure of certain Loan Documents (as defined in the senior secured term loan agreement) to be in full force and effect. If any event of default occurs and is not cured within applicable grace periods set forth in the senior secured term loan agreement or waived, all loans and other obligations could become due and immediately payable and the facility could be terminated. At December 31, 2013, debt issuance costs were $6.7 million, net of $1.0 million of accumulated amortization. At December 31, 2012, debt issuance costs were $4.3 million, net of $0.1 million of accumulated amortization. Debt issuance costs are included in other assets in the accompanying consolidated balance sheets.
68
Table of Contents
ALTISOURCE PORTFOLIO SOLUTIONS S.A. Notes to Consolidated Financial Statements (Continued)
Interest expense on the term loans, including amortization of debt issuance costs and the net debt discount, totaled $20.3 million and $1.2 million for the years ended December 31, 2013 and 2012, respectively (no comparative amount in 2011). Maturities of our long-term debt are as follows:
14. OTHER NON-CURRENT LIABILITIES Other non-current liabilities consist of the following as of December 31:
15. STOCKHOLDERS’ EQUITY AND SHARE-BASED COMPENSAT ION Common Stock Our Board of Directors has the power to issue shares of authorized but unissued common stock without further shareholder action subject to the requirements of applicable laws and stock exchanges. At December 31, 2013, we had 100.0 million shares authorized. At December 31, 2013, we had 22.6 million shares of common stock outstanding. The holders of shares of Altisource common stock are entitled to one vote for each share on all matters voted on by shareholders, and the holders of such shares will possess all voting power.
Stock Repurchase Plan In May 2012, our shareholders approved a new stock repurchase program, which replaced the previous stock repurchase program. Under the program, we are authorized to purchase up to 3.5 million shares of our common stock in the open market in addition to amounts previously purchased under the prior program. From authorization of the previous program in May 2010 through December 31, 2013, we have purchased approximately 3.7 million shares of our common stock in the open market at an average price of $63.04 per share. We purchased 1.2 million shares of common stock at an average price of $116.99 per share during the year ended December 31, 2013 and 0.3 million shares at an average price of $63.25 per share during the year ended December 31, 2012. As of December 31, 2013, approximately 2.3 million shares of common stock remain available for repurchase under the program. Luxembourg law limits share repurchases to approximately the balance of Altisource Portfolio Solutions S.A. (unconsolidated parent company) retained earnings, less shares repurchased. As of December 31, 2013, approximately $14 million was available to repurchase our common stock under Luxembourg law. Our senior secured term loan also limits the amount we can spend on share repurchases in any year and may prevent
69
(in thousands)
2014
$ 3,975
2015 3,975
2016
3,975
2017 3,975
2018
3,975
Thereafter 376,628
396,503
Less: current portion
(3,975 ) $ 392,528
(in thousands) 2013
2012
Contingent consideration
$ 42,946 $ —
Other non-current liabilities
2,530 1,738
Total
$ 45,476 $ 1,738
Table of Contents
ALTISOURCE PORTFOLIO SOLUTIONS S.A. Notes to Consolidated Financial Statements (Continued)
repurchases in certain circumstances. As of December 31, 2013, approximately $55 million was available to repurchase our common stock under our senior secured term loan. Equity Incentive Plan Our 2009 Equity Incentive Plan (the “Plan”) provides for various types of equity awards, including stock options, stock appreciation rights, stock purchase rights, restricted shares and other awards, or a combination of any of the above. Under the Plan, we may grant up to 6.7 million Altisource share-based awards to officers, directors, key employees and to employees of our affiliates. As of December 31, 2013, 2.5 million share-based awards were available for future grant under the Plan. The shares will be issued from authorized and unissued shares of our common stock. Expired and forfeited awards are available for reissuance. Vesting and exercise of share-based awards are generally contingent on continued employment. Share-Based Compensation We issue share-based awards in the form of stock options and certain other equity-based awards for certain employees and officers. We recorded share-based compensation expense of $2.4 million, $3.6 million and $3.9 million for the years ended December 31, 2013, 2012 and 2011, respectively. The amount for the year ended December 31, 2012 includes the reversal of $0.8 million of share-based compensation expense related to the departure of an executive officer in March 2012. Outstanding share-based compensation currently consists primarily of stock option grants that are a combination of service-based and market-based options.
Service-Based Options . These options are granted at fair value on the date of grant. The options generally vest over four years with equal annual cliff-vesting and expire on the earlier of 10 years after the date of grant or following termination of service. A total of 0.8 million service-based awards were outstanding at December 31, 2013. Market-Based Options . These option grants have two components each of which vest only upon the achievement of certain criteria. The first component, which we refer to internally as “ordinary performance” grants, consists of two-thirds of the market-based grant and begins to vest if the stock price is at least double the exercise price, as long as the stock price realizes a compounded annual gain of at least 20% over the exercise price. The remaining third of the market-based options, which we refer to internally as “extraordinary performance” grants, begins to vest if the stock price is at least triple the exercise price, as long as the stock price realizes a compounded annual gain of at least 25% over the exercise price. The vesting schedule for all market-based awards is 25% upon achievement of the criteria and the remaining 75% in three equal annual installments. A total of 1.8 million market-based awards were outstanding at December 31, 2013.
The Company granted less than 0.1 million stock options (at a weighted average exercise price of $104.84 per share), 0.3 million stock options (at a weighted average exercise price of $69.48 per share) and 0.2 million stock options (at a weighted average exercise price of $33.15 per share) during the years ended December 31, 2013, 2012 and 2011, respectively.
70
Table of Contents
ALTISOURCE PORTFOLIO SOLUTIONS S.A. Notes to Consolidated Financial Statements (Continued)
The fair value of the service-based options was determined using the Black-Scholes option pricing model, and a lattice (binomial) model was used to determine the fair value of the market-based options, using the following assumptions as of the grant date:
The following table summarizes the weighted-average fair value of stock options granted and the total intrinsic value of stock options exercised for the years ended December 31:
Stock-based compensation expense is recorded net of estimated forfeiture rates ranging from 1% to 10%. As of December 31, 2013, estimated unrecognized compensation costs related to share-based payments amounted to $2.5 million which we expect to recognize over a weighted average remaining requisite service period of approximately 2.9 years. The following table summarizes activity of our stock options:
71
2013 2012
2011
Black-Scholes Binomial
Black-Scholes Binomial
Black-Scholes Binomial
Risk-free interest rate (%)
1.02 — 1.81 0.01 — 2.71
0.87 — 1.17 0.08 — 2.04
1.69 — 1.93 0.04 — 3.03
Expected stock price volatility (%)
36.35 — 36.76 36.40 — 36.80
34.22 — 34.65 34.20 — 34.60
48.00 55.70 — 55.80
Expected dividend yield
— —
— —
— —
Expected option life (in years)
6.25 —
6.25 —
6.25 —
Contractual life (in years)
— 14
— 14
— 14
Fair value
$31.33 — $49.14 $16.12 — $41.72
$19.25 — $29.80 $9.98 — $22.76
$16.33 — $17.85 $16.91 — $20.39
2013 2012
2011
Weighted average fair value at date of grant
$ 32.59 $ 20.77
$ 17.66
Intrinsic value of options exercised (in thousands)
40,761 17,598
4,966
Fair value of options vested (in thousands)
3,156 2,790
3,536
Number of
options
Weighted average exercise
price
Weighted average
contractual term
(in years)
Aggregate intrinsic value
(in thousands)
Outstanding at December 31, 2012
3,058,309 $ 17.69
6.11 $ 211,072
Granted
75,000 104.84
Exercised
(401,718 ) 16.48
Forfeited (142,248 ) 55.35
Outstanding at December 31, 2013
2,589,343 18.33
5.20 363,293
Exercisable at December 31, 2013
2,194,755 12.68
4.79 320,326
Table of Contents
ALTISOURCE PORTFOLIO SOLUTIONS S.A. Notes to Consolidated Financial Statements (Continued)
The following table summarizes information about stock options outstanding and exercisable at December 31, 2013:
(a) These options contain market-based components as described above. All other options are time-based awards. The following table summarizes the market prices necessary in order for the market performance options to begin to vest:
16. COST OF REVENUE Cost of revenue principally includes payroll and employee benefits associated with personnel employed in customer service and operations roles, fees paid to external providers related to provision of services, reimbursable expenses, technology and telecommunications expenses as well as depreciation and amortization of operating assets. The components of cost of revenue were as follows for the years ended December 31:
72
Options outstanding Options exercisable
Exercise price range Number
Weighted average
remaining contractual
life
Weighted average exercise
price Number
Weighted average
remaining contractual
life
Weighted average exercise
price
$0.00 — $10.00(a)
1,700,112 4.49
$ 9.14 1,700,112
4.49 $ 9.14
$10.01 — $20.00(a)
97,737 2.80
12.45 97,737
2.80 12.45
$20.01 — $30.00(a)
502,686 6.30
23.07 328,625
6.31 23.15
$30.01 — $40.00(a)
61,058 6.98
33.54 23,874
7.30 33.44
$50.01 — $60.00(a)
10,000 8.37
53.00 3,750
8.37 53.00
$60.01 — $70.00(a)
142,750 8.19
60.67 40,657
8.19 60.67
$80.01 — $90.00(a)
15,000 9.12
83.86 —
— —
$90.01 — $100.00(a)
30,000 9.21
94.19 —
— —
$120.01 — $130.00(a)
30,000 9.62
125.98 —
— —
2,589,343
2,194,755
Market -based options
Vesting price
Ordinary performance
Extraordinary performance
$160.01 — $170.00
7,500 —
Over $170.00
22,500 52,125
30,000 52,125
Weighted average share price
$ 107.27 $ 74.08
(in thousands) 2013
2012 2011
Compensation and benefits
$ 156,812 $ 113,145
$ 82,548
Outside fees and services 193,233
123,338 86,201
Reimbursable expenses
102,478 96,147
82,074
Technology and telecommunications 25,534
23,404 18,772
Depreciation and amortization
14,423 10,167
6,254
Total
$ 492,480 $ 366,201
$ 275,849
Table of Contents
ALTISOURCE PORTFOLIO SOLUTIONS S.A. Notes to Consolidated Financial Statements (Continued)
17. SELLING, GENERAL AND ADMINISTRATIVE EXPENSES Selling, general and administrative expenses include payroll for personnel employed in executive, finance, legal, human resources, vendor management, risk and operational effectiveness roles. This category also includes occupancy costs, professional fees and depreciation and amortization on non-operating assets. The components of selling, general and administrative expenses were as follows for the years ended December 31:
18. OTHER INCOME (EXPENSE), NET Other income (expense), net consists of the following for the years ended December 31:
Loss in equity affiliates primarily represents our proportional share of the losses in Correspondent One and impairment loss on the investment (see Note 10). The change in fair value of put option relates to three put option agreements we entered into with certain of the sellers of MPA. The put option expired in December 2011.
73
(in thousands) 2013
2012 2011
Compensation and benefits
$ 27,864 $ 21,166
$ 22,327
Professional services 8,022
9,864 6,658
Occupancy related costs
28,424 24,041
17,824
Amortization of intangible assets 28,176
5,030 5,291
Depreciation and amortization
4,633 2,609
2,097
Other 16,691
12,002 7,934
Total
$ 113,810 $ 74,712
$ 62,131
(in thousands) 2013
2012 2011
Loss in equity affiliates, including impairment loss
$ (176 ) $ (1,741 ) $ (530 ) Interest income
899 222
32
Change in fair value of put option —
— 732
Other, net
(166 ) (69 ) 54
Total
$ 557 $ (1,588 ) $ 288
Table of Contents
ALTISOURCE PORTFOLIO SOLUTIONS S.A. Notes to Consolidated Financial Statements (Continued)
19. INCOME TAXES The income tax provision consists of the following for the years ended December 31:
We received a favorable ruling in June 2010 regarding the treatment of certain intangibles that exist for purposes of determining the Company’s taxable income. This ruling does not have a material impact on our deferred tax assets or liabilities. Income tax computed by applying the Luxembourg statutory income tax rate of 29.22% differs from income tax computed at the effective tax rate primarily because of the effect of the favorable tax ruling, differing tax rates in multiple jurisdictions, changes in valuation allowance and minority interest. We operate under tax holidays in certain geographies in India and the Philippines. The India tax holidays are effective through 2020, and may be extended if certain additional requirements are satisfied. The Philippines tax holiday is effective through 2016, and may also be extended. The tax holidays are conditional upon our meeting certain employment and investment thresholds. The impact of these tax holidays decreased foreign taxes by $0.2 million ($0.01 per diluted share), $1.5 million ($0.06 per diluted share), and $0.6 million ($0.02 per diluted share) for the years ended December 31, 2013, 2012 and 2011, respectively. The Philippines tax holiday commenced in 2013 and had no impact on taxes for the year ended December 31, 2013. The Company accounts for certain income and expense items differently for financial purposes and income tax purposes. We recognize deferred income tax assets and liabilities for these differences between the financial reporting basis and the tax basis of our assets and liabilities as well as expected benefits of utilizing net operating loss and credit carryforwards. We measure deferred income tax assets and liabilities using enacted tax rates expected to apply to taxable income in the years in which we expect to recover or settle those temporary differences.
74
(in thousands) 2013
2012 2011
Current:
Domestic - Luxembourg
$ 2,516 $ 2,841
$ 2,300
Foreign - U.S. Federal 6
— —
Foreign - U.S. State
403 353
119
Foreign - Non U.S. 3,600
2,552 2,891
$ 6,525
$ 5,746 $ 5,310
Deferred:
Domestic - Luxembourg
$ — $ 388
$ (387 ) Foreign - U.S. Federal
2,506 2,419
3,216
Foreign - U.S. State 84
(23 ) (22 ) Foreign - Non U.S.
(575 ) 208 (174 )
2,015 2,992
2,633
Total
$ 8,540 $ 8,738
$ 7,943
Table of Contents
ALTISOURCE PORTFOLIO SOLUTIONS S.A. Notes to Consolidated Financial Statements (Continued)
A summary of the tax effects of the temporary differences is as follows for the years ended December 31:
A valuation allowance is provided when it is deemed more likely than not that some portion or all of a deferred tax asset will not be realized. In determining whether a valuation allowance is needed, we considered estimates of future taxable income, future reversals of temporary differences, the tax character of gains and losses, and the impact of tax planning strategies that can be implemented, if warranted. The increase in valuation allowance of $0.8 million during 2013 relates to state and foreign losses generated in the current year. We have not provided Luxembourg deferred taxes on cumulative earnings of non-Luxembourg affiliates as we have chosen to indefinitely reinvest these earnings. The earnings reinvested as of December 31, 2013 were approximately $38.5 million. The Company had a deferred tax asset of $12.4 million as of December 31, 2013 relating to United States federal, state and foreign net operating losses compared to $14.3 million as of December 31, 2012. Of this amount, $1.4 million as of December 31, 2013 related to state net operating losses subject to a valuation allowance compared to $1.5 million as of December 31, 2012, and $1.8 million as of December 31, 2013 related to Luxembourg net operating losses subject to a valuation allowance compared to $0.9 million as of December 31, 2012. The Company has not recognized federal net operating loss carry forwards of $9.5 million as of December 31, 2013 related to stock options exercised compared to $2.2 million as of December 31, 2012. If realized, the benefit would be an increase to additional paid-in-capital. The gross amount of net operating losses available for carryover to future years is approximately $32.6 million as of December 31, 2013 compared to $36.1 million as of December 31, 2012. Of this amount, $13.5 million as of December 31, 2013 compared to $14.7 million as of December 31, 2012 relates to NCI for periods prior to our acquisition of NCI and is subject to Section 382 of the Internal Revenue Code (the “Code”) which limits their use to approximately $1.3 million per year. These losses are scheduled to expire between the years 2022 and 2029. The distribution of the Company in connection with the separation from Ocwen during 2009 was intended to be a tax-free transaction under Section 355 of the Code. However, Ocwen recognized, and paid tax on, substantially all of the gain it had in the assets that comprised Altisource as a result of the restructuring. To the extent Ocwen does recognize tax under Section 355 of the Code, Altisource has agreed to indemnify Ocwen. In addition, we have agreed to indemnify Ocwen should the expected tax treatments not be upheld upon review or audit to the extent
75
(in thousands) 2013
2012
Current deferred tax assets:
Allowance for doubtful accounts and other reserves
$ 43 $ 40
Accrued expenses
3,183 1,940
Current deferred tax liabilities:
Prepaid expenses
(389 ) (205 ) Current deferred tax assets, net
$ 2,837 $ 1,775
Non-current deferred tax assets:
Net operating loss carryforwards
$ 12,439 $ 14,342
Non-U.S. deferred tax assets
1,471 895
Share-based compensation
784 956
Other
7 7
Non-current deferred tax liabilities:
Intangible assets
(6,035 ) (6,869 ) Depreciation
(4,855 ) (2,845 )
3,811 6,486
Valuation allowance
(3,189 ) (2,413 ) Non-current deferred tax assets, net
$ 622 $ 4,073
Net deferred tax assets
$ 3,459 $ 5,848
Table of Contents
ALTISOURCE PORTFOLIO SOLUTIONS S.A. Notes to Consolidated Financial Statements (Continued)
related to our operating results. The Company does not anticipate a material obligation under this indemnity. The following table reconciles the income tax provision to the Luxembourg statutory income tax rate for the years ended December 31:
The Company follows ASC Topic 740 which clarifies the accounting and disclosure for uncertainty in tax positions. We analyzed our tax filing positions in all of the domestic and foreign tax jurisdictions where we are required to file income tax returns as well as for all open tax years in these jurisdictions. Based on this review, no reserves for uncertain income tax positions were required to have been recorded pursuant to ASC Topic 740. We recognize accrued interest and penalties related to uncertain tax positions in selling, general and administrative expenses in the consolidated statements of operations. As of December 31, 2013 and 2012, we did not have a liability recorded for payment of interest and penalties associated with uncertain tax positions. 20. EARNINGS PER SHARE Basic EPS is computed by dividing income available to common stockholders by the weighted average number of common shares outstanding for the period. Diluted EPS reflects the assumed conversion of dilutive securities. Basic and diluted EPS are calculated as follows for the years ended December 31:
An immaterial amount of options for the years ended December 31, 2013 and 2012 and 0.1 million options for the year ended December 31, 2011 that were anti-dilutive have been excluded from the computation of diluted EPS. These options were anti-dilutive because their exercise price was greater than the average market price of our stock. Also excluded from the computation of diluted EPS are 0.1 million, 0.3 million and 0.3 million options for the years ended December 31, 2013, 2012 and 2011, respectively, granted for shares that are issuable upon the achievement of certain market and performance criteria related to our common stock price and an annualized rate of return to investors that have not yet been met.
76
2013 2012
2011
Statutory tax rate
29.22 % 28.80 % 28.80 % Foreign rate differential
(24.97 ) (23.30 ) (20.03 ) Change in valuation allowance
0.76 0.16
—
State tax expense 0.24
0.17 0.06
Other
0.75 1.18
0.42
6.00 % 7.01 % 9.25 %
(in thousands, except per share data) 2013
2012 2011
Net income attributable to Altisource
$ 129,973 $ 110,627
$ 71,112
Weighted average common shares outstanding, basic
23,072 23,358
24,373
Dilutive effect of stock options 1,981
1,604 1,312
Weighted average common shares outstanding, diluted
25,053 24,962
25,685
Earnings per share:
Basic
$ 5.63 $ 4.74
$ 2.92
Diluted $ 5.19
$ 4.43 $ 2.77
Table of Contents
ALTISOURCE PORTFOLIO SOLUTIONS S.A. Notes to Consolidated Financial Statements (Continued)
21. COMMITMENTS AND CONTINGENCIES Litigation From time to time, we are involved in legal proceedings arising in the ordinary course of business. We record a liability for litigation if an unfavorable outcome is probable and the amount of loss can be reasonably estimated, including expected insurance coverage. For proceedings where a range of loss is determined, we record a best estimate of loss within the range. When legal proceedings are material, we disclose the nature of the litigation, and to the extent possible, the estimate of loss or range of loss. In the opinion of management, after consultation with legal counsel, the outcome of current legal proceedings, both individually and in the aggregate, will not have a material impact on our financial condition, results of operations or cash flows. Leases We lease certain premises and equipment under various operating lease agreements. Future minimum lease payments at December 31, 2013 under non-cancelable operating leases with an original term exceeding one year are as follows:
Total operating lease expense, net of sublease income, was $12.8 million, $10.9 million and $10.8 million for the years ended December 31, 2013, 2012 and 2011, respectively. The operating leases generally relate to office locations and reflect customary lease terms which range from 3 to 6 years in duration. Escrow and Trust Balances We hold customers’ assets in escrow and trust accounts at various financial institutions pending completion of certain real estate activities. We also hold cash in trust accounts at various financial institutions where contractual obligations mandate maintaining dedicated bank accounts for Financial Services collections. These amounts are held in escrow and trust accounts for limited periods of time and are not included in the consolidated balance sheets. Amounts held in escrow and trust accounts were $71.8 million and $47.2 million at December 31, 2013 and 2012, respectively. 22. SEGMENT REPORTING Our business segments are based upon our organizational structure, which focuses primarily on the services offered, and are consistent with the internal reporting used by our Chief Executive Officer to evaluate operating performance and to assess the allocation of our resources. We classify our business into three reportable segments. The Mortgage Services segment provides services that span the mortgage and real estate lifecycle and are typically outsourced by loan servicers, loan originators and investors in single family homes. The Financial Services segment provides collection and customer relationship management
77
(in thousands)
Operating lease obligations
2014
$ 9,142
2015 8,517
2016
7,077
2017 5,148
2018
4,386
Thereafter 138
$ 34,408
Table of Contents
ALTISOURCE PORTFOLIO SOLUTIONS S.A. Notes to Consolidated Financial Statements (Continued)
services primarily to debt originators and servicers (e.g., credit card, auto lending, retail credit and mortgage) and the utility and insurance industries. The Technology Services segment principally consists of our REALSuite software applications, Equator’s software applications as well as our information technology infrastructure services. The REALSuite platform provides a fully integrated set of software applications and technologies that manage the end-to-end lifecycle for residential and commercial mortgage loan servicing including the automated management and payment of a distributed network of vendors. Equator’s software applications provide comprehensive, end-to-end workflow and transaction services to manage real estate related activities and purchase related services from vendors. In addition, Corporate Items and Eliminations includes eliminations of transactions between the reporting segments and costs related to corporate support functions including executive, finance, legal, human resources, vendor management, risk and operational effectiveness. Financial information for our segments is as follows:
78
For the year ended December 31, 2013
Corporate
Mortgage Financial
Technology Items and
Consolidated
(in thousands) Services
Services Services
Eliminations Altisource
Revenue
$ 596,152 $ 92,958
$ 103,891 $ (24,644 ) $ 768,357
Cost of revenue
374,713 55,328
84,538 (22,099 ) 492,480
Gross profit
221,439 37,630
19,353 (2,545 ) 275,877
Selling, general and administrative expenses
46,515 15,571
12,442 39,282
113,810
Income from operations 174,924
22,059 6,911
(41,827 ) 162,067
Other income (expense), net (136 ) (10 ) 7
(19,595 ) (19,734 ) Income before income taxes and non-controlling
interests $ 174,788
$ 22,049 $ 6,918
$ (61,422 ) $ 142,333
For the year ended December 31, 2012
Corporate
Mortgage Financial
Technology Items and
Consolidated
(in thousands) Services
Services Services
Eliminations Altisource
Revenue
$ 452,796 $ 64,522
$ 74,189 $ (23,147 ) $ 568,360
Cost of revenue
285,586 46,737
54,634 (20,756 ) 366,201
Gross profit
167,210 17,785
19,555 (2,391 ) 202,159
Selling, general and administrative expenses
25,099 13,415
8,888 27,310
74,712
Income from operations 142,111
4,370 10,667
(29,701 ) 127,447
Other income (expense), net (1,713 ) (27 ) (25 ) (1,033 ) (2,798 )
Income before income taxes and non-controlling interests
$ 140,398 $ 4,343
$ 10,642 $ (30,734 ) $ 124,649
Table of Contents
ALTISOURCE PORTFOLIO SOLUTIONS S.A. Notes to Consolidated Financial Statements (Continued)
Our services are provided to customers primarily located in the United States.
23. QUARTERLY FINANCIAL DATA (UNAUDITED) The following tables contain selected unaudited statement of operations information for each quarter of 2013 and 2012. The following information reflects all normal recurring adjustments necessary for a fair presentation of the information for the periods presented. The operating results for any quarter are not necessarily indicative of results for any future period. Our business is affected by seasonality.
79
For the year ended December 31, 2011
Corporate
Mortgage Financial
Technology Items and
Consolidated
(in thousands) Services
Services Services
Eliminations Altisource
Revenue
$ 311,921 $ 71,181
$ 56,094 $ (15,509 ) $ 423,687
Cost of revenue
202,035 51,096
36,874 (14,156 ) 275,849
Gross profit
109,886 20,085
19,220 (1,353 ) 147,838
Selling, general and administrative expenses
15,278 15,634
4,867 26,352
62,131
Income from operations 94,608
4,451 14,353
(27,705 ) 85,707
Other income (expense), net 248
(34 ) (49 ) 38 203
Income before income taxes and non-controlling
interests $ 94,856
$ 4,417 $ 14,304
$ (27,667 ) $ 85,910
Corporate
Mortgage Financial
Technology Items and
Consolidated
(in thousands) Services
Services Services
Eliminations Altisource
Total assets:
December 31, 2013
$ 308,214 $ 55,930
$ 274,766 $ 85,928
$ 724,838
December 31, 2012 132,924
37,782 64,570
193,950 429,226
Premises &
equipment, net
Country (in thousands)
United States
$ 63,615
India 16,404
Luxembourg
3,217
Philippines 4,016
Total
$ 87,252
Table of Contents
ALTISOURCE PORTFOLIO SOLUTIONS S.A. Notes to Consolidated Financial Statements (Continued)
Unaudited quarterly results are as follows:
The sum of quarterly amounts, including per share amounts, may not equal amounts reported for year-to-date periods. This is due to the effects of rounding and changes in the number of weighted-average shares outstanding for each period.
On March 29, 2013, we acquired the Homeward fee-based businesses. On April 12, 2013, we completed the ResCap fee-based business transaction. On November 15, 2013, we acquired Equator (see Note 5).
80
2013 quarter ended
(in thousands, except per share data) March 31,
June 30, September 30,
December 31,
Revenue
$ 148,827 $ 186,110
$ 210,835 $ 222,585
Gross profit
51,865 69,138
76,574 78,300
Income before income taxes and non-controlling interests
30,678 34,485
38,614 38,556
Net income
28,527 32,068
36,955 36,243
Net income attributable to Altisource
27,518 30,931
36,008 35,516
Earnings per share:
Basic
$ 1.18 $ 1.34
$ 1.56 $ 1.56
Diluted
$ 1.10 $ 1.25
$ 1.42 $ 1.42
Weighted average shares outstanding:
Basic
23,374 23,161
23,025 22,734
Diluted
25,058 24,823
25,333 25,005
2012 quarter ended
(in thousands, except per share data) March 31,
June 30, September 30,
December 31,
Revenue
$ 139,066 $ 144,205
$ 143,988 $ 141,101
Gross profit
47,306 51,467
49,701 53,685
Income before income taxes and non-controlling interests
29,940 32,128
30,982 31,599
Net income
27,121 29,352
28,084 31,354
Net income attributable to Altisource
25,229 28,081
27,024 30,293
Earnings per share:
Basic
$ 1.08 $ 1.20
$ 1.16 $ 1.30
Diluted
$ 1.02 $ 1.13
$ 1.08 $ 1.20
Weighted average shares outstanding:
Basic
23,381 23,316
23,338 23,389
Diluted
24,844 24,846
25,016 25,162
(1)(2)
(1)
(1)
(2)
Table of Contents
ITEM 9. CHANGES IN AND DISAGREEMENTS WITH ACCOUNT ANTS ON ACCOUNTING AND FINANCIAL DISCLOSURE None. ITEM 9A. CONTROLS AND PROCEDURES Evaluation of Disclosure Controls and Procedures Our Chief Executive Officer and Chief Financial Officer have evaluated the effectiveness of our disclosure controls and procedures (as defined in Rule 13a-15(e) and Rule 15d-15(e) of the Securities Exchange Act of 1934, as amended (the “Exchange Act”)) as of the end of the period covered by this report. Based on such evaluation, such officers have concluded that our disclosure controls and procedures as of the end of the period covered by this report were effective to ensure that information required to be disclosed by us in the reports that we file or submit under the Exchange Act is recorded, processed, summarized and reported within the time periods specified in the SEC rules and forms, and to ensure that such information is accumulated and communicated to our management, including the Chief Executive Officer and Chief Financial Officer, as appropriate, to allow timely decisions regarding required disclosure. Management’s Report on Internal Control over Financial Reporting Management is responsible for establishing and maintaining adequate internal control over financial reporting, as defined in Rule 13a-15(f) of the Exchange Act. Management has assessed the effectiveness of our internal control over financial reporting as of December 31, 2013 based on criteria established in Internal Control—Integrated Framework issued by the Committee of Sponsoring Organizations of the Treadway Commission. The scope of management’s assessment of the effectiveness of internal control over financial reporting includes all of our businesses except for Equator, which was acquired on November 15, 2013 and whose financial statements represent 17% of total assets and less than 1% of revenues and net income attributable to Altisource of the consolidated financial statement amounts as of and for the year ended December 31, 2013. See Note 5 to the accompanying consolidated financial statements for further discussion of this acquisition. As a result of this assessment, management concluded that, as of December 31, 2013, our internal control over financial reporting was effective in providing reasonable assurance regarding the reliability of financial reporting and the preparation of financial statements for external purposes in accordance with generally accepted accounting principles. Deloitte & Touche LLP has independently assessed the effectiveness of our internal control over financial reporting and its report is included herein. Changes in Internal Control Over Financial Reporting There were no changes in our internal control over financial reporting during the quarter ended December 31, 2013 that materially affected, or are reasonably likely to materially affect, our internal control over financial reporting. Limitations on Controls Our disclosure controls and procedures and internal control over financial reporting are designed to provide reasonable assurance of achieving their objectives as specified above. Management does not expect, however, that our disclosure controls and procedures or our internal control over financial reporting will prevent or detect all error and fraud. Any control system, no matter how well designed and operated, is based upon certain assumptions and can provide only reasonable, not absolute, assurance that its objectives will be met. Further, no evaluation of controls can provide absolute assurance that misstatements due to error or fraud will not occur or that all control issues and instances of fraud, if any, within the Company have been detected. ITEM 9B. OTHER INFORMATION None.
81
Table of Contents
PART III
ITEM 10. DIRECTORS, EXECUTIVE OFFICERS AND CORPORATE GOVERNA NCE The information required by this item is incorporated herein by reference to our definitive proxy statement in connection with our 2014 annual meeting of shareholders to be filed pursuant to Regulation 14A under the Exchange Act. ITEM 11. EXECUTIVE COMPENSATION The information required by this item is incorporated herein by reference to our definitive proxy statement in connection with our 2014 annual meeting of shareholders to be filed pursuant to Regulation 14A under the Exchange Act. ITEM 12. SECURITY OWNERSHIP OF CERTAIN BENEFICIAL OWNERS AND MANAGEMENT AND RELATED
STOCKHOLDER MATTERS The information required by this item is incorporated herein by reference to our definitive proxy statement in connection with our 2014 annual meeting of shareholders to be filed pursuant to Regulation 14A under the Exchange Act. ITEM 13. CERTAIN RELATIONSHIPS AND RELATED TRANSACTIONS, AND DIRECTOR INDEPENDENCE The information required by this item is incorporated herein by reference to our definitive proxy statement in connection with our 2014 annual meeting of shareholders to be filed pursuant to Regulation 14A under the Exchange Act. ITEM 14. PRINCIPAL ACCOUNTING FEES AND SERVICES The information required by this item is incorporated herein by reference to our definitive proxy statement in connection with our 2014 annual meeting of shareholders to be filed pursuant to Regulation 14A under the Exchange Act.
82
Table of Contents
PART IV
83
ITEM 15. EXHIBITS, FINANCIAL STATEMENT SCHEDULES
(a)
The following documents are filed as part of this annual report. 1.
Financial Statements
See Item 8 above. 2.
Financial Statement Schedules:
Schedules for which provision is made in the applicable accounting regulations of the SEC are not required under the related instructions or are not applicable, and therefore have been omitted.
3.
Exhibits :
Exhibit
Number Exhibit Description
2.1
Form of Separation Agreement between Altisource Portfolio Solutions S.A. and Ocwen Financial Corporation (incorporated by reference to Exhibit 2.1 of the Registrant’s Form 10-12B/A — Amendment No. 1 to Form 10, as filed with the Commission on June 29, 2009)
2.2
Separation Agreement, dated as of December 21, 2012, between Altisource Residential Corporation and Altisource Portfolio Solutions S.A. (incorporated by reference to Exhibit 2.1 to the Company’s Form 8-K filed on December 21, 2012)
2.3
Separation Agreement, dated as of December 21, 2012, between Altisource Asset Management Corporation and Altisource Portfolio Solutions S.A. (incorporated by reference to Exhibit 2.2 to the Company’s Form 8-K filed on December 21, 2012)
2.4
Purchase and Sale Agreement, dated as of March 29, 2013, by and among Altisource Portfolio Solutions, Inc., Altisource Solutions S.à r.l., Ocwen Financial Corporation, Homeward Residential, Inc. and Power Valuation Services, Inc. (incorporated by reference to Exhibit 2.1 to the Company’s Form 8-K filed on April 4, 2013)
2.5
Purchase and Sale Agreement, dated as of August 19, 2013, by and among Altisource Portfolio Solutions S.A., Altisource Solutions S.à r.l. and the Equity Interestholders of Equator, LLC (incorporated by reference to Exhibit 2.1 to the Company’s Form 8-K filed on August 21, 2013)
3.1*
Articles of Incorporation of Altisource Portfolio Solutions S.A. 10.1
Separation Agreement, dated as of August 10, 2009, by and between Altisource Portfolio Solutions S.A. and Ocwen Financial Corporation (incorporated by reference to Exhibit 10.1 of the Registrant’s Current Report on Form 8-K, as filed with the Commission on August 13, 2009)
10.2
Tax Matters Agreement, dated as of August 10, 2009, between Altisource Solutions S.à r.l. and Ocwen Financial Corporation (incorporated by reference to Exhibit 10.2 of the Registrant’s Current Report on Form 8-K, as filed with the Commission on August 13, 2009)
10.3
Employee Matters Agreement, dated as of August 10, 2009, between Altisource Solutions S.à r.l. and Ocwen Financial Corporation (incorporated by reference to Exhibit 10.4 of the Registrant’s Current Report on Form 8-K, as filed with the Commission on August 13, 2009)
Table of Contents
84
10.4
Technology Products Services Agreement, dated as of August 10, 2009, between Altisource Solutions S.à r.l. and Ocwen Financial Corporation (incorporated by reference to Exhibit 10.5 of the Registrant’s Current Report on Form 8-K, as filed with the Commission on August 13, 2009)
10.5
Services Agreement, dated as of August 10, 2009, between Altisource Solutions S.à r.l. and Ocwen Financial Corporation (incorporated by reference to Exhibit 10.6 of the Registrant’s Current Report on Form 8-K, as filed with the Commission on August 13, 2009)
10.6
Data Center and Disaster Recovery Services Agreement, dated as of August 10, 2009, between Altisource Solutions S.à r.l. and Ocwen Financial Corporation (incorporated by reference to Exhibit 10.7 of the Registrant’s Current Report on Form 8-K, as filed with the Commission on August 13, 2009)
10.7
Intellectual Property Agreement, dated as of August 10, 2009, by and between Altisource Solutions S.à r.l. and Ocwen Financial Corporation (incorporated by reference to Exhibit 10.8 of the Registrant’s Current Report on Form 8-K, as filed with the Commission on August 13, 2009)
10.8†
Form of Altisource Portfolio Solutions S.A. 2009 Equity Incentive Plan (incorporated by reference to Exhibit 10.8 of Amendment No. 1 to the Registration Statement on Form 10, as filed with the Commission on June 29, 2009)
10.9†
Employment Agreement by and between Altisource Solutions S.à r.l. and William B. Shepro (incorporated by reference to Exhibit 10.9 of Amendment No. 1 to the Registration Statement on Form 10, as filed with the Commission on June 29, 2009)
10.10†
Employment Agreement by and between Altisource Solutions S.à r.l. and Robert D. Stiles (incorporated by reference to Exhibit 10.10 of Amendment No. 1 to the Registration Statement on Form 10, as filed with the Commission on June 29, 2009)
10.11†
Employment Agreement by and between Altisource Solutions S.à r.l. and Kevin J. Wilcox (incorporated by reference to Exhibit 10.11 of Amendment No. 1 to the Registration Statement on Form 10, as filed with the Commission on June 29, 2009)
10.12
Purchase and Sale Agreement, dated as of February 12, 2010, by and among Altisource Portfolio Solutions S.A., and the Equity Interest Holders of The Mortgage Partnership of America, L.L.C. and the Management Owners (incorporated by reference to Exhibit 10.12 of the Company’s 10-K as filed with the Commission on March 17, 2010)
10.13†
Form of Put Option Agreements (incorporated by reference to Exhibit 10.13 of the Company’s 10-K as filed with the Commission on March 17, 2010)
10.14†
Form of Non-qualified Stock Option Agreement, pursuant to the 2009 Equity Incentive Plan (incorporated by reference to Exhibit 10.14 of the Company’s 10-K as filed with the Commission on February 18, 2011)
10.15
First Amendment to the Transition Services Agreement, dated as of August 10, 2011, by and between Ocwen Financial Corporation and Altisource Solutions S.à r.l. (incorporated by reference to Exhibit 10.1 of the Company’s 8-K, as filed with the Commission on August 16, 2011)
10.16†
Separation Agreement dated February 22, 2012 between Altisource Portfolio Solutions S.à r.l., Altisource Portfolio Solutions S.A. and Robert D. Stiles (incorporated by reference to Exhibit 10.1 to the Company’s 8-K as filed with the Commission on February 23, 2012)
10.17†
Employment Agreement dated March 13, 2012 between Altisource Portfolio Solutions S.à r.l. and Michelle D. Esterman (incorporated by reference to Exhibit 10.1 to the Company’s 8-K as filed with the Commission on March 16, 2012)
Table of Contents
85
10.18
Support Services Agreement, dated as of August 10, 2012, by and between Ocwen Mortgage Servicing, Inc. and Altisource Solutions S.à r.l. (incorporated by reference to Exhibit 10.1 to the Company’s Form 8-K filed on August 16, 2012)
10.19†
First Amendment to the Employment Contract dated as of August 15, 2012 between Altisource Solutions S.à r.l. and William B. Shepro (incorporated by reference to Exhibit 10.1 to the Company’s Form 8-K filed on August 20, 2012)
10.20†
First Amendment to the Employment Contract dated as of August 15, 2012 between Altisource Solutions S.à r.l. and Kevin J. Wilcox (incorporated by reference to Exhibit 10.2 to the Company’s Form 8-K filed on August 20, 2012)
10.21
Services Agreement, dated as of October 1, 2012, by and between Ocwen Mortgage Servicing, Inc. and Altisource Solutions S.à r.l. (incorporated by reference to Exhibit 10.1 to the Company’s Form 8-K filed on October 1, 2012)
10.22
Technology Products Services Agreement, dated as of October 1, 2012, by and between Ocwen Mortgage Servicing, Inc. and Altisource Solutions S.à r.l. (incorporated by reference to Exhibit 10.2 to the Company’s Form 8-K filed on October 1, 2012)
10.23
Data Center and Disaster Recovery Agreement, dated as of October 1, 2012, by and between Ocwen Mortgage Servicing, Inc. and Altisource Solutions S.à r.l. (incorporated by reference to Exhibit 10.3 to the Company’s Form 8-K filed on October 1, 2012)
10.24
Intellectual Property Agreement, dated as of October 1, 2012, by and between Ocwen Mortgage Servicing, Inc. and Altisource Solutions S.à r.l. (incorporated by reference to Exhibit 10.4 to the Company’s Form 8-K filed on October 1, 2012)
10.25
First Amendment to Support Services Agreement, dated as of October 1, 2012, by and between Ocwen Mortgage Servicing, Inc. and Altisource Solutions S.à r.l. (incorporated by reference to Exhibit 10.5 to the Company’s Form 8-K filed on October 1, 2012)
10.26
First Amendment to Services Agreement, dated as of October 1, 2012, by and between Ocwen Financial Corporation and Altisource Solutions S.à r.l. (incorporated by reference to Exhibit 10.6 to the Company’s Form 8-K filed on October 1, 2012)
10.27
First Amendment to Technology Products and Services Agreement, dated as of October 1, 2012, by and between Ocwen Financial Corporation and Altisource Solutions S.à r.l. (incorporated by reference to Exhibit 10.7 to the Company’s Form 8-K filed on October 1, 2012)
10.28
First Amendment to Data Center and Disaster Recovery Agreement, dated as of October 1, 2012, by and between Ocwen Financial Corporation and Altisource Solutions S.à r.l. (incorporated by reference to Exhibit 10.8 to the Company’s Form 8-K filed on October 1, 2012)
10.29
First Amendment to Intellectual Property Agreement, dated as of October 1, 2012, by and between Ocwen Financial Corporation and Altisource Solutions S.à r.l. (incorporated by reference to Exhibit 10.9 to the Company’s Form 8-K filed on October 1, 2012)
10.30
Credit Agreement, dated as of November 27, 2012, among Altisource Solutions S.à r.l., as borrower, the Company and certain of the Company’s wholly-owned subsidiaries, as guarantors, Bank of America, N.A, as Administrative Agent and Collateral Agent, Bank of America, N.A., Barclays Bank PLC and Citigroup Global Markets Inc., as Lead Arrangers and Barclays Bank PLC and Citigroup Global Markets Inc., as Co-Syndication Agents, and certain lenders party thereto from time to time. (incorporated by reference to Exhibit 10.1 to the Company’s Form 8-K filed on December 3, 2012)
10.31
Support Services Agreement, dated as of December 21, 2012, between Altisource Residential Corporation and Altisource Solutions S.à r.l. (incorporated by reference to Exhibit 10.1 to the Company’s Form 8-K filed on December 21, 2012)
10.32
Tax Matters Agreement, dated as of December 21, 2012, between Altisource Residential Corporation and Altisource Solutions S.à r.l. (incorporated by reference to Exhibit 10.3 to the Company’s Form 8-K filed on December 21, 2012)
Table of Contents
86
10.33**
Master Services Agreement, dated as of December 21, 2012, between Altisource Residential Corporation and Altisource Solutions S.à r.l. (incorporated by reference to Exhibit 10.5 to the Company’s Form 8-K filed on December 21, 2012)
10.34
Trademark License Agreement, dated as of December 21, 2012, between Altisource Residential Corporation and Altisource Solutions S.à r.l. (incorporated by reference to Exhibit 10.6 to the Company’s Form 8-K filed on December 21, 2012)
10.35
Support Services Agreement, dated as of December 21, 2012, between Altisource Asset Management Corporation and Altisource Solutions S.à r.l. (incorporated by reference to Exhibit 10.2 to the Company’s Form 8-K filed on December 21, 2012)
10.36
Tax Matters Agreement, dated as of December 21, 2012, between Altisource Asset Management Corporation and Altisource Solutions S.à r.l. (incorporated by reference to Exhibit 10.4 to the Company’s Form 8-K filed on December 21, 2012)
10.37
Trademark License Agreement, dated as of December 21, 2012, between Altisource Asset Management Corporation and Altisource Solutions S.à r.l. (incorporated by reference to Exhibit 10.7 to the Company’s Form 8-K filed on December 21, 2012)
10.38
Technology Products Services Agreement, between Altisource Asset Management Corporation and Altisource Solutions S.à r.l. (incorporated by reference to Exhibit 10.8 to the Company’s Form 8-K filed on December 21, 2012)
10.39
Senior Unsecured Term Loan Agreement, dated as of December 27, 2012, among Altisource Solutions S.à r.l., as Lender, Ocwen Financial Corporation, as Borrower, and certain subsidiaries of Ocwen Financial Corporation, as Guarantors. (incorporated by reference to Exhibit 10.1 to the Company’s Form 8-K filed on December 31, 2012)
10.40
Second Amendment to Services Agreement, dated as of March 29, 2013, by and between Ocwen Financial Corporation and Altisource Solutions S.à r.l. (incorporated by reference to Exhibit 10.1 to the Company’s Form 8-K filed on April 4, 2013)
10.41
Second Amendment to Technology Products Services Agreement, dated as of March 29, 2013, by and between Ocwen Financial Corporation and Altisource Solutions S.à r.l. (incorporated by reference to Exhibit 10.2 to the Company’s Form 8-K filed on April 4, 2013)
10.42
Second Amendment to Data Center and Disaster Recovery Services Agreement, dated as of March 29, 2013, by and between Ocwen Financial Corporation and Altisource Solutions S.à r.l. (incorporated by reference to Exhibit 10.3 to the Company’s Form 8-K filed on April 4, 2013)
10.43
Second Amendment to Intellectual Property Agreement, dated as of March 29, 2013, by and between Ocwen Financial Corporation and Altisource Solutions S.à r.l. (incorporated by reference to Exhibit 10.4 to the Company’s Form 8-K filed on April 4, 2013)
10.44
First Amendment to Services Agreement, dated as of March 29, 2013, by and between Ocwen Mortgage Servicing, Inc. and Altisource Solutions S.à r.l. (incorporated by reference to Exhibit 10.5 to the Company’s Form 8-K filed on April 4, 2013)
10.45
First Amendment to Technology Products Services Agreement, dated as of March 29, 2013, by and between Ocwen Mortgage Servicing, Inc. and Altisource Solutions S.à r.l. (incorporated by reference to Exhibit 10.6 to the Company’s Form 8-K filed on April 4, 2013)
10.46
First Amendment to Data Center and Disaster Recovery Services Agreement, dated as of March 29, 2013, by and between Ocwen Mortgage Servicing, Inc. and Altisource Solutions S.à r.l. (incorporated by reference to Exhibit 10.7 to the Company’s Form 8-K filed on March 29, 2013)
Table of Contents
87
10.47
First Amendment to Intellectual Property Agreement, dated as of March 29, 2013, by and between Ocwen Mortgage Servicing, Inc. and Altisource Solutions S.à r.l. (incorporated by reference to Exhibit 10.8 to the Company’s Form 8-K filed on March 29, 2013)
10.48
Agreement, dated as of April 12, 2013, by and among Altisource Solutions S.à r.l., Ocwen Financial Corporation and Ocwen Mortgage Servicing, Inc. (incorporated by reference to Exhibit 10.1 to the Company’s Form 8-K filed on April 18, 2013)
10.49
Amendment No. 1 to Credit Agreement, dated as of May 7, 2013, among Altisource Solutions S.à r.l., as borrower, Altisource Portfolio Solutions S.A., Bank of America, N.A., as administrative agent and incremental term lender and the other lenders party thereto. (incorporated by reference to Exhibit 10.1 to the Company’s Form 8-K filed on May 13, 2013)
10.50
Amendment No. 2 to Credit Agreement, dated as of December 9, 2013, among Altisource Solutions S.à r.l., as borrower, Altisource Portfolio Solutions S.A., Bank of America, N.A., as Administrative Agent and the Lenders party thereto. (incorporated by reference to Exhibit 10.1 to the Company’s Form 8-K filed on December 11, 2013)
21.1*
Subsidiaries of the Registrant. 23.1*
Consent of Independent Registered Public Accounting Firm (Deloitte & Touche LLP). 31.1*
Section 302 Certification of the Chief Executive Officer pursuant to Exchange Act Rule 13a-14(a). 31.2*
Section 302 Certification of the Chief Financial Officer pursuant to Exchange Act Rule 13a-14(a). 32.1*
Certification of the Chief Executive Officer pursuant to 18 U.S.C. Section 1350, as adopted pursuant to Section 906 of the Sarbanes-Oxley Act of 2002.
32.2*
Certification of the Chief Financial Officer pursuant to 18 U.S.C. Section 1350, as adopted pursuant to Section 906 of the Sarbanes-Oxley Act of 2002.
Table of Contents
* Filed herewith ** Portions of this exhibit have been redacted pursuant to a request for confidential treatment. The non-public information has been filed
separately with the Securities and Exchange Commission. † Denotes management contract or compensatory arrangement
88
101
Pursuant to Rule 405 of Regulation S-T, the following financial information from the Company’s Annual Report on Form 10-K for the year ended December 31, 2013 is formatted in XBRL interactive data files: (i) Consolidated Balance Sheets at December 31, 2013 and December 31, 2012; (ii) Consolidated Statements of Operations for each of the years in the three-year period ended December 31, 2013; (iii) Consolidated Statements of Equity for each of the years in the three-year period ended December 31, 2013; (iv) Consolidated Statements of Cash Flows for each of the years in the three-year period ended December 31, 2013; and (v) Notes to Financial Statements.
Table of Contents
SIGNATURES
Pursuant to the requirements of Section 13 or 15(d) of the Securities Exchange Act of 1934, the Registrant has duly caused this report to be signed on its behalf by the undersigned, thereunto duly authorized.
Pursuant to the requirements of the Securities Exchange Act of 1934 this report has been signed below by the following persons on behalf of
the registrant and in the capacities indicated as of February 13, 2014.
89
Date: February 13, 2014
Altisource Portfolio Solutions S.A.
By: /s/ William B. Shepro
Name: William B. Shepro
Title: Director and Chief Executive Officer
(Principal Executive Officer)
By: /s/ Michelle D. Esterman
Name: Michelle D. Esterman
Title: Chief Financial Officer
(Principal Financial Officer and
Principal Accounting Officer)
Signature Title
Date /s/ William C. Erbey
Chairman of the Board of Directors February 13, 2014
William C. Erbey
/s/ William B. Shepro
Director and Chief Executive Officer February 13, 2014
William B. Shepro (Principal Executive Officer)
/s/ W. Michael Linn
Director February 13, 2014
W. Michael Linn
/s/ Roland Müller-Ineichen
Director February 13, 2014
Roland Müller-Ineichen
/s/ Timo Vättö
Director February 13, 2014
Timo Vättö
/s/ Michelle D. Esterman
Chief Financial Officer February 13, 2014
Michelle D. Esterman (Principal Financial Officer and Principal Accounting Officer)
Exhibit 3.1
« Altisource Portfolio Solutions S.A. »
Société anonyme
Grand Duché de Luxembourg
R.C.S. Luxembourg: B 72 391
Chapter I. Form, Corporate name, Registered office, Object, Duration
Art. 1. Form, Corporate name. There is established among the subscribe(s) and all those who may become owners of the shares hereafter issued, a company in the form of a public limited liability company (société anonyme) (the “Company”) which will be governed by the laws of the Grand Duchy of Luxembourg, in particular the law of 10 August 1915 on commercial companies, as amended (the “Law”), article 1832 of the Civil Code, as amended and by the present articles of incorporation (the “Articles”).
The Company will exist under the name of “ Altisource Portfolio Solutions S.A. ”
Art. 2. Registered office. The Company has its registered office in the City of Luxembourg. The Director or, as the case may be, the Board of Directors is authorised to change the address of the Company’s registered office inside the above stated municipality.
Branches or other offices may be established either in the Grand Duchy of Luxembourg or abroad by resolution of the Director or, as the case may be, the Board of Directors. In the event that in the view of the Director or, as the case may be, the Board of Directors, extraordinary political, economic or social developments occur or are imminent that would interfere with the normal activities of the Company at its registered office or with the ease of communications with such office or between such office and persons abroad, it may temporarily transfer the registered office abroad, until the complete cessation of these abnormal circumstances. Such temporary measures will have no effect on the nationality of the Company, which notwithstanding the temporary transfer of the registered office, will remain a company governed by the laws of the Grand Duchy of Luxembourg. Such temporary measures will be taken and notified to any interested parties by one of the bodies or persons entrusted with the daily management of the Company.
Art. 3. Corporate object. The object of the Company is the acquisition, the continuing management and the sale of participations, in any form whatsoever, in Luxembourg and/or in foreign undertakings, in particular in the areas of outsourcings, customer relationship management and technology services in the real estate, mortgage and consumer finance industries. The Company may also hold, manage and exploit intellectual property rights and render services to other group companies and third parties, notably in the area of outsourcings.
The Company may invest in and acquire, dispose of, grant or retain, loans, bonds and other debt instruments, shares, warrants and other equity instruments or rights, including, but
not limited to, shares of capital stock, limited partnership interests, limited liability company interests, notes, debentures, preferred stock, convertible securities and swaps, and any combination of the foregoing, in each case whether readily marketable or not, and obligations (including but not limited to synthetic securities obligations) in any type of company, entity or other legal person; engage in such other activities as the Company deems necessary, advisable, convenient, incidental to, or not inconsistent with, the foregoing; and grant pledges, guarantees and contracts of indemnity, of any kind, to Luxembourg or foreign entities in respect of its own or any other person’s obligations and debts.
The Company may also acquire, hold, manage and sell any movable or immovable assets of any kind or form. In a general fashion the Company may carry out any commercial, industrial or financial operation which it may deem useful in the accomplishment and development of its object.
The Company may also provide any financial assistance to the undertakings in which the Company has a participating interest or which form a part of the group of companies to which the Company belongs, including, among others, the granting of loans and the providing of guarantees or securities in any kind of form. The Company may pledge, transfer, encumber or otherwise create security over some or all of its assets.
In addition, the Company may render on an occasional basis assistance in any form (including but not limited to advances, loans, credits, guarantees or granting of security) to third parties other than the group of companies to which the Company belongs, subject to the condition that such assistance falls within the Company’s best interest and subject to the condition that such assistance would not trigger any license requirements. The Company may participate in the creation, development, management and control of any company or enterprise, either directly or indirectly, which have similar objects or whose objects are closely related to its own.
In a general fashion, the Company may carry out any commercial, industrial or financial operation and engage in such other activities as the Company deems necessary, advisable, convenient, incidental to, or not inconsistent with, the accomplishment and development of the foregoing.
Art. 4. Duration. The Company is formed for an unlimited duration.
Chapter II. Share capital, Shares
Art. 5. Share capital. The share capital of the Company is set at thirty million seven hundred eighty four thousand nine hundred and seven US Dollars (USD 30,784,907.-), divided into thirty million seven hundred eighty four thousand nine hundred and seven (30,784,907) shares with a nominal value of one United States Dollar (USD 1.-) each.
The authorised share capital is set at one hundred million United States Dollars (USD 100,000,000.-) divided into one hundred million (100,000,000.-) registered shares with a par value of one US Dollar (USD 1.00) each with the same rights attached as the existing shares.
The Director or, as the case may be, the Board of Directors, is authorised, during a period ending five years after the date of publication of this delegation of powers or the renewal of such delegation in the Luxembourg Official Gazette (Memorial C, Recueil des Sociétés et Associations) to:
• realize any increase of the subscribed share capital within the limits of the authorised share capital in one or several times, by the
issuing of new shares, against payment in cash or in kind, by conversion of claims, by the increase of the par value of existing shares or in any other manner;
• determine the terms and conditions of any such increase and, more specifically, but not limited to, the place and date of the issue or
the successive issues, the issue price, the amount of new shares to be issued, whether the new shares are to be issued and subscribed ,with or without an issue premium and the terms and conditions of the subscription of and paying up of the new shares (in cash or in kind);
• limit or waive the preferential subscription right reserved to the then existing shareholder(s) in case of issue of shares against payment
in cash.
After each increase of the subscribed share capital according to the above, the present Articles shall be amended to reflect such increase.
In addition to the share capital, a premium account may be established into which any premium paid on any share in addition to its par value is transferred. The amount of the premium account may be used to provide for the payment of any shares, which the Company may redeem on a pro rata basis from its shareholders, to offset any net realised losses, to make distributions to the shareholders or to allocate funds to the legal reserve.
Art. 6. Shares. The shares will take the form of registered shares. The shareholders shall not have the right to ask for the conversion of shares into bearer shares.
A shareholders’ register will be kept at the registered office where it will be available for inspection by any shareholder. This register shall contain all of the information required by Article 39 of the Law.
Each shareholder will notify the Company of its address and any change thereto by registered letter. The Company will be entitled to rely on the last address thus communicated.
Any person who acquires or disposes of shares in the Company’s share capital must notify the Company’s Board of Directors of the proportion of shares held by the relevant person as a result of the acquisition or disposal, where that proportion reaches, exceeds or falls below a threshold of 5%.
Ownership of shares will result from the recordings in the said register.
Transfers of shares will be carried out by a declaration of transfer recorded in shareholders’ register, dated and signed by the transferor and the transferee or by their representative(s). Transfers of shares may also be carried out in accordance with the rules on the transfer of claims under article 1690 of the Luxembourg Civil Code. Furthermore, the
Company may accept and record in the shareholders’ register any transfer referred to in correspondence or other any document showing the consent of the transferor and the transferee.
Any transfer of shares shall be entered into the register of shareholders, such inscription shall be signed by the Director or, as the case may be, two members of the Board of Directors of the Company or by one or more other persons duly authorized thereto by the Board of Directors.
Holders of shares may request the Company to issue and deliver certificates signed by the Director or, as the case may be, two Directors, setting out their respective holdings of shares. Such certificate shall not constitute evidence of ownership.
No share shall be pledged or mortgaged with any charge without the approval of the Director or, as the case may be, the Board of Directors.
Each share is indivisible as far as the Company is concerned.
Co-owners of shares must be represented towards the Company by a common attorney-in-fact, whether appointed amongst them or not.
The Company has the right to suspend the exercise of all rights attached to that share until one person has been designated as the sole owner towards the Company.
Art. 7. Payment of shares. Payments on shares not fully paid up at the time of subscription may be made at the time and upon conditions which the Director, or as the case may be, the Board of Directors, shall from time to time determine subject to the Law. Any amount called up on shares will be charged equally on all outstanding shares which are not fully paid up.
Art. 8. Increase and Reduction of the share capital. The subscribed share capital of the Company may be increased or reduced once or several times by a resolution of the sole shareholder or, as the case may be, by the general meeting of shareholders voting with the quorum and majority rules set out under these Articles or, as the case may be, by the Law for any amendment of these Articles.
The new shares to be subscribed for by contribution in cash will be offered in preference to the existing shareholders in proportion to the part of the capital held by these shareholders. The Director, or as the case may be, the Board of Directors shall determine the period within which the preferred subscription right may be exercised. This period may not be less than thirty days.
Notwithstanding the above, the sole shareholder or, as the case may be, the general meeting, voting with the quorum and majority rules required for any amendment of the Articles, may limit or withdraw the preferential subscription right or authorise the Director or, as the case may be, the Board of Directors to do so in the case of an increase of capital within the authorised capital.
Preferred subscription right may also be waived individually by the shareholders, or by the general meeting, voting with the same conditions of quorum and majority as for amendments of the Articles and provided that the suppression of the preferred subscription right is specifically referred to in the shareholders notice to attend.
The preferred subscription right is not be applicable when the subscribed capital is increased by means of contributions in kind.
Art. 9. Acquisition of own shares. The Company may acquire and hold its own shares under the following legal limits, in accordance with article 49-2 and following of the Law.
The Company may acquire and hold its own shares according to the Law.
Chapter III. Directors, Board of directors, Statutory auditors
Art. 10. Board of directors. If the Company has a single shareholder, the latter may appoint only one Director (the “Director”); however, a single shareholder may also appoint a board of directors (the “Board of Directors”) composed of at least three (3) and of maximum seven (7) members, if it so chooses. When the Company has several shareholders, it shall be managed by a Board of Directors composed of at least three (3) and of maximum seven (7) members who need not be shareholders.
The Director(s) shall be appointed, by the sole shareholder or, as the case may be, by the general meeting of shareholders. The sole shareholder, or as the case may be the general meeting of shareholders, will determine their number and the duration of their mandate for a period not exceeding six (6) years, and they will hold office until their successors are elected. They may be re-elected, and they may be removed at any time, with or without cause, by a resolution of the sole shareholder or, as the case may be, of the general meeting of shareholders. The mandate of the Director or, as the case may be, the Directors shall be remunerated.
If a corporate entity is appointed as Director, it shall designate a natural person as its permanent representative, who will represent the corporate entity as Sole Director or as member of the Board of Directors, in accordance with article 5\bis of the Law. In the event of a vacancy on the Board of Directors, if applicable, the remaining Director(s) may meet and may elect a director to fill such vacancy on a provisional basis until the next meeting of shareholders.
The Director(s) shall not disclose, even after the term of their mandate, information on the Company made available to them, the disclosure of which may be detrimental to the Company’s interests, except when such a disclosure is mandatory by law or in public interest.
Art. 11. Meetings of the board of directors. If the Company has one sole Director, the latter will exercise the power granted by the Law to the Board of Directors.
The Board of Directors will appoint from among its members a chairman (the “Chairman”). It may also appoint a corporate secretary, who need not be a Director and who
will be responsible for keeping the minutes of the meetings of the Board of Directors and of the shareholder(s).
The Board of Directors will meet upon call by the Chairman. A meeting of the Board of Directors must be convened if any two Directors so require.
The Chairman will preside at all meetings of the Board of Directors and of the shareholders, except that in his absence the Board of Directors may appoint another Director and the general meeting of shareholders may appoint any other person as chairman pro tempore by vote of the majority present or represented at such meeting.
Except in cases of urgency or with the prior consent of all those entitled to attend, at least twenty-four hours written notice of board meetings shall be given. Any such notice shall specify the place, the date and time of the meeting as well as the agenda and the nature of the business to be transacted.
The notice may be waived by unanimous written consent given at the meeting by all Directors. No separate notice is required for meetings held at times and places specified in a schedule previously adopted by resolution of the Board of Directors.
Every board meeting shall be held in Luxembourg or such other place indicated in the notice.
Any Director may act at any meeting of the Board of Directors by appointing in writing another Director as his proxy.
A quorum of the Board of Directors shall be the presence or the representation of a majority of the Directors holding office.
Decisions will be taken by a majority of the votes of the Directors present or represented at such meeting. In case of plurality of votes, the Chairman has a casting vote.
One or more Directors may participate in a meeting by means of a conference call, by videoconference or by any similar means of communication enabling thus several persons participating therein to simultaneously communicate with each other. Such meetings shall be considered equivalent as a meeting held at the registered office of the Company.
Where time is of the essence, a written decision passed by circular means and expressed by cable, facsimile or any other similar means of communication, signed by all the Directors, is proper and valid as though it had been adopted at a meeting of the Board of Directors which was duly convened and held. Such a decision can be documented in a single document or in several separate documents having the same content and each of them signed by one or several Directors.
Art. 12. Minutes of meetings of the board of directors. The minutes of any meeting of the Board of Directors shall be signed by all Directors present at the meeting. Any proxies will remain attached thereto.
Copies or extracts thereof shall be certified by the sole Director or, as the case may be, by the corporate secretary appointed by the Board of Directors.
Art. 13. General powers of the board of directors. The Director or, as the case may be, the Board of Directors is vested with the broadest powers to act on behalf of the Company and to perform or authorise all acts of administrative or disposal nature, necessary or useful for accomplishing the Company’s object. All powers not expressly reserved by the Law or by these Articles to the sole shareholder or, as the case may be, to the general meeting of shareholders, fall within the competence of the Director or, as the case may be, the Board of Directors.
The Director or, as the case may be, the Board of Directors may freely decide to reimburse any share premium account of the Company to its shareholders, in accordance with the provisions of the Law.
Art. 14. Delegation of powers. The Director or, as the case may be, the Board of Directors, may delegate its powers to conduct the daily management and affairs of the Company and the representation of the Company for such daily management and affairs to any member or members of the Board of Directors, directors, managers or other officers who need not be shareholders of the Company under the form of an Executive Committee, under such terms and with such powers as the Director or, as the case may be, the Board of Directors shall determine.
The Director or, as the case may be, the Board of Directors may also confer all powers and special mandates to any person who need not be a Director, and delegate to one or more directors, managers of the company or other agents, who may but are not required to be shareholders, acting either alone or jointly, and appoint and dismiss all officers and employees and fix their emoluments.
When the Company is managed by a Board of Directors, the delegation of daily management to a member of the Board of Directors or the Executive Committee entails the obligation for the Board of Directors to report each year to the ordinary general meeting on the salary, fees and any advantages granted to the delegate.
The Director, or, as the case may be, the Board of Directors may appoint amongst others the following committees, an Executive Committee, an Audit Committee, a Nomination and Governance Committee, a Compensation Committee and any other advisory committees required by law or otherwise and the Director, or, as the case may be, the Board of Directors will determine their composition and purpose.
Art. 15. Representation of the company. In case only one Director has been appointed, the Company will be bound toward third parties by the sole signature of that Director or by any person(s) to whom such authority has been delegated by that Director.
In case the Company is managed by a Board of Directors, the Company will be bound towards third parties by the joint signature of any two Directors or by any person(s) to whom such authority has been delegated by the Board of Directors.
Art. 16. Conflict of interests. No contract or other transaction between the Company and any other company or firm shall be affected or invalidated by the fact that any one or more of the Directors or officers of the Company has a personal interest in, or is a director, associate, member, officer or employee of such other company or firm. Except as otherwise provided for hereafter, any Director or officer of the Company who serves as a director, associate, officer or employee of any company or firm with which the Company shall contract or otherwise engage in business shall not, by reason of such affiliation with such other company or firm, be automatically prevented from considering and voting or acting upon any matters with respect to such contract or other business.
Notwithstanding the above, in the event that any Director or officer of the Company may have any personal interest in any transaction of the Company, other than transactions concluded under normal conditions and falling within the scope of the day-to-day management of the Company, he shall make known to the Board of Directors (if any) such personal interest and shall not consider or vote on any such transaction, and such transaction and such Director’s or officer’s interest therein shall be reported to the sole shareholder or as the case may be, to the next general meeting of shareholders. However, when the Company is composed of a single Director, minutes mentioning transactions in which the Director has a personal interest shall be recorded. The Company shall indemnify (or as the case may be advance to) any Director or officer and his heirs, executors and administrators, against expenses and costs (including reasonable lawyers’ fees) reasonably incurred by him in connection with any action, suit or proceeding to which he may be made a party by reason of his being or having been a director or officer of the Company, or, at the request of the Company, of any other company of which the Company is a shareholder or creditor and by which he is not entitled to be indemnified, except in relation to matters as to which he shall be finally adjudged in such action, suit or proceeding to be liable for gross negligence or willful misconduct; in the event of a settlement, indemnification shall be provided only in connection with such matters covered by the settlement as to which the Company is advised by its legal counsel that the person to be indemnified did not commit such a breach of duty. The foregoing right of indemnification shall not exclude other rights to which he may be entitled.
Art. 17. Auditors. The supervision of the operations of the Company is entrusted to one or more auditors. The auditors will be elected by the sole shareholder or, as the case may be, the general meeting of shareholders by a simple majority of votes present or represented at the meeting, which will determine their number, for a period not exceeding six years. They will hold office until their successors are elected. They shall be eligible for re-election, but they may be removed at any time, with or without cause, by a resolution of the sole shareholder or, as the case may be, by a resolution adopted by a simple majority of votes present or represented at the meeting.
Chapter IV. Meetings of shareholders
Art. 18. Annual general meeting. The annual general meeting will be held at the registered office of the Company or at such other place as may be specified in the notice convening the meeting on the third Wednesday of the month of May of each year, at 10 a.m. If such day is a public holiday, the meeting will be held on the next following business day. Art. 19. Other general meetings of shareholders. If the Company is composed of one sole shareholder, the latter exercises the powers granted by the law to the general meeting of shareholders. In such case, the decisions of the sole shareholder are recorded in minutes. The Director or, as the case may be, the Board of Directors may convene other general meetings. Such meetings must be convened if shareholders representing at least one tenth of the Company’s capital so require in writing with an indication of the agenda of the up coming meeting. If the general meeting is not held within one month of the scheduled date, it may be convened by an agent designated by the judge presiding the Tribunal d’Arrondissement dealing with commercial matters and hearing interim relief matters, upon the request of one or more shareholders representing the 10% (ten percent) threshold. General meetings of shareholders, including the annual general meeting, may be held abroad if, in the discretion of the Director or, as the case may be, the Board of Directors, circumstances of force majeure so require. Art. 20. Powers of the meeting of shareholders. Any regularly constituted general meeting of shareholders of the Company represents the entire body of shareholders. Subject to all the other powers reserved to the Director or, as the case may be, the Board of Directors, by the Law or the Articles, the general meeting of shareholders has the broadest powers to adopt, carry out or ratify any act relating to the operations of the Company.
Art. 21. Procedure, Vote. The sole shareholder or, as the case may be, the general meeting of shareholders will meet upon call by the Director or, as the case may be, by the Board of Directors or the auditor(s) made in compliance with Luxembourg law and the present Articles. The notice sent to the shareholders in accordance with the Law will specify the time and place of the meeting as well as the agenda and the nature of the business to be transacted. Shareholders representing at least one tenth of the Company’s share capital may request in writing that additional items be included on the agenda of any general meeting. Such request shall be addressed to the registered office of the Company by registered letter at least five days before the date on which the general meeting shall be held. If all the shareholders are present or represented at a general meeting of shareholders and if they state that they have been informed of the agenda of the meeting, the meeting may be held without prior notice.
A shareholder may act at any meeting of shareholders by appointing in writing whether in original, by facsimile or e-mail to which an electronic signature (valid under Luxembourg law) is affixed as his proxy another person who need not be a shareholder. The Director or, as the case may be, the Board of Directors may determine all other conditions that must be fulfilled in order to take part in a general meeting of shareholders. Except as otherwise required by the Law or by the present Articles, all other resolutions will be taken by a simple majority of votes irrespective of the number of shares present or represented at the meeting. Any resolution whose purpose is to amend the present Articles or whose adoption is subject by virtue of these Articles or, as the case may be, the Law to the quorum and majority rules set for the amendment of the Articles will be taken by two third of shareholders representing at least half of the subscribed share capital of the Company. One or several shareholders may participate in a meeting by means of a conference call, by videoconference or by any similar means of communication thus enabling several persons participating therein to simultaneously communicate with each other. Such participation shall be deemed equivalent to a physical presence at the meeting. One vote is attached to each share. Copies or extracts of the minutes of the resolutions passed by sole shareholder or, as the case may be, by the general meeting of shareholders shall be certified by the sole Director or, as the case may be, by the Chairman of the Board of Directors or by any two Directors.
Chapter V. Financial year, Distribution of profits
Art. 22. Financial year. The Company’s financial year begins on the first day of the month of January and ends on the last day of the month of December every year. Art. 23. Adoption of financial statements. At the end of each financial year, the accounts are closed, the Director or, as the case may be, the Board of Directors, draw up an inventory of assets and liabilities, the balance sheet and the profit and loss account, in accordance with the Law. The balance sheet and the profit and loss account are submitted to the sole shareholder or, as the case may be, the general meeting of shareholders for approval. Art. 24. Appropriation of profits. From the annual net profits of the Company, five percent (5%) shall be allocated to the reserve required by the Law. That allocation will cease to be required as soon and as long as such reserve amounts to ten percent (10%) of the subscribed share capital of the Company. Upon recommendation of the sole Director, or as the case may be, the Board of Directors, the sole shareholder or, as the case may be, the general meeting of shareholders shall determine how the remainder of the annual net profits will be disposed. It may decide to allocate the whole or part of the remainder to a reserve or to a provision reserve, to carry it
forward to the next following financial year or to distribute it to the shareholder(s) as dividend.
Subject to the conditions fixed by the Law, the sole Director, or as the case may be, the Board of Directors may pay out an advance payment on dividends. The sole director or the Board of Directors fixes the amount and the date of payment of any such advance payment. Dividends may also be paid out of unappropriated net profit brought forward from prior financial years. Subject to the prior approval or ratifications by the following decision of the sole shareholder or, as the case may be, of the general meeting of shareholders, the Director or, as the case may be, the Board of Directors may pay out interim dividends on the basis of the statement of accounts prepared by the Director or, as the case may be, the Board of Directors, showing sufficient funds available for distribution, provided that the amount to be distributed does not exceed profits realized since the end of the financial year increased by profits carried forward and distributable reserves and decreased by losses carried forward and any sums to be allocated to the reserves required by the Law or by the Articles. The Director or, as the case may be, the Board of Directors fixes the amount and the date of payment of any such interim dividends.
Chapter VI. Dissolution, Liquidation of the company
Art. 25. Dissolution, Liquidation. Upon the affirmative proposal of the Sole Director, or as the case may be, the Board of Directors, the Company may be dissolved by a decision of the sole shareholder or, as the case may be, of the general meeting of shareholders voting with the same quorum and majority as for the amendment of these Articles, unless otherwise provided by the Law. Should the Company be dissolved, the liquidation will be carried out by one or more liquidators (who may be physical persons or legal entities) appointed by the sole shareholder or by the general meeting of shareholders, as the case may be, which will determine their powers and their compensation. After payment of all the debts of and charges against the Company and of the expenses of liquidation, the net assets shall be distributed equally to the shareholders pro rata to the number of the shares held by them.
Chapter VII. Applicable law
Art. 26. Applicable law. All matters not governed by these Articles shall be determined in accordance with the applicable Luxembourg Law.”
Exhibit 21.1
LIST OF SUBSIDIARIES
The following are subsidiaries of Altisource Portfolio Solutions S.A. as of December 31, 2013 and the jurisdictions in which they are organized.
1
Name
Jurisdiction of incorporation
or organization Altisource Solutions S.à r.l.
Luxembourg Altisource Asia Holdings, Ltd. I
Mauritius Altisource Business Solutions Private Limited
Delaware Altisource Outsourcing Solutions S.R.L. (99.99% of outstanding stock)
Uruguay Altisource Holdings, LLC
Delaware Altisource Outsourcing Solutions S.R.L. (0.01% of outstanding stock)
Uruguay Altisource Single Family, Inc.
Delaware Altisource Solutions B.V.
Netherlands Altisource Business Solutions, Inc.
Philippines The Mortgage Partnership of America, L.L.C.
Missouri Equator, LLC
California Altisource Real Estate Web Portal S.à r.l.
Luxembourg Altisource Consumer Analytics S.à r.l.
Luxembourg Altisource Mortgage Solutions S.à r.l.
Luxembourg Altisource Spend Management S.à r.l.
Luxembourg
Exhibit 23.1
CONSENT OF INDEPENDENT REGISTERED PUBLIC ACCOUNTING FIRM
We consent to the incorporation by reference in Registration Statement No. 333-161175 on Form S-8 of our reports dated February 13, 2014, relating to the consolidated financial statements of Altisource Portfolio Solutions S.A. and subsidiaries (the “Company”) (which report expresses an unqualified opinion on the consolidated financial statements and includes an explanatory paragraph related to the significant transactions with Ocwen Financial Corporation, a related party), and the effectiveness of the Company’s internal control over financial reporting appearing in this Annual Report on Form 10-K of the Company for the year ended December 31, 2013.
1
/s/ Deloitte and Touche LLP
Atlanta, Georgia
February 13, 2014
Exhibit 31.1
CHIEF EXECUTIVE OFFICER CERTIFICATION
I, William B. Shepro, certify that:
1. I have reviewed this annual report on Form 10-K for the year ended December 31, 2013 of Altisource Portfolio Solutions S.A.; 2. Based on my knowledge, this report does not contain any untrue statement of a material fact or omit to state a material fact necessary to
make the statements made, in light of the circumstances under which such statements were made, not misleading with respect to the period covered by this report;
3. Based on my knowledge, the financial statements, and other financial information included in this report, fairly present in all material
respects the financial condition, results of operations and cash flows of the registrant as of, and for, the periods presented in this report; 4. The registrant’s other certifying officer(s) and I are responsible for establishing and maintaining disclosure controls and procedures (as
defined in Exchange Act Rules 13a-15(e) and 15d-15(e)) and internal control over financial reporting (as defined in Exchange Act Rules 13a-15(f) and 15d-15(f)) for the registrant and have:
(a) Designed such disclosure controls and procedures, or caused such disclosure controls and procedures to be designed under our
supervision, to ensure that material information relating to the registrant, including its consolidated subsidiaries, is made known to us by others within those entities, particularly during the period in which this report is being prepared;
(b) Designed such internal control over financial reporting, or caused such internal control over financial reporting to be designed
under our supervision, to provide reasonable assurance regarding the reliability of financial reporting and the preparation of financial statements for external purposes in accordance with generally accepted accounting principles;
(c) Evaluated the effectiveness of the registrant’s disclosure controls and procedures and presented in this report our conclusions
about the effectiveness of the disclosure controls and procedures, as of the end of the period covered by this report based on such evaluation; and
(d) Disclosed in this report any change in the registrant’s internal control over financial reporting that occurred during the registrant’s
most recent fiscal quarter (the registrant’s fourth fiscal quarter in the case of an annual report) that has materially affected, or is reasonably likely to materially affect, the registrant’s internal control over financial reporting; and
5. The registrant’s other certifying officer and I have disclosed, based on our most recent evaluation of internal control over financial
reporting, to the registrant’s auditors and the audit committee of the registrant’s board of directors:
(a) All significant deficiencies and material weaknesses in the design or operation of internal control over financial reporting which are reasonably likely to adversely affect the registrant’s ability to record, process, summarize and report financial information; and
(b) Any fraud, whether or not material, that involves management or other employees who have a significant role in the registrant’s
internal controls over financial reporting.
Date: February 13, 2014 By: /s/ William B. Shepro
William B. Shepro
Director and Chief Executive Officer
(Principal Executive Officer)
Exhibit 31.2
CHIEF FINANCIAL OFFICER CERTIFICATION
I, Michelle D. Esterman, certify that:
1. I have reviewed this annual report on Form 10-K for the year ended December 31, 2013 of Altisource Portfolio Solutions S.A.; 2. Based on my knowledge, this report does not contain any untrue statement of a material fact or omit to state a material fact necessary to
make the statements made, in light of the circumstances under which such statements were made, not misleading with respect to the period covered by this report;
3. Based on my knowledge, the financial statements, and other financial information included in this report, fairly present in all material
respects the financial condition, results of operations and cash flows of the registrant as of, and for, the periods presented in this report; 4. The registrant’s other certifying officer(s) and I are responsible for establishing and maintaining disclosure controls and procedures (as
defined in Exchange Act Rules 13a-15(e) and 15d-15(e)) and internal control over financial reporting (as defined in Exchange Act Rules 13a-15(f) and 15d-15(f)) for the registrant and have:
(a) Designed such disclosure controls and procedures, or caused such disclosure controls and procedures to be designed under our
supervision, to ensure that material information relating to the registrant, including its consolidated subsidiaries, is made known to us by others within those entities, particularly during the period in which this report is being prepared;
(b) Designed such internal control over financial reporting, or caused such internal control over financial reporting to be designed
under our supervision, to provide reasonable assurance regarding the reliability of financial reporting and the preparation of financial statements for external purposes in accordance with generally accepted accounting principles;
(c) Evaluated the effectiveness of the registrant’s disclosure controls and procedures and presented in this report our conclusions
about the effectiveness of the disclosure controls and procedures, as of the end of the period covered by this report based on such evaluation; and
(d) Disclosed in this report any change in the registrant’s internal control over financial reporting that occurred during the registrant’s
most recent fiscal quarter (the registrant’s fourth fiscal quarter in the case of an annual report) that has materially affected, or is reasonably likely to materially affect, the registrant’s internal control over financial reporting; and
5. The registrant’s other certifying officer and I have disclosed, based on our most recent evaluation of internal control over financial
reporting, to the registrant’s auditors and the audit committee of the registrant’s board of directors:
(a) All significant deficiencies and material weaknesses in the design or operation of internal control over financial reporting which are reasonably likely to adversely affect the registrant’s ability to record, process, summarize and report financial information; and
(b) Any fraud, whether or not material, that involves management or other employees who have a significant role in the registrant’s
internal controls over financial reporting.
Date: February 13, 2014 By: /s/ Michelle D. Esterman
Michelle D. Esterman
Chief Financial Officer
(Principal Financial Officer and
Principal Accounting Officer)
Exhibit 32.1
Certification of the Chief Executive Officer Pursuant to 18 U.S.C. Section 1350,
As Adopted Pursuant to Section 906 of the Sarbanes-Oxley Act of 2002
In connection with the Annual Report on Form 10-K of Altisource Portfolio Solutions S.A. (the “Company”) for the year ended December 31, 2013 as filed with the Securities and Exchange Commission on the date hereof (the “Report”), I, William B. Shepro, Chief Executive Officer of the Company, certify, pursuant to 18 U.S.C. Section 1350, as adopted pursuant to Section 906 of the Sarbanes-Oxley Act of 2002, that, to my knowledge:
(1) The Report fully complies with the requirements of Section 13(a) or 15(d) of the Securities Exchange Act of 1934; and (2) The information contained in the Report fairly presents, in all material respects, the financial condition and results of operations of
the Company.
Date: February 13, 2014 By: /s/ William B. Shepro
William B. Shepro
Director and Chief Executive Officer
(Principal Executive Officer)
Exhibit 32.2
Certification of the Chief Financial Officer Pursuant to 18 U.S.C. Section 1350,
As Adopted Pursuant to Section 906 of the Sarbanes-Oxley Act of 2002
In connection with the Annual Report on Form 10-K of Altisource Portfolio Solutions S.A. (the “Company”) for the year ended December 31, 2013 as filed with the Securities and Exchange Commission on the date hereof (the “Report”), I, Michelle D. Esterman, Chief Financial Officer of the Company, certify, pursuant to 18 U.S.C. Section 1350, as adopted pursuant to Section 906 of the Sarbanes-Oxley Act of 2002, that to my knowledge:
(1) The Report fully complies with the requirements of Section 13(a) or 15(d) of the Securities Exchange Act of 1934; and (2) The information contained in the Report fairly presents, in all material respects, the financial condition and results of operations of
the Company.
Date: February 13, 2014 By: /s/ Michelle D. Esterman