50
Altus Reservoir 2007 Sedimentation Survey U.S. Department of the Interior Bureau of Reclamation Technical Service Center Denver, Colorado April 2008
| Date post: | 30-Mar-2018 |
| Category: |
Documents |
| Upload: | phungkhuong |
| View: | 227 times |
| Download: | 4 times |

Altus Reservoir 2007 Sedimentation Survey
U.S. Department of the Interior Bureau of Reclamation Technical Service Center Denver, Colorado April 2008

U.S. Department of the Interior Bureau of Reclamation Technical Service Center Water and Environmental Resources Division Sedimentation and River Hydraulics Group Denver, Colorado April 2008
Altus Reservoir 2007 Sedimentation Survey prepared by Ronald L. Ferrari
ACKNOWLEDGMENTS
The Bureau of Reclamation's (Reclamation) Sedimentation and River Hydraulics (Sedimentation) Group of the Technical Service Center (TSC) prepared and published this report. Ronald Ferrari of the Sedimentation Group and Marcio White of the Reclamation’s Oklahoma Area Office of the Great Plains Region conducted the bathymetry survey of the reservoir in June of 2007. In November 2006 and February 2008, staff under the direction of Mr. Tom Buchanan of the Lugert-Altus Irrigation District worked with Reclamation staff in conducting the land surveys of the reservoir. Ron Ferrari completed the data processing to generate the new topographic map and area-capacity tables. Kent Collins of the Sedimentation Group performed the technical peer review of this documentation.
Mission Statements The mission of the Department of the Interior is to protect and provide access to our Nation’s natural and cultural heritage and honor our trust responsibilities to Indian Tribes and our commitments to island communities. The mission of the Bureau of Reclamation is to manage, develop, and protect water and related resources in an environmentally and economically sound manner in the interest of the American public.
Reclamation Report This report was produced by the Bureau of Reclamation’s Sedimentation and River Hydraulics Group (Mail Code 86-68240), PO Box 25007, Denver, Colorado 80225-0007, www.usbr.gov/pmts/sediment/. Disclaimer No warranty is expressed or implied regarding the usefulness or completeness of the information contained in this report. References to commercial products do not imply endorsement by the Bureau of Reclamation and may not be used for advertising or promotional purposes.
REPORT DOCUMENTATION PAGE Form Approved OMB No. 0704-0188
The public reporting burden for this collection of information is estimated to average 1 hour per response, including the time for reviewing instructions, searching existing data sources, gathering and maintaining the data needed, and completing and reviewing the collection of information. Send comments regarding this burden estimate or any other aspect of this collection of information, including suggestions for reducing the burden, to Department of Defense, Washington Headquarters Services, Directorate for Information Operations and Reports (0704-0188), 1215 Jefferson Davis Highway, Suite 1204, Arlington, VA 22202-4302. Respondents should be aware that notwithstanding any other provision of law, no person shall be subject to any penalty for failing to comply with a collection of information if it does not display a currently valid OMB control number. PLEASE DO NOT RETURN YOUR FORM TO THE ABOVE ADDRESS. 1. REPORT DATE (DD-MM-YYYY) April 2008
2. REPORT TYPE
3. DATES COVERED (From – To)
5a. CONTRACT NUMBER 5b. GRANT NUMBER
4. TITLE AND SUBTITLE Altus Reservoir 2007 Sedimentation Survey
5c. PROGRAM ELEMENT NUMBER 5d. PROJECT NUMBER 5e. TASK NUMBER
6. AUTHOR(S) Ronald L. Ferrari
5f. WORK UNIT NUMBER
7. PERFORMING ORGANIZATION NAME(S) AND ADDRESS(ES) Bureau of Reclamation, Technical Service Center, Denver, CO 80225
8. PERFORMING ORGANIZATION REPORT NUMBER
10. SPONSOR/MONITOR'S ACRONYM(S)
9. SPONSORING/MONITORING AGENCY NAME(S) AND ADDRESS(ES) Bureau of Reclamation, Denver Federal Center, PO Box 25007 Denver, CO 80225-0007 11. SPONSOR/MONITOR'S REPORT
NUMBER(S)
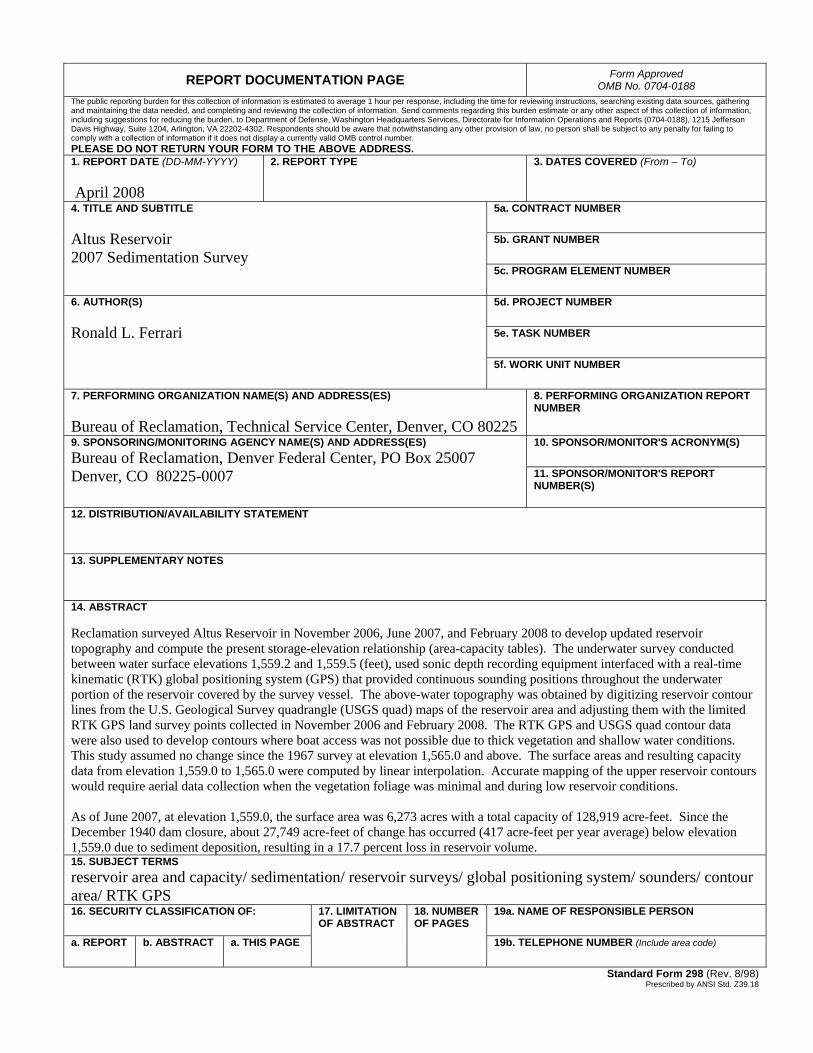
12. DISTRIBUTION/AVAILABILITY STATEMENT 13. SUPPLEMENTARY NOTES 14. ABSTRACT Reclamation surveyed Altus Reservoir in November 2006, June 2007, and February 2008 to develop updated reservoir topography and compute the present storage-elevation relationship (area-capacity tables). The underwater survey conducted between water surface elevations 1,559.2 and 1,559.5 (feet), used sonic depth recording equipment interfaced with a real-time kinematic (RTK) global positioning system (GPS) that provided continuous sounding positions throughout the underwater portion of the reservoir covered by the survey vessel. The above-water topography was obtained by digitizing reservoir contour lines from the U.S. Geological Survey quadrangle (USGS quad) maps of the reservoir area and adjusting them with the limited RTK GPS land survey points collected in November 2006 and February 2008. The RTK GPS and USGS quad contour data were also used to develop contours where boat access was not possible due to thick vegetation and shallow water conditions. This study assumed no change since the 1967 survey at elevation 1,565.0 and above. The surface areas and resulting capacity data from elevation 1,559.0 to 1,565.0 were computed by linear interpolation. Accurate mapping of the upper reservoir contours would require aerial data collection when the vegetation foliage was minimal and during low reservoir conditions. As of June 2007, at elevation 1,559.0, the surface area was 6,273 acres with a total capacity of 128,919 acre-feet. Since the December 1940 dam closure, about 27,749 acre-feet of change has occurred (417 acre-feet per year average) below elevation 1,559.0 due to sediment deposition, resulting in a 17.7 percent loss in reservoir volume. 15. SUBJECT TERMS reservoir area and capacity/ sedimentation/ reservoir surveys/ global positioning system/ sounders/ contour area/ RTK GPS 16. SECURITY CLASSIFICATION OF: 19a. NAME OF RESPONSIBLE PERSON
a. REPORT
b. ABSTRACT a. THIS PAGE
17. LIMITATION OF ABSTRACT
18. NUMBER OF PAGES
19b. TELEPHONE NUMBER (Include area code)
Standard Form 298 (Rev. 8/98) Prescribed by ANSI Std. Z39.18

Table of Contents
Page
Introduction ...................................................................................................................................... 1 Summary and Conclusions............................................................................................................... 5 Control Survey Data Information..................................................................................................... 7 Reservoir Operations........................................................................................................................ 8 Hydrographic Survey Equipment and Method................................................................................. 9 Reservoir Area and Capacity.......................................................................................................... 15
Topography Development....................................................................................................... 15 Lateral Distribution ................................................................................................................. 19 Longitudinal Distribution........................................................................................................ 28 Development of the 2007 Altus Reservoir Surface Areas....................................................... 31 2007 Storage Capacity ............................................................................................................ 38
2007 Reservoir Sediment Analyses................................................................................................ 41 References ...................................................................................................................................... 44
Index of Figures
Page Figure 1 - Reclamation Reservoirs Located in Oklahoma................................................................ 1 Figure 2 - Downstream Face of Altus Dam...................................................................................... 2 Figure 3 - USGS Quad of Altus Reservoir ....................................................................................... 4 Figure 4 - Reservoir Sediment Delta Formation............................................................................... 5 Figure 5 - Temporary Point Set on East Dike, November 2006....................................................... 7 Figure 6 - Survey Vessel with Mounted Instrumentation on Jackson Lake in Wyoming. ............... 9 Figure 7 - Altus Reservoir 2006/2007/2008 Survey Data Points. .................................................. 11 Figure 8 - RTK GPS instruments mounted on all terrain vehicles in upper reservoir area. Far
vehicle is parked near the reservoir water's edge. ................................................................. 13 Figure 9 - View from Granite Bridge looking upstream. Shows the thick vegetation that has
established on the sediment deposition, preventing access for GPS measurements. ............ 14 Figure 10 - Altus Reservoir Topographic Map. ............................................................................. 17 Figure 11 - Range Line 1................................................................................................................ 20 Figure 12 - Range Line 2................................................................................................................ 20 Figure 13 - Range Line 2A............................................................................................................. 21 Figure 14 - Range Line 3................................................................................................................ 21 Figure 15 - Range Line 4................................................................................................................ 22 Figure 16 - Range Line 5................................................................................................................ 22 Figure 17 - Range Line 6................................................................................................................ 23 Figure 18 - Range Line 6A............................................................................................................. 23 Figure 19 - Range Line 7................................................................................................................ 24 Figure 20 - Range Line 8................................................................................................................ 24 Figure 21 - Range Line 9................................................................................................................ 25 Figure 22 - Range Line 11.............................................................................................................. 25 Figure 23 - Range Line 13.............................................................................................................. 26 Figure 24 - Range Line 14.............................................................................................................. 26 Figure 25 - Range Line 14A........................................................................................................... 27 Figure 26 - Range Line 15.............................................................................................................. 27 Figure 27 - Altus Reservoir Longitudinal Profile........................................................................... 29 Figure 28 - Altus Reservoir Area and Capacity Plots..................................................................... 35

Figure 29 - Range Line 16 (1967 report)........................................................................................ 36 Figure 30 - Range Line 16A (1967 report)..................................................................................... 36 Figure 31 - Range Line 17 (1967 report)........................................................................................ 37 Figure 32 - Range Line 18 (1967 report)........................................................................................ 37 Figure 33 - 1998 Aerial View of Altus Reservoir. ......................................................................... 42
Index of Tables
Page
Table 1 - Reservoir Sediment Data Summary (page 1 of 2)........................................................... 33 Table 2 - Summary of 2007 Survey Results................................................................................... 39
Altus Reservoir 2007 Sedimentation Survey
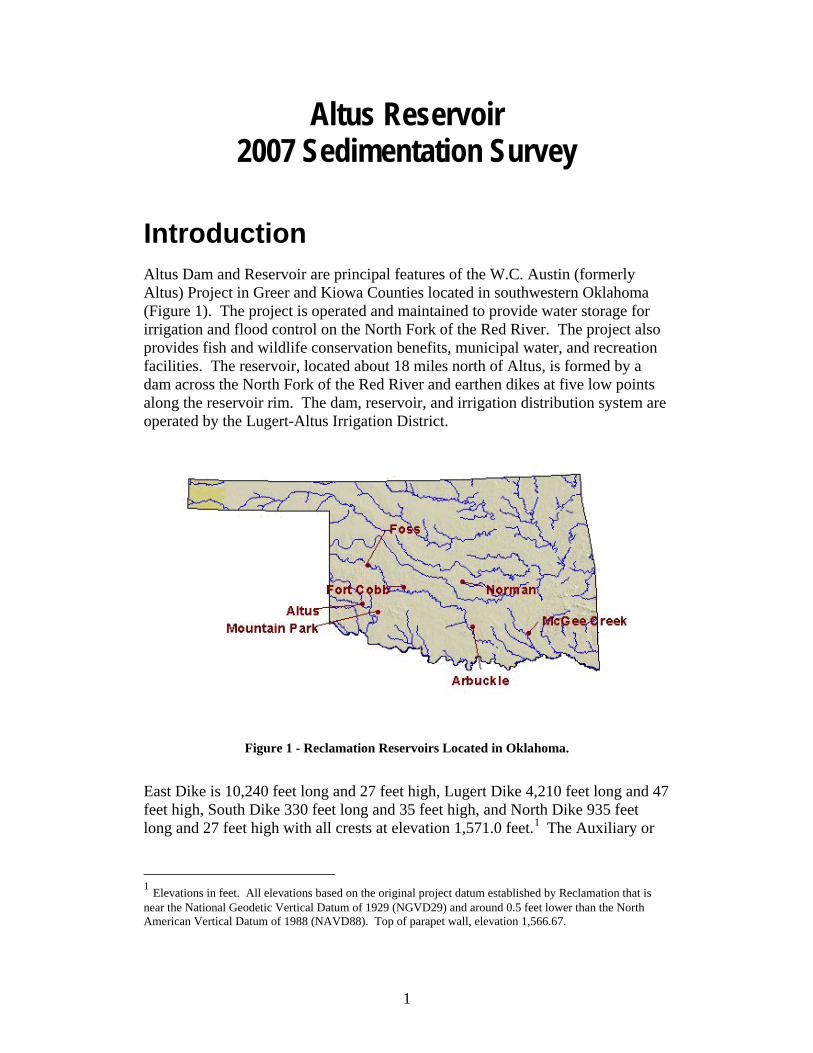
Introduction Altus Dam and Reservoir are principal features of the W.C. Austin (formerly Altus) Project in Greer and Kiowa Counties located in southwestern Oklahoma (Figure 1). The project is operated and maintained to provide water storage for irrigation and flood control on the North Fork of the Red River. The project also provides fish and wildlife conservation benefits, municipal water, and recreation facilities. The reservoir, located about 18 miles north of Altus, is formed by a dam across the North Fork of the Red River and earthen dikes at five low points along the reservoir rim. The dam, reservoir, and irrigation distribution system are operated by the Lugert-Altus Irrigation District.
Figure 1 - Reclamation Reservoirs Located in Oklahoma.
East Dike is 10,240 feet long and 27 feet high, Lugert Dike 4,210 feet long and 47 feet high, South Dike 330 feet long and 35 feet high, and North Dike 935 feet long and 27 feet high with all crests at elevation 1,571.0 feet.1 The Auxiliary or
1 Elevations in feet. All elevations based on the original project datum established by Reclamation that is near the National Geodetic Vertical Datum of 1929 (NGVD29) and around 0.5 feet lower than the North American Vertical Datum of 1988 (NAVD88). Top of parapet wall, elevation 1,566.67.
1

Santa Fe Railroad Dike is 5,000 feet long and 25 feet high with crest elevation 1,569.0. Altus Dam is a partially curved concrete gravity structure with granite masonry except on the downstream face of the overflow section (Figure 2). The dam’s dimensions are: Hydraulic height2 62.3 feet Structural height 110 feet Crest length 1,112 feet Crest elevation 1,564.0 feet
Figure 2 - Downstream Face of Altus Dam.
Incorporated near dam center are both controlled and uncontrolled overflow-type spillways. The uncontrolled section is 110.5 feet wide at crest elevation 1,559.0, with a discharge capacity of about 4,900 cubic-feet-seconds (cfs) at reservoir elevation 1,564.0. The controlled portion is regulated by nine radial gates, each 21 feet wide and 15 feet high. The controlled section is 229 feet wide at crest elevation 1,547.0 with a top of gate elevation of 1,562.0. The capacity of each radial gate at reservoir elevation 1,564.0 is about 5,800 cfs.
2 The definition of such terms as “hydraulic height,” “structural height,” etc. may be found in manuals such as Reclamation’s Design of Small Dams and Guide for Preparation of Standing Operating Procedures for Dams and Reservoirs, or ASCE’s Nomenclature for Hydraulics.
2

The canal outlet works consists of three 72-inch diameter outlet conduits controlled by 5-foot by 5-foot high pressure gates. The canal outlet has a total capacity of 1,000 cfs at elevation 1,524.0 and 3,500 cfs at elevation 1,559.0. The original river outlet works through the dam are no longer operational. The drainage area above the dam is 2,515 square miles of which 399 is considered noncontributing by the USGS. The area originates about 15 miles west of Amarillo, Texas and extends eastward into western Oklahoma. There are no known major structures in the watershed to reduce sediment contributions into the reservoir. However, the Granite Bridge and the State Highway 9 causeway, located within the reservoir about 9 miles upstream of the dam, have a dramatic affect on the sediment distribution within the reservoir. The Granite Bridge, near the east bank, is the only bypass for sediment downstream of the one-mile long causeway. The causeway is an elevated earthen dike that blocks about ninety percent of the reservoir. The 1970’s developed USGS quad of the reservoir shows the North Fork Red River meandering upstream of the causeway from reservoir east bank to west bank, then running parallel along the causeway before entering the main body of the reservoir under the bridge. Since this 1970’s developed map, the route of the river upstream of the bridge has straightened out where it now runs along the east bank of the reservoir. The reservoir is around 13.1 miles long with an average width of one mile (Figure3). Reservoir sedimentation is an ongoing depositional process that can remain invisible for a significant portion of the life of a reservoir. As the river enters the reservoir the flow depth increases and velocity decreases, resulting in a loss in the sediment transport capacity of the inflow, and allowing the sediment to deposit in the upper reservoir area (Figure 4). Initially the sediment deposition process occurred somewhat differently in Altus Reservoir. The Granite Bridge causeway in Altus Reservoir acted as a dam, meaning the majority of the inflowing sediment initially deposited in the very upper operation elevation range of the reservoir above this structure. The 1948 and 1967 surveys measured the most significant change due to sediment deposition in the reservoir above the causeway (Lara, 1971). As early as the 1967 reservoir survey, a drawdown of only a few feet resulted in a large exposure of the lake bottom in the upper reservoir area where the majority of the initial sediment had been deposited. With so much of the original upper area having been filled with sediment during the early years of reservoir operations, and with the river now flowing more directly into the main reservoir area below the causeway, the majority of future inflowing sediments will be deposited in the main body of the reservoir downstream of the bridge.
3

Figure 3 - USGS Quad of Altus Reservoir
4

Figure 4 - Reservoir Sediment Delta Formation.
Summary and Conclusions This Reclamation report presents the results of the 2007 survey of Altus Reservoir. The primary objectives of the survey were to gather data needed to: $ develop reservoir topography $ compute area-capacity relationships $ estimate storage depletion, by sediment deposition, since dam closure A control survey was conducted using the on-line positioning user service (OPUS) and RTK GPS to establish a horizontal and vertical control network near the reservoir for the hydrographic surveys. OPUS is operated by the National Geodetic Survey (NGS) and allows users to submit GPS data files that are processed with known point data to determine positions relative to the national control network. Initially, the GPS base was set over a temporary rebar on East Dike. The coordinates for this point were processed using OPUS, and from this base additional points were established and checked during the November 2006 and February 2008 land surveys and the June 2007 bathymetric surveys. The horizontal control for this study was in feet, Oklahoma South state plane coordinates, in the North American Datum of 1983 (NAD83). The vertical control was in feet, tied to NAVD88 and the Reclamation project vertical datum. All elevations in this report are referenced to Reclamation’s project or construction vertical datum that is near NGVD29 and about 0.5 feet lower than NAVD88. In November 2006, the RTK GPS land survey was conducted near reservoir elevation 1,541. Since the basin had been dry for several years, the survey was conducted assuming the data would be combined with a spring 2007 bathymetric survey where the inflows would provide overlap between the two surveyed areas.
5
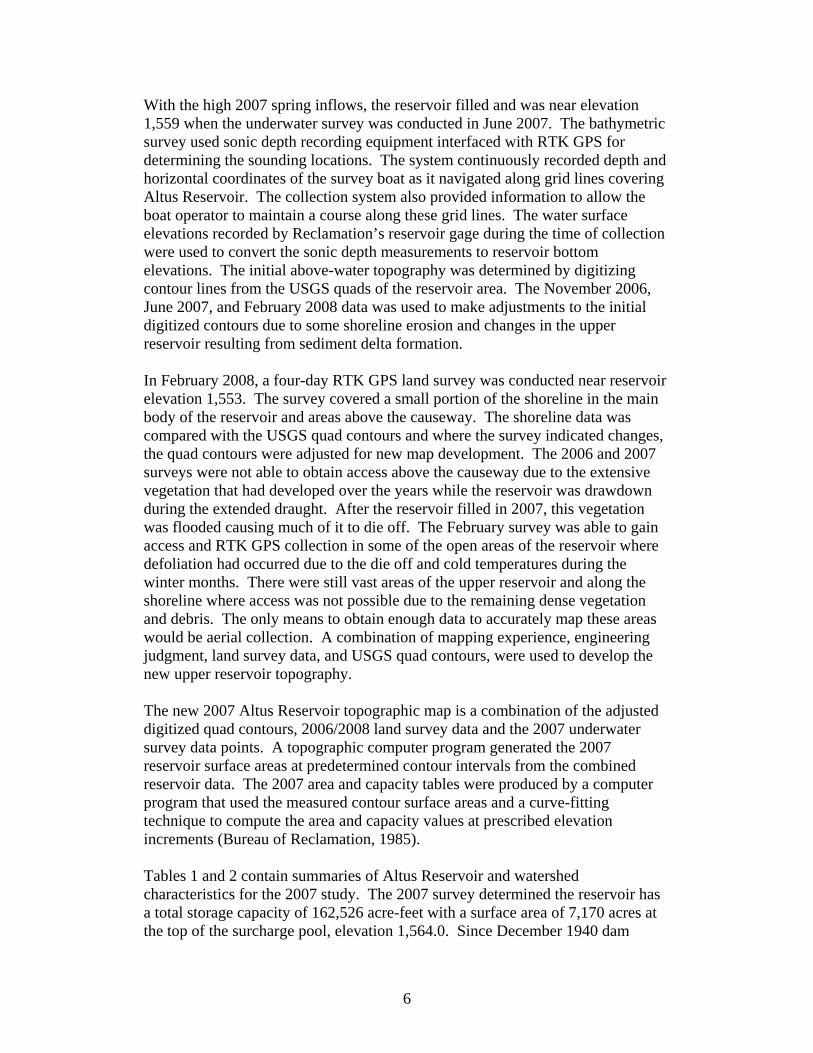
With the high 2007 spring inflows, the reservoir filled and was near elevation 1,559 when the underwater survey was conducted in June 2007. The bathymetric survey used sonic depth recording equipment interfaced with RTK GPS for determining the sounding locations. The system continuously recorded depth and horizontal coordinates of the survey boat as it navigated along grid lines covering Altus Reservoir. The collection system also provided information to allow the boat operator to maintain a course along these grid lines. The water surface elevations recorded by Reclamation’s reservoir gage during the time of collection were used to convert the sonic depth measurements to reservoir bottom elevations. The initial above-water topography was determined by digitizing contour lines from the USGS quads of the reservoir area. The November 2006, June 2007, and February 2008 data was used to make adjustments to the initial digitized contours due to some shoreline erosion and changes in the upper reservoir resulting from sediment delta formation. In February 2008, a four-day RTK GPS land survey was conducted near reservoir elevation 1,553. The survey covered a small portion of the shoreline in the main body of the reservoir and areas above the causeway. The shoreline data was compared with the USGS quad contours and where the survey indicated changes, the quad contours were adjusted for new map development. The 2006 and 2007 surveys were not able to obtain access above the causeway due to the extensive vegetation that had developed over the years while the reservoir was drawdown during the extended draught. After the reservoir filled in 2007, this vegetation was flooded causing much of it to die off. The February survey was able to gain access and RTK GPS collection in some of the open areas of the reservoir where defoliation had occurred due to the die off and cold temperatures during the winter months. There were still vast areas of the upper reservoir and along the shoreline where access was not possible due to the remaining dense vegetation and debris. The only means to obtain enough data to accurately map these areas would be aerial collection. A combination of mapping experience, engineering judgment, land survey data, and USGS quad contours, were used to develop the new upper reservoir topography. The new 2007 Altus Reservoir topographic map is a combination of the adjusted digitized quad contours, 2006/2008 land survey data and the 2007 underwater survey data points. A topographic computer program generated the 2007 reservoir surface areas at predetermined contour intervals from the combined reservoir data. The 2007 area and capacity tables were produced by a computer program that used the measured contour surface areas and a curve-fitting technique to compute the area and capacity values at prescribed elevation increments (Bureau of Reclamation, 1985). Tables 1 and 2 contain summaries of Altus Reservoir and watershed characteristics for the 2007 study. The 2007 survey determined the reservoir has a total storage capacity of 162,526 acre-feet with a surface area of 7,170 acres at the top of the surcharge pool, elevation 1,564.0. Since December 1940 dam
6

closure, the reservoir has an estimated volume change of 30,316 acre-feet below elevation 1,564.0 and 27,749 acre-feet below top of conservation elevation 1,559.0, resulting in a 17.7 percent loss in original capacity below elevation 1,559.0. This equates to an average annual loss of 417 acre-feet between 1940 and 2007.
Control Survey Data Information Prior to the surveys, a temporary point was set on East Dike using OPUS to establish the horizontal and vertical control datum (Figure 5). OPUS is operated by the NGS and allows users to submit GPS data files that are processed with known data to determine point positions relative to the national control network. The East Dike temporary point was used as the base for the November 2006, June 2007, and February 2008 surveys.
Figure 5 - Temporary Point set on East Dike, November 2006.
The horizontal control was in Oklahoma south zone state plane coordinates in NAD83 and the vertical control was tied to NAVD88 and the Reclamation project vertical datum. All elevations in this report are referenced to Reclamation’s project or construction vertical datum that is near NGVD29 and around 0.5 feet lower than NAVD88. During the November 2006 survey a control shot was taken on a brass cap located along the dam alignment on the right bank with following results:
7

North 568,239.44 East 1,579,523.30 Elevation 1,570.34 The Oklahoma-Texas Area Office forwarded control data information for a brass cap, labeled F105 with following coordinates in NAD27 and NGVD29: North 568,201.67 East 161,122.26 Elevation 1,569.65 The point data information was converted to NAD83 and NAVD88 using the Corp of Engineers conversion program CORPSCON: North 568,241.30 East 1,579,523.24 Elevation 1,570.18 It appears from the coordinates that they are the same datum point. The difference vertically is very small, only 0.16 feet, but there is a two-foot horizontal shift. This point was shot from a temporary base station established in the upper reservoir area. The brass cap was unmarked and visually worn. The information could be used as a control check during future surveys.
Reservoir Operations Altus Reservoir is part of the W.C. Austin Project that was designed to provide storage for irrigation, municipal water, and flood control. The project also provides benefits for fish and wildlife conservation and recreation facilities. The June 2007 capacity table lists 162,526 acre-feet of total storage below the maximum water surface elevation 1,564.03, table 1. The 2007 survey measured a minimum lake bottom elevation of 1,510.5. The following values are from the June 2007 capacity table: $ 13,981 acre-feet of surcharge pool storage between elevation 1,562.0 and 1,564.0 $ 19,626 acre-feet of flood control pool storage between elevation 1,559.0 and 1,562.0 $ 128,286 acre-feet of conservation pool storage between elevation 1,517.5 and 1,559.0 $ 633 acre-feet of dead pool storage below elevation 1,517.5.0 3 2007 Altus Reservoir area and capacity tables were extended to elevation 1,570.0. From elevation 1,564.0 through 1,566.67, top of parapet wall, there is 19,903 acre-feet of storage.
8

The computed annual inflow and reservoir stage records for Altus Reservoir are listed by water year in Table 1 for the available period 1945 through 2007. The inflow values were computed by the Great Plains Regional Office and showed the annual fluctuation with a computed average annual inflow of 104,039 acre-feet. The maximum reservoir elevation of 1,562.1 was recorded during water year 1951. The minimum reservoir elevation of 1,523.0 was recorded during water year 1985. During water years 2002 through 2007, the reservoir was below elevation 1,530 four out of the six years of reservoir operation, meaning the active reservoir body remained between the dam and the Granite Bridge.
Hydrographic Survey Equipment and Method The hydrographic survey equipment was mounted in the cabin of a 24-foot trihull aluminum vessel equipped with twin in-board motors (Figure 6). The hydrographic system included a GPS receiver with a built-in radio, a depth sounder, a helmsman display for navigation, a computer, and hydrographic system software for collecting the underwater data. An on-board generator supplied power to all the equipment. The shore equipment included a second GPS receiver with an external radio. The GPS receiver and antenna were mounted on a survey tripod over a known datum point and a 12-volt battery provided the power for the shore unit.
Figure 6 - Survey Vessel with Mounted Instrumentation on Jackson Lake in Wyoming.
The Sedimentation and River Hydraulics Group uses RTK GPS with the major benefit being precise heights measured in real time to monitor water surface elevation changes. The basic output from a RTK receiver are precise 3-D coordinates in latitude, longitude, and height with accuracies on the order of 2 centimeters horizontally and 3 centimeters vertically. The output is on the GPS
9

datum of WGS-84 that the hydrographic collection software converted into Oklahoma’s state plane coordinates, south zone in NAD83. The RTK GPS system employs two receivers that track the same satellites simultaneously just like with differential GPS. The Altus Reservoir bathymetric survey was conducted from June 4 through June 9 of 2007 between water surface elevation 1,559.2 and 1,559.5 (Reclamation project datum). The boat was not used for several of the days due to extreme winds. The bathymetric survey was conducted using sonic depth recording equipment, interfaced with a RTK GPS, capable of determining sounding locations within the reservoir. The survey system software continuously recorded reservoir depths and horizontal coordinates as the survey boat moved along closely spaced grid lines covering the reservoir area. Most transects (grid lines) were run somewhat parallel to the upstream-downstream alignment of the reservoir at around 200-foot spacing. The survey vessel's guidance system gave directions to the boat operator to assist in maintaining the course along these predetermined lines. Data was collected along the shore by the survey vessel for the majority of the reservoir. There were coves on both the east and west sides of the reservoir that were not covered by the survey vessel due to shallow water conditions and thick vegetation that invaded those areas during the recent reservoir draw down. Vegetation was also a problem in the very upper reach of the reservoir, both upstream and downstream of the Granite Bridge where it hindered access by the survey vessel. During each run, the depth and position data were recorded on the laptop computer hard drive for subsequent processing. Final processing of the underwater collected data set resulted in around 98,000 points (Figure 7). The 2007 underwater data was collected by a depth sounder calibrated by lowering an instrument that measured the sound velocity of the reservoir water column. The individual depth soundings were adjusted by the speed of sound of the measurements which can vary with density, salinity, temperature, turbidity, and other conditions. The soundings were further verified by lowering a weighted cable below the boat with beads marking known depths. The collected data were digitally transmitted to the computer collection system through a RS-232 port. The depth sounder also produced an analog hard-copy chart of the measured depths. These graphed analog charts were analyzed during post-processing, and when the analog charted depths indicated a difference from the computer recorded bottom depths, the computer data files were modified. The water surface elevations at the dam, recorded by a Reclamation gage, were used to convert the sonic depth measurements to true lake-bottom elevations. Additional information on collection and analysis procedures is included in Engineer and Design: Hydrographic Surveying (Corps of Engineers, January 2002) and Reservoir Survey and Data Analysis (Ferrari and Collins, 2006).
10

Figure 7 - Altus Reservoir 2006/2007/2008 survey data points.
11

12

A RTK GPS land survey was conducted by personnel from Reclamation and Lugert-Altus Irrigation District in November 2006 when the reservoir level was low, near elevation 1,541. Due to the extended drought and calls to survey the reservoir, the land survey was conducted under the assumption that the reservoir may not rise very much during spring runoff. Under that assumption, the land survey concentrated within the lower reservoir elevations where the terrain was wide open and sediment deposition had occurred. The survey was accomplished by mounting the RTK GPS receivers on all-terrain vehicles (ATV’s) and setting them to automatically collect data every ten feet as the ATV’s proceeded around the reservoir area where they had access (Figure 8). Access was limited due to thick vegetation in the upper elevations along the shore, upstream of the Granite Bridge, and also areas just downstream of the bridge. Collection near the existing water surface was also limited due to the soft bottom conditions that caused the vehicles to become stuck at times. Some data was collected on foot below the Granite Bridge along the river channel where openings in the vegetation allowed access and RTK GPS collection (Figure 9). The ground survey data was tied to the same control network as the bathymetric collection with elevations tied to NAVD88. During post processing, the elevations were shifted to match the Reclamation vertical datum, near NGVD29.
Figure 8 - RTK GPS instruments mounted on all terrain vehicles in upper reservoir area.
Far vehicle is parked near the reservoir water's edge.
13

Figure 9 - View from the Granite Bridge looking upstream. Shows the thick vegetation that has established itself on the sediment deposition, preventing access for GPS measurements.
In February 2008, an additional RTK GPS land survey was conducted by personnel from Reclamation and the Lugert-Altus Irrigation District when the reservoir level was near elevation 1,553. The four-day survey was conducted along a small portion of the shoreline in the main body of the reservoir and above the causeway. The shoreline data was compared with previous digitized USGS quad contours that were adjusted as warranted. The previous surveys were not able to gain access above the causeway due to the extensive vegetation growth while the reservoir was drawn down over the past few years. Full reservoir operation in 2007 flooded and killed some of this vegetation. The February survey was able to gain access in some open areas of the reservoir where the defoliation allowed RTK GPS ground shots. There was still a vast portion of the reservoir in the upper area and along the shoreline where access and GPS collection was not possible due to the thick vegetation and debris, especially in the extreme upper reservoir above elevation 1,556. The only means to obtain enough data to accurately map these areas of the reservoir would be aerial collection. But the 2006 and 2008 land surveys did allow limited reservoir topographic development. During the February 2008 survey, there was a shallow body of water upstream of Granite Bridge similar to that shown in the photograph on the cover of this report and in Figure 33. At the time of the 2008 survey, there was no connecting channel between this body of water and the main reservoir. The survey measured the upper body water surface about one foot higher than the main body reservoir water surface. The two bodies connect near reservoir elevation 1555.
14
Reservoir Area and Capacity
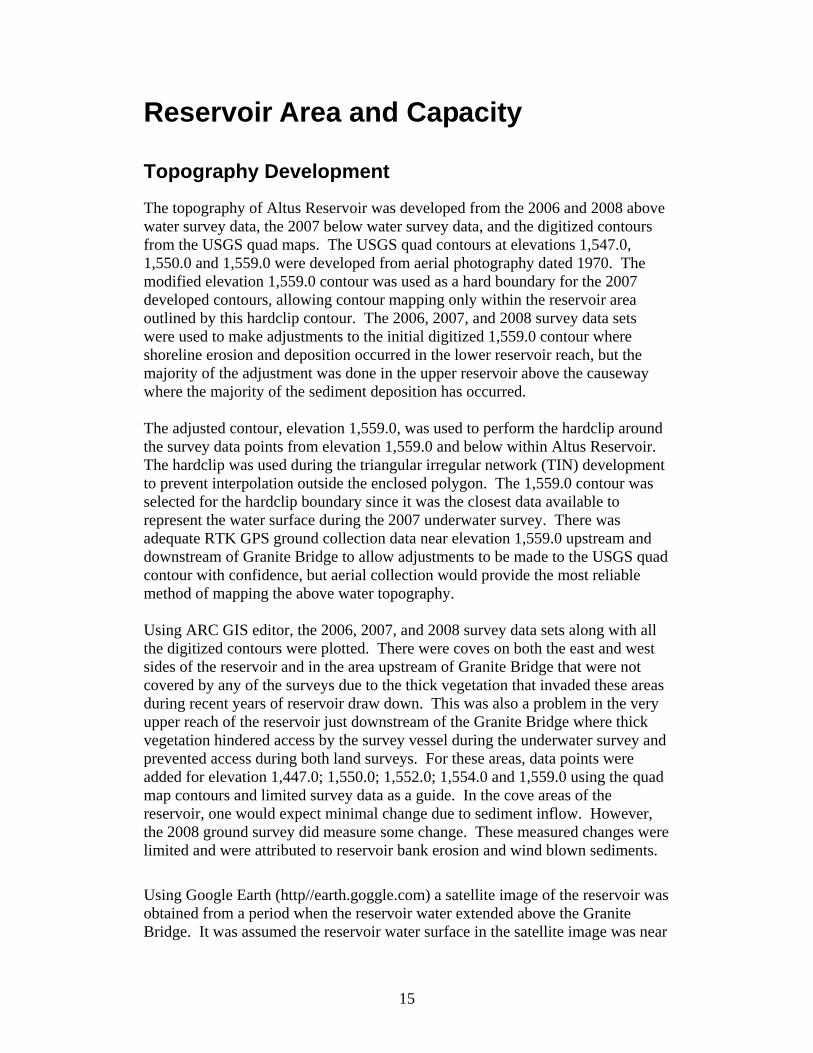
Topography Development
The topography of Altus Reservoir was developed from the 2006 and 2008 above water survey data, the 2007 below water survey data, and the digitized contours from the USGS quad maps. The USGS quad contours at elevations 1,547.0, 1,550.0 and 1,559.0 were developed from aerial photography dated 1970. The modified elevation 1,559.0 contour was used as a hard boundary for the 2007 developed contours, allowing contour mapping only within the reservoir area outlined by this hardclip contour. The 2006, 2007, and 2008 survey data sets were used to make adjustments to the initial digitized 1,559.0 contour where shoreline erosion and deposition occurred in the lower reservoir reach, but the majority of the adjustment was done in the upper reservoir above the causeway where the majority of the sediment deposition has occurred. The adjusted contour, elevation 1,559.0, was used to perform the hardclip around the survey data points from elevation 1,559.0 and below within Altus Reservoir. The hardclip was used during the triangular irregular network (TIN) development to prevent interpolation outside the enclosed polygon. The 1,559.0 contour was selected for the hardclip boundary since it was the closest data available to represent the water surface during the 2007 underwater survey. There was adequate RTK GPS ground collection data near elevation 1,559.0 upstream and downstream of Granite Bridge to allow adjustments to be made to the USGS quad contour with confidence, but aerial collection would provide the most reliable method of mapping the above water topography. Using ARC GIS editor, the 2006, 2007, and 2008 survey data sets along with all the digitized contours were plotted. There were coves on both the east and west sides of the reservoir and in the area upstream of Granite Bridge that were not covered by any of the surveys due to the thick vegetation that invaded these areas during recent years of reservoir draw down. This was also a problem in the very upper reach of the reservoir just downstream of the Granite Bridge where thick vegetation hindered access by the survey vessel during the underwater survey and prevented access during both land surveys. For these areas, data points were added for elevation 1,447.0; 1,550.0; 1,552.0; 1,554.0 and 1,559.0 using the quad map contours and limited survey data as a guide. In the cove areas of the reservoir, one would expect minimal change due to sediment inflow. However, the 2008 ground survey did measure some change. These measured changes were limited and were attributed to reservoir bank erosion and wind blown sediments.
Using Google Earth (http//earth.goggle.com) a satellite image of the reservoir was obtained from a period when the reservoir water extended above the Granite Bridge. It was assumed the reservoir water surface in the satellite image was near
15

elevation 1,555.0 or slightly higher. The satellite image showed the reservoir water body in the coves similar in shape to the upper USGS quad contours. Using all available information, points were added along the elevation 1,547.0 and 1,550.0 quad contours in the side coves as necessary to allow the software program to develop more accurate contours. The cross sections collected during the 1967 Altus Reservoir survey showed that much of the original area upstream of Granite Bridge, above elevation 1,550.0, had been lost due to sediment deposition. Additional confirmation of this deposition was obtained from the 2008 land survey. Points were also added along the upstream causeway alignment and pond outline. The points were added using ARCGIS editor where they were interpolated using all available data and previous mapping experience.
Contours for the reservoir below elevation 1,559.0 were developed from the TIN generated within ARCGIS. A TIN is a set of adjacent non-overlapping triangles computed from irregularly spaced points with x,y coordinates and z values. A TIN is designed to deal with continuous data such as elevations. The TIN software uses a method known as Delaunay's criteria for triangulation where triangles are formed among all data points within the polygon clip. The method requires that a circle drawn through the three nodes of a triangle will contain no other point, meaning that all the data points are connected to their nearest neighbors to form triangles. This method preserves all the collected data points. The TIN method is discussed in detail in the ARCGIS user’s documentation, (ESRI, 2007). The linear interpolation option of the ARCGIS TIN and CONTOUR commands was used to interpolate contours from the Altus Reservoir TIN. The areas of the enclosed contour polygons at one-foot increments were computed from the survey data for elevations 1,511.0 through 1,556.0. Since limited above water data was collected, this study assumed no change in reservoir surface area since the 1967 survey at elevation 1,565.0 and higher. The surface area of the developed elevation 1559.0 contour, minus the island areas, was used for the 2007 area and capacity computations. The reservoir contour topography at 2-foot intervals from elevation 1,556.0 and below is presented on Figure 10. Development of the contours within ARCGIS was directly from the TIN using all the enclosed data points resulted in a somewhat jagged representation of the contours. There are other mapping packages that can be used to generate smoother contours, but for this study the TIN approach including all data points was used to produce the most accurate surface area and resulting volume. The best means to develop the upper contours and resulting above water reservoir areas would be by aerial survey with the reservoir drawn down, but budget limitations prevented such collection.
16

17
Figure 10 - Altus Reservoir topographic map.

18

Lateral Distribution
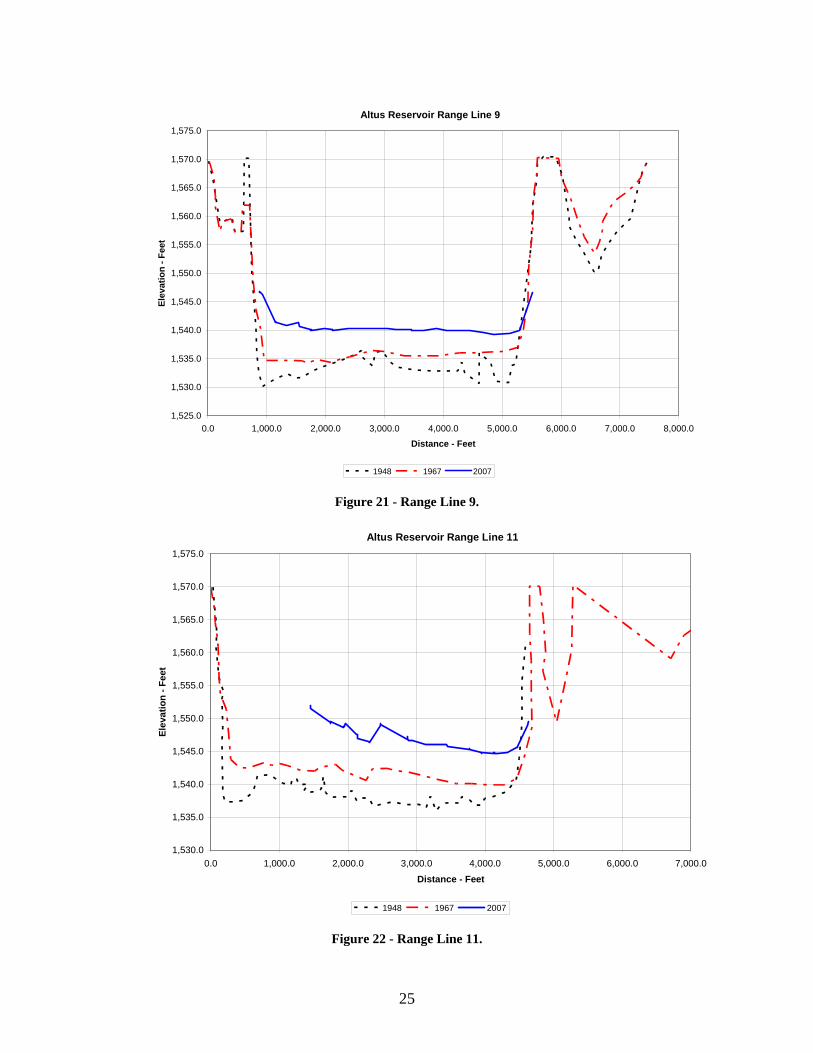
Profiles of several of the 25 previously surveyed sedimentation range lines were developed during this study to provide a visual representation of the lateral sediment deposition change since the 1948 and 1967 surveys (Figures 11 through 26). The location of the range lines along with the data points collected by this study are presented on Figure 7. The range line locations were visually determined from the reservoir sedimentation range system maps presented in the 1967 survey report. The range line plots were recreated by digitizing the 1948 and 1967 sedimentation range plots presented in the 1967 report (Lara, 1971). It appears the plots are from left to right bank looking downstream. The plots in the 1967 report were of a small scale, but enough detail was presented to allow digital interpolation. Using tools within ARCGIS, 2007 cross section data was developed by cutting profiles through the surveyed data points. The routine stored the nearest points along the projected range lines. These stored points varied from 10 to 50 feet from the projected alignment depending on available data. As seen from Figure 7, there were no data points from Range Lines 16 and above, and only limited data points available for Range Lines 13, 14, and 14a. Thick vegetation would have hindered much of the data collection above range line 16, but previous survey results showed that this area of the reservoir had mostly silted in laterally from elevation 1,555.0 and below. The 1967 results showed that large areas above elevation 1,559.0 had also been lost to sediment deposition. The Range Line plots provided valuable insight into the change in lateral sediment distribution. Range Lines 1 and 2 showed minimal sediment deposit since 1967 considering the length of time (40 years) between surveys. Minor sediment deposition was also measured at Range Lines 2A, 3, 4, 5, 6, 6A, 7 and 8. The first significant lateral buildup of sediment occurred at range line 9, located about 1.5 miles downstream of the causeway. Considerable sediment buildup was also measured at Range Lines 11 and 13, located downstream of the causeway. At Range Line 14, located just upstream of the bridge and causeway, there has been about five feet of sediment deposition since the 1967 survey. Even though limited 2008 survey data was collected above the causeway, the developed Range Lines 14, 14A, and 15 each showed the sediment level near elevation 1,555. Range Lines 14 and 14A cross the existing upstream water pond, but it appeared the average depth was only a few feet and would not significantly impact the average bottom elevation computations at these locations. Range Lines 14A and 15 showed a minimal change in the top sediment level since the 1967 survey. It was assumed that surveys of Range Line 16 and above would have produced similar general results.
19

Altus Reservoir Range Line 1
1,500.0
1,510.0
1,520.0
1,530.0
1,540.0
1,550.0
1,560.0
1,570.0
1,580.0
0.0 1,000.0 2,000.0 3,000.0 4,000.0 5,000.0 6,000.0
Distance - Feet
Elev
atio
n - F
eet
1948 1967 2007
Figure 11 - Range Line 1.
Altus Reservoir Range Line 2
1,500.0
1,510.0
1,520.0
1,530.0
1,540.0
1,550.0
1,560.0
1,570.0
1,580.0
0.0 1,000.0 2,000.0 3,000.0 4,000.0 5,000.0 6,000.0 7,000.0
Distance - Feet
Elev
atio
n - F
eet
1948 1967 2007
Figure 12 - Range Line 2.
20

Altus Reservoir Range Line 2A
1,500.0
1,510.0
1,520.0
1,530.0
1,540.0
1,550.0
1,560.0
1,570.0
1,580.0
0.0 100.0 200.0 300.0 400.0 500.0 600.0 700.0 800.0 900.0
Distance - Feet
Elev
atio
n - F
eet
Original 1967 2007
Figure 13 - Range Line 2A.
Altus Reservoir Range Line 3
1,510.0
1,520.0
1,530.0
1,540.0
1,550.0
1,560.0
1,570.0
1,580.0
0.0 1,000.0 2,000.0 3,000.0 4,000.0 5,000.0 6,000.0 7,000.0
Distance - Feet
Elev
atio
n - F
eet
1948 1967 2007
Figure 14 - Range Line 3.
21

Altus Reservoir Range Line 4
1,510.0
1,520.0
1,530.0
1,540.0
1,550.0
1,560.0
1,570.0
1,580.0
0.0 1,000.0 2,000.0 3,000.0 4,000.0 5,000.0 6,000.0 7,000.0
Distance - Feet
Elev
atio
n - F
eet
1948 1967 2007
Figure 15 - Range Line 4.
Altus Reservoir Range Line 5
1,510.0
1,520.0
1,530.0
1,540.0
1,550.0
1,560.0
1,570.0
1,580.0
0.0 1,000.0 2,000.0 3,000.0 4,000.0 5,000.0 6,000.0 7,000.0 8,000.0 9,000.0 10,000.0
Distance - Feet
Elev
atio
n - F
eet
1948 1967 2007
Figure 16 - Range Line 5.
22

Altus Reservoir Range Line 6
1,510.0
1,520.0
1,530.0
1,540.0
1,550.0
1,560.0
1,570.0
1,580.0
0.0 1,000.0 2,000.0 3,000.0 4,000.0 5,000.0 6,000.0 7,000.0 8,000.0 9,000.0
Distance - Feet
Elev
atio
n - F
eet
1948 1967 2007
Figure 17 - Range Line 6.
Altus Reservoir Range Line 6A
1,510.0
1,520.0
1,530.0
1,540.0
1,550.0
1,560.0
1,570.0
1,580.0
0.0 1,000.0 2,000.0 3,000.0 4,000.0 5,000.0 6,000.0 7,000.0 8,000.0 9,000.0 10,000.0
Distance - Feet
Elev
atio
n - F
eet
1948 1967 2007
Figure 18 - Range Line 6A.
23

Altus Reservoir Range Line 7
1,520.0
1,525.0
1,530.0
1,535.0
1,540.0
1,545.0
1,550.0
1,555.0
1,560.0
1,565.0
1,570.0
1,575.0
0.0 1,000.0 2,000.0 3,000.0 4,000.0 5,000.0 6,000.0 7,000.0 8,000.0 9,000.0 10,000.0
Distance - Feet
Elev
atio
n - F
eet
1948 1967 2007
Figure 19 - Range Line 7.
Altus Reservoir Range Line 8
1,525.0
1,530.0
1,535.0
1,540.0
1,545.0
1,550.0
1,555.0
1,560.0
1,565.0
1,570.0
1,575.0
4,000.0 4,500.0 5,000.0 5,500.0 6,000.0 6,500.0 7,000.0 7,500.0 8,000.0 8,500.0 9,000.0
Distance - Feet
Elev
atio
n - F
eet
1948 1967 2007
Figure 20 - Range Line 8.
24
Altus Reservoir Range Line 9
1,525.0
1,530.0
1,535.0
1,540.0
1,545.0
1,550.0
1,555.0
1,560.0
1,565.0
1,570.0
1,575.0
0.0 1,000.0 2,000.0 3,000.0 4,000.0 5,000.0 6,000.0 7,000.0 8,000.0
Distance - Feet
Elev
atio
n - F
eet
1948 1967 2007
Figure 21 - Range Line 9.
Altus Reservoir Range Line 11
1,530.0
1,535.0
1,540.0
1,545.0
1,550.0
1,555.0
1,560.0
1,565.0
1,570.0
1,575.0
0.0 1,000.0 2,000.0 3,000.0 4,000.0 5,000.0 6,000.0 7,000.0
Distance - Feet
Elev
atio
n - F
eet
1948 1967 2007
Figure 22 - Range Line 11.
25

Altus Reservoir Range Line 13
1,535.0
1,540.0
1,545.0
1,550.0
1,555.0
1,560.0
1,565.0
1,570.0
1,575.0
0.0 1,000.0 2,000.0 3,000.0 4,000.0 5,000.0 6,000.0
Distance - Feet
Elev
atio
n - F
eet
1948 1967 2007
Figure 23 - Range Line 13.
Altus Reservoir Range Line 14
1,540.0
1,545.0
1,550.0
1,555.0
1,560.0
1,565.0
1,570.0
1,575.0
1,580.0
0.0 500.0 1,000.0 1,500.0 2,000.0 2,500.0 3,000.0 3,500.0 4,000.0 4,500.0
Distance - Feet
Elev
atio
n - F
eet
1948 1967 2007
Figure 24 - Range Line 14.
26

Altus Reservoir Range Line 14A
1,540.0
1,545.0
1,550.0
1,555.0
1,560.0
1,565.0
1,570.0
1,575.0
0.0 500.0 1,000.0 1,500.0 2,000.0 2,500.0 3,000.0 3,500.0 4,000.0 4,500.0 5,000.0
Distance - Feet
Elev
atio
n - F
eet
1948 1967 2007
Figure 25 - Range Line 14A.
Altus Reservoir Range Line 15
1,540.0
1,545.0
1,550.0
1,555.0
1,560.0
1,565.0
1,570.0
1,575.0
0.0 1,000.0 2,000.0 3,000.0 4,000.0 5,000.0 6,000.0
Distance - Feet
Elev
atio
n - F
eet
1948 1967 2007
Figure 26 - Range Line 15.
27

Longitudinal Distribution
A means to further illustrate the sediment accumulation is a longitudinal plot of the distribution throughout the reservoir from Range Line 1 upstream (Figure 27). The longitudinal profile of the original river channel was projected from a small plot presented in the 1967 report. The profiles from 1948, 1967 and 2007, for Range Lines 1 through 15, were developed by computing the average main channel bottom elevation for each range line. To extend the 1948 and 1967 profiles above Range Line 15, the location and elevations were interpolated from the plot in the 1967 report. The profile shows an extreme rise in sediment depths occurring at Range Line 14, located just upstream of the Granite Bridge. From this pivot point (Figure 4), the sediment deposition slopes upstream, but does not show a major change since the 1967 survey. It is assumed that the 2007 profile upstream of Range Line 15 would not differ much from the 1967 profile. The rise of sediment depth at Range Line 14 going upstream for both the 1967 and 2007 surveys shows the influence of the causeway that restricts the inflowing river sediment before it enters the main reservoir body by passing downstream under the bridge. The 2007 plot shows the sediment build up downstream of the bridge (foreset slope) at Range Lines 9, 11 and 13. Further downstream towards the dam (Range Line 8 downstream), the sediment deposited along the bottomset slope to the dam and only shows a slight build up since the 1967 survey. Over time, it is expected the pivot point will begin to move further downstream, but the causeway will continue to influence this along with the sediment inflow rate. The comparison of the 1948, 1967 and 2007 profiles illustrates that the sediment inflow into the reservoir as been significantly reduced since the 1967 survey. The depths between these profiles show the buildup between the survey periods with the 2007 profile only showing a major change from Range Line 9 upstream to Range Line 14. When you figure the time period between the surveys, the profiles further illustrate the significant reduction in sediment inflow since the 1948 and 1967 surveys.
28

Altus Reservoir Longitudinal Profiles
1,500
1,505
1,510
1,515
1,520
1,525
1,530
1,535
1,540
1,545
1,550
1,555
1,560
1,565
1,570
1,575
0.0 2.0 4.0 6.0 8.0 10.0 12.0 14.0 16.0
Distance in Miles
Elev
atio
n in
Fee
t
Original 1948 1967 2007G
rani
te B
ridge
-----
------
--
------
RL2
A -----
RL3
-----
RL6
A
-----
RL2
------
RL4
------
-- R
L5
------
RL6
-----
RL7
-----
RL1
5
----
RL
11
-----
RL 8
------
RL9
-----
RL1
3
------
-- R
L14,
Figure 27 - Altus Reservoir longitudinal profile.
29

30

Development of the 2007 Altus Reservoir Surface Areas
The 2007 surface areas for Altus Reservoir were computed at 1-foot increments directly from the reservoir TIN from elevation 1,510.0 through 1,556.0. The TIN was developed from collected and interpolated data sets within the hardclip polygon created from the previously described digitized 1,559.0 contour. Surface area calculations were performed using ARCGIS commands that compute areas at user-specified elevations directly from the TIN. For the purpose of this study, the measured survey areas at 2- and 5-foot increments from elevation 1,510.0 through 1,556.0 were used in computing the new area and capacity tables. The 2007 adjusted 1,559.0 contour with resulting surface area was an input for computing the new area and capacity tables. This study assumed no change in surface area, since the 1967 survey, at elevation 1,565.0 and above. A straight line interpolation was used to compute the surface areas between elevations 1,559.0 and 1,565.0. A 1967 area and capacity table was located that showed the 1967 study computed the surface area and resulting capacity using straight-line interpolation between elevation 1,550.0 to 1,565.0. No written explanation was given, but the 1967 Altus Reservoir study did have surveyed range lines in the upper reservoir that measured the major changes. The 1967 surveyed cross sections above the Granite Bridge showed the causeway as a major restriction of sediment flowing into the lower body of the reservoir. The 1967 cross sections showed that since the 1948 survey, the majority of the surface area from the causeway upstream from elevation 1,550.0 and below had been lost due to sediment accumulation. The surveyed range lines also showed that a large portion of the surface area above elevation 1,550.0 had been lost due to sediment deposition. Due to this measured deposition, it appears the 1967 method of projecting the data between elevations 1,550.0 to 1,565.0 was the only means available outside of additional data collection. The 2007 study had the same issues, but the collected data determined that projecting was only necessary from elevation 1,559.0 to 1,565.0. Table 1 provides a summary of all the surveys that have been conducted on Altus Reservoir including the 1940 (original), 1948, 1953, 1967, and 2007 results. The area and capacity curves for all of these surveys are plotted on Figure 28. The table and plots show interesting results from all of these surveys. The 1948 results actually showed a slight increase in surface area at elevation 1,559.0 while the 1953 and 1967 survey results showed a significant loss of surface area at the same elevation. The original surface areas were measured from developed contours, and until 2007, all the surveys were conducted by measuring 25 or 26 cross sections to represent the 16 mile length of Altus Reservoir. The 1967 Altus Reservoir surface areas were computed using the range width ratio method explained in more detail in Chapter 9 of the Sedimentation Groups Erosion and Sedimentation Manual (Ferrari and Collins, 2006).
31

At first look, one could question such a large loss of surface area at the elevation 1,559.0 contour in 1967 when compared to the previous surveys. Upon viewing the range line plots above the Granite Bridge, it showed that a major surface area loss occurred in these upper elevation contours (Figures 11 through 26 and Figures 29 through 32). The Figure 29 through 32 plots are of the 1948 and 1967 survey results showing the sediment build-up along these range lines. As part of the 2007 analysis, the USGS quad contours of the reservoir area were digitized. These contours were developed from 1970 aerial photographs that were taken only three years after the 1967 survey. The following table shows the surface area results from the digitized contours along with the 1940 original and 1967 survey results. Elevation Year of Survey (Feet) (Surface area in acres)
1940 1967 1970 Aerial 1,540.0 3,720 3,219 3,512 1,547.0 4,777 4,081 4,511 1,559.0 6,772 6,260 6,431
Note: For elevation 1,559.0, the total digitized USGS area is with the islands removed, but above the Granite Bridge there appears to be additional islands that show as high green shaded areas on the quad sheet.
The table results show the differences between using the range line method of computation, as was used in 1967, versus the 1970 aerial results. The 1970 surface areas for elevation 1,540.0 and 1,547.0 are both around ten percent higher than the 1967 results. For elevation 1,559.0, the difference was only three percent. There are errors associated with the scale of the USGS quad maps that need to be considered. But the aerial data should provide the most accurate measurement of the surface area throughout the reservoir. The aerial data included the shoreline coves that may have been projected as silted-in during the 1967 analysis. If the coves were improperly evaluated in 1967, some of the 1967 data results could be flawed. The 2007 study used the USGS quad contour data information to represent the side coves. The February 2008 RTK GPS survey helped in developing the elevation 1,559.0 contour that was used for the 2007 reservoir mapping. This additional data helped to validate the 1,559.0 contour development, but primarily assisted in adjusting this contour above the causeway that has been greatly affected due to sediment deposition. The computed surface area for the 2007 adjusted 1,559.0 contour was 6,273 acres, nearly matching the computed results projected during the 1967 surface area development.
32

33
1. 2. 3. STATE Oklahoma4. 5. Altus 6. COUNTY7. ° 53 ' 8 " ° 17 ' 43 " 8. 2 9. SPILLWAY CREST EL 3
10. 11. 12. GROSS STORAGE 15CAPACITY, AC-FT
a. 4
b. 5
c.d. 16e.f.g.17. LENGTH OF RESERVOIR
18. TOTAL DRAINAGE AREA 6 22. 7
19. NET SEDIMENT CONTRIBUTING AREA 6 23. MEAN ANNUAL RUNOFF
20. LENGTH MILES AVG. WIDTH MILES 24. MEAN ANNUAL INFLOW 8
21. 25. °F °F 7
26. DATE OF 27. 28. 29. 30. 31. C/
26. DATE OF 35. 36
8 8 8
26. DATE OF 37. 38.
26. DATE OF 39.AVG. DRY WT. 40. SED. DEP. TONS/MI.2-YR 41. STORAGE LOSS, PCT. 42 SEDIMENT (#/FT3) b. TOTAL b. TOTAL TO INFLOW, PPM
TO DATE DATE a. PER. b. TOT.
43.
12/1940
2.12
7,065
c.AVG. ANN.
7.68 4.864.05 7.2811.12 12.74 25.886.67 8.56.07 3.03
PERCENT OF TOTAL SEDIMENT LOCATED WITHIN REACH DESIGNATION14.26 4.48 11.83 11.1 14.42 12.31 7.97 11.93 7.93
20.67
-2.832.99
10.54
North Fork, Red River
PERCENT OF TOTAL SEDIMENT LOCATED WITHIN DEPTH DESIGNATION
NEAREST P.O.
2-ft
a.
13,806
AVG. ANNUALa.
27,7490.065
0.683
a.
8.81
PERIOD
759 0.700580
14,673
1,096
5.12
838417 0.197
9,849
/MI.2-YR.
0.398
TOTALb.MEAN ANN.
126,980 952,320
0.521
1,502,793
0.509
2,730,690103,4406,554,452104,039
TOTAL SEDIMENT DEPOSITS TO DATE, AF
1,227,8973,823,762
6/2007
E 5.1 12.6
A 6/1953 20.3 10
7/1953 5,778
120-115-
62.3-60
105-
8.5
50-40
0.0
40-30
5.26
6/1948
10
a.
6,793
2116
TYPE OF
Contour (D)Range (D)
NO. OF
1027
PER.YRS
PER.YRS
26.440.1
89,000107,940
MILES
PRECIPITATION
66.5
146.5
U
Range (D)
13.
IRRIGATION
12/1940
ANNUAL
SURVEY
4/19676/2007
Range (D)
STORAGEALLOCATION
ELEVATION
251513.1
SQUARE MILES
24.4
0.01
0.010.01
110-0-10 60-7010-20 20-30 70-8030-40 80-9040-50 50-60
1.713.54
28.3126.6113.71
3.241.99
16.488.22 25.96 12.44
19.3522.6214.85
17.116.216.0
20.6216.4718.92
14.120.266 17.70
60970.2 10
C-5
9,1138,2130.535
20-10 10-C
60-50 30-20
3.78
7,072
DEPTH DESIGNATION RANGE IN FEET BELOW AND ABOVE CREST ELEVATION
90-100
4/1967
26.DATEOF
16.1
DATE
6/1948 580
472
52.3 10
7/1953 66.9 10 1,023
4/1967139 6/2007
8,368 10
128,919
119,270550,473952,320
a.
c. TOTAL
126,980
6,273
5,575
100.5068,028 10
0.2861,1331,070
606
383,347
/MI.2-YR.
0.535
RANGES OR
134,494
0.9ACRE-FEET
AREA, AC.
LAT
MILES24.2
1,559.0JOINT USECONSERVATION
1,564.0
99LONG
SURCHARGE
TOP OF DAM ELEVATIONRANGE 20W
34M
D
8
Bureau of Reclamation
95,356
256,700
7/1953
STREAM22
INTERVALSContour (D)
S
1
63SAB
17.2
MEAN ANNUAL PRECIPITATION
I
O
N
3,500+
152,060
AVG. WIDTH OF RESERVOIR
I
7,705
INACTIVEDEAD
FLOOD CONTROLES
6,772
R
V
RE
ORIGINAL
36,174
SURFACE AREA, AC-FT
R
TOP OF POOL192,842
156,668
1496.7
4,608
13.8
148,640
MAX. ELEVATION
SQUARE MILES
MIN. ELEVATION
INCHESINCHES
104,039
1,517.5 4,6081,073
142,862
156,668
RATIO AF/AF32.ACRE - FEET
BEGAN
DATE NORMAL
33.
OPERATIONS
6/19/1946
120to
BEGAN
1.241.291.371.431.51
22,174
1,0708,028
MAX. ANN.
188,800
b.
PERIOD WATER INFLOW, ACRE-FEET
213,400
MEAN ANN.10
10
10
6/1948
7
TOTALa.
6/2007
b.c.AVG. ANN.
7.5 7.5
24.2
b.
34. PERIOD
24.4
VR
6/1948
-11RANGE°FANNUAL TEMP, MEAN
CAPACITY
WATER INFLOW TO DATE, AF
SURVEYPERIOD CAPACITY LOSS, ACRE-FEET
TOTAL
SURVEY
4/1967
SURVEY
AT
Y
D
SURVEY
6/2007
SURVEY
26. 44.
6/19487/19534/1967
REACH DESIGNATION PERCENT OF TOTAL ORIGINAL LENGTH OF RESERVOIR
6/1948
4/1967
RESERVOIR SEDIMENTDATA SUMMARY
Altus Reservoir1
A 5NTWP.OWNERSEC
NAME OF RESERVOIR 1DATA SHEET NO.
9
25
2 to 5-feet 6,77226
256,575
96,260
Greer-Kiowa
ORIGINAL
SURFACE
DATESTORAGE
1564.014.
1559.0
ACRE-FEET
Table 1 - Reservoir Sediment Data Summary (page 1 of 2).
34
1
2
3
4
5
6
7
8
9
10
11
1,554.0 5,053 101,03891,16481,774 1,552.01,550.0 4,5701,548.0
1,564.0
60,796
177,267
64,706
128,919
1,546.0 72,940
162,526
3,970
6,2731,559.04,820
1,545.0
1,556.0
3,849
5,362
19491,528.21,540.81,551.61951
1947139,900
1,550.51,560.21,562.1 213,400
160,2001,526.91,542.01,553.5 158,600
12,92051,180
194619481950
1,531.21,548.01,560.4
Irrigation capacity includes 4,800 acre-feet of municipal use.
2,610
SURVEY 11 1,564.0 7,705 192,842
1,557.5
1960
6,772 156,668
1940
116
1,557.91,560.0
1,539.4
ELEVATION AREA CAPACITY
1,550.3
1,559.1
1,559.9 1,548.3
1,500.0 1 21SURVEY
134
2,5104,2791,545.0
1,530.0
1,559.0
7,793
1,540.0
2007
1,530.0 2,0491,525.0 1,603
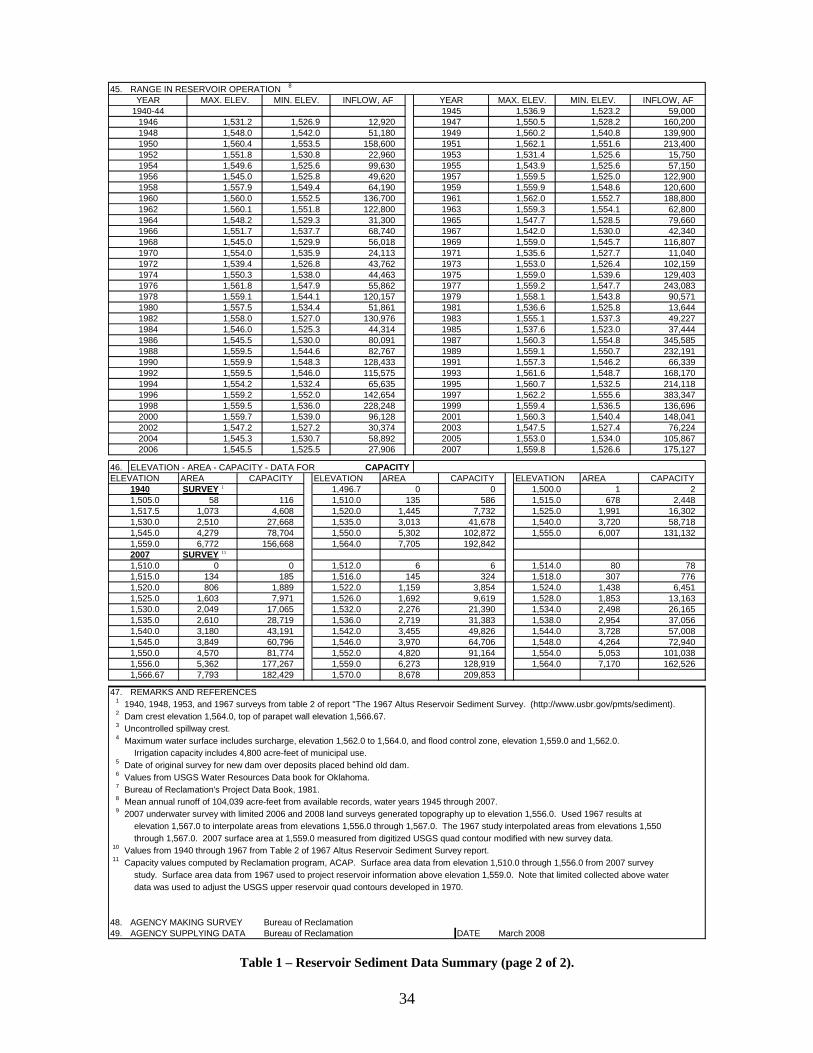
2007 underwater survey with limited 2006 and 2008 land surveys generated topography up to elevation 1,556.0. Used 1967 results at elevation 1,567.0 to interpolate areas from elevations 1,556.0 through 1,567.0. The 1967 study interpolated areas from elevations 1,550
3,180
47. REMARKS AND REFERENCES
Values from USGS Water Resources Data book for Oklahoma. Bureau of Reclamation's Project Data Book, 1981.
1940, 1948, 1953, and 1967 surveys from table 2 of report "The 1967 Altus Reservoir Sediment Survey. (http://www.usbr.gov/pmts/sediment). Dam crest elevation 1,564.0, top of parapet wall elevation 1,566.67.
49. Bureau of Reclamation March 2008
Capacity values computed by Reclamation program, ACAP. Surface area data from elevation 1,510.0 through 1,556.0 from 2007 survey study. Surface area data from 1967 used to project reservoir information above elevation 1,559.0. Note that limited collected above water
AGENCY MAKING SURVEY
data was used to adjust the USGS upper reservoir quad contours developed in 1970.
AGENCY SUPPLYING DATA DATE
8
1940-44
1,505.0
1,515.01,520.0
1,535.0
1,566.67
YEAR MAX. ELEV.
48. Bureau of Reclamation
Uncontrolled spillway crest. Maximum water surface includes surcharge, elevation 1,562.0 to 1,564.0, and flood control zone, elevation 1,559.0 and 1,562.0.
Date of original survey for new dam over deposits placed behind old dam.
Mean annual runoff of 104,039 acre-feet from available records, water years 1945 through 2007.
Values from 1940 through 1967 from Table 2 of 1967 Altus Reservoir Sediment Survey report.
through 1,567.0. 2007 surface area at 1,559.0 measured from digitized USGS quad contour modified with new survey data.
MIN. ELEV. INFLOW, AF59,000
MIN. ELEV. INFLOW, AF YEAR MAX. ELEV.1945 1,536.9 1,523.2
1851,889
28,71943,191
17,0657,971
27,668
1952 1,530.8
1,525.8
1986 1,545.5 1,530.0
1990
1,545.0
1,551.8 15,7501954 1,525.6 99,630 1955 1,525.6 57,1501,549.6
22,960 1,531.4
1,525.01,543.9
1,525.61953
122,9001958 1,549.4 64,190 1959 1,559.9 1,548.6 120,6001956 49,620
136,700 1961 1,562.0
1,559.51957
1,552.7 188,800
1972 1,526.8 43,762 1973 1,553.0 1,526.4 102,159
1,552.5
129,403
1978 1,544.1 120,157 1979 1,558.1 1,543.8 90,571
1974 1,538.0
51,861 1981
1,559.0 1,539.644,463 1975
13,644
1984 1,546.0 1,525.3 44,314 1985 1,537.6 1,523.0
1980 1,534.4
232,19180,091
1988 1,559.5 1,544.6 82,7671987 1,560.3 1,554.8 345,585
1991 1,557.3 1,546.21989 1,559.1 1,550.7
66,3391992 1,559.5 1,546.0 115,575 1993 1,561.6 1,548.7 168,170
128,433
1994 1,554.2 1,532.4 65,635 1995 1,560.7 1,532.5 214,1181996 1,559.2 1,552.0 142,654
1,545.3 1,530.7 58,892
1997
2005
199920011,559.7 1,539.0 96,128
1,553.0 1,534.0 105,8671,559.8 1,526.6 175,127
ELEVATION AREA
2006 1,545.5 1,525.5 27,906
46. ELEVATION - AREA - CAPACITY - DATA FOR
41,678
2007
1,496.7 0 0
CAPACITY
2,719
3,8541,159
2,276 21,3901,692
31,38349,826
1,515.0 6781,510.0 135 586 2,448
1,518.0 307 776
58,718131,132
78
16,302
6,451
1,538.0 2,954 37,056
1,524.0 1,438
26,165
AREA CAPACITYELEVATIONCAPACITY
1,542.0 3,455
1,522.0
57,008
3,7281,544.04,264
7,170
3241,516.0 145
209,8531,570.0 8,678
1,536.0
1970
45. RANGE IN RESERVOIR OPERATION
806
58
182,429
2004
1969 1,559.0 1,545.7 116,8071968 1,545.0 1,529.9 56,0181,554.0 1,535.9 24,113 1971 1,535.6 1,527.7 11,040
1962 1,560.1 1,551.8 122,800 1963 1,559.3 1,554.1 62,8001964 1,548.2 1,529.3 31,300 1965 1,547.7 1,528.5 79,6601966 1,551.7 1,537.7 68,740 1967 1,542.0 1,530.0 42,340
1,535.0 3,013 1,540.0 3,72078,704 1,550.0 1,555.05,302 102,872 6,007
1,510.0 0 0 1,512.0 6 6 1,514.0 80
1,517.5 1,073 4,608 1,520.0 1,445 7,732 1,525.0 1,991
1976 1,561.8 1,547.9 55,862 1977 1,559.2 1,547.7
1998 1,559.5 1,536.0 228,248
243,083
1,559.4 1,536.5 136,6961,562.2 1,555.6 383,347
37,444
1,536.6 1,525.8
1,540.4 148,0412002 1,547.2 1,527.2 30,374 2003 1,547.5 1,527.42000
76,224
49,2271982 1,558.0 1,527.0 130,976 1983 1,555.1 1,537.3
1,560.3
1,532.01,526.0 13,1639,619 1,528.0 1,853
1,534.0 2,498
Table 1 – Reservoir Sediment Data Summary (page 2 of 2).

35
Area-Capacity Curves for Altus Reservoir
1,500
1,510
1,520
1,530
1,540
1,550
1,560
1,570
0 20000 40000 60000 80000 100000 120000 140000 160000 180000 200000Capacity (acre-feet)
Elev
atio
n (fe
et)
1,500
1,510
1,520
1,530
1,540
1,550
1,560
1,57008001,6002,4003,2004,0004,8005,6006,4007,2008,000
Area (acres)
2007196719531948Original
Figure 28 - Altus Reservoir Area and Capacity Plots
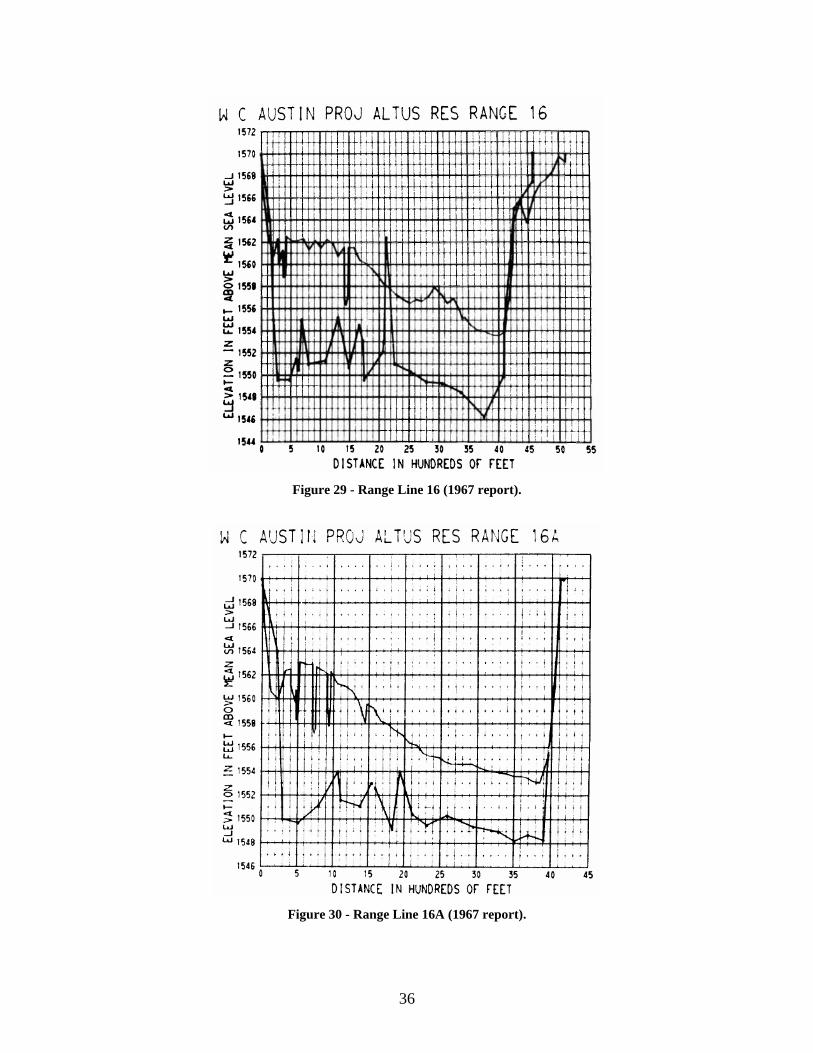
Figure 29 - Range Line 16 (1967 report).
Figure 30 - Range Line 16A (1967 report).
36

Figure 31 - Range Line 17 (1967 report).
Figure 32 - Range Line 18 (1967 report).
37

2007 Storage Capacity
The storage-elevation relationships based on the measured surface areas were developed using the area-capacity computer program ACAP (Bureau of Reclamation, 1985). The ACAP program can compute the area and capacity at elevation increments from 0.01 to 1.0 foot by linear interpolation between the given contour surface areas. The program begins by testing the initial capacity equation over successive intervals to ensure that the equation fits within an allowable error limit. The error limit was set at 0.000001 for Altus Reservoir. The capacity equation is then used over the full range of intervals fitting within the allowable error limit. For the first interval at which the initial allowable error limit is exceeded, a new capacity equation (integrated from basic area curve over that interval) is utilized until it exceeds the error limit. Thus, the capacity curve is defined by a series of curves, each fitting a certain region of data. Through differentiation of the capacity equations, which are of second order polynomial form, final area equations are derived:
y = a1 + a2x + a3x2
where: y = capacity
x = elevation above a reference base a1 = intercept a2 and a3 = coefficients
Results of the Altus Reservoir area and capacity computations are listed in a separate set of 2007 area and capacity tables and have been published for the 0.01, 0.1 and 1-foot elevation increments (Bureau of Reclamation, 2007). A description of the computations and coefficients output from the ACAP program is included with these tables. The original, 1948, 1953, 1967, and 2007 area-capacity relationships are listed on table 2 and the curves are plotted on Figure 28. As of June 2007, at conservation use elevation 1,559.0, the surface area was 6,273 acres with a total capacity of 128,919 acre-feet.
38

1 2 3 4 5 6 7 8 9 10 11 12 13 14 15 16 17 18 19 20
1948 1948 1953 1953 1967 1967 2007 2007
Original Original 1948 1948 Sediment Percent 1953 1953 Sediment Percent 1967 1967 Sediment Percent 2007 2007 Sediment Percent Percent
Elevation Area Capacity Area Capacity Volume Computed Area Capacity Volume Computed Area Capacity Volume Computed Area Capacity Volume Computed Reservoir
Feet Acres Ac-Ft Acres Ac-Ft Ac-Ft Sediment Acres Ac-Ft Ac-Ft Sediment Acres Ac-Ft Ac-Ft Sediment Ac-Ft Ac-Ft Ac-Ft Sediment Depth
1,564 7,705 192,842 7,773 185,035 7,807 7,740 178,610 14,232 7,168 168,063 24,779 7,170 162,526 30,316 100.0
1,559 6,772 156,668 6,793 148,640 8,028 100.0 6,575 142,862 13,806 100.0 6,260 134,494 22,174 100.0 6,273 128,919 27,749 100.0 92.6
1,555 6,007 131,132 5,951 123,178 7,954 99.1 5,769 118,192 12,940 93.7 5,534 110,907 20,225 91.2 5,221 106,175 24,957 89.9 86.6
1,550 5,302 102,872 5,102 95,568 7,304 91.0 4,945 91,433 11,439 82.9 4,626 85,506 17,366 78.3 4,570 81,774 21,098 76.0 79.2
1,547 4,777 87,670 4,543 81,108 6,562 81.7 4,422 77,390 10,280 74.5 4,144 72,350 15,320 69.1 4,117 68,749 18,921 68.2 74.7
1,545 4,279 78,704 4,120 72,444 6,260 78.0 4,124 68,846 9,858 71.4 3,823 64,383 14,321 64.6 3,849 60,796 17,908 64.5 71.8
1,540 3,720 58,718 3,561 53,254 5,464 68.1 3,577 49,609 9,109 66.0 3,219 46,778 11,940 53.8 3,180 43,191 15,527 56.0 64.3
1,535 3,103 41,678 2,915 37,086 4,592 57.2 2,912 33,415 8,263 59.9 2,616 32,191 9,487 42.8 2,610 28,719 12,959 46.7 56.9
1,530 2,510 27,668 2,270 24,155 3,513 43.8 2,199 20,679 6,989 50.6 2,165 20,240 7,428 33.5 2,049 17,065 10,603 38.2 49.5
1,525 1,991 16,302 1,787 14,035 2,267 28.2 1,578 11,280 5,022 36.4 1,645 10,715 5,587 25.2 1,603 7,971 8,331 30.0 42.1
1,520 1,445 7,732 1,292 6,368 1,364 17.0 1,111 4,591 3,141 22.8 1,103 3,845 3,887 17.5 806 1,889 5,843 21.1 34.6
1,517.5 1,073 4,608 922 3,614 994 12.4 735 2,300 2,308 16.7 643 1,663 2,945 13.3 266 633 3,975 14.3 30.9
1,515 678 2,448 664 1,640 808 10.1 373 940 1,508 10.9 182 632 1,816 8.2 134 185 2,263 8.2 27.2
1,510 135 586 60 100 486 6.1 41 44 542 3.9 59 30 556 2.5 0 0 586 2.1 19.8
1,505 58 116 0 0 116 1.4 0 0 116 0.8 0 0 116 0.5 0 0 116 0.4 12.3
1,500 1 2 0 0 2 0.0 0 0 2 0.0 0 0 2 0.0 0 0 2 0.0 4.9
1,497 0 0 0 0 0 0.0 0 0 0 0.0 0 0 0 0.0 0 0 0 0.0 0.0
1 Reservoir water surface elevation.
2 Original reservoir surface area.
3 Original reported reservoir capacity.
4 1948 reservoir surface area.
5 1948 reservoir capacity.
6 1948 computed sediment volume, column (3) - column (5).
7 1948 measured sediment in percentage of total sediment (8,028 acre-feet at elevation 1,559.0).
8 1953 reservoir surface area.
9 1953 reservoir capacity.
10 1953 computed sediment volume, column (3) - column (9).
11 1953 measured sediment in percentage of total sediment (13,806 acre-feet at elevation 1,559.0).
12 1967 reservoir surface area.
13 1967 reservoir capacity recomputed using ACAP.
14 1967 measured sediment volume, column (3) - column (13).
15 1967 measured sediment in percentage of total sediment (22,174 acre-feet at elevation 1,559.0).
16 2007 measured reservoir surface area. 2007 surface area at elevation 1,559.0 developed from USGS quad contour adjusted with limited land surface data.
17 2007 reservoir capacity computed using ACAP.
18 2007 measured sediment volume, column (3) - column (17).
19 2007 measured sediment in percentage of total sediment (27,749 acre-feet at elevation 1,559.0).
20 Depth of reservoir expressed in percentage of total depth, 67.3 feet, from maximum water surface 1,564.0.
Table 2 - Summary of 2007 Survey Results.
39

40
41
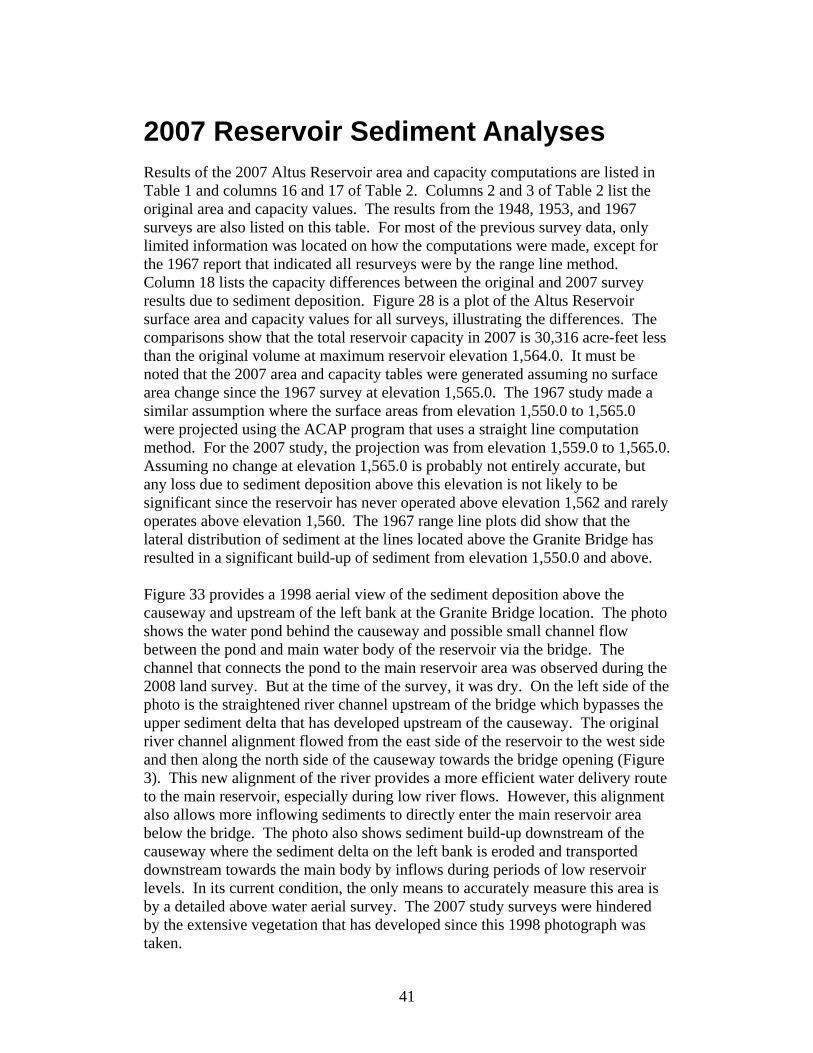
2007 Reservoir Sediment Analyses Results of the 2007 Altus Reservoir area and capacity computations are listed in Table 1 and columns 16 and 17 of Table 2. Columns 2 and 3 of Table 2 list the original area and capacity values. The results from the 1948, 1953, and 1967 surveys are also listed on this table. For most of the previous survey data, only limited information was located on how the computations were made, except for the 1967 report that indicated all resurveys were by the range line method. Column 18 lists the capacity differences between the original and 2007 survey results due to sediment deposition. Figure 28 is a plot of the Altus Reservoir surface area and capacity values for all surveys, illustrating the differences. The comparisons show that the total reservoir capacity in 2007 is 30,316 acre-feet less than the original volume at maximum reservoir elevation 1,564.0. It must be noted that the 2007 area and capacity tables were generated assuming no surface area change since the 1967 survey at elevation 1,565.0. The 1967 study made a similar assumption where the surface areas from elevation 1,550.0 to 1,565.0 were projected using the ACAP program that uses a straight line computation method. For the 2007 study, the projection was from elevation 1,559.0 to 1,565.0. Assuming no change at elevation 1,565.0 is probably not entirely accurate, but any loss due to sediment deposition above this elevation is not likely to be significant since the reservoir has never operated above elevation 1,562 and rarely operates above elevation 1,560. The 1967 range line plots did show that the lateral distribution of sediment at the lines located above the Granite Bridge has resulted in a significant build-up of sediment from elevation 1,550.0 and above. Figure 33 provides a 1998 aerial view of the sediment deposition above the causeway and upstream of the left bank at the Granite Bridge location. The photo shows the water pond behind the causeway and possible small channel flow between the pond and main water body of the reservoir via the bridge. The channel that connects the pond to the main reservoir area was observed during the 2008 land survey. But at the time of the survey, it was dry. On the left side of the photo is the straightened river channel upstream of the bridge which bypasses the upper sediment delta that has developed upstream of the causeway. The original river channel alignment flowed from the east side of the reservoir to the west side and then along the north side of the causeway towards the bridge opening (Figure 3). This new alignment of the river provides a more efficient water delivery route to the main reservoir, especially during low river flows. However, this alignment also allows more inflowing sediments to directly enter the main reservoir area below the bridge. The photo also shows sediment build-up downstream of the causeway where the sediment delta on the left bank is eroded and transported downstream towards the main body by inflows during periods of low reservoir levels. In its current condition, the only means to accurately measure this area is by a detailed above water aerial survey. The 2007 study surveys were hindered by the extensive vegetation that has developed since this 1998 photograph was taken.

Figure 33 - 1998 Aerial View of Altus Reservoir.
During the planning phase for this reservoir, the original estimated 100 year sediment accumulation for Altus Reservoir was 57 percent or around 110,000 acre-feet at maximum pool elevation 1,564.0. This computes to an average annual loss of 1,100 acre-feet. Table 1 lists the results of the 1948 and 1953 surveys that measured an average annual loss between surveys of 1,070 and 1,133 acre-feet respectfully. The 1967 survey measured a reduced average annual loss of 606 acre-feet since the 1953 survey. The 2007 survey measured an even lower average annual loss of 139 acre-feet since the 1967 survey. However, as noted earlier in this report, the 2007 aerial data included the shoreline coves that may have been projected as silted-in during the 1967 analysis. Consequently, data comparisons between the 1967 survey data and the 2007 survey data may be statistically invalid. Over the entire operation period from 1940 through 2007, the computed average annual loss was 417 acre-feet. The different survey and analysis methods between all the studies does not appear to be the main reason for the significant decrease in the calculated annual sediment inflow rate. Further analysis would be required to determine why such a significant drop occurred and why the 2007 study results since dam closure are only about one third of the original projection. The majority of the future inflowing sediments will enter and settle downstream of the Granite Bridge with the sediment delta growing towards the dam (Figure
42

4). Future surveys will be needed to measure this growth and to better refine the average annual loss due to sediment. The results of the 2007 Altus Reservoir study provide up-to-date surface area and capacity information for the entire reservoir. The only feasible means to obtain detailed information for the upper contours, the area above the causeway, and just downstream of the Granite Bridge would be by aerial collection. It is the general consensus that this study had enough information to develop the current surface areas and resulting capacity as presented in this report. Aerial collection would provide more detailed data for full development, but the results should not greatly differ from the 2007 study from elevation 1,559 and below. In general, a large portion of the original available reservoir area upstream of the Granite Bridge has been lost due to sediment deposition. The 1967 study range lines showed this loss occurred during the first 26.4 years of reservoir operation. The 2007 study cross sections illustrate further sediment deposition in this portion of the reservoir, mainly at Range Line 14. Range Lines 14A and 15 measured insignificant change since 1967. Part of this is due to the realignment of the inflowing river where the water and sediment now flow directly into the main reservoir. However, some reservoir operations since 1967 occurred via the original river alignment before it changed in the early 1990’s. The 2007 survey did measure some sediment build up at Range Lines 9, 11, and 13, located downstream of the Granite Bridge. However, it was expected that the buildup would have been even greater and extended further downstream if the 1948 and 1967 annual sediment inflow rates had, in fact, continued to occur through 2007. Since the 1998 aerial photo was taken, significant tree growth has occurred both upstream and just downstream of the causeway during reservoir drawdown due to the drought of the early 2000’s. If these areas become clear of vegetation in the future due to tree die off during higher reservoir operations, similar to the Figure 33 photograph, a winter survey should be planned by either aerial or land collection. To obtain good information on current annual sediment inflow, this data would need to be merged with a future underwater survey when the some of the same areas are covered by several feet of water for adequate data overlap. Either way, it is recommended that an additional sediment resurvey be conducted within the next 10-20 years utilizing at minimum the 2007 methodology or better to more accurately determine current sediment inflow rates.
43

References American Society of Civil Engineers, 1962. Nomenclature for Hydraulics, ASCE Headquarters, New York. Bureau of Reclamation, 1981. Project Data, Denver Office, Denver CO. Bureau of Reclamation, 1985. Surface Water Branch, ACAP85 User's Manual, Technical Service Center, Denver CO. Bureau of Reclamation, 1987(a). Guide for Preparation of Standing Operating Procedures for Bureau of Reclamation Dams and Reservoirs, U.S. Government Printing Office, Denver, CO. Bureau of Reclamation, 1987(b). Design of Small Dams, U.S. Government Printing Office, Denver CO. Bureau of Reclamation July 1998. Standing Operating Procedures (SOP), Altus Dam and Reservoir, W.C. Austin Project, Oklahoma, GP Region, Billings, MT. Bureau of Reclamation, June 2007. Altus Reservoir Area and Capacity Tables, W.C. Austin Project, Great Plains Region, Billings, MT. Corps of Engineers, January 2002. Engineer and Design Hydrographic Surveying, EM 1110-2-1003, Department of the Army, Washington DC, (www.usace.army.mil/inet/usace-docs/eng-manuals/em1110-2-1003/toc.htm). ESRI, 2006. Environmental Systems Research Institute, Inc. (www.esri.com) Ferrari, R.L. and Collins, K. (2006). Reservoir Survey and Data Analysis, Chapter 9, Erosion and Sedimentation Manual, Bureau of Reclamation, Sedimentation and River Hydraulics Group. Denver, Colorado. www.usbr.gov/pmts/sediment Lara, J.M., 1971. The 1967 Altus Reservoir Sediment Survey, U.S. Bureau of Reclamation, Denver, Colorado. http://www.usbr.gov/pmts/sediment/projects/index.html
44


