19
Amadeus 2017 Results Feb 28, 2018 © 2018 Amadeus IT Holding and its affiliates and subsidiaries

Amadeus 2017 Results
Feb 28, 2018
© 2
018
Am
adeu
s IT
Ho
ldin
g an
d it
s af
filia
tes
and
su
bsi
dia
rie
s
_ This presentation may contain certain statements which are not purely historical facts, including statements about anticipated orexpected future revenue and earnings growth. Any forward-looking statements in this presentation are based upon informationavailable to Amadeus on the date of this presentation. Any forward-looking statements involve risks and uncertainties that couldcause actual events or results to differ materially from the events or results described in the forward-looking statements. Amadeusundertakes no obligation to publicly update or revise any forward-looking statements, whether as a result of new information, futureevents or otherwise. Readers are cautioned not to place undue reliance on forward-looking statements.
_ This presentation has to be accompanied by a verbal explanation. A simple reading of this presentation without the appropriateverbal explanation could give rise to a partial or incorrect understanding.
2
Disclaimer
Operating review
President & CEO,
Mr. Luis Maroto
© 2
018
Am
adeu
s IT
Ho
ldin
g an
d it
s af
filia
tes
and
su
bsi
dia
rie
s

Operating Review
Luis MarotoPresident and CEO ©
201
8 A
mad
eus
IT H
old
ing
and
its
affi
liate
s an
d s
ub
sid
iari
es
4
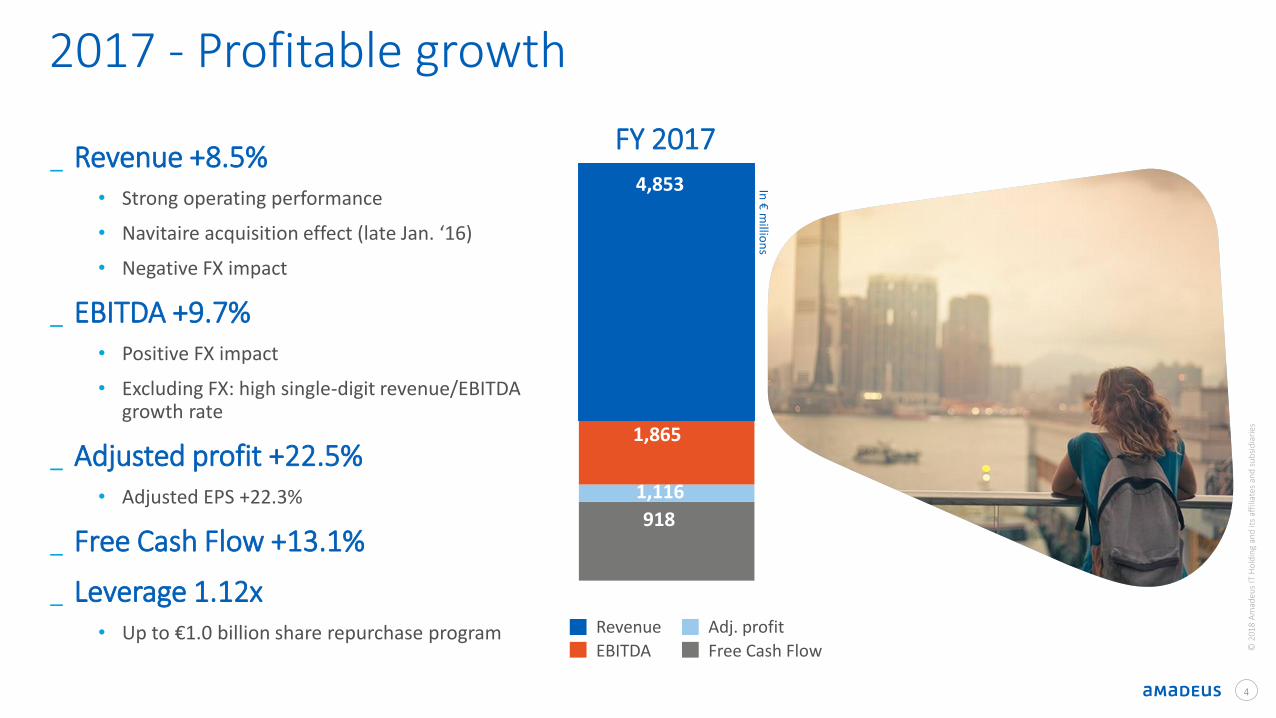
_ Revenue +8.5%• Strong operating performance
• Navitaire acquisition effect (late Jan. ‘16)
• Negative FX impact
_ EBITDA +9.7%• Positive FX impact
• Excluding FX: high single-digit revenue/EBITDA growth rate
_ Adjusted profit +22.5%• Adjusted EPS +22.3%
_ Free Cash Flow +13.1%
_ Leverage 1.12x• Up to €1.0 billion share repurchase program
918
1,865
4,853
1,116In
€m
illion
s
Revenue
EBITDA
Adj. profit
Free Cash Flow
2017 - Profitable growth
© 2
018
Am
adeu
s IT
Ho
ldin
g an
d it
s af
filia
tes
and
su
bsi
dia
rie
s
FY 2017

5
Recent business highlights
© 2
018
Am
adeu
s IT
Ho
ldin
g an
d it
s af
filia
tes
and
su
bsi
dia
rie
s
Airline Distribution
_ We renewed / signed 26 content agreements in the quarter, including Delta Air Lines and El Al - a total of 55 in 2017
• 12 were new signatures with low-cost and hybrid carriers
• Subscribers to Amadeus’ inventory can now access over 110 low-cost and hybrid carriers’ content worldwide
_ Interest in our merchandising solutions for the indirect channel continued to grow during the fourth quarter
• 7 airlines signed up for Amadeus Airline Ancillary Services for the indirect channel, including All Nippon Airways
• 4 carriers contracted Amadeus Fare Families, including El Al
• At the end of 2017, 143 airlines had signed up for Amadeus Airline Ancillary Services and 66 had contracted Amadeus Fare Families
Airline IT
_ PSS new signatures included Germania, Germania Swiss, Norwegian Air Argentina and Flybe - Europe’s largest regional airline, who also contracted for Amadeus Anytime Merchandising and Amadeus Customer Experience Management
_ Upselling activity included All Nippon Airways contracting Airline Cloud Availability, LATAM taking Altéa DCS Flight Management and Malaysia Airlines contracting Amadeus Customer Experience Management, among others
_ We had intense customer implementation activity in the quarter, including Japan Airlines to Altéa
New businesses
_ Hospitality IT: progressing in the roll-out of the Guest Reservation System with IHG (full deployment expected by late 2018 / early 2019)
_ New Airport IT customers: Velana International Airport (Maldives), Biarritz Airport (France) and Aktau International Airport (Kazakhstan)

6
© 2
016
Am
adeu
s IT
Ho
ldin
g a
nd
its
affi
liate
s an
d s
ub
sid
iari
es
1. When we refer to our competitive position, we are taking into account our TA air bookings in relation to the TA air booking industry, defined as the total volume of TA air bookings processed by the global CRS. It excludes air bookings made directly through in-house airline systems or single country operators, the latter primarily in China, Japan and Russia, which together combined represent an important part of the industry.
534.9 568.4
60.464.0
2016 2017Air bookings Non air bookings
Vo
lum
e gr
ow
th (%
)
WE = Western Europe; APAC = Asia and Pacific; NA = North America (incl. Mexico); MEA =
Middle East and Africa; CESE = Central, Eastern and Southern Europe; LatAm = Latin
America
3.1%
4.5%
2016 2017
Distribution
TA air booking industry growth1
Amadeus TA air bookings by region
Competitive position enhancement1
WE,
36.2%
APAC,
19.1%
NA,
17.4%
MEA,
12.2%
CESE,
8.5%
LatAm,
6.6%WE +2.0%
APAC +11.4%
NA +9.0%
MEA +5.1%
CESE +7.9%
LatAm +10.0%
Amadeus TA bookings (in millions)
0.9 p.p.0.6 p.p.
Q4 2017 FY 2017
Weigh
t (%)
+6.3%
+6.2% 632.3595.3
6
© 2
018
Am
adeu
s IT
Ho
ldin
g an
d it
s af
filia
tes
and
su
bsi
dia
rie
s

777
IT SolutionsPassengers Boarded1 (in millions) Amadeus PB1 by region
1,296.31,395.1
86.1
261.4
2016 2017Organic Non organic
Vo
lum
e gr
ow
th (%
)1. Passengers Boarded (“PB”) refers to actual passengers boarded onto flights operated by our Altéa and New Skies migrated customers. 2. Calculated based on passengers boarded adjusted to reflect growth of comparable airlines on the Altéa and New Skies platforms during both periods, excluding Air Berlin and January 2016 and 2017 Navitaire
New Skies passengers boarded.3. Customers that have contracted at least the Altéa Inventory module, in addition to the Reservations module, or Navitaire’s New Skies solution.
_ As of December 2017, 1993 customers had contracted for Altéa or New Skies, of which 195 had been migrated
_ PB growth of 19.8%, driven by:
• 7.6%2 organic growth
• Carrier implementations on our PSS platforms, both in 2017 (including Southwest Airlines, Japan Airlines, Malaysia Airlines, Kuwait Airways, Boliviana de Aviación, SmartWings, Germania, Norwegian Air Argentina, Air Algerie and MIAT -Mongolian Airlines on Altéa, as well as, GoAir, Viva Air Peru, Andes Líneas Aéreas, JetSMART and flyadeal on New Skies) and in 2016 (including Swiss International Air Lines, Brussels Airlines, China Airlines and Ukraine International Airlines onAltéa and Viva Group on New Skies)
• To a lesser extent, the consolidation impact from Navitaire
WE +8.7%
APAC +17.3%
NA +171.9%
LatAm +10.5%
MEA +6.2%
CESE +24.5%
WE,
36.9%
APAC,
30.4%
NA,
10.7%
LatAm,
9.0%
CESE,
5.4%MEA,
7.7%
+19.8%
Weigh
t (%)
1,382.5
1,656.5
+7.6%2
© 2
018
Am
adeu
s IT
Ho
ldin
g an
d it
s af
filia
tes
and
su
bsi
dia
rie
s
WE = Western Europe; APAC = Asia and Pacific; NA = North America (incl. Mexico);
MEA = Middle East and Africa; CESE = Central, Eastern and Southern Europe; LatAm =
Latin America

© 2
016
Am
adeu
s IT
Gro
up
an
d it
s af
filia
tes
and
su
bsi
dia
rie
s
Financial highlights
Ana de ProCFO
© 2
017
Am
adeu
s IT
Ho
ldin
g an
d it
s af
filia
tes
and
su
bsi
dia
rie
s

Revenue growth by segment
999
4,472.9 4,852.7
2016 2017
+8.5%
Group revenue (in € millions)
Distribution
+7.3%
IT Solutions+10.8%
Segment revenue (in € millions)
© 2
018
Am
adeu
s IT
Ho
ldin
g an
d it
s af
filia
tes
and
su
bsi
dia
rie
s
2,561.2 2,737.7
363.7399.9
2016 2017
Booking Non booking
1,142.11,282.4
120.8118.4285.0314.3
2016 2017IT Transactional Direct Distribution
Non transactional
2,925.03,137.6
1,547.9 1,715.1
_ Group revenue expanded by 8.5%, resulting from the positive evolutions of Distribution and IT Solutions, the consolidation of Navitaire and a negative FX impact
_ Distribution:
• 6.9% booking revenue increase: volume growth and higher average revenue per booking, driven by positive booking and customer mix, and contract renegotiations
• 9.9% non-booking revenue growth: search solutions, tools for corporations, advertising solutions and payment offering for travel agencies
_ IT Solutions:
• 12.3% IT transactional revenue growth: (i) volume expansion, coupled with dilutive PSS average pricing, as a consequence of customer mix (increasing weight of low-cost and hybrid carriers’ volumes), (ii) increased revenue from e-commerce, merchandising and personalization tools, revenue management systems and Airline Cloud Availability, among others, and (iii) healthy performance of Airport IT and Payments
• 10.3% non transactional revenue growth: consulting services and Hospitality IT

Contribution by segment
101010
563.6 617.9
2016 2017
+9.6%
Contribution by segment (in € millions)
1,223.0
1,306.0
2016 2017
1,040.7 1,177.0
2016 2017
Distribution
+6.8%
IT Solutions
+13.1%
Net indirect costs (in € millions)
41.8% 41.6% 67.2%68.6%
© 2
018
Am
adeu
s IT
Gro
up
an
d it
s af
filia
tes
and
su
bsi
dia
rie
s
_ Distribution: +6.8% contribution growth, resulting from revenue increase and margin contraction (impacted by a higher unitary distribution cost due to competitive pressure and customer mix)
_ IT Solutions: +13.1% contribution growth, as a combination of revenue growth and margin expansion, supported by FX effects, non-recurring cost impacts, our new businesses and a broadly stable margin in Airline IT
_ Net indirect costs: +9.6% growth, due to increased resources in corporate functions to support business expansion, the consolidation of Navitaire and a decrease in the capitalization ratio, impacted by project mix

EBITDA and Adjusted EPS growth
111111
911.0
1,116.1
€2.08
€2.55
0.00
0.50
1.00
1.50
2.00
2.50
3.00
500.0
510.0
520.0
530.0
540.0
550.0
560.0
570.0
580.0
590.0
600.0
610.0
620.0
630.0
640.0
650.0
660.0
670.0
680.0
690.0
700.0
710.0
720.0
730.0
740.0
750.0
760.0
770.0
780.0
790.0
800.0
810.0
820.0
830.0
840.0
850.0
860.0
870.0
880.0
890.0
900.0
910.0
920.0
930.0
940.0
950.0
960.0
970.0
980.0
990.0
1000.0
1010.0
1020.0
1030.0
1040.0
1050.0
1060.0
1070.0
1080.0
1090.0
1100.0
1110.0
1120.0
1130.0
1140.0
1150.0
1160.0
1170.0
1180.0
1190.0
1200.0
1210.0
1220.0
1230.0
1240.0
1250.0
1260.0
1270.0
1280.0
1290.0
1300.0
2016 2017
Adjusted Profit Adjusted EPS
Adj. Profit1 (in € millions) & Adj. EPS2 (€)
+22.5%
1. Excluding after-tax impact of the following items: (i) accounting effects derived from PPA exercises and impairment losses, (ii) non-operating exchange gains (losses) and (iii) other non-recurring items.
2. EPS corresponding to the Adjusted profit attributable to the parent company. Calculated based on weighted average outstanding shares of the period.
11
_ Adjusted profit increase as a result of :
_ EBITDA growth, coupled with lower financial and tax expenses, partly offset by D&A increase
_ Reduction of income tax rate to 20.8%, highly impacted by adjustments of deferred tax liabilities in France and the U.S. (lower corporate tax rates starting in 2018, in accordance with government regulatory changes)
EBITDA (in € millions)
+22.3%
_ EBITDA growth resulting from:
• Distribution and IT Solutions positive performances• Positive FX• Partly offset by an increase in net indirect costs
_ Excluding FX, EBITDA grew at a high single-digit growth rate and EBITDA margin was broadly stable
11
© 2
018
Am
adeu
s IT
Ho
ldin
g an
d it
s af
filia
tes
and
su
bsi
dia
rie
s
1,700.1 1,865.1
83.0
136.3 (54.3)
2016 EBITDA Distributioncontribution
IT Solutionscontribution
Net indirect costs 2017 EBITDA
38.0%
38.4%
+9.7%
Investment in R&D and Capex
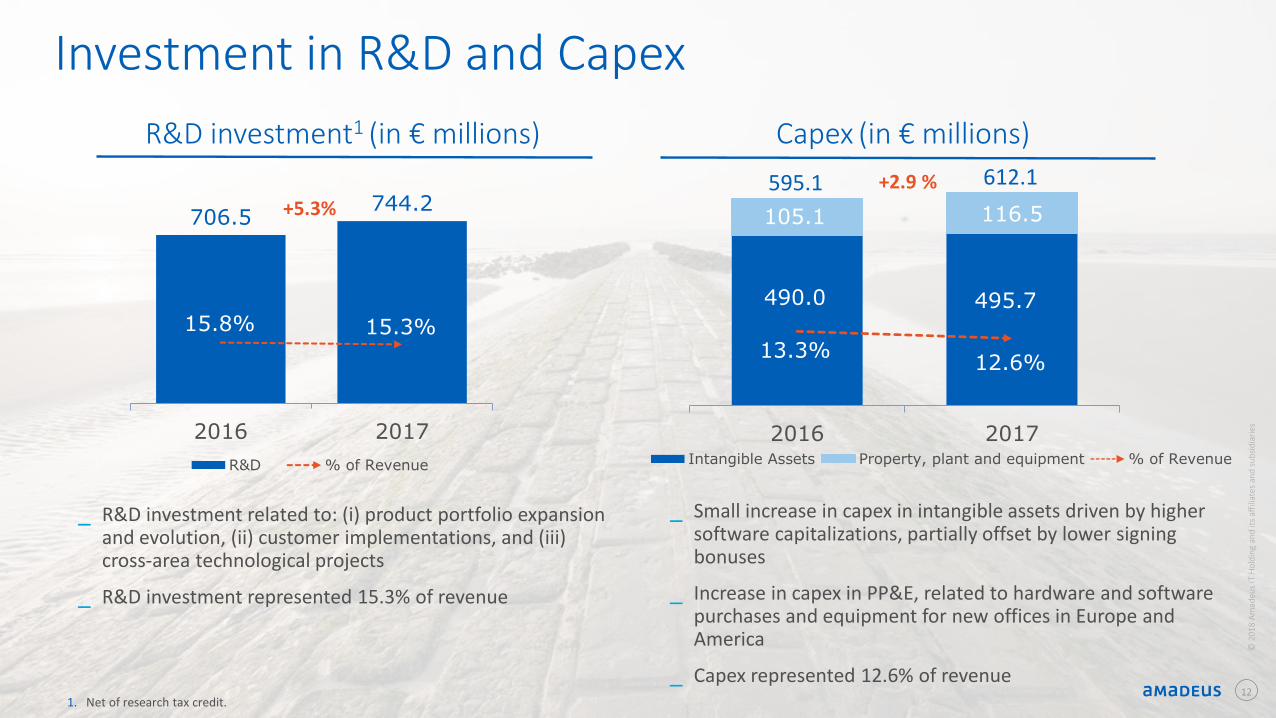
490.0 495.7
105.1 116.5
13.3%12.6%
0.0
20.0
40.0
60.0
80.0
100.0
120.0
140.0
160.0
180.0
200.0
220.0
240.0
260.0
280.0
300.0
320.0
340.0
360.0
380.0
400.0
420.0
440.0
460.0
480.0
500.0
520.0
540.0
560.0
580.0
600.0
620.0
640.0
660.0
680.0
700.0
2016 2017Intangible Assets Property, plant and equipment % of Revenue
706.5744.2
15.8% 15.3%
250.0
270.0
290.0
310.0
330.0
350.0
370.0
390.0
410.0
430.0
450.0
470.0
490.0
510.0
530.0
550.0
570.0
590.0
610.0
630.0
650.0
670.0
690.0
710.0
730.0
750.0
770.0
2016 2017
R&D % of Revenue
+5.3%
+2.9 %
1. Net of research tax credit.
_ R&D investment related to: (i) product portfolio expansion and evolution, (ii) customer implementations, and (iii) cross-area technological projects
_ R&D investment represented 15.3% of revenue
_ Small increase in capex in intangible assets driven by higher software capitalizations, partially offset by lower signing bonuses
_ Increase in capex in PP&E, related to hardware and software purchases and equipment for new offices in Europe and America
_ Capex represented 12.6% of revenue
Capex (in € millions) R&D investment1 (in € millions)
612.1595.1
12
© 2
018
Am
adeu
s IT
Ho
ldin
g an
d it
s af
filia
tes
and
su
bsi
dia
rie
s
Free cash flow generation and leverage
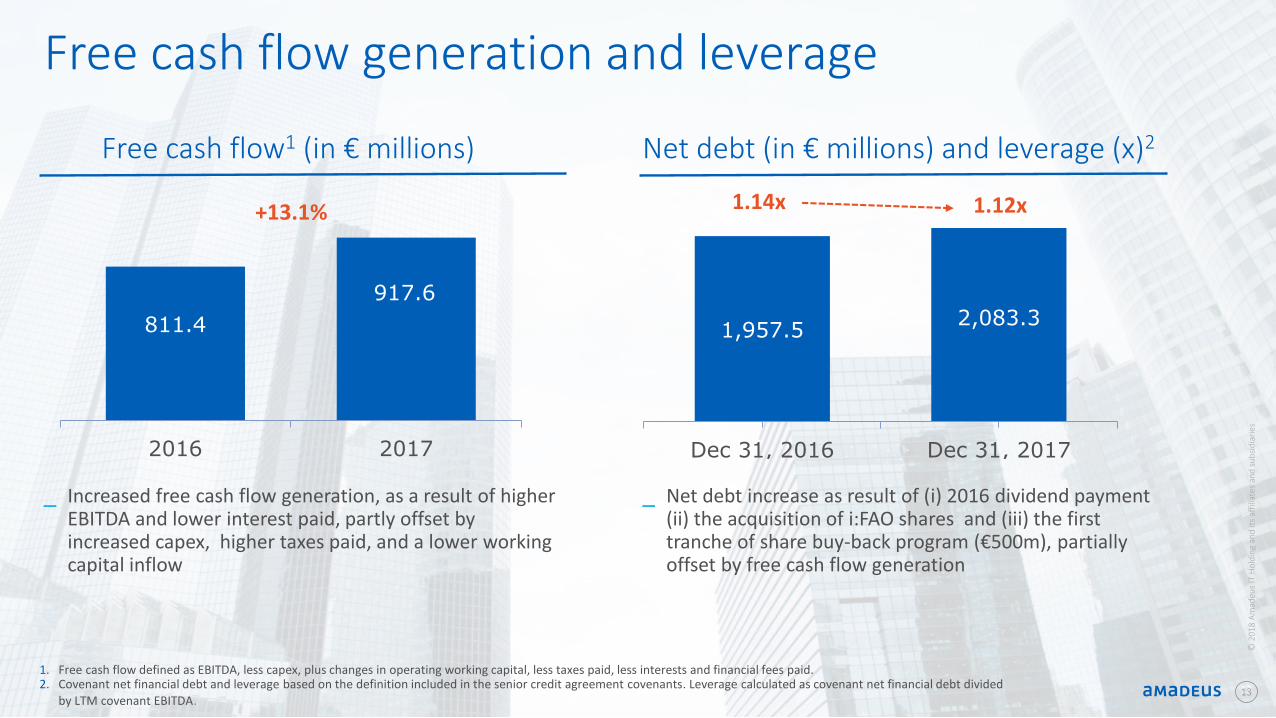
811.4
917.6
2016 2017
1,957.52,083.3
Dec 31, 2016 Dec 31, 2017
1.12x1.14x+13.1%
Net debt (in € millions) and leverage (x)2
1. Free cash flow defined as EBITDA, less capex, plus changes in operating working capital, less taxes paid, less interests and financial fees paid.2. Covenant net financial debt and leverage based on the definition included in the senior credit agreement covenants. Leverage calculated as covenant net financial debt divided
by LTM covenant EBITDA.131313
_ Increased free cash flow generation, as a result of higher EBITDA and lower interest paid, partly offset by increased capex, higher taxes paid, and a lower working capital inflow
_ Net debt increase as result of (i) 2016 dividend payment (ii) the acquisition of i:FAO shares and (iii) the first tranche of share buy-back program (€500m), partially offset by free cash flow generation
Free cash flow1 (in € millions)
© 2
018
Am
adeu
s IT
Ho
ldin
g an
d it
s af
filia
tes
and
su
bsi
dia
rie
s

© 2
016
Am
adeu
s IT
Gro
up
an
d it
s af
filia
tes
and
su
bsi
dia
rie
s
Outlook
© 2
018
Am
adeu
s IT
Ho
ldin
g an
d it
s af
filia
tes
and
su
bsi
dia
rie
s

15
2017 Restatement for 2018 accounting changesFrom 2018:
_ IFRS 15: TA IT revenue to be recognized in Distribution operating costs
_ IFRS 9: new impairment methodology for bad debt
_ Building and facilities expense: to be accounted for within Indirect costs (previously in Distribution, IT Solutions and Indirect costs)
1. Unaudited and subject to change throughout 2018.
In € millions 2017 Reported 2017 Restated1 Change1
Distribution revenue 3,137.6 2,925.2 (212.4)
IT Solutions revenue 1,715.1 1,715.1 0.0
Group revenue 4,852.7 4,640.3 (212.4)
Distribution contribution 1,306.0 1,348.9 42.9
Contribution margin 41.6% 46.1% 4.5 p.p.
IT Solutions contribution 1,177.0 1,217.8 40.8
Contribution margin 68.6% 71.0% 2.4 p.p.
Total contribution 2,483.0 2,566.7 83.7
Net Indirect costs (617.9) (707.0) (89.0)
EBITDA 1,865.1 1,859.8 (5.3)
EBITDA Margin (%) 38.4% 40.1% 1.6 p.p. © 2
018
Am
adeu
s IT
Ho
ldin
g an
d it
s af
filia
tes
and
su
bsi
dia
rie
s

_ Mid to high single-digit growth rate
_ High single-digit growth rate
_ Capex: 12-15% of revenue_ Free cash flow generation: €950-1000 million
2018 Outlook1
Excluding FX considerations
Free cash flow
EBITDA
Revenue
1. With respect to 2017 Restated and after IFRS 16 early adoption from Jan 1, 2018.`16
Capital structure
_ 1.0 – 1.5x Net Debt / EBITDA
Shareholderremuneration
_ Ordinary dividend 50% pay-out ratio and share repurchase program of up to €1 billion potentially through March 2020
© 2
018
Am
adeu
s IT
Ho
ldin
g an
d it
s af
filia
tes
and
su
bsi
dia
rie
s

_ Low double-digit PB growth
• +120m PB impact in 2018 from 2017 and 20183
migrations
• Expected de-migration of TAM and impact from Air Berlin Group’s and Monarch Airlines’ ceased operations4
_ Average revenue per PB diluted by higher weight of low-cost and hybrid carriers and lower growth from non-PB related revenue captions
_ Growth from new businesses
17
2018 Outlook by segment1
Margin evolution
_ Dilution
• Competitive pressure and customer mix
_ Expected deceleration in air traffic growth
• IATA projects 6.0% air traffic growth for 2018(vs. IATA’s reported 7.4% in 2017)2
• Easter timing difference impacting Q1 and Q2 2018 volume growth
_ Continued improvement of our competitive position
Revenue growth rate: mid single-digit Revenue growth rate: high single-digit to low double-digit
Margin evolution_ Dilution
• Combination of effects including faster NBU growth as well as NBU expansion in commercial and customer support activities1. With respect to 2017 Restated.
2. Source: IATA Air Passenger Market Analysis December 2017 (Jan 2018).3. In 2017: mainly Southwest Airlines (the domestic passengers business) (Q2), Kuwait Airways (Q2), Malaysia Airlines (Q3), Boliviana de Aviación (Q3), Japan Airlines, Air Algerie and Germania (end of the
year). In 2018: mainly Flybe.4. Based on public information, TAM carried over 30 million passengers in 2017. Air Berlin ceased operations at the end of October 2017 (Bel Air and Niki, part of the Air Berlin Group, ceased operations in
July and December 2017, respectively). Based on information published by Air Berlin in July 2017, during the Jan-Jul 2017 period, Air Berlin Group carried 13.8 million passengers. Monarch Airlines ceased operations in October 2017. According to public sources, the airline carried c.5.4 million passengers in 2016.
Excluding FX considerations
Distribution IT Solutions
© 2
018
Am
adeu
s IT
Ho
ldin
g an
d it
s af
filia
tes
and
su
bsi
dia
rie
s

18
2018 Investments
Customer implementation activity
Airline IT solutions portfolio: PSS: scheduled Altéa implementations (such as Air Canada or flybe) and ongoing DCS
implementation activity (such as LATAM Airlines Group) Other solutions, including merchandising and personalization tools, Cloud Availability,
revenue optimization solutions, loyalty
New businesses, particularly Hospitality IT (including IHG, Premier Inn and ongoing Sales and Catering portfolio implementations) but also Airport IT, Payments and Rail IT
Product portfolio expansion and evolution
Airline content distribution and retailing: NDC, merchandising, personalization, digital platform
Revenue optimization and disruption management solutions for airlines New businesses portfolio expansion and development Solutions for travel agencies and corporations
Technology evolution Ongoing shift to Cloud and adoption of new technologies Projects to enhance our systems security and stability
© 2
018
Am
adeu
s IT
Ho
ldin
g an
d it
s af
filia
tes
and
su
bsi
dia
rie
s

Thank you!
You can follow us on:
AmadeusITgroupamadeus.comamadeus.com/blog
© 2
018
Am
adeu
s IT
Ho
ldin
g an
d it
s af
filia
tes
and
su
bsi
dia
rie
s


