S-1 Reactivity of Individual Organolithium Aggregates – a RINMR Study of n-Butyllithium and 2-Methoxy-6-(methoxymethyl)phenyllithium Amanda C. Jones, Aaron W. Sanders, Martin J. Bevan, and Hans J. Reich,* Department of Chemistry, University of Wisconsin Madison, WI 53706 Supporting Information Table of Contents S1. Rapid Injection NMR Experiment Introduction. .................................................... S-3 The Rapid Injection Apparatus ...................................... S-4 Temperature Control .............................................. S-9 Volume Accuracy of Injection ...................................... S-10 Normal/Inverse Mode of Injection ................................... S-10 Low Temperature Experiments ..................................... S-11 Saturation ..................................................... S-11 Accuracy of Timing .............................................. S-12 Air/Water Problem .............................................. S-12 General Procedure for a RINMR Experiment .......................... S-13 Spectrometer Control of the Injector ................................. S-13 Pulse Program for Proton or Lithium Kinetics Runs ..................... S-14 S2. General Experimental ............................................. S-18 S3. Syntheses deutero-(Trimethylsilyl)acetylene (d-1a) .............................. S-19 (Trimethylsilyl)phenylthioethyne .................................... S-19 (Phenylthio)acetylene (1c) ........................................ S-19 Reaction of n-BuLi with Aldehydes .................................. S-19 1-Phenyl-1-pentanol ............................................. S-20 1-(4-Diethylaminophenyl)-1-pentanol ................................ S-20 3-Methoxymethylanisole .......................................... S-20 2-Trimethylstannyl-3-methoxymethyl-anisole .......................... S-20 S4. Competition Kinetics Competition Experiments with n-BuLi ................................ S-21 Competition Experiments with 2-Methoxy-6-(methoxymethyl)phenyllithium (5) S-21 Propargyl Alcohols (6a-c) ......................................... S-21 1-Phenyl-3-(trimethylsilyl)prop-2-yn-1-ol (6a) .......................... S-22 1-Phenyl-3-(triphenylsilyl)prop-2-yn-1-ol (6b) .......................... S-22 1-Phenyl-3-(phenylthio)prop-2-yn-1-ol (6c) ........................... S-22 S5. NMR Characterization of Lithium Reagents Product Lithium Acetylides (d-4a) ................................... S-23 Recrystallization of 2-Methoxy-6-(methoxymethyl)phenyllithium (5) ......... S-25 Characterization of 2-Methoxy-6-methoxymethylphenyllithium (5) .......... S-25 S6. Rapid Injection NMR Kinetics Preparation n-BuLi Samples ....................................... S-27 Kinetic Simulations .............................................. S-27 Reactivity of n-BuLi with (Trimethylsilyl)acetylene (1a) .................. S-27 Reactivity of n-BuLi with deutero-(Trimethylsilyl)acetylene (d-1a) .......... S-29
Transcript
S-1
Reactivity of Individual Organolithium Aggregates – a RINMR Study of n-Butyllithium and2-Methoxy-6-(methoxymethyl)phenyllithium
Amanda C. Jones, Aaron W. Sanders, Martin J. Bevan, and Hans J. Reich,* Department of Chemistry, University of Wisconsin Madison, WI 53706
Introduction. Several research groups have deployed rapid injection NMR (RINMR) apparati,[S-1, S-2a,
S-3 - S-8] for the study of fast organometallic reactions at low temperature. Most are based on a design reportedby McGarrity, Ogle and Loosli,[S-1] which employs a piston-driven syringe suspended above the NMR tubeinside the bore of the spectrometer magnet. A special nozzle on the tip of the syringe needle (which is dippedinto the NMR sample) causes turbulent mixing of the sample from a vigorous injection. Although very shorttime scale experiments were reported for such an apparatus (less than 100 msec), no experiments below -95°C were reported, presumably because solvent viscosity at lower temperatures makes injection-inducedturbulent mixing impractical, and perhaps because cooling of the syringe, which is mounted in the coolinggas stream, may cause malfunctions. We were interested in a simpler and more robust design (related to onedeveloped by the group at Erlangen[S-2a]), in which syringes are mounted above the spectrometer, with thesample being injected into the NMR tube through a long teflon needle. This makes it possible to carry outmore than one injection (our apparatus has two syringe mounts). More importantly, it allows the use of amechanical stirrer mounted above the spectrometer magnet so that efficient mixing can be achieved at anytemperature consistent with solvent freezing point and sample solubility. Our apparatus was constructed tooperate with 10 mm NMR tubes, since we were planning multinuclear NMR experiments where sensitivitywas an important issue. Larger sample size also leads to more precision in volume and concentrationmeasurements. Although it may be feasible to work with smaller tubes, the space constraints in the NMR tubewould require more delicate stirring and injection components, and we did not attempt to construct one.
The ability to execute RINMR experiments at very low temperatures on a time scale of a few secondsis a crucial aspect of our apparatus. For example, McGarrity, Ogle and Loosli[S-1b] studied the reactivity ofthe dimer and tetramer of n-BuLi at -85 °C, where the half-life of the tetramer is approximately 2.5 seconds.This makes it difficult to study the aggregates independently, since the time scale of interconversion iscomparable to both T1 of the observed nuclei and the acquisition time of the FID. In the experimentsreported in this paper at -130 °C, the half-life of the (n-BuLi)4 - (n-BuLi)2 interconversion is approximatelyone hour, so that experiments to individually measure the reactivity of the two aggregates have a very largedynamic range. A more quantitative depiction is given in Fig. S-1, which shows the “Curtin-Hammett” linefor a 15-second time-scale kinetic study. For )G‡ values below the line, individual species areinterconverting on the time scale of the experiment, and the Curtin-Hammett principle applies. Above theline, the reactivity of the species can be individually measured, since they are interconverting slower than therate of reaction. For a successful experiment, the interconversion barrier must be well (1-2 kcal/mol) abovethe barrier for reaction, and both must also be above the line. At -85 °C the activation energy for speciesinterconversion must be >12 kcal/mol for a 15-sec time-scale experiment to provide useful information,whereas at -135 °C, reactions can be studied under non-Curtin-Hammett conditions if the species interconvertwith activation energies of $9 kcal/mol . Thus, measurement of the reactivity of n-BuLi dimer and tetramer()G‡
-84 for interconversion ca 11.4 kcal/mol) is marginal at best at -84 °C, but can be done readily at -135 °C.The problem of working too close to the “Curtin-Hammett line” is illustrated by one of the conclusions ofMcGarrity, Ogle and Loosli: that the dimer is ca 10 times as reactive as the tetramer towards benzaldehyde,a number which we now know to be too small by at least 3 orders of magnitude.
S-4
t½ = 15 sec
Operational limit ofour apparatus in 1:3THF/Me2O solvent
-160 -140 -120 -100 -80 -60Temp (°C)
6
7
8
9
10
11
12
13
14
ΔG
(kca
l/mol
)
Figure S-1. Relationship between temperature and activation energy for a reaction with a 15 s half-life. Iftwo species are present, both of which could participate in the reaction, their barrier to interconversion mustbe well above the line for the rates to be independently measurable with our apparatus.
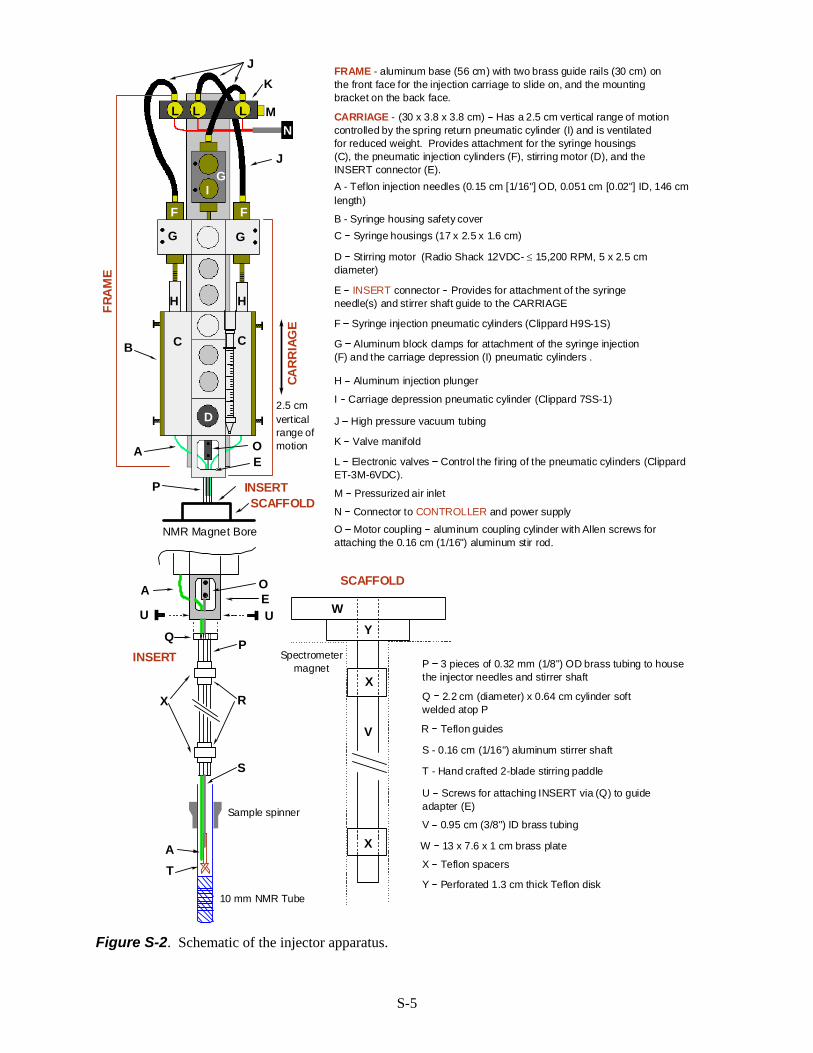
The Rapid Injection Apparatus. The automatic RINMR device that we built (Fig. S-2) consists of thefollowing parts, which are assembled for use directly above the spectrometer magnet (a Bruker Avance 360MHz spectrometer):
1. The main body of the injector consists of a fixed part (FRAME), and a moving part (CARRIAGE).On the FRAME are mounted a pneumatic cylinder to move the CARRIAGE, air valves for the pneumaticcylinders, and two brass guide rails. The CARRIAGE slides on the brass rails, and serves to lower and raisethe stirrer and injection needle(s) into and out of the NMR sample. On the CARRIAGE are mounted thesyringe(s), pneumatic cylinders for activating the syringes, and the stirring motor. The FRAME (2 kg) andCARRIAGE (3 kg) are deliberately massive to help absorb the shock of injection and spring return. TheFRAME is fastened to the ceiling, with the stirrer shaft centered above the spectrometer magnet bore.
2. The INSERT is placed inside the magnet bore and provides a guide to position needle(s) and stirrershaft in the magnet bore and into the top of the 10 mm NMR tube. It is attached to the CARRIAGE via guideadapter (E) and moves up and down with it.
3. The electronic control panel (CONTROLLER) provides control of the movement of the injectionCARRIAGE, the stirrer, and the pneumatic cylinders which actuate the syringe(s). It can be operatedmanually, or by the pulse program.
4. The SCAFFOLD (optional) provides protection for the top of the spectrometer magnet. It is basicallya holder for the INSERT. This is the only part of the apparatus that touches the spectrometer.
S-5
FRAME - aluminum base (56 cm) with two brass guide rails (30 cm) onthe front face for the injection carriage to slide on, and the mountingbracket on the back face.
CARRIAGE - (30 x 3.8 x 3.8 cm) Has a 2.5 cm vertical range of motioncontrolled by the spring return pneumatic cylinder (I) and is ventilatedfor reduced weight. Provides attachment for the syringe housings(C), the pneumatic injection cylinders (F), stirring motor (D), and theINSERT connector (E).
G Aluminum block clamps for attachment of the syringe injection (F) and the carriage depression (I) pneumatic cylinders .
H Aluminum injection plunger
C Syringe housings (17 x 2.5 x 1.6 cm)
E INSERT connector Provides for attachment of the syringeneedle(s) and stirrer shaft guide to the CARRIAGE
D Stirring motor (Radio Shack 12VDC- ≤ 15,200 RPM, 5 x 2.5 cmdiameter)
O Motor coupling aluminum coupling cylinder with Allen screws forattaching the 0.16 cm (1/16") aluminum stir rod.
F Syringe injection pneumatic cylinders (Clippard H9S-1S)
I Carriage depression pneumatic cylinder (Clippard 7SS-1)
L Electronic valves Control the firing of the pneumatic cylinders (ClippardET-3M-6VDC).
K Valve manifold
J High pressure vacuum tubing
M Pressurized air inlet
N Connector to CONTROLLER and power supply
B - Syringe housing safety cover
NMR Magnet Bore
L L
D
E
F F
G G
GI
J
H H
N
K
M
P
C
2.5 cmverticalrange ofmotion
CAR
RIA
GE
FRA
ME
INSERT
L
B
SCAFFOLD
A - Teflon injection needles (0.15 cm [1/16"] OD, 0.051 cm [0.02"] ID, 146 cmlength)
A O
C
J
SCAFFOLD
V
WY
Spectrometermagnet
X
X
J
J
Q
X R
P
S
10 mm NMR Tube
T
P 3 pieces of 0.32 mm (1/8") OD brass tubing to housethe injector needles and stirrer shaft
OE
Q 2.2 cm (diameter) x 0.64 cm cylinder softwelded atop P
R Teflon guides
S - 0.16 cm (1/16") aluminum stirrer shaft
T - Hand crafted 2-blade stirring paddle
U Screws for attaching INSERT via (Q) to guideadapter (E)
U
V 0.95 cm (3/8") ID brass tubing
W 13 x 7.6 x 1 cm brass plate
X Teflon spacers
Y Perforated 1.3 cm thick Teflon disk
INSERT
JU
Sample spinner
A
A
Figure S-2. Schematic of the injector apparatus.
S-6
C
F
G
G
I
H
B
INSERT
D
M
N
C
CARRIAGE
E
Guide rails
A
Figure S-3. Photograph of the injection apparatus.
The FRAME consists of a 56 x 5 x 0.8 cm aluminum base. On the back of the base is an aluminumfitting (Fig. S-4b) which slides into a matching fitting permanently mounted to the ceiling above thespectrometer magnet. At the top of the base is mounted an aluminum clamp (G) for the main pneumaticcylinder (Clippard 7/8" (2.2 cm) Bore, Brass Heavy Duty Minimatic Cylinder with Single Acting SpringReturn and Stud mount, 7SS-1) which actuates the CARRIAGE, and three pneumatic valves (L) which areconnected to the pneumatic cylinders on the FRAME (I) and CARRIAGE (F) by high pressure air hoses (J).On the bottom part of the frame are attached two 30 cm vertical brass guide rails for the CARRIAGE to slideon (See Fig. S-4c).
S-7
K
G
F
L
I
Top ofCARRIAGE
FRAME Base
GuideRails
FRAME Base
Bottom ofCARRIAGE
(a) (b)
(c)
UE
G
H
Top of FRAME
0mm
1020300
mm1020
0mm1020
Figure S-4. Photographs of portions of the injector. (a) Top of the FRAME and CARRIAGE, showing theelectronic valves and pneumatic cylinders. (b) The mounting bracket on the back of the FRAME at the topend. (c) The bottom of the FRAME and CARRIAGE, showing guide rails, and the mount for the INSERT.
The CARRIAGE consists of a 30 x 3.8 x 3.8 cm aluminum base, extensively machined and drilled toreduce weight, improve visibility, and provide points of attachment for mounting the working parts. TheCARRIAGE slides on the brass rails of the FRAME (see Fig. S-4c), and has a 2.5 cm range of up-downmotion. Mounted on the side of the CARRIAGE are two aluminum housings (C), designed to hold 1 mLHamilton gas-tight syringes (Fig. S-5a). The housings can be changed to accommodate other syringe sizes.Recessed into the bottom end of the CARRIAGE is a 12 volt DC electric motor (D) capable of operating at15,200 rpm (no load) (Radio Shack High-Speed 12VDC, 2.5 cm x 1.3 cm diameter). Bolted to theCARRIAGE below the stirrer is an adapter (E) which provides for attachment of the INSERT (see Figs. S-4cand S-5a). The syringes are actuated by spring-return pneumatic cylinders (F) with 2.5 cm strokes operatingat a pressure of 100 psi (Clippard 9/16" (1.4 cm) Bore, Brass Heavy Duty Minimatic Cylinder with SingleActing Spring Return and Stud mount, H9S-1S), which are attached to the sides of the CARRIAGE byaluminum clamps (G). The cylinder pistons are connected to adjustable aluminum plungers (H). TheCARRIAGE is moved on the guide rails by a third spring-return pneumatic cylinder (I), which is attachedto the FRAME by an aluminum clamp (G). The pneumatic cylinders are connected with high pressure tubing(J) to a manifold (K). The manifold is controlled by a series of electronic valves (Clippard ET-3M-6VDC)(L), which are connected to and actuated by the CONTROLLER.
S-8
P
Q
R
X
Holesforsyringeneedles
O
R
X
GuideRails
Syringe
INSERT
Syringeneedle
S
O
T
CARRIAGE
U
C
(a) (b)
(c)
E
Q
H
0mm
10
0mm1020
0mm
10
Figure S-5. Photographs showing details of the CARRIAGE and INSERT. (a) The bottom part of theinjector, with one syringe and the INSERT mounted on the CARRIAGE. The safety cover (B) whichnormally encloses the syringe housing (C) has been removed. (b) Details of the top of the INSERT, set upfor use without the SCAFFOLD (the Teflon spacers X would be removed if the SCAFFOLD were beingused). (c) The Teflon stirrer paddle.
S-9
The INSERT (Fig. S-5b) is placed directly into the probe (spacers X attached to INSERT), or into theSCAFFOLD, if it is in use (spacers X attached to SCAFFOLD). The INSERT consists of three pieces of 0.32cm (1/8") OD brass tubing (P) soft welded into a 2.5 cm diameter brass cylinder (Q). The outer tubes, whichhold the syringe needles, are 84 cm long, designed to reach to just above the top of the NMR tube, since thereis not enough space to fit these into the tube. The middle tube (which holds the stirrer shaft) is 92 cm long,designed to reach well within the NMR tube. The three brass tubes are held in place with Teflon guides (R)to give them additional strength and to center them in the SCAFFOLD. A 1.6 mm (1/16") x 91 cm aluminumstirrer shaft (S), with an aluminum shaft coupling (O) attached to the top, is inserted into the center brass tube.The coupling has a vertical black stripe to allow measurement of the stirring rate using a tachometer. A handcrafted two bladed Teflon paddle (T) is attached to the bottom end of the shaft. The one shown in Fig. S-5cwas the most effective of several designs tried. Upon assembly, the shaft coupling (O) is connected to theelectric stirrer motor and the brass cylinder (Q) is placed inside the internal guide connector (E), and fastenedwith thumb screws (U). The bottom of the stirrer paddle should be just above the sample level in the NMRtube, and the injection needle should end just above the top of the stirrer paddle.
The SCAFFOLD is an optional insert into the spectrometer bore which protects the top of thespectrometer, and provides a support for the INSERT during assembly of the apparatus. It consists of a 82cm long piece of 1.0 cm (3/8") ID brass tubing (V), which has been soft welded to a 1 cm thick brass plate(W). The 13 x 7.6 cm brass plate has the safety benefit of protecting the bore from any potential falling parts.The brass tube is fitted with Teflon spacers (X) which center the brass tube in the probe, and which can beeasily exchanged to fit different sized bores. The spacers have cutouts to allow the cooling and spinner gasto pass. A perforated 1.3 cm thick Teflon disk (Y), which rests directly on the room temperature shim stack,is used to allow spinner air to escape from under the scaffold. For extremely air sensitive samples anadditional flow of argon down the top of the spectrometer bore is used. To allow room for the Tygon hosewhich connects to an Argon cylinder, the SCAFFOLD is not used, and Teflon spacers (X) are placed on theTeflon guides (R) of the INSERT to align it for proper insertion into the NMR probe (as shown in Fig. S-4b).
The CONTROLLER operates in either manual or pulse-program control. For manual control a set of4 switches are used to lower and raise the CARRIAGE, start and stop the stirring motor, and perform theinjections of the two independently controlled syringes. The timing and duration of these operations can alsobe controlled by the spectrometer, using parameters written into the pulse program (see below), and this isthe nnormal mode of operation.
Temperature Control. Our RINMR kinetic studies benefitted greatly from the ability to measure theactual internal temperature of the sample before, during and after an injection using our internal 13C chemicalshift thermometer (Me3Si)3CH,[S-9] which shows an almost linear temperature dependence of the chemical shift(ca 1 Hz per degree) between the SiCH3 and the CH carbons. We normally use ca 2-4 µL of 10% 13Cenriched material in all samples for measurement of temperature before and after an injection. If a largeramount (ca 20 µL) is used, then the 13C signals can be seen in one scan, and the temperature of the samplecan be measured during an actual injection on a seconds time scale. Fig. S-6 shows the results of suchexperiments. There is a 4-5 degree jump in temperature during a typical injection of 0.2 mL of substrate into4 mL of a cold (< -100 °C) solution. The temperature returns to the pre-injection value in under 2 min. Sincethis is often a key time period for experiments, we developed a procedure to maintain a constant temperatureby raising the console temperature setting an appropriate amount (5 degrees) ca 10 s before the injection (Fig.S-6c).
S-10
Figure S-6. Sample temperature changes during RINMR experiments. (a) Response of sample temperatureto a 5° increase in spectrometer temperature setting. (b) Injection of a 0.2 mL sample of(trimethylsilyl)acetylene. (c) Spectrometer temperature setting raised 5° 10 s before injection of 0.2 mL of(trimethylsilyl)acetylene. This is the procedure used for most of the RINMR experiments reported. (d)Injection of 0.1 mL of a 2.5 M solution n-BuLi in hexanes. Note that the injected the volume is one-half thatof the other experiments, and temperature jump is also half as large, indicating insignificant heating due tosolvation of the n-BuLi.
Volume Accuracy of Injection. A weak feature of our experiment is that the volume of injectedmaterial cannot be controlled with great precision, nor can multiple small increments of sample be injectedbecause of the ca 146 cm long injection needles, and the on-off nature of our injection method. Wheneverpossible we checked the amount of reactant injected by NMR spectroscopic analysis of the sample during orafter the experiment.
Normal/Inverse Mode of Injection. “Normal” addition (substrate injected into a solution of the lithiumreagent) is the most convenient experiment to perform with our apparatus, because it avoids handling of asyringe filled with reactive or air-sensitive material (for example, the ca 146 cm needle has to be threaded intothe INSERT with the syringe filled with substrate). Most of the experiments reported in this paper usednormal addition. Successful inverse-mode additions were also carried out. For example, Fig. S-7 shows aRINMR experiment where n-BuLi in hexane was injected into 3:1 Me2O/THF at -131 °C (a similarexperiment was reported by McGarrity and coworkers[S-1b] at -84 °C in pure THF). Initially the n-BuLi ispresent as only the tetramer and the dimer grows in over the course of 1 h.
This experiment also demonstrates that the heat of solvation of the n-BuLi and that carried into the coldsample by the injected warm solution is dissipated rapidly since only traces of n-BuLi dimer are initiallyformed. The results of an experiment where an n-BuLi solution in hexanes was injected (Fig. 6d) show thatheat of solvation of the injected lithium reagent by THF and Me2O is not significant, since the temperatureincrease was very similar to that seen when the same volume of solvent alone was injected.
The inverse mode of injection is particularly useful for studying the reactivity of n-BuLi tetramer, sinceit produces an initial nonequilibrium state that is >95% tetramer. This mode was used for the experiments ofFig. S-17 and S-18 (reaction of n-BuLi with phenylthioacetylene and p-fluorobenzaldehyde).
0 60 120 180 240 300t / s
-140
-138
-136
-134
-132
-130
-128
-126
-124
-122
-120T
/ °C
Temperatureraised
InjectionTemperature raisedwithout injection. Injection without
temperaturechange.
Me3Si
Me3SiHC13Me3Si
0 60 120 180 240 300t / s
0 60 120 180 240 300t / s
20 μL 10% 13C enriched(Me3Si)3CH in 4 mL of 1:3THF/Me2O
0 60 120 180t / s
(a) (b) (c) (d)0.1 mL n-BuLi
injection
Injection withouttemperaturechange.
0.2 mL AcetyleneInjection
0.2 mL AcetyleneInjection
No Injection
S-11
2.0 1.5 1.0 0.5ppm
Tetramer and Hexamer in Hexane
0
2.6 min
3.1 min
Before Injection
6.1 min
7.2 min
22.3 min
43 min
46.5 min
91 minTime7Li
t1/2 = 60 minΔG -131 = 10.5 kcal/mol
(n-BuLi)4 + (n-BuLi)6
(n-BuLi)2
(nBuLi)2
(nBuLi)4
Figure S-7. An inverse mode injection of 0.05 mL of n-BuLi (2.6 M in hexanes) into 4 mL of 1:3THF/Me2O at -131 °C.
Low Temperature Experiments. The lower temperature limit of our experiments was dictated bycrystallization of solvent and solubility of substrate. We were interested in measuring the properties oflithium reagents in solvents in which they are typically used (most often THF or other ethers). The 1:3THF/Me2O solvent mixture chosen after considerable experimentation is a compromise between maintainingTHF-like solvent polarity and allowing work routinely down to -135 °C without crystallization of THF. Ifsolvent mixtures richer in THF are used, crystallization during the injection and when the sample is stirredbecomes a serious problem. Note that such samples can often be used at considerably lower temperaturesfor extended periods of time with no solvent crystallization if the sample is undisturbed. We conclude thatmany of the NMR experiments we and others have carried out in THF-ether and THF-dimethyl ether mixturesat temperatures near and below -130 °C were supersaturated in solvent, and probably also frequently insubstrate. The material to be injected was added neat, or dissolved in THF-ether mixtures, since solventscontaining Me2O (b.p. -23 °C ) could not be used.
Saturation. Most of the experiments reported here used 7Li NMR spectroscopy (I = 3/2) to monitor theprogress of the reaction. We were able to achieve satisfactory signal-to-noise in a single transient. Repetitionrates as fast as 0.25 seconds could be used with only minor saturation of the tetramer signal (see pre-scansin Fig. S-8) (T1(Tetramer) # 0.11 sec, T1(Dimer) # 0.03 sec) . In experiments in other contexts, use of 1H and 19FNMR spectroscopy required repetition rates of $ 2 s, and with 13C (enriched), $ 3 s.
S-12
2.5 2.0 1.5 1.0 0.5 0.0 -0.5
1.001.67
1.00
1.71
2.5 2.0 1.5 1.0 0.5 0.0 -0.5ppm
0
0.25
0.50
0.75
1.00
1.25
1.50
1.75
2.00
3.00
4.00
5.00
6.00
7
8
9
10
12
16
Li
0.021 M
1.3 M in Et2OInject 0.2 mL
(2 eqs).
Me3Si H
114
3,354
5,514
8,454
9,714
11, 038
13,558
18,298
19,138
t (s) t (s)
CCMe3Si Li
180 pre-scans takenbefore injection totest for saturation
Injection of acetylene
BuLi Dimer BuLi Tetramer
Stirrer downfor 1 sec
BuLi Tetramer
1:4 THF:Me2O-135.4 °C
#1
#180
Figure S-8. Sample RINMR experiment of the reaction of n-BuLi with (trimethylsilyl)acetylene. Spectrawere taken every 0.25 s for 45 s (180 spectra) then every 60 s for 20,000 s. The 7Li NMR spectra with theTeflon stirrer in the sample (t = 0-1 s, blue spectra) are only marginally broader than after the stirrer wasraised (t > 1 sec).
Accuracy of Timing. Several kinds of experiments showed that complete mixing of injected materialin THF-Me2O mixtures at -130 °C with the stirrer motor spinning at 4,000 to 6,000 rpm required ca 1 s (thisincludes lowering the CARRIAGE, injecting, stirring for 0.6 s and raising the CARRIAGE ). There is thusan inherent inaccuracy of ±0.5 s in the time measurement. To get reasonably accurate rate constants (± 15%)we need a half-life of at least 15 s ()G‡ > 9 kcal/mole), although poorer quality data can be obtainedbetween 3-15 s.
Air/water Problem. The RINMR experiment with our apparatus is inherently an open-tube operation,although the opening of the NMR tube is partially blocked by the stirrer and injector needle assembly. Withair-sensitive substrates the spectrometer must be operated using pure dry nitrogen for the cooling gas streamas well as for activating the sample spinner so that the spectrometer bore is an anaerobic environment.Nevertheless, we found that small amounts of air occasionally get into the sample (we showed that addition
S-13
of 6 mL of air into a 0.08 M sample of n-BuLi resulted in complete destruction of n-BuLi within 30 min).An argon flush (1 cm diameter Tygon tube inserted 12 cm into the magnet bore running 36 mL/sec)maintained throughout the experiment and especially during assembly of the apparatus, improvedreproducibility in experiments with n-BuLi. In this way, we could reliably work with n-BuLi in an open tubeeven in experiments lasting up to 10 h. This precaution did not seem to be needed for less reactive lithiumreagents, for example lithium (trimethylsilyl)acetylide.
General Procedure for a RINMR Experiment. Septum-sealed samples are prepared in a 10 mm NMRtube sawed to a length of 18 cm (see experimental for details of sample preparation). The material to beinjected (when not n-BuLi) is weighed into a separate, septum-sealed, N2 purged flask and dissolved inTHF/Et2O at a concentration appropriate for a 0.2 mL injection. The NMR sample (still sealed with a septum)is inserted into the probe, and preliminary spectra are collected to adjust spectrometer tuning, check thequality and concentration of the sample using 7Li and 1H NMR spectroscopy, and measure the temperatureof the sample using 13C NMR.[S-9]
The sample is then raised, the septum is removed, and the open NMR tube is lowered into thespectrometer with great care to minimize exposure to air. Argon purging is started and the apparatus isassembled as follows: the Teflon stirrer is attached to the stirrer shaft of the INSERT, which is placedcarefully in the probe and into the NMR tube. The INJECTOR assembly is attached to the ceiling bracket,the brass ring (Q) of the INSERT is attached to the guide connector (E), and the motor coupling is attachedto the motor. The air supply is attached to the pressurized air inlet (M) and the CONTROLLER is connectedto the injector relays. At this point the spectrometer temperature is stabilized to ca 5° lower than the targettemperature for the experiment.
The actual injection is performed as follows. The pulse program is started, which includes a number ofuser-defined pre-injection scans (the exact number depends on the acquisition time) set to last about 20 s.Approximately 10 s prior to the injection the spectrometer temperature setting is raised ca 5 °C (the offset hasto be empirically determined as depicted in Fig. S-6). After the pre-injection scans the automated pulseprogram lowers the CARRIAGE, starts the stirrer and injects the sample, continues stirring for 0.6 s, stopsthe stirrer, raises the CARRIAGE and continues collecting spectra. Depending on the length of theexperiment, spectra are typically taken at 0.8 s intervals for a few minutes (although intervals as short as 0.25s work well for 7Li), a period termed “fast acquisition” (see below). A longer time interval (15-60 s) isselected for the remainder of the experiment, a period termed “slow acquisition.” At the completion of theexperiment, the temperature of the sample is again checked,[S-9] and post-kinetics analyses of the sample areperformed (e.g. 1H NMR for concentration determination and 13C NMR for product determination).
Spectrometer Control of the Injector. The Bruker Timing Control Unit’s extra output lines are usedto control the actions of the injection apparatus. These lines are available to the user through the BP1connector on the back of the console. These are TTL lines that are normally in the high state, at 5 volts. Theyare controlled by changing the bits in a register through pulse programming. The specific register thatcontrols the outputs of connector BP1 is NMR Word 4. The specific lines that are available to the user arecontrolled by bits 3, 4, 6 and 7 (Table S-1). They correspond to pins Z, DD, S and W respectively onconnector BP1. These output lines are cabled to a control box. This box uses these digital inputs to switchelectrical lines that control three valves and one motor, as follows. The control box contains the switchingcircuitry and a power supply for the motor and valves. There are also manual override switches for each ofthe valves and a motor speed control dial, as well as a motor voltage meter.
Pulse Program for Proton or Lithium Kinetics Runs. The Bruker Avance-360 spectrometer utilizesXwinNMR acquisition and processing software. We use a 2D pulse program (shown below) to control theinjection and spectral acquisitions. The program can be written to contain as many loops as needed withspecific delays for each loop. The first pre-injection loop (10-20 s) allows us to monitor the sample prior tothe injection, check for signal saturation, and provide the time needed to change the temperature setting.During the injection loop starting at line 2 and occurring only once, the timing is as follows. Following d5,and d1, acquisition of a single scan occurs. Following completion of the acquisition time, the CARRIAGEis dropped followed by a delay of d11 (typically 0.5 s). Delays of zero are not allowed, so in order to stir atessentially the same time as the injection, d14 must be set to a small finite value (e.g. 1 ms). After theinjection, stirring is continued for a delay of d13. This is typically kept short (0.5 s), after which theapparatus is raised again. For the stirring motor to be shut off at the same time the apparatus is raised, d21is set to 1 ms. If d21 is set slightly longer (such as 0.5 s), the motor will continue stirring while the apparatusis raised. Both methods lead to efficient mixing. With delay d24 also small (1 ms), acquisitions continue(line 4) immediately following the completion of the injection and stirring procedure. The command ‘go =#’ comes into effect when the number of scans (NS) per spectrum is greater than 1, where NS is an externalacquisition parameter. In such a case, ‘d1' and ‘p1' are repeated. Thus ‘d1' is a repeated relaxation delay toprevent saturation from multiple scans, whereas ‘d5' and ‘d6' represent the delay between experiments, andthus determine how frequently kinetic data points are collected.
S-15
“l3 = td1 - l0 -l1 -l2"“d19 = 30 m”
zed5
1 d1p1*0.33 ph1go=1 ph31 ;data acquisition, cycle back to line 1 if #scans >1d19 wr #0 if 0#zd ;d19 is delay for disk I/Olo to 1 times l0 ;loopcounter 0, pre-injection loop, l0 repetitions
2 d53 d1
p1*0.33 ph1go=3 ph31d19 wr #0 zdlo to 2 times l1 ;loopcounter 1 injection loop (l1 = 1 for a single cycle)
d11 setnmr4|3 ;valve 1 - turn on dropd14 setnmr4|7 ;valve 4 - turn on stirrer motord13 setnmr4|6 ;valve 3 - turn on injectd21 setnmr4^3 ;valve 1 - turn off dropd24 setnmr4^7 ;valve 4 - turn off stirrer motor
4 d55 d1
p1*0.33 ph1go=5 ph31d19 wr #0 if 0# zdlo to 4 times l2 ;loopcounter 2, fast acquisition loop, l2 repetitions
6 d67 d1
p1*0.33 ph1go=7 ph31d19 wr#0 if #0 zdlo to 6 times l3 ;loopcounter 3, slow acquisition loop, l3 repetitions
d23 setnmr4^6 ;valve 3 - turn off inject
exit
ph1= 0 2 2 0 1 3 3 1ph31= 0 2 2 0 1 3 3 1
S-16
The command ased opens a dialog box in which to set the acquisition parameters for the experiment(Table S-2).
Table S-2. The acquisition parameter list in XwinNMR from the command ased. ASED - acquisition parameters
PULPROG kinauto pulse program for acquisition
td 1333[a] time domain size
ns 1 number of scans
ds 0 number of dummy scans
swh 1666.7[a] sweep width in Hz
aq 0.8[a] sec acquisition time (typically 0.8 - 2 s)
rg 1200[a] receiver gain
dw 104.8[a] usec dwell time
de 6[a] usec pre-scan delay
d1 0[a] sec relaxation delay
d5 0[a] sec interexperiment delay fast acquisition
d21 0.001 sec delay following apparatus raise (0.5 sec works also)
d23 0.001 sec delay following injection OFF
d24 0.001 sec delay following motor STOP
l0 15 pre-injection scans (typically 9-15)
l1 1 loopcounter during injection (typically 1)
l2 200[a] sec loopcounter fast acquisition (depends on reaction rate)
l3 211[b] sec loopcounter slow acquisition (depends on reaction rate)
[a] These parameters (in red) vary from experiment to experiment and depend upon the nucleus observed andthe time scale of the reaction. [b] The values in bold cannot be altered using this dialogue box.
An additional parameter, not available on the ased parameter list is td1. It is the number of incrementsalong the time axis. The number of the distinct spectra in loop 0 (the pre-injection scans), loop 1 (theinjection scan), loop 2 (fast acquisition) and loop3 (slow acquisition) add up to td1, which is user defined.The parameter l3 is automatically calculated (l3=td1-l0-l1-l2). The complete acquisition parameter listingis accessed with the command eda and is used to set td1.
That data are saved as a 2-dimensional SER file. Individual FIDs are extracted in XwinNMR from the
S-17
2D file to their own experiment number using the command RSER. Specifically, the command “rser 20620" extracts the 20th spectrum and places it into experiment number 620. The individual FIDs are thenworked up in NUTS like normal 1D spectra. Peak areas are determined using the NUTS line fitting routine.
S-18
S2. General Experimental.
Tetrahydrofuran (THF) and Et2O were freshly distilled from sodium benzophenone ketyl before use.Me2O was dried with n-BuLi directly prior to use in a graduated conical cylinder and distilled via cannulainto the NMR tube. Glassware was placed overnight in an oven at 110 °C or flame-dried before purging withN2 to remove moisture. NMR tubes, injection needles and syringes were kept dry by storing them under lowpressure in a glove box antechamber. Common lithium reagents were titrated using n-propanol in THF with1,10-phenanthroline as indicator.[S-10] Temperatures of -78 °C were achieved with a dry ice/acetone bath and-20 °C with a chemical freezer. Kugelrohr distillation temperatures refer to the pot temperature.
Commercially available starting materials and reagents (obtained from Aldrich Chemical Companyunless otherwise noted) include: n-BuLi (2.5 M in hexane), MeLi (1.4 M in ether), (trimethylsilyl)acetylene(1a) (GFS Chemicals), (triphenylsilyl)acetylene (1b), (p-tolylsulfonyl)acetylene (1d), 3-methoxybenzylalcohol, Me3SnCl.
Low-temperature heteronuclear NMR experiments were performed on a 360 MHz spectrometer witha 10 mm broadband probe at the following frequencies: 90.556 MHz (13C), 139.905 MHz (7Li). Spectra wereobtained in undeuterated ether solvents with the spectrometer unlocked. 13C spectra were acquired withcomposite pulse decoupling (CPD) and referenced internally to the C-2 carbon of THF (68.0 ppm).Lorenzian multiplication (LB) was applied to 13C spectra. 7Li and 6Li spectra were referenced externally to0.3M LiCl/MeOH standard (0.00 ppm). Samples were prepared in thin-walled 10 mm NMR tubes, fitted with9 mm septa, wrapped with parafilm and purged with N2 (or Argon for RINMR experiments). Samples wereprepared and stored at -78 °C.
S-19
H
O
R
n-BuLi
R
Bu
OH
S3. Syntheses
deutero-(Trimethylsilyl)acetylene (d-1a). To a 100 mL RB Schlenk flask equipped with a stir bar andpurged with N2 was added (trimethylsilyl)acetylene (8.0 mL, 56.6 mmol) and 50 mL of Et2O. The stirringsolution was cooled to -78 °C and n-BuLi (2.5 M in pentane, 20 ml, 50 mmol) was added. After 20 min thesolution was allowed to warm to room temperature. A high vacuum pump was connected to the Schlenk lineto evaporate all solvents and dry the resulting white solid. After 1 h the flask was taken off vacuum andbackfilled with N2. D2O (0.9 mL, 50 mmol) was added very slowly as the reaction is highly exothermic andvaporizes the acetylene if done too quickly. The white slurry was stirred vigorously for 15 min. The septumwas removed and the flask equipped with a 3-way distillation adapter connected to a 25 mL conical collectingflask (with the thermometer joint closed with a glass stopper). The Schlenk line was connected to the vacuumpump but kept closed to prepare for distillation. The slurry was frozen by submerging the flask in N2(l) for5 min and the Schlenk line was opened to evacuate the system. After 5 min the flask and setup were raisedand rotated to submerge the collecting flask. As the flask containing acetylene and LiOH warmed theacetylene condensed in the collecting flask. A clear liquid (4.82 g, 97%) was collected that contained byNMR #0.6 % of the proteo-acetylene and a small amount (# 2 mol%) of ether. 1H NMR (300 MHz, CDCl3):* 2.4 (s, 0.006 H), 0.2 (s, 9.0 H). 13C NMR (90 MHz, THF): * -0.17 (s), 89.2 (1:1:1 t, 2JD-C = 6.5 Hz), 94.7(1:1:1 t, 1JD-C = 36.4 Hz).
(Trimethylsilyl)phenylthioacetylene. This compound was synthesized according to a literatureprocedure.[S-11] Purification by kugelrohr distillation (0.02 torr, 125-135 °C) gave an 88% yield of a paleyellow oil. 1H NMR (300 MHz, CDCl3): * 0.26 (s, 9H), 7.2-7.27 (m, 1H), * 7.32 - 7.5 (m, 4H).
(Phenylthio)acetylene (1c). This compound was synthesized according to a slight modification of aliterature procedure.[S-11] (Trimethylsilyl)(phenylthio)acetylene (3.2 g, 15.5 mmol) was dissolved in 20 mLof CH3OH and stirred in an open 50 mL RB flask. KF (1.8 g, 31 mmol) was added in addition to 5 drops ofH2O. The clear solution was stirred at room temperature for 80 min, by which time it had turned a paleyellow. The reaction was quenched with aqueous NH4Cl (10 mL) and extracted with ether (35 mL). Theorganic layer was washed with water (10 mL). The aqueous layer was extracted sequentially with additionalether (2x20 mL). The organic layers were combined, dried with MgSO4 and concentrated to give a paleyellow oil (1.56 g, 11.6 mmol, 75%). Over time, the substance turned brown and was typically stored in a-78 °C freezer, where decomposition was kept at a minimum over a period of a few months. Typically beforeuse, the compound was dissolved in hexanes and run though a pipette containing silica gel and MgSO4. 1HNMR (300 MHz, CDCl3): * 3.26 (s, 1H), 7.21-7.27 (m, 1H), 7.32 - 7.39 (m, 2H), 7.43 - 7.48 (m, 2H). 13CNMR (90 MHz, CDCl3): * 71.3 (S-C/C-H), 87.1 (S-C/C-H), 126.9, 127.1, 129.6, 131.8. MS(EI): M+• =134.0190 (calcd for C8H6S = 134.0196).
Reaction of n-BuLi with Aldehydes. The benzyl alcohol products were prepared separately to confirmthe products of the kinetics reactions with benzaldehyde. The aldehyde (5.0 mmol) was weighed into a dry100 mL round bottom flask equipped with a stir bar. The flask was sealed with a septum and purged withN2. THF (30 mL) was added and the solution was cooled to -78 °C. n-BuLi (2.2 mL, 2.5 M hexanes, 5.5mmol) was added and allowed to react for 10 min. The solution was then warmed to room temperature andquenched with NH4Cl (10 mL). The solution was extracted with ether (30 mL) and washed with H2O (2 x10 mL) then brine (1 x 20 mL). The organic layer was then run through a short column of MgSO4 and silicagel. The organic layer was concentrated under low pressure and dried in vacuo (ca 0.1 torr). Quantitativeyields were obtained.
3-Methoxymethylanisole. 3-Methoxybenzyl alcohol (4.5 mL, 36 mmol) was added to a stirring slurryof NaH (2.92 g, 60% dispersion, 73 mmol) in 75 mL of DMSO in a 250 mL round bottom flask. After 1 h,MeI (4.5 mL, 73 mmol) was added and allowed to react for 1 h. The reaction was quenched with 50 mL ofH2O, extracted with 3 x 50 mL of 1:1 ether/hexanes. The organic layer was washed with 25 mL of H2O, 25mL of brine, dried with MgSO4 and concentrated to give a faint yellow oil (4.47 g, 86 %). 1H NMR (300MHz, CDCl3): * 3.40 (s, 3H), 3.83 (s, 3H), 4.45 (s, 2H), 6.85 (m, 1H), 6.93 (m, 2H), 7.27 (t, J=8.1 Hz, 1H).13C NMR (75 MHz, CDCl3): * 55.5, 58.4, 74.8, 113.1, 113.6, 120.2, 129.6, 140.1, 160.0.
2-Trimethylstannyl-3-methoxymethyl-anisole. 3-(Methoxymethyl)anisole (0.99 g, 6.54 mmol) and25 mL of hexane were added to a 50 mL RB flask, purged with N2, and cooled in an ice water bath. n-BuLi(2.35 M in pentane, 0.34 mL, 7.85 mmol) was added and the reaction flask was placed in a 0 °C freezer for5 days. Trimethyltin chloride (2.4 g, 12 mmol) in 5 mL of THF was added after transferring the reaction flaskto an ice water bath. The reaction mixture was extracted with ether, washed with brine, and dried withMgSO4. After concentrating under low pressure, the resulting yellow oil was purified by Kugelrohrdistillation (# 150 °C at 0.01 mm Hg) and a clear oil was collected (1.04 g, 3.31 mmol, 51 %). 1H NMR (300MHz, CDCl3): * 0.50 (s, 2J1H-119Sn = 56.3, 2J1H-117Sn = 53.8 Hz, 9H,), 3.1 (s, 3H), 3.3 (s, 3H), 4.3 (s,4J1H-Sn = 4Hz, 2H), 7.3 (m, 1H), 7.0 (s, 1H), 7.2 (s, 1H). 13C NMR (75 MHZ, CDCl3): * -6.2 (1J13C-119sn = 364 Hz, 1J13C-
For two reactants (A and B) competing for a deficiency of the same reagent (C) (where both reactionshave the same order) the relative rates can be calculated using the formula kA/kB = ln (XA left)/ln (XB left).“XA left” and “XB left” are defined as the mole fractions of the two starting materials remaining at the endof the reaction relative to the amount of starting materials at the beginning of the reaction. In theseexperiments A and B are two acetylenes, C is n-BuLi dimer. Data are summarized in Table 3.
Competition Experiments with n-BuLi. A mixture of two acetylenes (0.4 - 2 mmol) (the less reactiveacetylene in excess) was prepared as a solution in 4 mL of 1:3 THF/Me2O, in a 10 mm NMR tube. Adeficiency of n-BuLi (0.10 mL, 0.25 mmol, 2.5 M hexanes) was added to the sample at -128 °C using therapid-injection apparatus and allowed to react to completion (ca 2 h) as determined by 7Li NMR. Afterwarming to -80 °C, a solution of benzaldehyde (0.1 mL, 0.3 mmol) in THF was injected and allowed to reactfor 10 min. The sample was removed from the spectrometer and quenched with propionic acid. The mixturewas extracted with Et2O (20 mL), washed with NaHCO3(aq) (2 x 5 mL), brine (1 x 10 mL) and concentrated.The ratios of products and remaining starting material were determined by 1H NMR integration with CDCl3as solvent (300 MHz), using the propargylic and acetylenic protons, and pentachloroethane as an internalstandard.
Competition Experiments with 2-Methoxy-6-(methoxymethyl)phenyllithium (5): A sample of 5was prepared (see below) and checked by13C and 7Li NMR spectroscopy. Using the rapid-injection apparatusa solution of two acetylenes (0.5 - 2 mmol, the less reactive acetylene in excess) dissolved in THF wasinjected. The temperature for these experiments needed to be -100 °C or higher so that the rate of conversionfrom the tetramer to the reactive aggregate was fast enough to give convenient reaction times (< 2 h). Themethod of injecting a solution of the unreactive aggregate in a less polar solvent, as used for n-BuLi, was notviable due to the low solubility of the aryllithium in ether. The reaction was followed by 7Li NMRspectroscopy to ensure reaction completion. For reactions involving (trimethylsilyl)acetylene, which is lostupon workup, the acetylene concentration was determined in situ by 1H NMR spectroscopy prior to thereaction quench. A solution of benzaldehyde in THF was injected, which reacted within a few minutes. Thesample was ejected from the spectrometer, quenched with 3 mL of NH4Cl(aq) and allowed to warm to roomtemperature. The product was extracted with 5 mL of ether and the organic layer was dried with MgSO4 thenconcentrated under low pressure.
Table S-3. A summary of relative rate constants determined by competition kinetics. The numbers outsideof the parentheses are the average of the numbers inside the parentheses.
For characterization the benzaldehyde adducts were prepared and purified independently.
Propargyl Alcohols (6a-c). n-BuLi (0.1 mL, 2.5 M/hexanes) was added to a THF (3 mL) solution ofan acetylene (0.03 mmol) at -78 °C. After 5 min, benzaldehyde (0.025 mL, 0.25 mmol) was added andallowed to react for 5 min. The reaction was quenched with NH4Cl(aq) and allowed to warm to roomtemperature. The product was extracted with 5 mL of ether and the organic layer was dried with MgSO4, thenconcentrated under low pressure. Residual benzaldehyde, (phenylthio)acetylene and/or(trimethylsilyl)acetylene were removed under high vacuum (ca 0.2 torr). 1-Phenyl-3-(triphenylsilyl)prop-2-yn-1-ol was purified by column chromatography using silica and 1:9 ethyl acetate/ hexanes eluent.
Product Lithium Acetylides (4a-d). Lithium acetylide products were characterized by 13C NMRspectroscopy: 4a, 4b and 4c are dimeric in 1:3 THF/Me2O, displaying well-resolved 1:2:3:4:3:2:1 septets forthe carbanion carbon from coupling to two 7Li nuclei , or a 1:2:3:2:1 quintet for coupling to two 6Li nuclei(Fig. S-9). Our chemical shift data (Table S-4) are consistent with those of previously reported lithiumacetylides,[S-14a, S-15, S-16a] except that the carbanion carbon of the silyl acetylides have unusually large downfieldchemical shifts relative to the protonated counterpart (data for lithium phenylacetylide and propylacetylideare shown for comparison). Silicon substituents are known to increase the acidity of acetylenic protons morethan is predicted based on inductive effects alone,[S-17, S-18] and it is not surprising that the anomaly is alsoreflected in the NMR spectrum of the anion as well as the kinetics of deprotonation. Acetylide 4d wasmonomeric and is the first monomeric lithium acetylide to be characterization by NMR spectroscopy. 3,3,3-Triphenylpropynyllithium was shown to be partially monomeric in THF solution from analysis of theconcentration dependence of equilibrium acidities.[S-19] A metal free “naked” acetylide anion with aphosphazenium (P4) counterion has been characterized by NMR.[S-20] Monomeric lithium acetylides havealso been observed in the gas phase.[S-21]
Table S-4. Acetylene and lithium acetylide chemical shifts in 1:3 THF/Me2O at -125 °C to -135 °C.
Figure S-9. 13C and 7Li NMR spectroscopy of lithium acetylides 4a to 4d in 1:3 THF/Me2O.
The mixed dimer is a thermodynamically favored structure that forms in high concentration when oneequivalent of n-BuLi is added to a solution of the dimeric lithium (trimethylsilyl)acetylide. It can also beprepared by adding 0.5 equiv. of acetylene to a solution of n-BuLi (Fig. S-10). The 7Li chemical shift exactlymidway between the homodimers is suggestive of a mixed dimer. Coupling to lithium could not be resolvedwith 7Li, however, the 13C NMR spectrum of a 6Li labeled sample confirmed the dimer assignment as theanionic carbon displayed a 1:2:3:2:1 pentet from coupling to two 6Li nuclei.
S-25
δLi 0.33δLi 1.37
δ 170.2
J13C-6Li = 7.7 Hz
2.5 2.0 1.5 1.0 0.5
(n-BuLi)4
[Li] = 0.03 M, -132 ° C
LiLiBu C SiMe3C
(n-BuOLi)(n-BuLi)3(n-BuLi)2
LiLiC C SiMe3CCMe3Si
170.5 170.0ppm
7Li
169.0 168.5 168.0ppm
1
1/2
0
Eqs. 1a
3a
4a[6Li]-3a
[6Li]-4a
13C
LiLi
C C SiMe3CCMe3SiKeq = 0.06
(n-BuLiLiBu C SiMe3C +
[Li] = 0.06 M, -125 °C
Li)2
δLi 2.38
1: 3 THF / Me2O
δ 168.5
J13C-6Li = 8 Hz
3a 4a
2δ 1.86
δ 114.5 δ 115.7
δ 1.7
Figure S-10. Spectroscopy of the mixed dimer 4a, and comparison with the homo-dimers 3a and (n-BuLi)2.
Recrystallization of 2-Methoxy-6-(methoxymethyl)phenyllithium (5). 2-Trimethylstannyl-3-(methoxymethyl)anisole (0.13 g, 0.41 mmol) was weighed into a N2 purged NMR tube and dissolved in 1 mLof ether. The sample was cooled in a dry ice/acetone bath and MeLi (0.32 mL, 1.4 M/ether, 0.45 mmol) wasadded. The sample was allowed to warm slightly, until the solution turned a faint yellow. The sample wasthen placed back in the dry ice bath for 1-2 min, before placing in a -20 °C freezer. Crystals typically formedwithin 30 min. The ether supernatant was removed by cannula. The crystals were washed with ether (3x1mL), weighed wet (0.06 g, <0.39 mmol) and dissolved in the desired solvent mixture for NMR spectroscopy.
Characterization of 2-Methoxy-6-methoxymethylphenyllithium (5). Variable temperature NMR in3:2 THF/ether confirmed the presence of three aggregates and provided estimates for the barriers tointerconversion (Fig. S-11). The coalescence temperature by 7Li NMR spectroscopy for two of the isomersis ca -132 °C, which corresponds roughly to a )G‡ = 7.2 kcal/mol, an exchange rate that is too high for studyby RINMR. The coalescence temperature for exchange with the third isomer is ca -29 °C, which correspondsto an estimated )G‡ = 11.7 kcal/mol.
S-26
Li
O
[RLi] ca 0.02 M, 3:2 THF:Et2O
O Li
O
O7Li δ 2.97
4
7Li δ 2.257Li δ 2.13Li
O
O
2Tc = -132 °C
ΔG -132 ≈ 7.2 kcal/molTc = -29 °C
ΔG -29 ≈ 11.7 kcal/mol
4 3 2 1ppm 3 2 1ppm
-138 °C
-132 °C
-130 °C
-122 °C
-93 °C
-72 °C
-40 °C
-35 °C
-29 °C
-22 °C
Temp / °C
(RLi)4
(RLi)2 RLi
7Li Temp / C°(RLi)4
(RLi)2 RLi
(RLi)4
(RLi)2 / RLi
-1.10 -1.00 -0.90 -0.80Log (Monomer/Dimer)
-1.4
-1.2
-1.0
-0.8
-0.6
Log
(Tet
ram
er)
4 3 2 1ppm
0.02 M
0.04 M
0.06 m
-90 °C3:2 THF:Ether
(RLi)4
(RLi)2 RLi
Slope = 2.7
5-M 5-D 5-T
(a) (b)
(c)
Figure S-11. (a) Variable temperature 7Li NMR spectra of 2-methoxy-6-(methoxymethyl)phenyllithium (5)in 3:2 THF/ether. (b) 7Li NMR study of variable concentration samples. (c) Variable concentration log/logplot.
A variable concentration experiment at -90 °C (Fig. S-11) established that the downfield peak at * 2.97ppm in the 7Li NMR spectra is the higher aggregate. A plot of log([5-M] +[5-D]) vs. log[5-T] gives a slopeof 2.7, as expected for the summation of the expected slope of 4 (monomer vs. tetramer) and 2 (dimer vs.tetramer). The low solubility of the tetramer and the overlap of the two lower aggregates made a moredetailed concentration dependence experiment difficult. At concentrations higher than about 0.1 M, thetetramer began to precipitate, so only a very limited range of concentrations could be examined. A moredetailed description of the structure will be reported separately.
Preparation of n-BuLi Samples. A 10 mm NMR tube sawed to a length of 18 cm was sealed with aseptum, grease, and parafilm, and purged with Argon. The 13C chemical shift thermometer (10% 13C labeledtris(trimethylsilyl)methane, 4 :L),[S-9] an internal standard for concentrations (PhSiMe3, 28 mg, 0.186 mmol)and substrate (for cases where n-BuLi is to be injected) were weighed in, followed by 1 mL of freshlydistilled THF. The NMR tube was cooled in a dry ice/acetone bath. Me2O (-3 mL) is distilled via cannulainto the NMR tube from a graduated conical cylinder containing n-BuLi (for drying). For cases wheresubstrate will be injected, n-BuLi (0.05-0.1 mL, 2.5 M/hexane, 0.13 mmol) was added to the NMR tube.
Kinetic Simulations. For the reactions with n-BuLi and acetylenes, rate constants were determined bya least squares fit of experimental and calculated points from numerical integration of the equations in Fig.S-12. For the graphs reporting concentration vs time plots the points are experimental and the lines representthese kinetic simulations. In the 7Li NMR RINMR experiments with 1 there was no internal integrationstandard, so concentrations were normalized, assuming that the sum of the signals for (n-BuLi)2, (n-BuLi)4,3, and 4 were constant. The products of the reaction of 1 with n-BuLi tetramer are unknown. The reasonableprocess shown in eq. 3 was assumed for convenience in the simulations . Eq. 3 becomes significant only forreactions with 1c, and here the intermediate 3c does not build up detectably.
Figure S-12. Kinetic scheme for reactions of n-BuLi with acetylenes.
Reactivity of n-BuLi with (Trimethylsilyl)acetylene (1a). (Trimethylsilyl)acetylene (0.2 mL) wasinjected at varying concentrations (Fig. S-13 (a) 1 M in 1:1 THF/ether, (b) 2.6 M in 1:1 THF/ether, (c) neat)into a solution of n-BuLi (0.03 M) in 4 mL of 1:3 THF/Me2O. In these experiments kD-1a is not well definedsince most of the dimer reaction occurs during the 1-second mixing period. The temperature was slightlyhigher than our target of -130 °C in run (a), and slightly lower in run (c), and this fully accounts for the largervalues of kMD-1a and kT in run (a) and the smaller values in run (c). Because of the temperature variance, thereported value of k2
MD-1a = 2.6 M-1 s-1 is for the run at -129 °C. The reaction of 3a with 1a is thus first orderin 1a. As can be seen in Fig. S-14, the rate of reaction with n-BuLi tetramer is zero-order in 1a, so only eq.4 is operative and there is no detectable contribution from eq. 3.
Figure S-13. Time vs. concentration plots and kinetic simulations for 0.2 mL injections of varyingconcentrations of 1a in 1:1 THF/ether into 4 mL of a 0.03 M solution of n-BuLi in 1:3 THF/Me2O. The linesare numeric integration simulations using the kinetic scheme of Fig. S-12 and the rate constants shown.
Figure S-14. The injection of (a) 0.2 mL of neat 1a and (b) 0.2 mL of a 1 M solution of 1a in 1:1 THF/etherinto a 0.03 M solution of n-BuLi in 4 mL of 1:3 THF/Me2O at -135 °C. The lines are numeric integrationsimulations using the kinetic scheme of Fig. S-12 and the rate constants shown.
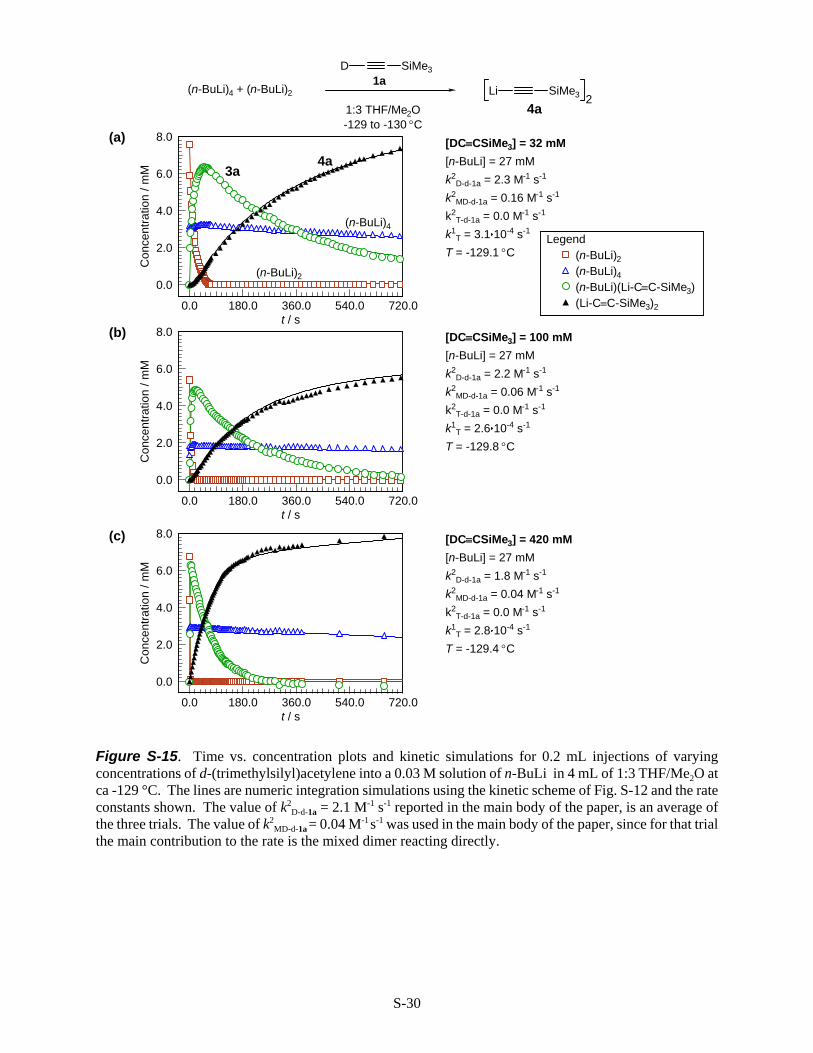
Reactivity of n-BuLi with d-(Trimethylsilyl)acetylene (d-1a). d-(Trimethylsilyl)acetylene wasinjected (0.2 mL) at varying concentrations (Fig. S-15 (a) 0.9 M in 1:1 THF/ether, (b) 3.8 M in 1:1 THF/ether,(c) NEAT into a solution of n-BuLi (0.03 M) in 4 mL of 1:3 THF/Me2O. The reaction of n-BuLi dimer wasfirst order in d-1a. The rate of reaction of the mixed dimer 3a was ca 0.7 order in d-1a, as reflected by thehigh k2
MD-d-1a value in Fig. S-15a, compared to the lower values in Fig. S-15b and Fig. S-15c. This trend wasreproducible and implies a competing first order rate determining process (zero order in acetylene, first orderin 3a) such as conversion of mixed dimer 3a to a very reactive open dimer,[S-16b] or even to monomers. Ratedetermining conversion to monomers would appear to be ruled out by the DNMR studies of n-BuLi inTHF,[S-14b] where line shape analysis showed that loss of C-Li J coupling in the dimer occurred on the sametime scale as dimer-tetramer interconversion. Thus, interconversion of n-BuLi dimers and monomers (whichwould result in loss of coupling) is at least 3 orders of magnitude slower than the reactions of the dimer andmixed dimer with 1a and d-1a.
Figure S-15. Time vs. concentration plots and kinetic simulations for 0.2 mL injections of varyingconcentrations of d-(trimethylsilyl)acetylene into a 0.03 M solution of n-BuLi in 4 mL of 1:3 THF/Me2O atca -129 °C. The lines are numeric integration simulations using the kinetic scheme of Fig. S-12 and the rateconstants shown. The value of k2
D-d-1a = 2.1 M-1 s-1 reported in the main body of the paper, is an average ofthe three trials. The value of k2
MD-d-1a = 0.04 M-1 s-1 was used in the main body of the paper, since for that trialthe main contribution to the rate is the mixed dimer reacting directly.
Disproportionation of the Mixed Dimer 3a. The disproportionation of 3a to (n-BuLi)2 and 4a (eq. 5in Fig. S-12) provides an alternative path for the reaction of mixed dimer 3a with 1a that is zero order inacetylene. We estimated the rate of this process as follows. The rate constant for comproportionation of 3a(k2
D-MD, eq. 5) was measured by injecting a solution of the acetylide homodimer 4a into a solution of n-BuLi(Fig. S-16), giving k2
D-MD = 2.7 M-1 s-1 (we did not prove the kinetic form of this process but assume that itis second order and follows eq. 5). From this rate constant and the measured equilibrium constant KMD = 0.06(Fig. S-10) we can calculate k2
MD-D = 0.15 M-1 s-1 (rate constant for the reverse reaction, disproportionation).Disproportionation does not compete with eq. 2 for the protio substrate 1a, since a calculated kobs (from k2
MD-Dand [3a]) under the conditions of the experiment in Fig. 13a is 0.0011 s-1, whereas kobs for the reaction of 3awith 1a is 0.10 s-1, a factor of 100 larger. This is consistent with the observation that reaction of 3a was firstorder in 1a (competitive disproportionation of 3a would result in a lower order in 1a). On the other hand,for the deuterated substrate d-1a, which is 1/40 as reactive as 1a, the disproportionation starts to becomecompetitive at the lowest concentration of d-1a (kobs = 2.6 A10-4 s-1 for disappearance of 3a, Fig. S-15a), butcontributes at most 20%-30% to the rate. Second order disproportionation may be in part responsible for thelower order in acetylene (0.7) found for the deuterated substrate. It cannot be entirely responsible, since asignificant contribution from Eq. 5 does not provide a satisfactory fitting of the experimental and simulatedrate plots for Fig. S-15a.
Figure S-16. A solution of lithium (trimethylsilyl)acetylide (0.2 mL, 0.22 M in THF) was injected into a0.022 M solution of n-BuLi in 4 mL of 1:3 THF/Me2O at -129.3 °C. k2
D-MD was determined by kineticsimulation of initial rates.
S-32
0 1000 2000 3000 4000 5000 6000 7000t / s
0.0
10.0
20.0
30.0
40.0
[H-C≡C-SPh] = 0.23 M[n-BuLi] = 0.05 Mk2
T-1c = 1.5 10-3 M-1s-1
k1T = 3.5 10-4 s-1
T = -128 °C
0 1000 2000 3000 4000 5000 6000 7000t / s
0
10
20
30
40
Con
cent
ratio
n / m
M
[H-C≡CSPh] = 0.06 M[n-BuLi] = 0.05 Mk2
T-1c = 1.0 10-3 M-1*s-1
k1T = 3.5 10-4 s-1
T = -128.5 °C
0 1000 2000 3000 4000 5000 6000 7000t / s
0.0
10.0
20.0
30.0
40.0
[H-C≡CSPh] = 0.75 M[n-BuLi] = 0.05 Mk2
T-1c = 1.5 10-3 M-1s-1
k1T = 3.5 10-4 s-1
T = -128.5 °C
0 1000 2000 3000 4000 5000 6000 7000t / s
0.0
10.0
20.0
30.0
40.0
Con
cent
ratio
n / m
M
[H-C≡CSPh] = 0.59 M[n-BuLi] = 0.05 Mk2
T1-c = 1.1 10-3 M-1s-1
k1T = 3.5 10-4 s-1
T = -129.5 °C
H SPh Li SPh1:3 THF/Me2O, -129 °C 2
Inject: 0.08 mL n-BuLi
4c
(n-BuLi)2(n-BuLi)4(Li-C≡C-SPh)2
Legend
4c
(n-BuLi)4
Reactivity of (n-BuLi)4 with (Phenylthio)acetylene (1c). n-BuLi (0.08 mL, 2.5 M/hexanes) wasinjected into a solution of (phenylthio)acetylene (0.06-0.75 M) in 4 mL of 1:3 THF/Me2O at ca -129 °C (Fig.S-17). The initial concentration of acetylene was determined using tris(trimethylsilyl)methane as an internalconcentration standard (in addition to its use as a shift thermometer [S-9]). Since these are “inverse mode”injections (section S1, Fig. S-7), neither the dimer nor the mixed dimer build up observably. For thesimulation, k2
D-1c and k2MD-1c were both set to an arbitrary large number ($5 M-1 s-1). The rate constant used
for dissociation of the tetramer to the dimer (k1T) was based upon experiments with other acetylenes where
dissociation was shown to be the rate limiting step.
Figure S-17. Time vs. concentration plots and kinetic simulations for 0.08 mL injections of n-BuLi (2.5M hexanes) into varying concentrations of (phenylthio)acetylene in 4 mL of 1:3 THF/Me2O at ca -129 °C.The value of k2
T-1c = 1.3@10-3 M-1 s-1 reported in the main body of the paper is an average of the four trials.
S-33
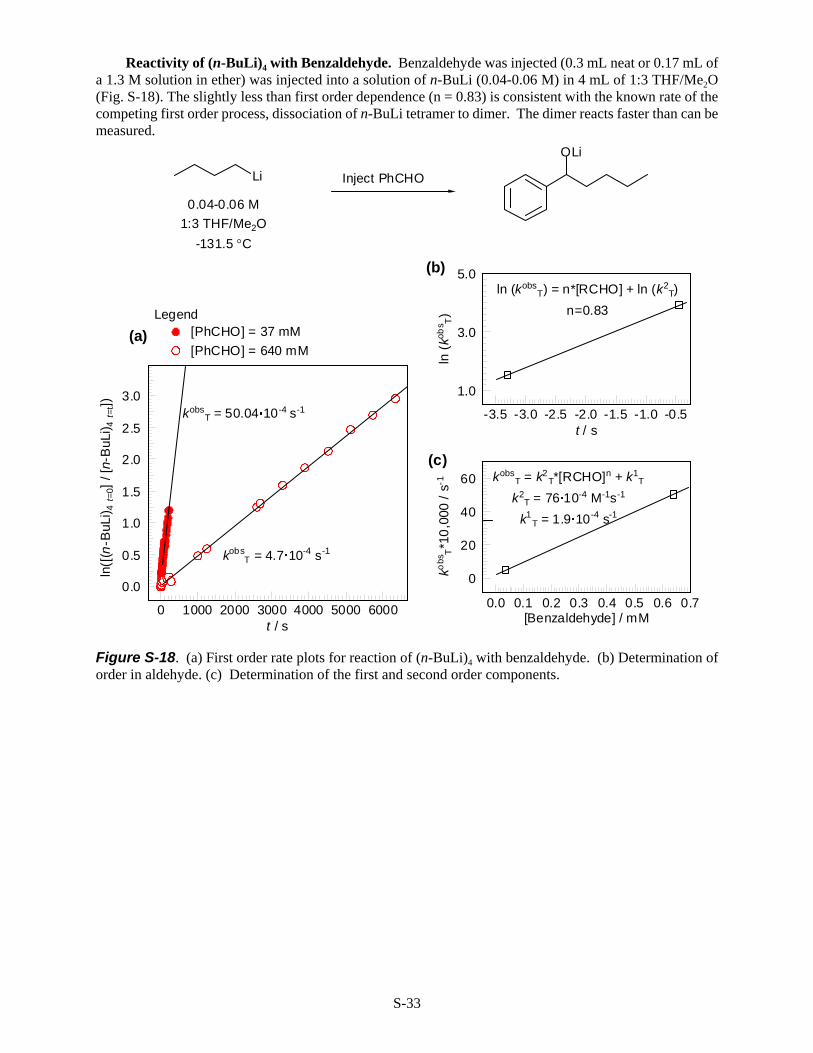
Reactivity of (n-BuLi)4 with Benzaldehyde. Benzaldehyde was injected (0.3 mL neat or 0.17 mL ofa 1.3 M solution in ether) was injected into a solution of n-BuLi (0.04-0.06 M) in 4 mL of 1:3 THF/Me2O(Fig. S-18). The slightly less than first order dependence (n = 0.83) is consistent with the known rate of thecompeting first order process, dissociation of n-BuLi tetramer to dimer. The dimer reacts faster than can bemeasured.
Figure S-18. (a) First order rate plots for reaction of (n-BuLi)4 with benzaldehyde. (b) Determination oforder in aldehyde. (c) Determination of the first and second order components.
0 1000 2000 3000 4000 5000 6000t / s
0.0
0.5
1.0
1.5
2.0
2.5
3.0
ln([
(n-B
uLi) 4
t=0]
/ [n
-BuL
i) 4 t=
t]) kobsT = 50.04 10-4 s-1
Inject PhCHO
0.04-0.06 M1:3 THF/Me2O
-131.5 °C
OLi
[PhCHO] = 640 mM
kobsT = 4.7 10-4 s-1
[PhCHO] = 37 mM(a)
(b)
(c)
Legend
-3.5 -3.0 -2.5 -2.0 -1.5 -1.0 -0.5t / s
1.0
3.0
5.0
ln (
kobs T)
0.0 0.1 0.2 0.3 0.4 0.5 0.6 0.7[Benzaldehyde] / mM
0
20
40
60
kobs
T*1
0,00
0 / s
-1 kobsT = k2
T*[RCHO]n + k1T
k2T = 76 10-4 M-1s-1
k1T = 1.9 10-4 s-1
ln (kobsT) = n*[RCHO] + ln (k2
T)n=0.83
Li
S-34
Et2N
H
O
0.4 mLin 4:1 THF/ether
1.8 - 6.3 M
OLi
Et2N
Li
60 mM1:3 THF/Me2O
-127.5 °C
k1T = 4.0 10-4 s-1 k1
T = 3.9 10-4 s-1
[RCHO] = 0.180 M [RCHO] = 0.06 M(a) (b)
0 500 1000 1500 2000 2500 3000t / s
0.0
0.5
1.0
1.5
2.0
ln ([
T]0 /
[T])
0 500 1000 1500 2000 2500 3000t / s
0.0
0.5
1.0
1.5
2.0
ln ([
T]0 /
[T])
Reactivity of (nBuLi)4 with p-Diethylaminobenzaldehyde. p-Diethylaminobenzaldehyde (Fig. S-19(a) 1.8 M in 3:2 THF/Et2O and (b) 6.3 M in 4:1 THF/Et2O) was injected into a solution of n-BuLi (0.08 M)in 4 mL of 1:3 THF/Me2O at -127.5 °C.
Figure S-19. First order plots of the reaction of (n-BuLi)4 with p-diethylaminobenzaldehyde.
S-35
Reactivity of 2-Methoxy-6-(methoxymethyl)phenyllithium with d-1a and 1d. d-(Trimethylsilyl)acetylene was injected (0.1 mL) as a solution in 1:1 THF/ether (0.5 M or 2 M) into a 0.01 Msolution of 5 in 3:2 THF/ether at -128 °C. A kobs
M-d-1a for two runs was determined based on the method ofinitial rates. A plot of [d-1a] vs. kobs
M-d-1a gave an estimated k2M-d-1a = 0.61 M-1 s-1, while ln[d-1a] vs.
ln(kobsM-d-1a) indicated the reaction is within error of first order in acetylene (Fig. S-20).
Figure S-20. The reaction of 0.01 M 5 with 0.01 M and 0.05 M d-1a in 3:2 THF/ether at -128 °C. (a)RINMR stacked plot for injection of d-1a into a solution of 5. (b) Raw rate plots for two concentrations ofd-1a. (c) Initial rate plot vs concentration. (d) Ln-ln plot to determine order in d-1a.
A solution of (p-tolylsulfonyl)acetylene (0.2 mL, 1.9 M in 5:3 THF/ether or 5.7 M in THF) was injectedinto 3 mL of a 0.04 M solution of 5 in 3:2 THF/ether at -127 °C. The rate of tetramer reacting with 1d wasindependent of the concentration of acetylene (k1
T = 2.2 A 10-5 s-1) indicating the tetramer must first dissociatebefore reacting (Fig. S-21).
O
Li
5
D SiMe3Li SiMe3
O
4 2 0ppm
0
8.5
33.4
75
128
220
403
568Time / s
(d-1a)
(ArLi)2 (ArLi)(ArLi)4
4a7Li
kobsM-d-1a = 0.0089 s-1
0 100 200 300 400 500 600t / s
0
4
8
12
16
Con
cnet
ratio
n / m
M
Legend ACJ8111 Mon/Dim [D-C≡C-SiMe3] = 62 mM
kobsM-d-1a = 0.039 s-1
2
[d-1a] = 0.01 M
3:2 THF/Et2O, -128 °C
0.00 0.02 0.04 0.06 0.08[d-1a]
0.000
0.020
0.040
0.060
kobs M
-d -1
a
-4.8 -4.4 -4.0 -3.6 -3.2 -2.8ln [d-1a]
-5.0
-4.6
-4.2
-3.8
-3.4
ln (k
obs M
-d -1
a)
k2M = 0.42 M-1*s-1
kobsM-d-1a = k2
M-d-1a*[d-1a]n
k2M-d-1a = 0.61
ln (kobsM) = n*ln [d-1a] + ln (k2
M)n=0.84
(a) (b)
(c) (d)
4a
S-36
Figure S-21. (a) Injection of 5.7 M solution of 1d in 5:3 THF/ether (0.23 mL, 0.41 M in situ) into a solutionof 5 (0.04 M) in 3:2 THF/ether at -127 °C. (b) & (c) Kinetic plots of tetramer disappearance for twoconcentrations of 1d, showing reaction is zero order in acetylene (k2
T. < 5.1 A10-5 M-1 s-1). Concentrations are
adjusted to reflect the about of 1d remaining after the monomer and dimer react.
O
Li
H SO2Tol-pLi SO2Tol-p
O
0 2000 4000 6000 8000 1000012000t / s
0.0
0.1
0.2
ln (T
et0/
Tet t)
k1T = 2.1 x 10⁻⁵ s-1
1d
0 2000 4000 6000 8000 10000t / s
0.0
0.1
0.2
ln (T
et0/T
ett)
k1T = 2.3 x 10⁻⁵ s-1
4 3 2 1 0 -1ppm
11,823
2,689
77
9
0.6
0
Time / s
(ArLi)2 (ArLi)(ArLi)4
4d
4d
[1d] = 0.39 M
7Li
[1d] = 0.39 M
[1d] = 0.1 M
5(a) (b)
(c)
5T
S-37
S8. References Supporting Information
[S-1] (a) McGarrity, J. F.; Prodolliet, J.; Smyth, T. Org. Mag. Res. 1981, 17, 59-65. (b) McGarrity,J. F.; Ogle, C. A.; Brich, Z.; Loosli, H. R. J. Am. Chem. Soc. 1985, 107, 1810-1815.
[S-2] (a) Schleyer, P. v. R.; Bauer, W. in: V. Snieckus (Ed.), Advances in Carbanion Chemistry, Vol1, Jai Press, Greenwich, CT, 1992, p. 89 f. The RINMR device description in this review article can be foundp. 108 f. Bauer, W. Analyse 1986, 17 (Kontron Co., Munich, Germany). (b) Bauer, W.; Winchester, W. R.;Schleyer, P. v. R. Organometallics 1987, 6, 2371-2379.
[S-3] Reetz, M. T.; Raguse, B.; Marth, C. F.; Huegel, H. M.; Bach, T.; Fox, D. N. A. Tetrahedron,1992, 48, 5731-5742.
[S-4] Palmer, C. A.; Ogle, C. A.; Arnett, E. M. J. Am. Chem. Soc. 1992, 114, 5619-5625. [S-5] Geletneky, C.; Foersterling, F. H.; Bock, W.; Berger, S. Chem. Ber. 1993, 126, 2397-2401. [S-6] Denmark, S. E.; Pham, S. M. Helv. Chim. Acta 2000, 83, 1846-1853.[S-7] Bertz, S. H.; Carlin, C. M.; Deadwyler, D. A.; Murphy, M. D.; Ogle, C. A.; Seagle, P. H. J. Am.
Chem. Soc. 2002, 124, 13650-13651.[S-8] Mok, K. H.; Nagashima, T.; Day, I. J.; Jones, J. A.; Jones, C. J. V.; Dobson, C. M.; Hore, P. J.
J. Am. Chem. Soc. 2003, 125, 12484-12492.[S-9] All temperatures were measured internally using our 13C NMR spectrosopic chemical shift
thermometer, tris(trimethylsilyl)methane: Sikorski, W.S.; Sanders, A.W.; Reich, H. J. Magn. Resonan.Chem. 1998, 36, S118-S124.
[S-10] Watson, S. C.; Eastham, J. F. J. Organomet. Chem. 1967, 9, 165-168.[S-11] Herunsalee, A.; Isobe, M.; Goto, T. Tetrahedron, 1991, 47, 3727-3736.[S-12] Makosza, M.; Chesnokov, Alexey A. Tetrahedron 2003, 59, 1995-2000.[S-13] Yamabe, H.; Mizuno, A.; Hiroyuki, K.; Nobuharu, I. J. Am. Chem. Soc, 2005, 127, 3248-3249.[S-14] (a) Haessig, R.; Seebach, D. Helv. Chim. Act. 1983, 66, 2269-2273. (b) Heinzer, J.; Oth, J. F.
M.; Seebach, D. Helv. Chim. Acta 1985, 68, 1848-1862. [S-15] (a) Fraenkel, G.; Pramanik, P. J. Chem. Soc., Chem. Commun. 1983, 1527. (b) Fraenkel, G.
Polym. Prep., Am. Chem. Soc. Div. Polym. Chem. 1986, 27, 132-133.[S-16] (a) Thompson, A.; Corley, E. G.; Huntington, M. F.; Grabowski, E. J. J.; Remenar, J. F.; Collum,
D. B. J. Am. Chem. Soc., 1998, 2028-2038. (b) Chadwick, S. T.; Rennels, R. A.; Rutherford, J. L.; Collum,D. B. J. Am. Chem. Soc. 2000, 122, 8640-8647.
[S-17] Eaborn, C.; Skinner, G. A.; Walton, D. R. M. J. Chem. Soc. B. 1966, 989-990. [S-18] Kresge, A. J.; Pruszynski, P.; Stang, P. J.; Williamson, B. L. J. Org. Chem. 1991, 56, 4808-4811.
[S-19] Gareyev, R.; Streitwieser, A. J. Org. Chem. 1996, 61, 1742-1747. [S-20] Tanaka, Y.; Arakawa, M.; Yamaguchi, Y.; Hori, C.; Ueno, M.; Tanaka, T.; Imahori, T.; Kondo,
Y. Chem. Asian J. 2006, 1, 581-585.[S-21] Grotjahn, D. B.; Apponi, A. J.; Brewster, M. A.; Xin, J.; Ziurys, L.M. Angew. Chem. Int. Ed.