AmBank Group Presentation Invest Malaysia 2009, Kuala Lumpur 30 June 2009 Ashok Ramamurthy Ashok Ramamurthy Deputy Group Managing Director and Group Chief Financial Officer AMMB Holdings Berhad
Transcript
AmBank GroupPresentationInvest Malaysia 2009, Kuala Lumpur30 June 2009
Ashok RamamurthyAshok RamamurthyDeputy Group Managing Director and Group Chief Financial Officer
AMMB Holdings Berhad
Agenda
Table of ContentsTable of Contents
1300 80 8888 (Domestic)(603) 2178 8888 (Overseas)
Introduction Structure & Strategy
Financial Year 31
March 2009 (FY2009)
Outlook
(FY2009)
Pages : 3 4 – 7 8 – 18 19 - 23
2
AmBank Group – a 30+ journey
70s 80s 90s 2000s
1988
AMMB the first merchant bank listed on KLSE
2005
Privatization of AMFB Holdings Berhad
AmInvestment Group Berhad (AIGB) listed
M f A B k d A Fi A B k
70s 80s 90s 2000s
1975
Arab- Malaysian Development Bank Berhad was incorporated
KLSE
1989
Arab-Malaysian Property Trust the first property trust to list on KLSE
Merger of AmBank and AmFinance : AmBank (M) Berhad
2006
IAG Limited, Australia acquired 30% equity in AmAssurance Berhad
1977
Acquired 70% of Arab-Malaysian Finance Berhad (AMFB)
1983Established Arab Malaysian Credit
1991
Incorporation of AMMB Holdings Berhad as holding company
AMFB, Group’s finance company, listed.
Listed AmFIRST REIT on Bursa
AmIslamic Bank commenced operations
Asset Size Today RM89.9 bil
1994
Established Arab-Malaysian Credit Berhad
1984
2007
Entry of Australia and New Zealand
89 9 b
Acquired commercial banking (Security Pacific Asian Bank Limited)
1986
Acquired stockbroking firm Kris
2001AMFB acquired MBF Finance Berhad
1984
Acquired Arab-Malaysian Insurance Berhad 2008
Privatisation of AIGB, becoming a wholly owned subsidiary of AHB
Entry of Australia and New Zealand Banking Group Limited as strategic partner and major investor
3
Acquired stockbroking firm, Kris Securities Sdn Bhd, (renamed to AmSecurities Sdn Bhd)
2002
Merger of AMFB and MBf Finance Berhad
Establishment of AmG Insurance Berhad
Investment Retail Business Islamic
Significant positions in major business
Investment Banking
Retail Banking
Business Banking Assurance Islamic
Banking
Stay relevant & t t k t h
Leverage on existing Focus on profitability T b th t 3
• General insurance business of a local insurance company
• Stake in Islamic insurance business
Bumiputera Special Issue Shares:
96 3 illi di h t b i d
5
• 96.3 million new ordinary shares to be issued to eligible existing Bumiputera shareholders
• In progress of confirming participations and Bumiputera status
• On 18 May 2007, the strategic partnership of AHB and ANZ commenced
ANZ’s Asian presence and aspirations: a significant advantage to AHB
• ANZ is the only Australian bank to have been in the Asian region for 40 years, with strategic banking partnerships across 7 countries
• AmBank is ANZ’s single largest investment in Asia, with a total investment of US$696 million• This is equivalent to 51% of total investments to date
+China
Vi t
Laos+ Vietnam
Cambodia
Malaysia
Philippines
ANZ has provided key resources and support to AmBankIndonesia
DirectorDr. Robert John Edgar
BoardDirector
Alex Thursby
Senior Management
Group CFO & Deputy Group MD
Ashok Ramamurthy
Chief Risk OfficerAndrew Kerr
Chief Operating OfficerTBC
DirectorMark Whelan
Management Ashok RamamurthyHead of Retail Distribution &
DepositsBrad Gravell
ManagementHead of FX & Derivatives Steve Kelly
Head of Capital & Balance Sheet Management
Neville Mallard
Program Director –
Credit Risk / Portfolio Mgt
Glenn Saunders
P j t Di t
Head of Market Risk Jonathan Manifold
Head of RiskHead of Systems
6
ANZ is committed to AmBank’s long-term success and aspirations
Program Director Retail CoF
Christopher Shields
Project DirectorMark Lockhart
Head of Risk Infrastructure
Chung Fui Ken
yAccountingIgnatius Lim
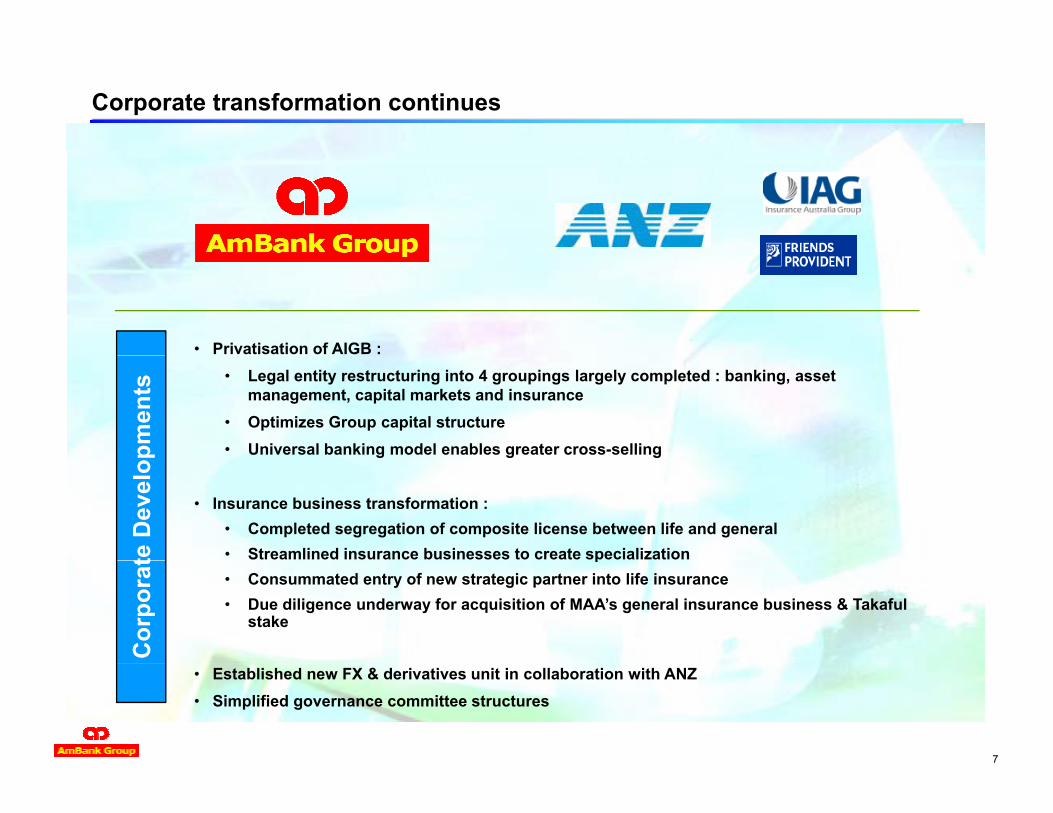
Corporate transformation continues
• Privatisation of AIGB :
pmen
ts • Legal entity restructuring into 4 groupings largely completed : banking, asset management, capital markets and insurance
• Optimizes Group capital structure• Universal banking model enables greater cross-selling
te D
evel
o
• Insurance business transformation :• Completed segregation of composite license between life and general • Streamlined insurance businesses to create specialization
Cor
pora
t p• Consummated entry of new strategic partner into life insurance• Due diligence underway for acquisition of MAA’s general insurance business & Takaful
stake
7
• Established new FX & derivatives unit in collaboration with ANZ• Simplified governance committee structures
41.0 43.6 49.3 53.5 56.9 59.7
Loans growth focused on viable and diversified segmentsGroup, Gross Loans
40
60(before Cagamas) : RM’bil
20
02004 2005 2006 2007 2008 2009
Financial year ended 31 March
Gross Loan movement (before netting Islamic financing sold to Cagamas)
Retail Business / Corporate By TypeLoan Composition %
40 5% 20 8% 3 7% 1 5% 1 7% 3 4% 16 7% 8 5% 3 0%
24.2
1.2%
10.0
19.5%
65.9%
2.3%
Individuals
Others
40.5% 20.8% 3.7% 1.5% 1.7% 3.4% 16.7% 8.5% 3.0%
23.9
12.0
12.4
2.2 2.1
3.1%
4.6%16.4%
16.3%15.3%
8.4
3.7
5.0
2.8
35.6%
34.9%
21.2%
10.6%
Business
SME
8
2.1 0.7 1.2 1.8
2.2 0.9
2.1
Auto Financing
Mortgage Asset Financing
Credit Cards LOC Co-Op
RM'bil Mar'09 Mar' 08
1.8
Business Banking (ex
GLR)
Relationship Banking & Regional Business
GLR + ILR Mar 09
Business1.0
Note :1 Group, Net Income and PATMI based on respective years’ financial statements; FY2008 based on FY2009 financial statements (comparative)
Improving trends on NPL & coverage
Asset Quality Indicators
8
12Asset Quality Indicators
39.3%32.2% 36.7%
56.6%67.3% 75.1% Loan Loss Coverage
20%
60%FY09 / 08 change :Loan loss coverage 7.8%
46.1
7.6
6.15.5
3.62.44.3
5.84.6
3 2
-20%
20%
-RM'bil Net NPL Gross NPL
%
3.22.0 1.5
-60%
17 4%20%
FY 2004 FY 2005 FY 2006 FY 2007 FY 2008 FY 2009
FY09 / 08 change :
10.9%
13.8%
9.6%
14.8%
17.4%
12.4%
10.4%10%
15%
FY09 / 08 change :Gross NPL ratio 2.2%Net NPL ratio 1.1%Net Provisions charge 0.4%
2.6%4.1%
0.6%
3.7%
6.2% 6.3%
1.0%
3.2%1.7%1.9%2.2%
0%
5%Gross NPL ratio
Net NPL ratio
Net Provisions Charge
9
Trend on NPL ratios, loan loss coverage and net provisions charge improved year-on-year Contributed by proactive collections activities & tightened risk assessment led by experienced teamBetter positioned for 2009 / 2010 credit & economic challenges
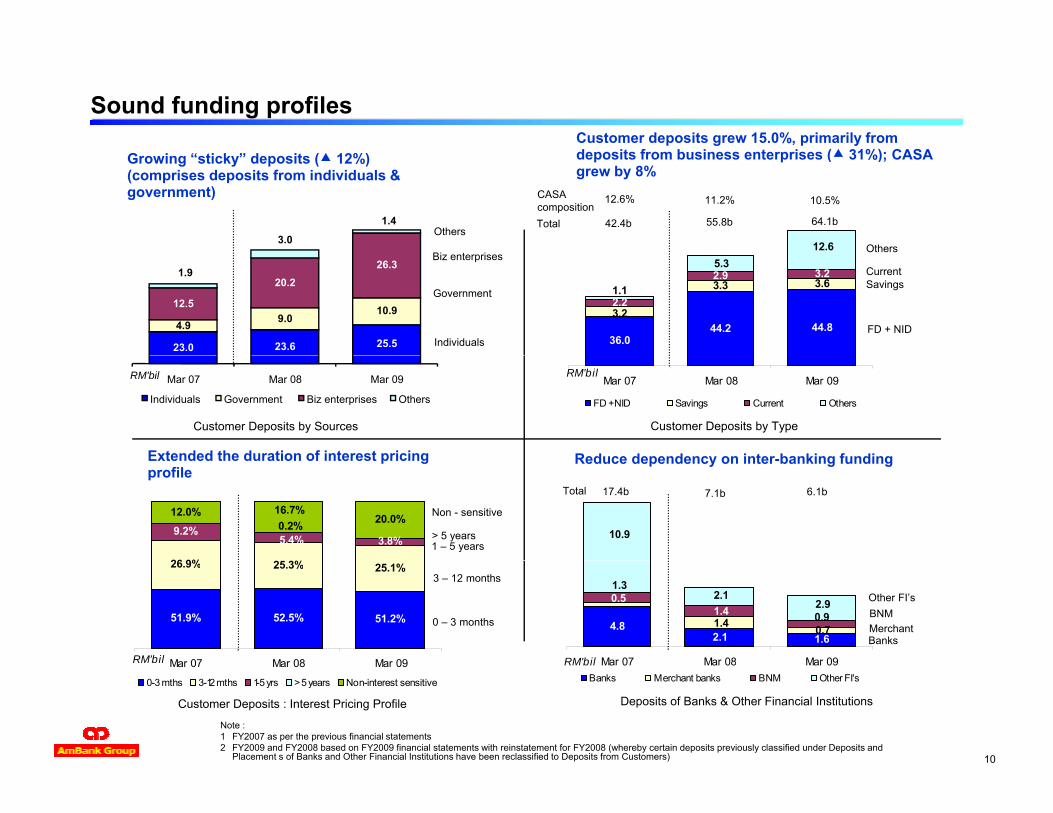
Sound funding profilesCustomer deposits grew 15.0%, primarily from d it f b i t i ( 31%) CASA
12.6
1.4
3.0
deposits from business enterprises ( 31%); CASA grew by 8%
12.6% 11.2% 10.5%
Bi t i
OthersTotal 42.4b 55.8b 64.1b
CASAcomposition
Others
Growing “sticky” deposits ( 12%)(comprises deposits from individuals & government)
36.044.2 44.8
3.2
3.3 3.62.2
2.9 3.21.1
5.3
25.523.623.0
10.99.04.9
26.320.2
12.5
1.9
Individuals
Government
Biz enterprises
SavingsCurrent
FD + NID
Mar 07 Mar 08 Mar 09RM'bil
FD + NID Savings Current Others
Mar 07 Mar 08 Mar 09RM'bil
Individuals Government Biz enterprises Others
Customer Deposits by TypeCustomer Deposits by Sources
Extended the duration of interest pricing Reduce dependency on inter banking funding
10.9
26 9% %
9.2%5.4% 3.8%0.2%
12.0% 16.7%20.0%
17.4b 7.1b 6.1bTotal
1 – 5 years
Non - sensitive
Extended the duration of interest pricing profile
Reduce dependency on inter-banking funding
> 5 years
4.82.1 1.6
0.5
1.4 0.7
1.3
1.4 0.9
2.12.9
Mar 07 Mar 08 Mar 09RM'bil
51.9% 52.5% 51.2%
26.9% 25.3% 25.1%
Mar 07 Mar 08 Mar 09RM'bil
BanksMerchantBNMOther FI’s
0 – 3 months
3 – 12 months
Mar 07 Mar 08 Mar 09RM bilBanks Merchant banks BNM Other FI's
Deposits of Banks & Other Financial InstitutionsCustomer Deposits : Interest Pricing Profile
Note :1 FY2007 as per the previous financial statements2 FY2009 and FY2008 based on FY2009 financial statements with reinstatement for FY2008 (whereby certain deposits previously classified under Deposits and
Placement s of Banks and Other Financial Institutions have been reclassified to Deposits from Customers)
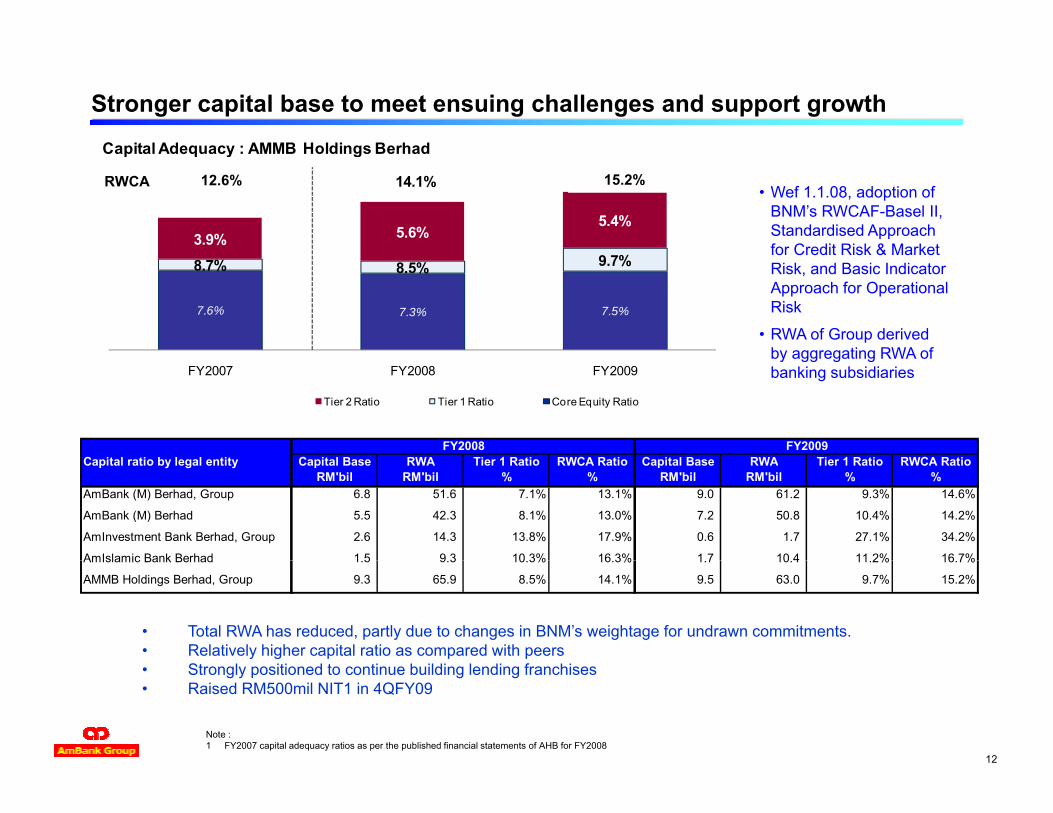
Note :1 FY2007 capital adequacy ratios as per the published financial statements of AHB for FY2008
• Strongly positioned to continue building lending franchises• Raised RM500mil NIT1 in 4QFY09
FY 2009 FINANCIAL PERFORMANCE
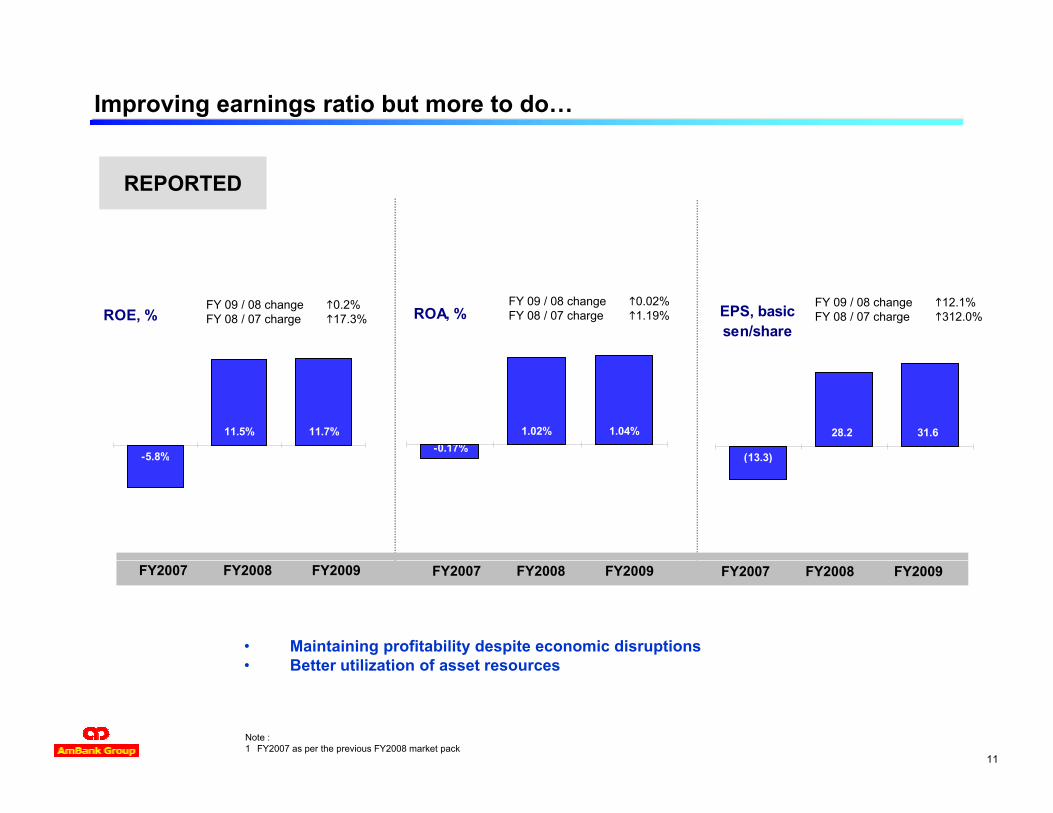
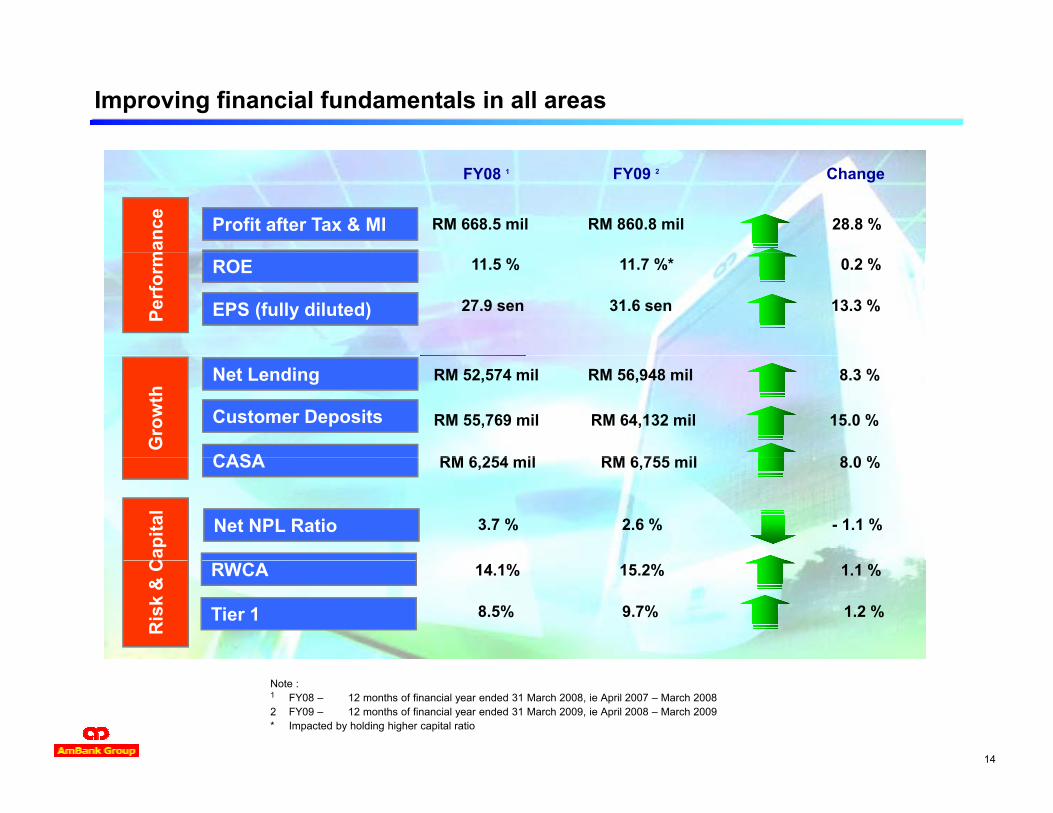
Improving financial fundamentals in all areas
FY09 2 Change FY08 1m
ance Profit after Tax & MI RM 668.5 mil RM 860.8 mil 28.8 %
Perf
orm ROE 11.5 % 11.7 %* 0.2 %
EPS (fully diluted) 27.9 sen 31.6 sen 13.3 %
Gro
wth
Net Lending RM 52,574 mil RM 56,948 mil 8.3 %
Customer Deposits RM 55,769 mil RM 64,132 mil 15.0 %
CASA RM 6 254 il RM 6 755 il 8 0 %
Cap
ital
Net NPL Ratio 3.7 % 2.6 % - 1.1 %
CASA RM 6,254 mil RM 6,755 mil 8.0 %
Ris
k &
C RWCA 14.1% 15.2% 1.1 %
Tier 1 8.5% 9.7% 1.2 %
14
Note :1 FY08 – 12 months of financial year ended 31 March 2008, ie April 2007 – March 20082 FY09 – 12 months of financial year ended 31 March 2009, ie April 2008 – March 2009* Impacted by holding higher capital ratio
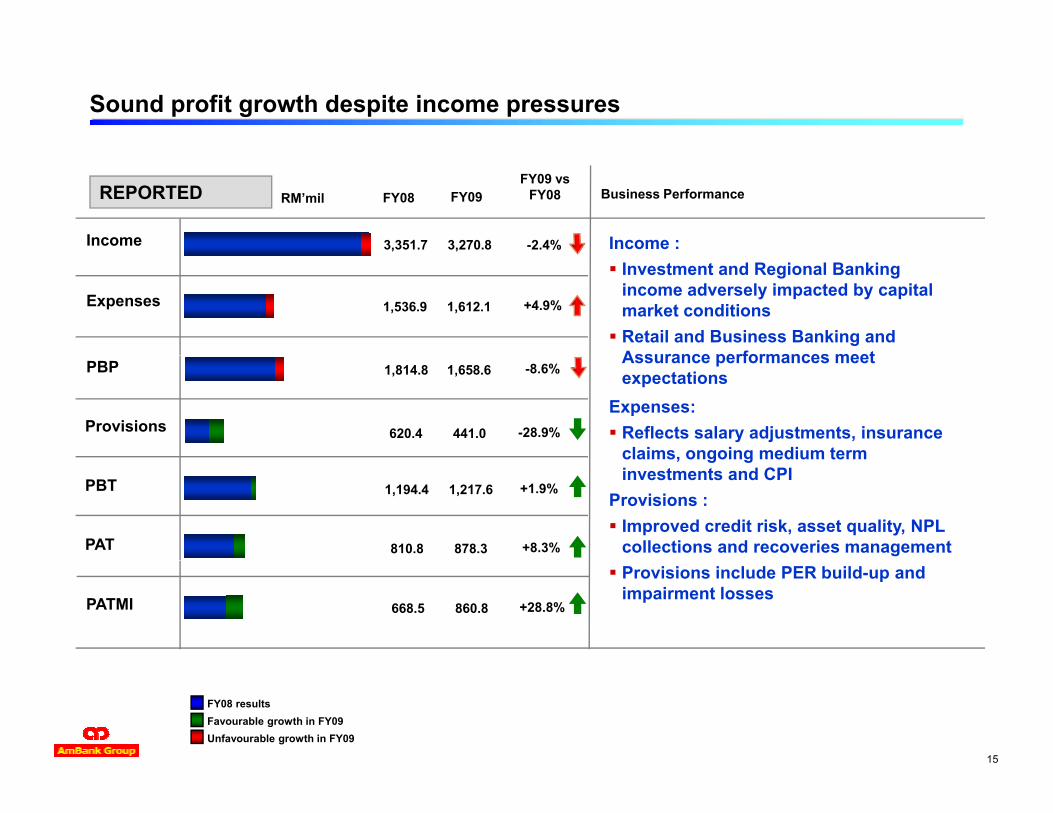
Sound profit growth despite income pressures
REPORTED
Income
RM’mil Business Performance
-2.4%3,270.83,351.7
FY09 vs FY08FY08
Income :
FY09
Expenses +4.9%1,612.11,536.9
Investment and Regional Banking income adversely impacted by capital market conditionsRetail and Business Banking and Assurance performances meetPBP
Provisions
-8.6%
-28.9%
1,658.61,814.8
441.0620.4
Assurance performances meet expectations
Expenses:Reflects salary adjustments, insurance claims, ongoing medium term
Note :Consensus as at 15 April 2009 (source : Bloomberg)Revenue is taken from consensus “Sales” estimate, PATMI taken from consensus “Net Income GAAP” estimate, EPS taken from consensus “EPS GAAP” estimate
Based on consensus as at 15 Apr 09. Earlier consensus for FY2009 indicated a larger positive variance to actual results.
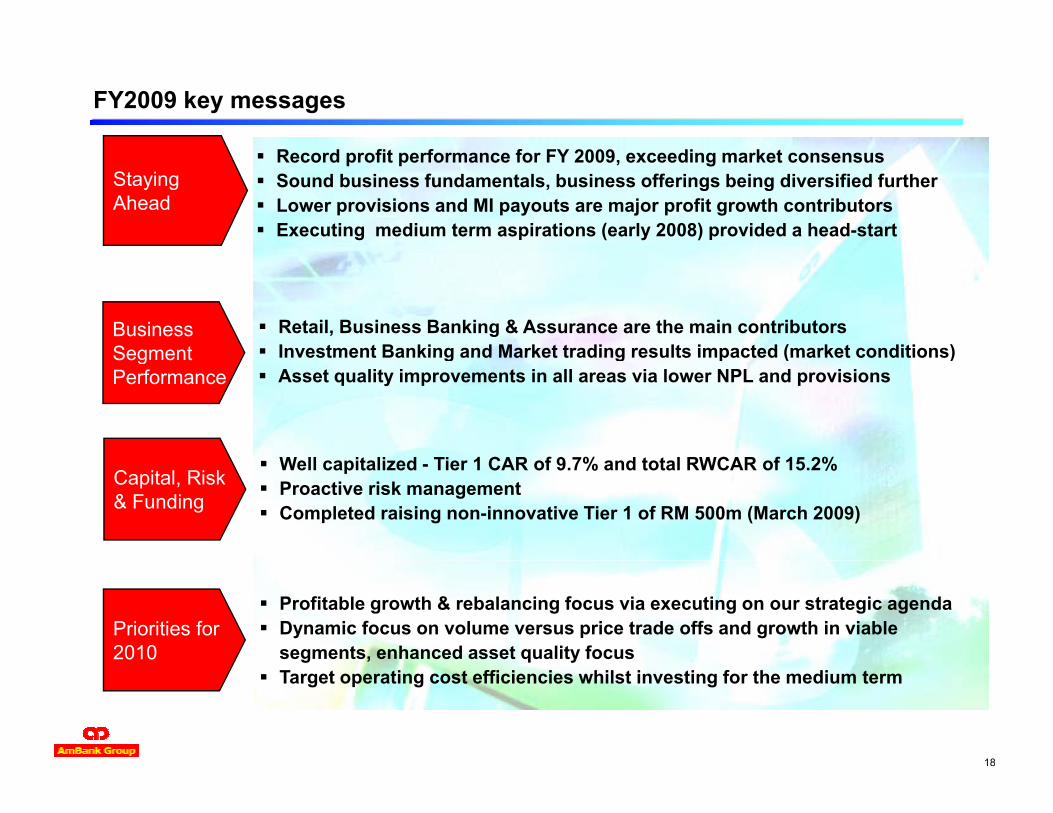
FY2009 key messages
R d fit f f FY 2009 di k tRecord profit performance for FY 2009, exceeding market consensusSound business fundamentals, business offerings being diversified furtherLower provisions and MI payouts are major profit growth contributorsExecuting medium term aspirations (early 2008) provided a head-start
Staying Ahead
Business Segment
Retail, Business Banking & Assurance are the main contributorsInvestment Banking and Market trading results impacted (market conditions)Segment
PerformanceInvestment Banking and Market trading results impacted (market conditions)Asset quality improvements in all areas via lower NPL and provisions
W ll it li d Ti 1 CAR f 9 7% d t t l RWCAR f 15 2%Capital, Risk & Funding
Well capitalized - Tier 1 CAR of 9.7% and total RWCAR of 15.2%Proactive risk management Completed raising non-innovative Tier 1 of RM 500m (March 2009)
Priorities for 2010
Profitable growth & rebalancing focus via executing on our strategic agendaDynamic focus on volume versus price trade offs and growth in viable segments, enhanced asset quality focus
18
Target operating cost efficiencies whilst investing for the medium term
What is ahead…
Global crisis will continue to have impacts on Malaysia (12-15 months)Global crisis will continue to have impacts on Malaysia (12 15 months)Valuable lessons have been learnt from the previous financial crisisBNM has commented that the banking system remains strong Growth in lending and risk weighted assets are set to slow downAsset quality will deteriorate & NPLs, whilst at historical lows, are set to increase
Industry :What is Ahead
q yBanks likely to proactively shore up their capital position, tighten lending criteria and strengthen risk management
Malaysia; Headroom to consider additional
Economy forecast to shrink in 09 but will grow c. 3.0% in CY10 (internal research)Fiscal spending of RM 67 billion (2009/10) expected to provide some shieldExternal sector contraction will be partly offset by domestic demandP t ti l i t f f th l i f th t li ipolicy options Potential exists for further loosening of the monetary policies
AMMB; Facing headwinds but sound
Executing to AHB’s strategic themes will provide greater resilienceEnhance risk and governance frameworksTougher economic conditions, despite disciplined execution, will delay achievement of medium term aspirations
19
ANZ, our strategic partner, is 1 of 11 AA rated banks in the world and listed as 1 of the 20 safest banks globally by Globe Finance Magazine, February 2009
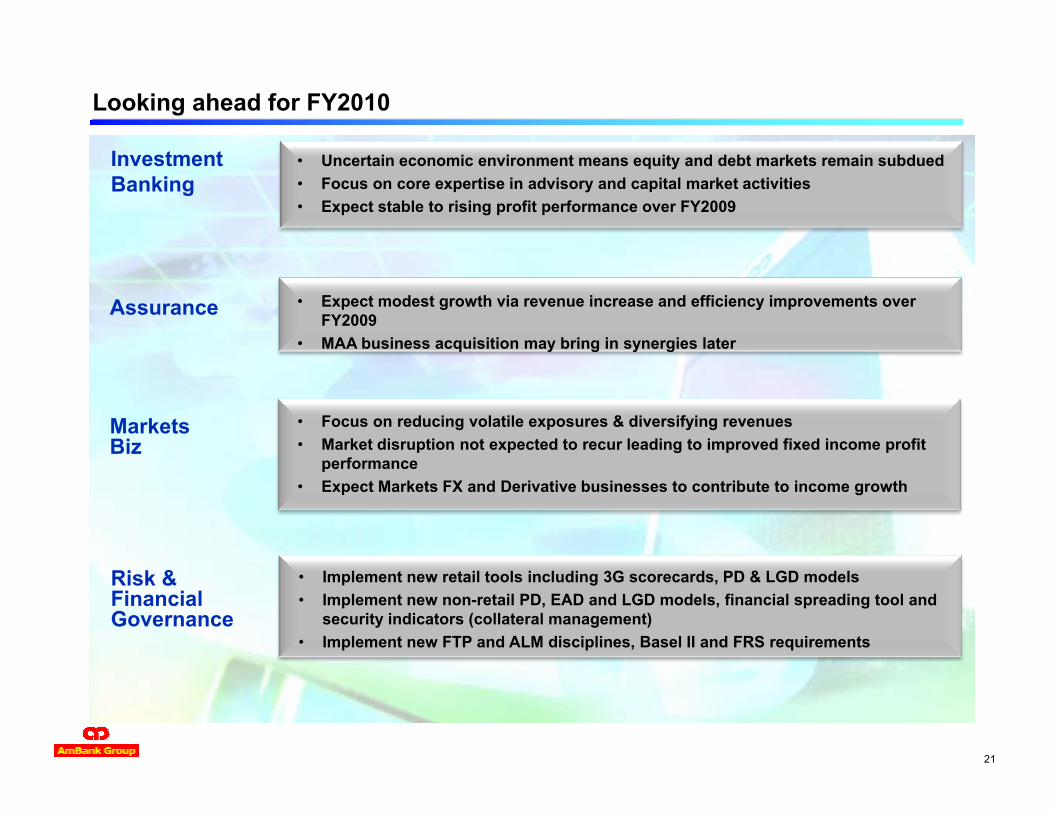
Looking ahead for FY2010
M i t i fit bl th & b l i f i ti t t i dOverall • Maintain profitable growth & rebalancing focus via executing on strategic agenda• Income diversification, cost management and enhanced risk disciplines are key
priorities for FY 2010• Position business for potential economic recovery towards mid FY2011
Retail• Maintain asset growth focus on profitable segments whilst growing deposits• Expect higher income growth from historical fixed income assets (under FTP)• Expect increased delinquencies & credit costs• Expect increased delinquencies & credit costs • Enhanced focus on risk management and collections• Expect minimal profit growth for FY2010
Business • Proactively manage existing accounts to mitigate higher risk of default• Focus on building a sustainable asset base targeted towards stronger industry
segments and with greater diversification• Enhance focus on deposits & transaction based fees • Expect rapid FY2009 profit growth to moderate in FY2010
Relationship & R i l Bi
• Deepen customer relationships to generate fee incomes & advisory mandatesE h f it l ffi i t b i th d l i i t fl t
20
Regional Biz • Enhance focus on capital efficient business growth and loan pricing to reflect economic risks
• Expect an improved profit performance over FY2009
Looking ahead for FY2010
Investment Banking
• Uncertain economic environment means equity and debt markets remain subdued• Focus on core expertise in advisory and capital market activities• Expect stable to rising profit performance over FY2009
Assurance • Expect modest growth via revenue increase and efficiency improvements over FY2009
• MAA business acquisition may bring in synergies later
Markets Biz
• Focus on reducing volatile exposures & diversifying revenues• Market disruption not expected to recur leading to improved fixed income profit
fperformance• Expect Markets FX and Derivative businesses to contribute to income growth
Risk & Financial Governance
• Implement new retail tools including 3G scorecards, PD & LGD models • Implement new non-retail PD, EAD and LGD models, financial spreading tool and
security indicators (collateral management)• Implement new FTP and ALM disciplines, Basel II and FRS requirements
21
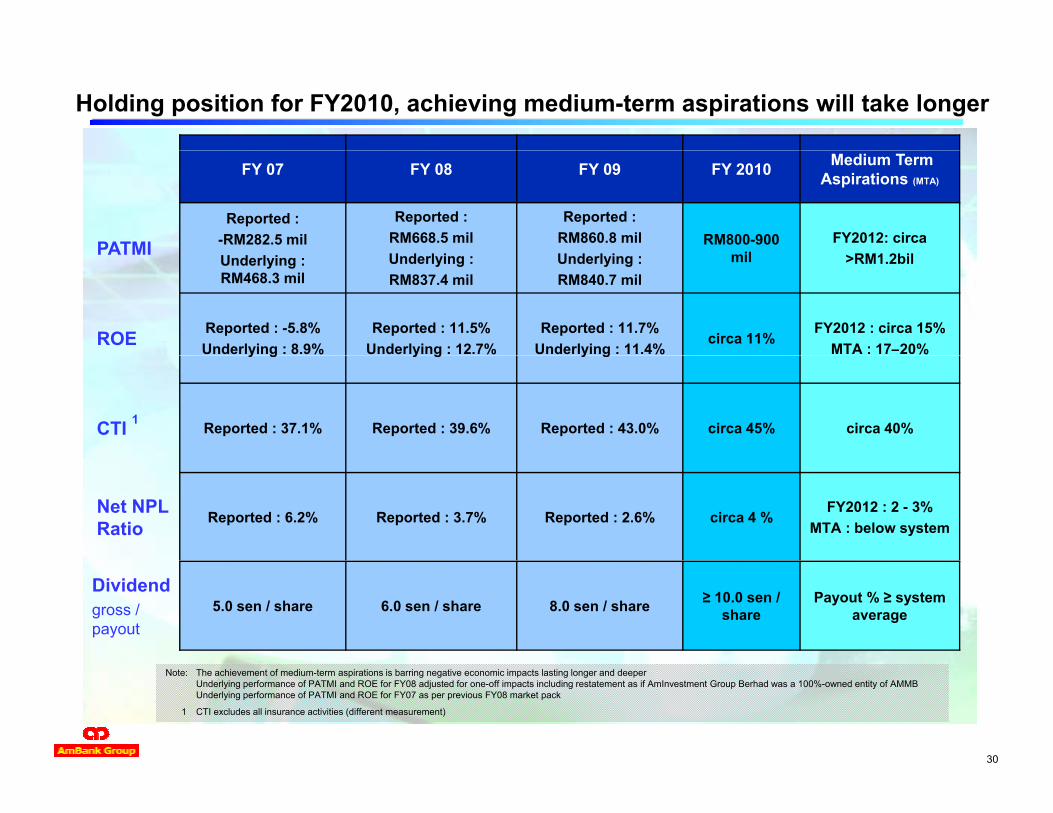
Holding position for FY2010, achieving medium-term aspirations will take longer
FY 07 FY 08 FY 09 FY 2010 Medium Term Aspirations (MTA)
PATMIReported :
-RM282.5 milReported :
RM668.5 milReported :
RM860.8 mil RM800-900 il
FY2012: circa PATMIUnderlying : RM468.3 mil
Underlying : RM837.4 mil
Underlying : RM840.7 mil
mil >RM1.2bil
ROE Reported : -5.8%Underlying : 8.9%
Reported : 11.5%Underlying : 12.7%
Reported : 11.7%Underlying : 11.4%
circa 11%FY2012 : circa 15%
MTA : 17–20%y g y g y g
CTI 1 Reported : 37.1% Reported : 39.6% Reported : 43.0% circa 45% circa 40%
Net NPL Ratio Reported : 6.2% Reported : 3.7% Reported : 2.6% circa 4 %
FY2012 : 2 - 3%MTA : below system
Dividendgross / payout
5.0 sen / share 6.0 sen / share 8.0 sen / share ≥ 10.0 sen / share
Payout % ≥ system average
30
Note: The achievement of medium-term aspirations is barring negative economic impacts lasting longer and deeperUnderlying performance of PATMI and ROE for FY08 adjusted for one-off impacts including restatement as if AmInvestment Group Berhad was a 100%-owned entity of AMMBUnderlying performance of PATMI and ROE for FY07 as per previous FY08 market pack
1 CTI excludes all insurance activities (different measurement)
Concluding remarks
Conclusion
1. Top 5 Banking Group with strong market and brand presence
2. Record FY09 performance exceeding consensus, testimony of the transformation underway to harness benefits from strategic partnerships
3. Well capitalized heading into tough FY10, remain committed on enhancing risk disciplines collections / restructuring activities & cost managementdisciplines, collections / restructuring activities & cost management
4. Executing to AHB’s medium term strategic themes around profitable growth and portfolio rebalancing, has provided a head-start advantage and will provide greater resilience over the current economic cycleresilience over the current economic cycle
5. AHB is well positioned to grow and be amongst the top-tiered banks in Malaysia
23
THANK YOUThe material in this presentation is general background information about AmBank Group’s
activities current at the date of the presentation. It is information given in summary form and does t t t b l t It i t i t d d t b li d d i t i t t ti lnot purport to be complete. It is not intended to be relied upon as advice to investors or potential
investors and does not take into account the investment objectives, financial situation or needs of any particular investor. These should be considered, with or without professional advice when
deciding if an investment is appropriate.
F f th i f ti i itFor further information, visit :
www.ambg.com.my
or contactH d G I t R l tiHead Group Investor Relations