43
Company No. 8515-D AmBank (M) Berhad Pillar 3 Disclosure As at 30 September 2016
Company No. 8515-D
AmBank (M) BerhadPillar 3 Disclosure
As at 30 September 2016
Company No. 8515-D
RWCAF - Pillar 3 Disclosure30 September 2016
Contents Page
1.0 Scope of Application 1
2.0 Capital Management 2
3.0 Capital Structure 7
4.0 General Risk Management 15
5.0 Credit Risk Management 16
6.0 Credit Risk Exposure under the Standardised Approach 28
7.0 Credit Risk Mitigation 34
8.0 Off Balance Sheet Exposures and Counterparty Credit Risk 36
9.0 Securitisation 39
10.0 Non-Traded Market Risk 41
11.0 Equities (Banking Book Positions) 41
12.0 Liquidity Risk and Funding Management 41
Company No. 8515-D
1
1.0 Scope of Application
Capital Adequacy Ratios
(a)(b)
The CCB requirements under transitional arrangements shall be phased in starting from 1 January 2016 as follows:
CCB0.625%
1.25%1.875%
2.5%
Frequency of Disclosure
Medium and Location of Disclosure
The Bank Negara Malaysia’s (“BNM”) Risk Weighted Capital Adequacy Framework - (Basel II) (“RWCAF”) - DisclosureRequirements ("Pillar 3") is applicable to all banking institutions licensed under the Financial Services Act 2013 (“FSA”). ThePillar 3 disclosure requirements aim to enhance transparency on the risk management practices and capital adequacy ofbanking institutions.
The following information has been provided in order to highlight the capital adequacy of the Group and the Bank. Theinformation provided has been verified by the Group internal auditors and certified by the Chief Executive Officer.
BNM guidelines on capital adequacy require regulated banking subsidiaries to maintain an adequate level of capital towithstand any losses which may result from credit and other risks associated with financing operations. Each of theseentities is independently held by AMMB Holdings Berhad ("AMMB") as a regulated banking institution - there are no cross-shareholdings within or between these entities.
With effect from 1 January 2016, pursuant to BNM's guidelines on Capital Adequacy Framework (Capital Components)issued on 13 October 2015, the minimum capital adequacy ratio to be maintained under the guidelines remained at 4.5% forCET1 capital, 6.0% for Tier 1 capital and 8% for total capital ratio. Banking institutions are also required to maintain capitalbuffers. The capital buffers shall comprise the sum of the following:
a Capital Conservation Buffer ("CCB") of 2.5%; anda Countercyclical Capital Buffer ("CCyB") determined as the weighted-average of the prevailing CCyB rates applied inthe jurisdictions in which the Bank has credit exposures.
Full disclosure requirements under the BNM guidelines are made on an annual and semi-annual basis except for disclosures under paragraph 10.1 of the guidelines and all qualitative disclosures which are made on an annual basis if there are nomaterial changes in the interim reporting period.
These Pillar 3 disclosure of the Group are available on the Group’s corporate website at www.ambankgroup.com.
The Group and the Bank has adopted the Standardised Approach for Credit and Market Risks and the Basic IndicatorApproach for Operational Risk, based on BNM’s Guidelines on Capital Adequacy Framework (Basel II - Risk WeightedAssets).
Calendar year 2016Calendar year 2017Calendar year 2018Calendar year 2019 onwards
The banking subsidiaries of AMMB Holdings Berhad ("AMMB") to which the RWCAF framework apply are AmBank (M)Berhad ("the Bank"), AmInvestment Bank Berhad ("AmInvestment") and AmBank Islamic Berhad ("AmBank Islamic") - whichoffers Islamic banking services.
Company No. 8515-D
2
1.1 Basis of Consolidation
2.0 Capital Management
The capital plan takes the following into account:
(a) Regulatory capital requirements:(b)
Equity accounted
Apart from regulatory requirements and statutory constraints, there is no current or foreseen material, practical or legalimpediments to the transfer of funds or regulatory capital within the Group.
Any such transfers would require the approval of the Board of Directors ("Board"), as well as the concurrence of BNM.
Capital requirement to support business growth, strategic objectives, buffer for material regulatory risks and stresstest results.
The capital and risk management of the banking subsidiaries of AMMB holdings berhad are managed collectively at Grouplevel. The Group’s capital management approach is driven by its desire to maintain a strong capital base to support thedevelopment of its businesses, to meet regulatory capital requirements at all times and to maintain good credit ratings.
Strategic, business and capital plans are drawn up annually covering a 3 year horizon and approved by the Board. Thecapital plan ensures that adequate levels of capital and an optimum mix of different components of capital are maintained bythe Group to support its strategy.
The Group uses internal models and other quantitative techniques in its internal risk and capital assessment. The modelshelp to estimate potential future losses arising from credit, market and other risks, and using regulatory formulae to simulatethe amount of capital required to support them. In addition, the models enable the Group to gain a deeper understanding ofits risk profile, e.g, by identifying potential concentrations, assessing the impact of portfolio management actions andperforming what-if analysis.
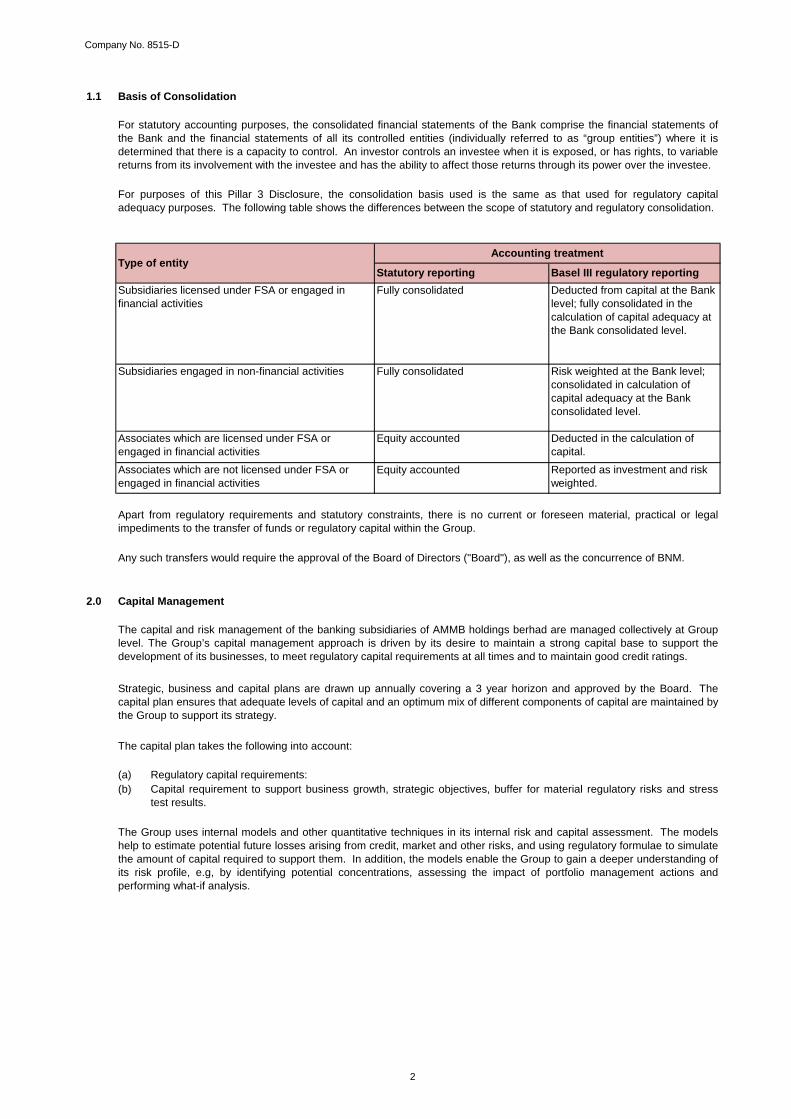
Deducted from capital at the Bank level; fully consolidated in the calculation of capital adequacy at the Bank consolidated level.
Risk weighted at the Bank level;consolidated in calculation of capital adequacy at the Bank consolidated level.
Deducted in the calculation of capital.Reported as investment and risk weighted.
Fully consolidated
Fully consolidated
Subsidiaries licensed under FSA or engaged in financial activities
Subsidiaries engaged in non-financial activities
Associates which are licensed under FSA or engaged in financial activitiesAssociates which are not licensed under FSA or engaged in financial activities
Equity accounted
For statutory accounting purposes, the consolidated financial statements of the Bank comprise the financial statements ofthe Bank and the financial statements of all its controlled entities (individually referred to as “group entities”) where it isdetermined that there is a capacity to control. An investor controls an investee when it is exposed, or has rights, to variablereturns from its involvement with the investee and has the ability to affect those returns through its power over the investee.
For purposes of this Pillar 3 Disclosure, the consolidation basis used is the same as that used for regulatory capitaladequacy purposes. The following table shows the differences between the scope of statutory and regulatory consolidation.
Accounting treatmentType of entity
Statutory reporting Basel III regulatory reporting
Company No. 8515-D
3
2.0 Capital Management (Cont'd.)
Stress testing and scenario analysis are used to ensure that the Group’s internal capital assessment considers the impact ofextreme but plausible scenarios on its risk profile and capital position. They provide an insight into the potential impact ofsignificant adverse events on the Group and how these events could be mitigated. The Group’s target capital levels are settaking into account its risk appetite and its risk profile under future expected and stressed economic scenarios.
The Group’s assessment of risk appetite is closely integrated with the Group’s strategy, business planning and capitalassessment processes, and is used to inform senior management’s views on the level of capital required to support theGroup’s business activities.
The Group uses a capital model to assess the capital demand for material risks, and support its internal capital adequacyassessment. Each material risk is assessed, relevant mitigants considered, and appropriate levels of capital determined.The capital modelling process is a key part of the Group’s management disciplines.
The capital that the Group is required to hold is determined by its statement of financial position, commitments andcontingencies, counterparty and other risk exposures after applying collateral and other mitigants, based on the Group’s riskrating methodologies and systems. BNM has the right to impose further capital requirements on Malaysian FinancialInstitutions.
The Group operates processes and controls to monitor and manage capital adequacy across the organisation. Capital ismaintained on the basis of the local regulator's requirement. It is overseen by the Group Asset and Liability Committee(“GALCO”). The GALCO is also responsible for managing the Group’s statement of financial position, capital and liquidity.
Company No. 8515-D
4
2.0 Capital Management (Cont'd.)
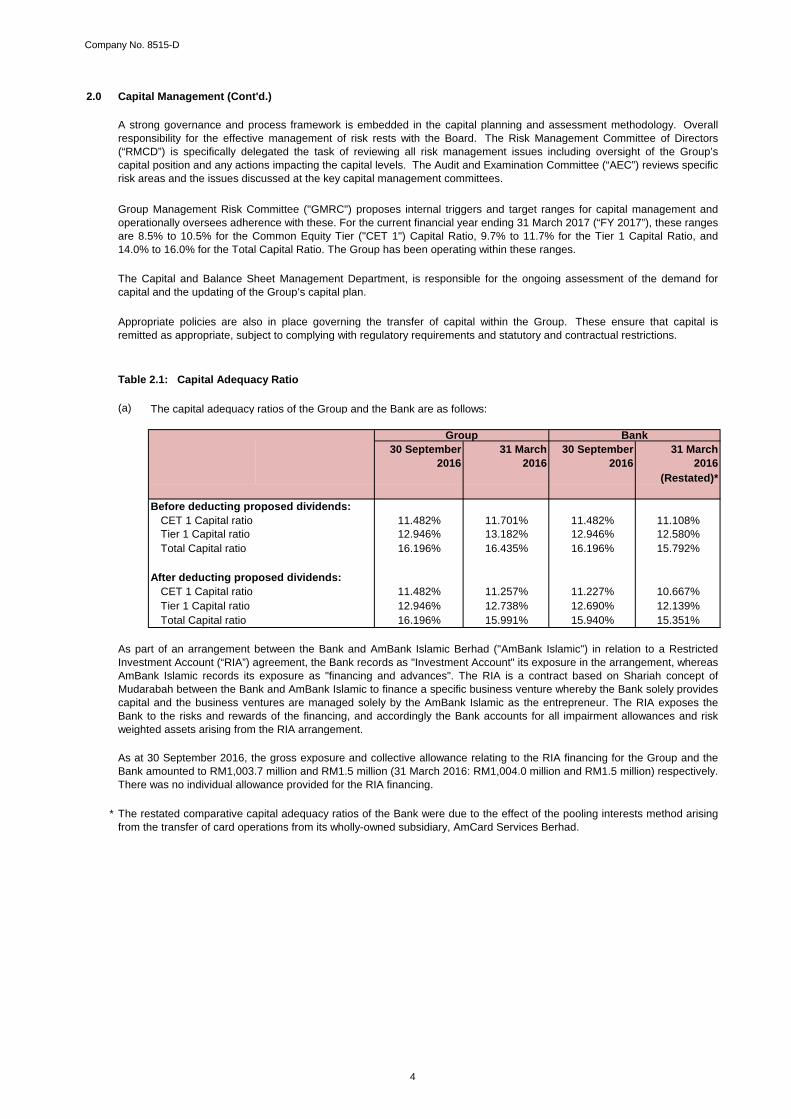
Table 2.1: Capital Adequacy Ratio
(a) The capital adequacy ratios of the Group and the Bank are as follows:
30 September2016
31 March2016
30 September2016
31 March2016
(Restated)*
Before deducting proposed dividends:CET 1 Capital ratio 11.482% 11.701% 11.482% 11.108%Tier 1 Capital ratio 12.946% 13.182% 12.946% 12.580%Total Capital ratio 16.196% 16.435% 16.196% 15.792%
After deducting proposed dividends:CET 1 Capital ratio 11.482% 11.257% 11.227% 10.667%Tier 1 Capital ratio 12.946% 12.738% 12.690% 12.139%Total Capital ratio 16.196% 15.991% 15.940% 15.351%
*
A strong governance and process framework is embedded in the capital planning and assessment methodology. Overallresponsibility for the effective management of risk rests with the Board. The Risk Management Committee of Directors(“RMCD”) is specifically delegated the task of reviewing all risk management issues including oversight of the Group’scapital position and any actions impacting the capital levels. The Audit and Examination Committee (“AEC”) reviews specificrisk areas and the issues discussed at the key capital management committees.
Group Management Risk Committee ("GMRC") proposes internal triggers and target ranges for capital management andoperationally oversees adherence with these. For the current financial year ending 31 March 2017 (“FY 2017”), these rangesare 8.5% to 10.5% for the Common Equity Tier ("CET 1") Capital Ratio, 9.7% to 11.7% for the Tier 1 Capital Ratio, and14.0% to 16.0% for the Total Capital Ratio. The Group has been operating within these ranges.
The Capital and Balance Sheet Management Department, is responsible for the ongoing assessment of the demand forcapital and the updating of the Group’s capital plan.
Appropriate policies are also in place governing the transfer of capital within the Group. These ensure that capital isremitted as appropriate, subject to complying with regulatory requirements and statutory and contractual restrictions.
Group Bank
As part of an arrangement between the Bank and AmBank Islamic Berhad ("AmBank Islamic") in relation to a RestrictedInvestment Account (“RIA”) agreement, the Bank records as "Investment Account" its exposure in the arrangement, whereasAmBank Islamic records its exposure as "financing and advances". The RIA is a contract based on Shariah concept ofMudarabah between the Bank and AmBank Islamic to finance a specific business venture whereby the Bank solely providescapital and the business ventures are managed solely by the AmBank Islamic as the entrepreneur. The RIA exposes theBank to the risks and rewards of the financing, and accordingly the Bank accounts for all impairment allowances and riskweighted assets arising from the RIA arrangement.
As at 30 September 2016, the gross exposure and collective allowance relating to the RIA financing for the Group and theBank amounted to RM1,003.7 million and RM1.5 million (31 March 2016: RM1,004.0 million and RM1.5 million) respectively.There was no individual allowance provided for the RIA financing.
The restated comparative capital adequacy ratios of the Bank were due to the effect of the pooling interests method arisingfrom the transfer of card operations from its wholly-owned subsidiary, AmCard Services Berhad.
Company No. 8515-D
5
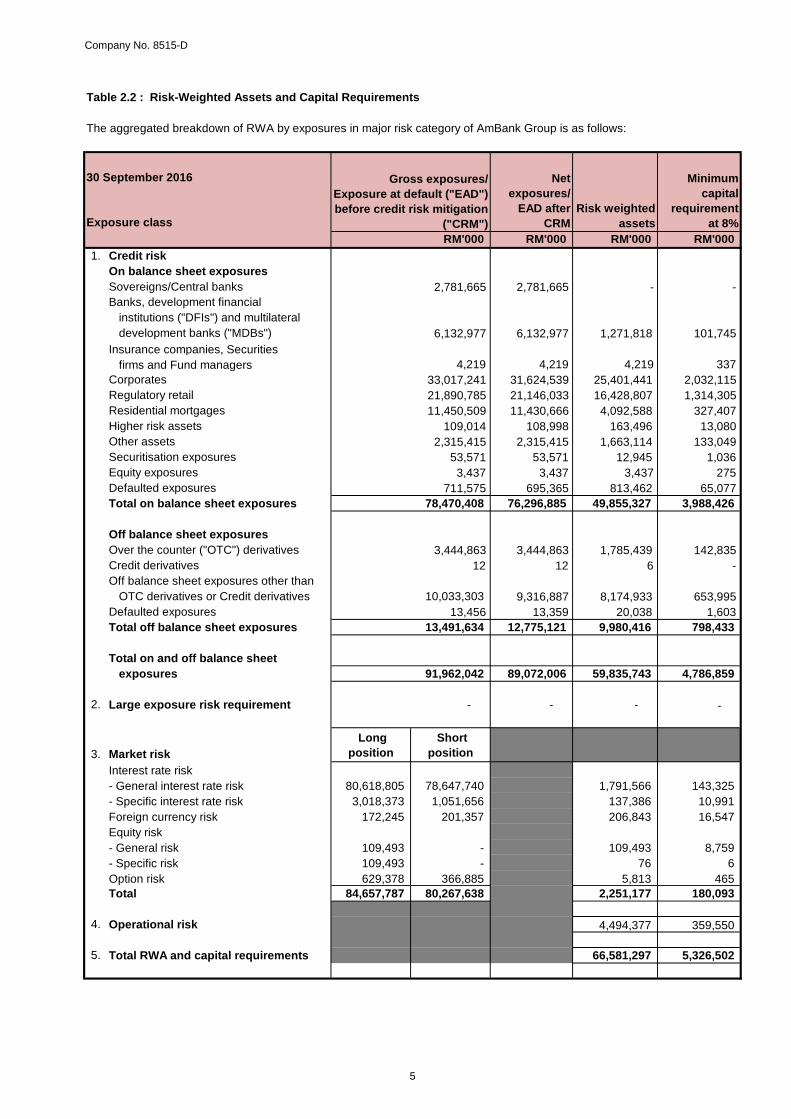
Table 2.2 : Risk-Weighted Assets and Capital Requirements
The aggregated breakdown of RWA by exposures in major risk category of AmBank Group is as follows:
Net exposures/
EAD after CRM
Risk weighted assets
Minimum capital
requirement at 8%
RM'000 RM'000 RM'000 RM'0001. Credit risk
On balance sheet exposuresSovereigns/Central banks 2,781,665 2,781,665 - - Banks, development financial institutions ("DFIs") and multilateral
development banks ("MDBs") 6,132,977 6,132,977 1,271,818 101,745 Insurance companies, Securities
firms and Fund managers 4,219 4,219 4,219 337 Corporates 33,017,241 31,624,539 25,401,441 2,032,115 Regulatory retail 21,890,785 21,146,033 16,428,807 1,314,305 Residential mortgages 11,450,509 11,430,666 4,092,588 327,407 Higher risk assets 109,014 108,998 163,496 13,080 Other assets 2,315,415 2,315,415 1,663,114 133,049 Securitisation exposures 53,571 53,571 12,945 1,036 Equity exposures 3,437 3,437 3,437 275 Defaulted exposures 711,575 695,365 813,462 65,077 Total on balance sheet exposures 78,470,408 76,296,885 49,855,327 3,988,426
Off balance sheet exposuresOver the counter ("OTC") derivatives 3,444,863 3,444,863 1,785,439 142,835 Credit derivatives 12 12 6 - Off balance sheet exposures other than
OTC derivatives or Credit derivatives 10,033,303 9,316,887 8,174,933 653,995 Defaulted exposures 13,456 13,359 20,038 1,603 Total off balance sheet exposures 13,491,634 12,775,121 9,980,416 798,433
Total on and off balance sheetexposures 91,962,042 89,072,006 59,835,743 4,786,859
2. Large exposure risk requirement - - - -
3. Market risk Long
position Short
position Interest rate risk - General interest rate risk 80,618,805 78,647,740 1,791,566 143,325 - Specific interest rate risk 3,018,373 1,051,656 137,386 10,991 Foreign currency risk 172,245 201,357 206,843 16,547 Equity risk - General risk 109,493 - 109,493 8,759 - Specific risk 109,493 - 76 6 Option risk 629,378 366,885 5,813 465 Total 84,657,787 80,267,638 2,251,177 180,093
4. Operational risk 4,494,377 359,550
5. Total RWA and capital requirements 66,581,297 5,326,502
30 September 2016
Exposure class
Gross exposures/ Exposure at default ("EAD") before credit risk mitigation
("CRM")
Company No. 8515-D
6
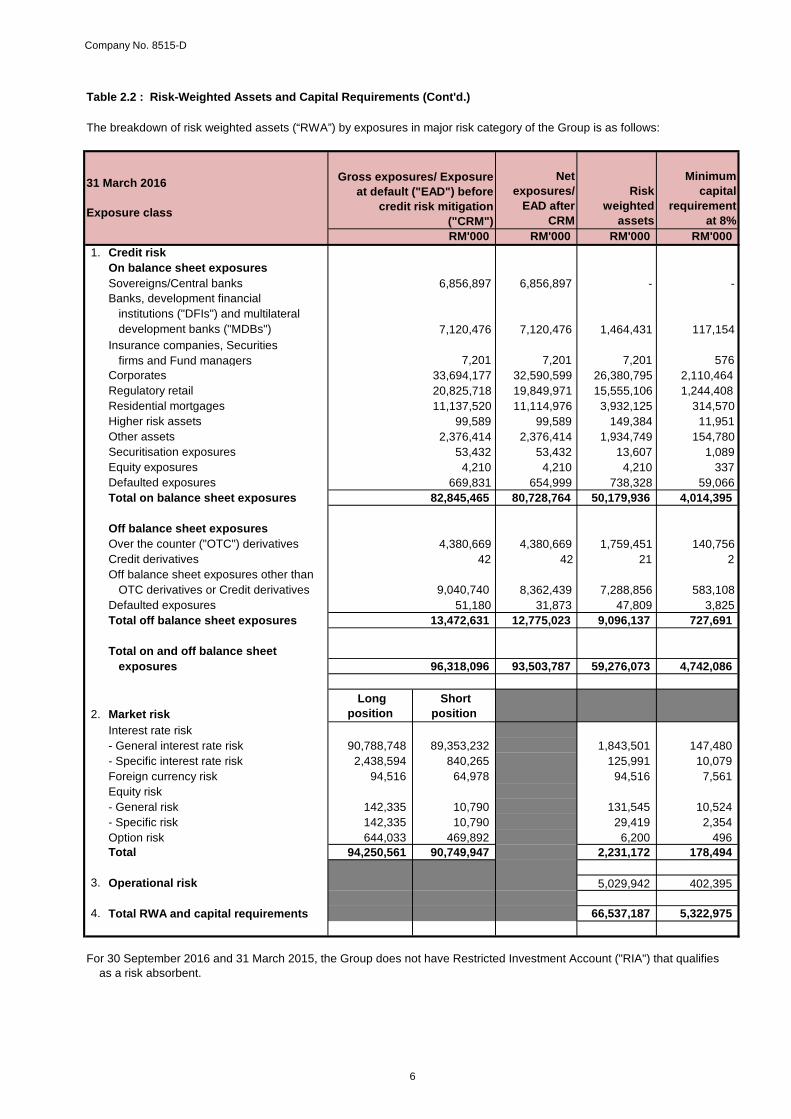
Table 2.2 : Risk-Weighted Assets and Capital Requirements (Cont'd.)
The breakdown of risk weighted assets (“RWA”) by exposures in major risk category of the Group is as follows:
Net exposures/
EAD after CRM
Risk weighted
assets
Minimum capital
requirement at 8%
RM'000 RM'000 RM'000 RM'0001. Credit risk
On balance sheet exposuresSovereigns/Central banks 6,856,897 6,856,897 - - Banks, development financial institutions ("DFIs") and multilateral
development banks ("MDBs") 7,120,476 7,120,476 1,464,431 117,154 Insurance companies, Securities
firms and Fund managers 7,201 7,201 7,201 576 Corporates 33,694,177 32,590,599 26,380,795 2,110,464 Regulatory retail 20,825,718 19,849,971 15,555,106 1,244,408 Residential mortgages 11,137,520 11,114,976 3,932,125 314,570 Higher risk assets 99,589 99,589 149,384 11,951 Other assets 2,376,414 2,376,414 1,934,749 154,780 Securitisation exposures 53,432 53,432 13,607 1,089 Equity exposures 4,210 4,210 4,210 337 Defaulted exposures 669,831 654,999 738,328 59,066 Total on balance sheet exposures 82,845,465 80,728,764 50,179,936 4,014,395
Off balance sheet exposuresOver the counter ("OTC") derivatives 4,380,669 4,380,669 1,759,451 140,756 Credit derivatives 42 42 21 2 Off balance sheet exposures other than
OTC derivatives or Credit derivatives 9,040,740 8,362,439 7,288,856 583,108 Defaulted exposures 51,180 31,873 47,809 3,825 Total off balance sheet exposures 13,472,631 12,775,023 9,096,137 727,691
Total on and off balance sheetexposures 96,318,096 93,503,787 59,276,073 4,742,086
2. Market risk Long
position Short
position Interest rate risk - General interest rate risk 90,788,748 89,353,232 1,843,501 147,480 - Specific interest rate risk 2,438,594 840,265 125,991 10,079 Foreign currency risk 94,516 64,978 94,516 7,561 Equity risk - General risk 142,335 10,790 131,545 10,524 - Specific risk 142,335 10,790 29,419 2,354 Option risk 644,033 469,892 6,200 496 Total 94,250,561 90,749,947 2,231,172 178,494
3. Operational risk 5,029,942 402,395
4. Total RWA and capital requirements 66,537,187 5,322,975
For 30 September 2016 and 31 March 2015, the Group does not have Restricted Investment Account ("RIA") that qualifies as a risk absorbent.
31 March 2016
Exposure class
Gross exposures/ Exposure at default ("EAD") before
credit risk mitigation ("CRM")
Company No. 8515-D
7
3.0 Capital Structure
The capital structure of the Group and the Bank includes capital under the following headings:
• CET 1 Capital;• Additional Tier 1 Capital; and• Tier 2 Capital.
3.1 CET 1 Capital
CET 1 Capital consists of the following:
a) Paid-up Ordinary Share Capital
b) Share Premium
Share premium is used to record premium arising from new shares issued by the Bank.
c) Retained Earnings
All capital instruments included in the capital base have been issued in accordance with the BNM rules and guidelines. TheAdditional Tier 1 and Tier 2 Capital instruments of the Group and the Bank that were issued prior to 2013 do not meet allqualifying criteria for full recognition of capital instruments under the Basel III accord, on the requirements for lossabsorbency at the point of non-viability, and write-off or conversion mechanisms for achieving principal loss absorptionand/or loss absorbency at the point of non-viability. These Additional Tier 1 and Tier 2 Capital instruments qualify for thegradual phase-out treatment under the transitional arrangements of the Basel III accord. Under this treatment, the amount ofcapital instruments that can be recognised for the Group and the Bank shall be capped at 90% of the base in 2013 (ascounted separately for Additional Tier 1 Capital and Tier 2 Capital respectively), with the cap reducing by 10% in eachsubsequent year. To the extent that an instrument is redeemed or derecognised after 1 January 2013, the amount servingas the base is not reduced.
Paid-up ordinary share capital is an item of capital issued by an entity to an investor, which is fully paid-up and wherethe proceeds of issue are immediately and fully available. There is no obligation to pay a coupon or dividend to theequity holder of ordinary shares. The capital is available for unrestricted and immediate use to cover risks andlosses, and enable the Bank to continue trading. It can only be redeemed on the winding up of the Bank.
Retained earnings at the end of the financial year/period and eligible reserves are accumulated resources included inthe shareholders' funds in an entity’s statement of financial position, with certain regulatory adjustments applied. Theretained earnings is included in CET 1 Capital net of any interim and/or final dividend declared, and net of any interimlosses. Quarterly interim profits have been included in CET 1 Capital subject to review/audit by the external auditors.
Company No. 8515-D
8
3.1 CET 1 Capital (Cont'd.)
d) Other Disclosed Reserves
Other disclosed reserves comprise the following:
i) Statutory Reserve
ii) Merger Reserve
iii) Foreign Currency Translation Reserve/(Deficit)
iv) Available-for-Sale Reserve/(Deficit)
v) Cash Flow Hedging Reserve/(Deficit)
Exchange gain (foreign currency translation reserve) and exchange losses (foreign currency translation deficit)arise from the translation of the financial statements of foreign operations, whose functional currencies aredifferent from that of the Group's presentation currency.
Statutory reserve is maintained in compliance with Section 47(2)f of the FSA and is not distributable as cashdividends.
The merger reserve represents reserve arising from the transfer of subsidiaries pursuant to schemes ofarrangement under group restructuring and was accounted for using the merger accounting method.
This account relates to the amount of the hedging of the items that are not fair valued in the statement offinancial position (including projected cash flows). Cash flow hedging gain as at the reporting period isclassified as cash flow hedging reserve and cash flow hedging losses is classified as cash flow hedging deficit.The amount of the cash flow hedging reserve/(deficit) is derecognised in the calculation of CET 1 Capital.
This account comprises the unrealised fair value gains (available-for-sale reserve) and losses (available-for-sale deficit) on financial investments available-for-sale. Where the available-for-sale reserve is a net gainoutstanding balance, the Group and Bank can recognise 45% of the total outstanding balance as part of CET 1Capital. Where the available-for-sale deficit is a net loss outstanding balance, the entire outstanding balance isdeducted in CET 1 Capital.
Company No. 8515-D
9
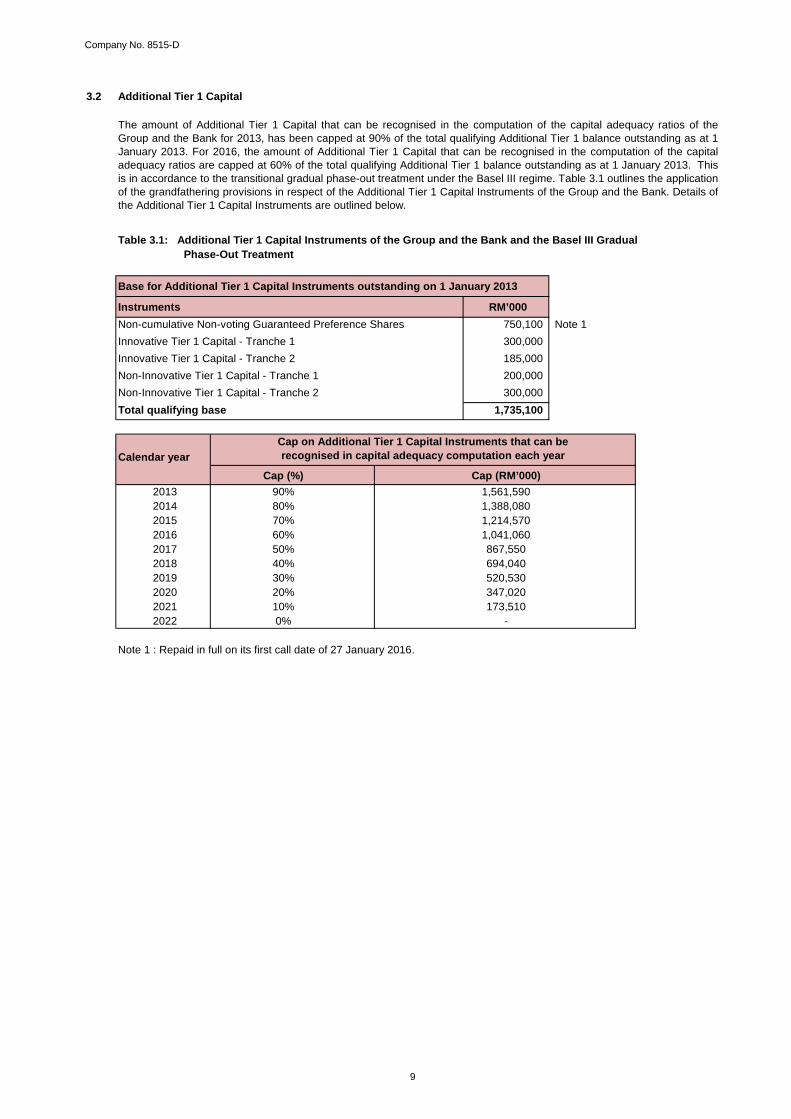
3.2 Additional Tier 1 Capital
Table 3.1: Additional Tier 1 Capital Instruments of the Group and the Bank and the Basel III Gradual Phase-Out Treatment
Base for Additional Tier 1 Capital Instruments outstanding on 1 January 2013
Instruments RM’000Non-cumulative Non-voting Guaranteed Preference Shares 750,100 Note 1Innovative Tier 1 Capital - Tranche 1 300,000 Innovative Tier 1 Capital - Tranche 2 185,000 Non-Innovative Tier 1 Capital - Tranche 1 200,000 Non-Innovative Tier 1 Capital - Tranche 2 300,000 Total qualifying base 1,735,100
Calendar yearCap (%) Cap (RM’000)
90% 1,561,59080% 1,388,08070% 1,214,57060% 1,041,06050% 867,55040% 694,04030% 520,53020% 347,02010% 173,5100% -
Note 1 : Repaid in full on its first call date of 27 January 2016.
20162017
The amount of Additional Tier 1 Capital that can be recognised in the computation of the capital adequacy ratios of theGroup and the Bank for 2013, has been capped at 90% of the total qualifying Additional Tier 1 balance outstanding as at 1January 2013. For 2016, the amount of Additional Tier 1 Capital that can be recognised in the computation of the capitaladequacy ratios are capped at 60% of the total qualifying Additional Tier 1 balance outstanding as at 1 January 2013. Thisis in accordance to the transitional gradual phase-out treatment under the Basel III regime. Table 3.1 outlines the applicationof the grandfathering provisions in respect of the Additional Tier 1 Capital Instruments of the Group and the Bank. Details ofthe Additional Tier 1 Capital Instruments are outlined below.
2013
20152014
202020212022
Cap on Additional Tier 1 Capital Instruments that can be recognised in capital adequacy computation each year
20192018
Company No. 8515-D
10
3.2 Additional Tier 1 Capital (Cont'd.)
Innovative Tier 1 Capital
Innovative Tier 1 Capital Securities
Non-innovative Tier 1 Capital
•
•
(collectively known as “Stapled Capital Securities”).
The Stapled Capital Securities comply with BNM’s Guidelines on Non-Innovative Tier 1 capital instruments. They constituteunsecured and subordinated obligations of the Bank. Claims in respect of the NCPCS rank pari passu and withoutpreference among themselves and with the most junior class of preference shares of the Bank but in priority to the rights and claims of the ordinary shareholders of the Bank. The SubNotes rank pari passu and without preference among themselvesand with the most junior class of notes or preference shares of AmPremier.
The SubNotes have a fixed interest rate of 9.0% per annum. However, the NCPCS distribution will not begin to accrue untilthe SubNotes are re-assigned to the Bank as referred to above.
On 18 August 2009, the Bank issued up to RM485 million Innovative Tier I Capital Securities under its RM500 millionInnovative Tier I Capital Securities (“ITICS”) Programme. The ITICS bear a fixed interest (non-cumulative) rate at issuancedate (interest rate is 8.25% per annum) and step up 100 basis points after the First Call Date (10 years after issuance date)and interest is payable semi annually in arrears. The maturity date is 30 years from the issue date. The ITICS facility is fora tenure of 60 years from the first issue date and has a principal stock settlement mechanism to redeem the ITICS via cashthrough the issuance of the Bank’s ordinary shares. Upon BNM’s approval, the Bank may redeem in whole but not in partthe relevant tranche of the ITICS at any time on the 10th anniversary of the issue date of that tranche or on any interestpayment date thereafter.
In the financial year ended 31 March 2009, the Bank issued RM500 million Non-Innovative Tier 1 Capital ("NIT1") in nominalvalue comprising:
The NCPCS are issued in perpetuity unless redeemed under the terms of the NCPCS. The NCPCS are redeemable at theoption of the Bank on the 20th interest payment date or 10 years from the issuance date of the SubNotes, or any NCPCSdistribution date thereafter, subject to redemption conditions being satisfied. The SubNotes have a tenure of 30 yearsunless redeemed earlier under the terms of the SubNotes. The SubNotes are redeemable at the option of AmPremier onany interest payment date, which cannot be earlier than the occurrence of assignment events as stipulated under the termsof the Stapled Capital Securities.
Subordinated Notes (“SubNotes”), which are issued by AmPremier Capital Berhad (“AmPremier”), a wholly-ownedsubsidiary of the Bank
Non-Cumulative Perpetual Capital Securities (“NCPCS”), which are issued by the Bank and stapled to theSubordinated Notes described below; and
Innovative Tier 1 Capital comprises deeply subordinated debt instruments which despite their legal form, have lossabsorbency qualities and can therefore be included as Tier 1 Capital. The Innovative Tier 1 securities in issue and theirprimary terms are as follows:
The proceeds from the NIT1 programme were used as working capital. The Stapled Capital Securities cannot be tradedseparately until the occurrence of certain assignment events. Upon occurrence of an assignment event, the Stapled CapitalSecurities will “unstaple”, leaving the investors to hold only the NCPCS while ownership of the Sub-Notes will be assigned tothe Bank pursuant to the forward purchase contract entered into by the Bank unless there is an earlier occurrence of anyother events stated under the terms of the Stapled Capital Securities. If none of the assignment events as stipulated underthe terms of the Stapled Capital Securities occur, the Stapled Capital Securities will unstaple on the 20th interest paymentdate or 10 years from the issuance date of the SubNotes.
Company No. 8515-D
11
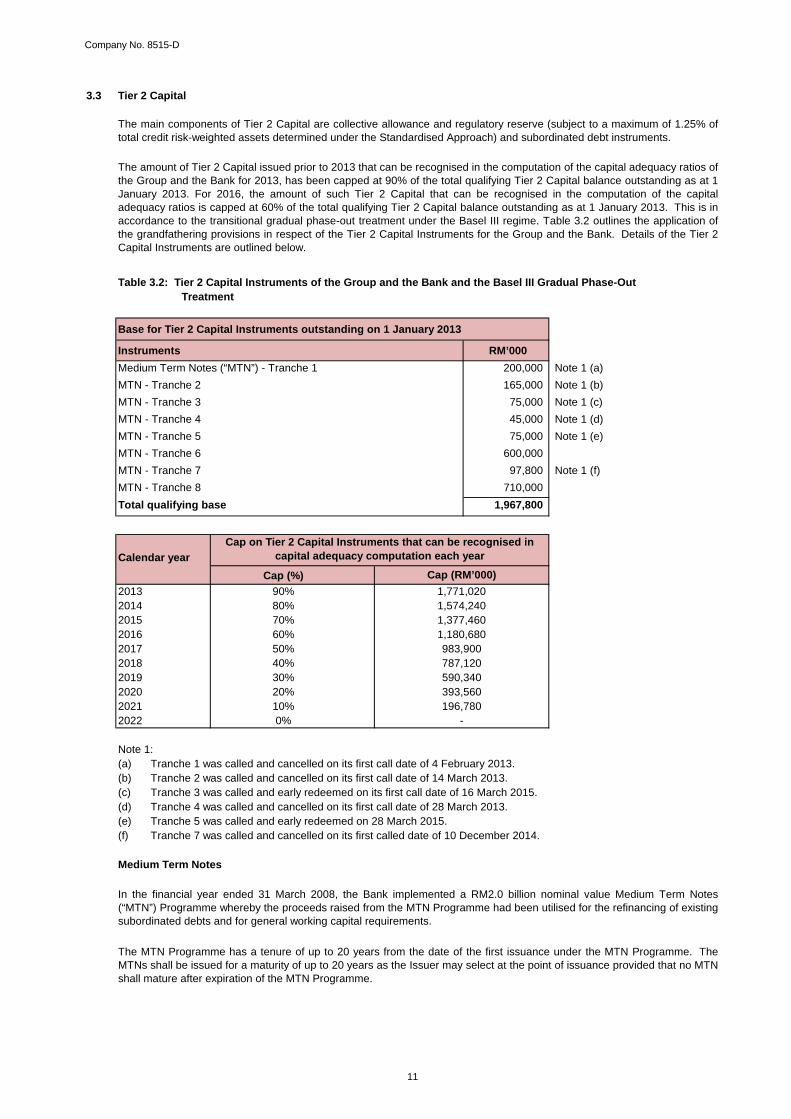
3.3 Tier 2 Capital
Table 3.2: Tier 2 Capital Instruments of the Group and the Bank and the Basel III Gradual Phase-Out Treatment
Base for Tier 2 Capital Instruments outstanding on 1 January 2013
Instruments RM’000Medium Term Notes (“MTN”) - Tranche 1 200,000 Note 1 (a)MTN - Tranche 2 165,000 Note 1 (b)MTN - Tranche 3 75,000 Note 1 (c)MTN - Tranche 4 45,000 Note 1 (d)MTN - Tranche 5 75,000 Note 1 (e)MTN - Tranche 6 600,000 MTN - Tranche 7 97,800 Note 1 (f)MTN - Tranche 8 710,000 Total qualifying base 1,967,800
Calendar yearCap (%)
2013 90%2014 80%2015 70%2016 60%2017 50%2018 40%2019 30%2020 20%2021 10%2022 0%
(a)(b)(c)(d)(e)(f)
Medium Term Notes
1,771,020
The amount of Tier 2 Capital issued prior to 2013 that can be recognised in the computation of the capital adequacy ratios ofthe Group and the Bank for 2013, has been capped at 90% of the total qualifying Tier 2 Capital balance outstanding as at 1January 2013. For 2016, the amount of such Tier 2 Capital that can be recognised in the computation of the capitaladequacy ratios is capped at 60% of the total qualifying Tier 2 Capital balance outstanding as at 1 January 2013. This is inaccordance to the transitional gradual phase-out treatment under the Basel III regime. Table 3.2 outlines the application ofthe grandfathering provisions in respect of the Tier 2 Capital Instruments for the Group and the Bank. Details of the Tier 2Capital Instruments are outlined below.
The main components of Tier 2 Capital are collective allowance and regulatory reserve (subject to a maximum of 1.25% oftotal credit risk-weighted assets determined under the Standardised Approach) and subordinated debt instruments.
1,180,680
-
In the financial year ended 31 March 2008, the Bank implemented a RM2.0 billion nominal value Medium Term Notes(“MTN”) Programme whereby the proceeds raised from the MTN Programme had been utilised for the refinancing of existingsubordinated debts and for general working capital requirements.
Cap (RM’000)
The MTN Programme has a tenure of up to 20 years from the date of the first issuance under the MTN Programme. TheMTNs shall be issued for a maturity of up to 20 years as the Issuer may select at the point of issuance provided that no MTNshall mature after expiration of the MTN Programme.
590,340393,560196,780
787,120
Tranche 7 was called and cancelled on its first called date of 10 December 2014.
Note 1:Tranche 1 was called and cancelled on its first call date of 4 February 2013.
1,574,240
Cap on Tier 2 Capital Instruments that can be recognised in capital adequacy computation each year
Tranche 2 was called and cancelled on its first call date of 14 March 2013.Tranche 3 was called and early redeemed on its first call date of 16 March 2015.Tranche 4 was called and cancelled on its first call date of 28 March 2013.Tranche 5 was called and early redeemed on 28 March 2015.
983,900
1,377,460
Company No. 8515-D
12
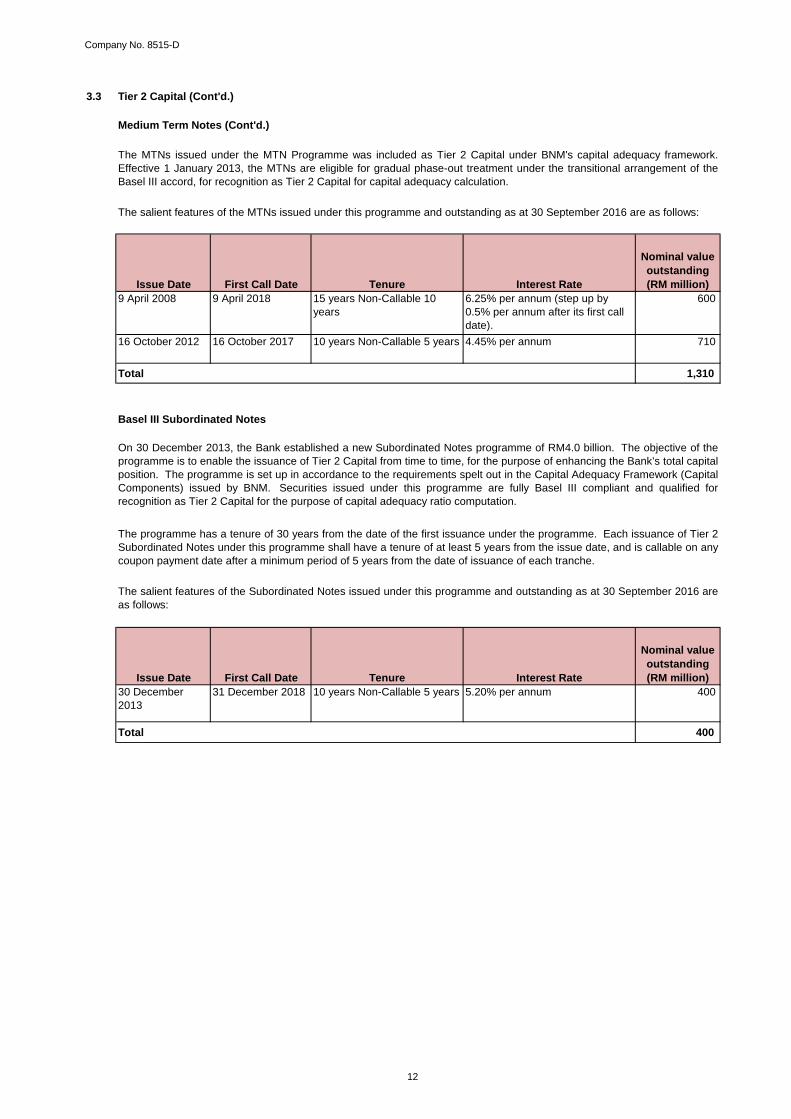
3.3 Tier 2 Capital (Cont'd.)
Medium Term Notes (Cont'd.)
Total 1,310
Basel III Subordinated Notes
Total 400
The salient features of the Subordinated Notes issued under this programme and outstanding as at 30 September 2016 areas follows:
The salient features of the MTNs issued under this programme and outstanding as at 30 September 2016 are as follows:
The MTNs issued under the MTN Programme was included as Tier 2 Capital under BNM's capital adequacy framework.Effective 1 January 2013, the MTNs are eligible for gradual phase-out treatment under the transitional arrangement of theBasel III accord, for recognition as Tier 2 Capital for capital adequacy calculation.
15 years Non-Callable 10 years
Nominal value outstanding (RM million)
Tenure
4.45% per annum 710
The programme has a tenure of 30 years from the date of the first issuance under the programme. Each issuance of Tier 2Subordinated Notes under this programme shall have a tenure of at least 5 years from the issue date, and is callable on anycoupon payment date after a minimum period of 5 years from the date of issuance of each tranche.
Interest Rate
6.25% per annum (step up by 0.5% per annum after its first call date).
600
16 October 2012
TenureIssue Date
10 years Non-Callable 5 years
400
9 April 2018
On 30 December 2013, the Bank established a new Subordinated Notes programme of RM4.0 billion. The objective of theprogramme is to enable the issuance of Tier 2 Capital from time to time, for the purpose of enhancing the Bank’s total capitalposition. The programme is set up in accordance to the requirements spelt out in the Capital Adequacy Framework (CapitalComponents) issued by BNM. Securities issued under this programme are fully Basel III compliant and qualified forrecognition as Tier 2 Capital for the purpose of capital adequacy ratio computation.
16 October 2017
First Call Date
5.20% per annum30 December 2013
31 December 2018 10 years Non-Callable 5 yearsFirst Call Date
Issue Date Interest Rate
Nominal value outstanding (RM million)
9 April 2008
Company No. 8515-D
13
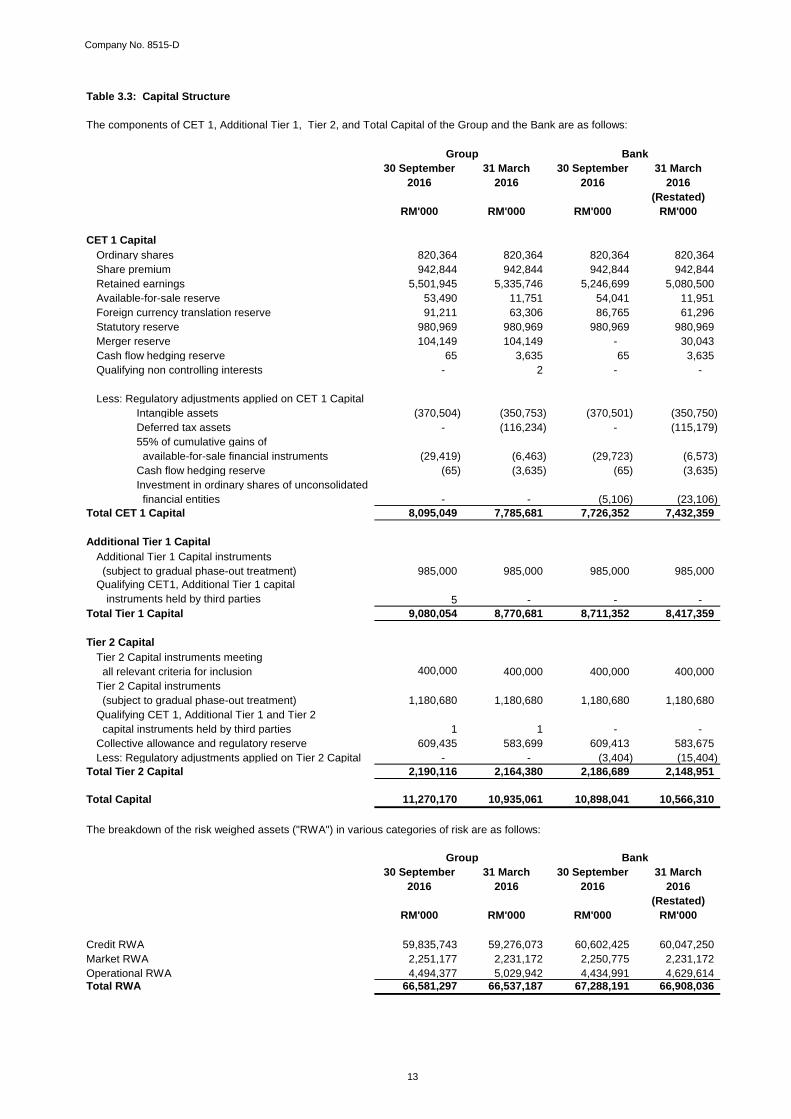
Table 3.3: Capital Structure
The components of CET 1, Additional Tier 1, Tier 2, and Total Capital of the Group and the Bank are as follows:
30 September 31 March 30 September 31 March2016 2016 2016 2016
(Restated)RM'000 RM'000 RM'000 RM'000
CET 1 CapitalOrdinary shares 820,364 820,364 820,364 820,364 Share premium 942,844 942,844 942,844 942,844 Retained earnings 5,501,945 5,335,746 5,246,699 5,080,500 Available-for-sale reserve 53,490 11,751 54,041 11,951 Foreign currency translation reserve 91,211 63,306 86,765 61,296 Statutory reserve 980,969 980,969 980,969 980,969 Merger reserve 104,149 104,149 - 30,043 Cash flow hedging reserve 65 3,635 65 3,635 Qualifying non controlling interests - 2 - -
Less: Regulatory adjustments applied on CET 1 CapitalIntangible assets (370,504) (350,753) (370,501) (350,750) Deferred tax assets - (116,234) - (115,179) 55% of cumulative gains of available-for-sale financial instruments (29,419) (6,463) (29,723) (6,573) Cash flow hedging reserve (65) (3,635) (65) (3,635) Investment in ordinary shares of unconsolidated financial entities - - (5,106) (23,106)
Total CET 1 Capital 8,095,049 7,785,681 7,726,352 7,432,359
Additional Tier 1 CapitalAdditional Tier 1 Capital instruments (subject to gradual phase-out treatment) 985,000 985,000 985,000 985,000 Qualifying CET1, Additional Tier 1 capital
instruments held by third parties 5 - - - Total Tier 1 Capital 9,080,054 8,770,681 8,711,352 8,417,359
Tier 2 CapitalTier 2 Capital instruments meeting all relevant criteria for inclusion 400,000 400,000 400,000 400,000 Tier 2 Capital instruments (subject to gradual phase-out treatment) 1,180,680 1,180,680 1,180,680 1,180,680 Qualifying CET 1, Additional Tier 1 and Tier 2 capital instruments held by third parties 1 1 - - Collective allowance and regulatory reserve 609,435 583,699 609,413 583,675 Less: Regulatory adjustments applied on Tier 2 Capital - - (3,404) (15,404)
Total Tier 2 Capital 2,190,116 2,164,380 2,186,689 2,148,951
Total Capital 11,270,170 10,935,061 10,898,041 10,566,310
The breakdown of the risk weighed assets ("RWA") in various categories of risk are as follows:
30 September 31 March 30 September 31 March2016 2016 2016 2016
(Restated)RM'000 RM'000 RM'000 RM'000
Credit RWA 59,835,743 59,276,073 60,602,425 60,047,250 Market RWA 2,251,177 2,231,172 2,250,775 2,231,172 Operational RWA 4,494,377 5,029,942 4,434,991 4,629,614 Total RWA 66,581,297 66,537,187 67,288,191 66,908,036
Group Bank
BankGroup
Company No. 8515-D
14
4.0 General Risk Management
Board Approved Risk Appetite Statement
The Group manages trading and sales activities by instituting appropriate governance, culture, and controls to promoteacceptable behaviour.
The Risk Appetite Framework provides portfolio limits/ parameters/controls for Credit Risk, Traded Market Risk, Non-TradedMarket Risk, Operational Risk and Regulatory Compliance incorporating, inter alia, limits/controls for countries, industries,single counterparty group, products, value at risk, stop loss, stable funding ratio, liquidity, operational risk and regulatorycompliance.
The Risk Management Framework takes its lead from the Board’s Approved Risk Appetite Framework that forms thefoundation of the Group to set its risk/reward profile.
The Group intends to maintain sufficient quantity and quality of capital in excess of Basel III requirement for CET 1 Capital,Tier 1 Capital, and Total Capital. Our capital requirements are robustly tested over a three year period.
We adopt a conservative approach to liquidity management, maintaining stable and diversified funding base consistent withBasel III liquidity matrix (Net Stable Funds Ratio, and Liquidity Coverage Ratios). Our targeted Unadjusted Loan DepositRatio is up to maximum 100% with continually improving current account and savings account (“CASA”) deposit compositionand market share.
The Risk Appetite Framework is approved annually by the Board taking into account the Group’s desired external rating andtargeted profitability/return on equity (“ROE”) and is reviewed periodically throughout the financial year by both the executivemanagement and the Board to consider any fine tuning/amendments taking into account prevailing or expected changes tothe environment that the Group operates in.
The Group's strategic goals are to sustain the top quartile ROE, and to maintain the credit rating of BBB+ or better (frominternational rating agencies) for the next one to two years. This is supported by sustainable asset quality and continuedportfolio diversification within retail and non-retail businesses, with greater contribution from non-interest income,complemented by robust management of liquidity, disciplined execution of interest rate risk/rate of return risk in the balancesheet, and with support from strong level of capital.
The Group manages operational risk by setting the operational risk appetite statements and measurements that the Group iswilling to tolerate to support its business strategies and objectives. The Group manages its reputational risk by not engagingin any activity that has potential to result in a material event or loss that would be outside the expectations of itsstakeholders. The Group also manages its regulatory compliance risk by setting positive compliance culture and ensuringthat the letter and spirit of regulatory requirements, applicable laws, rules, and standards in the respective jurisdictions arecomplied with.
Company No. 8515-D
4.0 General Risk Management (Cont'd.)
Risk Management Governance
5.0 Credit Risk Management
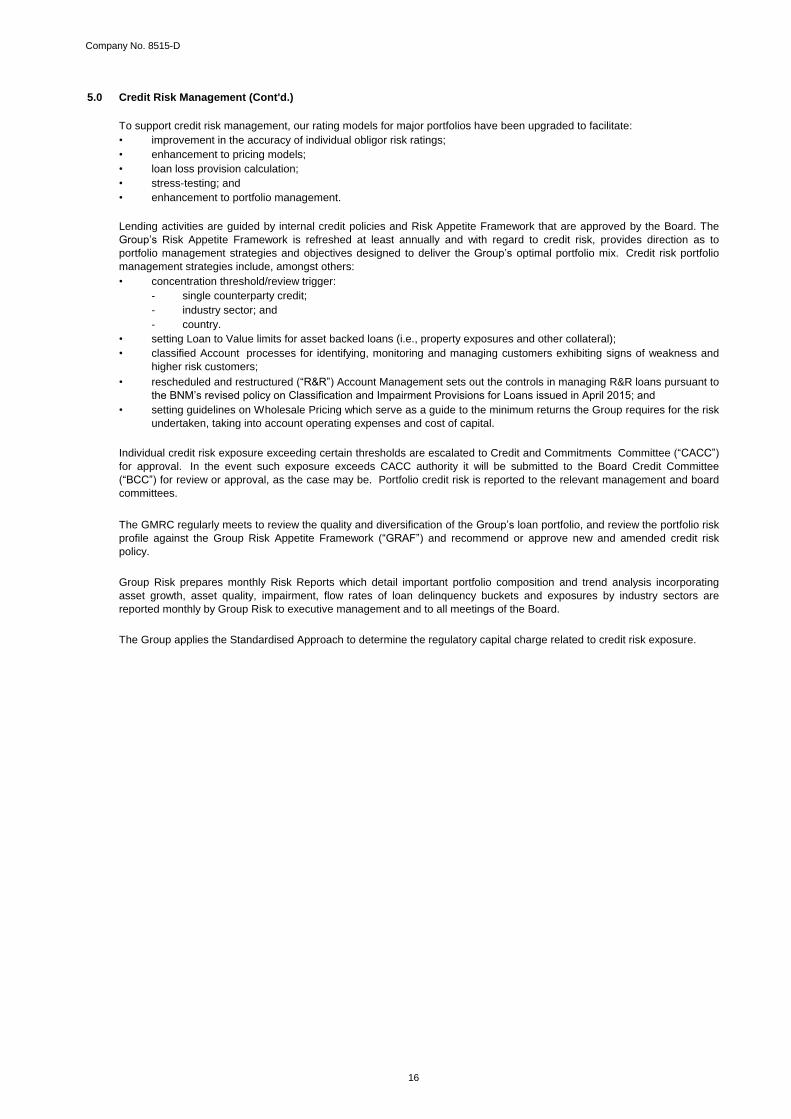
The credit risk management process is depicted in the table below:
The primary objective of credit risk management is to maintain accurate risk recognition - identification and measurement, to
ensure that credit risk exposure is in line with the Group’s Risk Appetite Framework ("GRAF") and related credit policies.
For non-retail credits, risk recognition begins with an assessment of the financial standing of the borrower or counterparty
using credit rating model. The model consists of quantitative and qualitative scores that are then translated into rating
grades. The assigned credit rating grade forms a crucial part of the credit analysis undertaken for each of the Group’s credit
exposures.
Credit risk is the risk of loss due to the inability or unwillingness of a counterparty to meet its payment obligations. Exposure
to credit risk arises from lending, securities and derivative exposures. The identification of credit risk is done by assessing
the potential impact of internal and external factors on the Group's transactions and/or positions.
For retail credits, credit-scoring systems to better differentiate the quality of borrowers are being used to complement the
credit assessment and approval processes.
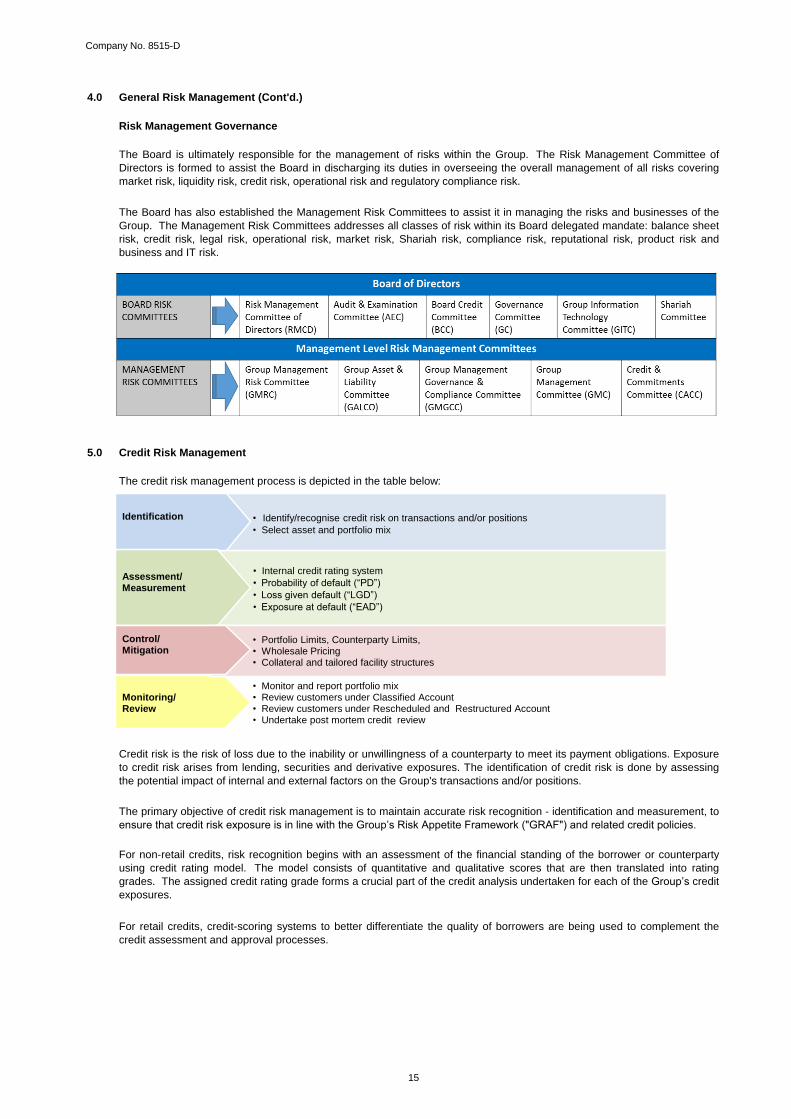
The Board is ultimately responsible for the management of risks within the Group. The Risk Management Committee of
Directors is formed to assist the Board in discharging its duties in overseeing the overall management of all risks covering
market risk, liquidity risk, credit risk, operational risk and regulatory compliance risk.
The Board has also established the Management Risk Committees to assist it in managing the risks and businesses of the
Group. The Management Risk Committees addresses all classes of risk within its Board delegated mandate: balance sheet
risk, credit risk, legal risk, operational risk, market risk, Shariah risk, compliance risk, reputational risk, product risk and
business and IT risk.
• Internal credit rating system
• Probability of default (“PD”)
• Loss given default (“LGD”)
• Exposure at default (“EAD”)
• Identify/recognise credit risk on transactions and/or positions
• Select asset and portfolio mix
Identification
Assessment/ Measurement
• Monitor and report portfolio mix • Review customers under Classified Account • Review customers under Rescheduled and Restructured Account • Undertake post mortem credit review
Monitoring/ Review
• Portfolio Limits, Counterparty Limits, • Wholesale Pricing • Collateral and tailored facility structures
Control/ Mitigation
15
Company No. 8515-D
5.0 Credit Risk Management (Cont'd.)
To support credit risk management, our rating models for major portfolios have been upgraded to facilitate:
• improvement in the accuracy of individual obligor risk ratings;
• enhancement to pricing models;
• loan loss provision calculation;
• stress-testing; and
• enhancement to portfolio management.
• concentration threshold/review trigger:
- single counterparty credit;
- industry sector; and
- country.
• setting Loan to Value limits for asset backed loans (i.e., property exposures and other collateral);
•
•
•
classified Account processes for identifying, monitoring and managing customers exhibiting signs of weakness and
higher risk customers;
rescheduled and restructured (“R&R”) Account Management sets out the controls in managing R&R loans pursuant to
the BNM’s revised policy on Classification and Impairment Provisions for Loans issued in April 2015; and
setting guidelines on Wholesale Pricing which serve as a guide to the minimum returns the Group requires for the risk
undertaken, taking into account operating expenses and cost of capital.
Lending activities are guided by internal credit policies and Risk Appetite Framework that are approved by the Board. The
Group’s Risk Appetite Framework is refreshed at least annually and with regard to credit risk, provides direction as to
portfolio management strategies and objectives designed to deliver the Group’s optimal portfolio mix. Credit risk portfolio
management strategies include, amongst others:
Individual credit risk exposure exceeding certain thresholds are escalated to Credit and Commitments Committee (“CACC”)
for approval. In the event such exposure exceeds CACC authority it will be submitted to the Board Credit Committee
(“BCC”) for review or approval, as the case may be. Portfolio credit risk is reported to the relevant management and board
committees.
The GMRC regularly meets to review the quality and diversification of the Group’s loan portfolio, and review the portfolio risk
profile against the Group Risk Appetite Framework (“GRAF”) and recommend or approve new and amended credit risk
policy.
Group Risk prepares monthly Risk Reports which detail important portfolio composition and trend analysis incorporating
asset growth, asset quality, impairment, flow rates of loan delinquency buckets and exposures by industry sectors are
reported monthly by Group Risk to executive management and to all meetings of the Board.
The Group applies the Standardised Approach to determine the regulatory capital charge related to credit risk exposure.
16
Company No. 8515-D
5.1 Impairment
5.1.1 Definition of past due and impaired loans and advances
All loans and advances are categorised as either:
• neither past due nor impaired;
• past due but not impaired; or
• impaired
A loan is classified as impaired under the following circumstances:
(a)
(b)
(c)
(d) a loan may also be classified as impaired:
i.
ii. due to cross-default. Cross-default occurs when:
-
-
or
iii. if deemed appropriate by the Watchlist Forum.
1
2 Material obligation as determined by Management. Current "material" threshold is set at more than RM200.00
3 Administrative defaults include cases where exposures become overdue because of oversight on the part of the obligor and/or the banking institution.
Instances of administrative defaults may be excluded from the historical default count, subject to appropriate policies and procedures established by the
banking institution to evaluate and approve such cases.
a default of a loan obligation of a customer triggers a default of a loan obligation of other customers
within the same customer group.
An asset is considered past due when any payment (whether principal and/or interest) due under the contractual
terms are received late or missed.
where the principal or interest or both is past due1
or the amount outstanding is in excess of approved limit (for
revolving facilities), each for more than 90 days or 3 months on any material obligation2; or
for loans where repayments are scheduled on intervals of 3 months or longer, the loan is to be classified as
impaired 1+30 days or 1day+1 month past due (the 30-days grace period is to allow for exclusion of
administrative default3.
for trade bills/facilities, an account is deemed defaulted and impaired when the past due is 90 days from due
date of the bill.
a default of a loan obligation of a customer triggers a default of another loan obligation of the same
customer or
For credit card facilities, an account is "past due" when the cardmember fails to settle the minimum monthly repayment due before the next billing date.
The CACC is allowed to waive the declaration of cross-default across all accounts of the same customer
or accounts of all customers within the same customer group.
if it is probable that the Group and the Bank will be unable to collect all amounts due (including both
interest and principal) according to the contractual terms of the agreement; or
17
Company No. 8515-D
18
5.1 Impairment (Cont'd)
5.1.1 Definition of past due and impaired loans and advances (Cont'd.)
(e)
i.
ii.
iii.
(f)
5.1.2 Methodology for Determination of Individual and Collective Allowances
Individual Assessment
(a) Trigger management
(b) Valuation of assets
Collective Assessment
4
5
debt instruments (for example, fixed income securities, debt converted instruments etc.) shall be classified asimpaired:
Excluding loans with an explicit guarantee from the Government of Malaysia
when the coupon/interest payment or face/ nominal value redemption is one (1) day past due after thegrace period, where there is a stipulated grace period within the contractually agreed terms; or
when an event of default ("EOD") has been declared by the Trustee/ Facility Agent4 for reasons otherthan payment in default (as outlined in the Trust Deed Guidelines issued by the Securities Commissionof Malaysia); or
where it is deemed appropriate to classify as impaired and approved by the Watchlist Forum.
the loan is deemed impaired when it is classified as rescheduled or restructured (“R&R”) in the Central CreditReference Information System (“CCRIS”)
In trigger management, financial assets which are above the pre-set individual assessment threshold areassessed using the relevant impairment triggers for objective evidence of impairment.
Loans and advances and commitments and contingencies below the significant threshold and those not assessed tobe individually impaired, will be subject to collective assessment and a collective allowance will be computedaccordingly. The collective impairment assessment and provisioning methodology uses historical loss data to derivethe level of provisions. The collective provisions are computed after making the necessary adjustments to reflectcurrent economic conditions.
With effect from 31 December 2015, the Bank is required to maintain, in aggregate, collective impairment allowancesand regulatory reserves of no less than 1.2% of total outstanding loans5 net of individual impairment.
Individual assessment is divided into 2 main processes - detection of an event(s) and an assessment of impairment:
In cases where the bond/sukuk holdings are not governed by a Trust Deed, the Facility Agent may declare, if so requested in writing by the bond/sukuk holders by way of Special Resolution that an EOD has occurred (subject to the Agency Agreement between issuers and facility agent), notwithstanding the stated maturity of the bond/sukuk.
Financial assets which are triggered by the impairment triggers will be measured for evidence of high likelihoodof impairment, i.e. estimated recoveries (based on the discounted cash flow projection method and taking intoaccount economic conditions) is less than carrying value or fair value is less than the carrying value.
An assessment is performed to determine whether objective evidence of impairment exists individually for financialassets that are individually significant, and collectively for financial assets that are not individually significant or notindividually impaired.
Company No. 8515-D
19
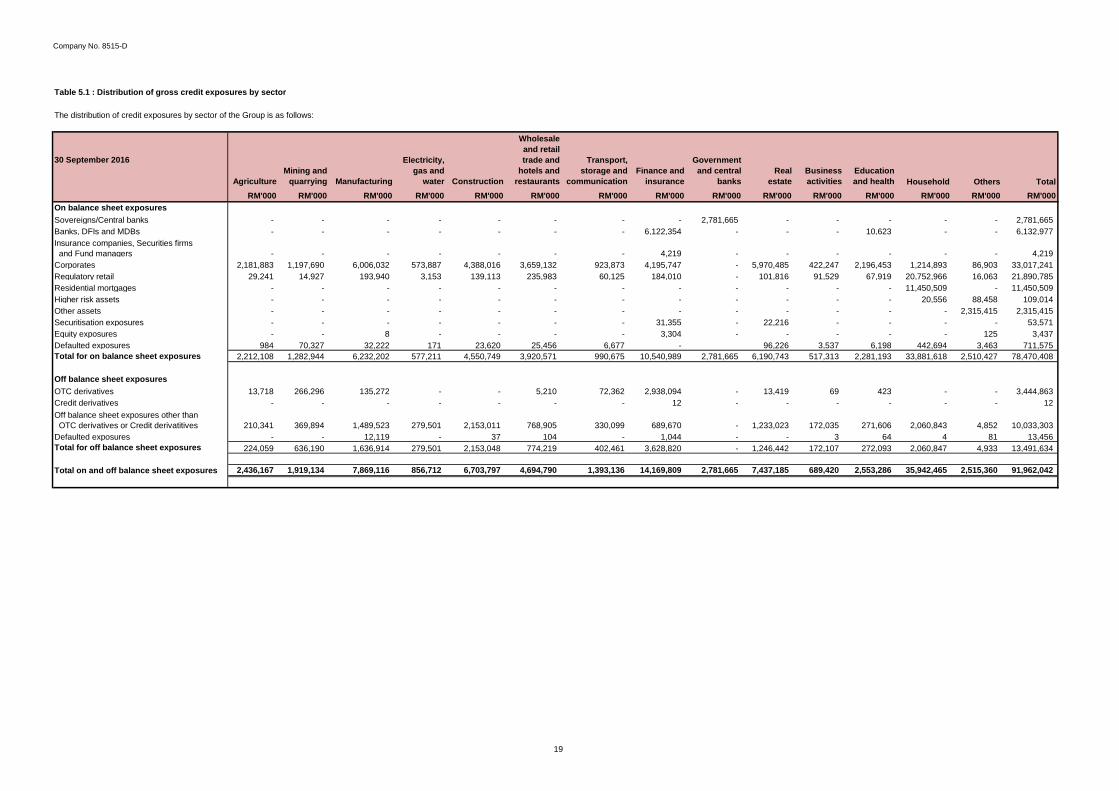
Table 5.1 : Distribution of gross credit exposures by sector
The distribution of credit exposures by sector of the Group is as follows:
30 September 2016
AgricultureMining and
quarrying Manufacturing
Electricity, gas and
water Construction
Wholesale and retail trade and
hotels and restaurants
Transport, storage and
communicationFinance and
insurance
Government and central
banks Real
estateBusiness activities
Education and health Household Others Total
RM'000 RM'000 RM'000 RM'000 RM'000 RM'000 RM'000 RM'000 RM'000 RM'000 RM'000 RM'000 RM'000 RM'000 RM'000On balance sheet exposuresSovereigns/Central banks - - - - - - - - 2,781,665 - - - - - 2,781,665 Banks, DFIs and MDBs - - - - - - - 6,122,354 - - - 10,623 - - 6,132,977 Insurance companies, Securities firms and Fund managers - - - - - - - 4,219 - - - - - - 4,219 Corporates 2,181,883 1,197,690 6,006,032 573,887 4,388,016 3,659,132 923,873 4,195,747 - 5,970,485 422,247 2,196,453 1,214,893 86,903 33,017,241 Regulatory retail 29,241 14,927 193,940 3,153 139,113 235,983 60,125 184,010 - 101,816 91,529 67,919 20,752,966 16,063 21,890,785 Residential mortgages - - - - - - - - - - - - 11,450,509 - 11,450,509 Higher risk assets - - - - - - - - - - - - 20,556 88,458 109,014 Other assets - - - - - - - - - - - - - 2,315,415 2,315,415 Securitisation exposures - - - - - - - 31,355 - 22,216 - - - - 53,571 Equity exposures - - 8 - - - - 3,304 - - - - - 125 3,437 Defaulted exposures 984 70,327 32,222 171 23,620 25,456 6,677 - 96,226 3,537 6,198 442,694 3,463 711,575 Total for on balance sheet exposures 2,212,108 1,282,944 6,232,202 577,211 4,550,749 3,920,571 990,675 10,540,989 2,781,665 6,190,743 517,313 2,281,193 33,881,618 2,510,427 78,470,408
Off balance sheet exposuresOTC derivatives 13,718 266,296 135,272 - - 5,210 72,362 2,938,094 - 13,419 69 423 - - 3,444,863 Credit derivatives - - - - - - - 12 - - - - - - 12 Off balance sheet exposures other than OTC derivatives or Credit derivatitives 210,341 369,894 1,489,523 279,501 2,153,011 768,905 330,099 689,670 - 1,233,023 172,035 271,606 2,060,843 4,852 10,033,303 Defaulted exposures - - 12,119 - 37 104 - 1,044 - - 3 64 4 81 13,456 Total for off balance sheet exposures 224,059 636,190 1,636,914 279,501 2,153,048 774,219 402,461 3,628,820 - 1,246,442 172,107 272,093 2,060,847 4,933 13,491,634
Total on and off balance sheet exposures 2,436,167 1,919,134 7,869,116 856,712 6,703,797 4,694,790 1,393,136 14,169,809 2,781,665 7,437,185 689,420 2,553,286 35,942,465 2,515,360 91,962,042
Company No. 8515-D
20
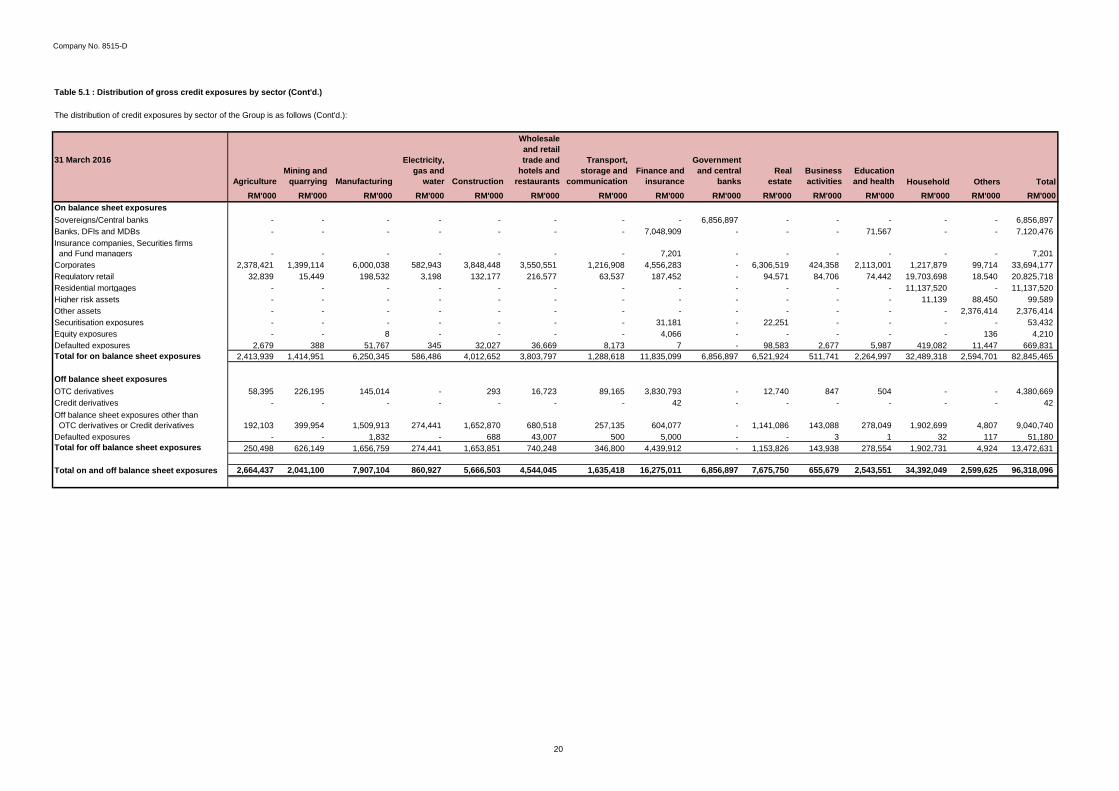
Table 5.1 : Distribution of gross credit exposures by sector (Cont'd.)
The distribution of credit exposures by sector of the Group is as follows (Cont'd.):
31 March 2016
AgricultureMining and
quarrying Manufacturing
Electricity, gas and
water Construction
Wholesale and retail trade and
hotels and restaurants
Transport, storage and
communicationFinance and
insurance
Government and central
banks Real
estateBusiness activities
Education and health Household Others Total
RM'000 RM'000 RM'000 RM'000 RM'000 RM'000 RM'000 RM'000 RM'000 RM'000 RM'000 RM'000 RM'000 RM'000 RM'000On balance sheet exposuresSovereigns/Central banks - - - - - - - - 6,856,897 - - - - - 6,856,897 Banks, DFIs and MDBs - - - - - - - 7,048,909 - - - 71,567 - - 7,120,476 Insurance companies, Securities firms and Fund managers - - - - - - - 7,201 - - - - - - 7,201 Corporates 2,378,421 1,399,114 6,000,038 582,943 3,848,448 3,550,551 1,216,908 4,556,283 - 6,306,519 424,358 2,113,001 1,217,879 99,714 33,694,177 Regulatory retail 32,839 15,449 198,532 3,198 132,177 216,577 63,537 187,452 - 94,571 84,706 74,442 19,703,698 18,540 20,825,718 Residential mortgages - - - - - - - - - - - - 11,137,520 - 11,137,520 Higher risk assets - - - - - - - - - - - - 11,139 88,450 99,589 Other assets - - - - - - - - - - - - - 2,376,414 2,376,414 Securitisation exposures - - - - - - - 31,181 - 22,251 - - - - 53,432 Equity exposures - - 8 - - - - 4,066 - - - - - 136 4,210 Defaulted exposures 2,679 388 51,767 345 32,027 36,669 8,173 7 - 98,583 2,677 5,987 419,082 11,447 669,831 Total for on balance sheet exposures 2,413,939 1,414,951 6,250,345 586,486 4,012,652 3,803,797 1,288,618 11,835,099 6,856,897 6,521,924 511,741 2,264,997 32,489,318 2,594,701 82,845,465
Off balance sheet exposuresOTC derivatives 58,395 226,195 145,014 - 293 16,723 89,165 3,830,793 - 12,740 847 504 - - 4,380,669 Credit derivatives - - - - - - - 42 - - - - - - 42 Off balance sheet exposures other than OTC derivatives or Credit derivatives 192,103 399,954 1,509,913 274,441 1,652,870 680,518 257,135 604,077 - 1,141,086 143,088 278,049 1,902,699 4,807 9,040,740 Defaulted exposures - - 1,832 - 688 43,007 500 5,000 - - 3 1 32 117 51,180 Total for off balance sheet exposures 250,498 626,149 1,656,759 274,441 1,653,851 740,248 346,800 4,439,912 - 1,153,826 143,938 278,554 1,902,731 4,924 13,472,631
Total on and off balance sheet exposures 2,664,437 2,041,100 7,907,104 860,927 5,666,503 4,544,045 1,635,418 16,275,011 6,856,897 7,675,750 655,679 2,543,551 34,392,049 2,599,625 96,318,096
Company No. 8515-D
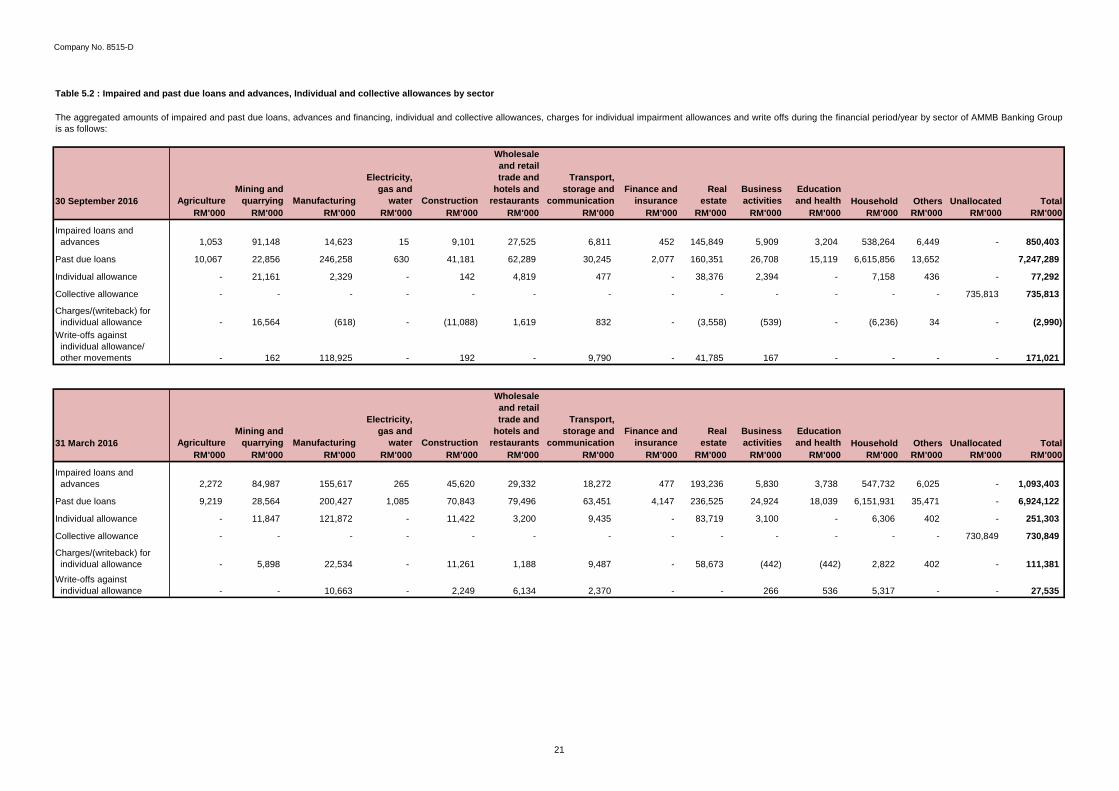
Table 5.2 : Impaired and past due loans and advances, Individual and collective allowances by sector
30 September 2016 Agriculture
Mining and
quarrying Manufacturing
Electricity,
gas and
water Construction
Wholesale
and retail
trade and
hotels and
restaurants
Transport,
storage and
communication
Finance and
insurance
Real
estate
Business
activities
Education
and health Household Others Unallocated Total
RM'000 RM'000 RM'000 RM'000 RM'000 RM'000 RM'000 RM'000 RM'000 RM'000 RM'000 RM'000 RM'000 RM'000 RM'000
1,053 91,148 14,623 15 9,101 27,525 6,811 452 145,849 5,909 3,204 538,264 6,449 - 850,403
10,067 22,856 246,258 630 41,181 62,289 30,245 2,077 160,351 26,708 15,119 6,615,856 13,652 7,247,289
- 21,161 2,329 - 142 4,819 477 - 38,376 2,394 - 7,158 436 - 77,292
- - - - - - - - - - - - - 735,813 735,813
- 16,564 (618) - (11,088) 1,619 832 - (3,558) (539) - (6,236) 34 - (2,990)
- 162 118,925 - 192 - 9,790 - 41,785 167 - - - - 171,021
Agriculture
Mining and
quarrying Manufacturing
Electricity,
gas and
water Construction
Wholesale
and retail
trade and
hotels and
restaurants
Transport,
storage and
communication
Finance and
insurance
Real
estate
Business
activities
Education
and health Household Others Unallocated Total
RM'000 RM'000 RM'000 RM'000 RM'000 RM'000 RM'000 RM'000 RM'000 RM'000 RM'000 RM'000 RM'000 RM'000 RM'000
2,272 84,987 155,617 265 45,620 29,332 18,272 477 193,236 5,830 3,738 547,732 6,025 - 1,093,403
9,219 28,564 200,427 1,085 70,843 79,496 63,451 4,147 236,525 24,924 18,039 6,151,931 35,471 - 6,924,122
- 11,847 121,872 - 11,422 3,200 9,435 - 83,719 3,100 - 6,306 402 - 251,303
- - - - - - - - - - - - - 730,849 730,849
- 5,898 22,534 - 11,261 1,188 9,487 - 58,673 (442) (442) 2,822 402 - 111,381
- - 10,663 - 2,249 6,134 2,370 - - 266 536 5,317 - - 27,535
The aggregated amounts of impaired and past due loans, advances and financing, individual and collective allowances, charges for individual impairment allowances and write offs during the financial period/year by sector of AMMB Banking Group
is as follows:
Write-offs against
individual allowance/
other movements
Impaired loans and
advances
Past due loans
Individual allowance
Collective allowance
Charges/(writeback) for
individual allowance
31 March 2016
Write-offs against
individual allowance
Impaired loans and
advances
Past due loans
Individual allowance
Collective allowance
Charges/(writeback) for
individual allowance
21
Company No. 8515-D
22
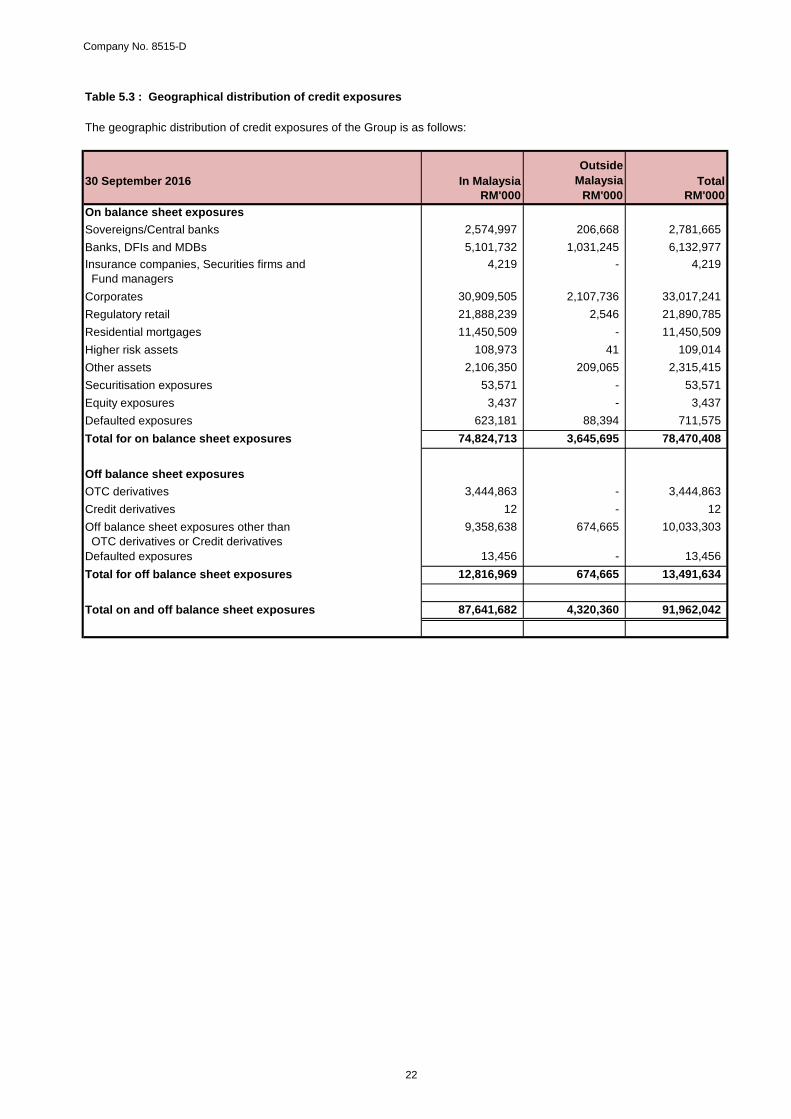
Table 5.3 : Geographical distribution of credit exposures
The geographic distribution of credit exposures of the Group is as follows:
30 September 2016 In MalaysiaOutside
Malaysia TotalRM'000 RM'000 RM'000
On balance sheet exposuresSovereigns/Central banks 2,574,997 206,668 2,781,665 Banks, DFIs and MDBs 5,101,732 1,031,245 6,132,977 Insurance companies, Securities firms and Fund managers
4,219 - 4,219
Corporates 30,909,505 2,107,736 33,017,241 Regulatory retail 21,888,239 2,546 21,890,785 Residential mortgages 11,450,509 - 11,450,509 Higher risk assets 108,973 41 109,014 Other assets 2,106,350 209,065 2,315,415 Securitisation exposures 53,571 - 53,571 Equity exposures 3,437 - 3,437 Defaulted exposures 623,181 88,394 711,575 Total for on balance sheet exposures 74,824,713 3,645,695 78,470,408
Off balance sheet exposuresOTC derivatives 3,444,863 - 3,444,863 Credit derivatives 12 - 12 Off balance sheet exposures other than OTC derivatives or Credit derivatives
9,358,638 674,665 10,033,303
Defaulted exposures 13,456 - 13,456 Total for off balance sheet exposures 12,816,969 674,665 13,491,634
Total on and off balance sheet exposures 87,641,682 4,320,360 91,962,042
Company No. 8515-D
23
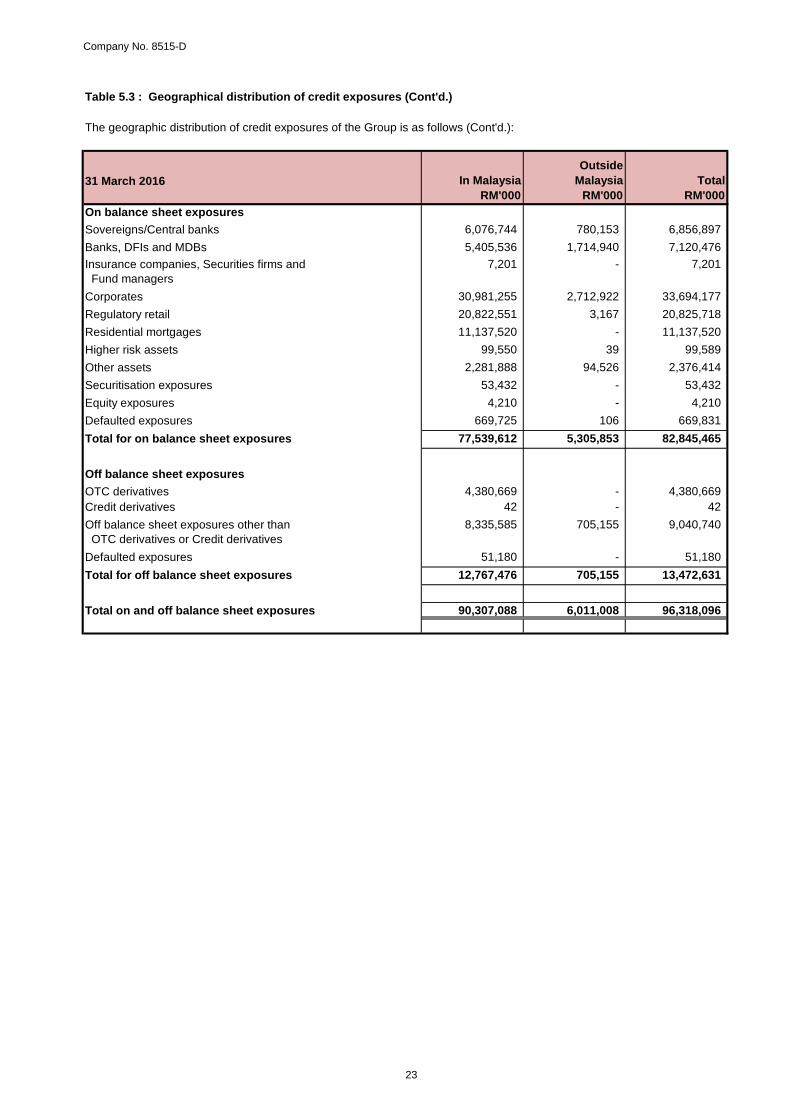
Table 5.3 : Geographical distribution of credit exposures (Cont'd.)
The geographic distribution of credit exposures of the Group is as follows (Cont'd.):
31 March 2016 In MalaysiaOutside
Malaysia TotalRM'000 RM'000 RM'000
On balance sheet exposuresSovereigns/Central banks 6,076,744 780,153 6,856,897 Banks, DFIs and MDBs 5,405,536 1,714,940 7,120,476 Insurance companies, Securities firms and Fund managers
7,201 - 7,201
Corporates 30,981,255 2,712,922 33,694,177 Regulatory retail 20,822,551 3,167 20,825,718 Residential mortgages 11,137,520 - 11,137,520 Higher risk assets 99,550 39 99,589 Other assets 2,281,888 94,526 2,376,414 Securitisation exposures 53,432 - 53,432 Equity exposures 4,210 - 4,210 Defaulted exposures 669,725 106 669,831 Total for on balance sheet exposures 77,539,612 5,305,853 82,845,465
Off balance sheet exposuresOTC derivatives 4,380,669 - 4,380,669 Credit derivatives 42 - 42 Off balance sheet exposures other than OTC derivatives or Credit derivatives
8,335,585 705,155 9,040,740
Defaulted exposures 51,180 - 51,180 Total for off balance sheet exposures 12,767,476 705,155 13,472,631
Total on and off balance sheet exposures 90,307,088 6,011,008 96,318,096
Company No. 8515-D
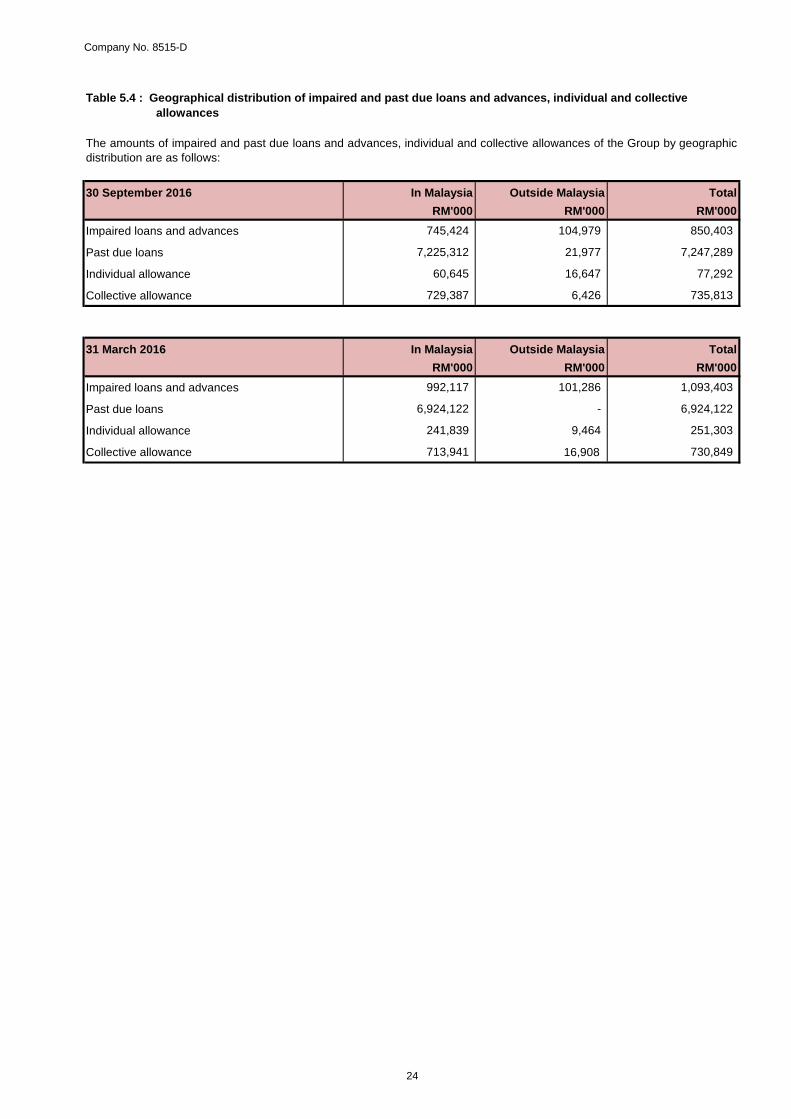
30 September 2016 In Malaysia Outside Malaysia Total
RM'000 RM'000 RM'000
Impaired loans and advances 745,424 104,979 850,403
Past due loans 7,225,312 21,977 7,247,289
Individual allowance 60,645 16,647 77,292
Collective allowance 729,387 6,426 735,813
31 March 2016 In Malaysia Outside Malaysia Total
RM'000 RM'000 RM'000
Impaired loans and advances 992,117 101,286 1,093,403
Past due loans 6,924,122 - 6,924,122
Individual allowance 241,839 9,464 251,303
Collective allowance 713,941 16,908 730,849
The amounts of impaired and past due loans and advances, individual and collective allowances of the Group by geographic
distribution are as follows:
Table 5.4 : Geographical distribution of impaired and past due loans and advances, individual and collective
allowances
Directors’ fees for directors who are executives of companies of the Group areThe Group and the Bank have lease commitments in respect of rented premises
24
Company No. 8515-D
25
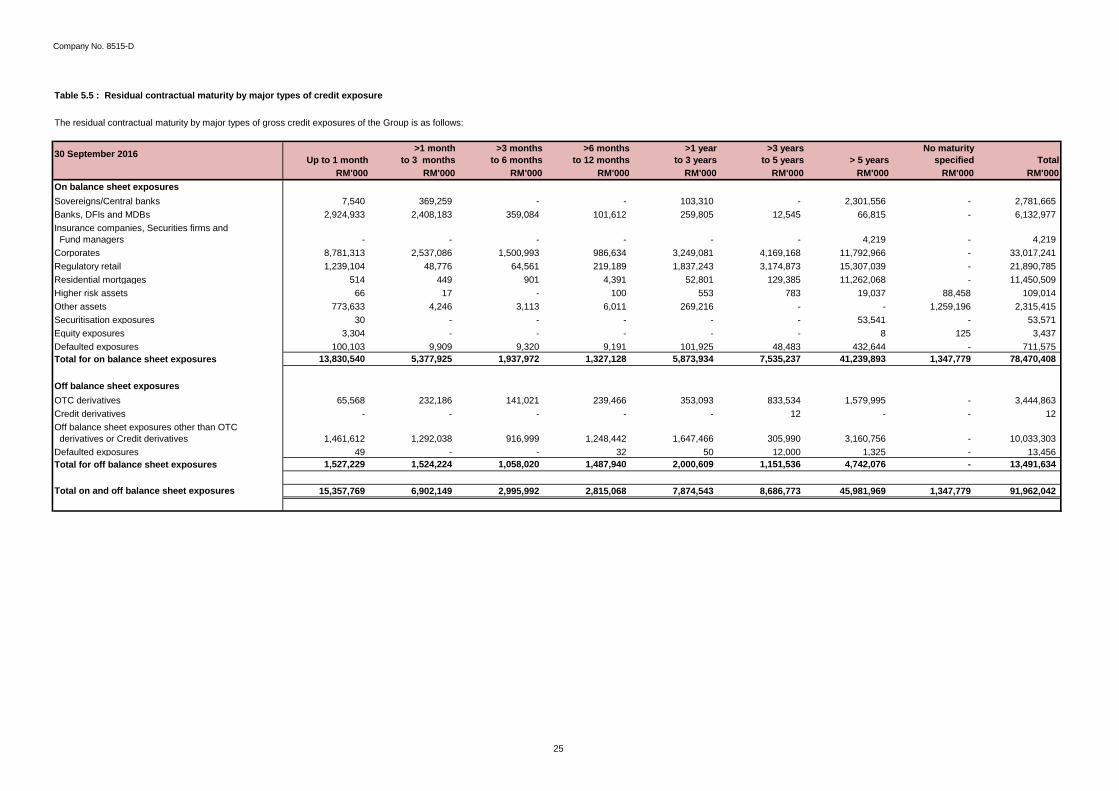
Table 5.5 : Residual contractual maturity by major types of credit exposure
The residual contractual maturity by major types of gross credit exposures of the Group is as follows:
30 September 2016 Up to 1 month >1 month
to 3 months>3 months
to 6 months>6 months
to 12 months>1 year
to 3 years>3 years
to 5 years > 5 yearsNo maturity
specified TotalRM'000 RM'000 RM'000 RM'000 RM'000 RM'000 RM'000 RM'000 RM'000
On balance sheet exposuresSovereigns/Central banks 7,540 369,259 - - 103,310 - 2,301,556 - 2,781,665 Banks, DFIs and MDBs 2,924,933 2,408,183 359,084 101,612 259,805 12,545 66,815 - 6,132,977 Insurance companies, Securities firms and Fund managers - - - - - - 4,219 - 4,219 Corporates 8,781,313 2,537,086 1,500,993 986,634 3,249,081 4,169,168 11,792,966 - 33,017,241 Regulatory retail 1,239,104 48,776 64,561 219,189 1,837,243 3,174,873 15,307,039 - 21,890,785 Residential mortgages 514 449 901 4,391 52,801 129,385 11,262,068 - 11,450,509 Higher risk assets 66 17 - 100 553 783 19,037 88,458 109,014 Other assets 773,633 4,246 3,113 6,011 269,216 - - 1,259,196 2,315,415 Securitisation exposures 30 - - - - - 53,541 - 53,571 Equity exposures 3,304 - - - - - 8 125 3,437 Defaulted exposures 100,103 9,909 9,320 9,191 101,925 48,483 432,644 - 711,575 Total for on balance sheet exposures 13,830,540 5,377,925 1,937,972 1,327,128 5,873,934 7,535,237 41,239,893 1,347,779 78,470,408
Off balance sheet exposuresOTC derivatives 65,568 232,186 141,021 239,466 353,093 833,534 1,579,995 - 3,444,863 Credit derivatives - - - - - 12 - - 12 Off balance sheet exposures other than OTC derivatives or Credit derivatives 1,461,612 1,292,038 916,999 1,248,442 1,647,466 305,990 3,160,756 - 10,033,303 Defaulted exposures 49 - - 32 50 12,000 1,325 - 13,456 Total for off balance sheet exposures 1,527,229 1,524,224 1,058,020 1,487,940 2,000,609 1,151,536 4,742,076 - 13,491,634
Total on and off balance sheet exposures 15,357,769 6,902,149 2,995,992 2,815,068 7,874,543 8,686,773 45,981,969 1,347,779 91,962,042
Company No. 8515-D
26
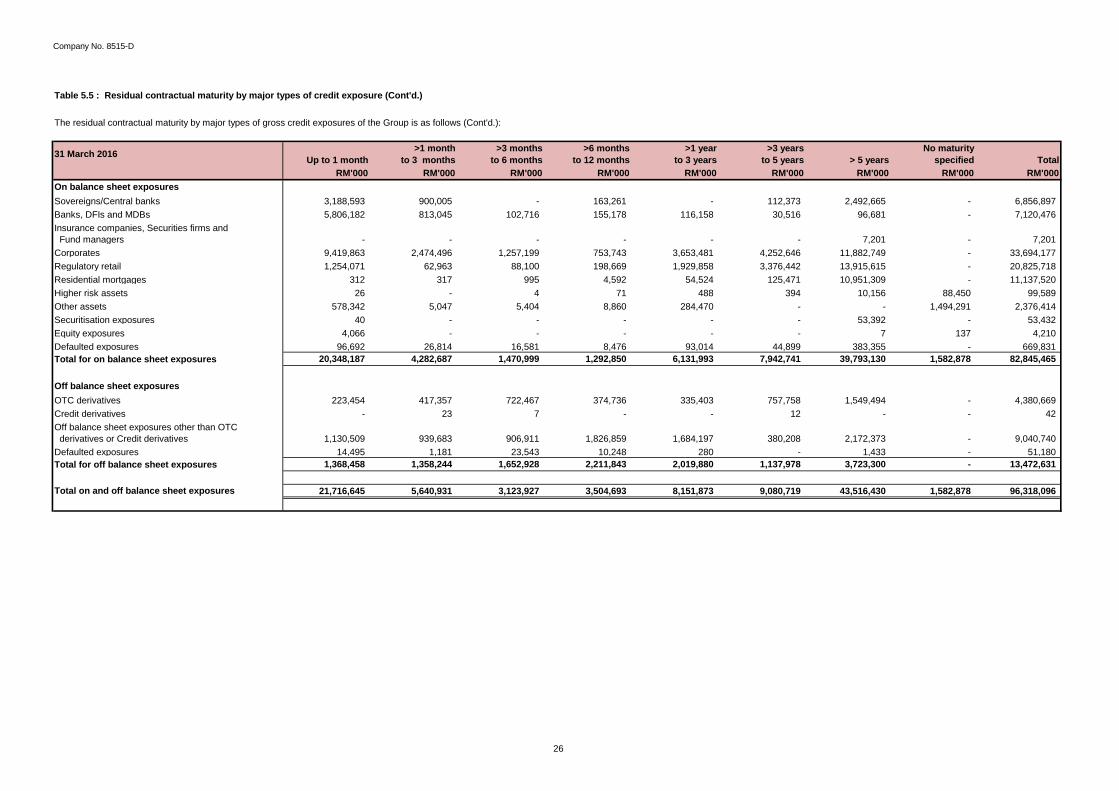
Table 5.5 : Residual contractual maturity by major types of credit exposure (Cont'd.)
The residual contractual maturity by major types of gross credit exposures of the Group is as follows (Cont'd.):
31 March 2016 Up to 1 month >1 month
to 3 months>3 months
to 6 months>6 months
to 12 months>1 year
to 3 years>3 years
to 5 years > 5 yearsNo maturity
specified TotalRM'000 RM'000 RM'000 RM'000 RM'000 RM'000 RM'000 RM'000 RM'000
On balance sheet exposuresSovereigns/Central banks 3,188,593 900,005 - 163,261 - 112,373 2,492,665 - 6,856,897 Banks, DFIs and MDBs 5,806,182 813,045 102,716 155,178 116,158 30,516 96,681 - 7,120,476 Insurance companies, Securities firms and Fund managers - - - - - - 7,201 - 7,201 Corporates 9,419,863 2,474,496 1,257,199 753,743 3,653,481 4,252,646 11,882,749 - 33,694,177 Regulatory retail 1,254,071 62,963 88,100 198,669 1,929,858 3,376,442 13,915,615 - 20,825,718 Residential mortgages 312 317 995 4,592 54,524 125,471 10,951,309 - 11,137,520 Higher risk assets 26 - 4 71 488 394 10,156 88,450 99,589 Other assets 578,342 5,047 5,404 8,860 284,470 - - 1,494,291 2,376,414 Securitisation exposures 40 - - - - - 53,392 - 53,432 Equity exposures 4,066 - - - - - 7 137 4,210 Defaulted exposures 96,692 26,814 16,581 8,476 93,014 44,899 383,355 - 669,831 Total for on balance sheet exposures 20,348,187 4,282,687 1,470,999 1,292,850 6,131,993 7,942,741 39,793,130 1,582,878 82,845,465
Off balance sheet exposuresOTC derivatives 223,454 417,357 722,467 374,736 335,403 757,758 1,549,494 - 4,380,669 Credit derivatives - 23 7 - - 12 - - 42 Off balance sheet exposures other than OTC derivatives or Credit derivatives 1,130,509 939,683 906,911 1,826,859 1,684,197 380,208 2,172,373 - 9,040,740 Defaulted exposures 14,495 1,181 23,543 10,248 280 - 1,433 - 51,180 Total for off balance sheet exposures 1,368,458 1,358,244 1,652,928 2,211,843 2,019,880 1,137,978 3,723,300 - 13,472,631
Total on and off balance sheet exposures 21,716,645 5,640,931 3,123,927 3,504,693 8,151,873 9,080,719 43,516,430 1,582,878 96,318,096
Company No. 8515-D
27
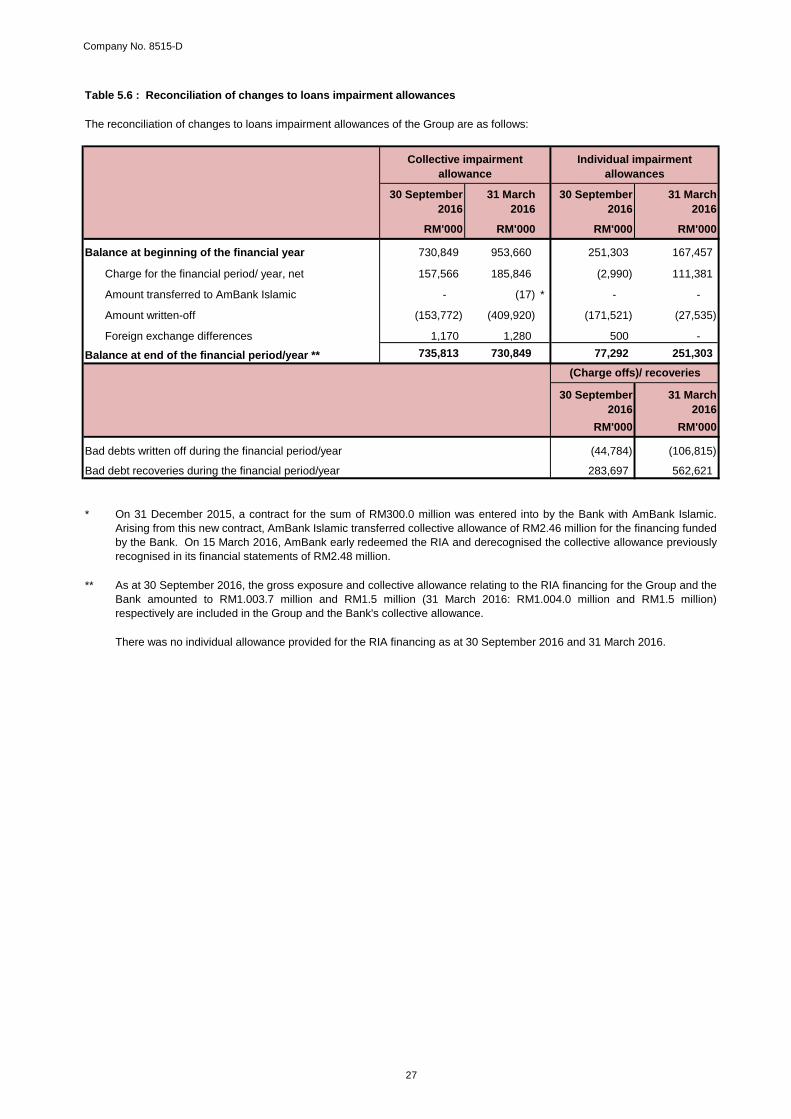
Table 5.6 : Reconciliation of changes to loans impairment allowances
30 September2016
31 March2016
30 September2016
31 March2016
RM'000 RM'000 RM'000 RM'000
Balance at beginning of the financial year 730,849 953,660 251,303 167,457
Charge for the financial period/ year, net 157,566 185,846 (2,990) 111,381
Amount transferred to AmBank Islamic - (17) * - -
Amount written-off (153,772) (409,920) (171,521) (27,535)
Foreign exchange differences 1,170 1,280 500 -
Balance at end of the financial period/year ** 735,813 730,849 77,292 251,303
30 September2016
31 March2016
RM'000 RM'000
Bad debts written off during the financial period/year (44,784) (106,815)
Bad debt recoveries during the financial period/year 283,697 562,621
*
**
On 31 December 2015, a contract for the sum of RM300.0 million was entered into by the Bank with AmBank Islamic.Arising from this new contract, AmBank Islamic transferred collective allowance of RM2.46 million for the financing fundedby the Bank. On 15 March 2016, AmBank early redeemed the RIA and derecognised the collective allowance previouslyrecognised in its financial statements of RM2.48 million.
As at 30 September 2016, the gross exposure and collective allowance relating to the RIA financing for the Group and theBank amounted to RM1.003.7 million and RM1.5 million (31 March 2016: RM1.004.0 million and RM1.5 million)respectively are included in the Group and the Bank's collective allowance.
There was no individual allowance provided for the RIA financing as at 30 September 2016 and 31 March 2016.
The reconciliation of changes to loans impairment allowances of the Group are as follows:
(Charge offs)/ recoveries
Collective impairment allowance
Individual impairment allowances
Company No. 8515-D
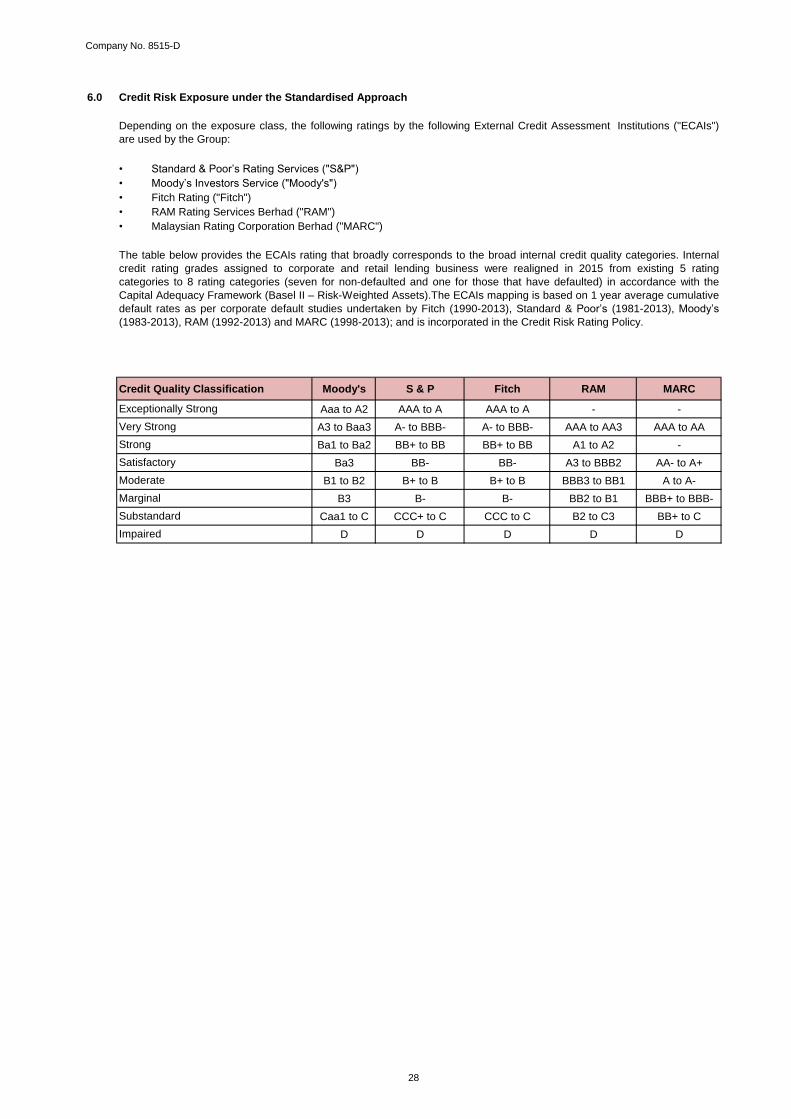
6.0 Credit Risk Exposure under the Standardised Approach
• Standard & Poor’s Rating Services ("S&P")
• Moody’s Investors Service ("Moody's")
• Fitch Rating ("Fitch")
• RAM Rating Services Berhad ("RAM")
• Malaysian Rating Corporation Berhad ("MARC")
Credit Quality Classification Moody's S & P Fitch RAM MARC
Aaa to A2 AAA to A AAA to A - -
A3 to Baa3 A- to BBB- A- to BBB- AAA to AA3 AAA to AA
Ba1 to Ba2 BB+ to BB BB+ to BB A1 to A2 -
Ba3 BB- BB- A3 to BBB2 AA- to A+
B1 to B2 B+ to B B+ to B BBB3 to BB1 A to A-
B3 B- B- BB2 to B1 BBB+ to BBB-
Caa1 to C CCC+ to C CCC to C B2 to C3 BB+ to C
D D D D D
Satisfactory
Marginal
Substandard
Impaired
The table below provides the ECAIs rating that broadly corresponds to the broad internal credit quality categories. Internal
credit rating grades assigned to corporate and retail lending business were realigned in 2015 from existing 5 rating
categories to 8 rating categories (seven for non-defaulted and one for those that have defaulted) in accordance with the
Capital Adequacy Framework (Basel II – Risk-Weighted Assets).The ECAIs mapping is based on 1 year average cumulative
default rates as per corporate default studies undertaken by Fitch (1990-2013), Standard & Poor’s (1981-2013), Moody’s
(1983-2013), RAM (1992-2013) and MARC (1998-2013); and is incorporated in the Credit Risk Rating Policy.
Exceptionally Strong
Very Strong
Strong
Depending on the exposure class, the following ratings by the following External Credit Assessment Institutions ("ECAIs")
are used by the Group:
Moderate
28
Company No. 8515-D
29
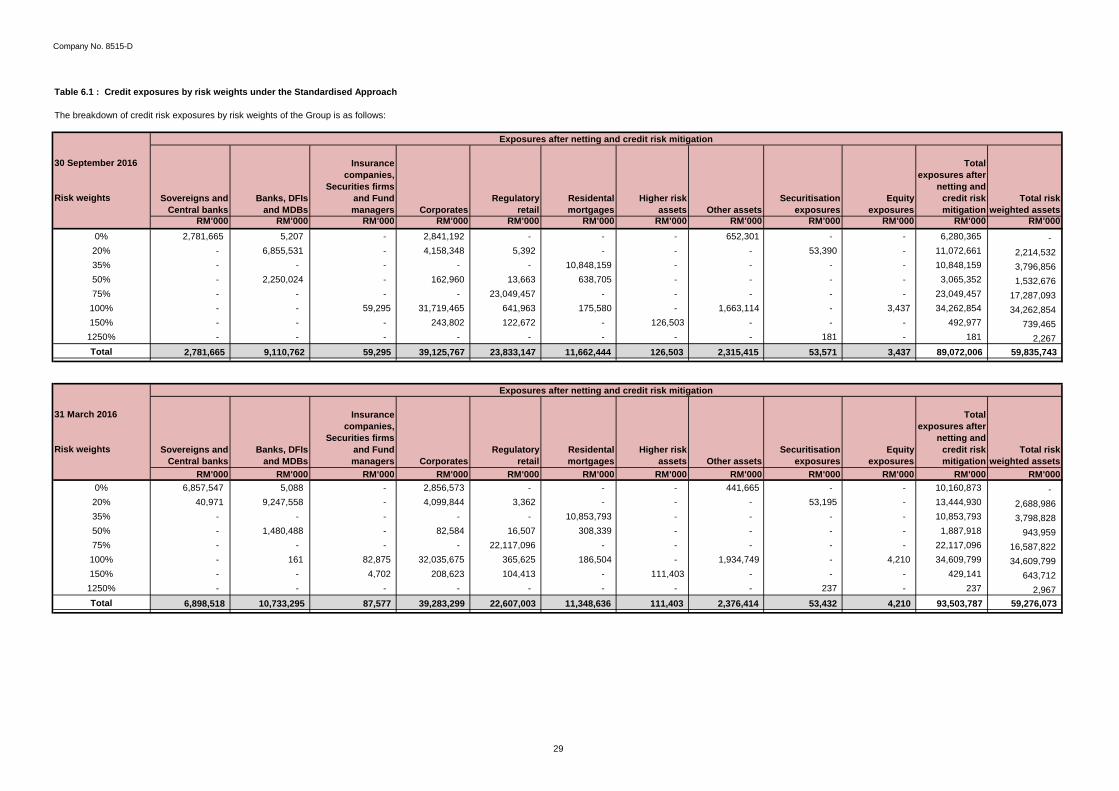
Table 6.1 : Credit exposures by risk weights under the Standardised Approach
The breakdown of credit risk exposures by risk weights of the Group is as follows:
Sovereigns and Central banks
Banks, DFIs and MDBs
Insurance companies,
Securities firms and Fund managers Corporates
Regulatory retail
Residental mortgages
Higher risk assets Other assets
Securitisation exposures
Equityexposures
Total exposures after
netting and credit risk mitigation
Total risk weighted assets
RM'000 RM'000 RM'000 RM'000 RM'000 RM'000 RM'000 RM'000 RM'000 RM'000 RM'000 RM'0000% 2,781,665 5,207 - 2,841,192 - - - 652,301 - - 6,280,365 -
20% - 6,855,531 - 4,158,348 5,392 - - - 53,390 - 11,072,661 2,214,532 35% - - - - - 10,848,159 - - - - 10,848,159 3,796,856 50% - 2,250,024 - 162,960 13,663 638,705 - - - - 3,065,352 1,532,676 75% - - - - 23,049,457 - - - - - 23,049,457 17,287,093
100% - - 59,295 31,719,465 641,963 175,580 - 1,663,114 - 3,437 34,262,854 34,262,854 150% - - - 243,802 122,672 - 126,503 - - - 492,977 739,465
1250% - - - - - - - - 181 - 181 2,267 Total 2,781,665 9,110,762 59,295 39,125,767 23,833,147 11,662,444 126,503 2,315,415 53,571 3,437 89,072,006 59,835,743
Sovereigns and Central banks
Banks, DFIs and MDBs
Insurance companies,
Securities firms and Fund managers Corporates
Regulatory retail
Residental mortgages
Higher risk assets Other assets
Securitisation exposures
Equityexposures
Total exposures after
netting and credit risk mitigation
Total risk weighted assets
RM'000 RM'000 RM'000 RM'000 RM'000 RM'000 RM'000 RM'000 RM'000 RM'000 RM'000 RM'0000% 6,857,547 5,088 - 2,856,573 - - - 441,665 - - 10,160,873 -
20% 40,971 9,247,558 - 4,099,844 3,362 - - - 53,195 - 13,444,930 2,688,986 35% - - - - - 10,853,793 - - - - 10,853,793 3,798,828 50% - 1,480,488 - 82,584 16,507 308,339 - - - - 1,887,918 943,959 75% - - - - 22,117,096 - - - - - 22,117,096 16,587,822
100% - 161 82,875 32,035,675 365,625 186,504 - 1,934,749 - 4,210 34,609,799 34,609,799 150% - - 4,702 208,623 104,413 - 111,403 - - - 429,141 643,712
1250% - - - - - - - - 237 - 237 2,967 Total 6,898,518 10,733,295 87,577 39,283,299 22,607,003 11,348,636 111,403 2,376,414 53,432 4,210 93,503,787 59,276,073
30 September 2016
Risk weights
Exposures after netting and credit risk mitigation
31 March 2016
Risk weights
Exposures after netting and credit risk mitigation
Company No. 8515-D
30
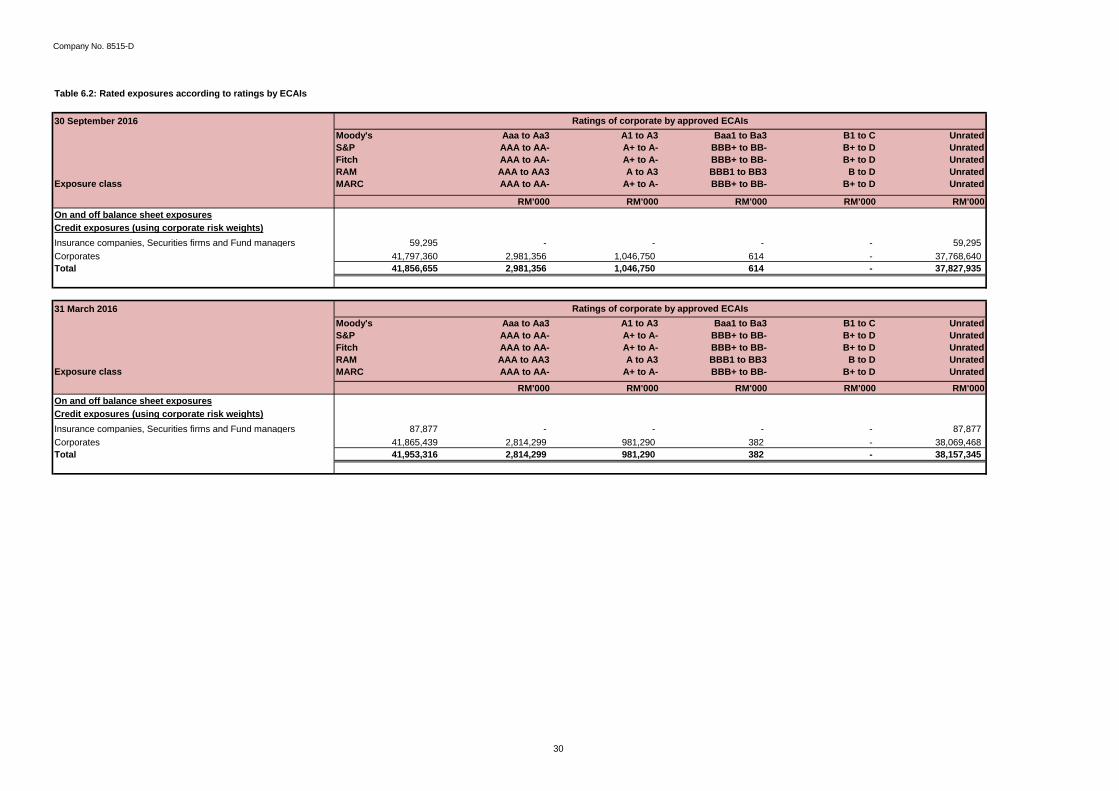
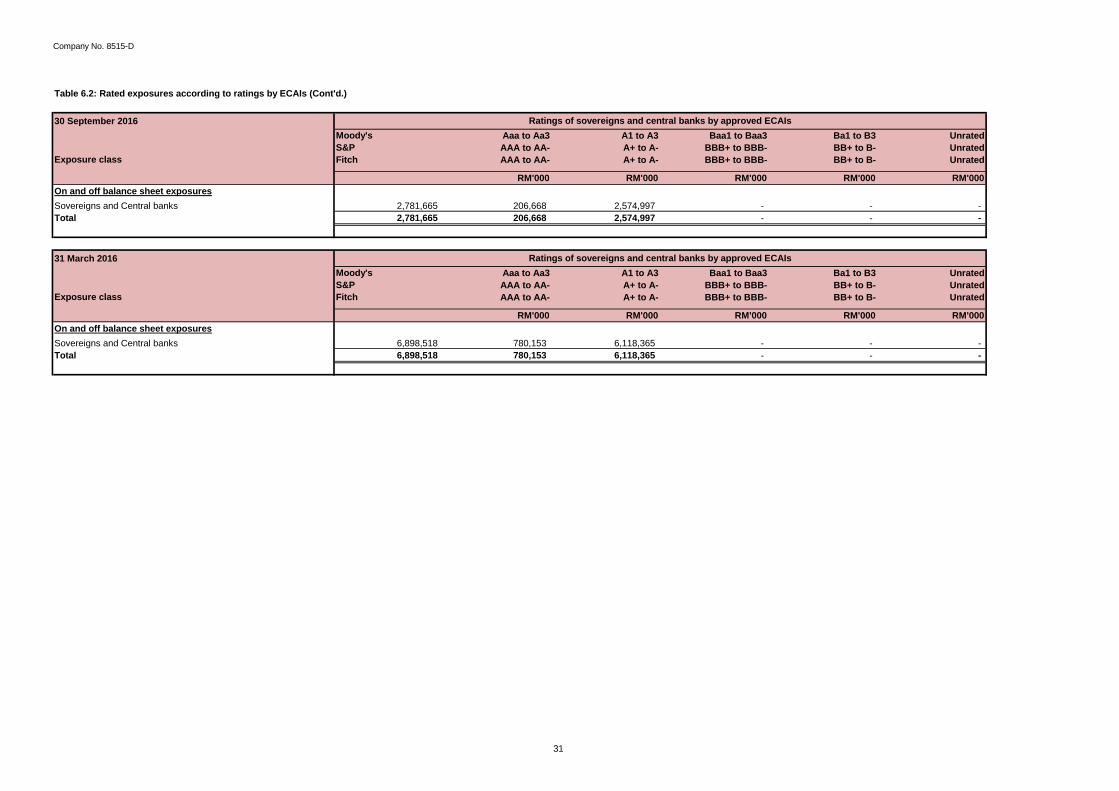
Table 6.2: Rated exposures according to ratings by ECAIs
30 September 2016Moody's Aaa to Aa3 A1 to A3 Baa1 to Ba3 B1 to C UnratedS&P AAA to AA- A+ to A- BBB+ to BB- B+ to D UnratedFitch AAA to AA- A+ to A- BBB+ to BB- B+ to D UnratedRAM AAA to AA3 A to A3 BBB1 to BB3 B to D Unrated
Exposure class MARC AAA to AA- A+ to A- BBB+ to BB- B+ to D Unrated
RM'000 RM'000 RM'000 RM'000 RM'000On and off balance sheet exposuresCredit exposures (using corporate risk weights)Insurance companies, Securities firms and Fund managers 59,295 - - - - 59,295 Corporates 41,797,360 2,981,356 1,046,750 614 - 37,768,640 Total 41,856,655 2,981,356 1,046,750 614 - 37,827,935
31 March 2016Moody's Aaa to Aa3 A1 to A3 Baa1 to Ba3 B1 to C UnratedS&P AAA to AA- A+ to A- BBB+ to BB- B+ to D UnratedFitch AAA to AA- A+ to A- BBB+ to BB- B+ to D UnratedRAM AAA to AA3 A to A3 BBB1 to BB3 B to D Unrated
Exposure class MARC AAA to AA- A+ to A- BBB+ to BB- B+ to D Unrated
RM'000 RM'000 RM'000 RM'000 RM'000On and off balance sheet exposuresCredit exposures (using corporate risk weights)Insurance companies, Securities firms and Fund managers 87,877 - - - - 87,877 Corporates 41,865,439 2,814,299 981,290 382 - 38,069,468 Total 41,953,316 2,814,299 981,290 382 - 38,157,345
Ratings of corporate by approved ECAIs
Ratings of corporate by approved ECAIs
Company No. 8515-D
31
Table 6.2: Rated exposures according to ratings by ECAIs (Cont'd.)
30 September 2016Moody's Aaa to Aa3 A1 to A3 Baa1 to Baa3 Ba1 to B3 UnratedS&P AAA to AA- A+ to A- BBB+ to BBB- BB+ to B- Unrated
Exposure class Fitch AAA to AA- A+ to A- BBB+ to BBB- BB+ to B- Unrated
RM'000 RM'000 RM'000 RM'000 RM'000On and off balance sheet exposuresSovereigns and Central banks 2,781,665 206,668 2,574,997 - - - Total 2,781,665 206,668 2,574,997 - - -
31 March 2016Moody's Aaa to Aa3 A1 to A3 Baa1 to Baa3 Ba1 to B3 UnratedS&P AAA to AA- A+ to A- BBB+ to BBB- BB+ to B- Unrated
Exposure class Fitch AAA to AA- A+ to A- BBB+ to BBB- BB+ to B- Unrated
RM'000 RM'000 RM'000 RM'000 RM'000On and off balance sheet exposuresSovereigns and Central banks 6,898,518 780,153 6,118,365 - - - Total 6,898,518 780,153 6,118,365 - - -
Ratings of sovereigns and central banks by approved ECAIs
Ratings of sovereigns and central banks by approved ECAIs
Company No. 8515-D
32
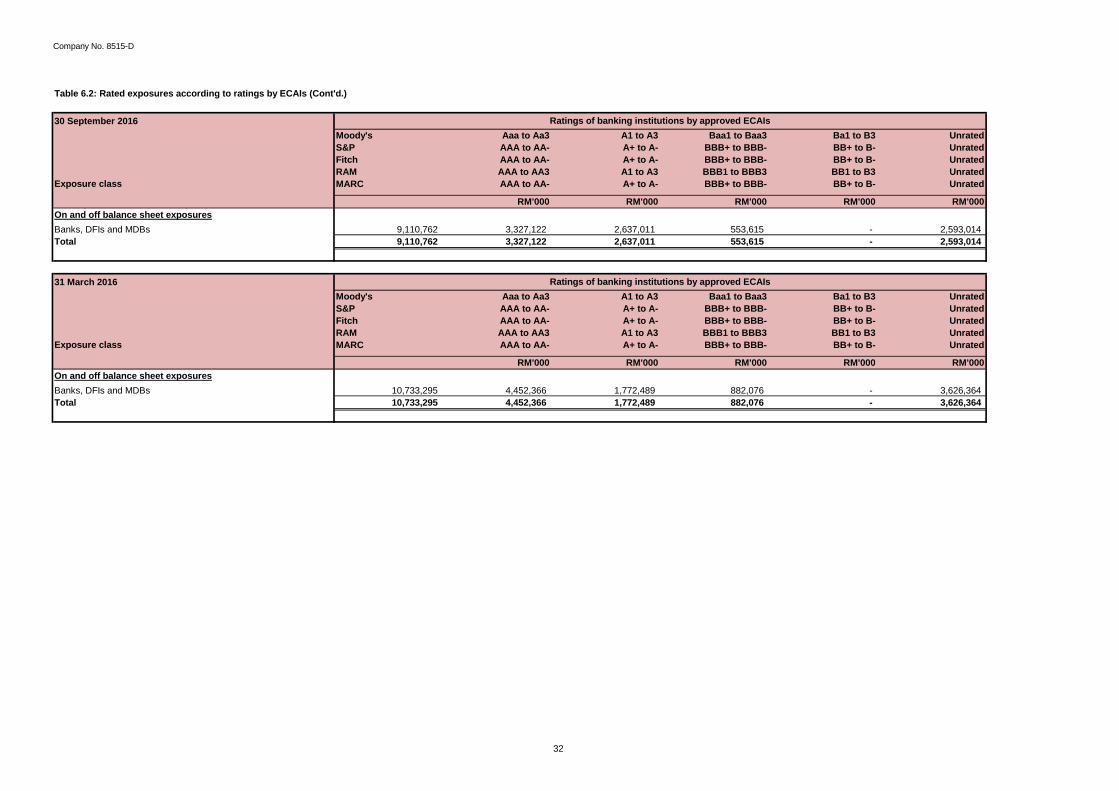
Table 6.2: Rated exposures according to ratings by ECAIs (Cont'd.)
30 September 2016Moody's Aaa to Aa3 A1 to A3 Baa1 to Baa3 Ba1 to B3 UnratedS&P AAA to AA- A+ to A- BBB+ to BBB- BB+ to B- UnratedFitch AAA to AA- A+ to A- BBB+ to BBB- BB+ to B- UnratedRAM AAA to AA3 A1 to A3 BBB1 to BBB3 BB1 to B3 Unrated
Exposure class MARC AAA to AA- A+ to A- BBB+ to BBB- BB+ to B- Unrated
RM'000 RM'000 RM'000 RM'000 RM'000On and off balance sheet exposuresBanks, DFIs and MDBs 9,110,762 3,327,122 2,637,011 553,615 - 2,593,014 Total 9,110,762 3,327,122 2,637,011 553,615 - 2,593,014
31 March 2016Moody's Aaa to Aa3 A1 to A3 Baa1 to Baa3 Ba1 to B3 UnratedS&P AAA to AA- A+ to A- BBB+ to BBB- BB+ to B- UnratedFitch AAA to AA- A+ to A- BBB+ to BBB- BB+ to B- UnratedRAM AAA to AA3 A1 to A3 BBB1 to BBB3 BB1 to B3 Unrated
Exposure class MARC AAA to AA- A+ to A- BBB+ to BBB- BB+ to B- Unrated
RM'000 RM'000 RM'000 RM'000 RM'000On and off balance sheet exposuresBanks, DFIs and MDBs 10,733,295 4,452,366 1,772,489 882,076 - 3,626,364 Total 10,733,295 4,452,366 1,772,489 882,076 - 3,626,364
Ratings of banking institutions by approved ECAIs
Ratings of banking institutions by approved ECAIs
Company No. 8515-D
33
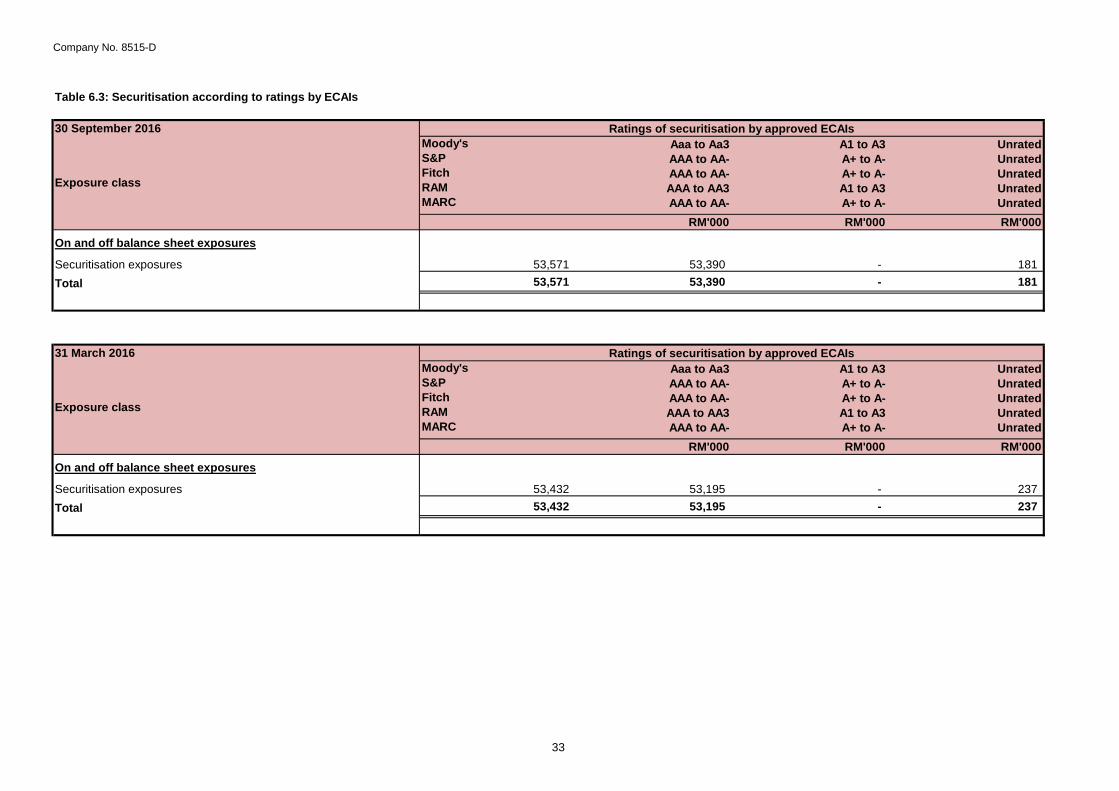
Table 6.3: Securitisation according to ratings by ECAIs
30 September 2016Moody's Aaa to Aa3 A1 to A3 UnratedS&P AAA to AA- A+ to A- UnratedFitch AAA to AA- A+ to A- UnratedRAM AAA to AA3 A1 to A3 UnratedMARC AAA to AA- A+ to A- Unrated
RM'000 RM'000 RM'000
On and off balance sheet exposures
Securitisation exposures 53,571 53,390 - 181 Total 53,571 53,390 - 181
31 March 2016Moody's Aaa to Aa3 A1 to A3 UnratedS&P AAA to AA- A+ to A- UnratedFitch AAA to AA- A+ to A- UnratedRAM AAA to AA3 A1 to A3 UnratedMARC AAA to AA- A+ to A- Unrated
RM'000 RM'000 RM'000
On and off balance sheet exposures
Securitisation exposures 53,432 53,195 - 237 Total 53,432 53,195 - 237
Ratings of securitisation by approved ECAIs
Exposure class
Ratings of securitisation by approved ECAIs
Exposure class
Company No. 8515-D
34
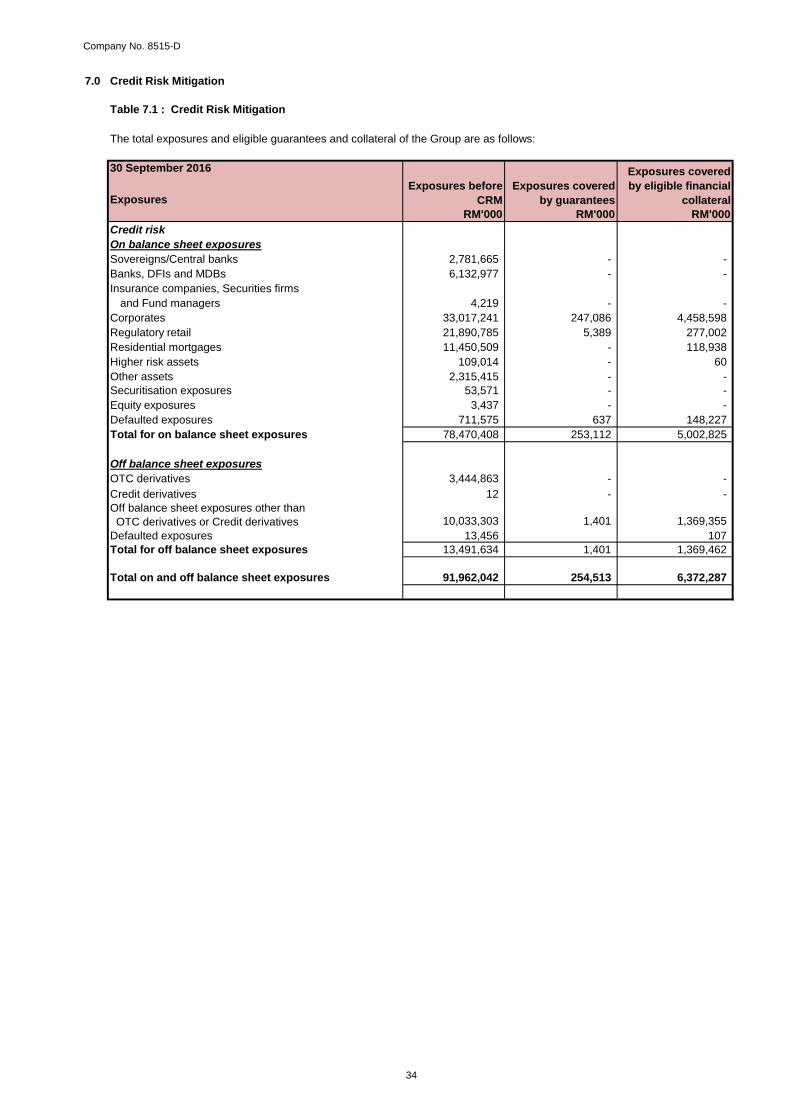
7.0 Credit Risk Mitigation
Table 7.1 : Credit Risk Mitigation
The total exposures and eligible guarantees and collateral of the Group are as follows:
30 September 2016
ExposuresRM'000 RM'000 RM'000
Credit riskOn balance sheet exposuresSovereigns/Central banks 2,781,665 - - Banks, DFIs and MDBs 6,132,977 - - Insurance companies, Securities firms
and Fund managers 4,219 - - Corporates 33,017,241 247,086 4,458,598 Regulatory retail 21,890,785 5,389 277,002 Residential mortgages 11,450,509 - 118,938 Higher risk assets 109,014 - 60 Other assets 2,315,415 - - Securitisation exposures 53,571 - - Equity exposures 3,437 - - Defaulted exposures 711,575 637 148,227 Total for on balance sheet exposures 78,470,408 253,112 5,002,825
Off balance sheet exposuresOTC derivatives 3,444,863 - - Credit derivatives 12 - - Off balance sheet exposures other than OTC derivatives or Credit derivatives 10,033,303 1,401 1,369,355 Defaulted exposures 13,456 107 Total for off balance sheet exposures 13,491,634 1,401 1,369,462
Total on and off balance sheet exposures 91,962,042 254,513 6,372,287
Exposures before CRM
Exposures covered by guarantees
Exposures covered by eligible financial
collateral
Company No. 8515-D
35
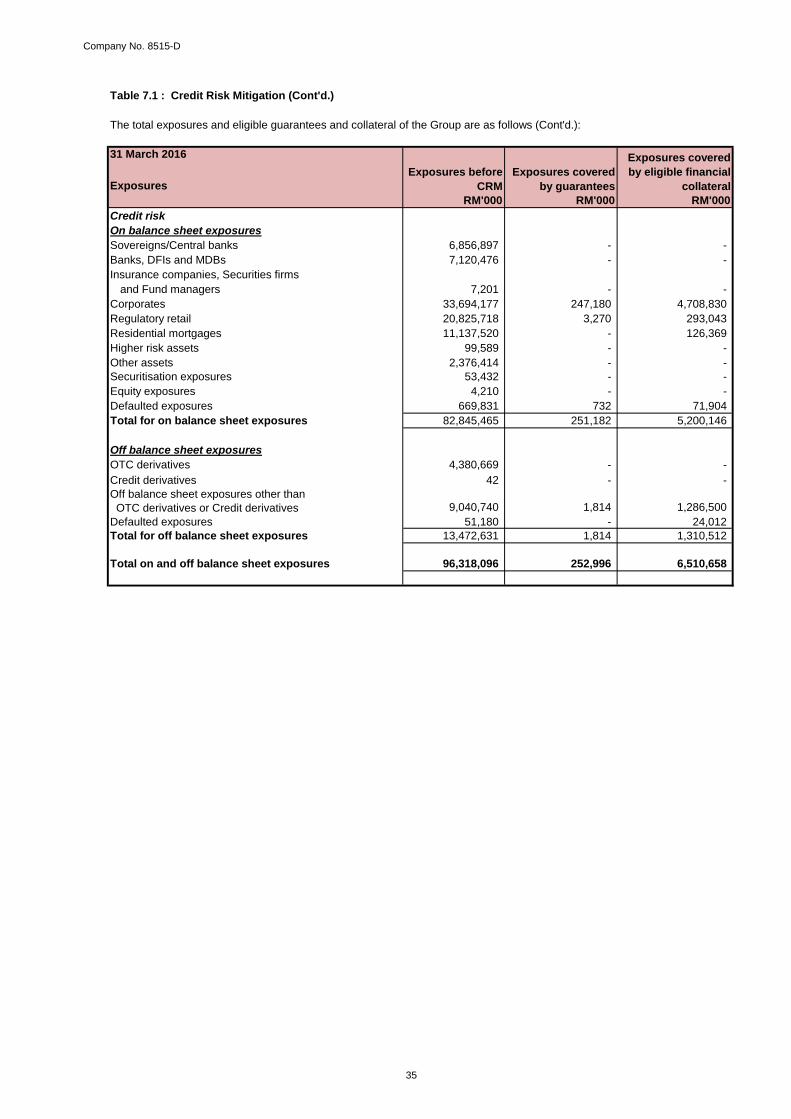
Table 7.1 : Credit Risk Mitigation (Cont'd.)
The total exposures and eligible guarantees and collateral of the Group are as follows (Cont'd.):
31 March 2016
ExposuresRM'000 RM'000 RM'000
Credit riskOn balance sheet exposuresSovereigns/Central banks 6,856,897 - - Banks, DFIs and MDBs 7,120,476 - - Insurance companies, Securities firms
and Fund managers 7,201 - - Corporates 33,694,177 247,180 4,708,830 Regulatory retail 20,825,718 3,270 293,043 Residential mortgages 11,137,520 - 126,369 Higher risk assets 99,589 - - Other assets 2,376,414 - - Securitisation exposures 53,432 - - Equity exposures 4,210 - - Defaulted exposures 669,831 732 71,904 Total for on balance sheet exposures 82,845,465 251,182 5,200,146
Off balance sheet exposuresOTC derivatives 4,380,669 - - Credit derivatives 42 - - Off balance sheet exposures other than OTC derivatives or Credit derivatives 9,040,740 1,814 1,286,500 Defaulted exposures 51,180 - 24,012 Total for off balance sheet exposures 13,472,631 1,814 1,310,512
Total on and off balance sheet exposures 96,318,096 252,996 6,510,658
Exposures before CRM
Exposures covered by guarantees
Exposures covered by eligible financial
collateral
Company No. 8515-D
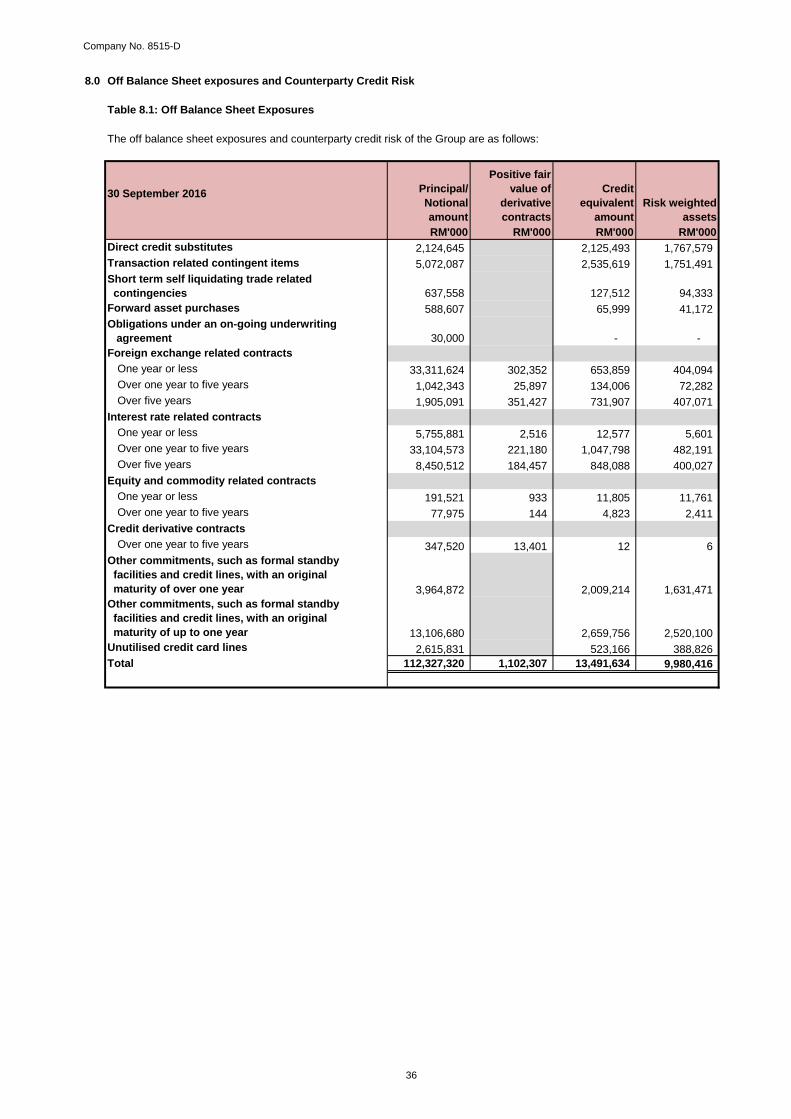
36
8.0 Off Balance Sheet exposures and Counterparty Credit Risk
Table 8.1: Off Balance Sheet Exposures
The off balance sheet exposures and counterparty credit risk of the Group are as follows:
30 September 2016 Principal/ Notional amount
Positive fair value of
derivative contracts
Credit equivalent
amountRisk weighted
assetsRM'000 RM'000 RM'000 RM'000
Direct credit substitutes 2,124,645 2,125,493 1,767,579 Transaction related contingent items 5,072,087 2,535,619 1,751,491 Short term self liquidating trade related contingencies 637,558 127,512 94,333 Forward asset purchases 588,607 65,999 41,172 Obligations under an on-going underwriting agreement 30,000 - - Foreign exchange related contracts
One year or less 33,311,624 302,352 653,859 404,094 Over one year to five years 1,042,343 25,897 134,006 72,282 Over five years 1,905,091 351,427 731,907 407,071
Interest rate related contractsOne year or less 5,755,881 2,516 12,577 5,601 Over one year to five years 33,104,573 221,180 1,047,798 482,191 Over five years 8,450,512 184,457 848,088 400,027
Equity and commodity related contractsOne year or less 191,521 933 11,805 11,761 Over one year to five years 77,975 144 4,823 2,411
Credit derivative contractsOver one year to five years 347,520 13,401 12 6
Other commitments, such as formal standby facilities and credit lines, with an original maturity of over one year 3,964,872 2,009,214 1,631,471 Other commitments, such as formal standby facilities and credit lines, with an original maturity of up to one year 13,106,680 2,659,756 2,520,100 Unutilised credit card lines 2,615,831 523,166 388,826 Total 112,327,320 1,102,307 13,491,634 9,980,416

Company No. 8515-D
37
Table 8.1: Off Balance Sheet Exposures (Cont'd.)
The off balance sheet exposures and counterparty credit risk of the Group are as follows:
31 March 2016 Principal/ Notional amount
Positive fair value of
derivative contracts
Credit equivalent
amountRisk weighted
assetsRM'000 RM'000 RM'000 RM'000
Direct credit substitutes 2,014,648 2,014,648 1,678,972 Transaction related contingent items 4,305,652 2,152,826 1,383,638 Short term self liquidating trade related contingencies 528,516 105,703 81,118 Assets sold with recourse 200 200 200 Forward asset purchases 856,526 82,275 65,604 Obligations under on-going underwriting agreements 60,000 - - Foreign exchange related contracts
One year or less 42,733,469 1,224,495 1,712,330 788,627 Over one year to five years 1,125,883 38,416 144,281 75,319 Over five years 1,980,369 281,465 656,786 359,512
Interest rate related contractsOne year or less 8,175,391 3,740 15,068 5,163 Over one year to five years 31,003,999 174,684 943,333 300,595 Over five years 9,423,151 149,030 892,707 216,844
Equity and commodity related contractsOne year or less 159,106 1,878 10,617 10,617 Over one year to five years 73,572 1,133 5,547 2,774
Credit derivative contractsOne year or less 337,027 485 30 15 Over one year to five years 336,367 19,493 12 6
Other commitments, such as formal standby facilities and credit lines, with an original maturity of over one year 3,703,251 1,854,126 1,516,296 Other commitments, such as formal standby facilities and credit lines, with an original maturity of up to one year 11,841,565 2,408,212 2,258,762 Unutilised credit card lines 2,369,650 473,930 352,075 Total 121,028,342 1,894,819 13,472,631 9,096,137
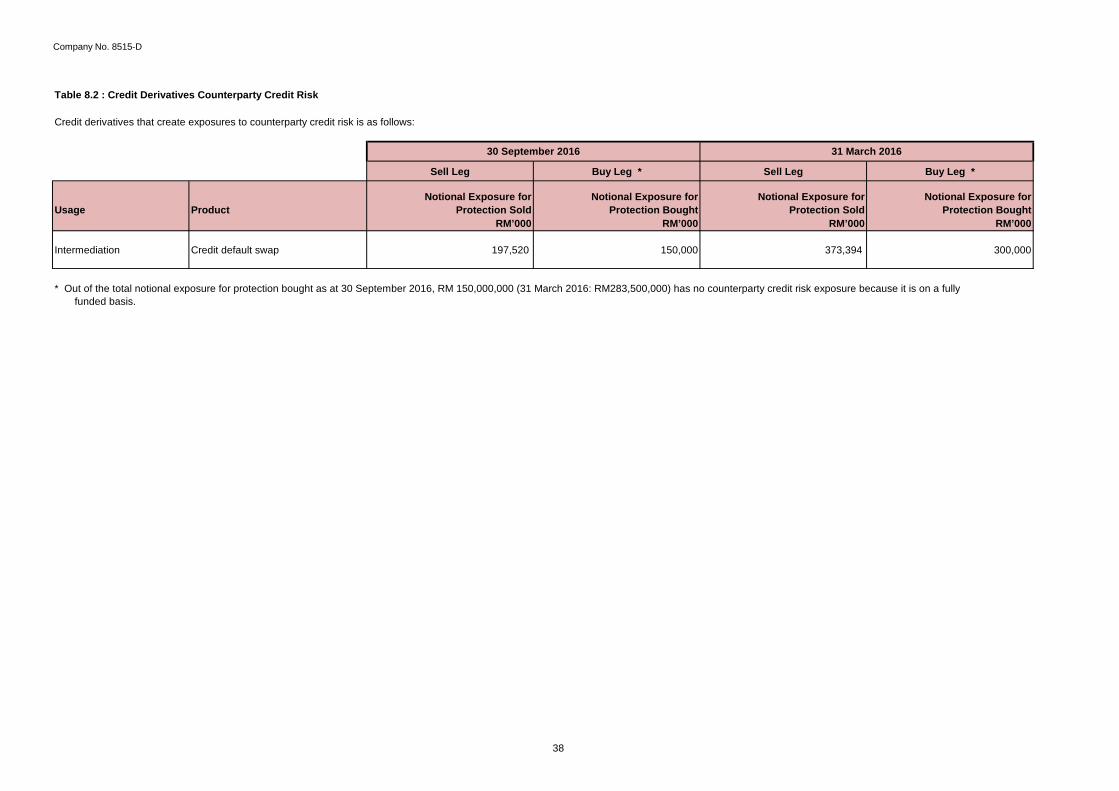
Company No. 8515-D
38
Table 8.2 : Credit Derivatives Counterparty Credit Risk
Credit derivatives that create exposures to counterparty credit risk is as follows:
Sell Leg Buy Leg * Sell Leg Buy Leg *
Usage ProductNotional Exposure for
Protection Sold Notional Exposure for
Protection BoughtNotional Exposure for
Protection Sold Notional Exposure for
Protection BoughtRM’000 RM’000 RM’000 RM’000
Intermediation Credit default swap 197,520 150,000 373,394 300,000
* Out of the total notional exposure for protection bought as at 30 September 2016, RM 150,000,000 (31 March 2016: RM283,500,000) has no counterparty credit risk exposure because it is on a fully funded basis.
30 September 2016 31 March 2016
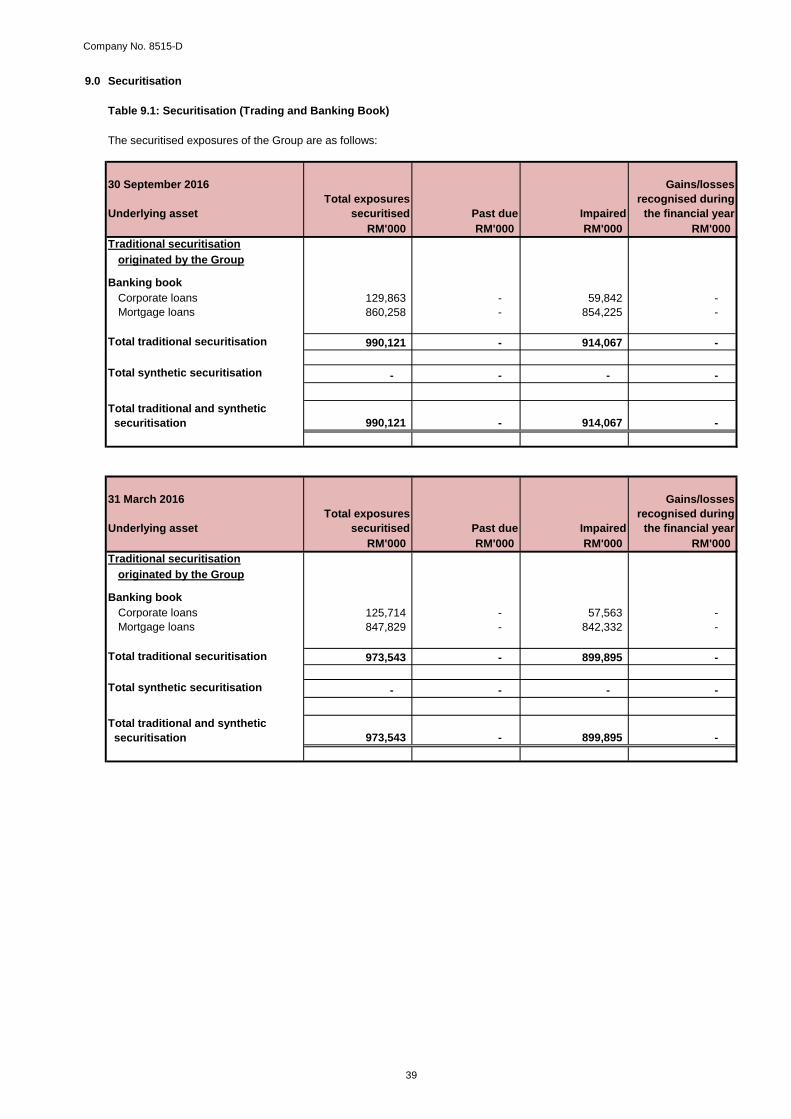
Company No. 8515-D
39
9.0 Securitisation
Table 9.1: Securitisation (Trading and Banking Book)
The securitised exposures of the Group are as follows:
30 September 2016
Underlying asset Total exposures
securitised Past due Impaired
Gains/losses recognised during
the financial yearRM'000 RM'000 RM'000 RM'000
Traditional securitisationoriginated by the Group
Banking bookCorporate loans 129,863 - 59,842 - Mortgage loans 860,258 - 854,225 -
Total traditional securitisation 990,121 - 914,067 -
Total synthetic securitisation - - - -
Total traditional and synthetic securitisation 990,121 - 914,067 -
31 March 2016
Underlying asset Total exposures
securitised Past due Impaired
Gains/losses recognised during
the financial yearRM'000 RM'000 RM'000 RM'000
Traditional securitisationoriginated by the Group
Banking bookCorporate loans 125,714 - 57,563 - Mortgage loans 847,829 - 842,332 -
Total traditional securitisation 973,543 - 899,895 -
Total synthetic securitisation - - - -
Total traditional and synthetic securitisation 973,543 - 899,895 -
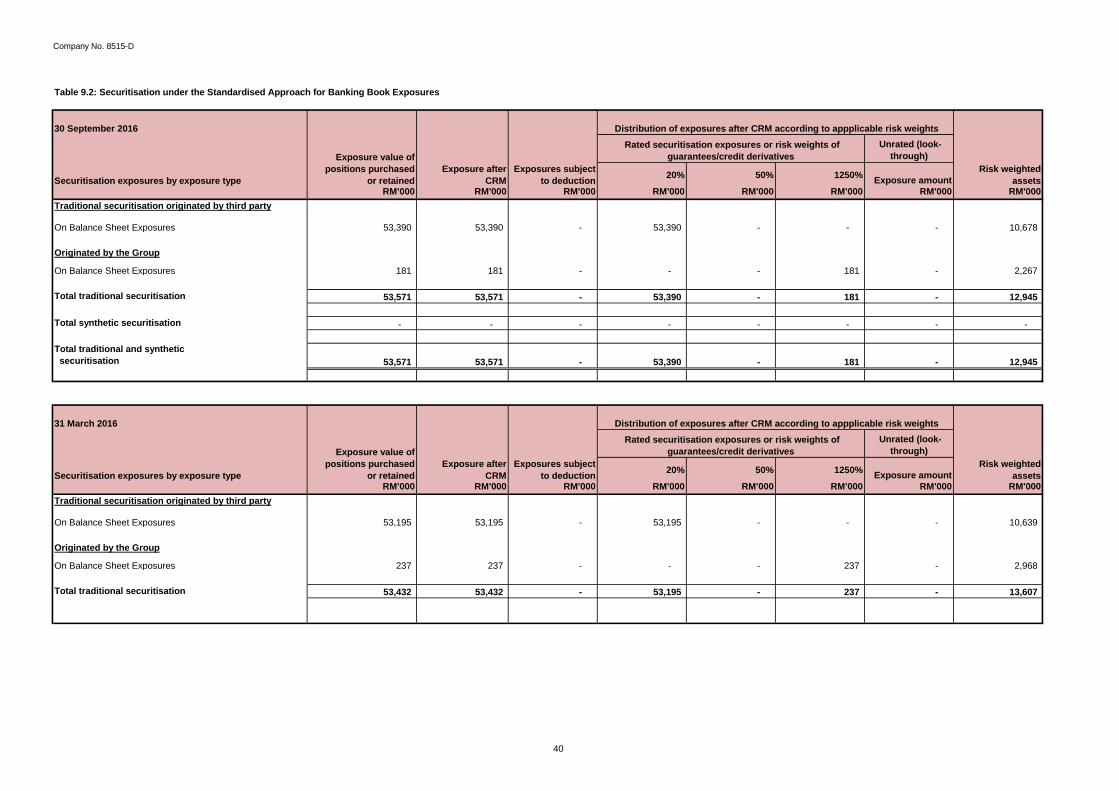
Company No. 8515-D
40
Table 9.2: Securitisation under the Standardised Approach for Banking Book Exposures
30 September 2016 Unrated (look-
through)
20% 50% 1250% Exposure amount RM'000 RM'000 RM'000 RM'000 RM'000 RM'000 RM'000 RM'000
Traditional securitisation originated by third party
On Balance Sheet Exposures 53,390 53,390 - 53,390 - - - 10,678
Originated by the Group
On Balance Sheet Exposures 181 181 - - - 181 - 2,267
Total traditional securitisation 53,571 53,571 - 53,390 - 181 - 12,945
Total synthetic securitisation - - - - - - - -
Total traditional and synthetic securitisation 53,571 53,571 - 53,390 - 181 - 12,945
31 March 2016 Unrated (look-
through)
20% 50% 1250% Exposure amount RM'000 RM'000 RM'000 RM'000 RM'000 RM'000 RM'000 RM'000
Traditional securitisation originated by third party
On Balance Sheet Exposures 53,195 53,195 - 53,195 - - - 10,639
Originated by the Group
On Balance Sheet Exposures 237 237 - - - 237 - 2,968
Total traditional securitisation 53,432 53,432 - 53,195 - 237 - 13,607
Securitisation exposures by exposure type
Securitisation exposures by exposure type
Exposure value of positions purchased
or retained Exposure after
CRM
Exposure value of positions purchased
or retained Exposure after
CRM
Risk weighted assets
Risk weighted assets
Distribution of exposures after CRM according to appplicable risk weights Rated securitisation exposures or risk weights of
guarantees/credit derivatives
Rated securitisation exposures or risk weights of guarantees/credit derivatives
Exposures subject to deduction
Distribution of exposures after CRM according to appplicable risk weights
Exposures subject to deduction
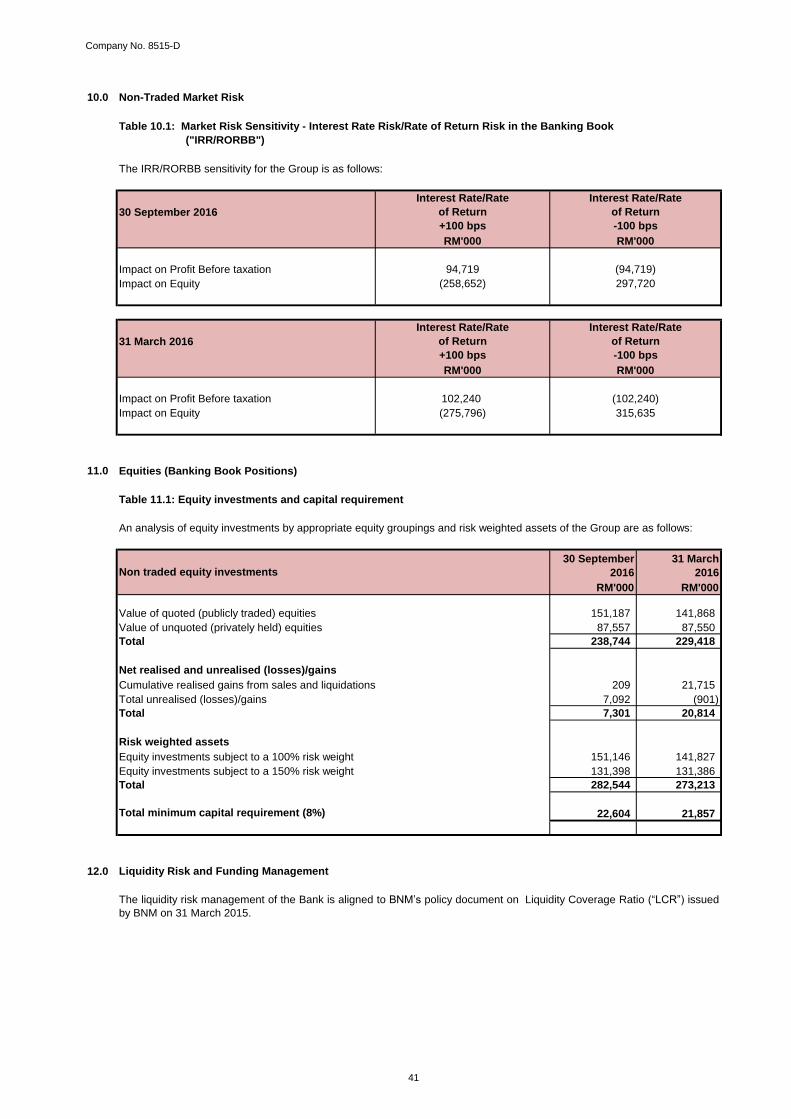
Company No. 8515-D
10.0 Non-Traded Market Risk
The IRR/RORBB sensitivity for the Group is as follows:
30 September 2016
Impact on Profit Before taxation
Impact on Equity
31 March 2016
Impact on Profit Before taxation
Impact on Equity
11.0
Table 11.1: Equity investments and capital requirement
30 September
2016
31 March
2016
RM'000 RM'000
Value of quoted (publicly traded) equities 151,187 141,868
Value of unquoted (privately held) equities 87,557 87,550
Total 238,744 229,418
Net realised and unrealised (losses)/gains
Cumulative realised gains from sales and liquidations 209 21,715
Total unrealised (losses)/gains 7,092 (901)
Total 7,301 20,814
Risk weighted assets
Equity investments subject to a 100% risk weight 151,146 141,827
Equity investments subject to a 150% risk weight 131,398 131,386
Total 282,544 273,213
Total minimum capital requirement (8%) 22,604 21,857
12.0 Liquidity Risk and Funding Management
(94,719)94,719
Non traded equity investments
297,720
RM'000
Interest Rate/Rate
of Return
-100 bps
Equities (Banking Book Positions)
An analysis of equity investments by appropriate equity groupings and risk weighted assets of the Group are as follows:
The liquidity risk management of the Bank is aligned to BNM’s policy document on Liquidity Coverage Ratio (“LCR”) issued
by BNM on 31 March 2015.
102,240
(275,796)
(102,240)
315,635
(258,652)
RM'000
RM'000
Interest Rate/Rate
of Return
+100 bps
RM'000
Interest Rate/Rate
of Return
+100 bps
Interest Rate/Rate
of Return
-100 bps
Table 10.1: Market Risk Sensitivity - Interest Rate Risk/Rate of Return Risk in the Banking Book
("IRR/RORBB")
41


![Mudarabah Creation Oracle FLEXCUBE Universal Banking ... · Mudarabah Creation . Oracle FLEXCUBE Universal Banking . Release 12.0 [12June] [20 ] Oracle Part Number E51527-01](https://static.documents.pub/doc/80x56/5f0a92a37e708231d42c4b6c/mudarabah-creation-oracle-flexcube-universal-banking-mudarabah-creation-oracle.jpg)

