60
Ambulance Services, England 2012-13 Published 19 June 2013

Ambulance Services, England 2012-13
Published 19 June 2013

Ambulance Services, England 2012-13
2 Copyright © 2013, Health and Social Care Information Centre. All rights reserved.
We are the trusted source of authoritative data and information relating to health and care.
www.hscic.gov.uk
Author: Health and Social Care Information Centre (HSCIC), Workforce and Facilities Team
Responsible statistician: Kate Anderson, Programme Manager
Version: V1.0
Date of publication
19 June 2013

Ambulance Services, England 2012-13
3 Copyright © 2013, Health and Social Care Information Centre. All rights reserved.
Contents
Summary 4 Revisions and Issues 6 Introduction 6 Data Quality 7 Analysis and Commentary 10 Aid to interpretation 20 Users and uses 24 Definitions 26 Further information 27 Index to tables 28 Reference tables 29 Annex 1 : KA34 guidance notes 45 Annex 2 : KA34 form 58
Ambulance Services, England 2012-13
4 Copyright © 2013, Health and Social Care Information Centre. All rights reserved.
Summary
In 2012-13 KA34:
The total number of emergency calls was 9.08 million, a 587,972 (6.9%) increase over last year when there were 8.49 million. Of these 2.95 million (32.5%) were category A (immediately life threatening).
Of all calls, 6.98 million (76.9%) resulted in an emergency response arriving at the scene of the incident, a 268,472 (4.0%) increase over last year when there were 6.71 million.
The number of emergency patient journeys was 5.02 million, 97,835 (2.0%) more than the
previous year when there were 4.92 million. Of these journeys, 4.53 million (90.3%) were taken to a type 1&2 A&E destination and 0.49
million (9.7%) were taken elsewhere. (Type 1 A&E department = A consultant led 24 hour service with full resuscitation facilities and designated
accommodation for the reception of accident and emergency patients Type 2 A&E department = A consultant led single specialty accident and emergency service (e.g.
ophthalmology, dental) with designated accommodation for the reception of patients) 1.99 million patients were treated at the scene and did not need onward transportation. This is
an increase of 181,115 (10.0%) since last year. Of these 681,230 (34.2%) were classed as category A.
There were 364,965 category C (emergency calls which are not immediately life threatening)
calls resolved with telephone advice, equating to 6.0 per cent of all category C calls.
There were 8,622 calls where following the arrival of a response, no ambulance was required. This is 10,929 (55.9%) less than last year and the lowest on record (first collected in 2007-08).
Ambulance Quality Indicators (AQI)12: The percentage of category A (immediately life threatening) incidents that resulted in an
emergency response arriving at the scene of the incident within 8 minutes in 2012-13 was:
a) 75.5 per cent (April – May) b) 74.0 per cent (Red 1, June - March) c) 75.6 per cent (Red 2, June – March)
1 Ambulance response times for 2012-13 are taken from NHS England‟s collection “Unify2 data collection – AmbSYS System Indicators” In this publication these figures will be referred to as Ambulance Quality Indicators (AQI). 2 From June 2012 category A 8 minute was split into Red 1 (most urgent) and Red 2 (serious but less time critical). Due to differing clock start times it is not possible to split previous years into these new categories therefore no direct comparisons can be made with previous years.

Ambulance Services, England 2012-13
5 Copyright © 2013, Health and Social Care Information Centre. All rights reserved.
Of the 12 NHS organisations providing ambulance services, the following number met or exceeded the 75% standard for 8 minute response times.34
a) 9 met or exceeded 75% (April – May) b) 7 met or exceeded 75% (Red 1, June - April) c) 11 met or exceeded 75% (Red 2, June – April)
The West Midlands Ambulance Service responded to the largest proportion of Category A Red
1 calls within eight minutes at 78.9% and the East Midlands Ambulance Service responded to the smallest proportion (70.0%).
The percentage of category A incidents that resulted in an ambulance vehicle capable of
transporting the patient arriving at the scene within 19 minutes5 was 96.0% (AQI data). Last year this was 96.8% (KA34) however this data is not directly comparable due to different clock start times.
Notes: i. Ambulance response times are taken from NHS England‟s collection “Unify2 data collection – AmbSYS
System Indicators” In this publication these figures will be referred to as Ambulance Quality Indicators (AQI).
ii. All definition explanations (including Cat A, Cat C) are available in the Definitions section (page 26) or Annex 1 (page 47)
iii. The AQI full set of data tables can be accessed at:
http://www.england.nhs.uk/statistics/ambulance-quality-indicators/ http://webarchive.nationalarchives.gov.uk/20130402145952/http:/transparency.dh.gov.uk/2012/06/19/ambqiguidance/ http://webarchive.nationalarchives.gov.uk/20130402145952/http:/transparency.dh.gov.uk/2012/06/19/ambqidownloads/
3 Ambulance response times for 2012-13 are taken from NHS England‟s collection “Unify2 data collection – AmbSYS System Indicators” In this publication these figures will be referred to as Ambulance Quality Indicators (AQI). 4 From June 2012 category A 8 minute was split into Red 1 (most urgent) and Red 2 (serious but less time critical). Due to differing clock start times it is not possible to split previous years into these new categories therefore no direct comparisons can be made with previous years. 5 While the category A 19 still retains the 95% standards (an ambulance response arriving at the scene within 19 minutes in 95% of cases) the change in Red 1 and Red 2 clock start times means data from 2012-13 is not directly comparable with earlier years.

Ambulance Services, England 2012-13
6 Copyright © 2013, Health and Social Care Information Centre. All rights reserved.
Revisions and Issues
Consultation on future of KA34: In January 2013 the Health and Social Care Information Centre published a consultation paper which outlined the changes to the source information used to produce the publication. The proposal to use the AQI data as an alternative source of data for the publication replacing the existing KA34 would change the content and layout to the annual report on Ambulance services.
The consultation closed in April 2013 and we received 2 responses from key users. We are very grateful for the feedback received. Further investigation is required following comments received and we are presently working with all relevant parties to finalise the outcomes from the consultation. We expect to report on the final outcome of the consultation during August 2013.
As part of these on-going investigations it was decided to run the KA34 collection for 2012-13 and use this year‟s data to make comparisons with the monthly data. Where possible both the KA34 and AQI data are shown within the publication for comparison purposes.
Great Western Ambulance Service Trust: As from 1st February 2013 Great Western Ambulance trust dissolved (its services were taken on by South Western Ambulance Service Foundation Trust). For background comparability purposes we have merged the two trusts as a separate line of data within the tables. However this is used only as an estimate and these figures are not highlighted within this report unless it is seen as useful additional information.
Introduction
Information about the ambulance services provided by the National Health Service in England has been collected on the Health and Social Care Information Centre (HSCIC) return KA34; a copy of which is included at the end of this bulletin (Annex 1).
The information is collected from individual ambulance organisations and shows volume of activity, and performance levels against required standards (e.g. responses within 8 or 19 minutes). This includes information on emergency calls, response times and patient destinations. This information is shown nationally and by each ambulance trust.
The HSCIC welcomes feedback on the methodology and tables within this publication. Please contact us with your comments and suggestions, clearly stating „Ambulance Services, England‟ as the subject heading, via: Email: [email protected] Telephone: 0845 300 6016 Post: 1 Trevelyan Square, Boar Lane, Leeds, LS1 6AE.

Ambulance Services, England 2012-13
7 Copyright © 2013, Health and Social Care Information Centre. All rights reserved.
Data Quality
Accuracy:
Ambulance services use two approved call prioritisation systems (the Medical Priority Dispatch System and NHS Pathways) to map codes that comprise of categories A (immediately life threatening) and C (emergency calls which are not immediately life threatening). The two ambulance trust systems are used to extract the information to complete the annual KA34 quality of ambulance services return data submission to the Health and Social Care Information Centre (HSCIC). The HSCIC‟s Omnibus system for collecting the data has some inbuilt validations based on previous year‟s thresholds. Data once signed off is returned to the HSCIC. The only areas not validated are new data items.
The KA34 is an established data collection based on 100% data i.e. not a sample and as such no estimation of the figures is needed and hence there is no sampling error.
The two ambulance trust systems are also used to extract the AQI information to complete the monthly AQI return to NHS England.
Relevance:
The statistics address user demand for numbers of calls, response times and patient journeys by Ambulance trust within England. The tables published in the release aim to answer the common questions previously raised. Users of the statistics are encouraged to contact us to let us know how they use the data with correspondence received included at the design and development meeting of the next publication which will decide if the requests can be accommodated in the next publication.
We consult with key users prior to making changes, and where possible publicise changes on the internet, at committees and other networks to consult with users more widely. We aim to respond quickly to policy changes to ensure our statistics remain relevant.
The statistics also meet NHS operating framework performance requirements. These are used by the Department of Health, NHS England, the Care Quality Commission (for performance indicators), to answer Parliamentary Questions, press queries and are available for use by any NHS organisation or the general public.
We actively review all our outputs and welcome feedback; if you would like to make any comments, please e-mail [email protected]
Comparability and Coherence:
Due to changes in methodology from time to time there are occasional breaks in time series. Where there are changes to the data provided, this is shown clearly in the outputs (with relevant notes). Where advance warning is known of future changes these will be pre-announced in accordance with HSCIC policy.
Agreed standards and definitions within England provide assurance that the data is consistent across ambulance trusts.
From 1st June 2012, the A8 measure was split into two parts, Red 1 and Red 2. This split reflects the way that ambulance trusts already sub-divide their Category A calls for operational purposes. Red 1 calls are the most time critical and cover cardiac arrest patients who are not breathing and do not have a pulse, and other severe conditions such as airway

Ambulance Services, England 2012-13
8 Copyright © 2013, Health and Social Care Information Centre. All rights reserved.
obstruction. Red 2 calls are serious but less immediately time critical and cover conditions such as stroke and fits. Due to differing clock start times it is not possible to split previous years into these new categories therefore no direct comparisons can be made with previous years. The differences in clock start times also affects category A 19 minute response times which are no longer directly comparable with earlier years.
Due to a Ministerial decision to cease Cat B 19 data from 1 April 2011, all category B information was stopped. It is no longer possible to collect this data or make any estimates for category B data going forward. This also has an effect on the other categories (primarily Cat C but will also affect Cat A) as data that would have been previously categorised as B will now be either A or C. Please note this should not affect national overall totals where data is not split by category and does not affect proportions such as 8 or 19 minute response times, for years prior to 2011-12. Data for 2011-12 and onwards is comparable unless otherwise stated due to other changes.
Since April 2007 urgent calls have been included with emergency calls and direct comparisons of absolute numbers with years prior to 2007-08 are not possible. However performance against response time requirements for 2007-08 and earlier years should not be significantly affected and comparisons have been made where possible. (Note: response times from 2008-09 are not comparable with earlier years – see the „update‟ section for more details).
The KA34 guidance is reviewed annually by the Urgent and Emergency Care Branch including the National Ambulance Director within Department of Health and discussions take place regularly with key ambulance trust stakeholders.
Guidance for 2012-13 KA34 ambulance services return is available in Annex 1 or at:
http://www.hscic.gov.uk/datacollections/ka34
There is similar information available from other parts of the UK but the data is not exactly comparable due to local definitions and standards in each area –see UK Home countries section on page 16 for further details.
Timeliness and punctuality:
All outputs adhere to the Code of Practice for Statistics by pre-announcing the date of publication through the Publications-Calendar web page on the HSCIC website.
The ambulance services data is made available as soon as possible after it has been validated and compiled (June each year).
Accessibility:
All data areas are published, however further detailed analyses may be available on request, subject to resource limits and compliance with disclosure control requirements. Data is also available on the website in a csv format to enable users to download the data in a suitable format for their purposes. The statistics are published in an accessible, orderly, pre-announced manner on the HSCIC website at 9:30am on the day of publication. Simultaneously this release is also published on the National Statistics Publication Hub.
This publication is accompanied by a press statement distributed by the press team to national and local press officers.
Ambulance Services, England 2012-13
9 Copyright © 2013, Health and Social Care Information Centre. All rights reserved.
Performance cost and respondent burden
The KA34 and AQI are simple data collections and asks trusts to provide data that they already collect and is produced from existing administrative systems with a minimal burden.
Confidentiality, Transparency and Security:
The standard HSCIC data security and confidentiality policies have been applied in the production of these statistics.

Ambulance Services, England 2012-13
10 Copyright © 2013, Health and Social Care Information Centre. All rights reserved.
Analysis and Commentary
Emergency calls and incidents (Tables 1- 8)
In 2012-13 there were almost 9.1 million calls recorded. Of these calls, 6.98 million (76.9%) resulted in the arrival of an emergency response at the scene of the incident. This compares with 6.71 million (79.0%) last year.
By trust, the proportion of calls resulting in a response arriving varies between 87.6% in South Western and 63.1% in London. The highest and lowest proportions last year were 88.6% in South Western and 64.9% in London.
These figures are influenced by the type of category of call received. For example if the proportion of category C calls received is high, (London 72.8% of emergency calls received are for category C with South Western receiving 68.0% of this call type) this may result in more emergency calls being resolved over the phone and thus no requirement for an emergency vehicle.
Figure 1 shows by Ambulance service the number (in thousands) of Emergency calls and the number of these that resulted in the arrival of an emergency response at the scene of the emergency incident. London has the greatest number of both emergency calls and of these those that resulted in the arrival of an emergency response at the scene of the incident.
Of the incidents attended the number classed as category A (immediately life threatening) was 2.72 million and category C (emergency calls which are not immediately life threatening) was 4.26 million. As a proportion of all incidents attended these are equivalent to 39.0% and 61.0% respectively. Last year‟s figures were 2.54 million (category A), and 4.17 million (category C), equivalent to 37.9% and 62.1% of all incidents respectively.

Ambulance Services, England 2012-13
11 Copyright © 2013, Health and Social Care Information Centre. All rights reserved.
Calls resolved through telephone advice
In 2012-13 there were 364,965 category C calls resolved through telephone advice only. By trust this varied from 1,442 (Isle of Wight) to 68,479 (London). Both slightly lower than last year (2,057 and 70,842 respectively).
Figure 2a shows by ambulance trust for 2012-13 the percentage of their own category C calls that they resolved through telephone advice. The North East resolved the lowest proportion at 1.1%, South East Coast the highest at 11.7% of all their category C calls, with the overall England proportion at 6.0% of the total category C calls.
Ambulance Services, England 2012-13
12 Copyright © 2013, Health and Social Care Information Centre. All rights reserved.
Response times (Tables 1, 6, 7 & 8)
Category A: 8 minute response
From 1st June 2012, the A8 measure was split into two parts, Red 1 and Red 2. This split reflects the way that ambulance trusts already sub-divide their Category A calls for operational purposes. Red 1 calls are the most time critical and cover cardiac arrest patients who are not breathing and do not have a pulse, and other severe conditions such as airway obstruction. Red 2 calls are serious but less immediately time critical and cover conditions such as stroke and fits. Red 1 patients should account for less than 5% of all ambulance calls. For Category A Red 1 calls, the clock starts on Call Connection. This will ensure that patients who genuinely require emergency ambulance care will continue to receive the most rapid response. For Category A Red 2 calls, a new clock start will be used. This will allow more appropriate ambulance resources to be provided to patients based on their specific clinical needs. The new clock start will be the earliest of I. The point at which the chief complaint of the call has been identified II. A vehicle has been assigned to the call III. A 60 second cap from the Call Connect time
Due to these changes to the way category A86 minute responses are recorded in 2012-13 it is not possible to make comparisons with previous years.
The existing standard of performance will remain for 2012/13, i.e. 75% of calls should receive a response at the scene within 8 minutes, for both Red1 and Red2 irrespective of geographical location.
April 2012 to May 2012 – for the first two months of the year and based on the 2011-12 standard, nationally the percentage of Category A incidents that received a response within 8 minutes was 75.5%. This equates to 0.33 million incidents. Of the 12 ambulance services 9 met or exceeded the 75% standard for this section.
June 2012 to March 2013 Red 1 - nationally the percentage of Category A red 1 incidents that received a response within 8 minutes was 74.0%, equating to 0.08 million incidents. Of the 12 ambulance services 7 met or exceeded the 75% standard for this section.
June 2012 to March 2013 Red 2 - nationally the percentage of Category A red 2 incidents that received a response within 8 minutes was 75.6% This equates to 1.64 million incidents. Of the 12 ambulance services 11 met or exceeded the 75% standard for this section.
6 Ambulance response times for 2012-13 are taken from NHS England‟s collection “Unify2 data collection – AmbSYS System Indicators” In
this publication these figures will be referred to as Ambulance Quality Indicators (AQI).

Ambulance Services, England 2012-13
13 Copyright © 2013, Health and Social Care Information Centre. All rights reserved.
Note: figures rounded to 1 decimal place.
By ambulance trust
South East Coast had the highest percentage response rate in (April 2012 - May 2012) at 77.9% of all emergency incidents attended by an emergency response vehicle by the 8 minute target time.
West Midlands had the highest percentage response rate for Red 1 calls (June 2012 - March 2013) at 78.9% of all emergency incidents attended by an emergency response vehicle by the 8 minute target time.
Great Western had the highest percentage response rate for Red 2 calls (June 2012 - March 2013) at 76.9% of all emergency incidents attended by an emergency response vehicle by the 8 minute target time.

Ambulance Services, England 2012-13
14 Copyright © 2013, Health and Social Care Information Centre. All rights reserved.
Table 1a: Number and Percentage Red 1 calls of the total Red 1 and Red 2 calls resulting in an emergency response, June 2012- March 2013
Number of Red 1 calls resulting in an emergency response
Number of Red 2 calls resulting in an
emergency response
Total Number of Red 1 and Red 2
calls resulting in an emergency response
% Red 1 calls of the total Red 1 and Red 2 calls resulting in an emergency response
Ambulance service (thousands) (thousands) (thousands) (percent)
England 114.4 2165.1 2279.5 5.0%
North East 2.7 130.9 133.6 2.0% North West 27.8 295.7 323.4 8.6% Yorkshire 15.5 206.5 222.0 7.0% East Midlands 19.1 178.4 197.5 9.7% West Midlands 6.6 281.2 287.7 2.3% East of England 9.9 193.9 203.8 4.9% London 12.1 354.6 366.8 3.3% South East Coast 4.9 215.1 220.0 2.2% South Central 6.4 89.7 96.2 6.7% Great Western 5.0 69.7 74.7 6.7% South Western 4.3 143.3 147.6 2.9% Isle of Wight 0.2 6.0 6.2 2.4%
South Western* 9.293 212.981 222.3 4.2%
*On the 1st February 2013 Great Western Ambulance Service NHS Trust dissolved, from that point its services were delivered by the South Western Ambulance Service NHS Foundation Trust. Data for these two trusts have been merged as a separate line within the table. This is included only for additional information and is not used for any comparisons It was envisaged that Red 1 patients would account for less than 5.0% of all Category A ambulance calls. For England the percentage of Red 1 calls resulting in an emergency response as a total of all category A (Red1 + Red 2) calls resulting in an emergency response is 5.0%. However at a trust level East Midlands had the highest percentage at 9.7% and the lowest being the North East with 2.0%, as shown in table 1a and figure 3a.
There are a number of factors which may impact on ambulance response times which include:
Demand – the demand for ambulance services is increasing with a national 26% increase in emergency calls since 2007-08. Regionally increases have ranged from 1.2% (Great Western) to 48.2% (South Western). The increasing number of
Ambulance Services, England 2012-13
15 Copyright © 2013, Health and Social Care Information Centre. All rights reserved.
emergency calls places considerable pressure on resources. Although Red 1 Category A calls have a greater priority than Red 2 Category A calls both are serious, requiring immediate attention, however not every call requesting an emergency vehicle is a genuine category A incident. Demand for ambulances can also be increased in the event of an emergency situation such as dealing with a major road traffic accident. Great Western dissolved in February 2013, its responsibilities were taken over by South Western. If these two trusts are combined the percentage increase in calls since 2007-08 is an estimated 28.3%.
Location of incident – England has diverse geographical makeups which are classified
between urban and rural with population not uniformly distributed, this gives rise to various issues on number and type of vehicles required to respond. For example the factors affecting achieving the standard in a densely populated heavily congested city (eg London) are different to low population very rural countryside (eg North Yorkshire moors), however both are measured against the same standards.
Handover and turnaround time – The timely handover of patient care between the ambulance service and the hospital can help reduce delays and improve service offered to patients. Patient handover is where the professional responsibility and accountability for the care of the patient is transferred from the ambulance crew to the medical staff at the hospital. The turnaround time is the overall time taken for the ambulance crew to handover the patient, clean, restock and make the vehicle available to respond to another call. This is important as it increases the number of patients that they can respond to in a timely manner.
Staffing – Having enough trained professionals available to cover rotas and service patients in a timely fashion
Other dependencies such as; o Parking / Access – inability to gain access to streets or park close to incidents o Adverse weather o Major incidents o Major sporting / public events
All, some or none of the above factors will affect ambulance trust response times and overall ability to meet required national standards with these factors probably affecting trusts differently throughout the year. Trusts awareness of these influences facilitates effective planning to maximise the opportunity to achieve the national standards.

Ambulance Services, England 2012-13
16 Copyright © 2013, Health and Social Care Information Centre. All rights reserved.
Category A: 19 minute response
Nationally the percentage of Category A incidents that received a response within 19 minutes was 96.0%, this equates to 2.60 million incidents.
Last year (2011-12 KA34) this was 96.8% and 2.44 million respectively, however due to different clock start times this is not directly comparable with 2012-13 data.
At a trust level, 10 out of the 12 services exceeded the 95% standard, (the same as last year) the remaining services were 91.9% (East Midlands) and 93.5% (East of England).
Number of calls where following arrival an emergency response no ambulance is required (Table 5)
In 2012-13 there were 8,622 calls where following an emergency response arriving at a scene no ambulance was required, a 55.9% drop on last year (19,551). By trust this varies from 0 (West Midlands) to 3,252 (London).

Ambulance Services, England 2012-13
17 Copyright © 2013, Health and Social Care Information Centre. All rights reserved.
Patient Destinations: Emergency (Tables 1, 9, 10, 11 & 12)
From 1st April 2009 patient journeys data has been split into two areas of patient destinations. These two areas combined are equivalent to previous years‟ „emergency patient journeys‟
There were 4.53 million patient journeys to a Type 1 and 2 A&E destinations in 2012-13. By trust this varies from 10,709 (Isle of Wight) to 747,162 (North West).
The number of patient journeys to a destination other than a Type 1 and 2 A&E was 0.49 million in 2012-13. By trust this varies from 2,734 (Isle of Wight) to 88,751 (London).
The number of patient destinations combined (comparable with previous patient journeys) has risen over the last year, with a reported 5.02 million in 2012-13, compared to 4.92 million in 2011-12.

Ambulance Services, England 2012-13
18 Copyright © 2013, Health and Social Care Information Centre. All rights reserved.
Numbers of patient destinations combined per 100 incidents in 2012-13 shows that around 72 patients were conveyed to a healthcare provider for every 100 emergency incidents attended. Ranging by Ambulance service from 59 (South Western) to 83 (North West and North East) patients being conveyed to a healthcare provider for every 100 emergency incidents attended.
Total number of patients treated at the scene only (Tables 1 & 13) (collected from 1 April 2009)
In 2012-13 there were 1.99 million patients treated at the scene only, with the majority relating to patients within category C. This is a 10.0% increase over last year (1.81 million). By trust the overall figure varies from 6,004 (Isle of Wight) to 267,802 (East of England).
Patient Journeys – non urgent - Special/planned (Tables 1 & 9)
The number of these journeys has generally been falling for many years with an average annual decrease of 6.6% since 2002-03, and a 2012-13 figure of 7.13 million compared to 8.29 million last year.
99.6% of these journeys were planned, with just 0.4% classed as special journeys; this is the same proportion as last year.

Ambulance Services, England 2012-13
19 Copyright © 2013, Health and Social Care Information Centre. All rights reserved.
Other UK home countries Other UK countries also measure ambulance response times. However the outputs differ in different countries because they are designed to help monitor policies that have been developed separately by each government. Further investigation would be needed to establish whether the definitional differences have a significant impact on the comparability of the data.
For example, in England the clock starts for category A red 1 when the call is answered, whereas in Wales the clock starts when the location of the incident is established. In Northern Ireland the clock starts when the following details of a call have been ascertained: caller‟s telephone number, exact location of incident, and the nature of the chief complaint.
Wales
In Wales, statistics on ambulance services are issued on a monthly basis by the Knowledge & Analytical services, Welsh Government - http://wales.gov.uk/topics/statistics/headlines/health2012/120502/?lang=en
The monthly release contains information on the emergency ambulance service in Wales: emergency responses to Category A (immediately life-threatening) calls by Unitary Authority, Local Health Board and ambulance region, and numbers of emergency calls.
Scotland
In Scotland, some statistics on ambulance services are available on the Scottish Ambulance Service website - http://www.scottishambulance.com/Performance/Default.aspx
Northern Ireland
In Northern Ireland, statistics on ambulance services are published annually by the Department of Health, Social Services and Public Safety in their „Hospital Statistics: Emergency Care‟ bulletin - http://www.dhsspsni.gov.uk/index/stats_research/hospital-stats/emergency_care-3/emergency-care-stats.htm
Information is published on emergency and urgent calls, response times and patient journeys.
England monthly:
Ambulance Quality Indicators – (monthly) update for England Monthly Information is published by the NHS England at http://mediacentre.dh.gov.uk/2012/05/04/statistical-press-notice-ambulance-quality-indicators/
The monthly release contains information on –
Ambulance System Indicators; Category A 8 minute response time, category A 19 minute response time, call abandonment rate, re-contact rate following discharge of care, time to answer call, time to treatment, ambulance calls closed with telephone advice or managed without transport to A&E, ambulance emergency journeys.

Ambulance Services, England 2012-13
20 Copyright © 2013, Health and Social Care Information Centre. All rights reserved.
Ambulance Clinical Outcomes; Outcome from cardiac arrest – return of spontaneous circulation, outcome from acute ST-elevation myocardial infarction (STEMI), outcome from stroke for ambulance patients, outcome from cardiac arrest – survival to discharge.
Aid to Interpretation
i) Methods used to compile the statistics
Background
National response times standards for emergency and urgent ambulance services have been set since 1974. The NHS Executive Review of Ambulance Performance Standards introduced revised standards following publication in July 1996. The following revised targets were issued to ambulance services in Executive Letter EL(96)87, as amended by the Department of Health‟s letters to all Chief Executives dated 10 September 2004, 28 September 2004 and 2 March 2006, via the NHS Operating Framework 2011-12 and most recently by the Department of Health‟s letter to all Chief Executives dated 16 May 2012
The Department of Health requires summary details from NHS Health Care Providers on ambulance activity. Both the KA34 and AQI Data Sets provide performance management measures of response times; these are also required by NHS Trusts for Ambulance Service internal monitoring and for defining service agreements.
The information originally monitored 'Your guide to the NHS' targets and the standards introduced following a review of ambulance performance standards in 1996-97. The standards required that all Ambulance Services would be expected to reach 75% of immediately life-threatening calls within 8 minutes irrespective of location and that all incidents that require a fully equipped ambulance vehicle, able to transport the patient in a clinically safe manner (emergency ambulance), arrive within 19 minutes of the transport request being made in 95% of cases.
Ambulance services use two approved call prioritisation systems (the Medical Priority Dispatch System and NHS Pathways) to map codes that comprise of categories A immediately life threatening) and C (emergency calls which are not immediately life threatening).
The call categorisation codes that comprise Categories A and C are reviewed annually by the Emergency Call Prioritisation Advisory Group (ECPAG) and, if appropriate, revised lists will be issued.
NHS ambulance trusts use different types of technical solutions to quickly identify the location of a caller, to dispatch an emergency response and to record electronically the various stages of the call management cycle, including starting and stopping of the clock.
It is expected that ambulance services will have robust governance arrangements, including data management protocols, in place to assure their Board and independent auditors that all performance data submitted as part of this return is measured and recorded in accordance with this guidance.

Ambulance Services, England 2012-13
21 Copyright © 2013, Health and Social Care Information Centre. All rights reserved.
The ambulance information collected by the Health and Social Care Information Centre (HSCIC) via the KA34 is provided by individual ambulance service providers to show volume of service against required standards. The information obtained from both the KA34 and AQI is analysed by the HSCIC, DH and NHS England at England and individual ambulance service providers to show volume of service and performance against required standards; including clinical quality indicators, and time series analysis.
Collection
Ambulance trusts are required to collect, monitor and make available details of performance against target. Ambulance services use two approved call prioritisation systems (the Medical Priority Dispatch System and NHS Pathways) to map codes that comprise of categories A, and C. The system holds information on all emergency calls received with details of response times and patient destinations. These categorisation codes are reviewed annually and, if appropriate, revised lists will be issued each year in advance of 1st April.
Although the vast majority of calls can be categorised using this list, some calls remain that the list does not deal with:
(a) Duplicate or multiple calls to an incident where a response has already been activated. All of these calls should be categorised in the same way as the original call that activated the response
(b) Hang-ups before coding is complete
Caller not with patient and unable to give details
Caller refuses to give details
Hoax calls where response not activated
Response cancelled before coding is complete (e.g. patient recovers)
All of these are counted as category C calls
The two ambulance trust systems are used to extract the information to complete the annual KA34 quality of ambulance services return data submission to the Health and Social Care Information Centre (HSCIC).
Ambulance trusts collect each occurrence of an emergency call and associated information for the KA34 submission on their systems. These two systems are the only administrative source for this information, thus the only method available to the HSCIC to obtain this information is directly from each ambulance trust.
The information is collected annually for all emergency calls received for the period 1st April to 31st March.
The collection form consists of 3 parts:
Part 1 – Emergency Calls: items collected
total number of emergency calls total number of incidents, which resulted in an emergency response arriving at the
scene

Ambulance Services, England 2012-13
22 Copyright © 2013, Health and Social Care Information Centre. All rights reserved.
record the total number of calls where, following the arrival of a rapid response vehicle or an approved responder at the scene, the control room subsequently decided that a fully equipped ambulance vehicle would not be required for category A calls
total number of incidents that resulted in the arrival of a fully equipped ambulance vehicle (car or ambulance) able to transport the patient
total number of successfully completed Category C calls that have been resolved by a designated healthcare professional providing telephone advice
Part 2 – Emergency Patient Destinations:
total number of emergency patient journeys to Type 1 and 2 A&E destinations total number of emergency patient journeys to a destination other than Type 1 and 2
A&E total number of patients treated at scene only
Part 3 – Patient Journeys: Non-urgent:
total number of patient journeys other than emergency, include special and planned journeys
The KA34 is maintained on the Omnibus data collection system which has built-in data validation criteria that reduce errors in data entry and improves data quality at source. In order to successfully complete the KA34 return on the Omnibus system the data has to pass the validation criteria to enable submission.
Automatic validations via Omnibus system include:
row, column values sum agree to totals. Year on year percentage change validation user has to enter a reason for greater
than 10% change. On receipt of the data HSCIC check the data against previous year‟s information from data supplier to ensure accuracy.
The summary information provided from the KA34 is collated and summarised at individual trust level.
For this year (2012-13) the following has been collected using the AQl unify2 collection tool and collected by NHS England monthly.
total number of Category A incidents, which resulted in an emergency response arriving at the scene of the incident within 8 minutes
total number of incidents that resulted in the arrival of an ambulance response within 19 minutes
NHS England have validated and previously published this information and provided HSCIC with annual totals.
Aggregation
The information sourced on the KA34 is returned at an aggregated level. Each organisation provides totals by each category requested. From this, overall totals, percentages and rates

Ambulance Services, England 2012-13
23 Copyright © 2013, Health and Social Care Information Centre. All rights reserved.
for England and ambulance trusts are calculated by the HSCIC. These are generated for numerous areas including Cat A & Cat C targets & performance.
Example of calculations performed: i) Emergency patient journeys per 100 emergency incidents This information enables comparison between ambulance trusts and overall England figures. It is calculated as follows:
Numerator: Total number of Emergency incidents (calls resulting in an emergency response arriving at the scene of the incident): Denominator: Total number of Emergency patient journeys
Multiply the result by 100 will give the number of Emergency patient journeys per 100 emergency incidents.
Where Total number of Emergency patient journeys is:
The sum of:
total number of emergency patient journeys to Type 1 and 2 A&E destinations
and
total number of emergency patient journeys to a destination other than Type 1 and 2 A&E
Sources of Error
The HSCIC collects from all ambulance trusts the total number of emergency calls received and the number patient journeys undertaken during the reported year. This gives 100% coverage of all ambulance information for England. As this collection is not a sample no estimation of the figures is needed and hence there is no sampling error.
However it should be noted:
The telephone operators who answer the calls ask a series of questions to ascertain the nature of the emergency and follow a prescriptive path (the computer system selects the path depending on input) which classifies the category of the emergency. Processing (non-sampling) errors could occur where operators in the ambulance control centres incorrectly input data into their administrative system or measurement errors could occur from operators who mis-interpret a response to a question or have different interpretations to the same question, thus leading to a mis-categorisation. To ensure this is reduced to a minimum the ambulance trusts have their own internal training and monitoring of actual calls and act upon any mis-classification.
If the system coding classification is set up incorrectly then calls will be miscategorised. This occurred immediately prior to publication of the 2010-11 data when the HSCIC was alerted to an issue with the data from the Pathways system that North East Ambulance Service (NEAS) use. This issue was raised after two other trusts started using this system. Communication between the trusts highlighted that category A calls had been incorrectly coded as category C. NEAS re-submitted 2010-11 figures and based on these revised figures 2010-11 national A8 minute response rates increased by 0.1%. 2010-11 data is now correct, however this issue may have

Ambulance Services, England 2012-13
24 Copyright © 2013, Health and Social Care Information Centre. All rights reserved.
affected NEAS previous years submissions however the impact cannot be confirmed (a revised dataset for previous years is not readily available). Changes to Cat A19 & B19 are very small at a regional basis and therefore changes are negligable at national level.
Users and Uses
How are the statistics used? Users and uses of the Report i) Known Users of the Statistics This section contains comments based on responses from the users listed. All these users have found the information in the report useful for the purposes set out.
Department of Health
“Information from the KA34 collection is used by the Department of Health to brief Ministers, answer Parliamentary Questions and provide responses to correspondence on the Category A response times, the number of emergency calls, the number of emergency responses and the number of patient journeys, and how these have changed since the last year. However, following on from the introduction of clinical quality indicators for the ambulance service, it is proposed to discontinue the KA34 collection so that 2012-13 will be the last year data are collected under KA34.”
North West Ambulance Service NHS Trust
“The information provides a high level benchmark of ambulance services for comparison. The KA34 itself provides a regulatory check for services as it is the central mandated return for ambulance services.
I would however note that instead of guidance rewrites as ambulance services have evolved and delivered differing strands of emergency transport and patient transport services, the guidance and requirements have not evolved in the same manner, they have been merely been added to continuously. This means the guidance is complex and not necessarily fit for purpose.
The basic counts however do have some value. “
Press & Journal Articles
Press – the data have been used to underpin articles in newspapers, journals, etc on matters of public interest. While the national press occasionally take an interest in the ambulance statistics it is usually the local press that picks up on the regional variations. Some examples are below;
21st June 2012 – Page 15 (Telegraph and Argus, Bradford)
22nd June 2012 – Page 1 (Netdoctor.co.uk)
24th June 2012 – Page 2 (The Huddersfield Daily Examiner)

Ambulance Services, England 2012-13
25 Copyright © 2013, Health and Social Care Information Centre. All rights reserved.
25th June 2012 – Page 2 (Carlisle News & Star)
26th June 2012 – Page 1 (York Press)
Further details available on request.
Reports:
National Audit Office: report by the controller and auditor general –
Transforming NHS ambulance services June 2011 available at:
http://www.connectingforhealth.nhs.uk/systemsandservices/pathways/news/fullreport.pdf
ii) Unknown Users of the Statistics We believe other key users of the statistics are:
Ministers and their advisors Ambulance trusts Various government departments Students, academics and universities Individual citizens
The survey report is free to access via the HSCIC and HM Government (data.gov.uk) websites and therefore the majority of users will access the report without being known to the HSCIC. It is therefore important to have in place mechanisms to understand how these additional users are using the statistics and to gain valuable feedback on how the HSCIC can make the data more useful to them. On the webpage where the report is surfaced there is a link to a feedback web form which the HSCIC uses for all its reports. The specific questions asked on the form are:
How useful did you find the content in this publication? How did you find out about this publication? What type of organisation do you work for? What did you use the report for? What information was the most useful? Were you happy
with the data quality? To help us improve our publications, what changes would you like to see (for instance content
or timing)? Would you like to take part in future consultations on our publications?
Any responses via this web form are passed to the team responsible for the report to consider. The HSCIC has not received any feedback on the last three publications, 2011-12, 2010-11 and the 2009-10 report. The webpage where the ambulance publication information is situated generate page views with the report and tables being downloaded by users. It is difficult to gather information about the use that is being made of the report/tables published on the HSCIC website once downloaded.

Ambulance Services, England 2012-13
26 Copyright © 2013, Health and Social Care Information Centre. All rights reserved.
Uses of these statistics The statistics are used in a variety of ways. Some examples of these include:
Advice to Ministers To assess National and ambulance trust performance against targets and standards For benchmarking trusts against other ambulance trusts For national and local press articles
Future Engagement
Further uses of the data in the report will be added to this document as we become aware of them.
Consultation on future of KA34: In January 2013 the Health and Social Care Information Centre published a consultation paper which outlined the changes to the source information used to produce the publication. The proposal to use the AQI data as an alternative source of data for the publication replacing the existing KA34 would change the content and layout to the annual report on Ambulance services.
The consultation closed in April 2013 and we received 2 responses from key users. We are very grateful for the feedback received. Further investigation is required following comments received and we are presently working with all relevant parties to finalise the outcomes from the consultation. We expect to report on the final outcome of the consultation during August 2013.
DEFINITIONS
The majority of definitions are available in the KA34 guidance in Annex 1 however there are some below that are not covered by the guidance and may prove useful:
Category A: presenting conditions, which may be immediately life threatening and should receive an emergency response within 8 minutes irrespective of location in 75% of cases. Presenting conditions, which require a fully equipped ambulance vehicle to attend the incident, must have an ambulance vehicle arrive within 19 minutes of the request for transport being made in 95% of cases, unless the control room decides that an ambulance is not required.
Category A Red 1: Red 1 calls are the most time critical and cover cardiac arrest patients who are not breathing and do not have a pulse, and other severe conditions. For Red 1 calls, the start time is when the call connects, ensuring that patients who require immediate emergency ambulance care will continue to receive the most rapid response.
Category A Red 2: Red 2 calls, which are serious but less immediately time critical and cover conditions such as stroke and fits, a new clock start will allow call handlers to get more information about patients so that they receive the most appropriate ambulance resource based on their specific clinical needs.

Ambulance Services, England 2012-13
27 Copyright © 2013, Health and Social Care Information Centre. All rights reserved.
Category B: presenting conditions, which though serious are not immediately life threatening and must receive a response within 19 minutes in 95% of cases.
Category C: presenting conditions which are not immediately serious or life threatening. For these calls the response time standards are not set nationally but are locally determined.
Type 1 and 2 A&E: A type 1 A&E department is generally a consultant led 24 hour service with full resuscitation facilities, whereas a type 2 A&E department is generally a consultant led department offering a single specialty e.g. dentistry
Aborted calls: performance figures are calculated on the number of emergency calls resulting in an emergency response arriving at the scene of the incident. This excludes calls aborted for any reason e.g. hoax calls and also duplicate calls relating to the same incident.
Geographical coverage: the performance figures shown in this Bulletin relate to all calls to which each ambulance service responds; in some areas this may include calls from outside a service's usual geographical area of coverage.
FURTHER INFORMATION
Any enquiries about the data contained in this Bulletin or requests for further information should be addressed to:
Health and Social Care Information Centre
1 Trevelyan Square
Boar Lane
Leeds
LS1 6AE
Tel: 0845 300 6016
Email: [email protected]
This bulletin and previous editions of the publication can be found on the Health and Social Care Information Centre website patient experience section at:
http://www.hscic.gov.uk/article/2021/Website-Search?q=ambulance&topics=13359&sort=Relevance&size=10&page=1&area=both#top
June 2013

Index to Tables
Table Description
Table 1 Summary statistics, England 2002-03 to 2012-13Table 2 Emergency calls by ambulance service, 2004-05 to 2012-13Table 2a Emergency calls by category and ambulance service, 2012-13Table 3 Emergency calls resolved through telephone advice only, by ambulance service 2009-10 to 2012-13Table 4 Emergency incidents (calls resulting in response arriving at the scene of the incident)
by ambulance service, 2004-05 to 2012-13Table 4a Emergency incidents (calls resulting in response arriving at the scene of the incident)
by category and ambulance service, 2012-13Table 5 Emergency calls where following the arrival of an emergency response no ambulance is required,
by category and ambulance service, 2007-08 to 2012-13Table 6 Emergency incidents: response times by ambulance service and category of call, 2012-13Table 6a Emergency incidents: response times by ambulance service and category of call, 2012-13 (AQI data)Table 7 Category A emergency incidents: responses within 8 minutes by ambulance service, 2004-05 to 2012-13Table 8 Emergency incidents: responses within 19 minutes by category of call and ambulance service,
2004-05 to 2012-13Table 9 Emergency patient journeys and destinations by ambulance service, 2012-13Table 10 Emergency patient journeys per 100 incidents by ambulance service, 2004-05 to 2009-10, and by category
of call by ambulance service, 2010-11 to 2012-13Table 11 Emergency patient journeys by ambulance service, 2004-05 to 2012-13Table 12 Emergency patient destinations by ambulance service and category of call, 2012-13Table 13 Emergency incidents: number of patients treated at the scene only, by category and
ambulance trust, 2009-10 to 2012-13

Table 1 Summary statistics, 2002-03 to 2012-13
Englandmillions and percentages millions and percentages
AQI monthly data2002-03 2003-04 2004-05 2005-06 2006-07 2007-08 2008-09 2009-10 2010-11 2011-12 2012-13 2012-13
Emergency calls(1)
:
Total 4.93 5.32 5.62 5.96 6.33 7.23 7.48 7.87 8.08 8.49 9.08 8.54
Number of calls resolved through telephone advice only (CAT C only)
Total - - - - - - - 0.22 0.24 0.32 0.36 0.40
Emergency incidents (calls resulting in an emergency response arriving at the scene of the incident):
Total 3.99 4.27 4.53 4.77 5.07 5.89 6.15 6.42 6.61 6.71 6.98 n/a
category A incidents
Total 1.11 1.15 1.27 1.64 1.80 1.81 1.94 2.08 2.23 2.54 2.72 n/a
Response within 8 minutes(2)
Number (millions)(2) 0.82 0.87 0.96 1.24 1.34 1.40 1.44 1.55 1.67 1.94 n/a n/aPercentage 74.6 75.7 76.2 74.0
(3)74.6 77.1 74.3 74.3 74.9
(9)76.2
(9) n/a n/a
category A(10)
incidents (AQI)
AQI (April - May) - - - - - - - - - - - 0.44AQI Red 1 (June - March) - - - - - - - - - - - 0.11AQI Red 2 (June - March) - - - - - - - - - - - 2.17Response within 8 minutes
(2)
Number (millions)(2)
AQI (April - May) - - - - - - - - - - - 0.33AQI Red 1 (June - March) - - - - - - - - - - - 0.08AQI Red 2 (June - March) - - - - - - - - - - - 1.64
PercentageAQI (April - May) - - - - - - - - - - - 75.5
AQI Red 1 (June - March) - - - - - - - - - - - 74.0
AQI Red 2 (June - March) - - - - - - - - - - - 75.6
Total (ambulance able to transport the - - - 1.63 1.78 1.80 1.93 2.07 2.21 2.52 2.71 n/apatient arriving at the scene of the incident)
Response within 19 minutes(2)
Number (millions)(2) - - - 1.56 1.73 1.75 1.87 2.01 2.14 2.44 n/a n/aPercentage 96.0 95.9 97.0 97.1 96.9 96.8 96.7
(9)96.8
(9) n/a n/a
- - - - - - - - - - - 2.71Response within 19 minutes (AQI)(2)
Number (millions)(2) - - - - - - - - - - - 2.60Percentage - - - - - - - - - - - 96.0
Calls where following arrival of a response no ambulance is required. - - - - - 0.02 0.02 0.01 0.03 0.02 0.01 n/a
Emergency patient journey destinations
Emergency(4)(5) 3.97 4.11 4.17 4.25 4.27 4.26 4.51 4.70 4.87 4.92 5.02 4.90
of which
Patient destinations(5)
to Type 1&2 A&E(6) - - - - - - - 4.06 4.29 4.40 4.53 n/ato destination other than Type 1&2 A&E(6) - - - - - - - 0.64 0.58 0.52 0.49 n/a
Treated at scene only - - - - - - - 1.60 1.76 1.81 1.99 1.92Special/planned
(7) 14.08 13.70 12.82 12.28 10.81 9.51 9.59 9.47 8.84 8.29 7.13 n/aSpecial - - - - - 0.08 0.08 0.06 0.05 0.04 0.03 n/aPlanned - - - - - 9.43 9.51 9.40 8.79 8.26 7.10 n/a
Total patient journeys 18.05 17.81 16.99 16.53 15.08 13.77 14.10 14.17 13.71 13.21 12.15 n/aEmergency patient journeys per 100 emergency incidents
(8)
rate 76.1 75.0 73.4 72.6 70.1 72.4 73.3 73.3 73.8 73.3 71.9 n/a
Source: Form KA34 Source: AQI
(1) From 2007-08 urgent calls were included (previous years relate to emergency calls only), therefore comparisons of absolute numbers from 2007-08 and previous years are not possible.
(2) From 2008-09 the starting point for response time measurement was changed, data for 8 and 19 minute responses from 2008-09 are not comparable with previous years.
(3) Estimate. In 2005-06 several trusts misreported data, the unadjusted figure of the percentage for England is 75.3%. For more information see the 2005-06 publication.
(4) From 2007-08 emergency and urgent patient journeys were merged, for comparison purposes previous years have been merged.
(7) From 2007-08, special and planned journeys were collected separately.
n/a denotes not available"-" denotes not applicable
Data prior to 2004-05 re-used with the permission of The Department of Health
Copyright © 2013, Health and Social Care Information Centre (HSCIC). All rights reserved.
AQI (Ambulance Quality Indicators) are taken from NHS England’s collection “Unify2 data collection – AmbSYS System Indicators” In this publication these figures
will be referred to as AQI.
(10)From June 2012 Category A calls were split into Red 1 (most serious/time critical) and Red 2 (serious but less time critical). It is not possible to compare A8 and A 19 data from June 2012 onwards with earlier years due to different clock start times
AQI - Total number of incidents with ambulance vehicle arriving
(5) From 2009-10, the number of emergency journeys was split to show patient destination. The split collects numbers of patient journeys going to Type 1&2 A&Es and those journeys going to destinations other than Type 1&2 A&Es. When combined these data are comparable with previous years emergency patient journeys data.
(6) Type 1 A&E destination is generally consultant led and has full resuscitation facilities and accommodation for reception of A&E patients whereas type 2 A&E departments are still consultant led but provide a single specialty (e.g. dentistry). Other destinations can include minor injury units, walk in centres etc.
(9) During 2010 -11 submission it was found that a trust had miscoded category A calls as category C. The 2010-11 data was resubmitted and is correct as published, the impact at national level in 2010-11 was 0.1%. This issue may have affected previous years submissions however the impact cannot be confirmed (a revised dataset for previous years is not readily available).
(8) From 2007-08 urgent and emergency patient journeys were merged, it is not possible to compare data from this point with previous years because the incidents used to calculate the numbers in this table now include urgent calls (previous years relate to emergency calls only).
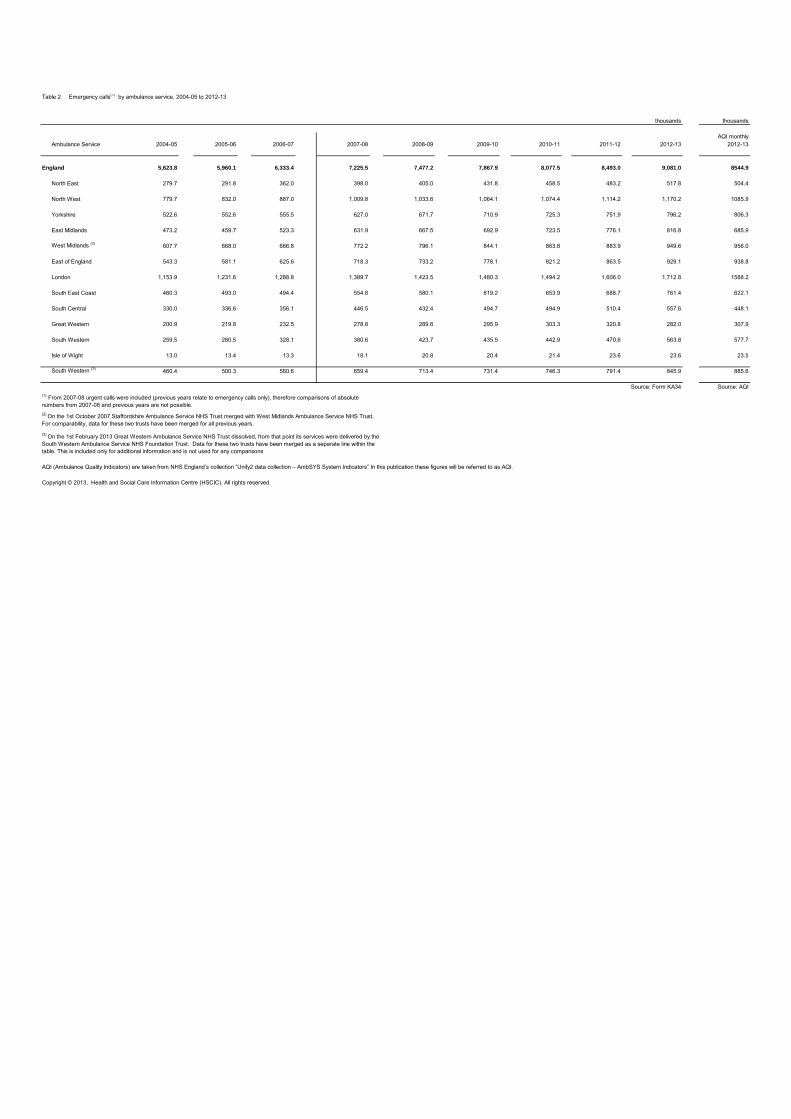
Table 2 Emergency calls(1) by ambulance service, 2004-05 to 2012-13
thousands thousands
AQI monthlyAmbulance Service 2004-05 2005-06 2006-07 2007-08 2008-09 2009-10 2010-11 2011-12 2012-13 2012-13
England 5,623.8 5,960.1 6,333.4 7,225.5 7,477.2 7,867.9 8,077.5 8,493.0 9,081.0 8544.9
North East 279.7 291.8 362.0 398.0 405.0 431.8 458.5 483.2 517.8 504.4
North West 779.7 832.0 887.0 1,009.8 1,033.6 1,064.1 1,074.4 1,114.2 1,170.2 1085.9
Yorkshire 522.6 552.6 555.5 627.0 671.7 710.9 725.3 751.9 796.2 806.3
East Midlands 473.2 459.7 523.3 631.9 667.5 692.9 723.5 776.1 816.8 685.9
West Midlands (2) 607.7 668.0 666.8 772.2 796.1 844.1 863.8 883.9 949.6 956.0
East of England 543.3 581.1 625.6 718.3 733.2 778.1 821.2 863.5 929.1 938.8
London 1,153.9 1,231.6 1,288.8 1,389.7 1,423.5 1,480.3 1,494.2 1,606.0 1,712.8 1588.2
South East Coast 460.3 493.0 494.4 554.8 580.1 619.2 653.9 688.7 761.4 622.1
South Central 330.0 336.6 356.1 446.5 432.4 494.7 494.9 510.4 557.6 448.1
Great Western 200.9 219.8 232.5 278.8 289.6 295.9 303.3 320.8 282.0 307.9
South Western 259.5 280.5 328.1 380.6 423.7 435.5 442.9 470.6 563.8 577.7
Isle of Wight 13.0 13.4 13.3 18.1 20.8 20.4 21.4 23.6 23.6 23.5
South Western (3) 460.4 500.3 560.6 659.4 713.4 731.4 746.3 791.4 845.9 885.6
Source: Form KA34 Source: AQI
Copyright © 2013, Health and Social Care Information Centre (HSCIC). All rights reserved.
(2) On the 1st October 2007 Staffordshire Ambulance Service NHS Trust merged with West Midlands Ambulance Service NHS Trust. For comparability, data for these two trusts have been merged for all previous years.
(1) From 2007-08 urgent calls were included (previous years relate to emergency calls only), therefore comparisons of absolute numbers from 2007-08 and previous years are not possible.
(3) On the 1st February 2013 Great Western Ambulance Service NHS Trust dissolved, from that point its services were delivered by the South Western Ambulance Service NHS Foundation Trust. Data for these two trusts have been merged as a separate line within the table. This is included only for additional information and is not used for any comparisons
AQI (Ambulance Quality Indicators) are taken from NHS England’s collection “Unify2 data collection – AmbSYS System Indicators” In this publication these figures will be referred to as AQI.

Table 2a Emergency calls by category and ambulance service, 2012-13
thousands thousands
Ambulance Service Total of which Category A Category C Total(2)
England 9,081.0 2,952.3 6,128.6 8,544.9
North East 517.8 165.8 352.0 504.4
North West 1,170.2 404.5 765.7 1,085.9
Yorkshire 796.2 280.4 515.7 806.3
East Midlands 816.8 306.2 510.6 685.9
West Midlands 949.6 365.7 583.9 956.0
East of England 929.1 269.4 659.7 938.8
London 1,712.8 465.2 1,247.6 1,588.2
South East Coast 761.4 287.8 473.6 622.1
South Central 557.6 118.6 439.0 448.1
Great Western 282.0 100.6 181.5 307.9
South Western 563.8 180.3 383.5 577.7
Isle of Wight 23.6 7.8 15.8 23.5
South Western(1) 845.9 280.9 565.0 885.6
Source: Form KA34 Source: AQI
(2)AQI does not enable further breakdown to Category A and Category C
Copyright © 2013, Health and Social Care Information Centre (HSCIC). All rights reserved.
AQI (Ambulance Quality Indicators) are taken from NHS England’s collection “Unify2 data collection – AmbSYS System
Indicators” In this publication these figures will be referred to as AQI.
(1) On the 1st February 2013 Great Western Ambulance Service NHS Trust dissolved, from that point its services were delivered by the South Western Ambulance Service NHS Foundation Trust. Data for these two trusts have been merged as a separate line within the table. This is included only for additional information and is not used for any comparisons
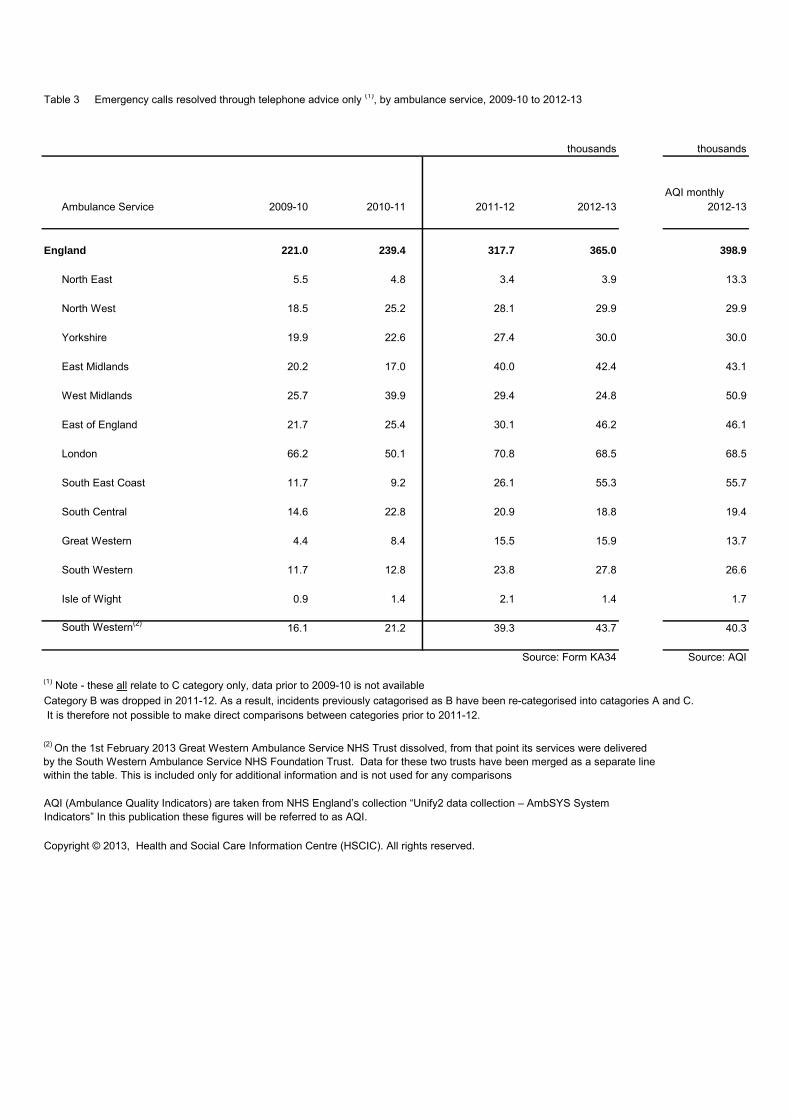
Table 3 Emergency calls resolved through telephone advice only (1), by ambulance service, 2009-10 to 2012-13
thousands thousands
AQI monthlyAmbulance Service 2009-10 2010-11 2011-12 2012-13 2012-13
England 221.0 239.4 317.7 365.0 398.9
North East 5.5 4.8 3.4 3.9 13.3
North West 18.5 25.2 28.1 29.9 29.9
Yorkshire 19.9 22.6 27.4 30.0 30.0
East Midlands 20.2 17.0 40.0 42.4 43.1
West Midlands 25.7 39.9 29.4 24.8 50.9
East of England 21.7 25.4 30.1 46.2 46.1
London 66.2 50.1 70.8 68.5 68.5
South East Coast 11.7 9.2 26.1 55.3 55.7
South Central 14.6 22.8 20.9 18.8 19.4
Great Western 4.4 8.4 15.5 15.9 13.7
South Western 11.7 12.8 23.8 27.8 26.6
Isle of Wight 0.9 1.4 2.1 1.4 1.7
South Western(2) 16.1 21.2 39.3 43.7 40.3
Source: Form KA34 Source: AQI
(1) Note - these all relate to C category only, data prior to 2009-10 is not availableCategory B was dropped in 2011-12. As a result, incidents previously catagorised as B have been re-categorised into catagories A and C. It is therefore not possible to make direct comparisons between categories prior to 2011-12.
Copyright © 2013, Health and Social Care Information Centre (HSCIC). All rights reserved.
(2) On the 1st February 2013 Great Western Ambulance Service NHS Trust dissolved, from that point its services were delivered by the South Western Ambulance Service NHS Foundation Trust. Data for these two trusts have been merged as a separate line within the table. This is included only for additional information and is not used for any comparisons
AQI (Ambulance Quality Indicators) are taken from NHS England’s collection “Unify2 data collection – AmbSYS System
Indicators” In this publication these figures will be referred to as AQI.

Table 4 Emergency incidents (1) (calls resulting in response arriving at the scene of the incident) by ambulance service, 2004-05 to 2012-13
thousands
Ambulance Service 2004-05 2005-06 2006-07 2007-08 2008-09 2009-10 2010-11 2011-12 2012-13
England 4,526.3 4,770.1 5,068.8 5,888.7 6,150.4 6,415.2 6,606.5 6,710.6 6,979.1
North East 228.3 238.9 249.6 321.7 340.7 353.7 361.5 367.1 371.1
North West 676.6 698.5 755.2 846.1 873.1 893.1 901.3 919.5 953.0
Yorkshire 426.7 451.6 481.4 549.3 564.8 598.9 615.9 631.1 658.3
East Midlands 379.9 400.0 430.9 524.9 547.9 573.6 595.4 593.1 616.2
West Midlands (2) 481.8 521.1 575.4 657.9 691.8 708.8 730.4 745.7 790.2
East of England 458.0 486.5 517.0 604.9 641.6 668.5 693.4 700.0 706.5
London 827.4 856.7 865.5 945.8 973.9 1,012.9 1,058.1 1,041.7 1,080.5
South East Coast 377.9 398.7 421.6 503.4 530.4 561.3 581.0 593.1 611.5
South Central 254.4 272.0 289.2 349.3 364.7 383.2 390.1 411.3 440.6
Great Western 158.9 169.6 177.4 216.8 233.3 256.2 262.8 272.4 237.7
South Western 244.2 264.0 292.5 351.4 370.1 387.4 397.9 417.2 494.1
Isle of Wight 12.0 12.6 13.1 17.3 18.2 17.5 18.6 18.3 19.4
South Western(3) 403.1 433.6 469.9 568.2 603.3 643.6 660.7 689.6 731.7
Source: Form KA34
Copyright © 2013, Health and Social Care Information Centre (HSCIC). All rights reserved.
(1) From 2007-08 urgent calls were included (previous years relate to emergency calls only), therefore comparisons of absolute numbers from 2007-08 and previous years are not possible.
(2) On the 1st October 2007 Staffordshire Ambulance Service NHS Trust merged with West Midlands Ambulance Service NHS Trust. For comparability, data for these two trusts have been merged for all previous years.
(3) On the 1st February 2013 Great Western Ambulance Service NHS Trust dissolved, from that point its services were delivered by the South Western Ambulance Service NHS Foundation Trust. Data for these two trusts have been merged as a separate line within the table. This is included only for additional information and is not used for any comparisons

Table 4a Emergency incidents (calls resulting in response arriving at the scene of the incident) by category and ambulance service, 2012-13
thousands thousands
Ambulance Service Total of which Category A Category C Total Category A Red 1(1) Red 2(1) Category CApril & May only
England 6,979.1 2,721.1 4,257.9 n/a 441.6 114.4 2,165.1 n/a
North East 371.1 159.0 212.2 n/a 25.4 2.7 130.9 n/a
North West 953.0 386.9 566.1 n/a 63.4 27.8 295.7 n/a
Yorkshire 658.3 265.8 392.4 n/a 43.8 15.5 206.5 n/a
East Midlands 616.2 234.5 381.7 n/a 37.0 19.1 178.4 n/a
West Midlands 790.2 343.3 446.9 n/a 55.5 6.6 281.2 n/a
East of England 706.5 241.9 464.6 n/a 38.1 9.9 193.9 n/a
London 1,080.5 438.1 642.4 n/a 71.3 12.1 354.6 n/a
South East Coast 611.5 266.0 345.5 n/a 45.9 4.9 215.1 n/a
South Central 440.6 113.4 327.3 n/a 17.2 6.4 89.7 n/a
Great Western 237.7 92.8 144.9 n/a 18.1 5.0 69.7 n/a
South Western 494.1 172.2 321.9 n/a 24.6 4.3 143.3 n/a
Isle of Wight 19.4 7.4 12.0 n/a 1.2 0.2 6.0 n/a
South Western(2) 731.7 265.0 466.8 n/a 42.7 9.3 213.0 n/a
Source: Form KA34 Source: AQI
Copyright © 2013, Health and Social Care Information Centre (HSCIC). All rights reserved.
AQI Monthly 2012-13
AQI (Ambulance Quality Indicators) are taken from NHS England’s collection “Unify2 data collection – AmbSYS System
Indicators” In this publication these figures will be referred to as AQI.
June to March
(1)From June 2012 Category A calls were split into Red 1 (most serious/time critical) and Red 2 (serious but less time critical). It is not possible to compare A8 and A 19 data from June 2012 onwards with earlier years due to different clock start times
(2) On the 1st February 2013 Great Western Ambulance Service NHS Trust dissolved, from that point its services were delivered by the South Western Ambulance Service NHS Foundation Trust. Data for these two trusts have been merged as a separate line within the table. This is included only for additional information and is not used for any comparisons

Table 5 Emergency calls where following the arrival of an emergency response no ambulance is required by ambulance service, 2007-08 to 2012-13
Ambulance Service 2007-08 2008-09 2009-10 2010-11 2011-12 2012-13
England 22,536 17,375 13,580 29,666 19,551 8,622
North East 12 13 40 783 109 226
North West 2,948 3,381 3,387 3,091 3,262 1,210
Yorkshire 5,810 5,924 609 678 592 739
East Midlands 875 76 184 398 362 388
West Midlands 448 0 0 0 0 0
East of England 2,109 3,087 2,184 1,954 1,699 1,392
London 1,697 358 3,584 21,176 12,001 3,252
South East Coast 5,381 1,745 237 250 69 34
South Central 379 516 737 328 250 126
Great Western 748 294 259 404 553 360
South Western 908 720 295 172 315 699
Isle of Wight 1,221 1,261 2,064 432 339 196
South Western(1) 1,656 1,014 554 576 868 1,059
Source: Form KA34
Due to changes in working practices over time, there may be fluctuations in these figures from one year to the next
Copyright © 2013, Health and Social Care Information Centre (HSCIC). All rights reserved.
(1) On the 1st February 2013 Great Western Ambulance Service NHS Trust dissolved, from that point its services were delivered by the South Western Ambulance Service NHS Foundation Trust. Data for these two trusts have been merged as a separate line within the table. This is included only for additional information and is not used for any comparisons

Table 6 Emergency incidents: response times by ambulance service, 2012-13
Total number of incidents with emergency response
Total number of incidents with
ambulance vehicle arriving
Ambulance service (thousands) (thousands)
England 2,721.1 2,712.5
North East 159.0 158.7
North West 386.9 385.7
Yorkshire 265.8 265.1
East Midlands 234.5 234.1
West Midlands 343.3 343.3
East of England 241.9 240.5
London 438.1 434.8
South East Coast 266.0 265.9
South Central 113.4 113.2
Great Western 92.8 92.4
South Western 172.2 171.5
Isle of Wight 7.4 7.2
South Western (1) 265.0 263.9
Source: Form KA34
Copyright © 2013, Health and Social Care Information Centre (HSCIC). All rights reserved.
Category A calls
(1) On the 1st February 2013 Great Western Ambulance Service NHS Trust dissolved, from that point its services were delivered by the South Western Ambulance Service NHS Foundation Trust. Data for these two trusts have been merged as a separate line within the table. This is included only for additional information and is not used for any comparisons

Table 6a Emergency incidents: response times by ambulance service and category of call, 2012-13
thousands and percentages
Total number of incidents with emergency response
Number of Category A calls resulting in an emergency response
Number of Category A calls resulting in an emergency response within 8 minutes
Proportion of calls responded to within 8 minutes
Number of Red 1 calls resulting in an emergency response
Red 1 - Response within 8 minutes
Red 1 - Response within
8 minutes (percentage of total incidents with response)
Number of Red 2 calls resulting in an
emergency response
Red 2 - Response within 8 minutes
Red 2 - Response within
8 minutes (percentage of total incidents with response)
Total number of incidents with
ambulance vehicle arriving
Response within 19 minutes
(percentage of total incidents with response)
Response within 19 minutes
April & May only April & May only April & May only June to March only June to March only June to March only June to March only June to March onlyAmbulance service (thousands) (thousands) (thousands) (%) (thousands) (thousands) (%) (thousands) (thousands) (%) (thousands) (thousands) (%)
England n/a 441.6 333.3 75.5 114.373 84.6 74.0 2165.1 1636.9 75.6 2,712.4 2,604.0 96.0
North East n/a 25.4 19.3 75.9 2.691 2.1 76.6 130.9 100.2 76.5 158.7 154.0 97.0
North West n/a 63.4 48.7 76.8 27.757 20.4 73.5 295.7 226.6 76.6 385.6 366.8 95.1
Yorkshire n/a 43.8 33.9 77.3 15.473 11.1 71.7 206.5 155.4 75.2 265.1 257.1 97.0
East Midlands n/a 37.0 28.3 76.4 19.063 13.4 70.0 178.4 134.7 75.5 234.1 215.0 91.9
West Midlands n/a 55.5 42.1 75.9 6.561 5.2 78.9 281.2 212.4 75.5 343.3 334.0 97.3
East of England n/a 38.1 28.6 75.0 9.892 7.3 74.2 193.9 141.2 72.8 240.6 225.0 93.5
London n/a 71.3 50.3 70.6 12.148 9.4 77.7 354.6 270.6 76.3 434.8 426.9 98.2
South East Coast n/a 45.9 35.8 77.9 4.906 3.7 75.1 215.1 161.5 75.1 265.7 258.6 97.3
South Central n/a 17.2 12.8 74.7 6.439 5.0 78.2 89.7 67.5 75.2 113.2 107.6 95.0
Great Western n/a 18.1 13.9 76.8 5.021 3.8 75.3 69.7 53.6 76.9 92.4 88.5 95.7
South Western n/a 24.6 18.6 75.8 4.272 3.1 73.0 143.3 108.8 75.9 171.5 163.5 95.4
Isle of Wight n/a 1.2 1.0 77.3 0.15 0.1 78.7 6.0 4.6 76.6 7.4 7.2 97.4
South Western(2) n/a 42.7 32.5 76.2 9.293 6.901 74.3 212.981 162.378 76.2 263.901 251.97 95.5
Source: AQI
Copyright © 2013, Health and Social Care Information Centre (HSCIC). All rights reserved.
Category A calls(1)
(1)From June 2012 Category A calls were split into Red 1 (most serious/time critical) and Red 2 (serious but less time critical). It is not possible to compare A8 and A 19 data from June 2012 onwards with earlier years due to different clock start times
AQI (Ambulance Quality Indicators) are taken from NHS England’s collection “Unify2 data collection – AmbSYS System Indicators” In this publication these figures will be referred to as AQI.
(2) On the 1st February 2013 Great Western Ambulance Service NHS Trust dissolved, from that point its services were delivered by the South Western Ambulance Service NHS Foundation Trust. Data for these two trusts have been merged as a separate line within the table. This is included only for additional information and is not used for any comparisons

Table 7 Category A emergency (1) incidents: responses within 8 minutes (2), by ambulance service, 2004-05 to 2012-13
percentage of responses
within 8 minutes
percentage of responses
within 8 minutes
Red 1 Red 2Ambulance service 2004-05 2005-06 2006-07 2007-08 2008-09 (2) 2009-10 2010-11 2011-12 2012-13 (April - May)
England 76.2 75.3(3)
74.6 77.1 74.3 74.3 74.9(5)
76.2 n/a 75.5 74.0 75.6
North East 77.3 75.2 76.3 78.5 75.7 75.4 75.8(5)
77.9 n/a 75.9 76.6 76.5
North West 76.7 74.3 72.7 75.6 74.3 73.0 73.6 76.7 n/a 76.8 73.5 76.6
Yorkshire 75.1 72.7 72.4 73.5 69.4 70.8 73.7 75.7 n/a 77.3 71.7 75.2
East Midlands 75.8 75.1 75.9 79.5 76.0 73.7 72.4 75.2 n/a 76.4 70.0 75.5
West Midlands (4) 79.4 77.9 77.2 80.9 75.4 72.5 76.8 76.3 n/a 75.9 78.9 75.5
East of England 76.3 76.6 75.2 75.0 74.6 75.7 74.6 75.4 n/a 75.0 74.2 72.8
London 76.6 75.1 75.2 78.9 75.5 75.5 75.1 75.7 n/a 70.6 77.7 76.3
South East Coast 74.8 76.0 75.1 77.2 75.2 76.3 76.0 77.6 n/a 77.9 75.1 75.1
South Central 76.2 76.0 73.8 75.1 72.6 74.8 77.5 75.9 n/a 74.7 78.2 75.2
Great Western 72.7 74.0 72.8 72.2 68.4 75.0 74.3 75.6 n/a 76.8 75.3 76.9
South Western 75.7 75.9 74.1 78.9 78.0 78.3 76.9 76.1 n/a 75.8 73.0 75.9
Isle of Wight 77.2 75.7 78.0 81.7 77.0 77.2 77.3 76.2 n/a 77.3 78.7 76.6
South Western(6).. .. .. .. 74.0 76.8 75.7 75.9 n/a 76.2 74.3 76.2
Source: Form KA34 Source: AQI
resubmitted and is correct as published, the impact at national level in 2010-11 was 0.1%. This issue may have affected previous years submissions however the impact cannot be confirmed (a revised dataset for previous years is not readily available).
Copyright © 2013, Health and Social Care Information Centre (HSCIC). All rights reserved.
From June 2012 Category A calls were split into Red 1 (most serious/time critical) and Red 2 (serious but less time critical). It is not possible to compare A8 and A 19 data from June 2012 onwards with earlier years due to different clock start times
AQI (Ambulance Quality Indicators) are taken from NHS England’s collection “Unify2 data collection – AmbSYS System Indicators” In this publication these figures will be
referred to as AQI.
Category A AQI 2012-13
(June - March)
Category A Calls
(6) On the 1st February 2013 Great Western Ambulance Service NHS Trust dissolved, from that point its services were delivered by the South Western Ambulance Service NHS Foundation Trust. Data for these two trusts have been merged as a separate line within the table. This is included only for additional information and is not used for any comparisons
(5) During 2010 -11 submission it was found that a trust had miscoded category A calls as category C. The 2010-11 data was
(2) From 2008-9 the starting point for response time measurement was changed, data relating to 8 and 19 minute responses from 2008-09 are not comparable with previous years.
(4) On the 1st October 2007 Staffordshire Ambulance Service NHS Trust merged with West Midlands Ambulance Service NHS Trust. For comparability, data for these two trusts have been merged for all previous years.
(1) From 2007-08 urgent calls are included (previous years relate to emergency calls only).
(3) Unadjusted figure, in 2005-06 several trusts misreported data, the adjusted estimate of the percentage for England is around 74% for more information see the 2005-06 publication.

Table 8 Emergency (1) incidents: responses within 19 minutes (2), by ambulance service, 2004-05 to 2012-13
percentage of responses within 19 minutes
AQI monthly2004-05 2005-06 2006-07 2007-08 2008-09 (2) 2009-10 2010-11 2011-12 2012-13 2012-13
Ambulance service
England 96.0 95.9 97.0 97.1 96.9 96.8 96.7(5)
96.8 n/a 96.0
North East 98.7 98.5 98.6 99.1 99.0 98.8 98.5(5)
98.5 n/a 97.0
North West 95.3 95.7 97.5 97.6 96.5 95.4 95.6 95.5 n/a 95.1
Yorkshire 93.5 94.7 96.8 96.1 96.1 96.7 97.4 97.9 n/a 97.0
East Midlands 96.2 95.9 96.9 97.6 97.3 96.5 93.5 92.3 n/a 91.9
West Midlands (3)98.3 97.5 98.2 98.6 98.0 97.5 98.0 98.0 n/a 97.3
East of England 97.7 97.5 96.2 95.7 95.8 96.0 95.6 94.9 n/a 93.5
London 95.9 95.2 98.0 98.1 98.6 98.7 99.0 99.1 n/a 98.2
South East Coast 97.1 97.6 97.6 97.6 96.9 98.2 97.7 98.1 n/a 97.3
South Central 95.5 94.9 94.7 94.8 94.5 92.7 95.3 95.3 n/a 95.0
Great Western 92.0 91.7 92.6 93.1 94.0 95.3 95.1 96.3 n/a 95.7
South Western 96.1 94.4 94.0 95.5 95.8 96.5 96.1 95.8 n/a 95.4
Isle of Wight 98.6 98.4 98.5 99.1 96.4 97.1 98.2 97.9 n/a 97.4
South Western(7).. .. .. .. 95.1 95.9 95.6 96.0 n/a 95.5
Source: Form KA34 Source: AQI
(1) From 2007-08 urgent calls are included (previous years relate to emergency calls only).(2) From 2008-9 the starting point for response time measurement was changed, data relating to 8 and 19 minute responses from 2008-09 are not comparable with previous years.
(4) Due to changes in the category B 19 minute definitions for 2010-11 this data is not fully comparable with previous years. For more information see the guidance Annex 1 or the Data Quality section within this publication (Ambulance services England 2010-11)
and is correct as published, the impact at national and regional level in 2010-11 was minimal. This issue may have affected previous years submissions however the impact cannot be confirmed (a revised dataset for previous years is not readily available). (6) Category B was dropped in 2011-12. As a result, incidents previously categorised as B have been re-categorised into categories A and C. See previous versions of this publication for a timeseries of category B 19 minute proportions.
Copyright © 2013, Health and Social Care Information Centre (HSCIC). All rights reserved.
AQI (Ambulance Quality Indicators) are taken from NHS England’s collection “Unify2 data collection – AmbSYS System Indicators” In
this publication these figures will be referred to as AQI.
(7) On the 1st February 2013 Great Western Ambulance Service NHS Trust dissolved, from that point its services were delivered by the South Western Ambulance Service NHS Foundation Trust. Data for these two trusts have been merged as a separate line within the table. This is included only for additional information and is not used for any comparisons
(3) On the 1st October 2007 Staffordshire Ambulance Service NHS Trust merged with West Midlands Ambulance Service NHS Trust. For comparability, data for these two trusts have been merged for all previous years.
(5) During 2010 -11 submission it was found that a trust had miscoded category A calls as category C. The 2010-11 data was resubmitted
Category A calls
From June 2012 Category A calls were split into Red 1 (most serious/time critical) and Red 2 (serious but less time critical). It is not possible to compare A8 and A 19 data from June 2012 onwards with earlier years due to different clock start times

Table 9 Emergency patient journeys and destinations by ambulance service, 2012-13
thousands thousands
Total Emergency Journeys of which
Patient Journeys to Type 1 & 2
A&E (1)
Patient Journeys to destination other than Type 1 & 2
A&E (1)Special / Planned
Journeys total of which
Special Journeys
Planned Journeys
AQI monthly 2012-13
Emergency journeys
England 12,148.3 5,017.1 4,530.1 487.0 7,131.1 28.3 7,102.8 4,898.3
North East 1,291.0 308.0 244.8 63.3 983.0 0.0 983.0 307.2
North West 2,615.2 790.3 747.2 43.2 1,824.9 13.8 1,811.1 790.3
Yorkshire 1,547.9 523.5 491.0 32.4 1,024.4 5.5 1,018.9 488.3
East Midlands 580.4 433.2 421.8 11.4 147.2 0.0 147.2 388.5
West Midlands 1,359.2 535.5 471.2 64.2 823.7 5.8 818.0 540.6
East of England 1,218.9 453.6 390.2 63.4 765.3 0.0 765.3 453.6
London 965.1 832.2 743.4 88.8 132.9 1.0 131.9 832.2
South East Coast 777.9 411.0 375.7 35.3 366.9 0.0 366.9 411.0
South Central 791.9 279.2 273.9 5.4 512.6 0.0 512.6 234.3
Great Western 341.9 143.5 121.1 22.4 198.4 0.0 198.4 144.8
South Western 628.0 293.8 239.2 54.6 334.2 0.2 334.0 294.0
Isle of Wight 31.0 13.4 10.7 2.7 17.6 2.0 15.6 13.4
South Western(2) 969.8 437.3 360.3 76.9 532.6 0.2 532.3 438.8
Source: Form KA34 Source: AQI
Copyright © 2013, Health and Social Care Information Centre (HSCIC). All rights reserved.
(1) Type 1 A&E destination is generally consultant led and has full resuscitation facilities and accommodation for reception of A&E patients whereas type 2 A&E departments are still consultant led but provide a single specialty (e.g.
(2) On the 1st February 2013 Great Western Ambulance Service NHS Trust dissolved, from that point its services were delivered by the South Western Ambulance Service NHS Foundation Trust. Data for these two trusts have been merged as a separate line within the table. This is included only for additional information and is not used for any comparisons
AQI (Ambulance Quality Indicators) are taken from NHS England’s collection “Unify2 data collection – AmbSYS System Indicators” In this
publication these figures will be referred to as AQI.

Table 10 Emergency (1) patient journeys per 100 incidents by ambulance service, 2004-05 to 2009-10, and by category of call by ambulance service for 2010-11 to 2012-13
per 100 incidents
2004-05 2005-06 2006-07 2007-08 2008-09 2009-10
Ambulance ServiceEmergency
journeysEmergency
journeysEmergency
journeysEmergency
journeysEmergency
journeysEmergency
journeysEmergency
journeysCategory
ACategory
BCategory
CEmergency
journeysCategory
ACategory
CEmergency
journeysCategory
ACategory
C
England 73 73 70 72 73 73 74 79 69 75 73 77 71 72 76 69
North East 81 80 75 79 79 79 81 85 76 85 83 84 81 83 85 82
North West 77 79 77 80 83 87 86 89 83 86 84 86 83 83 85 82
Yorkshire 78 78 75 79 80 79 82 85 77 84 81 84 79 80 83 77
East Midlands 78 79 73 71 70 70 69 70 65 76 71 73 70 70 72 69
West Midlands (2) 66 67 60 71 70 71 73 79 66 75 71 76 68 68 71 65
East of England 68 66 65 65 64 64 64 70 59 65 64 70 61 64 69 62
London 74 75 76 76 79 75 77 83 72 77 78 83 75 77 82 74
South East Coast 74 66 64 67 70 70 70 80 64 69 68 73 65 67 71 64
South Central 66 65 62 62 66 65 66 70 61 69 66 69 65 63 66 63
Great Western 77 75 70 68 66 67 61 66 50 68 64 69 60 60 66 56
South Western 64 63 62 64 65 64 64 67 58 68 62 66 61 59 63 58
Isle of Wight 70 67 63 76 80 60 76 78 79 72 70 72 69 69 71 68
South Western(3) .. .. .. 66 65 65 63 66 55 68 63 67 61 60 64 57
Source: Form KA34
Copyright © 2013, Health and Social Care Information Centre (HSCIC). All rights reserved.
2012-13
(3) On the 1st February 2013 Great Western Ambulance Service NHS Trust dissolved, from that point its services were delivered by the South Western Ambulance Service NHS Foundation Trust. Data for these two trusts have been merged as a separate line within the table. This is included only for additional information and is not used for any comparisons
(2) On the 1st October 2007 Staffordshire Ambulance Service NHS Trust merged with West Midlands Ambulance Service NHS Trust. For comparability, data for these two trusts have been merged for all previous years.
2011-123
(1) From 2007-08 urgent and emergency patient journeys were merged, it is not possible to compare data from this point with previous years because the incidents used to calculate the numbers in this table now include urgent calls (previous years relate to emergency calls only).
2010-11

Table 11 Emergency patient journeys (1), by ambulance service 2004-05 to 2012-13
thousands and percentage thousands
Ambulance service 2004-05 2005-06 2006-07 2007-08 2008-09 2009-10 2010-11 2011-12 2012-13
AQI monthly 2012-13
Emergency journeys
England 4,170.6 4,253.0 4,272.1 4,263.2 4,510.0 4,701.4 4,874.2 4,919.3 5,017.1 2.0% 4898.3
North East 257.2 259.0 255.9 255.4 268.1 278.7 293.7 303.1 308.0 1.6% 307.2
North West 621.1 643.1 665.2 678.1 722.9 781.1 774.9 771.0 790.3 2.5% 790.3
Yorkshire 445.6 439.7 442.3 431.8 451.1 470.8 503.5 512.1 523.5 2.2% 488.3
East Midlands 383.5 398.6 399.1 370.5 382.2 402.0 413.4 422.6 433.2 2.5% 388.5
West Midlands (2) 429.3 456.1 432.6 466.6 486.5 505.9 532.4 531.0 535.5 0.8% 540.6
East of England 397.5 405.7 419.0 394.1 409.3 430.6 446.6 446.3 453.6 1.6% 453.6
London 668.6 689.7 699.8 722.6 770.8 762.2 812.6 809.4 832.2 2.8% 832.2
South East Coast 353.6 336.4 330.2 338.3 369.7 393.3 409.0 406.0 411.0 1.2% 411.0
South Central 220.7 225.1 226.2 217.6 242.2 247.2 257.8 271.2 279.2 3.0% 234.3
Great Western 161.1 163.2 158.3 148.5 153.3 171.5 161.2 173.6 143.5 -17.3% 144.8
South Western 221.0 224.8 231.5 226.5 239.3 247.5 254.8 260.2 293.8 12.9% 294.0
Isle of Wight 11.4 11.5 11.9 13.1 14.6 10.6 14.3 12.9 13.4 4.5% 13.4
South Western(3) 382.1 388.1 389.9 375.0 392.6 419.1 416.0 433.8 437.3 438.8
Source: Form KA34 Source: AQI
Copyright © 2013, Health and Social Care Information Centre (HSCIC). All rights reserved.
% change 2011-12 to 2012-13
(2) On the 1st October 2007 Staffordshire Ambulance Service NHS Trust merged with West Midlands Ambulance Service NHS Trust. For comparability, data for these two trusts have been merged for all previous years.
(1) From 2007-08 emergency and urgent patient journeys have been merged, for comparison purposes previous years have been aggregated.
(3) On the 1st February 2013 Great Western Ambulance Service NHS Trust dissolved, from that point its services were delivered by the South Western Ambulance Service NHS Foundation Trust. Data for these two trusts have been merged as a separate line within the table. This is included only for additional information and is not used for any comparisons
AQI (Ambulance Quality Indicators) are taken from NHS England’s collection “Unify2 data collection – AmbSYS System Indicators” In
this publication these figures will be referred to as AQI.

Table 12 Emergency patient destinations by ambulance service and category of call for 2012-13
thousands
of which
Ambulance Service TotalCategory
ACategory
C TotalCategory
ACategory
C TotalCategory
ACategory
C
England 5,017.1 2,060.6 2,956.5 4,530.1 1,942.7 2,587.5 487.0 117.9 369.1
North East 308.0 135.1 172.9 244.8 117.8 126.9 63.3 17.3 46.0
North West 790.3 327.7 462.6 747.2 321.9 425.3 43.2 5.9 37.3
Yorkshire 523.5 219.4 304.1 491.0 210.7 280.3 32.4 8.7 23.8
East Midlands 433.2 169.8 263.3 421.8 166.8 255.0 11.4 3.1 8.3
West Midlands 535.5 243.9 291.6 471.2 242.1 229.2 64.2 1.8 62.4
East of England 453.6 167.6 286.0 390.2 153.8 236.4 63.4 13.8 49.6
London 832.2 357.4 474.7 743.4 322.2 421.2 88.8 35.2 53.6
South East Coast 411.0 189.8 221.2 375.7 176.3 199.4 35.3 13.5 21.8
South Central 279.2 74.5 204.8 273.9 73.8 200.1 5.4 0.7 4.7
Great Western 143.5 61.7 81.8 121.1 55.5 65.6 22.4 6.1 16.3
South Western 293.8 108.4 185.4 239.2 97.7 141.5 54.6 10.7 43.9
Isle of Wight 13.4 5.3 8.2 10.7 4.1 6.6 2.7 1.2 1.6
South Western(2) 437.3 170.1 267.2 360.3 153.3 207.1 76.9 16.8 60.1
Source: Form KA34
Copyright © 2013, Health and Social Care Information Centre (HSCIC). All rights reserved.
AQI (Ambulance Quality Indicators) are taken from NHS England’s collection “Unify2 data collection – AmbSYS System
Indicators” In this publication these figures will be referred to as AQI.
(1) Type 1 A&E destination is generally consultant led and has full resuscitation facilities and accommodation for reception of A&E patients whereas type 2 A&E departments are still consultant led but provide a single specialty (e.g. dentistry). Other destinations can include minor injury units, walk in centres etc
All emergency patient journeysPatient Journeys to destination Type 1 & 2 A&E
(1)Patient Journeys to destination other than
Type 1 & 2 A&E (1)
(2) On the 1st February 2013 Great Western Ambulance Service NHS Trust dissolved, from that point its services were delivered by the South Western Ambulance Service NHS Foundation Trust. Data for these two trusts have been merged as a separate line within the table. This is included only for additional information and is not used for any comparisons

Table 13 Emergency incidents : number of patients treated at the scene only by category and ambulance trust, 2009-10(1) to 2012-13(2)
thousands thousands
2012-13
Ambulance Service TotalCategory
ACategory
BCategory
C TotalCategory
ACategory
BCategory
C TotalCategory
ACategory
C TotalCategory
ACategory
C Total(4)
England 1,598.6 448.2 759.3 391.1 1,762.9 498.6 825.5 438.8 1,809.3 593.7 1,215.6 1,990.4 681.2 1,309.2 1,922.7
North East 81.5 21.3 43.4 16.7 75.9 22.1 39.9 13.9 74.3 29.9 44.4 73.8 31.0 42.7 72.1
North West 61.6 29.2 23.0 9.5 127.0 46.6 56.5 23.8 152.6 53.4 99.1 167.2 62.2 105.0 168.2
Yorkshire 126.3 40.7 59.1 26.5 111.5 35.5 51.2 24.8 118.0 39.3 78.6 132.9 45.7 87.2 127.6
East Midlands 184.6 61.7 91.5 31.5 180.6 60.8 85.8 33.9 169.2 60.5 108.7 181.9 64.5 117.4 180.4
West Midlands 202.9 50.2 98.1 54.6 221.2 64.5 102.1 54.6 228.0 85.5 142.5 262.1 103.6 158.5 256.5
East of England 245.0 65.9 111.8 67.3 256.1 71.2 111.2 73.7 263.3 74.3 189.0 267.8 81.5 186.3 262.5
London 168.3 46.0 83.2 39.1 245.5 58.3 129.7 57.5 232.3 67.4 165.0 248.3 80.6 167.7 249.1
South East Coast 175.1 37.2 82.7 55.2 180.0 36.6 82.7 60.7 187.1 67.4 119.8 200.5 76.1 124.3 189.8
South Central 140.2 33.2 69.3 37.7 135.0 32.7 62.5 39.8 143.8 33.7 110.1 161.4 38.9 122.5 161.7
Great Western 84.7 26.4 38.6 19.7 101.6 33.7 45.4 22.5 98.9 32.7 66.2 94.2 31.1 63.0 73.4
South Western 124.5 35.7 57.4 31.4 124.0 35.1 57.1 31.8 136.3 47.6 88.7 194.4 63.7 130.6 175.4
Isle of Wight 4.0 0.7 1.4 2.0 4.4 1.3 1.3 1.8 5.5 2.0 3.5 6.0 2.2 3.8 6.0
South Western(3) 209.2 62.1 96.0 51.1 225.7 68.8 102.5 54.3 235.2 80.3 154.9 288.5 94.9 193.6 248.8
Source: Form KA34 Source: AQI(1) Data prior to 2009-10 is not available
(2) Category B was dropped in 2011-12. As a result, incidents previously categorised as B have been re-categorised into categories A and C. It is therefore not possible to make direct comparisons between categories in 2011-12 and those in earlier years
(4)AQI does not enable further breakdown to Category A and Category C
Copyright © 2013, Health and Social Care Information Centre (HSCIC). All rights reserved.
AQI (Ambulance Quality Indicators) are taken from NHS England’s collection “Unify2 data collection – AmbSYS System
Indicators” In this publication these figures will be referred to as AQI.
2009-10 2010-11 2011-12 2012-13
(3) On the 1st February 2013 Great Western Ambulance Service NHS Trust dissolved, from that point its services were delivered by the South Western Ambulance Service NHS Foundation Trust. Data for these two trusts have been merged as a separate line within the table. This is included only for additional information and is not used for any comparisons

Ambulance Services, England 2012-13
45 Copyright © 2013, Health and Social Care Information Centre. All rights reserved.
Annex 1: KA34 guidance notes
KA34 – Quality of Ambulance Services Return
A guide to completing the collection using the Omnibus System

Ambulance Services, England 2012-13
46 Copyright © 2013, Health and Social Care Information Centre. All rights reserved.
The Health and Social Care Information Centre (HSCIC) is England‟s central, authoritative source of health and social care information. Acting as a „hub‟ for high quality, national, comparative data, we deliver information for local decision makers, to improve the quality and efficiency of care.
www.hscic.gov.uk Author: The Health and Social Care Information Centre (HSCIC), Data Collections Team
Version: 6.7
Date of Publication: 1st April 2013

Ambulance Services, England 2012-13
47 Copyright © 2013, Health and Social Care Information Centre. All rights reserved.
Contents
1. Introduction 49
2. Ambulance Response Time Requirements 50
3. Definitions for Completion of KA34 51
3.1 Part 1 - Emergency calls: 51
3.2 Resolving Category C calls through telephone advice 51
3.3 Incidents 51
3.4 Patient Destinations and Patient Journeys 52
3.5 Timing of emergency response times – clock start and stop 52
3.6 Emergency response 53
3.7 Cross-border Calls 53
4. Completing the KA34 Return 54
4.1 Part 1: Emergency calls 54
4.2 Parts 2 and 3: Emergency Patient Destinations and Patient Journeys 55
4.3 Breach Reasons 56
5. ANNEX 57
6. Copy of Omnibus Form 58
7. Contacts 59

Ambulance Services, England 2012-13
48 Copyright © 2013, Health and Social Care Information Centre. All rights reserved.
Introduction The information obtained from the KA34 is provided by individual ambulance service providers to show volume of service and performance against required standards. This information is published annually in a statistical bulletin. The published data is used by the Department of Health to answer correspondence and to underpin policy development and implementation. This is a mandatory collection and has been approved by the Review of Central Returns steering committee under the reference number ROCR/OR/2128/001MAND. This document is intended to help you complete this collection using the Omnibus System. However, if you have any further queries please do not hesitate to contact us using the details in the contacts section.

Ambulance Services, England 2012-13
49 Copyright © 2013, Health and Social Care Information Centre. All rights reserved.
Data Reporting Requirements for the Completion of KA34, 2012-13 Introduction
1.1 The information obtained from the KA34 is analysed by individual ambulance service providers to show volume of service and performance against required standards; including clinical quality indicators. This information is published each year by the Health and Social Care Information Centre (HSCIC) with a conclusive annual bulletin being published. The most recent annual statistical bulletin “Ambulance services, England: 2011-12”, is available on the HSCIC website. Find data - Health & Social Care Information Centre
1.2 The KA34 reporting template for 2012-13 is enclosed at the end of this guidance document. It is planned to publish information derived from the returns made by the ambulance services on an annual basis.
Important note: The principal changes to the guidance for 2011-12 reporting were:
A) Removal of the Category B, 19-minute ambulance response time requirement. This has meant that the term ‘Category B’ has been removed and the guidance and collection form has been amended to reflect this.
To note: that some re-numbering of sections has been required to allow changes to be made to this guidance.
1.3 NHS Ambulance Trusts use different types of technical solutions to quickly identify the location of a caller, to dispatch an emergency response and to record electronically the various stages of the call management cycle, including the stopping of the clock.
1.4 It is expected that ambulance services will have robust governance arrangements, including data management protocols, in place to assure their Board and independent auditors that all performance data submitted as part of this return is measured and recorded in accordance with this guidance.

Ambulance Services, England 2012-13
50 Copyright © 2013, Health and Social Care Information Centre. All rights reserved.
Ambulance Response Time Requirements 2.1 National response times standards for emergency and urgent ambulance services have been
set since 1974. The NHS Executive Review of Ambulance Performance Standards introduced revised standards following publication in July 1996. The following revised targets were issued to ambulance services in Executive Letter EL(96)87, as amended by the Department of Health‟s letters to all Chief Executives dated 10 September 2004, 28 September 2004 and 2 March 2006, and most recently via the NHS Operating Framework 2011-12.
2.1.1 Category A: presenting conditions, which may be immediately life threatening and should receive an emergency response within 8 minutes irrespective of location in 75% of cases. Presenting conditions, which require a fully equipped ambulance vehicle to attend the incident, must have an ambulance vehicle arrive within 19 minutes of the request for transport being made in 95% of cases, unless the control room decides that an ambulance is not required.
2.1.2 Category C: presenting conditions which are not immediately life threatening. For these calls
the response time standards are not set nationally but are locally determined.
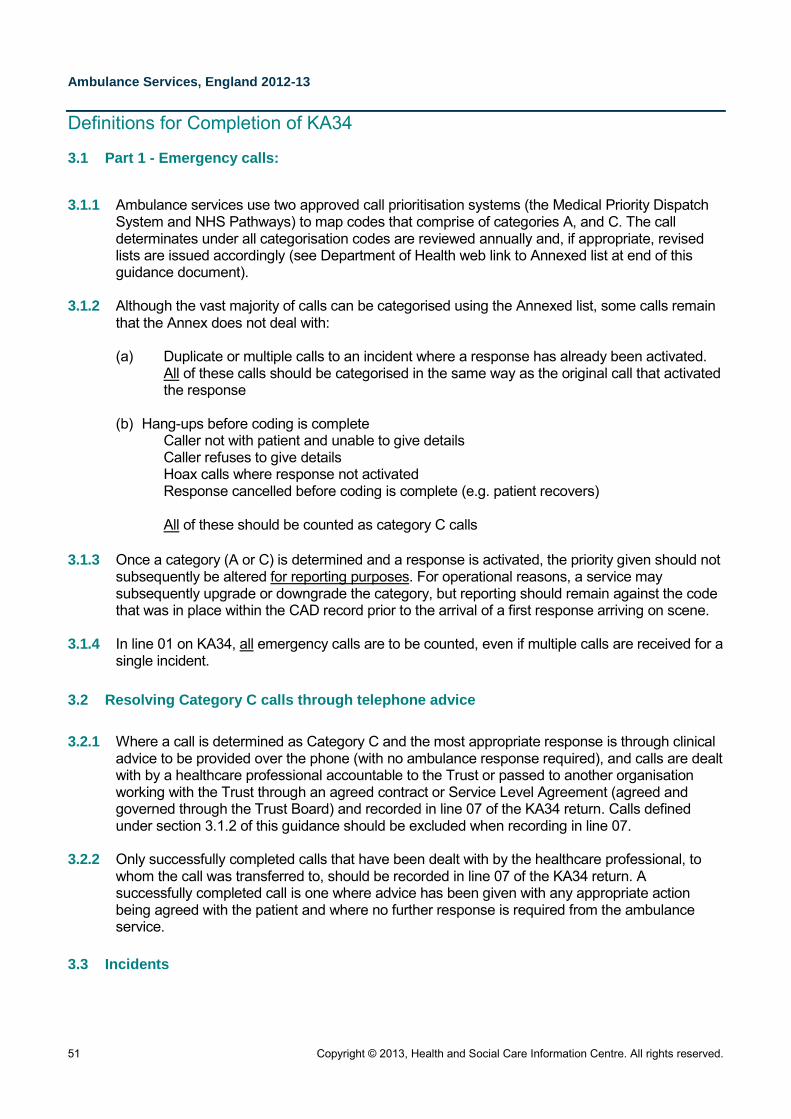
Ambulance Services, England 2012-13
51 Copyright © 2013, Health and Social Care Information Centre. All rights reserved.
Definitions for Completion of KA34
3.1 Part 1 - Emergency calls:
3.1.1 Ambulance services use two approved call prioritisation systems (the Medical Priority Dispatch
System and NHS Pathways) to map codes that comprise of categories A, and C. The call determinates under all categorisation codes are reviewed annually and, if appropriate, revised lists are issued accordingly (see Department of Health web link to Annexed list at end of this guidance document).
3.1.2 Although the vast majority of calls can be categorised using the Annexed list, some calls remain
that the Annex does not deal with:
(a) Duplicate or multiple calls to an incident where a response has already been activated. All of these calls should be categorised in the same way as the original call that activated the response
(b) Hang-ups before coding is complete
Caller not with patient and unable to give details Caller refuses to give details Hoax calls where response not activated Response cancelled before coding is complete (e.g. patient recovers)
All of these should be counted as category C calls
3.1.3 Once a category (A or C) is determined and a response is activated, the priority given should not
subsequently be altered for reporting purposes. For operational reasons, a service may subsequently upgrade or downgrade the category, but reporting should remain against the code that was in place within the CAD record prior to the arrival of a first response arriving on scene.
3.1.4 In line 01 on KA34, all emergency calls are to be counted, even if multiple calls are received for a
single incident.
3.2 Resolving Category C calls through telephone advice
3.2.1 Where a call is determined as Category C and the most appropriate response is through clinical
advice to be provided over the phone (with no ambulance response required), and calls are dealt with by a healthcare professional accountable to the Trust or passed to another organisation working with the Trust through an agreed contract or Service Level Agreement (agreed and governed through the Trust Board) and recorded in line 07 of the KA34 return. Calls defined under section 3.1.2 of this guidance should be excluded when recording in line 07.
3.2.2 Only successfully completed calls that have been dealt with by the healthcare professional, to
whom the call was transferred to, should be recorded in line 07 of the KA34 return. A successfully completed call is one where advice has been given with any appropriate action being agreed with the patient and where no further response is required from the ambulance service.
3.3 Incidents

Ambulance Services, England 2012-13
52 Copyright © 2013, Health and Social Care Information Centre. All rights reserved.
3.3.1 For purposes of reporting performance, each incident responded to should be counted only once (except for line 01), regardless of how many ambulances or other emergency responses are despatched to the incident.
3.4 Patient Destinations and Patient Journeys
3.4.1 Each patient conveyed is counted as an individual patient destination. Similarly, each patient
who is treated at the scene of an incident without requiring onward conveyance is counted as an individual treatment at the scene.
Part 2 – Emergency Patient Destinations:
3.4.2 Disaggregation of emergency patient destinations - include only those patients conveyed as
a result of a 999 call made by a member of the public or organisation, or as a result of being categorised as an emergency following a referral by a health care professional.
3.4.3 Emergency patient journeys to Type 1 and 2 A&E (as defined in the NHS Data Dictionary) –
include those emergency patient journeys provided by the Trust where a patient is transported to a Type 1 or Type 2 A&E department only.
3.4.4 Emergency patient journeys to a destination other than Type 1 and 2 A&E – include those
emergency patient journeys provided by the Trust where a patient is transported to all other destinations other than Type 1 or 2 A&E departments. An example of this could be conveying a patient to a minor injuries unit or a Walk-in Centre, a specialist stroke or cardiac centre, GP service or any other health or social care service.
3.4.5 Treatment at the scene – include those patients who were treated at the scene by the
ambulance service and as a result of that treatment did not require onward transportation for further treatment. If, as part of that treatment, the ambulance trust staff arranged, for example, an appointment for the patient at a GP surgery or a follow-up home visit from a health professional that should also be counted as treatment at the scene. Responses where ambulance trust staff attended an incident and advice was given but no clinical intervention was necessary with no onward transportation required, then that should also be included as treatment at the scene.
Part 3 – Patient Journeys: Non-urgent
3.4.6 The following provides a more detailed clarification of what should be included in Part 3 „Patient
Journeys: Non-Urgent‟ section of the KA34 return: 3.4.7 Special patient journeys - include those patient journeys provided by the Trust where
punctuality is of paramount importance and late arrival beyond the prescribed time could be detrimental to the patient‟s medical condition. An example of this is a transfer between hospitals where a serious or critically ill patient requires specialist facilities not available at the transferring hospital and where treatment is required en route.
3.4.8 Planned/ non-emergency patient journeys - include all other patient journeys by the Trust.
These are for any patients not given emergency or special priority (e.g. most journeys for outpatient appointments, hospital admissions and discharges of a routine nature, including transport to and from other healthcare facilities).
3.5 Timing of emergency response times – clock start and stop

Ambulance Services, England 2012-13
53 Copyright © 2013, Health and Social Care Information Centre. All rights reserved.
3.5.1 In order to calculate the response time the “clock starts” when the call is presented to the control room telephone switch. This will be the case for all calls received on control room telephone lines; from dedicated 999 lines or otherwise. For calls that are electronically transferred to the computer aided dispatch (CAD) system from another CAD the clock starts immediately when that call record is first received by an ambulance trust system.
3.5.2 The "clock stops" when the first emergency response vehicle arrives at the scene of the incident.
To clarify, a legitimate clock stop position can include the response arriving at a pre-arrival rendezvous point when one has been determined as appropriate for the safety of ambulance staff in agreement with the control room. For example, a rendezvous point could be agreed for the following situations:
Information has been received relating to the given location that the patient is violent and police or other further assistance is required.
Information has been received that the operational incident because of its nature is unsafe for ambulance staff to enter.
3.5.3 A response within 8 minutes means 8 minutes 0 seconds (i.e. 480 seconds) or less. Similarly,
19 minutes means 19 minutes 0 seconds or less.
Category A 19-minute transport request 3.5.4 Whichever is the earlier, the clock starts when either
the initial responder makes a request for transport to the control room, or the information received from the 999 caller indicates that transport is needed, in which
case the clock starts as per 3.5.1.
3.6 Emergency response
3.6.1 For the purposes of the Category A 8-minute standard, an emergency response may only be by:
An emergency ambulance; or A rapid response vehicle equipped with a defibrillator to provide treatment at the scene; or An approved first responder equipped with a defibrillator, who is accountable to the ambulance
service; or when a healthcare professional is at the location of the incident, equipped with a defibrillator and deemed clinically appropriate to respond by the trust. A first responder is not a substitute for an ambulance response and an ambulance response should be dispatched to all calls attended by an approved first responder.
3.6.2 For the purposes of the Category A 19-minute standard, transport is defined as a fully equipped
ambulance vehicle (car or ambulance) able to transport the patient in a clinically safe manner. 3.7 Cross-border Calls
3.7.1 A cross-border call/incident should be reported by only one Ambulance Service. 3.7.2 Each NHS Ambulance Service is responsible for reporting on the performance of all emergency
calls for which it receives the initial call. This includes calls received by a Service that relate to incidents occurring outside its recognised boundary and calls relating to incidents within or outside its boundary that are subsequently transferred to another Service for response.
3.7.3 An Ambulance Service should not report, or report on the performance relating to, any incident
where another Ambulance Service received the initial call, even if the call was transferred to and

Ambulance Services, England 2012-13
54 Copyright © 2013, Health and Social Care Information Centre. All rights reserved.
dealt with by that Ambulance Service. Trusts responsible for dealing with any cross-border calls should advise the Trusts who received the initial call of all appropriate clock start times for performance reporting purposes.
3.7.4 Where an NHS Ambulance Service asks another NHS Ambulance Service to undertake a call on
its behalf, the responsibility for dealing with the call in the most appropriate way passes to the Ambulance Service once it has accepted it.
Completing the KA34 Return
4.1 Part 1: Emergency calls
Line 01 on KA34: Total number of emergency calls
4.1.1 Record in column 1 on KA34 the total number of emergency calls where the incident is classified
as immediately life-threatening (Category A), in column 2 on KA34 the total number of emergency calls where the incident is classified as category C.
4.1.2 If there have been multiple calls to an incident, all calls should be recorded in this line. Include
non-urgent transport requests, which, after interrogation and the agreement of the caller, are treated as either Category A, or C calls.
Lines 02 to 07 on KA34: Emergency responses 4.1.3 In Line 02 on KA34 record the total number of incidents, which resulted in an emergency
response arriving at the scene. If there have been multiple calls to a single incident, only one incident should be recorded. A separate entry should be made for each of the categories A and C.
4.1.4 In Line 03 on KA34 record the total number of Category A incidents, which resulted in an
emergency response arriving at the scene of the incident within 8 minutes. A response within eight minutes means eight minutes zero seconds or less. Note that this detail is not required for category C incidents.
RESPONSE PERFORMANCE FOR CATEGORY A INCIDENTS AT 8 MINUTES IS
CALCULATED AS FOLLOWS:
Emergency responses within 8 minutes (Line 03) _________________________________________ Total number of incidents with an emergency responses (Line 02)
4.1.5 In Line 04 on KA34, record the total number of calls where, following the arrival of a rapid
response vehicle or an approved responder at the scene, the control room subsequently decided that a fully equipped ambulance vehicle would not be required for category A calls. Note that this detail is not required for category C.
4.1.6 In Line 05 on KA34, record the total number of incidents that resulted in the arrival of a fully
equipped ambulance vehicle (car or ambulance) able to transport the patient. Note that this detail is not required for category C.

Ambulance Services, England 2012-13
55 Copyright © 2013, Health and Social Care Information Centre. All rights reserved.
NOTE: The number of emergency incidents resulting in the arrival of an emergency response
(line 02) can be split into:
(i) those where an emergency response arrived and the control room subsequently decided that a fully equipped ambulance vehicle (car or ambulance) was not needed (line 04 on KA34),
(ii) those where a fully equipped ambulance vehicle (car or ambulance) able to transport
the patient was needed (line 05 on KA34).
For Category A, the total of lines 04 and 05 on KA34 should therefore equal the number recorded in line 02 on KA34.
4.1.7 In Line 06 on KA34, record the total number of incidents that resulted in the arrival of an
ambulance response within 19 minutes, as per section 3.6.2. For Category A incidents, the timing starts when a request for transport is made (see 3.5.4). Note that this detail not required for category C
NOTE: only the first ambulance response to arrive at the scene of the incident should be
included in lines 05 or 06 where more than one ambulance response has been despatched. RESPONSE PERFORMANCE FOR CATEGORY A INCIDENTS AT 19 MINUTES IS
CALCULATED AS FOLLOWS:
Total number of incidents with an ambulance response arriving within 19 minutes (Line 06) _________________________________________ Total number of incidents with ambulance response arriving (Line 05)
4.1.8 In line 07 on KA34, record the total number of successfully completed Category C calls that
have been resolved by a designated healthcare professional providing telephone advice (see section. 3.2.)
4.2 Parts 2 and 3: Emergency Patient Destinations and Patient Journeys
4.2.1 Count each patient conveyed as an individual patient destination (part 2) or as an individual
patient journey (part 3). Part 2: Emergency Patient Destinations 4.2.2 Record the number of patient journeys separately for Categories A and C arising from
emergency calls into the following three destination categories (see section 3.4.2):
Patient journeys to Type 1 and 2 A&E Patient journeys to a destination other than Type 1 and 2 A&E. Treatment at the scene
Part 3: Patient Journeys - Non-urgent

Ambulance Services, England 2012-13
56 Copyright © 2013, Health and Social Care Information Centre. All rights reserved.
4.2.3 Record here the total number of patient journeys other than emergency, include special and
planned journeys.
4.3 Breach Reasons
4.3.1 Some errors are breachable and can be bypassed by providing an explanation. Please be aware that any reasons you provide in the breachable validations sections of this collection may be reproduced in the Health and Social Care Information Centre's (and in other) formal publications

Ambulance Services, England 2012-13
57 Copyright © 2013, Health and Social Care Information Centre. All rights reserved.
ANNEX
The call categorisation codes that comprise Categories A and C are set out at http://webarchive.nationalarchives.gov.uk/20130107105354/http://www.dh.gov.uk/prod_consum_dh/groups/dh_digitalassets/documents/digitalasset/dh_073488.pdf The code lists are reviewed annually by the Emergency Call Prioritisation Advisory Group (ECPAG) and, if appropriate, revised lists will be issued accordingly.

Ambulance Services, England 2012-13
58 Copyright © 2013, Health and Social Care Information Centre. All rights reserved.
Annex 2: KA34 form

Ambulance Services, England 2012-13
59 Copyright © 2013, Health and Social Care Information Centre. All rights reserved.
Contacts If you have any questions regarding this collection, please contact us using the details below.
For queries relating to the content of this collection (guidance, definitions), please contact Ambulance Policy – Urgent and Emergency Care Team at the Department of Health, by emailing: [email protected] Please state clearly:
Your Ambulance Trust In the email subject area “KA34 – Ambulance Services Return”
For technical issues and queries relating to the Omnibus System, please refer to the Omnibus User Guidance Manual, which can be accessed by clicking the following link: http://www.hscic.gov.uk/omnibussurvey If queries remain, please email: [email protected] Thank you for completing this collection.

Ambulance Services, England 2012-13
60 Copyright © 2013, Health and Social Care Information Centre. All rights reserved.
Published by The Health and Social Care Information Centre (HSCIC)
Part of the Government Statistical Service
This publication may be requested in large print or other formats.
For further information: www.hscic.gov.uk
0845 300 6016
Copyright © 2013 The Health and Social Care Information Centre, Data Collections Team. All rights reserved. This work remains the sole and exclusive property of the Health and Social Care Information Centre and may only be reproduced where there is explicit reference to the ownership of the Health and Social Care Information Centre. This work may be re-used by NHS and government organisations without permission. This work is subject to the Re-Use of Public Sector Information Regulations and permission for commercial use must be obtained from the copyright holder.


