80
The International Authority on Air System Components AIR MOVEMENT AND CONTROL ASSOCIATION INTERNATIONAL, INC. AMCA Publication 201-02 Fans and Systems (R2007)
| Date post: | 02-Dec-2015 |
| Category: |
Documents |
| Upload: | abubacker-siddique |
| View: | 413 times |
| Download: | 22 times |

The International Authority on Air System Components
AIR MOVEMENT AND CONTROLASSOCIATION INTERNATIONAL, INC.
AMCAPublication 201-02
Fans and Systems
(R2007)

AMCA PUBLICATION 201-02 (R2007)
Fans and Systems
Air Movement and Control Association International, Inc.
30 West University Drive
Arlington Heights, IL 60004-1893
© 2007 by Air Movement and Control Association International, Inc.
All rights reserved. Reproduction or translation of any part of this work beyond that permitted by Sections 107 and
108 of the United States Copyright Act without the permission of the copyright owner is unlawful. Requests for
permission or further information should be addressed to the Executive Director, Air Movement and Control
Association International, Inc. at 30 West University Drive, Arlington Heights, IL 60004-1893 U.S.A.
Forward
ANSI/AMCA Standard 210 Laboratory Methods of Testing Fans for Aerodynamic Performance Rating, provides abasis for accurately rating the performance of fans when tested under standardized laboratory conditions. Theactual performance of a fan when installed in an air moving system will sometimes be different from the fanperformance as measured in the laboratory. The difference in performance between the laboratory and the fieldinstallation can sometimes be attributed to the interaction of the fan and the duct system, i.e., duct system designcan diminish the usable output of the fan.
AMCA Publication 201 Fans and Systems, introduced the concept of System Effect Factor to the air movingindustry. The System Effect Factor quantifies the duct system design effect on performance. The System EffectFactor has been widely accepted since its inception in 1973. It must be remembered, however, that the "factors"provided are approximations as it is prohibitive to test all fan types and all duct system configurations. The majorrevision to this edition of AMCA Publication 201 Fans and Systems, is a change to the use of SI units of measure,with Inch-Pound units being given secondary consideration.
AMCA 201 Review Committee
Bill Smiley The Trane Company / LaCrosse
James L. Smith Aerovent, A Twin City Fan Company
Tung Nguyen Emerson Ventilation Products
Patrick Chinoda Hartzell Fan, Inc.
Rick Bursh Illinois Blower, Inc.
Sutton G. Page Austin Air Balancing Corp.
Paul R. Saxon AMCA Staff
Disclaimer
AMCA International uses its best efforts to produce standards for the benefit of the industry and the public in lightof available information and accepted industry practices. However, AMCA International does not guarantee, certifyor assure the safety or performance of any products, components or systems tested, designed, installed oroperated in accordance with AMCA International standards or that any tests conducted under its standards will benon-hazardous or free from risk.
Objections to AMCA Standards and Certifications Programs
Air Movement and Control Association International, Inc. will consider and decide all written complaints regardingits standards, certification programs, or interpretations thereof. For information on procedures for submitting andhandling complaints, write to:
Air Movement and Control Association International30 West University DriveArlington Heights, IL 60004-1893 U.S.A.
or
AMCA International, Incorporatedc/o Federation of Environmental Trade Associations2 Waltham Court, Milley Lane, Hare HatchReading, BerkshireRG10 9TH United Kingdom

Related AMCA Standards and Publications
Publication 200 AIR SYSTEMS
System Pressure Losses
Fan Performance Characteristics
System Effect
System Design Tolerances
Air Systems is intended to provide basic information needed to design effective and energy efficient air systems.
Discussion is limited to systems where there is a clear separation of the fan inlet and outlet and does not cover
applications in which fans are used only to circulate air in an open space.
Publication 201 FANS AND SYSTEMS
Fan Testing and Rating
The Fan "Laws"
Air Systems
Fan and System Interaction
System Effect Factors
Fans and Systems is aimed primarily at the designer of the air moving system and discusses the effect on inlet and
outlet connections of the fan's performance. System Effect Factors, which must be included in the basic design
calculations, are listed for various configurations. AMCA 202 and AMCA 203 are companion documents.
Publication 202 TROUBLESHOOTING
System Checklist
Fan Manufacturer's Analysis
Master Troubleshooting Appendices
Troubleshooting is intended to help identify and correct problems with the performance and operation of the air
moving system after installation. AMCA 201 and AMCA 203 are companion documents.
Publication 203 FIELD PERFORMANCE MEASUREMENTS OF FAN SYSTEMS
Acceptance Tests
Test Methods and Instruments
Precautions
Limitations and Expected Accuracies
Calculations
Field Performance Measurements of Fan Systems reviews the various problems of making field measurements
and calculating the actual performance of the fan and system. AMCA 201 and AMCA 202 are companion
documents.

TABLE OF CONTENTS
1. Introduction . . . . . . . . . . . . . . . . . . . . . . . . . . . . . . . . . . . . . . . . . . . . . . . . . . . . . . . . . . . . . . . . . . . .1
1.1 Purpose . . . . . . . . . . . . . . . . . . . . . . . . . . . . . . . . . . . . . . . . . . . . . . . . . . . . . . . . . . . . . . . . . . . .1
1.2 Some limitations . . . . . . . . . . . . . . . . . . . . . . . . . . . . . . . . . . . . . . . . . . . . . . . . . . . . . . . . . . . . . .1
2. Symbols and Subscripts . . . . . . . . . . . . . . . . . . . . . . . . . . . . . . . . . . . . . . . . . . . . . . . . . . . . . . . . . .1
2.1 Symbols and subscripted symbols . . . . . . . . . . . . . . . . . . . . . . . . . . . . . . . . . . . . . . . . . . . . . . . .1
2.2 Subscripts . . . . . . . . . . . . . . . . . . . . . . . . . . . . . . . . . . . . . . . . . . . . . . . . . . . . . . . . . . . . . . . . . . .1
3. Fan Testing . . . . . . . . . . . . . . . . . . . . . . . . . . . . . . . . . . . . . . . . . . . . . . . . . . . . . . . . . . . . . . . . . . . . .1
3.1 ANSI/AMCA Standard 210 . . . . . . . . . . . . . . . . . . . . . . . . . . . . . . . . . . . . . . . . . . . . . . . . . . . . . .1
3.2 Ducted outlet fan tests . . . . . . . . . . . . . . . . . . . . . . . . . . . . . . . . . . . . . . . . . . . . . . . . . . . . . . . . .3
3.3 Free inlet, free outlet fan tests . . . . . . . . . . . . . . . . . . . . . . . . . . . . . . . . . . . . . . . . . . . . . . . . . . .4
3.4 Obstructed inlets and outlets . . . . . . . . . . . . . . . . . . . . . . . . . . . . . . . . . . . . . . . . . . . . . . . . . . . .4
4. Fan Ratings . . . . . . . . . . . . . . . . . . . . . . . . . . . . . . . . . . . . . . . . . . . . . . . . . . . . . . . . . . . . . . . . . . . .4
4.1 The Fan Laws . . . . . . . . . . . . . . . . . . . . . . . . . . . . . . . . . . . . . . . . . . . . . . . . . . . . . . . . . . . . . . .4
4.2 Limitations . . . . . . . . . . . . . . . . . . . . . . . . . . . . . . . . . . . . . . . . . . . . . . . . . . . . . . . . . . . . . . . . . .4
4.3 Fan performance curves . . . . . . . . . . . . . . . . . . . . . . . . . . . . . . . . . . . . . . . . . . . . . . . . . . . . . . .9
5. Catalog Performance Tables . . . . . . . . . . . . . . . . . . . . . . . . . . . . . . . . . . . . . . . . . . . . . . . . . . . . . .13
5.1 Type A: Free inlet, free outlet fans . . . . . . . . . . . . . . . . . . . . . . . . . . . . . . . . . . . . . . . . . . . . . . .13
5.2 Ducted fans . . . . . . . . . . . . . . . . . . . . . . . . . . . . . . . . . . . . . . . . . . . . . . . . . . . . . . . . . . . . . . . .13
6. Air Systems . . . . . . . . . . . . . . . . . . . . . . . . . . . . . . . . . . . . . . . . . . . . . . . . . . . . . . . . . . . . . . . . . . .16
6.1 The system . . . . . . . . . . . . . . . . . . . . . . . . . . . . . . . . . . . . . . . . . . . . . . . . . . . . . . . . . . . . . . . . .16
6.2 Component losses . . . . . . . . . . . . . . . . . . . . . . . . . . . . . . . . . . . . . . . . . . . . . . . . . . . . . . . . . . .16
6.3 The system curve . . . . . . . . . . . . . . . . . . . . . . . . . . . . . . . . . . . . . . . . . . . . . . . . . . . . . . . . . . . .17
6.4 Interaction of system curve and fan performance curve . . . . . . . . . . . . . . . . . . . . . . . . . . . . . .18
6.5 Effect of changes in speed . . . . . . . . . . . . . . . . . . . . . . . . . . . . . . . . . . . . . . . . . . . . . . . . . . . . .18
6.6 Effect of density on system resistance . . . . . . . . . . . . . . . . . . . . . . . . . . . . . . . . . . . . . . . . . . . .19
6.7 Fan and system interaction . . . . . . . . . . . . . . . . . . . . . . . . . . . . . . . . . . . . . . . . . . . . . . . . . . . .21
6.8 Effects of errors in estimating system resistance . . . . . . . . . . . . . . . . . . . . . . . . . . . . . . . . . . . .21
6.9 Safety factors . . . . . . . . . . . . . . . . . . . . . . . . . . . . . . . . . . . . . . . . . . . . . . . . . . . . . . . . . . . . . . .22
6.10 Deficient fan/system performance . . . . . . . . . . . . . . . . . . . . . . . . . . . . . . . . . . . . . . . . . . . . . .23
6.11 Precautions to prevent deficient performance . . . . . . . . . . . . . . . . . . . . . . . . . . . . . . . . . . . . .23
6.12 System effect . . . . . . . . . . . . . . . . . . . . . . . . . . . . . . . . . . . . . . . . . . . . . . . . . . . . . . . . . . . . . .23
7. System Effect Factor (SEF) . . . . . . . . . . . . . . . . . . . . . . . . . . . . . . . . . . . . . . . . . . . . . . . . . . . . . . .24
7.1 System Effect Curves . . . . . . . . . . . . . . . . . . . . . . . . . . . . . . . . . . . . . . . . . . . . . . . . . . . . . . . . .24
7.2 Power determination . . . . . . . . . . . . . . . . . . . . . . . . . . . . . . . . . . . . . . . . . . . . . . . . . . . . . . . . .29
8. Outlet System Effect Factors . . . . . . . . . . . . . . . . . . . . . . . . . . . . . . . . . . . . . . . . . . . . . . . . . . . . .29
8.1 Outlet ducts . . . . . . . . . . . . . . . . . . . . . . . . . . . . . . . . . . . . . . . . . . . . . . . . . . . . . . . . . . . . . . . .29
8.2 Outlet diffusers . . . . . . . . . . . . . . . . . . . . . . . . . . . . . . . . . . . . . . . . . . . . . . . . . . . . . . . . . . . . . .30
8.3 Outlet duct elbows . . . . . . . . . . . . . . . . . . . . . . . . . . . . . . . . . . . . . . . . . . . . . . . . . . . . . . . . . . .31
8.4 Turning vanes . . . . . . . . . . . . . . . . . . . . . . . . . . . . . . . . . . . . . . . . . . . . . . . . . . . . . . . . . . . . . . .35
8.5 Volume control dampers . . . . . . . . . . . . . . . . . . . . . . . . . . . . . . . . . . . . . . . . . . . . . . . . . . . . . .35
8.6 Duct branches . . . . . . . . . . . . . . . . . . . . . . . . . . . . . . . . . . . . . . . . . . . . . . . . . . . . . . . . . . . . . .37
9. Inlet System Effect Factors . . . . . . . . . . . . . . . . . . . . . . . . . . . . . . . . . . . . . . . . . . . . . . . . . . . . . . .38
9.1 Inlet ducts . . . . . . . . . . . . . . . . . . . . . . . . . . . . . . . . . . . . . . . . . . . . . . . . . . . . . . . . . . . . . . . . . .38
9.2 Inlet duct elbows . . . . . . . . . . . . . . . . . . . . . . . . . . . . . . . . . . . . . . . . . . . . . . . . . . . . . . . . . . . .38
9.3 Inlet vortex (spin or swirl) . . . . . . . . . . . . . . . . . . . . . . . . . . . . . . . . . . . . . . . . . . . . . . . . . . . . . .40
9.4 Inlet turning vanes . . . . . . . . . . . . . . . . . . . . . . . . . . . . . . . . . . . . . . . . . . . . . . . . . . . . . . . . . . .44
9.5 Airflow straighteners . . . . . . . . . . . . . . . . . . . . . . . . . . . . . . . . . . . . . . . . . . . . . . . . . . . . . . . . . .44
9.6 Enclosures (plenum and cabinet effects) . . . . . . . . . . . . . . . . . . . . . . . . . . . . . . . . . . . . . . . . . .46
9.7 Obstructed inlets . . . . . . . . . . . . . . . . . . . . . . . . . . . . . . . . . . . . . . . . . . . . . . . . . . . . . . . . . . . .47
10. Effects of Factory Supplied Accessories . . . . . . . . . . . . . . . . . . . . . . . . . . . . . . . . . . . . . . . . . . .49
10.1 Bearing and supports in fan inlet . . . . . . . . . . . . . . . . . . . . . . . . . . . . . . . . . . . . . . . . . . . . . . .50
10.2 Drive guards obstructing fan inlet . . . . . . . . . . . . . . . . . . . . . . . . . . . . . . . . . . . . . . . . . . . . . . .50
10.3 Belt tube in axial fan inlet or outlet . . . . . . . . . . . . . . . . . . . . . . . . . . . . . . . . . . . . . . . . . . . . . .50
10.4 Inlet box . . . . . . . . . . . . . . . . . . . . . . . . . . . . . . . . . . . . . . . . . . . . . . . . . . . . . . . . . . . . . . . . . . .50
10.5 Inlet box dampers . . . . . . . . . . . . . . . . . . . . . . . . . . . . . . . . . . . . . . . . . . . . . . . . . . . . . . . . . . .50
10.6 Variable inlet vane (VIV) . . . . . . . . . . . . . . . . . . . . . . . . . . . . . . . . . . . . . . . . . . . . . . . . . . . . . .51

Annex A. SI / I-P Conversion Table (Informative) . . . . . . . . . . . . . . . . . . . . . . . . . . . . . . . . . . . . . . .52
Annex B. Dual Fan Systems - Series and Parallel . . . . . . . . . . . . . . . . . . . . . . . . . . . . . . . . . . . . . . .53
B.1 Fans operating in series . . . . . . . . . . . . . . . . . . . . . . . . . . . . . . . . . . . . . . . . . . . . . . . . . . . . . . .53
B.2 Fans operating in parallel . . . . . . . . . . . . . . . . . . . . . . . . . . . . . . . . . . . . . . . . . . . . . . . . . . . . . .53
Annex C. Definitions and Terminology . . . . . . . . . . . . . . . . . . . . . . . . . . . . . . . . . . . . . . . . . . . . . . . .55
C.1 The air . . . . . . . . . . . . . . . . . . . . . . . . . . . . . . . . . . . . . . . . . . . . . . . . . . . . . . . . . . . . . . . . . . . .55
C.2 The fan . . . . . . . . . . . . . . . . . . . . . . . . . . . . . . . . . . . . . . . . . . . . . . . . . . . . . . . . . . . . . . . . . . . .55
C.3 The system . . . . . . . . . . . . . . . . . . . . . . . . . . . . . . . . . . . . . . . . . . . . . . . . . . . . . . . . . . . . . . . . .58
Annex D. Examples of the Convertibility of Energy from Velocity
Pressure to Static Pressure . . . . . . . . . . . . . . . . . . . . . . . . . . . . . . . . . . . . . . . . . . . . . . . .62
D.1 Example of fan (tested with free inlet, ducted outlet) applied to a
duct system . . . . . . . . . . . . . . . . . . . . . . . . . . . . . . . . . . . . . . . . . . . . . . . . . . . . . . . . . . . . . . . .62
D.2 Example of fan (tested with free inlet, ducted outlet), connected to a
duct system and then a plenum . . . . . . . . . . . . . . . . . . . . . . . . . . . . . . . . . . . . . . . . . . . . . . . . .63
D.3 Example of fan with free inlet, free outlet - fan discharges directly
into plenum and then to duct system (abrupt expansion at fan outlet) . . . . . . . . . . . . . . . . . . .65
D.4 Example of fan used to exhaust with obstruction in inlet, inlet elbow,
inlet duct, free outlet . . . . . . . . . . . . . . . . . . . . . . . . . . . . . . . . . . . . . . . . . . . . . . . . . . . . . . . . . .66
Annex E. References . . . . . . . . . . . . . . . . . . . . . . . . . . . . . . . . . . . . . . . . . . . . . . . . . . . . . . . . . . . . . .69


AMCA INTERNATIONAL, INC. AMCA 201-02 (R2007)
Fans and Systems
1. Introduction
ANSI/AMCA 210 Laboratory Methods of Testing FansFor Aerodynamic Performance Rating, offers the
system design engineer guidance as to how the fan
was tested and rated. AMCA Publication 201 Fansand Systems, helps provide guidance as to what
effect the system and its connections to the fan have
on fan performance.
Recognizing and accounting for losses that affect the
fan’s performance, in the design stage, will allow the
designer to predict with reasonable accuracy, the
installed performance of the fan.
1.1 Purpose
This part of the AMCA Fan Application Manualincludes general information about how fans are
tested in the laboratory, and how their performance
ratings are calculated and published. It also reviews
some of the more important reasons for the "loss" of
fan performance that may occur when the fan is
installed in an actual system.
Allowances, called System Effect Factors (SEF), are
also given in this part of the manual. SEF must be
taken into account by the system design engineer if a
reasonable estimate of fan/system performance is to
be determined.
1.2 Some limitations
It must be appreciated that the System Effect Factorsgiven in this manual are intended as guidelines and
are, in general, approximations. Some have been
obtained from research studies, others have been
published previously by individual fan manufacturers,
and many represent the consensus of engineers with
considerable experience in the application of fans.
Fans of different types and even fans of the same
type, but supplied by different manufacturers, will not
necessarily react with the system in exactly the same
way. It will be necessary, therefore, to apply judgment
based on actual experience in applying the SEF.
The SEF represented in this manual assume that the
fan application is generally consistent with the
method of testing and rating by the manufacturer.
Inappropriate application of the fan will result in SEF
values inconsistent with the values presented.
Mechanical design of the fan is not within the scope
of this publication.
2. Symbols and Subscripts
For symbols and subscripted symbols, see Table 2.1.
For subscripts, see Table 2.2.
3. Fan Testing
Fans are tested in setups that simulate installations.
The four standard installation types are as shown in
Figure 3.1.
Figure 3.1 - Standard Fan Installation Types
3.1 ANSI/AMCA Standard 210
Most fan manufacturers rate the performance of their
products from tests made in accordance with
ANSI/AMCA 210 Laboratory Methods of Testing Fansfor Aerodynamic Performance Rating. The purpose
AMCA INSTALLATION TYPE A:Free Inlet, Free Outlet
AMCA INSTALLATION TYPE B:Free Inlet, Ducted Outlet
AMCA INSTALLATION TYPE C:Ducted Inlet, Free Outlet
AMCA INSTALLATION TYPE D:Ducted Inlet, Ducted Outlet
1

Table 2.1 - Symbols and Subscripted Symbols
UNITS OF MEASURE
SYMBOL DESCRIPTION SI I-P
A Area of cross section m2 ft2
D Diameter, impeller mm in.
D Diameter, Duct m ft
H Fan Power Input kw hp
H/T Hub-to-Tip Ratio Dimensionless
Kp Compressibility Coefficient Dimensionless
Cp Loss Coefficient Dimensionless
N Speed of Rotation rpm rpm
Ps Fan Static Pressure Pa in. wg
Pt Fan Total Pressure Pa in. wg
Pv Fan Velocity Pressure Pa in. wg
pb Corrected Barometric Pressure kPa in. Hg
PL Plane of Measurement --- ---
Q Airflow m3/s ft3/min
Re Fan Reynolds Number Dimensionless
SEF System Effect Factor Pa in. wg
td Dry-Bulb Temperature °C °F
tw Wet-Bulb Temperature °C °F
μ Air Viscosity Pa•s lbm/ft•s
V Velocity m/s fpm
W Power Input to Motor watts watts
ηs Fan Static Efficiency % %
ηt Fan Total Efficiency % %
ρ Air Density kg/m3 lbm/ft3
Table 2.2 - Subscripts
SUBSCRIPT DESCRIPTION
a Atmospheric conditions
c Converted Value
x Plane 0, 1, 2, ...as appropriate
1 Fan Inlet Plane
2 Fan Outlet Plane
3 Pitot Traverse Plane
5 Plane 5 (nozzle inlet station in chamber)
6 Plane 6 (nozzle discharge station in chamber)
8 Plane 8 (inlet chamber measurement station)
AMCA 201-02 (R2007)
2
TransitionPiece
Straightener
1 2
FOR FAN INSTALLATION TYPES:
B: Free Inlet, Ducted Outlet D: Ducted Inlet, Ducted Outlet
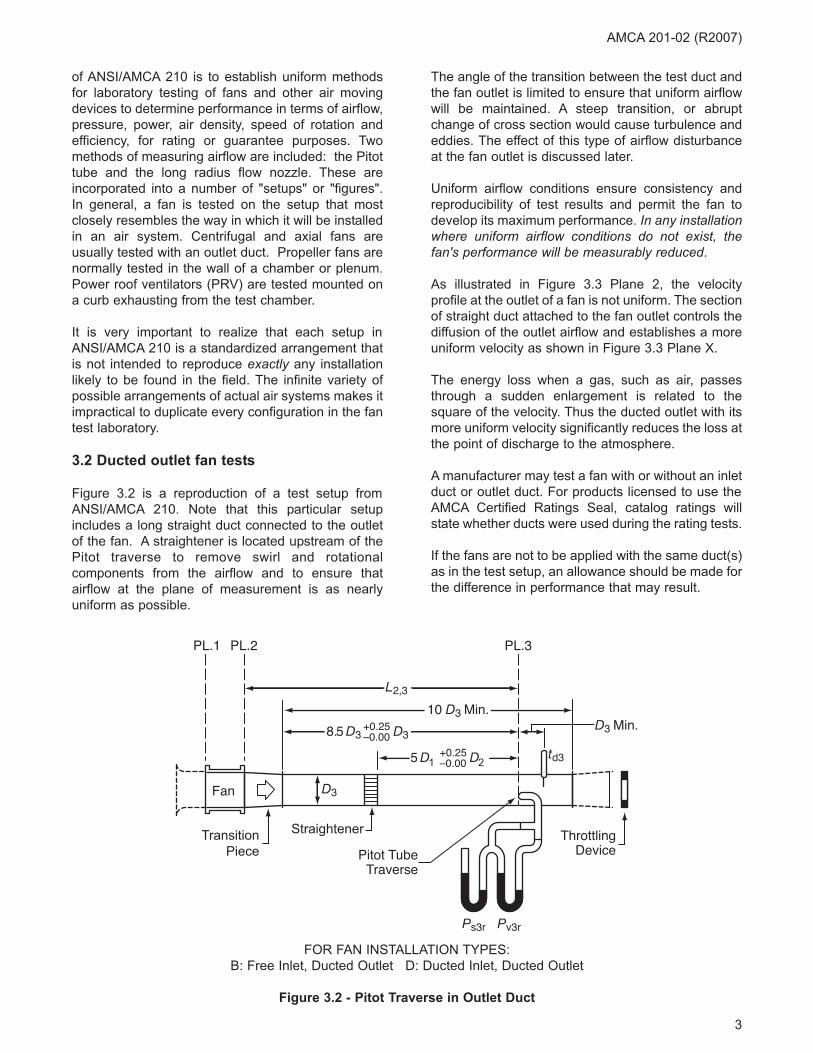
Figure 3.2 - Pitot Traverse in Outlet Duct
AMCA 201-02 (R2007)
of ANSI/AMCA 210 is to establish uniform methods
for laboratory testing of fans and other air moving
devices to determine performance in terms of airflow,
pressure, power, air density, speed of rotation and
efficiency, for rating or guarantee purposes. Two
methods of measuring airflow are included: the Pitot
tube and the long radius flow nozzle. These are
incorporated into a number of "setups" or "figures".
In general, a fan is tested on the setup that most
closely resembles the way in which it will be installed
in an air system. Centrifugal and axial fans are
usually tested with an outlet duct. Propeller fans are
normally tested in the wall of a chamber or plenum.
Power roof ventilators (PRV) are tested mounted on
a curb exhausting from the test chamber.
It is very important to realize that each setup in
ANSI/AMCA 210 is a standardized arrangement that
is not intended to reproduce exactly any installation
likely to be found in the field. The infinite variety of
possible arrangements of actual air systems makes it
impractical to duplicate every configuration in the fan
test laboratory.
3.2 Ducted outlet fan tests
Figure 3.2 is a reproduction of a test setup from
ANSI/AMCA 210. Note that this particular setup
includes a long straight duct connected to the outlet
of the fan. A straightener is located upstream of the
Pitot traverse to remove swirl and rotational
components from the airflow and to ensure that
airflow at the plane of measurement is as nearly
uniform as possible.
The angle of the transition between the test duct and
the fan outlet is limited to ensure that uniform airflow
will be maintained. A steep transition, or abrupt
change of cross section would cause turbulence and
eddies. The effect of this type of airflow disturbance
at the fan outlet is discussed later.
Uniform airflow conditions ensure consistency and
reproducibility of test results and permit the fan to
develop its maximum performance. In any installationwhere uniform airflow conditions do not exist, thefan's performance will be measurably reduced.
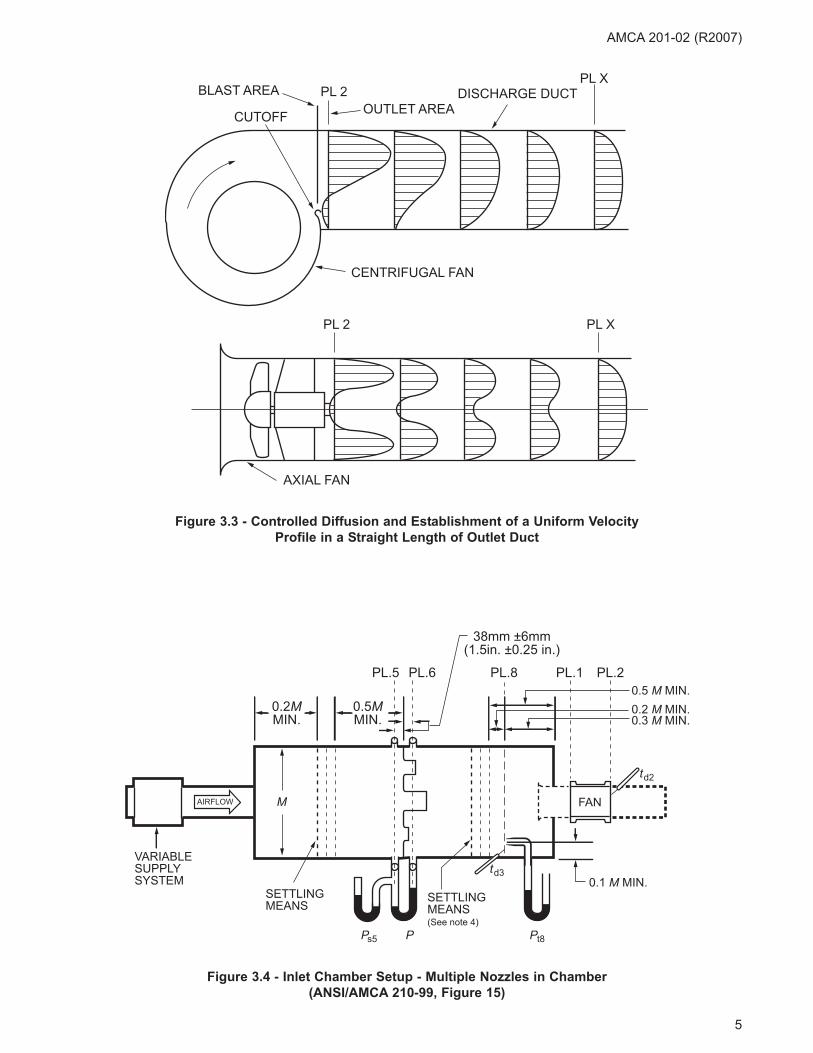
As illustrated in Figure 3.3 Plane 2, the velocity
profile at the outlet of a fan is not uniform. The section
of straight duct attached to the fan outlet controls the
diffusion of the outlet airflow and establishes a more
uniform velocity as shown in Figure 3.3 Plane X.
The energy loss when a gas, such as air, passes
through a sudden enlargement is related to the
square of the velocity. Thus the ducted outlet with its
more uniform velocity significantly reduces the loss at
the point of discharge to the atmosphere.
A manufacturer may test a fan with or without an inlet
duct or outlet duct. For products licensed to use the
AMCA Certified Ratings Seal, catalog ratings will
state whether ducts were used during the rating tests.
If the fans are not to be applied with the same duct(s)
as in the test setup, an allowance should be made for
the difference in performance that may result.
3
4
3.3 Free inlet, free outlet fan tests
Figure 3.4 illustrates a typical multi-nozzle chamber
test setup from ANSI/AMCA 210. This simulates the
conditions under which most exhaust fans are tested
and rated. Fan performance based on this type of
test may require adjustment when additional
accessories are used with the fan. Fans designed for
use without duct systems are usually rated over a
lower range of pressures. They are commonly
cataloged and sold as a complete unit with suitable
drive and motor.
3.4 Obstructed inlets and outlets
The test setups in ANSI/AMCA 210 result in
unobstructed airflow conditions at both the inlet and
the outlet of the fan. Appurtenances or obstructions
located close to the inlet and/or outlet will affect fan
performance. Shafts, bearings, bearing supports and
other appurtenances normally used with a fan should
be in place when a fan is tested for rating.
Variations in construction which may affect fan
performance include changes in sizes and types of
sheaves and pulleys, bearing supports, bearings and
shafts, belt guards, inlet and outlet dampers, inlet
vanes, inlet elbows, inlet and outlet cones, and
cabinets or housings.
Since changes in performance will be different for
various product designs, it will be necessary to make
suitable allowances based on data obtained from the
applicable fan catalog or directly from the
manufacturer.
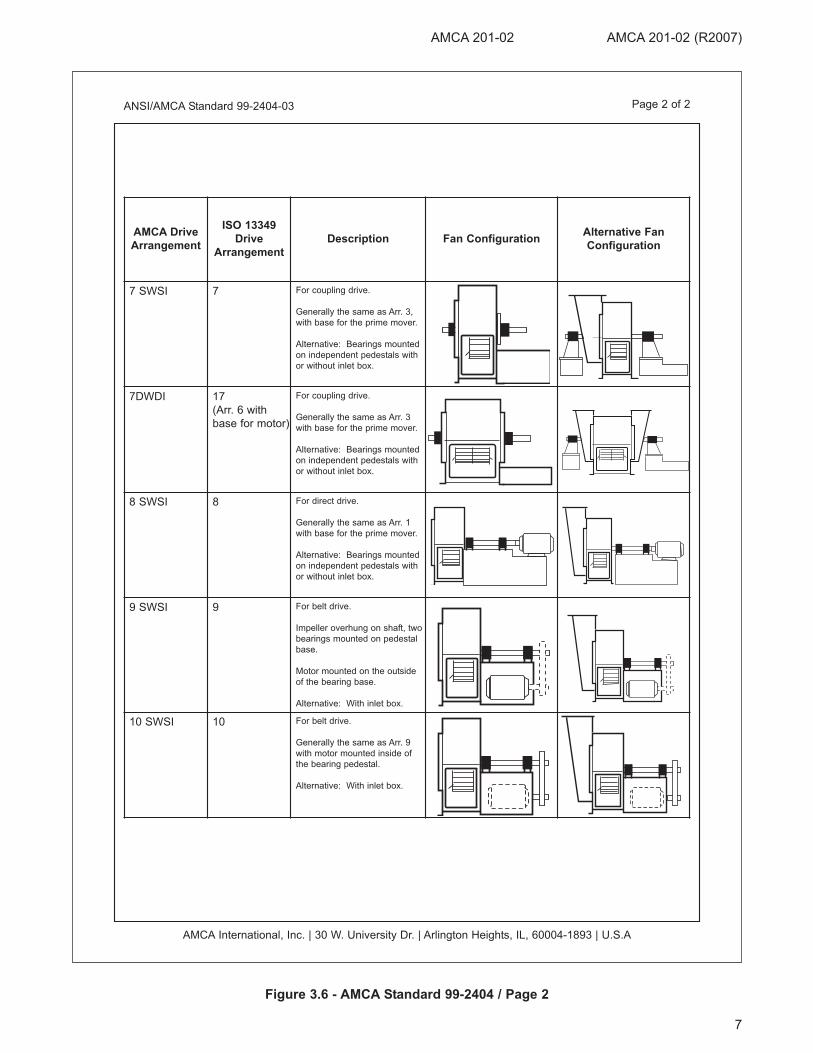
Most single width centrifugal fans are tested using
Arrangement 1 fans. Some allowance for the effect
of bearings and bearing supports in the inlet may be
necessary when using Arrangement 3 or
Arrangement 7. The various AMCA standard
arrangements are shown on Figures 3.5, 3.6, and
3.7.
4. Fan Ratings
4.1 The Fan Laws
It is not practical to test a fan at every speed at which
it may be applied. Nor is it possible to simulate every
inlet density that may be encountered. Fortunately,
by use of a series of equations commonly referred to
as the Fan Laws, it is possible to predict with good
accuracy the performance of a fan at other speeds
and densities than those of the original rating test.
The performance of a complete series of
geometrically similar (homologous) fans can also be
calculated from the performance of smaller fans in
the series using the appropriate equations.
Because of the relationship between the airflow,
pressure and power for any given fan, each set of
equations for changes in speed, size or density,
applies only to the same Point of Rating, and all the
equations in the set must be used to define the
converted condition. A Point of Rating is the specified
fan operating point on its characteristic curve.
The Fan Law equations are shown below as ratios.
The un-subscripted variable is used to designate the
initial or test fan values for the variable and the
subscript c is used to designate the converted,
dependent or desired variable.
Qc = Q × (Dc/D)3 × (Nc/N) × (Kp/Kpc)
Ptc = Pt × (Dc/D)2 × (Nc/N)2 × (ρc/ρ) × (Kp/Kpc)
Pvc = Pv × (Dc/D)2 × (Nc/N)2 × (ρc/ρ)
Psc = Ptc - Pvc
Hc = H × (Dc/D)5 × (Nc/N)3 × (ρc/ρ) × (Kp/Kpc)
ηtc = (Qc × Ptc × Kp) / Hc (SI)
ηtc = (Qc × Ptc × Kp) / (6362 • Hc) (I-P)
ηsc = ηtc × (Psc/Ptc)
These equations have their origin in the classical
theories of fluid mechanics, and the accuracy of the
results obtained is sufficient for most applications.
Better accuracy would require consideration of
Reynolds number, Mach number, kinematic viscosity,
dynamic viscosity, surface roughness, impeller blade
thickness and relative clearances, etc.
4.2 Limitations
Under certain conditions the properties of gases
change and there are, therefore, limitations to the use
of the Fan Laws. Accurate results will be obtained
when the following limitations are observed:
a. Fan Reynolds Number (Re). The term Reynolds
number is associated with the ratio of inertia to
viscous forces. When related to fans, investigations
of both axial and centrifugal fans show that
performance losses are more significant at low
Reynolds number ranges and are effectively
negligible above certain threshold Reynolds
numbers. In an effort to simplify the comparison of
the Reynolds numbers of two fans, the fan industry
AMCA 201-02 (R2007)
5
AMCA 201-02 (R2007)
PL 2PL X
PL 2 PL X
OUTLET AREA
BLAST AREA
CENTRIFUGAL FAN
AXIAL FAN
CUTOFF
DISCHARGE DUCT
PL.5 PL.6 PL.8 PL.1 PL.2
SETTLINGMEANS
VARIABLESUPPLYSYSTEM
SETTLINGMEANS(See note 4)
FAN
0.1 M MIN.
0.5 M MIN.
0.2 M MIN.0.3 M MIN.
P t8PP s5
M
0.2MMIN.
38mm ±6mm(1.5in. ±0.25 in.)
0.5MMIN.
td2
td3
AIRFLOW
Figure 3.3 - Controlled Diffusion and Establishment of a Uniform Velocity
Profile in a Straight Length of Outlet Duct
Figure 3.4 - Inlet Chamber Setup - Multiple Nozzles in Chamber
(ANSI/AMCA 210-99, Figure 15)

AMCA International, Inc. | 30 W. University Dr. | Arlington Heights, IL, 60004-1893 | U.S.A
ANSI/AMCA Standard 99-2404-03 Page 1 of 2
AMCA Drive
Arrangement
ISO 13349
Drive
Arrangement
Description Fan ConfigurationAlternative Fan
Configuration
1 SWSI 1 or
12 (Arr. 1 with
sub-base)
For belt or direct drive.
Impeller overhung on shaft, two
bearings mounted on pedestal
base.
Alternative: Bearings mounted
on independant pedestals, with
or without inlet box.
2 SWSI 2 For belt or direct drive.
Impeller overhung on shaft,
bearings mounted in bracket
supported by the fan casing.
Alternative: With inlet box.
3 SWSI 3 or
11 (Arr. 3 with
sub-base)
For belt or direct drive.
Impeller mounted on shaft
between bearings supported by
the fan casing.
Alternative: Bearings mounted
on independent pedestals, with
or without inlet box.
3 DWDI 6 or
18 (Arr. 6 with
sub-base)
For belt or direct drive.
Impeller mounted on shaft
between bearings supported by
the fan casing.
Alternative: Bearings mounted
on independent pedestals, with
or without inlet boxes.
4 SWSI 4 For direct drive.
Impeller overhung on motor
shaft. No bearings on fan.
Motor mounted on base.
Alternative: With inlet box.
5 SWSI 5 For direct drive.
Impeller overhung on motor
shaft. No bearings on fan.
Motor flange mounted to
casing.
Alternative: With inlet box.
Drive Arrangements for Centrifugal FansAn American National Standard - Approved by ANSI on April 17, 2003
Figure 3.5 - AMCA Standard 99-2404 / Page 1
AMCA 201-02 (R2007)
6
ANSI/AMCA Standard 99-2404-03 Page 2 of 2
AMCA International, Inc. | 30 W. University Dr. | Arlington Heights, IL, 60004-1893 | U.S.A
AMCA Drive
Arrangement
ISO 13349
Drive
Arrangement
Description Fan ConfigurationAlternative Fan
Configuration
7 SWSI 7 For coupling drive.
Generally the same as Arr. 3,
with base for the prime mover.
Alternative: Bearings mounted
on independent pedestals with
or without inlet box.
7DWDI 17
(Arr. 6 with
base for motor)
For coupling drive.
Generally the same as Arr. 3
with base for the prime mover.
Alternative: Bearings mounted
on independent pedestals with
or without inlet box.
8 SWSI 8 For direct drive.
Generally the same as Arr. 1
with base for the prime mover.
Alternative: Bearings mounted
on independent pedestals with
or without inlet box.
9 SWSI 9 For belt drive.
Impeller overhung on shaft, two
bearings mounted on pedestal
base.
Motor mounted on the outside
of the bearing base.
Alternative: With inlet box.
10 SWSI 10 For belt drive.
Generally the same as Arr. 9
with motor mounted inside of
the bearing pedestal.
Alternative: With inlet box.
Figure 3.6 - AMCA Standard 99-2404 / Page 2
AMCA 201-02 AMCA 201-02 (R2007)
7

AMCA International, Inc. | 30 W. University Dr. | Arlington Heights, IL, 60004-1893 | U.S.A
ANSI/AMCA Standard 99-3404-03 Page 1 of 1
Drive Arrangements for Axial FansAn American National Standard - Approved by ANSI on June 10, 2003
AMCA Drive
Arrangement
ISO 13349
Drive
Arrangement
Description Fan ConfigurationAlternative Fan
Configuration
1 1
12 (Arr. 1 with
sub-base)
For belt or direct drive.
Impeller overhung on shaft, two
bearings mounted either
upstream or downstream of the
impeller.
Alternative: Single stage or two
stage fans can be supplied with
inlet box and/or discharge
evasé.
3 3
11 (Arr. 3 with
sub-base)
For belt or direct drive.
Impeller mounted on shaft
between bearings on internal
supports.
Alternative: Fan can be
supplied with inlet box, and/or
discharge evasé.
4 4 For direct drive.
Impeller overhung on motor
shaft. No bearings on fan.
Motor mounted on base or
integrally mounted.
Alternative: With inlet box
and/or with discharge evasé.
M MM M
7 7 For direct drive.
Generally the same as Arr. 3
with base for the prime mover.
Alternative: With inlet box
and/or discharge evasé.
M M
8 8 For direct drive.
Generally the same as Arr. 1
with base for the prime mover.
Alternative: Single stage or two
stage fans can be supplied with
inlet box and/or discharge
evasé.
M M
9 9 For belt drive.
Generally same as Arr. 1 with
motor mounted on fan casing,
and/or an integral base.
Alternative: With inlet box
and/or discharge evasé
M
Note: All fan orientations may be horizontal or vertical
Figure 3.7 - AMCA Standard 99-3404 / Page 1
AMCA 201-02 (R2007)
8

AMCA 201-02 (R2007)
has adopted the term Fan Reynolds Number.
Re = (πND2ρ) / (60μ)
where: N = impeller rotational speed, rpm
D = impeller diameter, m(ft)
ρ = air density, kg/m3 (lbm/ft3)
μ = absolute viscosity,
1.8185 × 10⁻³ Pa•s (5°C to 38°C) (SI)
(1.22 × 10-05 lbm/ft•s (40°F to 100°F)) (I-P)
The threshold fan Reynolds number for centrifugal
and axial fans is about 3.0 × 10⁶. That is, there is a
negligible change in performance between the two
fans due to differences in Reynolds number if both
fans are operating above this threshold value. When
the Reynolds number of a model fan is below 3.0 ×
106, there may be a gain in efficiency (size effect) for
a full size fan operating above the threshold
compared to one operating below the threshold. This
occurs only when both fans are operating near peak
efficiency. Therefore, when a model test is being
conducted to verify the rating of a full size fan, the
Reynolds number should be above 3.0 ×10⁶ to avoid
any uncertainty relating to Reynolds number effects.
b. Point of Rating. To predict the performance of a
fan from a smaller model using the Fan Laws, both
fans must be geometrically similar (homologous),
and both fans must operate at the same
corresponding rating points on their characteristic
curves. Two or more fans are said to be operating at
corresponding “points of rating” if the positions of the
operating points, relative to the pressure at shutoff
and the airflow at free delivery, are the same.
c. Compressibility. Compressibility is the characteristic
of a gas to change its volume as a function of
pressure, temperature and composition. The
compressibility coefficient (Kp) expresses the ratio of
the fan total pressure developed with an
incompressible fluid to the fan total pressure
developed with a compressible fluid (See
ANSI/AMCA 210). Differences in the compressibility
coefficient between two similar fans must be
calculated using the proper specific heat ratio for the
gases being handled.
d. Specific Heat Ratio (Cp). Model fan tests are
usually based on air with a specific heat ratio of 1.4.
Induced draft fans may handle flue gas with a specific
heat ratio of 1.35. Even though these differences may
normally be considered small, they make a
noticeable difference in the calculation of the
compressibility coefficient. Refer to AMCA
Publication 802, Annex A, for calculation procedures.
e. Tip Speed Mach Parameter (Mt). Tip speed Mach
parameter is an expression relating the tip speed of
the impeller to the speed of sound at the fan inlet
condition.
When airflow velocity at a point approaches the
speed of sound, some blocking or choking effects
occur that reduce the fan performance.
4.3 Fan performance curves
A fan performance curve is a graphic presentation of
the performance of a fan. Usually it covers the entire
range from free delivery (no obstruction to airflow) to
no delivery (an air tight system with no air flowing).
One, or more, of the following characteristics may be
plotted against volume airflow (Q).
Fan Static Pressure Ps
Fan Total Pressure Pt
Fan Power HFan Static Efficiency ηs
Fan Total Efficiency ηt
Air density (ρ), fan size (D), and fan rotational speed
(N) are usually constant for the entire curve and must
be stated.
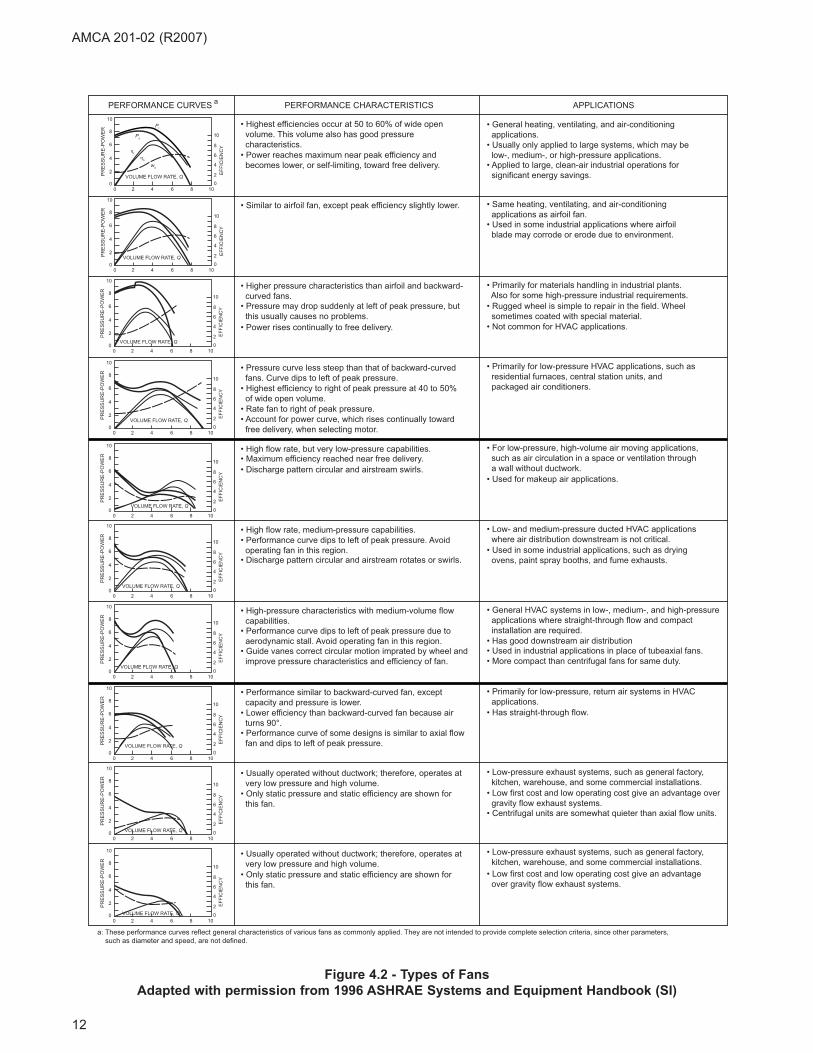
A typical fan performance curve is shown in Figure
4.1. Figure 4.2 illustrates examples of performance
curves for a variety of fan types.
9

SIZE 30 FAN AT N RPM
OPERATION ATSTANDARD DENSITY
PR
ES
SU
RE
, P
PO
WE
R, H
0
10
20
30
40
50
60
70
80
90
100
AIRFLOW, Q
Pt
Ps
η t
η s
H EF
FIC
IEN
CY, η
PE
RC
EN
T
Figure 4.1 - Fan Performance Curve at N RPM
AMCA 201-02 (R2007)
10

AMCA 201-02 (R2007)
11
TYPE IMPELLER DESIGN HOUSING DESIGN
AIR
FOIL
BA
CK
WA
RD
-IN
CLI
NE
DB
AC
KW
AR
D-
CU
RV
ED
RA
DIA
LFO
RW
AR
D-
CU
RV
ED
PR
OP
ELL
ER
TUB
EA
XIA
L
AX
IAL
FAN
S
VAN
EA
XIA
L
CE
NTR
IFU
GA
L FA
NS
TUB
ULA
R
CE
NTR
IFU
GA
L
SP
EC
IAL
DE
SIG
NS
PO
WE
R R
OO
F V
EN
TILA
TOR
S
AX
IAL
CE
NTR
IFU
GA
L• Highest efficiency of all centrifugal fan designs.• Ten to 16 blades of airfoil contour curved away from direction of rotation. Deep blades allow for efficient expansion within blade passages• Air leaves impeller at velocity less than tip speed.• For given duty, has highest speed of centrifugal fan designs
• Scroll-type design for efficient conversion of velocity pressure to static pressure.• Maximum efficiency requires close clearance and alignment between wheel and inlet
• Uses same housing configuration as airfoil design.• Efficiency only slightly less than airfoil fan.• Ten to 16 single-thickness blades curved or inclined away from direction of rotation• Efficient for same reasons as airfoil fan.
• Scroll. Usually narrowest of all centrifugal designs.• Because wheel design is less efficient, housing dimensions are not as critical as for airfoil and backward-inclined fans.
• Higher pressure characteristics than airfoil, backward-curved, and backward-inclined fans.• Curve may have a break to left of peak pressure and fan should not be operated in this area.• Power rises continually to free delivery.
• Flatter pressure curve and lower efficiency than the airfoil, backward-curved, and backward-inclined.• Do not rate fan in the pressure curve dip to the left of peak pressure.• Power rises continually toward free delivery. Motor selection must take this into account.
• Scroll similar to and often identical to other centrifugal fan designs.• Fit between wheel and inlet not as critical as for airfoil and backward-inclined fans.
• Simple circular ring, orifice plate, or venturi.• Optimum design is close to blade tips and forms smooth airfoil into wheel.
• Cylindrical tube with close clearance to blade tips.
• Cylindrical tube with close clearance to blade tips.• Guide vanes upstream or downstream from impeller increase pressure capability and efficiency.
• Cylindrical tube similar to vaneaxial fan, except clearance to wheel is not as close.• Air discharges radially from wheel and turns 90° to flow through guide vanes.
• Normal housing not used, since air discharges from impeller in full circle.• Usually does not include configuration to recover velocity pressure component.
• Essentially a propeller fan mounted in a supporting structure• Hood protects fan from weather and acts as safety guard.• Air discharges from annular space at bottom of weather hood.
• Low efficiency.• Limited to low-pressure applications.• Usually low cost impellers have two or more blades of single thickness attached to relatively small hub.• Primary energy transfer by velocity pressure.
• Somewhat more efficient and capable of developing more useful static pressure than propeller fan.• Usually has 4 to 8 blades with airfoil or single- thickness cross section.• Hub usually less than transfer by velocity pressure.
• Good blade design gives medium- to high-pressure capability at good efficiency.• Most efficient of these fans have airfoil blades.• Blades may have fixed, adjustable, or controllable pitch.• Hub is usually greater than half fan tip diameter.
• Performance similar to backward-curved fan except capacity and pressure are lower.• Lower efficiency than backward-curved fan.• Performance curve may have a dip to the left of peak pressure.
• Low-pressure exhaust systems such as general factory, kitchen, warehouse, and some commercial installations.• Provides positive exhaust ventilation, which is an advantage over gravity-type exhaust units.• Centrifugal units are slightly quieter than axial units.
• Low-pressure exhaust systems such as general factory, kitchen, warehouse, and some commercial installations.• Provides positive exhaust ventilation, which is an advantage over gravity-type exhaust units.
R
M
A
B
R
M
Figure 4.2 - Types of Fans
Adapted with permission from 1996 ASHRAE Systems and Equipment Handbook (SI)
12
AMCA 201-02 (R2007)
Figure 4.2 - Types of Fans
Adapted with permission from 1996 ASHRAE Systems and Equipment Handbook (SI)
PERFORMANCE CHARACTERISTICS APPLICATIONSPERFORMANCE CURVES a
• Similar to airfoil fan, except peak efficiency slightly lower.
• Higher pressure characteristics than airfoil and backward- curved fans.• Pressure may drop suddenly at left of peak pressure, but this usually causes no problems.• Power rises continually to free delivery.
• Pressure curve less steep than that of backward-curved fans. Curve dips to left of peak pressure.• Highest efficiency to right of peak pressure at 40 to 50% of wide open volume.• Rate fan to right of peak pressure.• Account for power curve, which rises continually toward free delivery, when selecting motor.
• High flow rate, but very low-pressure capabilities.• Maximum efficiency reached near free delivery.• Discharge pattern circular and airstream swirls.
• High flow rate, medium-pressure capabilities.• Performance curve dips to left of peak pressure. Avoid operating fan in this region.• Discharge pattern circular and airstream rotates or swirls.
• High-pressure characteristics with medium-volume flow capabilities.• Performance curve dips to left of peak pressure due to aerodynamic stall. Avoid operating fan in this region.• Guide vanes correct circular motion imprated by wheel and improve pressure characteristics and efficiency of fan.
• Usually operated without ductwork; therefore, operates at very low pressure and high volume.• Only static pressure and static efficiency are shown for this fan.
• Usually operated without ductwork; therefore, operates at very low pressure and high volume.• Only static pressure and static efficiency are shown for this fan.
• Low-pressure exhaust systems, such as general factory, kitchen, warehouse, and some commercial installations.• Low first cost and low operating cost give an advantage over gravity flow exhaust systems.
• Has straight-through flow.
• Primarily for low-pressure, return air systems in HVAC applications.
• General HVAC systems in low-, medium-, and high-pressure applications where straight-through flow and compact installation are required.• Has good downstream air distribution• Used in industrial applications in place of tubeaxial fans.• More compact than centrifugal fans for same duty.
• Low-pressure exhaust systems, such as general factory, kitchen, warehouse, and some commercial installations.• Low first cost and low operating cost give an advantage over gravity flow exhaust systems.• Centrifugal units are somewhat quieter than axial flow units.
• Low- and medium-pressure ducted HVAC applications where air distribution downstream is not critical.• Used in some industrial applications, such as drying ovens, paint spray booths, and fume exhausts.
• For low-pressure, high-volume air moving applications, such as air circulation in a space or ventilation through a wall without ductwork.• Used for makeup air applications.
• Primarily for low-pressure HVAC applications, such as residential furnaces, central station units, and packaged air conditioners.
• Primarily for materials handling in industrial plants. Also for some high-pressure industrial requirements.• Rugged wheel is simple to repair in the field. Wheel sometimes coated with special material.• Not common for HVAC applications.
• Same heating, ventilating, and air-conditioning applications as airfoil fan.• Used in some industrial applications where airfoil blade may corrode or erode due to environment.
• General heating, ventilating, and air-conditioning applications.
• Highest efficiencies occur at 50 to 60% of wide open volume. This volume also has good pressure characteristics.• Power reaches maximum near peak efficiency and becomes lower, or self-limiting, toward free delivery.
• Performance similar to backward-curved fan, except capacity and pressure is lower.• Lower efficiency than backward-curved fan because air turns 90°.• Performance curve of some designs is similar to axial flow fan and dips to left of peak pressure.
PR
ES
SU
RE
-PO
WE
R
EFF
ICIE
NC
Y
VOLUME FLOW RATE, Q
10
108
8
6
4
2
0
6
4
2
00 2 4 6 8 10
PR
ES
SU
RE
-PO
WE
R
EFF
ICIE
NC
Y
VOLUME FLOW RATE, Q
10
108
8
6
4
2
0
6
4
2
00 2 4 6 8 10
PR
ES
SU
RE
-PO
WE
R
EFF
ICIE
NC
Y
VOLUME FLOW RATE, Q
10
108
8
6
4
2
0
6
4
2
00 2 4 6 8 10
PR
ES
SU
RE
-PO
WE
R
EFF
ICIE
NC
Y
VOLUME FLOW RATE, Q
10
108
8
6
4
2
0
6
4
2
00 2 4 6 8 10
PR
ES
SU
RE
-PO
WE
R
EFF
ICIE
NC
Y
VOLUME FLOW RATE, Q
10
108
8
6
4
2
0
6
4
2
00 2 4 6 8 10
PR
ES
SU
RE
-PO
WE
R
EFF
ICIE
NC
Y
VOLUME FLOW RATE, Q
10
108
8
6
4
2
0
6
4
2
00 2 4 6 8 10
PR
ES
SU
RE
-PO
WE
R
EFF
ICIE
NC
Y
VOLUME FLOW RATE, Q
10
108
8
6
4
2
0
6
4
2
00 2 4 6 8 10
PR
ES
SU
RE
-PO
WE
R
EFF
ICIE
NC
Y
VOLUME FLOW RATE, Q
10
108
8
6
4
2
0
6
4
2
00 2 4 6 8 10
PR
ES
SU
RE
-PO
WE
R
EFF
ICIE
NC
Y
VOLUME FLOW RATE, Q
10
108
8
6
4
2
0
6
4
2
00 2 4 6 8 10
PR
ES
SU
RE
-PO
WE
R
EFF
ICIE
NC
Y
VOLUME FLOW RATE, Q
10
108
8
6
4
2
0
6
4
2
00 2 4 6 8 10
Ps
Pt
ηt
ηs
wo
• Usually only applied to large systems, which may be low-, medium-, or high-pressure applications.• Applied to large, clean-air industrial operations for significant energy savings.
a: These performance curves reflect general characteristics of various fans as commonly applied. They are not intended to provide complete selection criteria, since other parameters, such as diameter and speed, are not defined.

13
AMCA 201-02 (R2007)
5. Catalog Performance Tables
5.1 Type A: Free inlet, free outlet fans
Fans designed for use other than with duct systems
are usually rated over a lower range of pressures.
They are commonly cataloged and sold as a
complete unit with suitable drive and motor.
Typical fans in this group are propeller fans and
power roof ventilators. They are usually available in
direct or belt-drive arrangements and performance
ratings are published in a modified form of the multi-
rating table. Figure 5.1 illustrates such a table for part
of a line of belt-drive propeller fans.
5.2 Ducted fans
There are three types of ducted fans, as described in
Section 3:
1) Type B: Free inlet, ducted outlet
2) Type C: Ducted inlet, free outlet
3) Type D: Ducted inlet, ducted outlet
The performance of fans intended for use with duct
systems is usually published in the form of a "multi-
rating" table. A typical multi-rating table, as illustrated
in Figure 5.2 shows:
a) the speed (N) in rpm
b) the power (H) in kw (hp)
c) the fan static pressure (Ps) in Pa (in. wg)
d) the outlet velocity (V) in m/s, (fpm)
e) the airflow (Q) in m3/s (cfm)
Figure 5.3 shows constant speed characteristic
curves superimposed on a section of the multi-rating
table for the same fan. A brief study of this figure will
assist in understanding the relationship between
curves and the multi-rating tables.
Figure 5.1 - Propeller Fan Performance Table
SIZE
(cm)
No. of
Blades
Motor
kWrpm
Peak
kW
AIRFLOW (m3/s) @ STATIC PRESSURE (Pa)
0 31 62 93 124 155 186 217 248
61 3
0.19 862 0.13 2.02 1.58 0.58
0.19 960 0.20 2.25 1.87 0.97
0.25 1071 0.27 2.51 2.18 1.76 0.76
0.37 1220 0.40 2.86 2.57 2.24 1.70 0.81
69 3
0.19 806 0.20 2.89 2.36 1.05
0.25 883 0.27 3.17 2.68 1.94 0.76
0.37 1035 0.43 3.71 3.30 2.85 1.56 0.95
0.56 1165 0.62 4.18 3.83 3.44 3.01 1.60 1.10
84 3
0.37 825 0.42 4.36 3.76 3.04 1.27
0.56 945 0.62 4.99 4.48 3.92 2.38 1.42
0.75 1045 0.82 5.23 5.08 4.57 4.01 2.31 1.52
1.12 1190 1.19 6.29 5.90 5.47 5.01 4.48 2.79 1.94
1.49 1306 1.64 6.91 6.53 6.15 5.75 5.32 4.81 3.05 2.24 1.84
SIZE
(in.)
No. of
Blades
Motor
hprpm
Peak
bhp
AIRFLOW (ft3/min) @ STATIC PRESSURE (in. wg)
0 1/8 1/4 3/8 1/2 5/8 3/4 7/8 1
24 3
1/4 862 0.18 4,283 3,350 1,230
1/4 960 0.27 4,770 3,960 2,050
1/3 1071 0.36 5,321 4,620 3,730 1,600
1/2 1220 0.54 6,062 5,450 4,750 3,600 1,710
27 3
1/4 806 0.27 6,123 4,990 2,230
1/3 883 0.36 6,708 5,675 4,100 1,620
1/2 1035 0.57 7,862 7,000 6,035 3,315 2,020
3/4 1165 0.83 8,850 8,110 7,290 6,385 3,400 2,330
33 3
1/2 825 0.56 9,240 7,970 6,430 2,700
3/4 945 0.83 10,580 9,500 8,300 5,040 3,010
1 1045 1.1 11,710 10,755 9,685 8,490 4,890 3,215
1½ 1190 1.6 13,335 12,490 11,580 10,610 9,500 5,905 4,100
2 1306 2.2 14,630 13,845 13,030 12,185 11,280 10,200 6,470 4,740 3,900
TYPICAL RATING TABLE FOR A SERIES OF BELT-DRIVEN PROPELLER FANS
TYPICAL RATING TABLE FOR A SERIES OF BELT-DRIVEN PROPELLER FANS

Volume
CFM
Outlet
Vel.
(fpm)
1/4 in. wg 3/8 in. wg 1/2 in. wg 5/8 in. wg 3/4 in. wg 7/8 in. wg 1 in. wg 1-1/4 in. wg 1-1/2 in. wg
rpm bhp rpm bhp rpm bhp rpm bhp rpm bhp rpm bhp rpm bhp rpm bhp rpm bhp
3825
4590
5355
6120
6885
500
600
700
800
900
222
236
253
272
292
0.185
0.233
0.292
0.365
0.450
270
284
300
317
0.334
0.400
0.483
0.579
313
327
343
0.519
0.608
0.716
352
366
0.743
0.856 389 1.01 411 1.17
7650
8415
9180
9945
10710
1000
1100
1200
1300
1400
314
338
361
385
409
0.560
0.682
0.826
0.989
1.175
337
358
379
402
425
0.695
0.832
0.988
1.163
1.360
360
378
398
419
441
0.840
0.981
1.149
1.340
1.553
383
399
417
437
457
0.992
1.144
1.314
1.514
1.741
403
419
436
454
473
1.15
1.31
1.49
1.69
1.93
424
438
455
472
489
1.31
1.48
1.68
1.89
2.12
443
458
472
489
506
1.48
1.60
1.86
2.09
2.34
494
507
522
538
2.04
2.25
2.49
2.76
540
554
568
2.67
2.92
3.20
11475
12240
13005
13770
14535
1500
1600
1700
1800
1900
434
458
483
508
1.387
1.626
1.895
2.191
449
473
498
522
547
1.587
1.837
2.115
2.424
2.767
464
488
511
535
559
1.780
2.048
2.346
2.665
3.017
479
501
525
538
571
1.993
2.269
2.570
2.901
3.275
494
515
537
560
584
2.19
2.49
2.80
3.15
3.52
509
529
550
572
595
2.40
2.70
3.03
3.40
3.78
524
543
564
585
606
2.61
2.92
3.26
3.64
4.04
555
572
590
610
630
3.06
3.39
3.73
4.12
4.55
584
600
617
635
654
3.52
3.87
4.24
4.63
5.07
15300
16830
18360
19890
21420
2000
2200
2400
2600
2800
571
621
3.144
4.003
585
633
682
3.403
4.289
5.335
595
644
693
742
791
3.672
4.577
5.632
6.885
8.308
607
654
703
752
801
3.93
4.87
5.96
7.22
8.67
618
665
712
761
810
4.21
5.16
6.28
7.56
9.03
629
675
721
769
818
4.48
5.46
6.61
7.91
9.40
651
695
741
788
834
5.02
6.06
7.24
8.60
10.15
674
715
759
805
852
5.56
6.65
7.90
9.30
10.88
22950
24480
26010
27540
29070
30600
3000
3200
3400
3600
3800
4000
850 10.32 859
908
10.71
12.50
867
916
965
1015
11.09
13.01
15.16
17.52
883
932
981
1030
1072
1129
11.89
13.84
16.03
18.47
21.16
24.11
898
946
995
1044
1093
1142
12.70
14.70
16.92
19.39
22.13
25.16
IMPELLER DIAMETER: 36.5 IN OUTLET AREA: 7.65 SQ FT
TIP SPEED IN FPM: 9.56 × RPM MAXIMUM BHP: 18.3 × (RPM/1000)3
TYPICAL MULTISPEED RATING TABLE FOR A SINGLE WIDTH, SINGLE INLET CENTRIFUGAL FAN
Figure 5.2 - Centrifugal Fan Performance Tables
IMPELLER DIAMETER: 927 mm OUTLET AREA: .71 SQ METERS
TIP SPEED IN m/s: .0485 × RPM MAXIMUM kW: 13.65 × (RPM/1000)3
Volume
m3/s
Outlet
Vel.
(m/s)
62 Pa 93 Pa 124 Pa 155 Pa 186 Pa 217 Pa 246 Pa 310 Pa 373 Pa
rpm kW rpm kW rpm kW rpm kW rpm kW rpm kW rpm kW rpm kW rpm kW
1.81
2.17
2.53
2.89
3.25
2.55
3.06
3.56
4.07
4.58
222
236
253
272
292
0.14
0.17
0.22
0.27
0.34
270
284
300
317
0.25
0.30
0.36
0.43
313
327
343
0.39
0.45
0.53
352
366
0.55
0.64 389 0.75 411 0.87
3.61
3.97
4.33
4.69
5.06
5.08
5.59
6.10
6.61
7.13
314
338
361
385
409
0.42
0.51
0.62
0.74
0.88
337
358
379
402
426
0.52
0.62
0.74
0.87
1.01
360
378
398
419
441
0.63
0.73
0.86
1.00
1.16
382
399
417
437
457
0.74
0.85
0.98
1.13
1.30
403
419
436
454
473
0.86
0.98
1.11
1.26
1.44
424
438
455
472
489
0.98
1.10
1.25
1.41
1.58
443
458
472
489
506
1.10
1.19
1.39
1.56
1.74
494
507
522
538
1.52
1.68
1.86
2.06
540
554
568
1.99
2.18
2.39
5.42
5.78
6.14
6.50
6.86
7.63
8.14
8.65
9.15
9.66
434
458
483
508
1.03
1.21
1.41
1.63
449
473
498
522
547
1.18
1.37
1.58
1.81
2.06
464
488
511
535
559
1.33
1.53
1.75
1.99
2.25
479
501
525
538
571
1.49
1.69
1.92
2.16
2.44
494
515
537
560
584
1.63
1.86
2.09
2.35
2.62
509
529
550
572
595
1.79
2.01
2.26
2.54
2.82
524
543
564
585
606
1.95
2.18
2.43
2.71
3.01
555
572
590
610
630
2.28
2.53
2.78
3.07
3.39
584
600
617
635
654
2.62
2.89
3.16
3.45
3.78
7.22
7.94
8.67
9.39
10.11
10.17
11.18
12.21
13.23
14.24
571
621
2.34
2.99
585
633
682
2.54
3.20
3.98
595
644
693
742
791
2.74
3.41
4.20
5.13
6.20
607
654
703
752
801
2.93
3.63
4.44
5.38
6.47
616
665
712
761
810
3.14
3.85
4.68
5.64
6.73
629
675
721
769
818
3.34
4.07
4.93
5.90
7.01
651
695
741
788
834
3.74
4.52
5.40
6.41
7.57
674
715
759
805
852
4.15
4.96
5.89
6.94
8.11
10.83
11.55
12.28
13.00
13.72
14.44
15.25
16.27
17.30
18.31
19.32
20.34
850 7.70 859
908
7.99
9.40
867
916
965
1015
8.27
9.70
11.30
13.06
883
932
981
1030
1072
1129
8.87
10.32
11.95
13.77
15.78
17.98
898
946
995
1044
1093
1142
9.47
10.96
12.62
14.46
16.50
18.76
TYPICAL MULTISPEED RATING TABLE FOR A SINGLE WIDTH, SINGLE INLET CENTRIFUGAL FAN
AMCA 201-02 (R2007)
14

222
236
253
272
292
.185
.233
.292
.365
.450
270
284
300
317
.334
.400
.483
.579
313
327
343
.51
9.6
08
.71
6352
366
.743
.856
389
1.0
1411
1.1
7
314
338
361
335
409
.560
.682
.826
.988
1.1
75
337
358
379
482
426
.695
.822
.988
1.1
63
1.3
60
360
378
398
419
441
.84
0.9
81
1.1
49
1.3
40
1.5
53
332
399
417
437
457
.992
1.1
44
1.3
14
1.5
14
1.7
41
403
419
436
454
473
1.1
51.3
11.4
91.6
91.9
3
424
438
455
472
489
1.3
11.4
81.5
81.8
92.1
2
443
458
472
489
506
1.4
81.6
01.8
62.0
92.3
4
494
507
522
538
2.0
42.2
52.4
92.7
6
540
554
568
2.6
72.9
23.2
8584
598
3.3
73.6
6
434
456
482
508
1.3
87
1.6
26
2.1
9
449
473
493
522
547
1.5
87
1.8
37
2.1
15
2.4
24
2.7
67
464
488
511
535
559
1.7
82.0
48
2.3
46
2.6
65
3.0
17
479
501
525
538
571
1.9
95
2.2
69
2.5
70
2.9
01
3.2
76
494
515
537
560
584
2.1
92.4
92.8
03.1
53.5
2
509
529
550
572
595
2.4
02.7
03.0
33.4
0
524
543
564
585
606
2.6
12.9
23.2
63.8
44.0
4
555
572
590
610
630
3.0
63.4
93.7
34.1
24.5
5
584
600
617
635
654
3.5
23.8
74.2
44.6
35.0
7
612
627
643
661
678
3.9
94.3
64.7
65.1
85.6
3
571
629
3.7
44
4.0
03
584
633
682
3.4
03
4.2
89
5.3
35
596
644
693
742
791
4.5
77
5.6
32
6.8
85
8.3
08
607
654
703
752
801
3.9
34.8
75.7
67.2
28.6
7
618
665
712
761
810
4.2
15.1
66.2
87.5
69.0
3
629
675
721
769
818
4.4
85.4
66.8
17.9
18.4
8
651
695
741
788
834
5.0
26.0
67.2
48.6
010.1
5
674
715
759
852
5.5
66.6
57.9
09.3
010.8
8
696
736
778
822
867
6.1
17.2
4
10.0
211
.65
850
10.3
2859
908
10.7
112.6
0867
916
965
10
15
11.0
913.0
115.1
617.5
2
883
932
981
1030
1079
1129
11.8
913.8
416.0
318.4
721.1
624.1
1
898
946
995
1044
1093
1142
12.7
014.7
016.9
219.3
922.1
325.1
6
914
960
10
09
1057
1106
1155
13.4
815.5
617.8
320.3
523.1
226.1
8
RECOMMENDEDSELECTION RANGE810 RPM585 RPM
490 RPM
390 RPM
PR
ES
SU
RE
IN IN
. WG
BR
AK
E H
OR
SE
PO
WE
R
VO
LUM
EC
FMO
UTL
ET
VE
LOC
ITY
500
600
700
800
900
1000
1100
1200
1300
1400
1500
1600
1700
1800
1900
2000
2200
2400
2600
2800
3000
3200
3400
3600
3800
4000
3825
4590
5355
6120
6885
7650
8415
9180
9945
1071
0
1147
512
240
1300
513
770
1453
5
1530
016
830
1836
019
890
2142
0
2295
024
480
2601
027
540
2907
030
600
CFM
1/4”
SP
3/8”
SP
1/2”
SP
5/8”
SP
3/4”
SP
7/8”
SP
1” S
P1-
1/4”
SP
1-1/
2” S
P1-
3/4”
SP
RP
MB
HP
RP
MB
HP
RP
MB
HP
RP
MB
HP
RP
MB
HP
RP
MB
HP
RP
MB
HP
RP
MB
HP
RP
MB
HP
RP
MB
HP
AMCA 201-02 (R2007)
15
Figure 5.3 - Typical Fan Performance Table Showing Relationship to a Family
of Constant Speed Performance Curves

Most performance tables do not cover the complete
range from no delivery to free delivery but cover only
the typical operating range. Figure 5.4 illustrates the
recommended performance range of a centrifugal
fan. Comparison of Figure 5.4 with Figure 5.3 will
show that the published performance table also
covers only the recommended performance range of
the fan.
It should be remembered that fans are generally
tested without obstructions in the inlet and outlet and
without any optional airstream accessories in place.
Catalog ratings will, therefore, usually apply only to
the bare fan with unobstructed inlet and outlet.
Fan performance adjustment factors for airstream
accessories are normally available from either the fan
catalog or the fan manufacturer.
Fans are usually tested in arrangement 1, or similar
(see Figure 3.5). Rating tables will, therefore, also
apply only to the tested arrangement. Allowances for
the effect of bearing supports used in other
arrangements should be obtained from the
manufacturer if not shown in the catalog.
6. Air Systems
6.1 The system
An air system may consist simply of a fan with
ducting connected to either the inlet or outlet or to
both. A more complicated system may include a fan,
ductwork, air control dampers, cooling coils, heating
coils, filters, diffusers, sound attenuation, turning
vanes, etc. See AMCA Publication 200 Air Systems,
for more information.
6.2 Component losses
Every system has a combined resistance to airflow
that is usually different from every other system and
is dependent upon the individual components in the
system.
The determination of the "pressure loss" or
"resistance to airflow," for the individual components
can be obtained from the component manufacturers.
The determination of pressure losses for ductwork
design is well documented in standard handbooks
such as the ASHRAE Handbook of Fundamentals.
AIRFLOW
PR
ES
SU
RE
SELECTION NOT USUALLY
RECOMMENDED IN THIS RANGE
SELECTION
NOT USUALLY
RECOMMENDED
IN THIS RANGE
RECOMMENDED
SELECTION RANGE
PR
ESSU
RE
DUCT SYSTEM CURVE
DU
CT S
YSTEM
CU
RVE
Figure 5.4 - Recommended Performance Range of a Typical Centrifugal Fan
AMCA 201-02 (R2007)
16

In a later section, the effects of some system
components and fan accessories on fan performance
are discussed. The System Effects presented will
assist the system designer to determine fan
selection.
6.3 The system curve
At a fixed airflow through a given air system a
corresponding pressure loss, or resistance to this
airflow, will exist. If the airflow is changed, the
resulting pressure loss, or resistance to airflow, will
also change. The relationship between airflow
pressure and loss can vary as a function of type of
duct components, their interaction and the local
velocity magnitude. In many cases, typical duct
systems operate in the turbulent flow regime and the
pressure loss can be approximated as a function of
velocity (or airflow) squared. The simplifying
relationship used in this publication governing the
change in pressure loss as a function of airflow for a
fixed system is:
Pc/P = (Qc/Q)2
A more through discussion of duct system pressure
losses can be found in AMCA Publication 200 AirSystems.
The system curve of a "fixed system" plots as a
parabola in accordance with the above relationship.
Typical plots of the resistance to flow versus volume
airflow for three different and arbitrary fixed systems,
(A, B, and C) are illustrated in Figure 6.1. For a fixed
system an increase or decrease in airflow results in
an increase or decrease in the system resistance
along the given system curve only. Also, as the
components in a system change, the system curve
changes.
Refer to Figure 6.1, Duct System A. With a system at
the design airflow (Q) and at a design system
resistance (P), an increase in airflow to 120% of Qwill result in an increase in system resistance P of
144% since system resistance varies with the square
of the airflow. Likewise, a decrease in airflow Q to
50% would result in a decrease in system resistance
P to 25% of the design system resistance.
In Figure 6.1, System Curve B is representative of a
system that has more component pressure loss than
System Curve A, and System Curve C has less
component pressure loss than System Curve A.
Notice that on a percentage basis, the same
relationships also hold for System Curves B and C.
These relationships are characteristic of typical fixed
systems.
SYSTE
M B
SYSTEM A
SYSTEM C
PE
RC
EN
T O
F S
YS
TE
M R
ES
ISTA
NC
E
PERCENT OF SYSTEM AIRFLOW
0
20
40
60
80
100
120
140
160
180
200
0
20 40 60 80 100 120 140 160 180 200
SYSTEMDESIGN POINT
Figure 6.1 - System Curves
AMCA 201-02 (R2007)
17
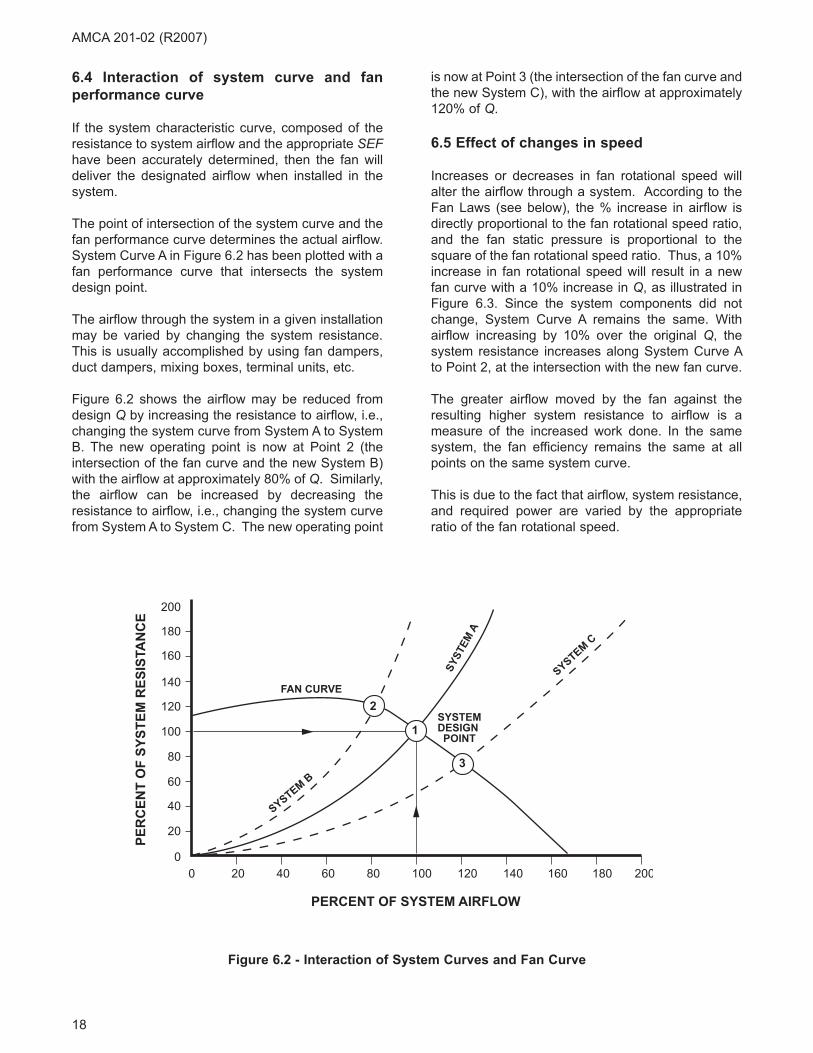
6.4 Interaction of system curve and fan
performance curve
If the system characteristic curve, composed of the
resistance to system airflow and the appropriate SEFhave been accurately determined, then the fan will
deliver the designated airflow when installed in the
system.
The point of intersection of the system curve and the
fan performance curve determines the actual airflow.
System Curve A in Figure 6.2 has been plotted with a
fan performance curve that intersects the system
design point.
The airflow through the system in a given installation
may be varied by changing the system resistance.
This is usually accomplished by using fan dampers,
duct dampers, mixing boxes, terminal units, etc.
Figure 6.2 shows the airflow may be reduced from
design Q by increasing the resistance to airflow, i.e.,
changing the system curve from System A to System
B. The new operating point is now at Point 2 (the
intersection of the fan curve and the new System B)
with the airflow at approximately 80% of Q. Similarly,
the airflow can be increased by decreasing the
resistance to airflow, i.e., changing the system curve
from System A to System C. The new operating point
is now at Point 3 (the intersection of the fan curve and
the new System C), with the airflow at approximately
120% of Q.
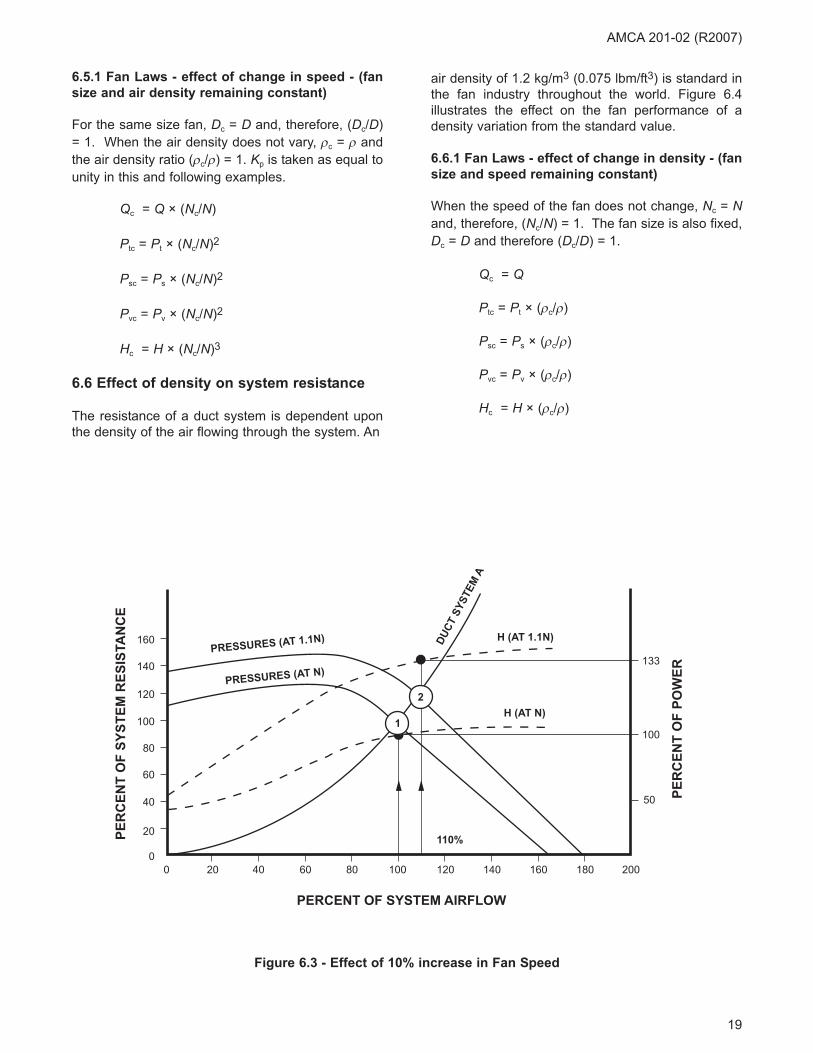
6.5 Effect of changes in speed
Increases or decreases in fan rotational speed will
alter the airflow through a system. According to the
Fan Laws (see below), the % increase in airflow is
directly proportional to the fan rotational speed ratio,
and the fan static pressure is proportional to the
square of the fan rotational speed ratio. Thus, a 10%
increase in fan rotational speed will result in a new
fan curve with a 10% increase in Q, as illustrated in
Figure 6.3. Since the system components did not
change, System Curve A remains the same. With
airflow increasing by 10% over the original Q, the
system resistance increases along System Curve A
to Point 2, at the intersection with the new fan curve.
The greater airflow moved by the fan against the
resulting higher system resistance to airflow is a
measure of the increased work done. In the same
system, the fan efficiency remains the same at all
points on the same system curve.
This is due to the fact that airflow, system resistance,
and required power are varied by the appropriate
ratio of the fan rotational speed.
200
0
20
40
60
80
100
120
140
160
180
200
40 60 80 100 120 140 160 180 200
FAN CURVE
SYSTEM B
SY
STE
M A
SYSTEM C
SYSTEMDESIGN POINT
1
2
3
PERCENT OF SYSTEM AIRFLOW
PE
RC
EN
T O
F S
YS
TE
M R
ES
ISTA
NC
E
Figure 6.2 - Interaction of System Curves and Fan Curve
AMCA 201-02 (R2007)
18
PERCENT OF SYSTEM AIRFLOW
PE
RC
EN
T O
F P
OW
ER
PE
RC
EN
T O
F S
YS
TE
M R
ES
ISTA
NC
E
0
0
20
40
60
80
100
120
140
160
20 40 60 80 100
100
133
50
120 140
110%
160 180 200
H (AT 1.1N)PRESSURES (AT 1.1N) D
UC
T S
YS
TE
M A
PRESSURES (AT N)
H (AT N)1
2
Figure 6.3 - Effect of 10% increase in Fan Speed
AMCA 201-02 (R2007)
6.5.1 Fan Laws - effect of change in speed - (fan
size and air density remaining constant)
For the same size fan, Dc = D and, therefore, (Dc/D)
= 1. When the air density does not vary, ρc = ρ and
the air density ratio (ρc/ρ) = 1. Kp is taken as equal to
unity in this and following examples.
Qc = Q × (Nc/N)
Ptc = Pt × (Nc/N)2
Psc = Ps × (Nc/N)2
Pvc = Pv × (Nc/N)2
Hc = H × (Nc/N)3
6.6 Effect of density on system resistance
The resistance of a duct system is dependent upon
the density of the air flowing through the system. An
air density of 1.2 kg/m3 (0.075 lbm/ft3) is standard in
the fan industry throughout the world. Figure 6.4
illustrates the effect on the fan performance of a
density variation from the standard value.
6.6.1 Fan Laws - effect of change in density - (fan
size and speed remaining constant)
When the speed of the fan does not change, Nc = Nand, therefore, (Nc/N) = 1. The fan size is also fixed,
Dc = D and therefore (Dc/D) = 1.
Qc = Q
Ptc = Pt × (ρc/ρ)
Psc = Ps × (ρc/ρ)
Pvc = Pv × (ρc/ρ)
Hc = H × (ρc/ρ)
19

0
0
0 20 40 60 80 100 120 140 160 180 200
20
40
60
80
100
20
40
60
80
100
PERCENT OF SYSTEM AIRFLOW
PE
RC
EN
T O
F P
OW
ER
PE
RC
EN
T O
F S
YS
TE
MR
ES
ISTA
NC
E A
ND
FA
N P
RE
SS
UR
E
POWER @ DENSITY ρ
FAN PRESSURE CURVE@ DENSITY ρ/2
FAN PRESSURE CURVE@ DENSITY ρ SYSTEM A
@ DENSITY ρFAN INLET
SYSTEM A@ DENSITY ρ/2
FAN INLET
POWER @ DENSITY ρ/2
Figure 6.4 - Density Effect
AMCA 201-02 (R2007)
20

CALCULATED SYSTEM CURVE
PEAK FAN PRESSURE
FAN PRESSURE
CURVE
DESIGN AIRFLOW
DE
SIG
N R
ES
ISTA
NC
E
1
Figure 6.5 - Fan/System Curve at Design Point
AMCA 201-02 (R2007)
6.7 Fan and system interaction
When system pressure losses have been accurately
estimated and desirable fan inlet and outlet
conditions have been provided, design airflow can be
expected, as illustrated in Figure 6.5. Note again that
the intersection of the actual system curve and the
fan curve determine the actual airflow. However,
when system pressure losses have not been
accurately estimated as in Figure 6.6, or when
undesirable fan inlet and outlet conditions exist as in
Figure 6.7, design performance may not be obtained.
6.8 Effects of errors in estimating system
resistance
6.8.1 Higher system resistance. In Figure 6.6,
System Curve B shows a situation where a system
has greater resistance to airflow than designed
(Curve A). This condition is generally a result of
inaccurate allowances of system resistance. All
pressure losses must be considered when
calculating system resistance or the actual system
will be more restrictive to airflow than intended. This
condition results in an actual airflow at Point 2, which
is at a higher pressure and lower airflow than was
expected.
If the actual duct system pressure loss is greater than
design, an increase in fan speed may be necessary
to achieve Point 5, the design airflow.
CAUTION: Before increasing fan rotational
speed, check with the fan manufacturer to
determine whether the fan rotational speed can
be safely increased. Also determine the expected
increase in power. Since the power required
increases as the cube of the fan rotational speed
ratio, it is very easy to exceed the capacity of the
existing motor and that of the available electrical
service.
6.8.2 Lower system resistance. Curve C in Figure
6.6 shows a system that has less resistance to airflow
than designed. This condition results in an actual
airflow at Point 3, which is at a lower pressure and
higher airflow than was expected.
21

FAN PRESSURECURVE
CURVE B:ACTUAL SYSTEM
CURVE A:CALCULATED SYSTEM
CURVE CACTUAL SYSTEM
PEAK FANPRESSURE
ACTUAL SYSTEM RESISTANCEMORE THAN DESIGN
ACTUAL SYSTEMLESS THANDESIGN
DESIGN AIRFLOW
DE
SIG
N R
ES
ISTA
NC
E
5
1
2
4
3
Figure 6.6 - Fan/System Curve Not at Design Point
AMCA 201-02 (R2007)
6.9 Safety factors
It has been common practice among system
designers to add safety factors to the calculated
system resistance to account for the “unexpected”.
In some cases, safety factors may compensate for
resistance losses that were unaccounted for and the
actual system will deliver the design airflow, Point 1,
Figure 6.6. If the actual system resistance is lower
than the design system resistance, including the
safety factors, the fan will run at Point 3 and deliver
more airflow. This result may not be advantageous
because the fan may be operating at a less efficient
point on the fan’s performance curve and may require
more power than a properly designed system. Under
these conditions, it may be desirable to reduce the
fan performance to operate at Point 4 on Curve C,
Figure 6.6. This may be accomplished by reducing
the fan speed, adjusting the variable inlet vane (VIV),
if installed, or inlet dampers. The system resistance
could also be increased to Point 1 on Curve A, Figure
6.6. The change in fan operating point should be
evaluated carefully, since a change in fan power
consumption may occur.
The system designer should also evaluate the fan
performance tolerance and system resistance
tolerance to determine if the lower or upper limits of
the probable airflow in the system are acceptable.
The combination of these tolerances should be
evaluated to ensure that the “high-side” system
resistance curve does not fall into the unstable range
of performance. Operation in this area of the curve
should be avoided and precautions taken to ensure
operations outside of the unstable area, especially at
the highest expected system resistance.
22

AMCA 201-02 (R2007)
6.10 Deficient fan/system performance
The most common causes of deficient fan/system
performance are improper fan inlet duct design, fan
outlet duct design, and fan installation into the duct
system. Any one or a combination of these conditions
that alter the aerodynamic characteristics of the air
flowing through the fan such that the fan’s full airflow
potential, as tested in the laboratory and cataloged, is
not likely to be realized.
Other major causes of deficient performance are:
• The air performance characteristics of the
installed system are significantly different from
the system designer's intent (See Figure 6.6).
This may be due to a change in the system by
others or unexpected behavior of the system
during operation.
• The system design calculations did not include
adequate allowances for the effect of accessories
and appurtenances (See Section 10).
• The fan selection was made without allowing
for the effect of appurtenances on the fan's
performance (See Section 10).
• Dirty filters, dirty ducts, dirty coils, etc., will
increase the system resistance, and
consequently, reduce the airflow - often
significantly.
• The "performance" of the system has been
determined by field measurement techniques
that have a high degree of uncertainty.
Other "on-site" problems are listed in AMCA
Publication 202 Troubleshooting, which includes
detailed checklists and recommendations for the
correction of problems with the performance of air
systems.
6.11 Precautions to prevent deficient
performance
• Use appropriate allowances in the design
calculations when space or other factors
dictate the use of less than optimum
arrangement of the fan outlet and inlet
connections (See Sections 8 and 9).
• Design the connections between the fan and
the system to provide, as nearly as possible,
uniform airflow conditions at the fan outlet and
inlet connections (See Sections 8 and 9).
• Include adequate allowance for the effect of all
accessories and appurtenances on the
performance of the system and the fan. If
possible, obtain from the fan manufacturer
data on the effect of installed appurtenances
on the fan's performance (See Section 10).
• Use field measurement techniques that can be
applied effectively on the particular system.
Be aware of the probable accuracy of
measurement and conditions that affect this.
Refer to AMCA Publication 203 FieldPerformance Measurement of Fan Systems;
for more precise measurement see AMCA
Standard 803 Industrial Process/PowerGeneration Fans: Site Performance TestStandard. Also, refer to AABC National
Standards, Chapter 8, Volume Measurements,
Associated Air Balance Council, 5th Edition,
1989.
6.12 System Effect
Figure 6.7 illustrates deficient fan/system
performance resulting from one or more of the
undesirable airflow conditions listed in Section 6.10.
It is assumed that the system pressure losses, shown
in system curve A, have been accurately determined,
and a suitable fan selected for operation at Point 1.
However, no allowance has been made for the effect
of the system connections on the fan's performance.
To account for this System Effect it will be necessary
to add a System Effect Factor (SEF) to the calculated
system pressure losses to determine the actual
system curve. The SEF for any given configuration is
velocity dependent and will vary across a range of
airflow. This will be discussed in more detail in
Section 7. (See Figure 7.1).
In Figure 6.7 the point of intersection between the fan
performance curve and the actual system curve B is
Point 4. The actual airflow will be deficient by the
difference 1-4. To achieve design airflow, a SEFequal to the pressure difference between Point 1 and
2 should have been added to the calculated system
pressure losses and the fan selected to operate at
Point 2. Note that because the System Effect is
velocity related, the difference represented between
Points 1 and 2 is greater than the difference between
Points 3 and 4.
The System Effect includes only the effect of the
system configuration on the fan's performance.
23

AMCA 201-02 (R2007)
7. System Effect Factor (SEF)
A System Effect Factor is a value that accounts for
the effect of conditions adversely influencing fan
performance when installed in the air system.
7.1 System Effect Curves
Figure 7.1 shows a series of 19 System Effect
Curves. By entering the chart at the appropriate air
velocity (on the abscissa), it is possible to read
across from any curve (to the ordinate) to find the
SEF for a particular configuration.
24
AIRFLOWDEFICIENCY
SYSTEMEFFECT ATACTUAL AIRFLOW
FAN CATALOGPRESSURECURVE
SYSTEM EFFECT LOSSAT DESIGN AIRFLOW
CURVE ACALCULATED SYSTEMWITH NO ALLOWANCEFOR SYSTEM EFFECT
CURVE BACTUAL SYSTEMWITH SYSTEM EFFECT
DESIGN AIRFLOW
DE
SIG
N R
ES
ISTA
NC
E
1
2
4
3
Figure 6.7 - Deficient Fan/System Performance - System Effect Ignored

AIR VELOCITY, (m/s)
SY
ST
EM
EF
FE
CT
FA
CT
OR
PR
ES
SU
RE
, P
a
(Air Density = 1.2 kg/m3)
1000
900
800
700
600
500
400
300
200
100
90
80
70
60
50
40
30
20
2.5 3 4 5 6 7 8 9 10 20 30
X
W
V
U
T
S
R
Q
PONMLKJIHGF
Figure 7.1 - System Effect Curves (SI)
AMCA 201-02 (R2007)
25

AIR VELOCITY, ft/min × 100
SY
ST
EM
EF
FE
CT
FA
CT
OR
- P
RE
SS
UR
E,
in.
wg
50.1
0.15
0.2
0.25
0.3
0.4
0.5
0.6
0.7
0.8
0.9
1.0
1.5
2.0
2.5
3.0
4.0
5.0
6 7 8 9 10 15 20 25 30 40 50 60
FG H I J K L M N O
P
Q
R
S
T
U
V
W
X
(Air Density = 0.075 lbm/ft3)
Figure 7.1 - System Effect Curves (I-P)
AMCA 201-02 (R2007)
26
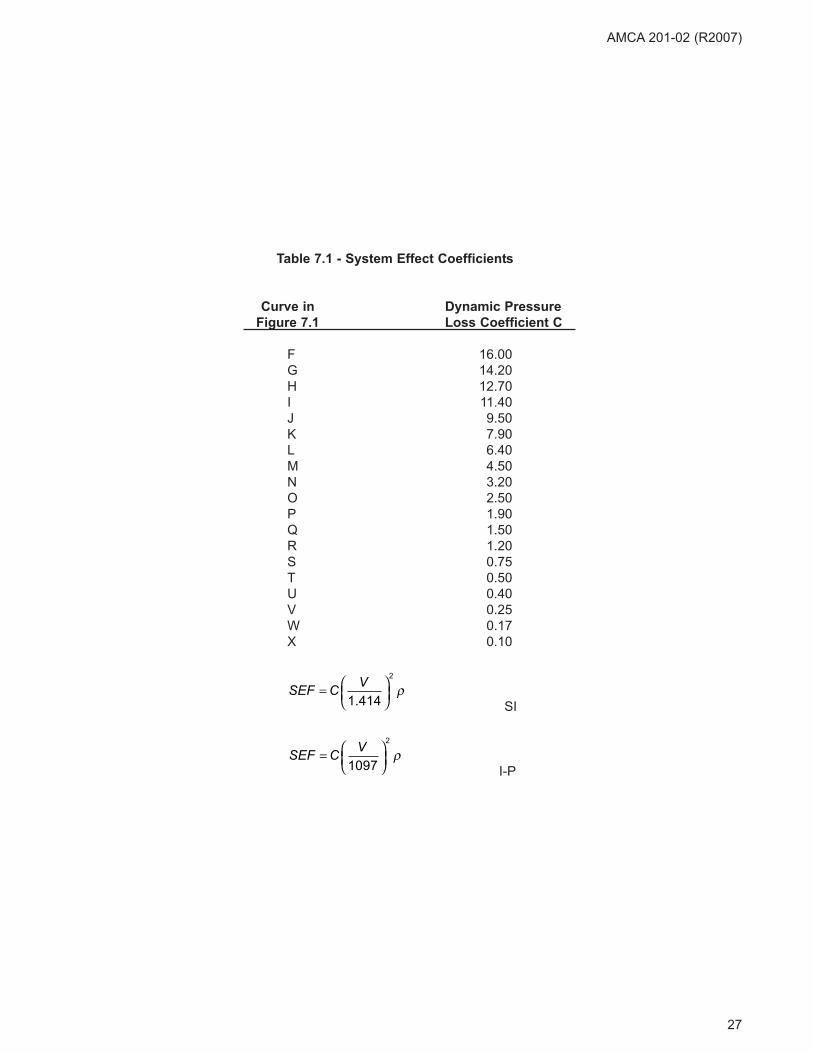
Table 7.1 - System Effect Coefficients
Curve in Dynamic Pressure
Figure 7.1 Loss Coefficient C
F 16.00
G 14.20
H 12.70
I 11.40
J 9.50
K 7.90
L 6.40
M 4.50
N 3.20
O 2.50
P 1.90
Q 1.50
R 1.20
S 0.75
T 0.50
U 0.40
V 0.25
W 0.17
X 0.10
SI
I-P
SEF C V= ⎛⎝⎜
⎞⎠⎟1097
2
ρ
SEF C V= ⎛⎝⎜
⎞⎠⎟1 414
2
.ρ
AMCA 201-02 (R2007)
27

DESIGN AIRFLOW
AC
TU
AL S
YS
TE
M R
ES
ISTA
NC
E
AC
TU
AL P
OW
ER
RE
QU
IRE
D
SEF
FAN POWER
FAN PRESSURE
ACTUAL SYSTEM W/ SEF
CALCULATEDSYSTEM W/NOALLOWANCE
FOR SEF
Figure 7.2 - Effect of System on Fan Selection
AMCA 201-02 (R2007)
The SEF is given in Pascals (in. wg) and must be
added to the total system pressure losses as shown
on Figure 7.2.
The velocity used when entering Figure 7.1 will be
either the inlet or the outlet velocity of the fan. This
will depend on whether the configuration in question
is related to the fan inlet or the fan outlet. Most
catalog ratings include outlet velocity figures but, for
centrifugal fans, it may be necessary to calculate the
inlet velocity (See Figure 9.14). The inlet velocity and
outlet velocity of an axial fan can be approximated by
using the fan impeller diameter to determine the
airflow area. The necessary dimensioned drawings
are usually included in the fan catalog.
In Sections 8 and 9, typical inlet and outlet
configurations are illustrated and the appropriate
System Effect Curve is listed for each configuration.
If more than one configuration is included in a
system, the SEF for each must be determined
separately and the total of these System Effects must
be added to the total pressure losses.
The System Effect Curves are plotted for standard air
at a density of 1.2 kg/m3 (0.075 lbm/ft3). Since the
System Effect is directly proportional to density,
values for other densities can be calculated as below:
Where:
SEF2 = SEF at actual density
SEF1 = SEF at standard density
d2 = actual density
d1 = standard density
Alternatively, the SEF may be calculated by the
method shown in Table 7.1. Determine the
configuration being evaluated and use the
appropriate loss coefficient, Cp, and application
velocity, V. The SEF can then be calculated using the
equations shown in Table 7.1.
SEF SEF dd2 1
2
1
=⎛
⎝⎜
⎞
⎠⎟
28
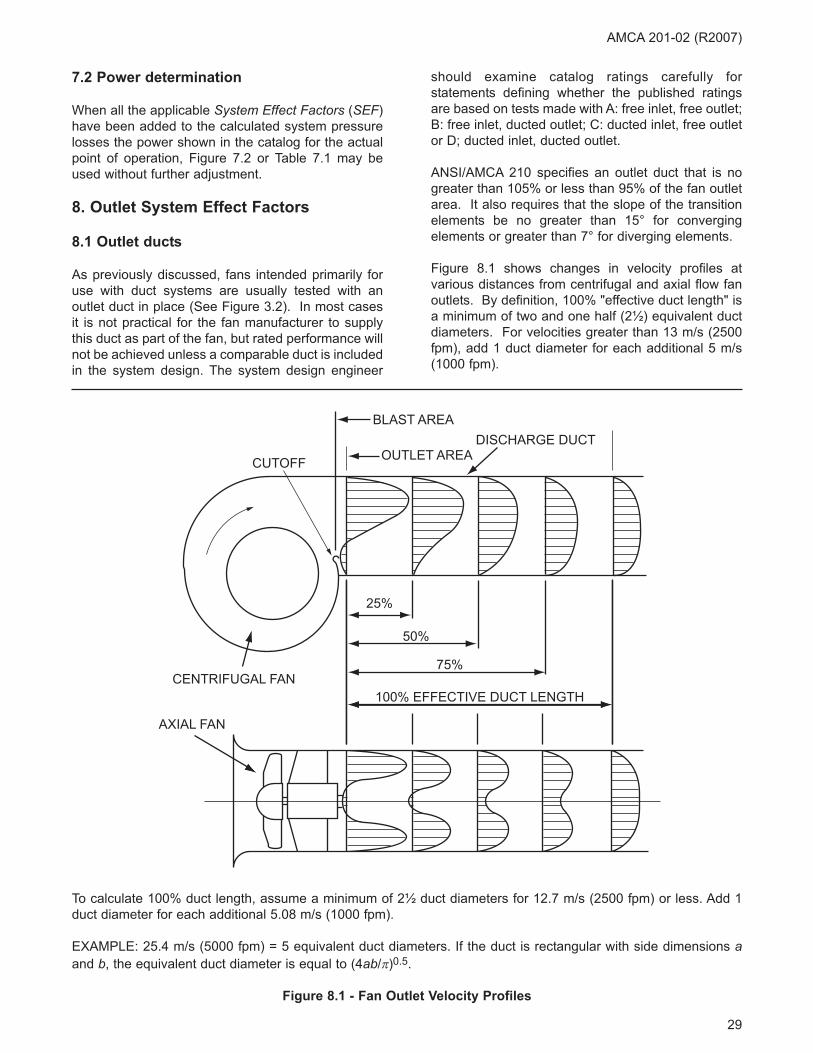
OUTLET AREA
BLAST AREA
CENTRIFUGAL FAN
AXIAL FAN
CUTOFF
DISCHARGE DUCT
25%
50%
75%
100% EFFECTIVE DUCT LENGTH
To calculate 100% duct length, assume a minimum of 2½ duct diameters for 12.7 m/s (2500 fpm) or less. Add 1
duct diameter for each additional 5.08 m/s (1000 fpm).
EXAMPLE: 25.4 m/s (5000 fpm) = 5 equivalent duct diameters. If the duct is rectangular with side dimensions aand b, the equivalent duct diameter is equal to (4ab/π)0.5.
Figure 8.1 - Fan Outlet Velocity Profiles
AMCA 201-02 (R2007)
7.2 Power determination
When all the applicable System Effect Factors (SEF)
have been added to the calculated system pressure
losses the power shown in the catalog for the actual
point of operation, Figure 7.2 or Table 7.1 may be
used without further adjustment.
8. Outlet System Effect Factors
8.1 Outlet ducts
As previously discussed, fans intended primarily for
use with duct systems are usually tested with an
outlet duct in place (See Figure 3.2). In most cases
it is not practical for the fan manufacturer to supply
this duct as part of the fan, but rated performance will
not be achieved unless a comparable duct is included
in the system design. The system design engineer
should examine catalog ratings carefully for
statements defining whether the published ratings
are based on tests made with A: free inlet, free outlet;
B: free inlet, ducted outlet; C: ducted inlet, free outlet
or D; ducted inlet, ducted outlet.
ANSI/AMCA 210 specifies an outlet duct that is no
greater than 105% or less than 95% of the fan outlet
area. It also requires that the slope of the transition
elements be no greater than 15° for converging
elements or greater than 7° for diverging elements.
Figure 8.1 shows changes in velocity profiles at
various distances from centrifugal and axial flow fan
outlets. By definition, 100% "effective duct length" is
a minimum of two and one half (2½) equivalent duct
diameters. For velocities greater than 13 m/s (2500
fpm), add 1 duct diameter for each additional 5 m/s
(1000 fpm).
29
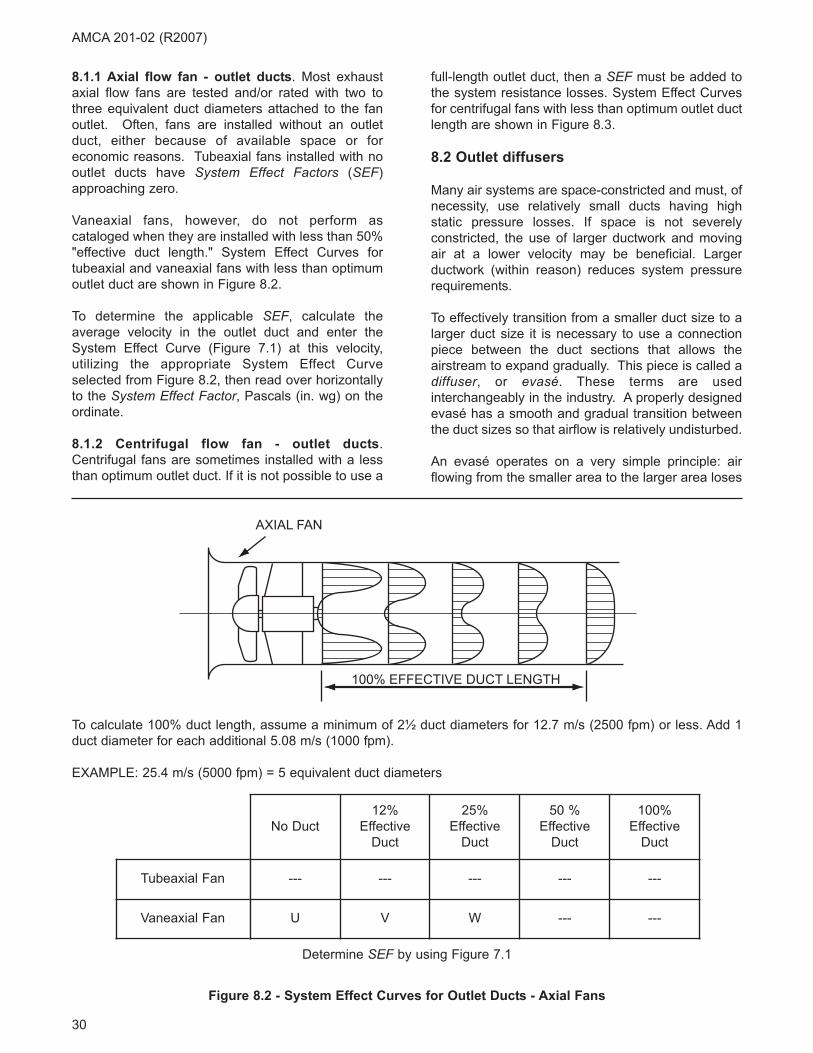
AXIAL FAN
100% EFFECTIVE DUCT LENGTH
Figure 8.2 - System Effect Curves for Outlet Ducts - Axial Fans
Tubeaxial Fan
Vaneaxial Fan
No Duct
12%
Effective
Duct
25%
Effective
Duct
50 %
Effective
Duct
100%
Effective
Duct
--- --- --- --- ---
U V W --- ---
To calculate 100% duct length, assume a minimum of 2½ duct diameters for 12.7 m/s (2500 fpm) or less. Add 1
duct diameter for each additional 5.08 m/s (1000 fpm).
EXAMPLE: 25.4 m/s (5000 fpm) = 5 equivalent duct diameters
Determine SEF by using Figure 7.1
AMCA 201-02 (R2007)
8.1.1 Axial flow fan - outlet ducts. Most exhaust
axial flow fans are tested and/or rated with two to
three equivalent duct diameters attached to the fan
outlet. Often, fans are installed without an outlet
duct, either because of available space or for
economic reasons. Tubeaxial fans installed with no
outlet ducts have System Effect Factors (SEF)
approaching zero.
Vaneaxial fans, however, do not perform as
cataloged when they are installed with less than 50%
"effective duct length." System Effect Curves for
tubeaxial and vaneaxial fans with less than optimum
outlet duct are shown in Figure 8.2.
To determine the applicable SEF, calculate the
average velocity in the outlet duct and enter the
System Effect Curve (Figure 7.1) at this velocity,
utilizing the appropriate System Effect Curve
selected from Figure 8.2, then read over horizontally
to the System Effect Factor, Pascals (in. wg) on the
ordinate.
8.1.2 Centrifugal flow fan - outlet ducts.
Centrifugal fans are sometimes installed with a less
than optimum outlet duct. If it is not possible to use a
full-length outlet duct, then a SEF must be added to
the system resistance losses. System Effect Curves
for centrifugal fans with less than optimum outlet duct
length are shown in Figure 8.3.
8.2 Outlet diffusers
Many air systems are space-constricted and must, of
necessity, use relatively small ducts having high
static pressure losses. If space is not severely
constricted, the use of larger ductwork and moving
air at a lower velocity may be beneficial. Larger
ductwork (within reason) reduces system pressure
requirements.
To effectively transition from a smaller duct size to a
larger duct size it is necessary to use a connection
piece between the duct sections that allows the
airstream to expand gradually. This piece is called a
diffuser, or evasé. These terms are used
interchangeably in the industry. A properly designed
evasé has a smooth and gradual transition between
the duct sizes so that airflow is relatively undisturbed.
An evasé operates on a very simple principle: air
flowing from the smaller area to the larger area loses
30
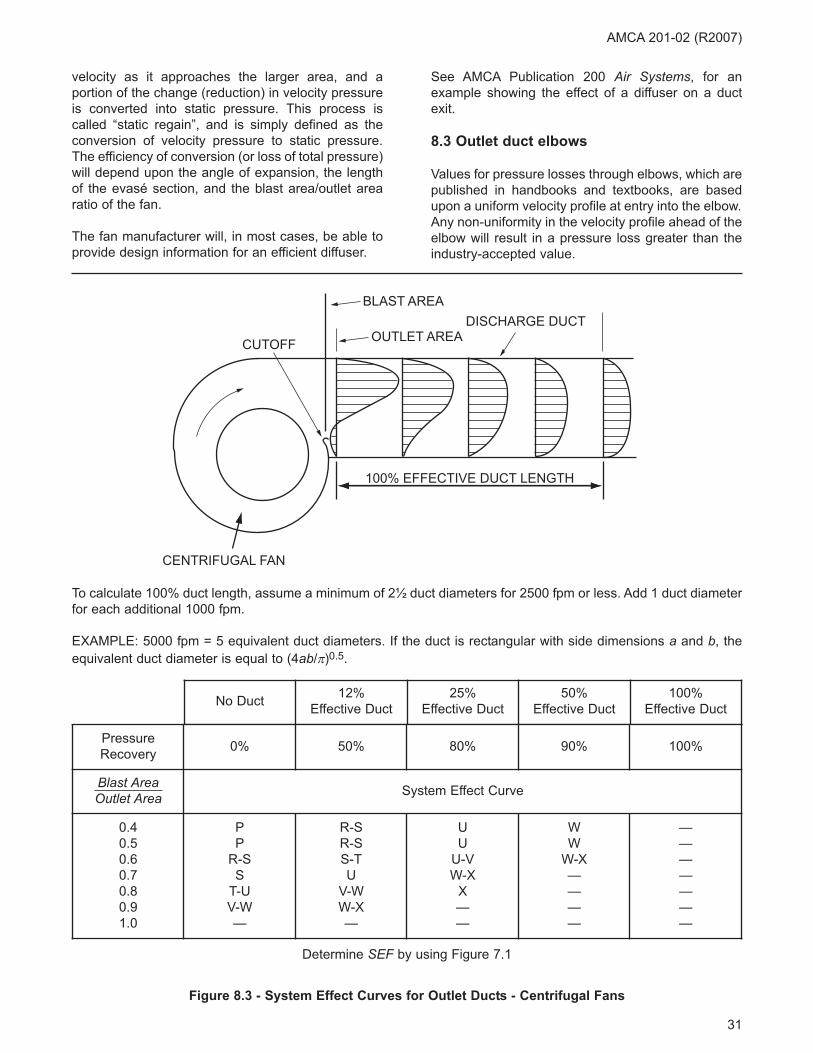
OUTLET AREA
BLAST AREA
CENTRIFUGAL FAN
CUTOFF
DISCHARGE DUCT
100% EFFECTIVE DUCT LENGTH
To calculate 100% duct length, assume a minimum of 2½ duct diameters for 2500 fpm or less. Add 1 duct diameter
for each additional 1000 fpm.
EXAMPLE: 5000 fpm = 5 equivalent duct diameters. If the duct is rectangular with side dimensions a and b, the
equivalent duct diameter is equal to (4ab/π)0.5.
Figure 8.3 - System Effect Curves for Outlet Ducts - Centrifugal Fans
No Duct12%
Effective Duct
25%
Effective Duct
50%
Effective Duct
100%
Effective Duct
Pressure
Recovery0% 50% 80% 90% 100%
Blast AreaOutlet Area System Effect Curve
0.4
0.5
0.6
0.7
0.8
0.9
1.0
P
P
R-S
S
T-U
V-W
—
R-S
R-S
S-T
U
V-W
W-X
—
U
U
U-V
W-X
X
—
—
W
W
W-X
—
—
—
—
—
—
—
—
—
—
—
Determine SEF by using Figure 7.1
AMCA 201-02 (R2007)
velocity as it approaches the larger area, and a
portion of the change (reduction) in velocity pressure
is converted into static pressure. This process is
called “static regain”, and is simply defined as the
conversion of velocity pressure to static pressure.
The efficiency of conversion (or loss of total pressure)
will depend upon the angle of expansion, the length
of the evasé section, and the blast area/outlet area
ratio of the fan.
The fan manufacturer will, in most cases, be able to
provide design information for an efficient diffuser.
See AMCA Publication 200 Air Systems, for an
example showing the effect of a diffuser on a duct
exit.
8.3 Outlet duct elbows
Values for pressure losses through elbows, which are
published in handbooks and textbooks, are based
upon a uniform velocity profile at entry into the elbow.
Any non-uniformity in the velocity profile ahead of the
elbow will result in a pressure loss greater than the
industry-accepted value.
31

TUBEAXIAL FAN SHOWN
VANEAXIAL FAN SHOWN
% EFFECTIVEDUCT LENGTH
% EFFECTIVEDUCT LENGTH
Determine SEF by using Figures 7.1 and 8.1
Figure 8.4 - System Effect Curves for Outlet Duct Elbows - Axial Fans
Tubeaxial Fan
Vaneaxial Fan
Vaneaxial Fan
90° Elbow No Duct
12%
Effective
Duct
25%
Effective
Duct
50 %
Effective
Duct
100%
Effective
Duct
2 & 4 Pc --- --- --- --- ---
2 Pc U U-V V W ---
4 Pc W --- --- --- ---
AMCA 201-02 (R2007)
Since the velocity profile at the outlet of a fan is not
uniform, an elbow located at or near the fan outlet will
develop a pressure loss greater than the industry-
accepted value.
The amount of this loss will depend upon the location
and orientation of the elbow relative to the fan outlet.
In some cases, the effect of the elbow will be to
further distort the outlet velocity profile of the fan.
This will increase the losses and may result in such
uneven airflow in the duct that branch- takeoffs near
the elbow will not deliver their design airflow. (See
Section 8.6)
Wherever possible, a length of straight duct should
be installed at the fan outlet to permit the diffusion
and development of a uniform airflow profile before
an elbow is inserted in the duct. If an elbow must be
located near the fan outlet then it should be a radius
elbow having a minimum radius-to-duct-diameter
ratio of 1.5.
8.3.1 Axial fans - outlet duct elbows. Tubeaxial
fans with two-piece and four-piece mitered elbows at
varying distances from the fan outlet have a
negligible SEF (see Figure 8.4).
Vaneaxial fans with two and four-piece mitered
elbows at varying distances from the fan outlet
resulted in System Effect Curves as shown in Figure
8.4.
8.3.2 Centrifugal fans - outlet duct elbows. The
outlet velocity of centrifugal fans is generally higher
toward one or adjacent sides of the rectangular duct.
If an elbow must be located near the fan outlet it
should have a minimum radius-to-duct-diameter ratio
of 1.5, and it should be arranged to give the most
uniform airflow possible. Figure 8.5 gives System
Effect Curves that can be used to estimate the effect
of an elbow at the fan outlet. It also shows the
reduction in losses resulting from the use of a straight
outlet duct.
32

POSITION C
POSITION D
POSITION B
POSITION A
SWSI CENTRIFUGAL FAN SHOWN
INLET
% EFFECTIVE
DUCT LENGTH
Note: Fan Inlet and elbow positions must be oriented as shown for the proper application of the table on the facing
page.
Figure 8.5 - Outlet Elbows on SWSI Centrifugal Fans
AMCA 201-02 (R2007)
33
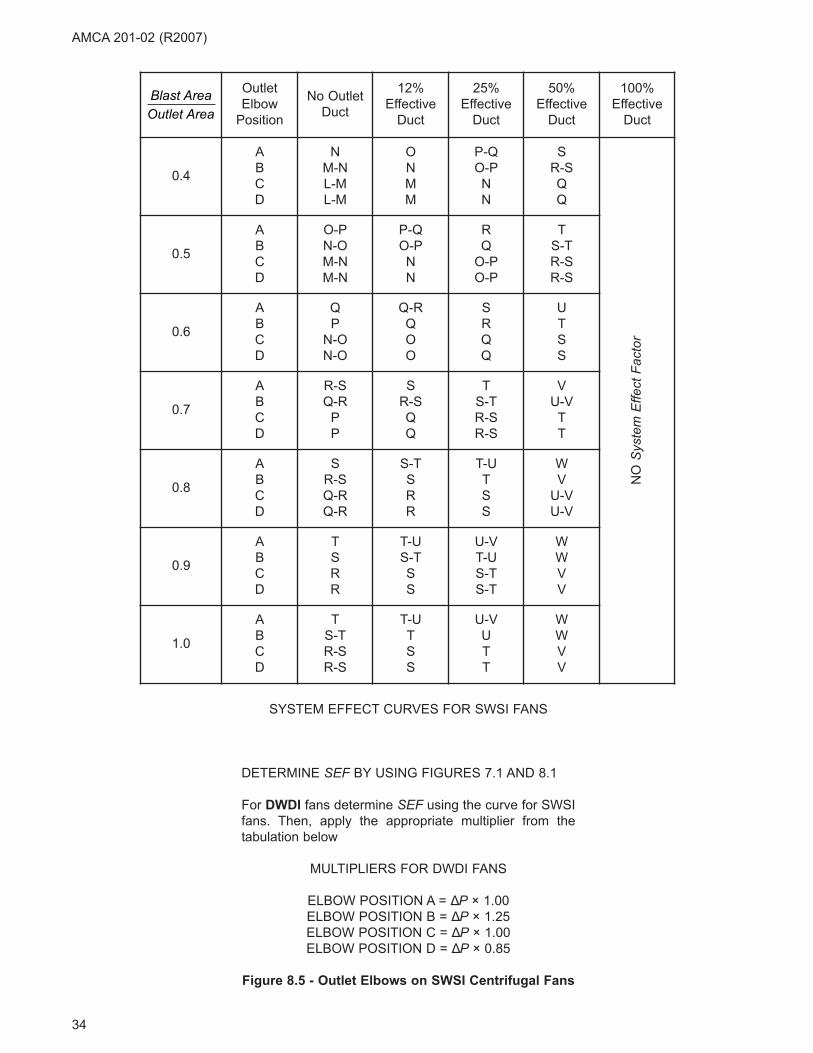
Blast AreaOutlet Area
Outlet
Elbow
Position
No Outlet
Duct
12%
Effective
Duct
25%
Effective
Duct
50%
Effective
Duct
100%
Effective
Duct
0.4
A
B
C
D
N
M-N
L-M
L-M
O
N
M
M
P-Q
O-P
N
N
S
R-S
Q
Q
NO
Sys
tem
Effe
ct F
acto
r
0.5
A
B
C
D
O-P
N-O
M-N
M-N
P-Q
O-P
N
N
R
Q
O-P
O-P
T
S-T
R-S
R-S
0.6
A
B
C
D
Q
P
N-O
N-O
Q-R
Q
O
O
S
R
Q
Q
U
T
S
S
0.7
A
B
C
D
R-S
Q-R
P
P
S
R-S
Q
Q
T
S-T
R-S
R-S
V
U-V
T
T
0.8
A
B
C
D
S
R-S
Q-R
Q-R
S-T
S
R
R
T-U
T
S
S
W
V
U-V
U-V
0.9
A
B
C
D
T
S
R
R
T-U
S-T
S
S
U-V
T-U
S-T
S-T
W
W
V
V
1.0
A
B
C
D
T
S-T
R-S
R-S
T-U
T
S
S
U-V
U
T
T
W
W
V
V
SYSTEM EFFECT CURVES FOR SWSI FANS
DETERMINE SEF BY USING FIGURES 7.1 AND 8.1
For DWDI fans determine SEF using the curve for SWSI
fans. Then, apply the appropriate multiplier from the
tabulation below
MULTIPLIERS FOR DWDI FANS
ELBOW POSITION A = ΔP × 1.00
ELBOW POSITION B = ΔP × 1.25
ELBOW POSITION C = ΔP × 1.00
ELBOW POSITION D = ΔP × 0.85
Figure 8.5 - Outlet Elbows on SWSI Centrifugal Fans
AMCA 201-02 (R2007)
34

PARALLEL-BLADE DAMPERILLUSTRATING DIVERTED AIRFLOW
OPPOSED-BLADE DAMPERILLUSTRATING NON-DIVERTEDAIRFLOW
Figure 8.6 - Parallel Blade vs. Opposed Blade Damper
AMCA 201-02 (R2007)
8.4 Turning vanes
Turning vanes will usually reduce the pressure loss
through an elbow, however, where a non-uniform
approach velocity profile exists, such as at a fan
outlet, the vanes may serve to continue the non-
uniform profile beyond the elbow. This may result in
increased losses in other system components
downstream of the elbow.
8.5 Volume control dampers
Volume control dampers are manufactured with
either "opposed" blades or "parallel" blades. When
partially closed, the parallel bladed damper diverts
the airstream to the side of the duct. This results in a
non-uniform velocity profile beyond the damper and
airflow to branch ducts close to the downstream side
may be seriously affected.
The use of an opposed blade damper is
recommended when air volume control is required at
the fan outlet and there are other system
components, such as coils or branch takeoffs
downstream of the fan. When the fan discharges into
a large plenum or to free space a parallel blade
damper may be satisfactory.
For a centrifugal fan, best air performance will usually
be achieved by installing an opposed blade damper
with its blades perpendicular to the fan shaft;
however, other considerations, such as the need for
thrust bearings, may require installation of the
damper with its blades parallel to the fan shaft.
When a damper is required, it is often furnished as
accessory equipment by the fan manufacturer (see
Figure 8.6). In many systems, a volume control
damper will be located in the ductwork at or near the
fan outlet.
Published pressure drops for wide-open control
dampers are based on uniform approach velocity
profiles. When a damper is installed close to the
outlet of a fan the approach velocity profile is non-
uniform and much higher pressure losses through the
damper can result. Figure 8.7 lists multipliers that
should be applied to the damper manufacturer's
catalog pressure drop when the damper is installed at
the outlet of a centrifugal fan. These multipliers
should be applied to all types of fan outlet dampers.
35

VOLUME CONTROL DAMPER
Figure 8.7 - Pressure Drop Multipliers for Volume Control Dampers on a Fan Discharge
BLAST AREA PRESSURE DROP
OUTLET AREA MULTIPLIER
0.4 7.5
0.5 4.8
0.6 3.3
0.7 2.4
0.8 1.9
0.9 1.5
1.0 1.2
AMCA 201-02 (R2007)
36

Note: Avoid location of split or duct branch close to fan discharge. Provide a straight section of duct to allow for air
diffusion.
Figure 8.8 - Branches Located Too Close to Fan
AMCA 201-02 (R2007)
8.6 Duct branches
Standard procedures for the design of duct systems
are based on the assumption of uniform airflow
profiles in the system.
In Figure 8.8 branch takeoffs or splits are located
close to the fan outlet. Non-uniform airflow conditions
will exist and pressure loss and airflow may vary
widely from the design intent. Wherever possible a
length of straight duct should be installed between
the fan outlet and any split or branch takeoff.
37
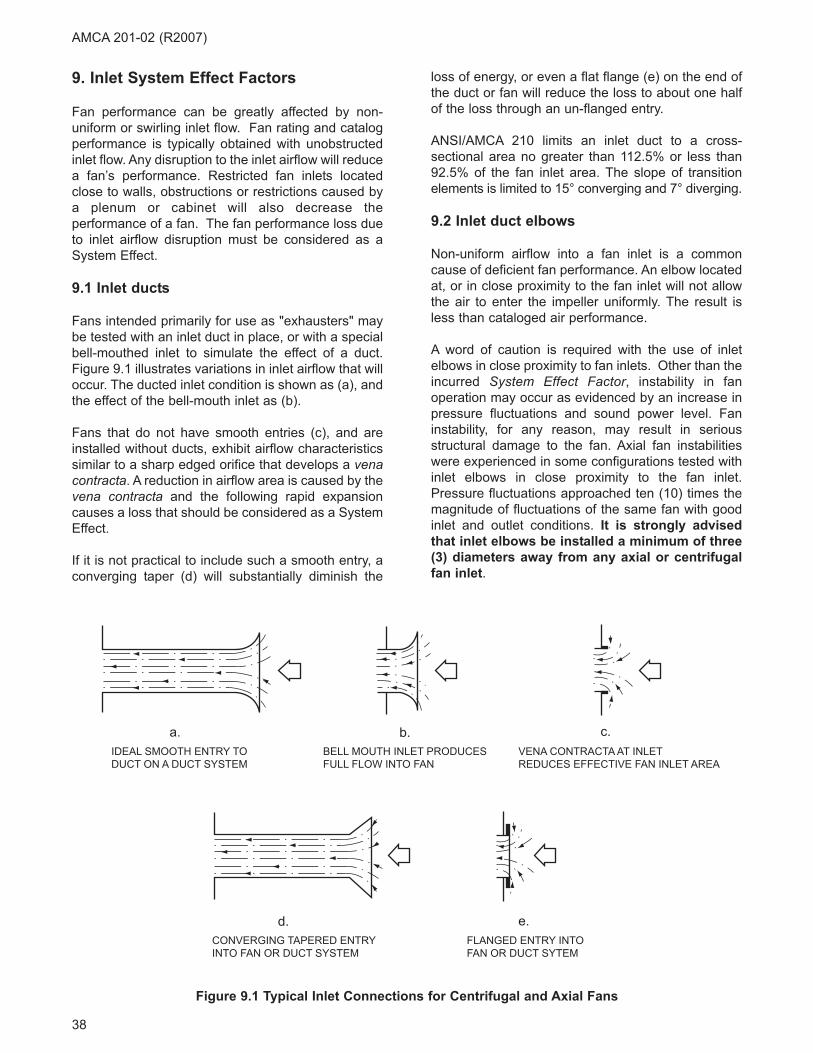
Figure 9.1 Typical Inlet Connections for Centrifugal and Axial Fans
CONVERGING TAPERED ENTRYINTO FAN OR DUCT SYSTEM
FLANGED ENTRY INTOFAN OR DUCT SYTEM
IDEAL SMOOTH ENTRY TODUCT ON A DUCT SYSTEM
a.BELL MOUTH INLET PRODUCESFULL FLOW INTO FAN
b.VENA CONTRACTA AT INLETREDUCES EFFECTIVE FAN INLET AREA
c.
e.d.
AMCA 201-02 (R2007)
9. Inlet System Effect Factors
Fan performance can be greatly affected by non-
uniform or swirling inlet flow. Fan rating and catalog
performance is typically obtained with unobstructed
inlet flow. Any disruption to the inlet airflow will reduce
a fan’s performance. Restricted fan inlets located
close to walls, obstructions or restrictions caused by
a plenum or cabinet will also decrease the
performance of a fan. The fan performance loss due
to inlet airflow disruption must be considered as a
System Effect.
9.1 Inlet ducts
Fans intended primarily for use as "exhausters" may
be tested with an inlet duct in place, or with a special
bell-mouthed inlet to simulate the effect of a duct.
Figure 9.1 illustrates variations in inlet airflow that will
occur. The ducted inlet condition is shown as (a), and
the effect of the bell-mouth inlet as (b).
Fans that do not have smooth entries (c), and are
installed without ducts, exhibit airflow characteristics
similar to a sharp edged orifice that develops a venacontracta. A reduction in airflow area is caused by the
vena contracta and the following rapid expansion
causes a loss that should be considered as a System
Effect.
If it is not practical to include such a smooth entry, a
converging taper (d) will substantially diminish the
loss of energy, or even a flat flange (e) on the end of
the duct or fan will reduce the loss to about one half
of the loss through an un-flanged entry.
ANSI/AMCA 210 limits an inlet duct to a cross-
sectional area no greater than 112.5% or less than
92.5% of the fan inlet area. The slope of transition
elements is limited to 15° converging and 7° diverging.
9.2 Inlet duct elbows
Non-uniform airflow into a fan inlet is a common
cause of deficient fan performance. An elbow located
at, or in close proximity to the fan inlet will not allow
the air to enter the impeller uniformly. The result is
less than cataloged air performance.
A word of caution is required with the use of inlet
elbows in close proximity to fan inlets. Other than the
incurred System Effect Factor, instability in fan
operation may occur as evidenced by an increase in
pressure fluctuations and sound power level. Fan
instability, for any reason, may result in serious
structural damage to the fan. Axial fan instabilities
were experienced in some configurations tested with
inlet elbows in close proximity to the fan inlet.
Pressure fluctuations approached ten (10) times the
magnitude of fluctuations of the same fan with good
inlet and outlet conditions. It is strongly advised
that inlet elbows be installed a minimum of three
(3) diameters away from any axial or centrifugal
fan inlet.
38
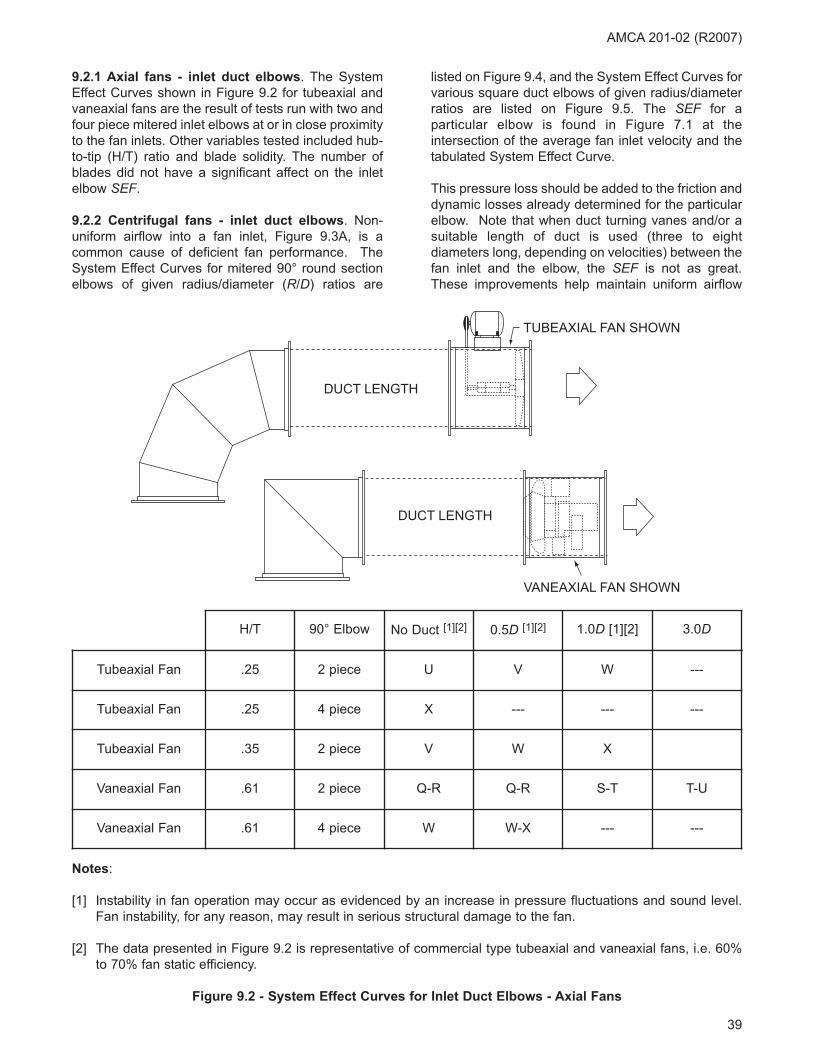
DUCT LENGTH
DUCT LENGTH
VANEAXIAL FAN SHOWN
TUBEAXIAL FAN SHOWN
H/T 90° Elbow No Duct [1][2] 0.5D [1][2] 1.0D [1][2] 3.0D
Tubeaxial Fan .25 2 piece U V W ---
Tubeaxial Fan .25 4 piece X --- --- ---
Tubeaxial Fan .35 2 piece V W X
Vaneaxial Fan .61 2 piece Q-R Q-R S-T T-U
Vaneaxial Fan .61 4 piece W W-X --- ---
Notes:
[1] Instability in fan operation may occur as evidenced by an increase in pressure fluctuations and sound level.
Fan instability, for any reason, may result in serious structural damage to the fan.
[2] The data presented in Figure 9.2 is representative of commercial type tubeaxial and vaneaxial fans, i.e. 60%
to 70% fan static efficiency.
Figure 9.2 - System Effect Curves for Inlet Duct Elbows - Axial Fans
AMCA 201-02 (R2007)
9.2.1 Axial fans - inlet duct elbows. The System
Effect Curves shown in Figure 9.2 for tubeaxial and
vaneaxial fans are the result of tests run with two and
four piece mitered inlet elbows at or in close proximity
to the fan inlets. Other variables tested included hub-
to-tip (H/T) ratio and blade solidity. The number of
blades did not have a significant affect on the inlet
elbow SEF.
9.2.2 Centrifugal fans - inlet duct elbows. Non-
uniform airflow into a fan inlet, Figure 9.3A, is a
common cause of deficient fan performance. The
System Effect Curves for mitered 90° round section
elbows of given radius/diameter (R/D) ratios are
listed on Figure 9.4, and the System Effect Curves for
various square duct elbows of given radius/diameter
ratios are listed on Figure 9.5. The SEF for a
particular elbow is found in Figure 7.1 at the
intersection of the average fan inlet velocity and the
tabulated System Effect Curve.
This pressure loss should be added to the friction and
dynamic losses already determined for the particular
elbow. Note that when duct turning vanes and/or a
suitable length of duct is used (three to eight
diameters long, depending on velocities) between the
fan inlet and the elbow, the SEF is not as great.
These improvements help maintain uniform airflow
39

40
into the fan inlet and thereby approach the airflow
conditions of the laboratory test setup.
Occasionally, where space is limited, the inlet duct
will be mounted directly to the fan inlet as shown on
Figure 9.3B. The many possible variations in the
width and depth of a duct influence the reduction in
performance to varying degrees and makes it
impossible to establish reliable SEF. Note: Capacity
losses as high as 45% have been observed in
poorly designed inlets such as in Figure 9.3B.
This inlet condition should be AVOIDED.
Existing installations can be improved with guide
vanes or the conversion to square or mitered elbows
with guide vanes, but a better alternative would be a
specially designed inlet box similar to that shown in
Figure 9.6.
9.2.3 Inlet boxes. Inlet boxes are added to
centrifugal and axial fans instead of elbows in order
to provide more predictable inlet conditions and to
maintain stable fan performance. They may also be
used to protect fan bearings from high temperature,
or corrosive / erosive gases. The fan manufacturer
should include the effect of any inlet box on the fan
performance, and when evaluating a proposal it
should be established that an appropriate loss has
been incorporated in the fan rating. Should this
information not be available from the manufacturer,
refer to Section 10.4 for an approximate System Effect.
9.3 Inlet vortex (spin or swirl)
Another major cause of reduced performance is an
inlet duct design or fan installation that produces a
vortex or spin in the airstream entering a fan inlet. An
example of this condition is illustrated in Figure 9.7.
An ideal inlet condition allows the air to enter
uniformly without spin in either direction. A spin in the
same direction as the impeller rotation (pre-rotation)
reduces the pressure- volume curve by an amount
dependent upon the intensity of the vortex. The effect
is similar to the change in the pressure-volume curve
achieved by variable inlet vanes installed in a fan
inlet; the vanes induce a controlled spin in the
direction of impeller rotation, reducing the airflow,
pressure and power (see Section 10.6).
A counter-rotating vortex at the inlet may result in a
slight increase in the pressure-volume curve but the
power will increase substantially.
There are occasions, with counter-rotating swirl,
when the loss of performance is accompanied by a
surging airflow. In these cases, the surging may be
more objectionable than the performance change.
Inlet spin may arise from a great variety of approach
conditions and sometimes the cause is not obvious.
Figure 9.3A - Non-Uniform Airflow Into a Fan
Inlet Induced by a 90°, 3-Piece Section Elbow--
No Turning Vanes
Figure 9.3B - Non-Uniform Airflow Induced Into
Fan Inlet by a Rectangular Inlet Duct
LENGTHOF DUCT
D
R
AMCA 201-02 (R2007)
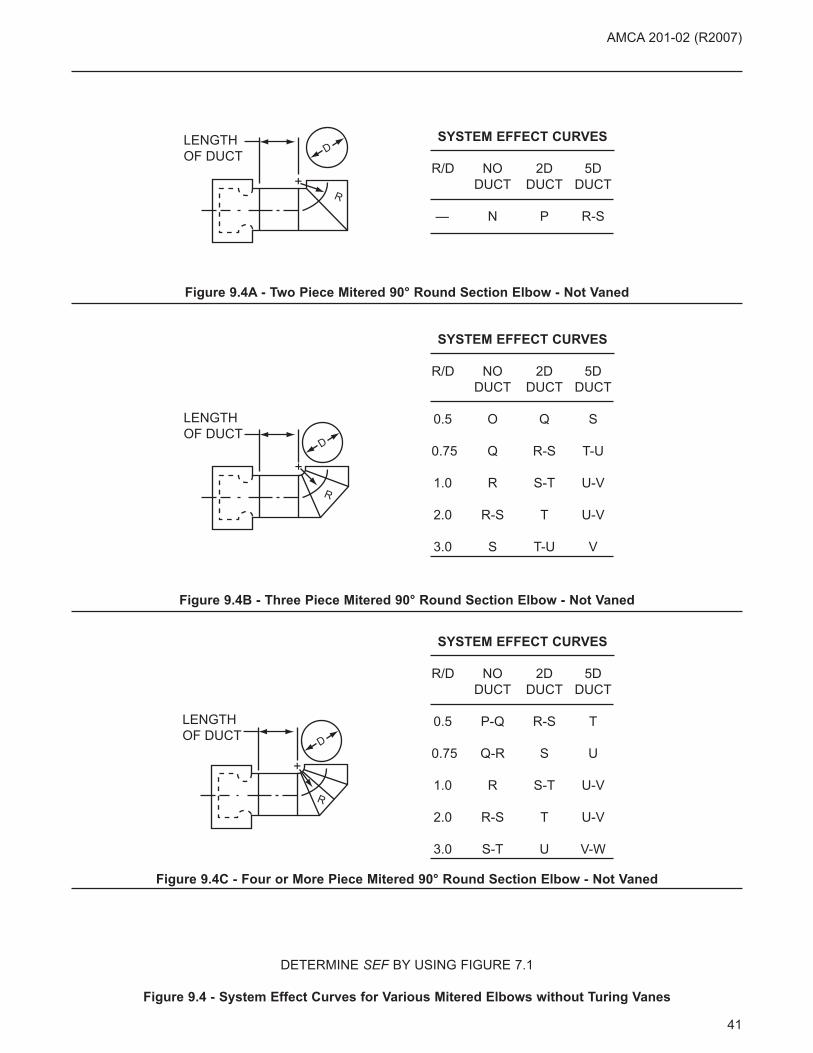
41
AMCA 201-02 (R2007)
LENGTHOF DUCT
R
D
+
LENGTHOF DUCT
D
R
+
LENGTHOF DUCT D
R
+
DETERMINE SEF BY USING FIGURE 7.1
Figure 9.4 - System Effect Curves for Various Mitered Elbows without Turing Vanes
Figure 9.4A - Two Piece Mitered 90° Round Section Elbow - Not Vaned
Figure 9.4B - Three Piece Mitered 90° Round Section Elbow - Not Vaned
Figure 9.4C - Four or More Piece Mitered 90° Round Section Elbow - Not Vaned
SYSTEM EFFECT CURVES
R/D NO 2D 5D
DUCT DUCT DUCT
— N P R-S
SYSTEM EFFECT CURVES
R/D NO 2D 5D
DUCT DUCT DUCT
0.5 O Q S
0.75 Q R-S T-U
1.0 R S-T U-V
2.0 R-S T U-V
3.0 S T-U V
SYSTEM EFFECT CURVES
R/D NO 2D 5D
DUCT DUCT DUCT
0.5 P-Q R-S T
0.75 Q-R S U
1.0 R S-T U-V
2.0 R-S T U-V
3.0 S-T U V-W
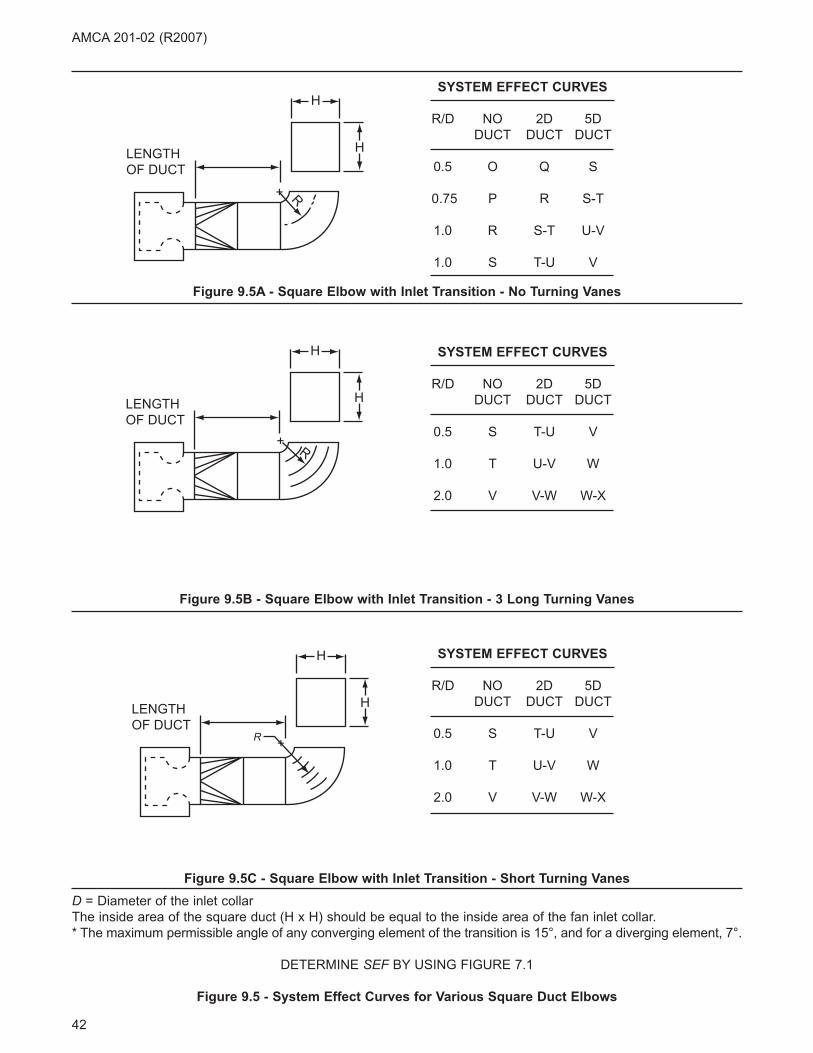
D = Diameter of the inlet collar
The inside area of the square duct (H x H) should be equal to the inside area of the fan inlet collar.
* The maximum permissible angle of any converging element of the transition is 15°, and for a diverging element, 7°.
DETERMINE SEF BY USING FIGURE 7.1
Figure 9.5 - System Effect Curves for Various Square Duct Elbows
H
H
+ R
LENGTHOF DUCT
H
H
+ R
LENGTHOF DUCT
H
H
+
LENGTHOF DUCT
R
SYSTEM EFFECT CURVES
R/D NO 2D 5D
DUCT DUCT DUCT
0.5 O Q S
0.75 P R S-T
1.0 R S-T U-V
1.0 S T-U V
SYSTEM EFFECT CURVES
R/D NO 2D 5D
DUCT DUCT DUCT
0.5 S T-U V
1.0 T U-V W
2.0 V V-W W-X
SYSTEM EFFECT CURVES
R/D NO 2D 5D
DUCT DUCT DUCT
0.5 S T-U V
1.0 T U-V W
2.0 V V-W W-X
Figure 9.5B - Square Elbow with Inlet Transition - 3 Long Turning Vanes
Figure 9.5A - Square Elbow with Inlet Transition - No Turning Vanes
Figure 9.5C - Square Elbow with Inlet Transition - Short Turning Vanes
AMCA 201-02 (R2007)
42
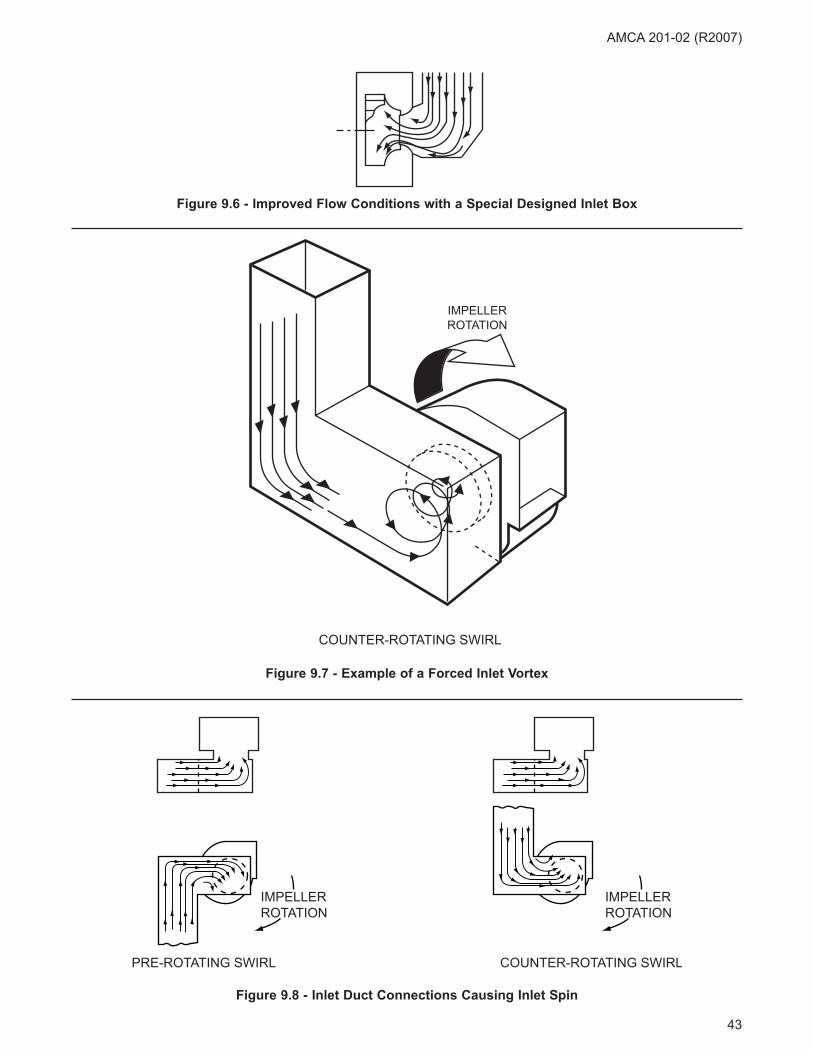
IMPELLER
ROTATION
COUNTER-ROTATING SWIRL
Figure 9.7 - Example of a Forced Inlet Vortex
Figure 9.8 - Inlet Duct Connections Causing Inlet Spin
IMPELLERROTATION
IMPELLERROTATION
PRE-ROTATING SWIRL COUNTER-ROTATING SWIRL
AMCA 201-02 (R2007)
43
Figure 9.6 - Improved Flow Conditions with a Special Designed Inlet Box

9.4 Inlet turning vanes
Where space limitations prevent the use of optimum
fan inlet conditions, more uniform airflow can be
achieved by the use of turning vanes in the inlet
elbow (see Figure 9.9). Numerous variations of
turning vanes are available, from a single curved
sheet metal vane to multi-bladed "airfoil" vanes.
The pressure drop (loss) through these devices must
be added to the system pressure losses.
The amount of loss for each device is published by
the manufacturer, but it should be realized that the
cataloged pressure loss will be based upon uniform
airflow at the entry to the elbow. If the airflow
approaching the elbow is significantly non-uniform
because of a disturbance farther upstream in the
system, the pressure loss through the elbow will be
higher than the published figure. A non-uniform
airflow entering a duct elbow with turning vanes will
leave the duct elbow with non-uniform airflow.
9.5 Airflow straighteners
Figure 9.10 shows two airflow straighteners used in
testing setups to reduce fan swirl before measuring
stations. Figure 9.10A is the egg-crate straightener
used in ANSI/AMCA 210; larger cell sizes made
proportionately longer could be used.
Figure 9.10B shows the star straightener used in the
ISO standard. A single splitter sheet may be used to
eliminate swirl in some cases. Straighteners are
intended to reduce swirl before or after a fan or a
process station. Do not install straighteners where
the air profile is known to be non-uniform, the
device will carry the non-uniformity further
downstream.
TURNINGVANES
TURNINGVANES
TURNINGVANES
CORRECTED PRE-ROTATING SWIRL
CORRECTED COUNTER-ROTATING SWIRL
IMPELLERROTATION
IMPELLERROTATION
Figure 9.9 - Corrections for Inlet Spin
AMCA 201-02 (R2007)
44
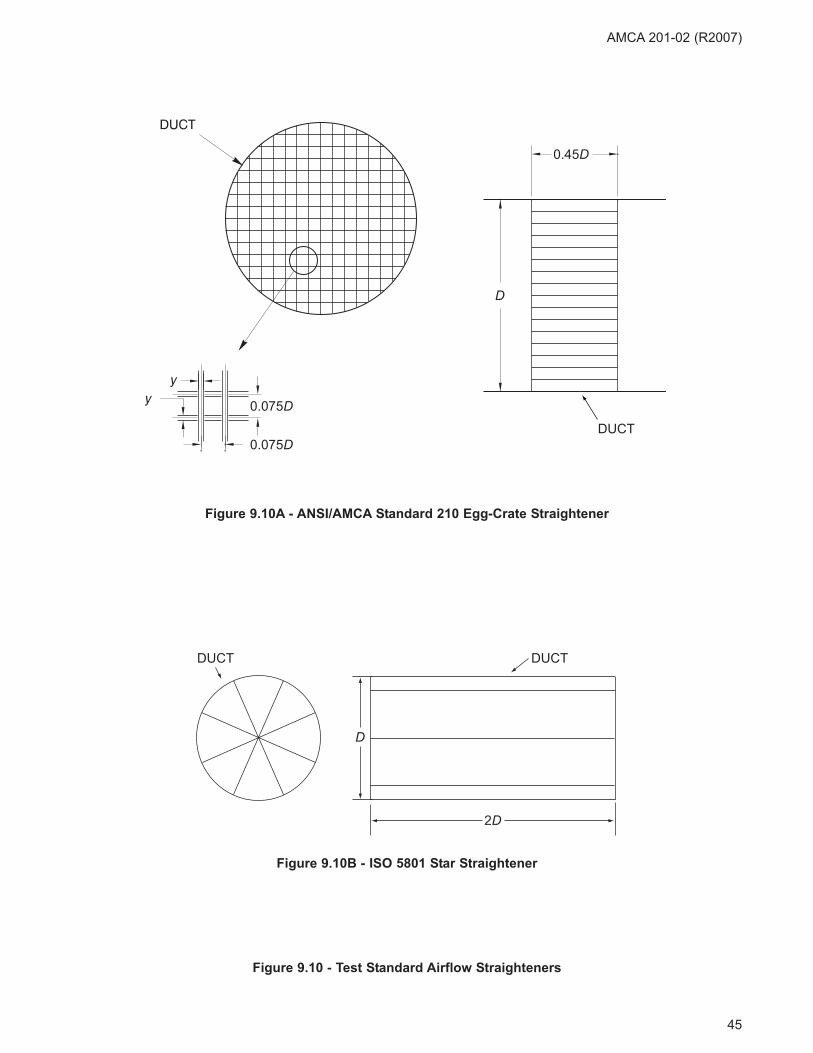
DUCT
0.075D
0.075D
D
0.45D
2D
D
DUCTDUCT
Figure 9.10B - ISO 5801 Star Straightener
Figure 9.10A - ANSI/AMCA Standard 210 Egg-Crate Straightener
Figure 9.10 - Test Standard Airflow Straighteners
AMCA 201-02 (R2007)
45

9.6 Enclosures (plenum and cabinet effects)
Fans within plenums and cabinets or next to walls
should be located so that air may flow unobstructed
into the inlets. Fan performance is reduced if the
space between the fan inlet and the enclosure is too
restrictive. It is common practice to allow at least
one-half impeller diameter between an enclosure wall
and the fan inlet. Adjacent inlets of multiple double
width centrifugal fans located in a common enclosure
should be at least one impeller diameter apart if
optimum performance is to be expected. Figure 9.11
illustrates fans with restricted inlets and their
applicable System Effect Curves.
2LL L
INLE
TD
IA.
Figure 9.11C - Centrifugal Fan Near Wall(s) Figure 9.11D - DWDI Fan Near Wall on One Side
Figure 9.11A - Fans and Plenum Figure 9.11B - Axial Fan Near Wall
EQUAL
DIAMETEROF INLET
EQUAL L
LL L L
DWDI SWSI
L - DISTANCE
INLET TO WALL
0.75 x DIA. OF INLET
0.50 x DIA. OF INLET
0.40 x DIA. OF INLET
0.30 x DIA. OF INLET
V-W
U
T
S
X
V-W
V-W
U
For Figures 9.11A, B & C
SYSTEM EFFECT CURVES
For Figures 9.11D
SYSTEM EFFECT CURVES
Determine SEF by calculating inlet velocity and using Figure 7.1
Figure 9.11 - System Effect Curves for Fans Located in Plenums and Cabinet
Enclosures and for Various Wall-to-inlet Dimensions
AMCA 201-02 (R2007)
46
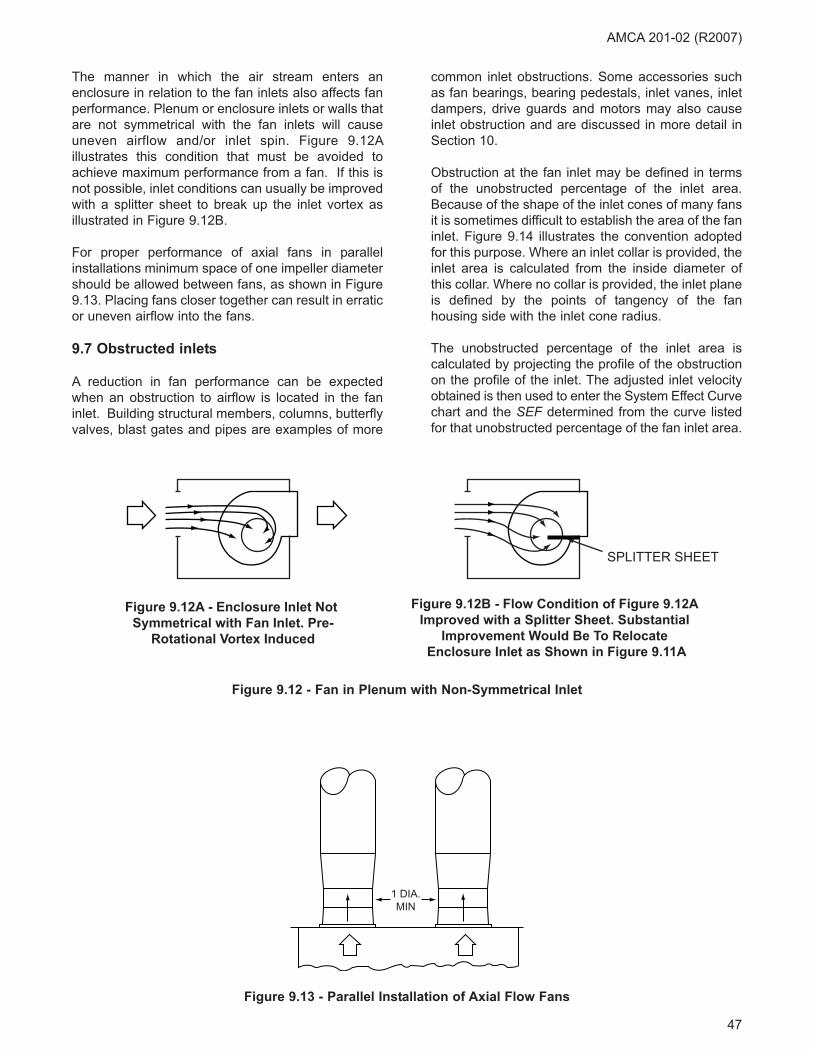
The manner in which the air stream enters an
enclosure in relation to the fan inlets also affects fan
performance. Plenum or enclosure inlets or walls that
are not symmetrical with the fan inlets will cause
uneven airflow and/or inlet spin. Figure 9.12A
illustrates this condition that must be avoided to
achieve maximum performance from a fan. If this is
not possible, inlet conditions can usually be improved
with a splitter sheet to break up the inlet vortex as
illustrated in Figure 9.12B.
For proper performance of axial fans in parallel
installations minimum space of one impeller diameter
should be allowed between fans, as shown in Figure
9.13. Placing fans closer together can result in erratic
or uneven airflow into the fans.
9.7 Obstructed inlets
A reduction in fan performance can be expected
when an obstruction to airflow is located in the fan
inlet. Building structural members, columns, butterfly
valves, blast gates and pipes are examples of more
common inlet obstructions. Some accessories such
as fan bearings, bearing pedestals, inlet vanes, inlet
dampers, drive guards and motors may also cause
inlet obstruction and are discussed in more detail in
Section 10.
Obstruction at the fan inlet may be defined in terms
of the unobstructed percentage of the inlet area.
Because of the shape of the inlet cones of many fans
it is sometimes difficult to establish the area of the fan
inlet. Figure 9.14 illustrates the convention adopted
for this purpose. Where an inlet collar is provided, the
inlet area is calculated from the inside diameter of
this collar. Where no collar is provided, the inlet plane
is defined by the points of tangency of the fan
housing side with the inlet cone radius.
The unobstructed percentage of the inlet area is
calculated by projecting the profile of the obstruction
on the profile of the inlet. The adjusted inlet velocity
obtained is then used to enter the System Effect Curve
chart and the SEF determined from the curve listed
for that unobstructed percentage of the fan inlet area.
1 DIA.MIN
Figure 9.13 - Parallel Installation of Axial Flow Fans
Figure 9.12 - Fan in Plenum with Non-Symmetrical Inlet
SPLITTER SHEET
Figure 9.12A - Enclosure Inlet Not Symmetrical with Fan Inlet. Pre-
Rotational Vortex Induced
Figure 9.12B - Flow Condition of Figure 9.12A Improved with a Splitter Sheet. Substantial
Improvement Would Be To Relocate Enclosure Inlet as Shown in Figure 9.11A
AMCA 201-02 (R2007)
47

INLET PLANE
FREE INLET AREA PLANE - FAN WITH INLET COLLAR
FREE INLET AREA PLANE - FAN WITHOUT INLET COLLAR
INSIDE DIAMETER
INLET COLLAR
POINT OF TANGENTWITH FAN HOUSING SIDEAND INLET CONE RADIUS
INLET PLANE
DIAMETER
OF TANGENT
Figure 9.14 - System Effect Curves for Inlet Obstructions
(Table based on Fans and Fan Systems, Thompson & Trickler, Chem Eng MAR83, p. 60)
System Effect Curve (Figure 7.1)
Distance from obstruction to inlet plane
Percentage of
unobstructed inlet area
0.75 Inlet
diameter
0.5 Inlet
diameter
0.33 Inlet
diameter
0.25 Inlet
diameterAt Inlet plane
100 - - - - -
95 - - X W V
90 - X V-W U-V T-U
85 X W-X V-W U-V S-T
75 W-X V U S-T R-S
50 V-W U S-T R-S Q
25 U-V T S-T Q-R P
AMCA 201-02 (R2007)
48
Table for Figure 9.14

10. Effects of Factory Supplied Accessories
Unless the manufacturer's catalog clearly states to
the contrary, it should be assumed that published fan
performance data does not include the effects of any
accessories supplied with the fan.
If possible, the necessary information should be
obtained directly from the manufacturer. The data
presented in this section are offered only as a guide
in the absence of specific data from the fan
manufacturer. See Figure 10.1 for terminology.
Cone TypeVariable
Inlet Vanes
Figure 10.1 - Common Terminology for Centrifugal Fan Appurtenances
AMCA 201-02 (R2007)
49
AMCA 201-02 (R2007)
10.1 Bearing and supports in fan inlet
Arrangement 3 and 7 fans (see Figure 3.5) require
that the fan shaft be supported by a bearing and
bearing support in the fan inlet or just adjacent to it.
These components may have an effect on the flow of
air into the fan inlet and consequently on the fan
performance, depending upon the size of the
bearings and supports in relation to the fan inlet
opening. The location of the bearing and support,
that is, whether it is located in the actual inlet or
"spaced out" from the inlet, will also have an effect.
In cases where manufacturer's performance ratings
do not include the effect of the bearings and
supports, it will be necessary to compensate for this
inlet restriction. Use the fan manufacturer's
allowance for bearings in the fan inlet if possible.
If no better data are available, use the procedures
described in Section 9.7 as an approximation.
10.2 Drive guards obstructing fan inlet
All fans have moving parts that require guarding for
safety in the same way as other moving machinery.
Fans located less than 2.1 m (7 ft) above the floor
require special consideration as specified in the
United States’ Occupational Safety and Health Act.
National, federal, state and local rules, regulations,
and codes should be carefully considered and
followed.
Arrangement 3 and 7 fans may require a belt drive
guard in the area of the fan inlet. Depending on the
design, the guard may be located in the plane of the
inlet, along the casing side sheet, or it may be
"spaced out" due to "spaced out" bearing pedestals.
In any case, depending on the location of the guard,
and on the inlet velocity, the fan performance may be
significantly affected by this obstruction. It is
desirable that a drive guard located in this position be
furnished with as much opening as possible to allow
maximum flow of air to the fan inlet.
If available, use the fan manufacturer's allowance for
drive guards obstructing the fan inlet. SEF for drive
guard obstructions situated at the inlet of a fan may
be approximated using Figure 9.14.
Where possible, open construction on guards is
recommended to allow free air passage to the fan
inlet. Guards and sheaves should be designed to
obstruct, as little of the fan inlet as possible and in no
case should the obstruction be more than 1/3 of the
fan inlet area.
10.3 Belt tube in axial fan inlet or outlet
With a belt driven axial flow fan it is usually necessary
that the fan motor be mounted outside the fan
housing (see Figure 3.7 Arrangement 9, and Annex B
Figure B.7).
To protect the belts from the airstream, and also to
prevent any air leakage through the fan housing,
manufacturers in many cases provide a belt tube.
Most manufacturers include the effects of an axial fan
belt tube in their rating tables. In cases where the
effect is not included, the appropriate SEF is
approximated by calculating the percentage of
unobstructed area of air passage way and using
Figure 9.14.
10.4 Inlet box
When an inlet box configuration is supplied by the fan
manufacturer, the fan performance should include
the effect of the inlet box.
The System Effect of fan inlet boxes can vary widely
depending upon the design. This data should be
available from the fan manufacturer. In the absence
of fan manufacturer's data, a well-designed inlet box
should approximate System Effect Curves "S" or "T"
of Figure 7.1.
10.5 Inlet box dampers
Inlet box dampers may be used to control the airflow
through the system. Either parallel or opposed blades
may be used (see Figure 10.1).
The parallel blade type is installed with the blades
parallel to the fan shaft so that, in a partially closed
position, a forced inlet vortex will be generated. The
effect on the fan characteristics will be similar to that
of a variable inlet vane control.
The opposed blade type is used to control airflow by
the addition of pressure loss created by the damper
in a partially closed position.
If possible, complete data should be obtained from
the fan manufacturer giving the System Effect of the
inlet box and damper pressure drop over the range of
application. If data are not available, System Effect
Curves "S" or "T" from Figure 7.1 should be applied
for the inlet box and pressure loss from the damper
manufacturer for the damper in making the fan
selection.
50
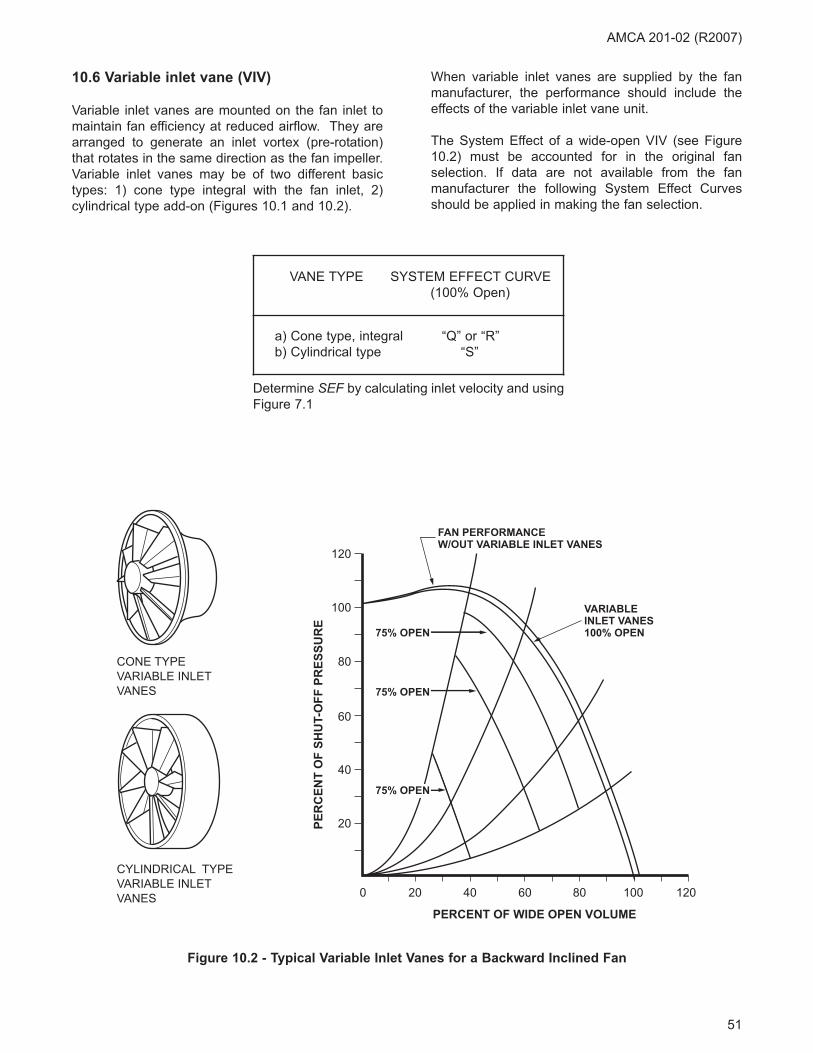
10.6 Variable inlet vane (VIV)
Variable inlet vanes are mounted on the fan inlet to
maintain fan efficiency at reduced airflow. They are
arranged to generate an inlet vortex (pre-rotation)
that rotates in the same direction as the fan impeller.
Variable inlet vanes may be of two different basic
types: 1) cone type integral with the fan inlet, 2)
cylindrical type add-on (Figures 10.1 and 10.2).
When variable inlet vanes are supplied by the fan
manufacturer, the performance should include the
effects of the variable inlet vane unit.
The System Effect of a wide-open VIV (see Figure
10.2) must be accounted for in the original fan
selection. If data are not available from the fan
manufacturer the following System Effect Curves
should be applied in making the fan selection.
20
0 20 40 60 80 100 120
40
60
80
100
120
PERCENT OF WIDE OPEN VOLUME
PE
RC
EN
T O
F S
HU
T-O
FF
PR
ES
SU
RE
75% OPEN
75% OPEN
75% OPEN
FAN PERFORMANCEW/OUT VARIABLE INLET VANES
VARIABLE INLET VANES100% OPEN
CONE TYPE
VARIABLE INLET
VANES
CYLINDRICAL TYPE
VARIABLE INLET
VANES
Figure 10.2 - Typical Variable Inlet Vanes for a Backward Inclined Fan
VANE TYPE SYSTEM EFFECT CURVE
(100% Open)
a) Cone type, integral “Q” or “R”
b) Cylindrical type “S”
Determine SEF by calculating inlet velocity and using
Figure 7.1
AMCA 201-02 (R2007)
51

Annex A. SI / I-P Conversion Table (Informative)
Taken from AMCA 99-0100
Quantity I-P to SI SI to I-P
Length (ft) 0.3048 = m (m) 3.2808 = ft
Mass (weight) (lbs) 0.4536 = kg (kg) 2.2046 = lbs.
Time The unit of time is the second in both systems
Velocity(ft-s) 0.3048 = ms
(ft/min) 0.00508 = ms
(ms) 3.2808 = ft-s
(ms) 196.85 = ft/min
Acceleration (in./s2) 0.0254 = m/s2 (m/s2) 39.370 = in./s2
Area (ft2) 0.09290 = m2 (m2) 10.764 = ft2
Volume Flow Rate (cfm) 0.000471948 = m3/s (m3/s) 2118.88 = cfm
Density (lb/ft3) 16.01846 = kg/m3 (kg/m3) 0.06243 = lb/ft3
Pressure
(in. wg) 248.36 = Pa
(in. wg) 0.24836 = kPa
(in. Hg) 3.3864 = kPa
(Pa) 0.004026 = in. wg
(kPa) 4.0264 = in. wg
(kPa) 0.2953 = in. Hg
Viscosity:
Absolute
Kinematic
(lbm/ft-s) 1.4882 = Pa s
(ft2/s) 0.0929 = m2/s
(Pa s) 0.6719 = (lbm/ft-s)
(m2/s) 10.7639 = ft2/s
Gas Constant (ft lb/lbm-°R) 5.3803 = J-kg/K (j-kg/K) 0.1858 = (ft lb/lbm-°R)
Temperature (°F - 32°)/1.8 = °C (1.8 × °C) + 32° = °F
Power (BHP) 746 = W
(BHP) 0.746 = kW
(W)/746 = BHP
(kW)/0.746 = BHP
AMCA 201-02 (R2007)
52
AMCA 201-02 (R2007)
Annex B. Dual Fan Systems - Series and
Parallel
It is sometimes necessary to install two or more fans
in systems that require higher pressures or airflow
than would be attainable with a single fan. Two fans
may offer a space, cost, or control advantage over a
single larger fan, or it may be simply a field
modification of an existing system to boost pressure
or airflow.
B.1 Fans operating in series
To obtain a system pressure boost, fans are often
installed in series. The fans may be mounted as close
as the outlet of one fan directly attached to the inlet
of the next fan, or they may be placed in remote
locations with considerable distance between fans.
The fans must handle the same mass airflow,
assuming no loss or gains between stages. The
combined total pressure will then be the sum of each
fan’s total pressure (Figure B.1). The velocity
pressure corresponds to the air velocity at the outlet
of the last fan stage. The static pressure for the
combination is the total pressure minus the velocity
pressure and is not the sum of the individual fan
static pressures.
In practice there is some reduction in airflow due to
the increased air density in the later fan stage(s).
There can also be significant loss of airflow due to
non-uniform airflow into the inlet of the next fan.
Sometimes multiple impellers are assembled in a
single housing and this assembly is known as a
“multi-stage” fan. This combination is seldom used in
conventional ventilating and air conditioning systems
but it is not uncommon in special industrial systems.
It is advisable to request the fan manufacturer to
review the proposed system design and make some
estimate of its installed performance.
B.2 Fans operating in parallel
Suppliers of air handling equipment and designers of
custom systems commonly incorporate two identical,
in parallel fans to deliver large volumes of air while
taking advantage of the space savings offered by
using two smaller fans.
These types of systems normally have common inlet
and outlet sections, or they may have individual ducts
of equal resistance that join together at equal
velocities. In either case, the characteristic curve is
the sum of the separate airflows for a given static or
total pressure (Figure B.2).
The total performance of the multiple fans will be less
than the theoretical sum if inlet conditions are
restricted or the airflow into the inlets is not straight
(see Section 9.6). Also, adding a parallel fan to an
existing system without modifying the resistance
(larger ducts, etc.) will result in lower than anticipated
airflow due to increased system resistance.
Fans that have a “positive” slope in the pressure-
volume curve to the left of the peak pressure curve,
typical of some axial and forward curved centrifugal
fans (see Figure 4.2), can experience unstable
operation under certain conditions. If fans are
operated in parallel in the region of this “positive”
slope, multiple operating conditions may occur.
Figure B.2 illustrates the combined pressure-volume
curve of two such fans operating in parallel.
The closed loop to the left of the peak pressure point
is the result of plotting all the possible combinations
of volume airflow at each pressure. If the system
curve intersects the combined volume-pressure
curve in the area enclosed by the loop, more than
one point of operation is possible. This may cause
one of the fans to handle more of the air and could
cause a motor overload if the fans are individually
driven. This unbalanced airflow condition tends to
reverse readily with the result that the fans will
intermittently load and unload. This "pulsing" often
generates noise and vibration and may cause
damage to the fans, ductwork or driving motors.
Aileron controls in forward curved fan outlets or
dampers near the inlets or outlets may be used to
correct unbalanced airflow or to eliminate pulsations
or reversing operation (See Figure B.3).
53

100%
100%
200%
PERCENT OF FAN AIRFLOW
PE
RC
EN
T O
F F
AN
STA
TIC
PR
ES
SU
RE
SYSTEMRESISTANCE
SERIES FANCOMBINEDPRESSURE CURVE
SINGLE FANPRESSURE CURVE
Figure B.1 - Typical Characteristic Curve of Two Fans Operating in Series
AMCA 201-02 (R2007)
54

55
AMCA 201-02 (R2007)
PERCENT OF FAN AIRFLOW
PE
RC
EN
T O
F F
AN
STA
TIC
PR
ES
SU
RE
200
100
FAN OPERATION NOTRECOMMENDED IN THISRANGE
PARALLEL FANS - FAN PRESSURE ATCOMBINED VOLUME
SINGLE FAN -PRESSURECURVE
UN
STA
BL
E S
YS
TE
M
STA
BL
E S
YS
TE
M
Figure B.2 - Parallel Fan Operation
AILERON
Figure B.3 - Aileron Control
56
Annex C. Definitions and Terminology
C.1 The air
C.1.1 Air velocity. The velocity of an air stream is its
rate of motion, expressed in m/s (fpm). The velocity
at a plane (Vx) is the average velocity throughout the
entire area of the plane.
C.1.2 Airflow. The airflow at a plane (Qx) is the rate
of airflow, expressed in m3/s (cfm) and is the product
of the average velocity at the plane and the area of
the plane.
C.1.3 Barometric pressure. Barometric pressure
(pb) is the absolute pressure exerted by the
atmosphere at a location of measurement (per AMCA99-0066).
C.1.4 Pressure-static. Static pressure is the portion
of the air pressure that exists by virtue of the degree
of compression only. If expressed as gauge pressure,
it may be negative or positive (per AMCA 99-0066).
Static pressure at a specific plane (Psx) is the
arithmetic average of the gauge static pressures as
measured at specific points in the traverse of the
plane.
C.1.5 Pressure-velocity. Velocity pressure is that
portion of the air pressure which exists by virtue of
the rate of motion only. It is always positive (perAMCA 99-0066).
Velocity pressure at a specific plane (Pvx) is the
square of the arithmetic average of the square roots
of the velocity pressures as measured at specific
points in the traverse plane.
C.1.6 Pressure-total. Total pressure is the air
pressure that exists by virtue of the degree of
compression and the rate of motion. It is the
algebraic sum of the velocity pressure and the static
pressure at a point. Thus if the air is at rest, the total
pressure will equal the static pressure (per AMCA 99-0066).
Total pressure at a specific plane (Ptx) is the algebraic
sum of the static pressure and the velocity pressure
at that plane.
C.1.7 Standard air density. A density of 1.2 kg/m3
(0.075 lbm/ft3) corresponding approximately to air at
20°C (68°F), 101.325 kPa (29.92 in. Hg) and 50%
relative humidity (per AMCA 99-0066).
C.1.8 Temperature. The dry-bulb temperature (td) isthe air temperature measured by a dry temperature
sensor. Temperatures relating to air density are
usually referenced to the fan inlet.
The wet-bulb temperature (tw) is the temperature
measured by a temperature sensor covered by a
water-moistened wick and exposed to air in motion.
Readings shall be taken only under conditions that
assure an air velocity of 3.6 to 10.2 m/s (700 to 2000
ft/min) over the wet-bulb and only after sufficient time
has elapsed for evaporative equilibrium to be
attained.
Wet bulb depression is the difference between dry-
bulb and wet-bulb temperatures (td - tw) at the same
location.
C.2 The fan
C.2.1 Blast area. The blast area of a centrifugal fan
is the fan outlet area less the projected area of the
cutoff; see Figure B.6 (per AMCA 99-0066).
C.2.2 Inlet area. The fan inlet area (A1) is the gross
inside area of the fan inlet (see Figure 9.14).
C.2.3 Outlet area. The fan outlet area (A2) is the
gross inside area of the fan outlet.
C.2.4 Fan. (1) A device, which utilizes a power-drive
rotating impeller for moving air or gases. The internal
energy (enthalpy) increase imparted by a fan to a gas
does not exceed 25 kJ/kg (10.75 BTU/lbm). (2) A
device having a power-driven rotating impeller
without a housing for circulating air in a room (perAMCA 99-0066).
The volume airflow of a fan (Q) is the rate of airflow
in m3/s (cfm) expressed at the fan inlet conditions.
C.2.5 Fan impeller diameter. The fan impeller
diameter is the maximum diameter measured over
the impeller blades.
C.2.6 Fan total pressure. Fan total Pressure (Pt) is
the difference between the total pressure at the fan
outlet and the total pressure at the fan inlet. Pt = Pt1 -
Pt2 (Algebraic).
Ignoring the losses that exist between the planes of
measurement and the fan, Figures C.1, C.2 and C.3
illustrate fan total pressures for three basic
arrangements for fans connected to external
systems.
AMCA 201-02 (R2007)
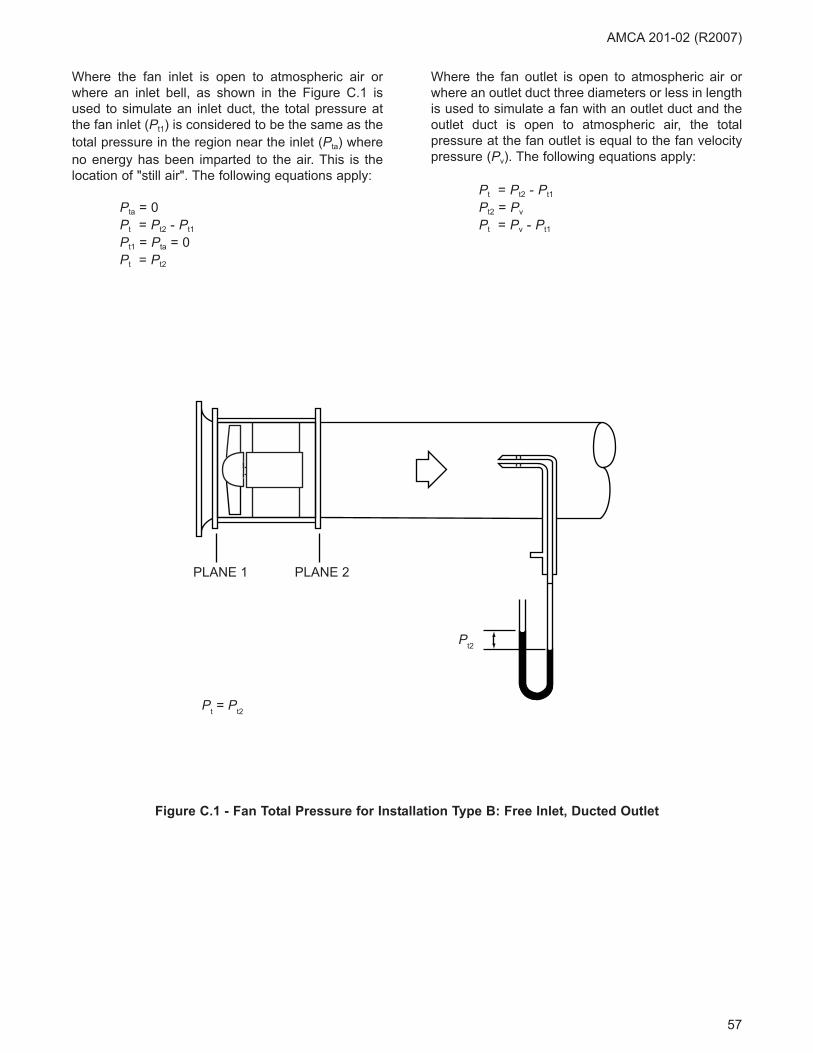
57
AMCA 201-02 (R2007)
Where the fan inlet is open to atmospheric air or
where an inlet bell, as shown in the Figure C.1 is
used to simulate an inlet duct, the total pressure at
the fan inlet (Pt1) is considered to be the same as the
total pressure in the region near the inlet (Pta) where
no energy has been imparted to the air. This is the
location of "still air". The following equations apply:
Pta = 0
Pt = Pt2 - Pt1
Pt1 = Pta = 0
Pt = Pt2
Where the fan outlet is open to atmospheric air or
where an outlet duct three diameters or less in length
is used to simulate a fan with an outlet duct and the
outlet duct is open to atmospheric air, the total
pressure at the fan outlet is equal to the fan velocity
pressure (Pv). The following equations apply:
Pt = Pt2 - Pt1
Pt2 = Pv
Pt = Pv - Pt1
PLANE 2PLANE 1
Pt2
Pt = Pt2
Figure C.1 - Fan Total Pressure for Installation Type B: Free Inlet, Ducted Outlet
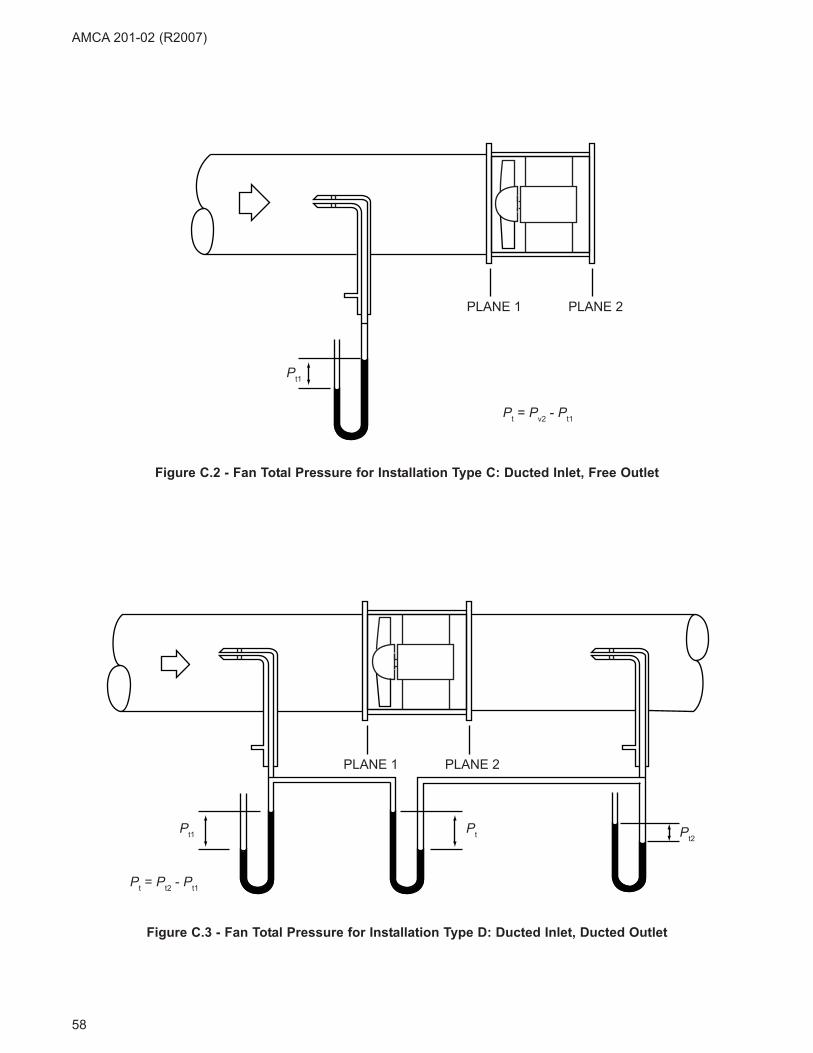
58
AMCA 201-02 (R2007)
PLANE 2PLANE 1
Pt1
Pt = Pv2 - Pt1
Figure C.2 - Fan Total Pressure for Installation Type C: Ducted Inlet, Free Outlet
Figure C.3 - Fan Total Pressure for Installation Type D: Ducted Inlet, Ducted Outlet
PLANE 2PLANE 1
Pt2Pt1
Pt = Pt2 - Pt1
Pt

59
AMCA 201-02 (R2007)
PLANE 2PLANE 1
Pv2
Pv = Pv2
Figure C.4 - Fan Velocity Pressure for Installation Type B: Free Inlet, Ducted Outlet
C.2.7 Fan velocity pressure. Fan velocity pressure
(Pv) is the pressure corresponding to the average air
velocity at the fan outlet. Pv = Pv2
Assuming no change in air density or area between
the plane of measurement and the fan outlet, Figure
C.4 illustrates fan velocity pressure.
C.2.8 Fan static pressure. The difference between
the fan total pressure and the fan velocity pressure.
Therefore, fan static pressure is the difference
between the static pressure at a fan outlet and the
total pressure at a fan inlet (per AMCA 99-0066).
Ps = Pt - Pv
Ignoring losses between the planes of measurement
and the fan, Figure C.5 illustrates the fan static
pressure for a fan with ducted inlet and outlet.
Ps = Ps2 - Ps1 - Pv1 (Algebraic)
Where the fan inlet is open to atmospheric air, (free
inlet, ducted outlet), the fan static pressure (Ps) is
equal to the static pressure at the fan outlet.
Ps = Ps2
Where the fan outlet is open to atmospheric air
(ducted inlet, free outlet), ignoring the SEF, the fan
static pressure (Ps) is equal to the inlet static
pressure (Ps1) less the inlet velocity pressure (Pv1).
Ps = -Ps1 - Pv1
Ps = -(-Ps1) - Pv1
Ps = Ps1 - Pv1
C.3 The system
C.3.1 Equivalent duct diameter. The diameter of a
circle having the same area as another geometric
shape. For a rectangular cross-section duct with
width (a) and height (b), the equivalent diameter is:
(4ab/π)0.5 (per AMCA 99-0066).
C.3.2 Fan performance. Fan performance is a
statement of the volume airflow, static or total
pressure, speed and power input at a stated inlet
density and may include total and static efficiencies.
C.3.3 Fan performance curve. Of the many forms of
fan performance curves, generally all convey
information sufficient to determine fan performance
as defined above. In this manual, ‘fan performance
curve’ refers to the constant speed performance
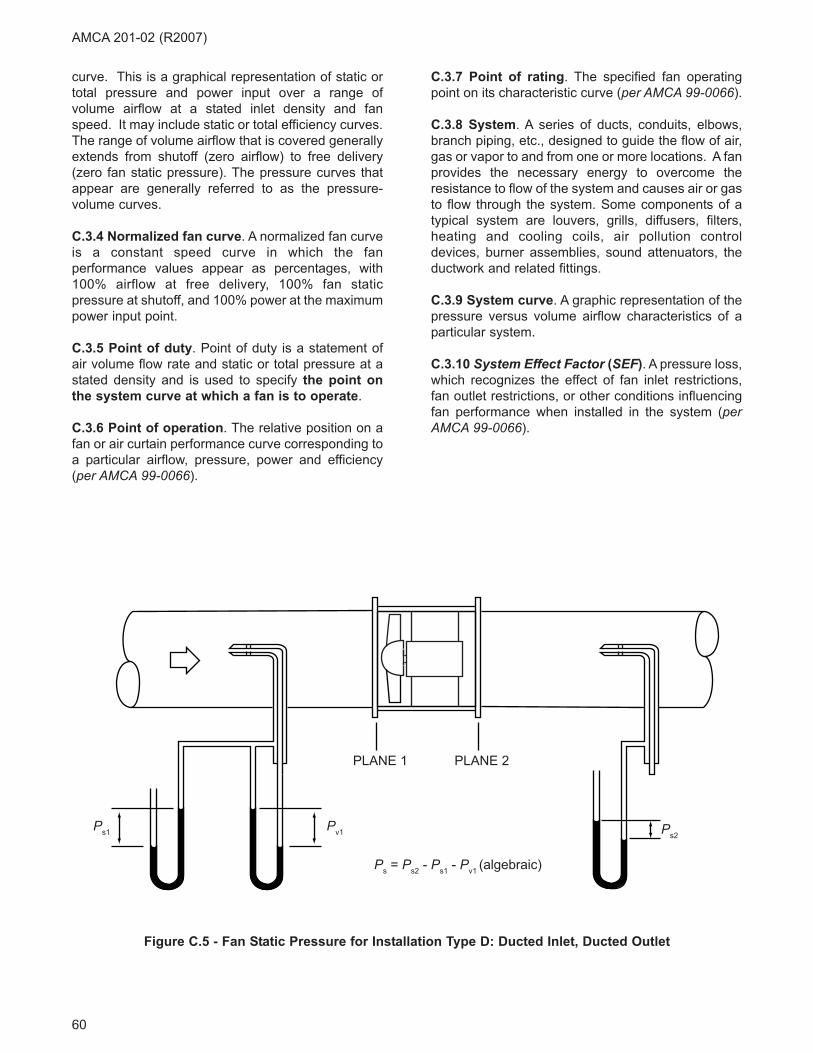
60
AMCA 201-02 (R2007)
curve. This is a graphical representation of static or
total pressure and power input over a range of
volume airflow at a stated inlet density and fan
speed. It may include static or total efficiency curves.
The range of volume airflow that is covered generally
extends from shutoff (zero airflow) to free delivery
(zero fan static pressure). The pressure curves that
appear are generally referred to as the pressure-
volume curves.
C.3.4 Normalized fan curve. A normalized fan curve
is a constant speed curve in which the fan
performance values appear as percentages, with
100% airflow at free delivery, 100% fan static
pressure at shutoff, and 100% power at the maximum
power input point.
C.3.5 Point of duty. Point of duty is a statement of
air volume flow rate and static or total pressure at a
stated density and is used to specify the point on
the system curve at which a fan is to operate.
C.3.6 Point of operation. The relative position on a
fan or air curtain performance curve corresponding to
a particular airflow, pressure, power and efficiency
(per AMCA 99-0066).
C.3.7 Point of rating. The specified fan operating
point on its characteristic curve (per AMCA 99-0066).
C.3.8 System. A series of ducts, conduits, elbows,
branch piping, etc., designed to guide the flow of air,
gas or vapor to and from one or more locations. A fan
provides the necessary energy to overcome the
resistance to flow of the system and causes air or gas
to flow through the system. Some components of a
typical system are louvers, grills, diffusers, filters,
heating and cooling coils, air pollution control
devices, burner assemblies, sound attenuators, the
ductwork and related fittings.
C.3.9 System curve. A graphic representation of the
pressure versus volume airflow characteristics of a
particular system.
C.3.10 System Effect Factor (SEF). A pressure loss,
which recognizes the effect of fan inlet restrictions,
fan outlet restrictions, or other conditions influencing
fan performance when installed in the system (perAMCA 99-0066).
Figure C.5 - Fan Static Pressure for Installation Type D: Ducted Inlet, Ducted Outlet
PLANE 2PLANE 1
Ps2Pv1Ps1
Ps = Ps2 - Ps1 - Pv1 (algebraic)

61
AMCA 201-02 (R2007)
HOUSING
DIVERTER
CENTER PLATE
SIDE SHEET
CUT OFF
BEARINGSUPPORT
INLET COLLAR
INLET
BLADE
BACKPLATE
IMPELLER
RIM
CUT OFF
BLAST AREADISCHARGE
OUTLET AREA
SCROLL
FRAME
Figure C.6 - Terminology for Centrifugal Fan Components

62
AMCA 201-02 (R2007)
BELT TUBE
CASING
BEARING CASING
BLADE
HUB
IMPELLER
GUIDE VANE
Figure C.7C - Vaneaxial Fan-Belt Drive
Figure C.7B - Tubeaxial Fan-Direct Drive (Impeller Downstream)
DIFFUSERBLADE
HUB
IMPELLER
INLET BELL
CASING
MOTOR
Figure C.7A - Tubular Centrifugal Fan-Direct Drive
INLET
BACKPLATERIM
HUB
IMPELLER
BLADEGUIDE VANE
MOTOR
CASING
Figure C.7 - Terminology for Axial and Tubular Centrifugal Fans
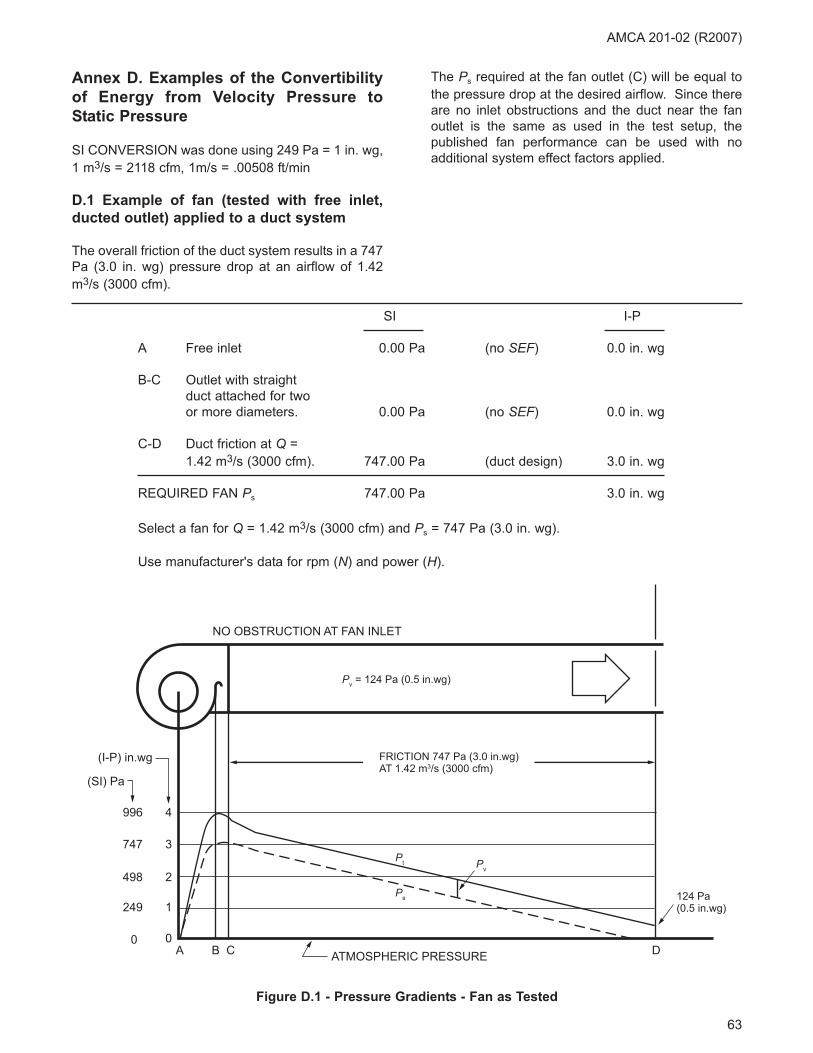
63
AMCA 201-02 (R2007)
Annex D. Examples of the Convertibility
of Energy from Velocity Pressure to
Static Pressure
SI CONVERSION was done using 249 Pa = 1 in. wg,
1 m3/s = 2118 cfm, 1m/s = .00508 ft/min
D.1 Example of fan (tested with free inlet,
ducted outlet) applied to a duct system
The overall friction of the duct system results in a 747
Pa (3.0 in. wg) pressure drop at an airflow of 1.42
m3/s (3000 cfm).
The Ps required at the fan outlet (C) will be equal to
the pressure drop at the desired airflow. Since there
are no inlet obstructions and the duct near the fan
outlet is the same as used in the test setup, the
published fan performance can be used with no
additional system effect factors applied.
SI I-P
A Free inlet 0.00 Pa (no SEF) 0.0 in. wg
B-C Outlet with straight
duct attached for two
or more diameters. 0.00 Pa (no SEF) 0.0 in. wg
C-D Duct friction at Q =
1.42 m3/s (3000 cfm). 747.00 Pa (duct design) 3.0 in. wg
REQUIRED FAN Ps 747.00 Pa 3.0 in. wg
Select a fan for Q = 1.42 m3/s (3000 cfm) and Ps = 747 Pa (3.0 in. wg).
Use manufacturer's data for rpm (N) and power (H).
NO OBSTRUCTION AT FAN INLET
ATMOSPHERIC PRESSURE
0
1
2
3
4
0
249
498
747
996
Pt
Ps
Pv
Pv = 124 Pa (0.5 in.wg)
FRICTION 747 Pa (3.0 in.wg)AT 1.42 m3/s (3000 cfm)
A B C D
(I-P) in.wg
(SI) Pa
124 Pa(0.5 in.wg)
Figure D.1 - Pressure Gradients - Fan as Tested
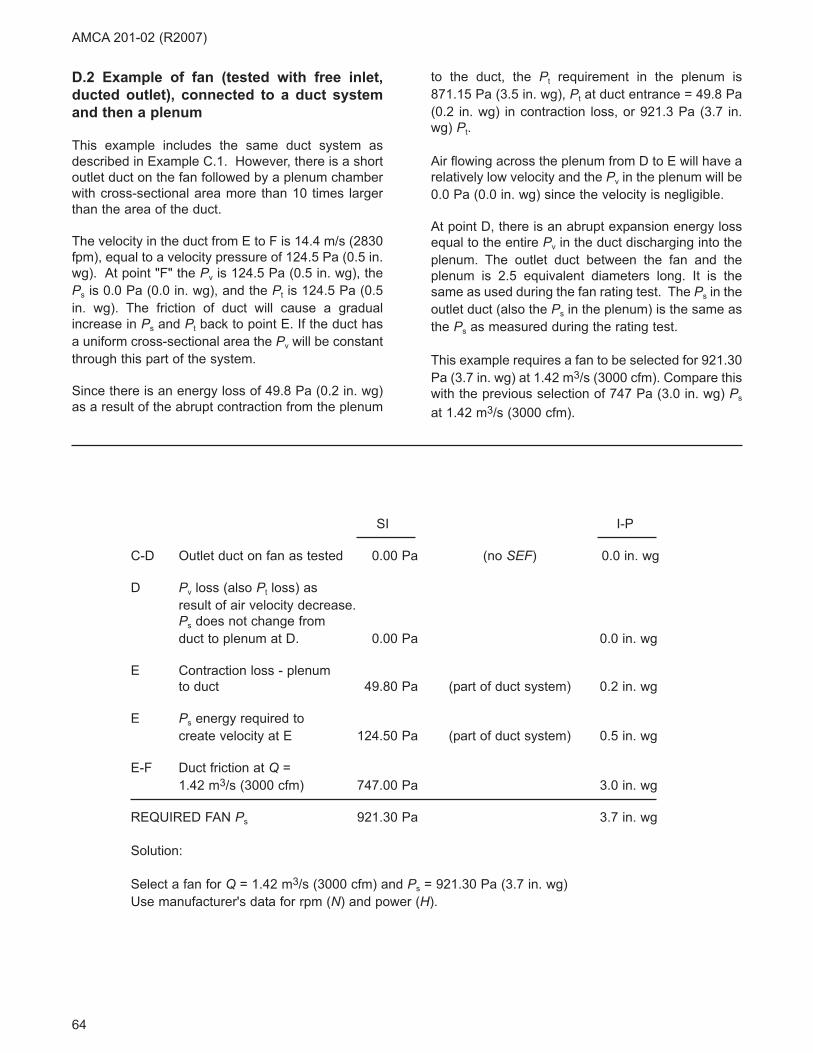
64
AMCA 201-02 (R2007)
SI I-P
C-D Outlet duct on fan as tested 0.00 Pa (no SEF) 0.0 in. wg
D Pv loss (also Pt loss) as
result of air velocity decrease.
Ps does not change from
duct to plenum at D. 0.00 Pa 0.0 in. wg
E Contraction loss - plenum
to duct 49.80 Pa (part of duct system) 0.2 in. wg
E Ps energy required to
create velocity at E 124.50 Pa (part of duct system) 0.5 in. wg
E-F Duct friction at Q =
1.42 m3/s (3000 cfm) 747.00 Pa 3.0 in. wg
REQUIRED FAN Ps 921.30 Pa 3.7 in. wg
Solution:
Select a fan for Q = 1.42 m3/s (3000 cfm) and Ps = 921.30 Pa (3.7 in. wg)
Use manufacturer's data for rpm (N) and power (H).
D.2 Example of fan (tested with free inlet,
ducted outlet), connected to a duct system
and then a plenum
This example includes the same duct system as
described in Example C.1. However, there is a short
outlet duct on the fan followed by a plenum chamber
with cross-sectional area more than 10 times larger
than the area of the duct.
The velocity in the duct from E to F is 14.4 m/s (2830
fpm), equal to a velocity pressure of 124.5 Pa (0.5 in.
wg). At point "F" the Pv is 124.5 Pa (0.5 in. wg), the
Ps is 0.0 Pa (0.0 in. wg), and the Pt is 124.5 Pa (0.5
in. wg). The friction of duct will cause a gradual
increase in Ps and Pt back to point E. If the duct has
a uniform cross-sectional area the Pv will be constant
through this part of the system.
Since there is an energy loss of 49.8 Pa (0.2 in. wg)
as a result of the abrupt contraction from the plenum
to the duct, the Pt requirement in the plenum is
871.15 Pa (3.5 in. wg), Pt at duct entrance = 49.8 Pa
(0.2 in. wg) in contraction loss, or 921.3 Pa (3.7 in.
wg) Pt.
Air flowing across the plenum from D to E will have a
relatively low velocity and the Pv in the plenum will be
0.0 Pa (0.0 in. wg) since the velocity is negligible.
At point D, there is an abrupt expansion energy loss
equal to the entire Pv in the duct discharging into the
plenum. The outlet duct between the fan and the
plenum is 2.5 equivalent diameters long. It is the
same as used during the fan rating test. The Ps in the
outlet duct (also the Ps in the plenum) is the same as
the Ps as measured during the rating test.
This example requires a fan to be selected for 921.30
Pa (3.7 in. wg) at 1.42 m3/s (3000 cfm). Compare this
with the previous selection of 747 Pa (3.0 in. wg) Ps
at 1.42 m3/s (3000 cfm).
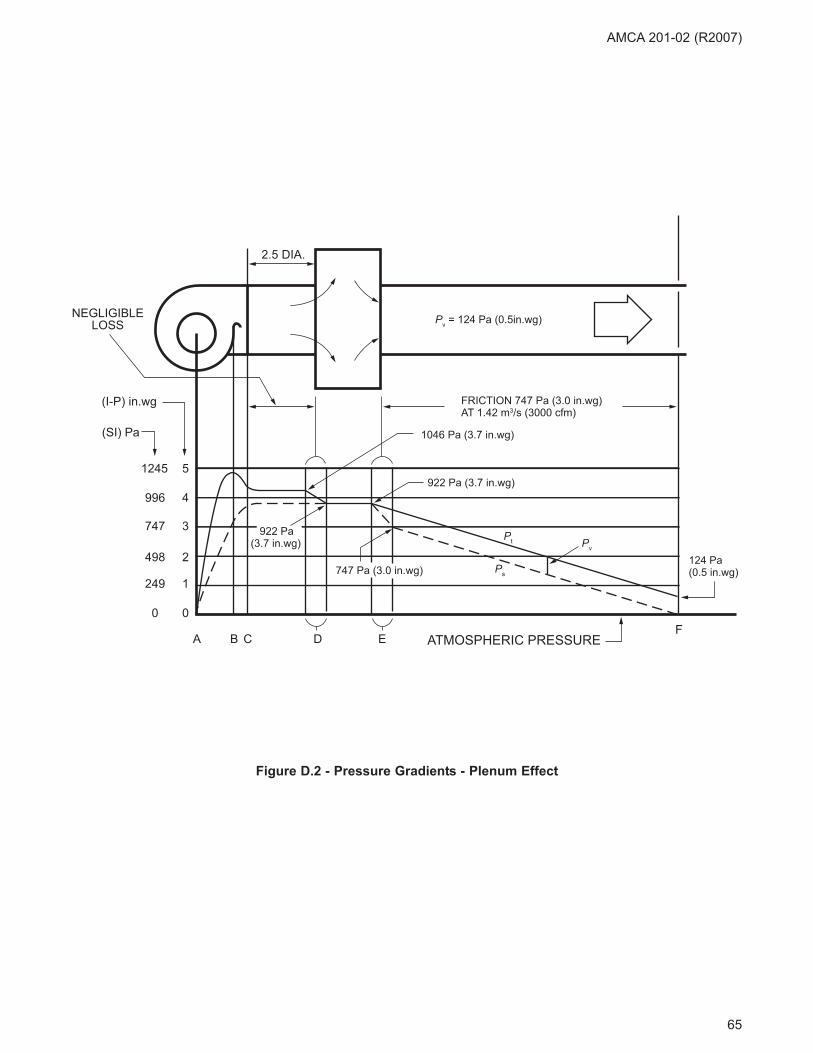
65
AMCA 201-02 (R2007)
FRICTION 747 Pa (3.0 in.wg)AT 1.42 m3/s (3000 cfm)
ATMOSPHERIC PRESSURE
5
4
3
2
1
0
1245
996
747
498
249
0
Pt
Ps
Pv
Pv = 124 Pa (0.5in.wg)
1046 Pa (3.7 in.wg)
922 Pa (3.7 in.wg)
747 Pa (3.0 in.wg)
922 Pa (3.7 in.wg)
A B C D EF
(I-P) in.wg
(SI) Pa
124 Pa(0.5 in.wg)
NEGLIGIBLELOSS
2.5 DIA.
Figure D.2 - Pressure Gradients - Plenum Effect

66
AMCA 201-02 (R2007)
D.3 Example of fan with free inlet, free outlet
- fan discharges directly into plenum and
then to duct system (abrupt expansion at fan
outlet)
This example is similar to the plenum effect example
except the duct at the fan outlet has been omitted.
The fan discharges directly into the plenum.
It may seem unreasonable that the System Effect
loss at the fan outlet is greater than the defined fan
outlet velocity. Fans with cutoffs must generate
higher velocities at the cutoff plane (blast area) than
in the outlet duct (outlet area). This higher velocity
(at cutoff) is partially converted to Ps when outlet
ducts are used as on fan tests. When fans with
cutoffs are "bulk-headed" into plenums or discharge
directly into the atmosphere as with exhausters, all
the velocity energy is lost. In these applications, the
energy loss and the System Effect Factor may
exceed the fan outlet velocity pressure as defined in
terms of "fan outlet area".
The SEF for fans without outlet duct was obtained as
follows:
GIVEN:
Fan outlet velocity = 14.4 m/s
(2830 fpm) No outlet duct
System Effect Curve = R-S, (from Figure 8.3)
SEF = 149.4 Pa (0.6 in. wg), (from Figure 7.1) at 14.4
m/s (2830 fpm) velocity and system curve R)
Fan Blast AreaOutlet Area
= 0 6.
SI I-P
B-C SEF 149.40 Pa 0.6 in. wg
(see above)
B-C Pv loss (also Pt loss) as
result of air velocity decrease.
Ps does not change from
duct to plenum at C 0.00 Pa 0.0 in. wg
D contraction loss - plenum
to duct 49.80 Pa (part of duct system) 0.2 in. wg
D Ps energy required to
create velocity at D 124.50 Pa (part of duct system) 0.5 in. wg
D-E duct friction at Q =
1.42 m3/s (3000 cfm) 747.00 Pa (duct design) 3.0 in. wg
REQUIRED FAN Ps 1070.70 Pa 4.3 in. wg
Solution:
Select a fan for 1.42 m3/s (3000 cfm) Q and 1070.70 Pa (4.3 in. wg) Ps.
Use manufacturer's data for rpm (N) and power (H).

67
AMCA 201-02 (R2007)
FRICTION 747 Pa (3.0 in.wg)AT 1.42 m3/s (3000 cfm)
ATMOSPHERIC PRESSURE
5
4
3
2
1
0
1245
996
747
498
249
0
Pt
Ps
Pv
Pv = 124 Pa (0.5 in.wg)
922 Pa (3.7 in.wg)
872 Pa (3.5 in.wg)
747 Pa (3.0 in.wg)
149 Pa (0.6 in.wg) SEF
A B C D E
(I-P) in.wg
(SI) Pa
124 Pa (0.5 in.wg)
Figure D.3 - Pressure Gradients - Abrupt Expansion at Fan Outlet
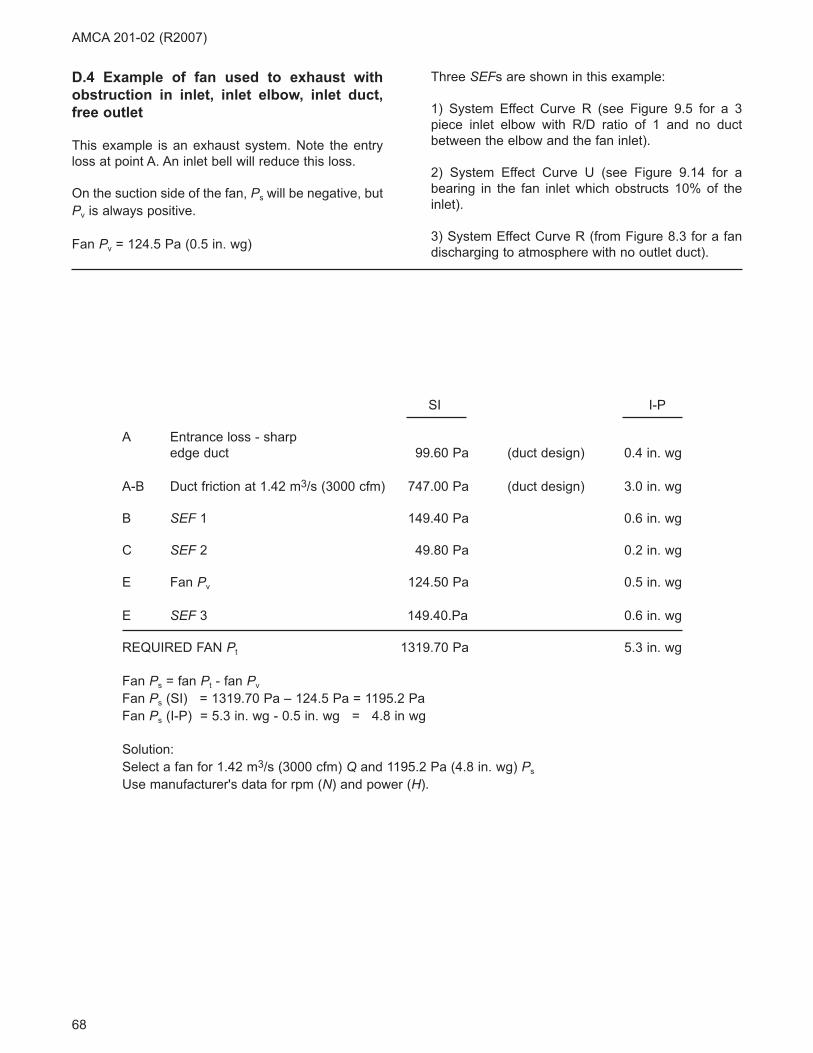
68
AMCA 201-02 (R2007)
SI I-P
A Entrance loss - sharp
edge duct 99.60 Pa (duct design) 0.4 in. wg
A-B Duct friction at 1.42 m3/s (3000 cfm) 747.00 Pa (duct design) 3.0 in. wg
B SEF 1 149.40 Pa 0.6 in. wg
C SEF 2 49.80 Pa 0.2 in. wg
E Fan Pv 124.50 Pa 0.5 in. wg
E SEF 3 149.40.Pa 0.6 in. wg
REQUIRED FAN Pt 1319.70 Pa 5.3 in. wg
Fan Ps = fan Pt - fan Pv
Fan Ps (SI) = 1319.70 Pa – 124.5 Pa = 1195.2 Pa
Fan Ps (I-P) = 5.3 in. wg - 0.5 in. wg = 4.8 in wg
Solution:
Select a fan for 1.42 m3/s (3000 cfm) Q and 1195.2 Pa (4.8 in. wg) Ps
Use manufacturer's data for rpm (N) and power (H).
D.4 Example of fan used to exhaust with
obstruction in inlet, inlet elbow, inlet duct,
free outlet
This example is an exhaust system. Note the entry
loss at point A. An inlet bell will reduce this loss.
On the suction side of the fan, Ps will be negative, but
Pv is always positive.
Fan Pv = 124.5 Pa (0.5 in. wg)
Three SEFs are shown in this example:
1) System Effect Curve R (see Figure 9.5 for a 3
piece inlet elbow with R/D ratio of 1 and no duct
between the elbow and the fan inlet).
2) System Effect Curve U (see Figure 9.14 for a
bearing in the fan inlet which obstructs 10% of the
inlet).
3) System Effect Curve R (from Figure 8.3 for a fan
discharging to atmosphere with no outlet duct).

69
AMCA 201-02 (R2007)
FRICTION 747 Pa (3.0 in.wg)AT 1.42 m3/s (3000 cfm)
ATMOSPHERIC PRESSURE
FAN INLET
-5
-4
-3
-2
-1
0
+1
-1245
-996
-747
-498
-249
0
+249
Pv
Pt
Ps
149 Pa (0.6 in.wg)ELBOW SEF
50 Pa (0.2 in.wg)OBSTRUCTION SEF
149 Pa (0.6 in.wg)
REQUIRED
149 Pa (0.6 in.wg)
ABRUPTDISCHARGE SEF P
v = 124 Pa (0.5 in.wg)
100 Pa (0.4 in.wg)
-847 Pa (-3.4 in.wg)
-996 Pa (4.0 in.wg)
-971 Pa (3.9 in.wg)
-1121 Pa (4.5 in.wg)
-1171 Pa (4.7 in.wg)
224 Pa (0.9 in.wg)
C D E
(I-P) in.wg
(SI) Pa
BA
Figure D.4 - Pressure Gradients - Exhaust System
Annex E. References
These references contain additional information related to the subject of this manual:
1. ANSI/AMCA 210-99, Laboratory Methods of Testing Fans for Aerodynamic Performance Rating, Air Movementand Control Association International, Inc., 30 West University Drive, Arlington Heights, IL, 60004-1893 U.S.A.,1999.
2. AMCA Publication 200-95, Air Systems, Air Movement and Control Association International, Inc., 30 WestUniversity Drive, Arlington Heights, IL, 60004-1893 U.S.A., 1995.
3. AMCA Publication 202-98, Troubleshooting, Air Movement and Control Association International, Inc., 30 WestUniversity Drive, Arlington Heights, IL, 60004-1893 U.S.A., 1997.
4. ASHRAE Handbook, HVAC Systems and Equipment, 1996, The American Society of Heating, Refrigeratingand Air Conditioning Engineers, Inc., 1791 Tullie Circle N.E., Atlanta, GA, 30329 U.S.A., 1996, (Chapter 18Fans).
5. Traver, D. G., System Effects on Centrifugal Fan Performance, ASHRAE Symposium Bulletin, Fan Application,Testing and Selection, The American Society of Heating, Refrigerating and Air Conditioning Engineers, Inc.,1791 Tullie Circle N.E., Atlanta, GA, 30329 U.S.A., 1971.
6. Christie, D. H., Fan Performance as Affected By Inlet Conditions, ASHRAE Transactions, Vol. 77, TheAmerican Society of Heating, Refrigerating and Air Conditioning Engineers, Inc., 1791 Tullie Circle N.E.,Atlanta, GA, 30329 U.S.A., 1971.
7. Zaleski, R. H., System Effect Factors For Axial Flow Fans, AMCA Paper 2011-88, AMCA EngineeringConference, Air Movement and Control Association International, Inc., 30 West University Drive, ArlingtonHeights, IL, 60004-1893 U.S.A., 1988.
8. Roslyng, O., Installation Effect on Axial Flow Fan Caused Swirl and Non-Uniform Velocity Distribution,Institution of Mechanical Engineers (IMechE), 1 Birdcage Walk, London SW1H 9JJ, England, 1984.
9. Clarke, M. S., Barnhart, J. T., Bubsey, F. J., Neitzel, E., The Effects of System Connections on FanPerformance, ASHRAE RP-139 Report, The American Society of Heating, Refrigerating and Air ConditioningEngineers, Inc., 1791 Tullie Circle N.E., Atlanta, GA, 30329 U.S.A., 1978.
10. Madhaven, S., Wright, T., J. DiRe, Centrifugal Fan Performance With Distorted Inflows, The American Societyof Mechanical Engineers, 345 East 47th Street, New, York, NY, 10017 U.S.A., 1983.
11. Cory, W. T. W., Fan System Effects Including Swirl and Yaw, AMCA Paper 1832-84-A5, AMCA EngineeringConference, Air Movement and Control Association International, Inc., 30 West University Drive, ArlingtonHeights, IL, 60004-1893 U.S.A., 1984.
12. Cory, W. T. W., Fan Performance Testing and Effects of the System, AMCA Paper 1228-82-A5, AMCAEngineering Conference, Air Movement and Control Association International, Inc., 30 West University Drive,Arlington Heights, IL, 60004-1893 U.S.A., 1984.
13. Galbraith, L.E., Discharge Diffuser Effect on Performance - Axial Fans, AMCA Paper 1950-86-A6, AMCAEngineering Conference, Air Movement and Control Association International, Inc., 30 West University Drive,Arlington Heights, IL, 60004-1893 U.S.A., 1986.
14. Industrial Ventilation –23rd Edition, American Conference of Governmental Industrial Hygienists, 1330 KemperMeadow Drive, Cincinnati, OH 45240-1634 U.S.A., 1998.
15. Fans and Systems, John E. Thompson and C. Jack Trickler, The New York Blower Company, ChemicalEngineering, March 21, 1983, pp. 48-63
16. AABC National Standards, Chapter 8, Volume Measurements, Associated Air Balance Council, 1518 K StreetNW, Suite 503, Washington, DC 20005 U.S.A.
AMCA 201-02 (R2007)
70

AIR MOVEMENT AND CONTROLASSOCIATION INTERNATIONAL, INC.
30 West University DriveArlington Heights, IL 60004-1893 U.S.A.
E-Mail : [email protected] Web: www.amca.orgTel: (847) 394-0150 Fax: (847) 253-0088
The Air Movement and control Association International, Inc. is a not-for-profit international association of the world’s manufacturers of related air system equipment primarily, but limited to: fans, louvers, dampers, air curtains, airflow measurement stations, acoustic attenuators, and other air system components for the industrial, commercial and residential markets.


