Amendment in phosphorus levels moderate the chromium toxicity in Raphanus sativus L. as assayed by antioxidant enzymes activities D. Sayantan, Shardendu n Laboratory of Environment and Biotechnology, Department of Botany, Patna Science College, Patna University, Patna 800005, Bihar, India article info Article history: Received 23 September 2012 Received in revised form 18 May 2013 Accepted 29 May 2013 Available online 28 June 2013 Keywords: Antioxidant enzymes Biomass Chlorophyll Chromium toxicity Phosphorus Raphanus sativus L abstract Chromium (Z ¼24), a d-block element, is a potent carcinogen, whereas phosphorus is an essential and limiting nutrient for the plant growth and development. This study undertakes the role of phosphorus in moderating the chromium toxicity in Raphanus sativus L., as both of them compete with each other during the uptake process. Two-factor complete randomized experiment (5 chromium 5 phosphorus concentrations) was conducted for twenty eight days in green house. The individuals of R. sativus were grown in pots supplied with all essential nutrients. The toxic effects of chromium and the moderation of toxicity due to phosphorus amendment were determined as accumulation of chromium, nitrogen, phosphorus in root tissues and their effects were also examined in the changes in biomass, chlorophyll and antioxidant enzyme levels. Cr and N accumulation were almost doubled at the highest concentration of Cr supply, without any P amendment, whereas at the highest P concentration (125 mM), the accumulation was reduced to almost half. A significant reduction in toxic effects of Cr was determined as there was three-fold increase in total chlorophyll and biomass at the highest P amendment. Antioxidant enzymes like superoxide dismutase, catalase, peroxidase and lipid peroxidation were analyzed at various levels of Cr each amended with five levels of P. It was observed that at highest level of P amendment, the reduction percentage in toxicity was 33, 44, 39 and 44, correspondingly. Conclusively, the phosphorus amendment moderates the toxicity caused by the supplied chromium in R. sativus. This finding can be utilized to develop a novel technology for the amelioration of chromium stressed fields. & 2013 Elsevier Inc. All rights reserved. 1. Introduction Chromium (Z ¼ 24) is a well known toxic heavy metal. The health hazards caused by the Cr exposure range from dermatitis, dermatosis and different types of cancer. The sources of Cr contamination of soils are different industrial operations, smelting, tanning, electroplating etc. The risk of Cr transfer in the food chain from soil is immense, by the process of uptake and accumulation by crop plants (Dube et al., 2003). Cr exists in both mobile and chelated forms. Out of the two stable forms Cr (III) and Cr (VI), former occurs in the bound form with organic matter of soil, whereas the latter exists in the inorganic form, mainly associated with oxygen as chromate and dichromate ions (Shanker et al., 2005). Adsorption, absorption, accumulation and transformation are the processes by which plants detoxify the metal/metalloid con- taminated sites. Above processes come under the umbrella of one phenomenon named as phytoremediation. It is defined by Cunningham and Berti (1993) as the use of plants to remove pollutants from environment or to render them harmless. It is a green and cost effective technology, which can be utilized in place of other expensive technologies. In the process, one or a group of hyperaccumulator species grown as a unit called as constructed ecosystem is being used in developed countries (Azaizeh et al., 2006). Many papers and reviews are written on it (Salt et al., 1998; Schnoor et al., 1995; Shardendu et al., 2003), still, there are many gaps to be filled in. That is, interaction of growth nutrients (e.g. P) with chelated or unchelated metal ions (Dube et al., 2003), e.g. P may interact with Cr in-situ (Wallace et al., 1976; Shanker et al., 2005). Phosphorus is an essential macronutrient and competes with Cr for uptake (Wallace et al., 1976; Cervantes et al., 2001). Phosphorus is taken up by plants in the form of phosphate ions present as dissolved inorganic phosphorus (DIP) in the water Contents lists available at SciVerse ScienceDirect journal homepage: www.elsevier.com/locate/ecoenv Ecotoxicology and Environmental Safety 0147-6513/$ - see front matter & 2013 Elsevier Inc. All rights reserved. http://dx.doi.org/10.1016/j.ecoenv.2013.05.037 Abbreviations: APX, ascorbate peroxidase; CAT, catalase; Chl, chlorophyll; DHAR, dehydroascorbate reductase; DIP, dissolved inorganic phosphorus; DOP, dissolved organic phosphorus; DW, dry weight; EDTA, ethylenediaminetetraacetic acid; FW, fresh weight; GR, glutathione reductase; MDA, malondialdehyde; MDHAR, Mono- dehydroascorbate reductase; PIP, Particulate inorganic phosphorus; POD, Peroxi- dase; POP, Particulate organic phosphorus; ROS, Reactive oxygen species; SE, (Stan- dard error); SOD, Superoxide dismutase; UV–vis, Ultra violet–visible n Corresponding author. E-mail addresses: [email protected] (D. Sayantan), [email protected] (Shardendu). Ecotoxicology and Environmental Safety 95 (2013) 161–170
Transcript
Ecotoxicology and Environmental Safety 95 (2013) 161–170
Contents lists available at SciVerse ScienceDirect
Ecotoxicology and Environmental Safety
0147-65http://d
Abbredehydroorganicfresh wdehydrodase; POdard err
n CorrE-m
sharden
journal homepage: www.elsevier.com/locate/ecoenv
Amendment in phosphorus levels moderate the chromium toxicityin Raphanus sativus L. as assayed by antioxidant enzymes activities
D. Sayantan, Shardendu n
Laboratory of Environment and Biotechnology, Department of Botany, Patna Science College, Patna University, Patna 800005, Bihar, India
a r t i c l e i n f o
Article history:Received 23 September 2012Received in revised form18 May 2013Accepted 29 May 2013Available online 28 June 2013
Keywords:Antioxidant enzymesBiomassChlorophyllChromium toxicityPhosphorusRaphanus sativus L
13/$ - see front matter & 2013 Elsevier Inc. Alx.doi.org/10.1016/j.ecoenv.2013.05.037
Chromium (Z¼24), a d-block element, is a potent carcinogen, whereas phosphorus is an essential andlimiting nutrient for the plant growth and development. This study undertakes the role of phosphorus inmoderating the chromium toxicity in Raphanus sativus L., as both of them compete with each otherduring the uptake process. Two-factor complete randomized experiment (5 chromium�5 phosphorusconcentrations) was conducted for twenty eight days in green house. The individuals of R. sativus weregrown in pots supplied with all essential nutrients. The toxic effects of chromium and the moderation oftoxicity due to phosphorus amendment were determined as accumulation of chromium, nitrogen,phosphorus in root tissues and their effects were also examined in the changes in biomass, chlorophylland antioxidant enzyme levels. Cr and N accumulation were almost doubled at the highest concentrationof Cr supply, without any P amendment, whereas at the highest P concentration (125 mM), theaccumulation was reduced to almost half. A significant reduction in toxic effects of Cr was determinedas there was three-fold increase in total chlorophyll and biomass at the highest P amendment.Antioxidant enzymes like superoxide dismutase, catalase, peroxidase and lipid peroxidation wereanalyzed at various levels of Cr each amended with five levels of P. It was observed that at highestlevel of P amendment, the reduction percentage in toxicity was 33, 44, 39 and 44, correspondingly.Conclusively, the phosphorus amendment moderates the toxicity caused by the supplied chromium inR. sativus. This finding can be utilized to develop a novel technology for the amelioration of chromiumstressed fields.
& 2013 Elsevier Inc. All rights reserved.
1. Introduction
Chromium (Z¼24) is a well known toxic heavy metal. Thehealth hazards caused by the Cr exposure range from dermatitis,dermatosis and different types of cancer. The sources of Crcontamination of soils are different industrial operations, smelting,tanning, electroplating etc. The risk of Cr transfer in the food chainfrom soil is immense, by the process of uptake and accumulationby crop plants (Dube et al., 2003). Cr exists in both mobile andchelated forms. Out of the two stable forms Cr (III) and Cr (VI),former occurs in the bound form with organic matter of soil,whereas the latter exists in the inorganic form, mainly associated
with oxygen as chromate and dichromate ions (Shanker et al.,2005).
Adsorption, absorption, accumulation and transformation arethe processes by which plants detoxify the metal/metalloid con-taminated sites. Above processes come under the umbrella of onephenomenon named as phytoremediation. It is defined byCunningham and Berti (1993) as the use of plants to removepollutants from environment or to render them harmless. It is agreen and cost effective technology, which can be utilized in placeof other expensive technologies. In the process, one or a group ofhyperaccumulator species grown as a unit called as constructedecosystem is being used in developed countries (Azaizeh et al.,2006). Many papers and reviews are written on it (Salt et al., 1998;Schnoor et al., 1995; Shardendu et al., 2003), still, there are manygaps to be filled in. That is, interaction of growth nutrients (e.g. P)with chelated or unchelated metal ions (Dube et al., 2003), e.g. Pmay interact with Cr in-situ (Wallace et al., 1976; Shanker et al.,2005).
Phosphorus is an essential macronutrient and competes withCr for uptake (Wallace et al., 1976; Cervantes et al., 2001).Phosphorus is taken up by plants in the form of phosphate ionspresent as dissolved inorganic phosphorus (DIP) in the water
D. Sayantan, Shardendu / Ecotoxicology and Environmental Safety 95 (2013) 161–170162
column of soil particles. Other forms of phosphorus includeparticulate inorganic phosphorus (PIP), dissolved organic phos-phorus (DOP) and particulate organic phosphorus (POP), whichhave to undergo biotransformation to DIP for phytoavailability(Welch and Lindell, 1992; Holdford, 1997). In plant body, excessphosphorus accumulates as polyphosphate (Eixler et al., 2006;Powell et al., 2009). These polyphosphates may either be acidsoluble or acid insoluble form (Miyachi et al., 1964). Acid solublepolyphosphates are utilized in metabolism and synthesis ofdeoxyribonucleic acid (DNA) and proteins, whereas acid insolubleform is stored in the biomass and is utilized in the condition ofstarvation of phosphorus (Kuhl, 1974; Powell et al., 2008).
Chromium toxicity in plants generates reactive oxygen species(ROS) causing oxidative stress and lipid peroxidation (Shankeret al., 2005; Subrahmanyam, 2008) in various tissues. ROS isscavenged by various antioxidant enzymes such as catalase(CAT), superoxide dismutase (SOD), ascorbate peroxidase (APX)and other thiol regulated enzymes like dehydroascorbate reduc-tase (DHAR), monodehydroascorbate reductase (MDHAR) andglutathione reductase (GR) (Clijsters et al., 1999; Shanker et al.,2004). Levels of these antioxidant enzymes can be used asindicators of heavy metal induced metabolic stress in plants(Shanker et al., 2005).
The present study examines the role of different levels ofphosphorus amendments on chromium toxicity in Rapahnussativus L. The advantages of this cosmopolitan dining item are itsstorage root (tuber) and shorter growth cycle. But surprisingly, it isleft uninvestigated so far. The experiment is done with the designin which five different concentrations of Cr has been taken andat each Cr level, there were five amendments of P concentration.The variations in chlorophyll and biomass content, along withroot tissue storage of Cr, P and N in R. sativus have beendetermined. Furthermore, to examine the effect of P on Cr inducedoxidative-toxicity, the variations in antioxidant enzymes (super-oxide dismutase, catalase, peroxidase) and lipid peroxidationlevels (as malondialdehyde content) in root tissues have beendetermined.
2. Materials and methods
2.1. Experimental design and plant growth
Two-factor complete randomly designed experiment (in 5�5 pattern) was setup to examine the effects of amendments of phosphorus on chromium toxicity inRaphanus sativus L. Plants were supplied with five concentrations of Cr (viz. 2.0, 3.5,5.0, 6.5 and 8.0 mM). Each level of Cr was amended with five concentrations ofphosphorus (viz. 25, 50, 75, 100 and 125 mM). P was supplied as sodiumdihydrogen phosphate salt and Cr (as Cr6+) was supplied as potassium dichromatesalt. The controls were, 0.0 mM Cr with 125 mM P and 0 mM P with 2.0–8.0 mM Cr.
Seeds of R. sativus were wrapped in sterilized tissue paper towels soaked in halfstrength nutrient solution (Shardendu et al., 2012), and were allowed to germinatefor 72 h. Meanwhile, for the pot experiment, refined sand was prepared. Sand wastreated with 3% hydrochloric acid (HCl), for leaching out all the minerals adsorbedon to the sand. The HCl treated sand was then soaked in distilled water for 5 h, andwashed three times with doubled distilled water so that the pH of sand rises fromacidic to neutral. Later, sand was air dried and autoclaved. Each pot was filled with4 kg prepared sand and 2 L full strength nutrient solution. The pots withoutseedlings were transferred to the green house. The seedlings of R. sativus wereplanted at a density five per pots. The seedlings were allowed to grow with naturallight and dark conditions where temperature was maintained at 2575 1C. Thevolume of nutrient solution was maintained in every three days.
After 10 days of seedling growth, it was thinned to one per pot. Treatments ofCr and P were started with the eleven days old seedlings. The 25 pots weresupplied with Cr and P as above mentioned (5�5) fashion along with the controls.Each combination of Cr and P treatment had three replicates, leading to 75treatment pots.
A similar experiment with 75 pots as above were done with the seedlingdensity of five per pot and the variation in antioxidant enzyme levels weremeasured on the first day of treatment, at the intervals of 0, 1, 3, 6 and 12 h.
2.2. Determination of dry weight biomass and chlorophyll
Plants were harvested after twenty eight days of treatments of Cr and P andwere separated into root and shoot parts. Dry weight biomass of shoots+roots wasdetermined for every treatment. Chlorophyll was measured in the fresh leaves androot parts were utilized for determination of Cr, P and N.
Roots were initially washed under gently running tap water to remove looselyadhered sand particles followed by rinsing with 3% HCl for leaching out of mineralsadsorbed on the surface of roots. The shoots and acid rinsed roots were washed atleast three times with double-distilled water, and dried in a drought oven at 80 1Ctill the achievement of constant weight. Dry weight (DW) biomass (in grams) perplant was determined using Electronic Balance (Oriental Sales, India).
Chlorophyll a, b were estimated by its extraction from leaves using 80% acetonefollowed by determination of OD663 and OD645 using UV–vis spectrophotometer(SYSTRONICS 2202, India) and then calibrating these values in formulae devised byMaclachlan and Zalik (1963).
2.3. Digestion of plant material and determination of Cr, P and N
For analysis of Cr, P and N, dried root samples were grinded using stainless steelgrinder (Philips, India) and meshed to achieve size o200 μm. The ground sampleswere digested with different procedures. For Cr analysis, 500 mg of groundmaterials were digested in 2+1 nitric acid: perchloric acid using technique asdescribed by Walinga et al. (1995) with minor modifications. Weighed sampleswere incubated in the acid mixture overnight to overcome the vigorous reactionphase, followed by placing the conical flask containing reaction mixture in heatingblock and allowed to boil at 150 1C till the dense white fumes of perchloric acidevolved. The flask was removed and the mixture was allowed to cool. Again 15 mLof acid mixture was added and again heated at the same temperature till thedigested plant debris turned pure white. The flask was then removed and thedigested product was filtered through Whattman 42 filter paper. The filtrate wasadjusted to volume of 50 mL with double-distilled water for further analysis of Cr.Total Cr was estimated as per American Public Health Association (APHA, 2005a)where total Cr has been converted to Cr6+ before determination UV–vis spectro-photometrically. Conversion was achieved by treating 5 mL of acidified (with 1+1sulfuric acid: double distilled water) digest with potassium permanganate andsodium azide. Color was developed by addition of diphenyl carbazide reagent andOD540 was recorded using spectrophotometer. Concentration of Cr (in microgramsper gram DW) was determined using standard graph.
For the analysis of P and N, the ground-samples were digested by the methoddescribed by Langner and Hendrix (1982) with minor modifications. 25 mg ground-sample was boiled in the 150 mL of (1+1) digestion mixture (9 mg L−1 sodiumhydroxide+20.1 mg L−1 potassium peroxodisulphate): doubled distilled water, at120 1C for 2 h. The digested product was filtered through Whattman 42 filter paperand the filtrate was used for further determination of N and P. Phosphorus in thedigested product was determined by stannous chloride method (APHA, 2005b)).Ammonium molybdate (0.4 mL) and stannous chloride (0.05 mL) were added to10 mL of acidified digested product and OD690 was recorded using spectrophot-ometer after 10–12 min of incubation. Concentration of phosphorus (in milligramsper gram DW) in the digest was measured using a standard graph.
Total nitrogen in the digested product was determined as nitrate–nitrogenfollowing the phenol–disulphonic acid method (Eastoe and Pollard, 1950). 50 mL ofdigest was evaporated to dryness on a hot plate (temperature¼80 1C) followed bythe dissolution of precipitate in 2+20 phenol disulphonic acid: double distilledwater. Dropwise ammonia solution was added till the solution turned yellow andvolume was made up to 100 mL. OD410 was recorded using spectrophotometer andthe concentration of N (in milligrams per gram DW) was determined usingstandard graph.
2.4. Extraction and assay of antioxidant enzymes and lipid peroxidation
One plant from each pot containing five individuals of R. sativus was harvestedon the first day of treatment at the intervals of 0, 1, 3, 6 and 12 h for the analysis ofantioxidant enzymes. For extraction of enzymes, 1 g of frozen roots was homo-genized in ice cold 0.1 M Tris–HCl buffer maintained at pH 7.8 along with 1 mMethylenediaminetetraacetic acid (EDTA), 5 mL of 4% polyvinyl pyrrolidone and1 mM dithiotreitol, followed by filtration of homogenate and centrifugation at20,000g at 4 1C for 20 min The supernatant was used for further enzyme assays.
Superoxide dismutase (SOD) [EC 1.15.1.1] activity was determined as perdiscussed by Minami and Yoshikawa (1979). The reaction mixture consisted of50 mM Tris–cacodylic buffer (Sodium salt), pH 8.2, 0.1 mM EDTA, 1.4% TritonX-100,0.055 mM nitroblue tetrazolium (NBT), enzyme extract and 16 mM pyragallol, whichinitiated the reaction. The reaction was incubated at 37 1C for 5 min. The reactionwas terminated by adding a mixture containing 0.35 M formic buffer, pH 3.5, 0.6%Triton-X 100 and 3.5% formaldehyde. The OD540 of the reaction product wasrecorded and the activity was expressed in Units (U) per milligram FW (where 1 Urepresented the amount of enzyme that caused the inhibition of NBT reduction by5%). Catalase (CAT) [EC 1.11.1.6] activity was determined by following the method of
D. Sayantan, Shardendu / Ecotoxicology and Environmental Safety 95 (2013) 161–170 163
Dhindsa et al. (1981). Reaction was started by adding the supernatant to mixturecontaining 50 mM sodium phosphate buffer pH 7.0 and 15 mM H2O2. The activitywas determined by monitoring the decomposition of H2O2 (coefficientε¼45 M−1 cm−1) at OD240. Enzyme activity was expressed in Units per milligramFW, defined as mMol H2O2 decomposed per minute. Peroxidase (POD) [EC 1.11.1.7]activity was determined by method described by Kato and Shimizu (1987) modifiedby Zou et al. (2009). Reaction mixture contained 100 mM sodium phosphate buffer(pH 6.0), 30% H2O2 and gluaicol. Reaction was initiated by adding 1 mL of extract to3 mL reaction mixture and the increase in OD470 at every 30 s intervals for period of2 min was noted. The activity was expressed in Units per milligram FW where 1 Urepresented 0.1 change in absorbance at 470 nm.
Lipid peroxidation was expressed as malondialdehyde (MDA) content accord-ing to method described by Beuge and Aust (1978). Roots (0.5 g) were homo-genized in 5 mL of 10% trichloroacetic acid (TCA) in an ice cold mortar and pestle.The homogenate was centrifuged at 4000g for 10 min. The supernatant was furtherused for the determination of lipid peroxidation. To 2 mL supernatant, 2 mL of 0.6%tribarbituric acid (TBA) in 10% TCA was added. The reaction mixture was incubatedin water bath at 100 1C for 15 min followed by cooling in an ice bath. The mixturewas then centrifuged at 10000g for 10 min and the supernatant was recorded forOD532 against a blank that contained all the reagents except sample. OD532 of thepink colored supernatant was directly proportional to the MDA concentration,which was calculated as per extinction coefficient (ε¼1.56�105 M−1 cm−1). MDAconcentration was expressed in micro moles per gram DW.
2.5. Statistical analyses
All the values presented in figures are the means of three replicates of thetreatments. Standard errors (SE) were calculated from the replicates and presentedas Error bars (7). The significance of differences between control and thetreatments was determined by Student's t-test for paired samples, with thedifferences considered significant at Po0.05, Po0.01, Po0.001. There were twocontrols for Student's t-test. For the effect of only Cr, the control for the t-test wasthe Zero level Cr and for the effect of P amendment on the parameters, the controlwas the zero level P. Correlation statistics (r-value) were also calculated. Allstatistical analyses were performed using software STATISTICA v5.52.164.0 andgraphs were constructed using MICROSOFT EXCEL 2003.
3. Results
3.1. Cr accumulation in root tissues of R. sativus as a functionof its supplies with P amendments
As expected, chromium accumulation in plant roots was dose-dependent and increased as the concentration of Cr supplyenhanced (Fig. 1). Cr accumulation in roots was doubled whenthe Cr supply was highest (8.0 mM Cr/0 mM P amendment) incomparison to the initial supply of 2.0 mM Cr without P amend-ment. There was a significant (at 0.05 level) positive correlation(0.965≤r≤0.998) between the Cr supply and its storage in roots(Table 1A). However, impact of amendment of phosphorus con-centration on Cr accumulation was notable. At each Cr supply,accumulation of Cr decreased as the levels of P increased, showinga reciprocal correlation (−0.960≤r≤−0.762) among these two
0
50
100
150
200
250
300
350
400
0mM Cr 2.0mM Cr 3.5mM C
Cr
conc
entr
atio
n in
roo
t (µ
g g-1
DW
)
Cr
0mM P 25mM P 50mM P
c
c
b b c bb
aa
aa
Fig. 1. Variation of Cr storage in root tissues of (mg g−1 DW) R. sativus with various Cr/Pn¼3. a, b, c indicate values that differ significantly from control at Po0.05, Po0.01, Poresult. The major trendline is Cr accumulation vs Cr supply with 0 mM Cr as a control.
parameters (Table 1B). For example, at 2.0 mM Cr supply therewas a gradual enhancement in the percentage reduction in Craccumulation (20.18%, 23.42%, 30.80%, 33.13% and 49.48%) for thefive respective increasing levels of P supply, compared with thecontrol plants (Fig. 1). The same trend of the role of P was alsoobserved for the other Cr supplies, but there was a significantdecrease in the percentage of reduction of Cr accumulation mean-ing thereby, the impact of P amendment in reduction of Craccumulation was limited. At 3.5 mM Cr supply, the mean Craccumulation was reduced upto 28.69%, followed by 24.52%,11.30% and 12.41% for the respective (5.0 mM, 6.5 mM and8.0 mM) Cr supplies and their controls.
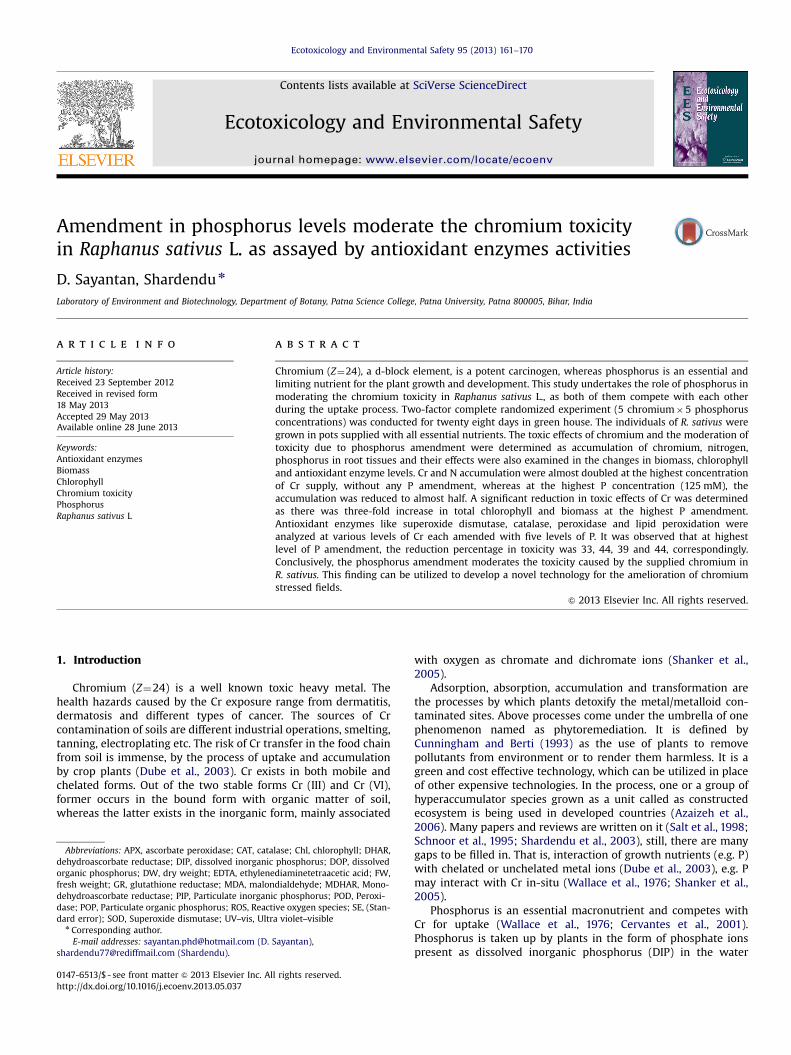
3.2. Levels of chlorophyll as a function of Cr suppliesand P amendment
The content of chlorophyll a and b in control as well asexperimental samples was determined as an indicator of Crtoxicity and also, being moderated by the P amendments. Theconcentrations of chlorophyll a and b (Figs. 2A and B respectively)significantly decreased with gradual increase in the Cr levels.There was a significant reciprocal correlation (−0.992≤r≤−0.986)between total chlorophyll and Cr supplies (Table 1A). Leavessuffered severe chlorosis and there was 93% reduction of chlor-ophyll (a+b) in samples with the highest Cr supply (8.0 mM Cr/0 mM P) in comparison to samples without Cr supply with125 mM P amendment. However, the trend in the reduction ofchlorophyll a and b were different with the various P amendments.The concentration of total chlorophyll significantly increased withthe gradual increase in supplied P, indicating the role of P in thereduction of Cr induced toxicity. The chlorophyll (a+b) enhancedalmost three times at both 5.0 mM as well as 6.5 mM Cr supplieswith respect to their controls amended with 125 mM P (Fig. A andB). Likewise, approximately two fold increase in total chlorophyllwas determined for the remaining three Cr supplies (2.0 mM,3.5 mM and 8.0 mM Cr). The role of P amendments in thereduction of Cr toxicity, determined as total chlorophyll, wasstatistically significant (0.824≤r≤0.998; Table 1B).
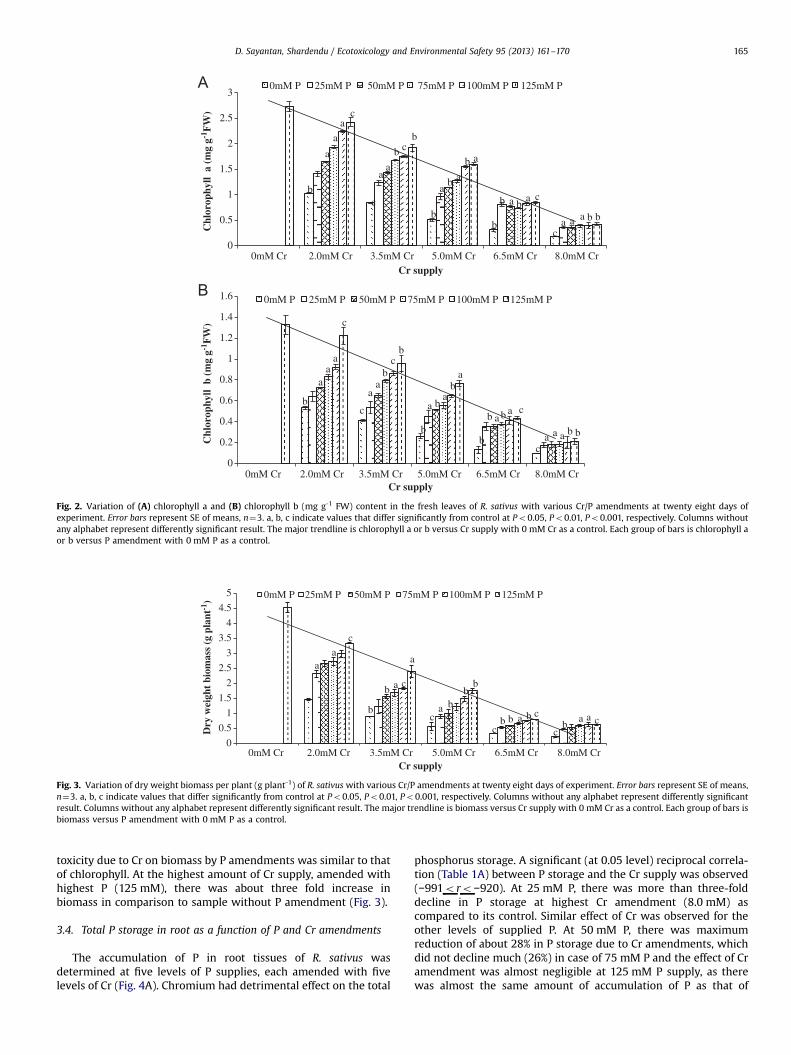
3.3. Variation in dry weight biomass of plants as a functionof Cr and P amendments
The dry weight (DW) variation of individual plant was mea-sured after twenty eight days of experiment from each potsupplied with a concentration of Cr, each amended with five Pconcentrations. A significant reduction of biomass was measuredin the samples with Cr supplies without P amendment as
r 5.0mM Cr 6.5mM Cr 8.0mM Cr supply
75mM P 100mM P 125mM P
cc
c
b
a aa a
b
a a aa a
a a
amendments at twenty eight days of experiment. Error bars represent SE of means,0.001, respectively. Columns without any alphabet represent differently significantEach group of bars is Cr storage vs P amendment with 0 mM P as a control.
Table 1APearson Correlation coefficient [r] between Cr supply and Cr tissue storage; Cr supply and total chlorophyll; Cr supply and biomass; Cr supply and phosphorus tissue storage;Cr supply and nitrogen tissue storage; Cr supply and antioxidant enzymes and lipid peroxidation (at various incubation periods as well as different amendments of P). Ther-values in Bold represent significance at 0.05 level.
Parameters Phosphorus amendments
0mM 25 mM 50mM 75mM 100mM 125 mM
Cr supply vs Cr storage 0.965 0.978 0.989 0.982 0.998 0.995Cr supply vs total chlorophyll −0.988 −0.986 −0.992 −0.992 −0.991 −0.992Cr supply vs biomass −0.962 −0.921 −0.938 −0.956 −0.961 −0.984Cr supply vs P storage − −0.991 −0.939 −0.647 −0.920 −0.128Cr supply vs N tissue storage − 0.990 0.988 0.856 0.870 0.990Cr supply vs SOD
@1 h 0.977 0.965 0.974 0.969 0.963 0.971@3 h 0.992 0.992 0.966 0.994 0.945 0.953@6 h 0.993 0.893 0.894 0.921 0.913 0.935@12 h 0.993 0.997 0.995 0.998 0.978 0.991
Cr supply vs CAT@1 h 0.978 0.985 0.974 0.965 0.950 0.942@3 h 0.975 0.961 0.954 0.975 0.871 0.928@6 h 0.999 0.993 0.976 0.954 0.913 0.928@12 h 0.987 0.990 0.979 0.940 0.940 0.987
Cr supply vs POD@1 h 0.995 0.993 0.986 0.992 0.958 0.967@3 h 0.992 0.997 0.980 0.985 0.978 0.970@6 h 0.993 0.998 0.992 0.998 0.990 0.971@12 h 0.995 0.991 0.990 0.983 0.984 0.966
Cr supply vs LP@1 h 0.991 0.984 0.984 0.979 0.980 0.982@3 h 0.995 0.989 0.984 0.983 0.980 0.980@6 h 0.999 0.997 0.990 0.978 0.979 0.982@12 h 0.993 0.992 0.994 0.992 0.990 0.993
Table 1BPearson Correlation coefficient [r] between P amendments and P tissue storage; P amendments and total chlorophyll; P amendments and Biomass; P amendments and Ptissue storage; P amendments and nitrogen tissue storage; phosphorus amendments and antioxidant enzymes and lipid peroxidation (at various incubation periods as wellas different supplies of Cr). The r-values in Bold represent significance at 0.05 level.
Parameters Chromium supplies
2.0 mM 3.5 mM 5.0 mM 6.5mM 8.0 mM
P amendment vs Cr storage −0.958 −0.919 −0.955 −0.960 −0.762P amendment vs total chlorophyll 0.998 0.983 0.977 0.748 0.824P amendment vs biomass 0.946 0.978 0.993 0.967 0.872P amendment vs P storage 0.83 0.56 0.26 0.96 −0.08P amendment vs N tissue storage −0.992 −0.978 −0.979 −0.918 −0.985
P amendment vs SOD@1 h −0.945 −0.980 −0.934 −0.884 −0.878@3 h −0.969 −0.958 −0.921 −0.863 −0.768@6 h −0.976 −0.982 −0.912 −0.982 −0.970@12 h −0.984 −0.989 −0.995 −0.842 −0.821
P amendment vs CAT@1 h −0.983 −0.993 −0.996 −0.903 −0.886@3 h −0.862 −0.998 −0.927 −0.990 −0.919@6 h −0.987 −0.993 −0.983 −0.911 −0.932@12 h −0.996 −0.961 −0.921 −0.889 −0.907
P amendment vs POD@1 h −0.989 −0.981 −0.986 −0.827 −0.906@3 h −0.998 −0.944 −0.994 −0.972 −0.979@6 h −0.996 −0.983 −0.993 −0.894 −0.979@12 h −0.964 −0.999 −0.949 −0.957 −0.933
P amendment vs LP@1 h −0.978 −0.993 −0.921 −0.116 −0.566@3 h −0.984 −0.967 −0.992 −0.643 −0.817@6 h −0.969 −0.979 −0.985 −0.550 −0.534@12 h −0.963 −0.994 −0.960 −0.674 −0.847
D. Sayantan, Shardendu / Ecotoxicology and Environmental Safety 95 (2013) 161–170164
compared to the control (samples without Cr supply). The max-imum reduction was 97.52% with the highest Cr concentration(8.0 mM), which gradually improved as 92.85%, 87.96%, 80.21% and
67.85% with the respective decrease in Cr supply (Fig. 3). Asignificant reciprocal correlation (−0.984≤r≤−0.921) was observedbetween biomass and Cr supplies (Table 1A). A reduction in
Fig. 2. Variation of (A) chlorophyll a and (B) chlorophyll b (mg g-1 FW) content in the fresh leaves of R. sativus with various Cr/P amendments at twenty eight days ofexperiment. Error bars represent SE of means, n¼3. a, b, c indicate values that differ significantly from control at Po0.05, Po0.01, Po0.001, respectively. Columns withoutany alphabet represent differently significant result. The major trendline is chlorophyll a or b versus Cr supply with 0 mM Cr as a control. Each group of bars is chlorophyll aor b versus P amendment with 0 mM P as a control.
Fig. 3. Variation of dry weight biomass per plant (g plant-1) of R. sativus with various Cr/P amendments at twenty eight days of experiment. Error bars represent SE of means,n¼3. a, b, c indicate values that differ significantly from control at Po0.05, Po0.01, Po0.001, respectively. Columns without any alphabet represent differently significantresult. Columns without any alphabet represent differently significant result. The major trendline is biomass versus Cr supply with 0 mM Cr as a control. Each group of bars isbiomass versus P amendment with 0 mM P as a control.
D. Sayantan, Shardendu / Ecotoxicology and Environmental Safety 95 (2013) 161–170 165
toxicity due to Cr on biomass by P amendments was similar to thatof chlorophyll. At the highest amount of Cr supply, amended withhighest P (125 mM), there was about three fold increase inbiomass in comparison to sample without P amendment (Fig. 3).
3.4. Total P storage in root as a function of P and Cr amendments
The accumulation of P in root tissues of R. sativus wasdetermined at five levels of P supplies, each amended with fivelevels of Cr (Fig. 4A). Chromium had detrimental effect on the total
phosphorus storage. A significant (at 0.05 level) reciprocal correla-tion (Table 1A) between P storage and the Cr supply was observed(−991oro−920). At 25 mM P, there was more than three-folddecline in P storage at highest Cr amendment (8.0 mM) ascompared to its control. Similar effect of Cr was observed for theother levels of supplied P. At 50 mM P, there was maximumreduction of about 28% in P storage due to Cr amendments, whichdid not decline much (26%) in case of 75 mM P and the effect of Cramendment was almost negligible at 125 mM P supply, as therewas almost the same amount of accumulation of P as that of
Fig. 4. Variation of storage of (A) phosphorus and (B) nitrogen in root tissues (mg g-1 DW) of R. sativus with various Cr/P amendments at twenty eight days of experiment.Error bars represent SE of means, n¼3. a, b, c indicate values that differ significantly from control at Po0.05, Po0.01, Po0.001, respectively. Columns without any alphabetrepresent differently significant result. The major trendline is for variation in P or N storage versus P amendment with 0 mM Cr/125 mM P (first bar) as a control.
0102030405060708090100
SOD
(U
mg-1
FW
)
Cr/P amendments
0h 1h 3h 6h 12h
0102030405060708090
CA
T (
U m
g-1F
W)
Cr/P amendments
0h 1h 3h 6h 12h
0102030405060708090100
PO
D (
U m
g-1 F
W)
Cr/P amendments
0h 1h 3h 6h 12h
0102030405060708090
100
Mal
ondi
alde
hyde
(µM
g-1
DW
)
Cr/P amendments
0h 1h 3h 6h 12h
Fig. 5. Variation of (A) superoxide dismutase (SOD), (B) catalase (CAT), (C) peroxidase (POD) activities (U mg−1 FW) and (D) lipid peroxidation (malondialdehyde contentexpressed as mM g−1 DW) in root tissues of R. sativus for time intervals 0 h, 1 h, 3 h, 6 h and 12 h with various Cr/P amendments at the first day of experiment. Error barsrepresent SE of means, n¼3. The major trendline is SOD/CAT/POD/malondialdehyde at different incubation period versus Cr supply with 0 mM Cr as a control. Each group ofline drawings represents the variation in SOD/CAT/POD/malondialdehyde at different incubation period versus P amendment with 0 mM P as a control.
D. Sayantan, Shardendu / Ecotoxicology and Environmental Safety 95 (2013) 161–170166
control plant samples. Therefore, the effect of Cr amendment on Pstorage was limited up to the intermediate levels of P supply. Atthe highest level of P supply, with the enhancement of Crconcentration there was no significant reduction storage of P intissues.
3.5. Total N storage in root as a function of P and Cr amendments
A constant amount of N was supplied to each pot for thegrowth of plants in nutrient solution. Unassimilated N was storedin root tissues, and it was also affected by the five levels of P, each
Table 1CPearson correlation coefficient [r] between various antioxidant enzymes viz.superoxide dismutase (SOD), catalase (CAT), peroxidase (POD), lipid peroxidation(LP) and incubation period at different supplies of Cr, each amended with differentP concentrations. The r-values in Bold represent significance at 0.05 level.
AntioxidantEnzymes at differentCr concentrations
Phosphorus amendments
0 mM 25 mM 50 mM 75 mM 100 mM 125 mM
1. SOD0.0 Mm − − − − − 0.832.0 mM 0.853 0.866 0.753 0.762 0.859 0.8773.5 mM 0.831 0.856 0.894 0.851 0.939 0.9315.0 mM 0.835 0.815 0.742 0.738 0.849 0.9036.5 mM 0.705 0.699 0.702 0.663 0.743 0.7218.0 mM 0.683 0.639 0.701 0.691 0.693 0.656
2. CAT0.0 mM − − − − − 0.942.0 mM 0.831 0.857 0.886 0.925 0.788 0.9103.5 mM 0.867 0.911 0.934 0.977 0.995 0.9935.0 mM 0.844 0.857 0.851 0.797 0.910 0.9766.5 mM 0.718 0.737 0.751 0.711 0.803 0.7608.0 mM 0.630 0.648 0.681 0.684 0.625 0.673
3. POD0.0 mM − − − − − 0.992.0 mM 0.881 0.917 0.939 0.942 0.996 0.9913.5 mM 0.717 0.737 0.662 0.728 0.808 0.7495.0 mM 0.686 0.726 0.753 0.748 0.896 0.8536.5 mM 0.717 0.707 0.716 0.734 0.693 0.7358.0 mM 0.720 0.732 0.728 0.719 0.751 0.776
4. LP0.0 mM − − − − − 0.992.0 mM 0.745 0.770 0.771 0.808 0.855 0.8913.5 mM 0.801 0.810 0.833 0.817 0.834 0.8475.0 mM 0.734 0.752 0.804 0.766 0.765 0.7816.5 mM 0.649 0.659 0.663 0.731 0.646 0.6348.0 mM 0.647 0.657 0.665 0.666 0.649 0.627
D. Sayantan, Shardendu / Ecotoxicology and Environmental Safety 95 (2013) 161–170 167
amended with five levels of Cr, as in case of P storage. Contrary toP storage, total N stored in the roots of R. sativus increased with theincrease in Cr levels (Fig. 4B). It was observed that N storage wasindependent of P supply but there was direct relationship betweenN storage and gradual increase in Cr supply. There was a sig-nificant (at 0.05 level) correlation between Cr and N storage(Table 1A).
3.6. Changes in the behavior of antioxidant enzymes and lipidperoxidation in root tissues at each Cr level and with P amendments
Four antioxidant enzymes namely superoxide dismutase (SOD),catalase (CAT), peroxidase (POD) and lipid peroxidation (expressedas malondialdehyde content) were selected to determine the toxiceffect of Cr and its amelioration by P amendments. There was ageneral trend of enhancement in enzyme activity with increasinglevel of Cr, whereas the percentage of enzyme activities reducedwith each Cr supply amended with increasing P levels (Figs. 5A–D).
At the first instance, almost two fold enhancement of SOD levelwas observed at the maximum concentration of Cr supply withoutany P amendment (Fig.5A). A significant (at 0.05 level) positivecorrelation (0.893≤r≤0.998) between the Cr supply and SODactivity further supported this observation (Table 1A). With thegradual enhancement of P amendment, there was a trend ofsignificant reduction in the percentage of enhancement in SODlevel and a maximum of 33% reduction (Fig. 5A) was observed athighest P amendment (125 mM), with the intermediate level of Cr(5.0 mM) supply (Fig. 5A). However, at the higher levels of Cr, roleof P amendment was negligible.
Although the effect of Cr, P and incubation period on CATactivity was almost similar to that of SOD, in this case, there wastwo fold increase in its activity and the maximum reduction inpercentage increase in CAT activity with highest P amendment wasforty four (Fig. 5B). CAT looks more sensitive to Cr than that of SODbecause the maximum reduction was at 3.5 mM Cr; however, inthe case of SOD it was at 5.0 mM Cr for the same incubation timeand P level. The behavior of CAT and SOD at the higher levels of Crwas almost the same as there was only a minor difference inreduction percentage.
Keeping the trends of SOD and CAT intact, there was asignificant (at 0.05 level) positive correlation between the Crsupplies/incubation period and POD activity (Tables 1A and Crespectively). However, there was about than four times enhance-ment in the POD activity, of course after highest level of Cr supplywithout P amendment with increasing the incubation period(Fig. 5C). Contrary to the effect of Cr and incubation period,relationship between P amendments and POD activity was reci-procal (−0.994≤r≤−0.921) (Table 1B). The role of P amendment inreducing the Cr toxicity was similar to that of other antioxidantenzymes, however the reduction in level of enzymatic activity wasvariable (Fig. 5C). The maximum reduction was almost 39% at2.0 mM Cr, amended with 125 mM P. The effect of P amendmenton enzyme activities was least observed at 6.5 mM and 8.0 mM Crsupplies.
Malondialdehyde levels, corresponded to the lipid peroxidationof cellular membrane of root cells, were recorded higher withrespect to Cr supply as well as incubation period (Fig. 5D), where,it showed a significant (at 0.05 level) positive correlation of ranges,0.978≤r≤0.999 (Table 1A) for the previous and 0.891≤r≤0.99 forthe latter one (Table 1C). However, P was responsible for thedecrease in the toxicity of Cr as represented by the significantnegative correlation coefficient (r) of malondialdehyde levels asper P amendments, ranging between −0.994 and −0.96 (Table 1B).This statistics was in support with the reduction percentage ofmalondialdehyde level by 44.09 at 3.5 mM Cr/125 mM P amend-ment when compared with positive control plant (3.5 mM Cr/
0 mM P) (Fig. 5D). On an average, 6.5 mM and 8.0 mM Cr plantsshowed 14.7% reduction, when compared with the respectivepositive controls taking consideration of 12 h incubation period.
4. Discussion
There is wide spectrum of reports regarding the toxicity ofheavy metals, including Cr, in plants (Mallick et al., 1996;Shardendu et al., 2003; Shanker et al., 2005; Azaizeh et al.,2006; Vardanyan and Ingole, 2006; Dazy et al., 2008; Rahmanet al., 2011). This study reports the interesting range in toxicitycaused by the Cr variation. R. sativus was grown in a randomizedfashion at five levels of Cr, and at each of its level, there were fiveamendments of phosphorus (i.e. two-factor 5�5 randomizeddesign). There were two general trends of observation for almostall of the determined parameters, viz. one, Cr toxicity was dose or/and incubation period dependent and the other, there was gradualreduction in toxicity of Cr at each increasing concentration of Pamendment.
With the gradual enhancement of Cr supply, a gradual increaseof Cr accumulation in root tissues was measured (Fig.1), which isin agreement with other works done on different plants likeAmaranthus viridis (Zou et al., 2006), Citrullus (Dube et al., 2003),vegetable crops (Zayed et al., 1998) etc. In this study, the content ofaccumulation was much higher (upto 340.0970.003 mg g−1 DW)in comparison to many other reports. Ganesh et al. (2008) havereported the accumulation upto 170 mg kg−1 (or 170 mg g−1) DW inpaddy cultivars and Zou et al. (2006) have reported accumulationof 58.68 mg g−1 DW in Amaranthus viridis. The root of R. sativus is
D. Sayantan, Shardendu / Ecotoxicology and Environmental Safety 95 (2013) 161–170168
tuber, which is storage root. The storage capacity of R. sativus wasfurther testified because the amount of Cr accumulation was morethan four times higher than the reports of Dube et al. (2003) inCitrullus. The amount of Cr accumulation decreased at every higherlevel P amendment. There was a gradual significant decrease in Craccumulation, when the initial P amendment (25 mM) wasincreased to 125 mM. This trend was similar for the 2.0 mM,3.5 mM and 5.0 mM Cr levels each with five levels of P amend-ments. At the two higher concentrations of Cr (6.5 mM and8.0 mM), the P amendments did not show any significant impacton the accumulation. This might be due to the greater toxic impactof higher Cr levels, which mitigates the effects of P amendments tonegligible. It supports the fact that Cr, at its higher concentration,acts as a stronger competitor for carriers on the surface of rootcells than P, depending upon the same carrier. This competition forcarrier results in higher uptake and accumulation of Cr in roottissues. The mechanism of the impact of P on Cr accumulation isanalogous with sulfate on Cr accumulation (Odjegba and Fasidi,2004; Sinha et al., 2005).
Levels of photosynthetic pigment is an important indicator ofCr induced toxicity in plants (Shanker et al., 2005; Subrahmanyam,2008), which indicates how Cr affect CO2 fixation, in turn electrontransport, photophosphorylation, as well as other carbon fixingenzyme activities (Clijsters and Van Assche, 1985). The majortrendlines in Figs. 2A and B show the toxic impact of Cr supplieson the chlorophyll a, b concentrations, respectively. There wasreciprocal relationship between variation of total chlorophyll inleaves and concentration of Cr supply as well as Cr accumulation inroot parts. This trend was similar to work done by other research-ers (Subrahmanyam, 2008; Zou et al., 2009; Unnikannan et al.,2011). Above relationship between total chlorophyll and Cr sup-plies might be due to the oxidative stress generated in the aerialparts of the plants (Panda and Choudhury, 2005). There was directrelationship between P amendment and total chlorophyll. So,when the level of P amendment was enhanced, the concentrationof total chlorophyll also increased. Shanker et al. (2005) in hisreview also presented the inverse relationship between Cr accu-mulation and photosynthetic pigment concentration in leaves ofplants. At the higher supplies of P, its uptake was faster than Cr,hence the increase in the concentration of total chlorophyll inleaves. The maximum enhancement of total chlorophyll was aboutthree fold higher for the amendment 6.5 mM Cr/125 mM P ascompared to samples with the same Cr supply without Pamendment.
Photosynthetic activity is the direct method for determinationof biomass of plants (Beadle and Long, 1985; Voronin et al., 2003;Zou et al., 2006; Hossain et al., 2012). There are two importantmethods to determine the growth and development in plants, i.e.chlorophyll and biomass (Shardendu and Ambasht, 1991). Theeffect of Cr and P treatments on the above parameters was similaron both the parameters, i.e. total chlorophyll and biomass. Therewas reduction in biomass with the enhancement of Cr supplies(Fig. 3). Statistically, their reciprocal correlationship was alsosignificant (Table 1A). Cr had a negative impact on the productionof chlorophyll, and hence the biomass (Shanker et al., 2005).However, as in other parameters, the toxicity of Cr was reduceddue to P amendments, hence increased the production of biomass.
The accumulation of P in plant tissues was dependent onsupply level of P, irrespective of Cr levels, but this trend waslimited to certain P level. At 100 mM and 125 mM P concentra-tions, the accumulation of P remained almost constant. Thisindicates two facts: first, P is preferred choice for plants, as it isnecessary for the metabolic functions like DNA synthesis as well asprotein metabolism. Unutilized P is stored in plant parts as acidinsoluble polyphosphates (Powell et al., 2008; Powell et al., 2009).P is called as limiting nutrient for the growth and metabolism of
plants (Reddy et al., 1999; Shardendu et al., 2012). However, theeffect of Cr on P accumulation was detrimental, irrespective of Psupply. More than three fold decline in P storage in root tissueswas measured due to the detrimental effect of Cr supply incomparison to its control. This reduction of P accumulation wasin agreement with the work done by Turner and Rust (1971) andDube et al. (2003). Cr interferes with the P metabolism, whichreduces the P accumulation (Spence and Millar, 1963).
A fixed amount of N was supplied in the nutrient medium forgrowth and development of plants. The N accumulation in roots ofR. sativus was dependent on the P levels as of the other para-meters. The competition between the P and Cr for respectivecarriers needed for uptake was also observed here, for example,when the P was supplied at fixed level, the accumulation of Crenhanced. This might due to the increase in the proteins(enzymes) in the root cells, mainly for combating the oxidativestress conferred due Cr accumulation (Upadhyay and Panda, 2010).The results of this experiment also confirmed with the findings onPistia (Bassi et al., 1990; Singh and Tandon, 2009) and Ipomoeareptans (Kasmiyati and Santosa, 2000) where, increased levels ofCr induced higher protein production.
The production of ROS is promising indicator for examiningtoxicity due to any stress (Stohs and Bagchi, 1995; Malmir, 2011).Defense mechanism of plants produces antioxidant enzymes tocombat the stress by reducing ROS to harmless products. In thisstudy, determination of some antioxidant enzymes in the rootparts, at different concentrations of Cr stresses with furtheramendments of P have been done. SOD acts as a key antioxidantenzyme, which catalyzes disproportionation of superoxide anion(O2
−) to H2O2 and O2. CAT and POD further scavenge H2O2 andconvert to O2+H2O and other phenolic compounds respectively(Gajewska et al., 2006). In this study, with the increase in Cr levelsand incubation period, the activity of SOD increased significantly(at 0.05 level). This was in agreement with various other works(Shanker et al., 2004; Shanker and Pathmanabhan, 2004; Dazyet al., 2008; Subrahmanyam, 2008; Zou et al., 2009). However,phosphorus had a significant effect on the reduction of SOD levels,in turn confirming its role in the reduction of ROS production, thusreduction in the toxicity impacted by Cr. The same trend wasobserved in CAT as well as POD activities. This was because, withincrease in P amendment there was a reduction in the accumula-tion of Cr in roots, in turn reducing the stress of ROS formation. AsROS level decreased, the enzyme responsible for its conversion toH2O2 (i.e. SOD) also decreased, in turn reducing the H2O2 quench-ing enzymes (CAT and POD). Apart from the elevation of antiox-idant levels in the root cells, oxidative stress is also responsible forthe formation of malondialdehyde (MDA) in the root cells, whichresults due to the lipid peroxidation of the cell membrane (Shamsiet al., 2008). So the amount of MDA in cells is a direct indicator oflevels of lipid peroxidation (Chaoui et al., 1997). In this study, MDAcontent is positively correlated with Cr supplies as well asincubation period. With the time elapsed, more will be thedamage to the cells due to ROS production and accumulation.Similar results were confirmed by various studies with Cr as wellas other heavy metals (Shanker et al., 2004; Shanker andPathmanabhan, 2004; Subrahmanyam, 2008; Malmir, 2011). As Pwas amended with each Cr supplies, similar to the other antiox-idant enzymes, level of lipid peroxidation diminished as indicatedby the decreased malondialdehyde level.
The result clearly shows that R. sativus is a significant reme-diator of Cr as it can accumulate 340.0977.2 mg g−1 in its roottissue without P amendment. But the other aspect of this studywas to check the transfer of Cr in the food chain by amendment ingrowth medium nutrient (P), which was proved by the lesseramount of Cr accumulation (287.2473.3 mg g−1) by R. sativus atthe same Cr supply but amended with 125 mM P.
D. Sayantan, Shardendu / Ecotoxicology and Environmental Safety 95 (2013) 161–170 169
5. Conclusions
In conclusion, this work presents the R. sativus L., a cosmopo-litan dining item, as a good accumulator of N, P and Cr. It also addsto the novel investigation that the presence of P with Cr in themedium of growth reduces the amount of accumulation of Cr, asboth competes each other for common uptake carriers on theroots. The relationship between Cr toxicity and chlorophyll orbiomass is reciprocal. We further believe, from the findings of thevariation in levels of antioxidant enzymes due to amendment of Pin growth medium, that it can be considered a novel technology inthe Cr toxicity amelioration in plants grown in fields. It is beyonddoubt that R. sativus is one of the best remediator of Cr stress, butthe essence of this study is the in-situ reduction of Cr toxicity inthe natural/artificial system by the enhancement of P.
Acknowledgments
Authors pay their sincere gratitude to University Grants Com-mission, New Delhi, India [F. No. 33-169/2007 (SR)] and Council ofScientific and Industrial Research, New Delhi, India [F. No. 38(1165)/07/EMR II], for providing financial assistance towards thiswork. The first author also thanks University Grants Commission,New Delhi for the financial assistance as fellowship [F. No. 33-169/2007 (SR)]. The authors would also like to thank the anonymousreviewers for evaluation of this manuscript.
References
APHA, 2005a. Chromium—Colorimetric method. In: Eaton, A.D., Clesceri, L.S., Rice,E.W., Greenberg, A.E. (Eds.), Standard Methods for the Examination of Waterand Wastewater. American Public Health Association, American Water WorksAssociation. Water Environment Federation Joint Publication, USA, pp. 3(67).
APHA, 2005b. Phosphorus—Stannous chloride method. In: Eaton, A.D., Clesceri, L.S.,Rice, E.W., Greenberg, A.E. (Eds.), Standard Methods for the Examination ofWater and Wastewater. American Public Health Association, American WaterWorks Association. Water Environment Federation joint publication, USA, p. 4(152).
Bassi, M., Corradi, M.G., Favali, M.A., 1990. Effects of chromium in fresh water algaeand macrophytes. In: Wang, W., Gorsuch, J.W., Lower, W.R (Eds.), Plants forToxicity Assessment ASTM STP 1091. American Society for Testing andMaterials, Philadelphia, USA, pp. 204–224.
Beadle, C.L., Long, S.P., 1985. Photosynthesis—is it limiting to biomass production?Biomass 8, 119–168.
Cervantes, C., Gracia, J.C., Devars, S., Corona, F.G., Tavera, H.C., Torres-Guzman, J.C.,Moreno-Sanchez, R., 2001. Interactions of chromium with microorganisms andplants. FEMS Microbiol. Rev. 25, 335–347.
Chaoui, A., Mazhoudi, S., Ghorbal, M.H., Ferjani, E.L., 1997. Cadmium and zincinduction of lipid peroxidation and effects on antioxidant enzyme activities inbean (Phaseolus vulgaris L.). Plant Sci. 127, 139–147.
Clijsters, H., Cuypers, A., Vangronsveld, J., 1999. Physiological response to heavymetals in plants; defense against oxidative stress. Z. Naturforsch. 54c, 730–734.
Clijsters, H., Van Assche, F., 1985. Inhibition of photosynthesis by heavy metals.Photosynth. Res. 7, 31–40.
Cunningham, S.D., Berti, W.R., 1993. Remedaition of contaminated soils with greenplants: an overview. In vitro Cell. Dev. Biol. 29, 207–212.
Dazy, M., Béraud, E., Cotelle, S., Meux, E., Masfaraud, J-F., Fērard, J-F., 2008.Antioxidant enzyme activities as affected by trivalent and hexavalentchromium species in Frontinalis antipyretica Hedw. Chemosphere 73, 281–290.
Dhindsa, R.S., Plumb-Dhindsa, P., Thorpe, T.A., 1981. Leaf senescence: correlatedwith increased levels of membrane permeability and lipid peroxidation, anddecreased levels of superoxide dismutase and catalase. J. Exp. Bot. 32, 93–101.
Dube, B.K., Tewari, K., Chatterjee, J., Chatterjee, C., 2003. Excess chromium altersuptake and translocation of certain nutrients in citrullus. Chemosphere 53,1147–1153.
Eastoe, J.E., Pollard, A.G., 1950. A modified phenol disulphonic acid method fordetermining nitrates in soil extracts etc. J. Sci. Food Agric. 1, 266–269.
Eixler, S., Karsten, U., Selig, U., 2006. Phosphorus stored in Chlorella vulgaris(Trebouxiophyceae, Chlorophyta) cells and its dependence on phosphatesupply. Phycologia 45, 53–60.
Gajewska, E., Sklodowska, M., Slaba, M., Mazur, J., 2006. Effect of nickel onantioxidant enzyme activities, praline and chlorophyll contents in wheatshoots. Biol. Plantarum. 50, 653–659.
Ganesh, K.S., Baskaran, L., Rajasekaran, S., Sumathi, K., Chidambaram, A.L.A.,Sundaramoorthy, P., 2008. Chromium stress induced alterations in biochemicaland enzyme metabolism in aquatic and terrestrial plants. Colloid Surf. B. 63,159–163.
Holdford, I.C.R., 1997. Soil phosphorus: its measurement, and its uptake by plants.Aust. J. Soil Res. 35, 227–240.
Hossain, M.D., Hanafi, M.M., Saleh, G., Foroughi, M., Behmaram, R., Noori, Z., 2012.Growth, photosynthesis and biomass allocation of different kenaf (Hibiscuscannabinus L.) accessions grown on sandy soil. Aust. J. Crop Sci. 6, 480–487.
Kasmiyati, S., Santosa, 2000. Sulfate amelioration of chromium toxicity on waterspinach (Ipomoea reptans Poir.). Biologia 2, 599–613.
Kato, M., Shimizu, S., 1987. Chlorophyll metabolism in higher plants. VII. Chlor-ophyll degradation in senescing tobacco leaves; phenolic-dependent perox-idative degradation. Can. J. Bot. 65, 729–735.
Kuhl, A.P., 1974. In: Stewart, W.D.P. (Ed.), Algal Physiology and Biochemistry.Blackwell Scientific, Oxford UK, pp. 636–654.
Langner, C.L., Hendrix, P.F., 1982. Evaluation of persulphate digestion method forparticulate nitrogen and phosphorus. Water Res. 16, 1451–1454.
Maclachlan, S., Zalik, S., 1963. Plastid structure, chlorophyll concentration, and freeamino acid composition of a chlorophyll mutant barley. Can. J. Bot. 41,1053–1062.
Mallick, N., Shardendu, Rai L.C., 1996. Heavy metal toxicity of macrophytes withspecial reference to its removal. Biomed. Environ. Sci. 9, 399–407.
Malmir, H.A., 2011. Comparison of antioxidant enzyme activities in leaves stemsand roots of Sorghum (Sorghum bicolor L.) exposed to Cr (VI). Afr. J. Plant Sci. 5,436–444.
Minami, M., Yoshikawa, H., 1979. A simplified assay method of superoxidedismutase activity for clinical use. Clin. Chim. Acta. 92, 337–342.
Odjegba, V.J., Fasidi, I.O., 2004. Accumulation of trace elements by Pistia stratiotes:implications for phytoremediation. Ecotoxicology 13, 637–646.
Panda, S.K., Choudhury, S., 2005. Chromium stress in plants. Braz. J. Plant Physiol.17, 95–102.
Powell, N., Shilton, A., Chisti, Y., Pratt, S., 2009. Towards a luxury uptake processvia microalga—Defining the polyphosphate dynamics. Water Res. 43,4207–4213.
Powell, N., Shilton, A., Pratt, S., Chisti, Y., 2008. Factors influencing luxury uptake ofphosphorus by microalgae in waste stabilization ponds. Environ. Sci. Technol.42, 5958–5962.
Rahman, M.A., Rahman, M.M., Kadohashi, K., Maki, T., Hasegawa, H., 2011. Effect ofexternal iron and arsenic species on chelant-enhanced iron bioavailability andarsenic uptake in rice (Oryza sativa L.). Chemosphere 84, 439–445.
Reddy, K.R., Kadlec, R.H., Flaig, E., Gale, P.M., 1999. Phosphorus retention in streamsand wetlands: A review. Crit. Rev. Environ. Sci. Technol. 29, 83–146.
Shanker, A.K., Djanaguiraman, M., Sudhagar, R., Chandrashekar, C.N., Pathmanab-han, G., 2004. Differential antioxidant response to ascorbate glutathione path-way enzymes and metabolites to chromium speciation stress in green gram(Vigna radiata (L.) R. Wilczek. cv CO4) roots. Plant Sci. 166, 1035–1043.
Shanker, A.K., Pathmanabhan, G., 2004. Speciation dependant antioxidant responsein roots and leaves of Sorghum (Sorghum bicolor (L) Moench cv CO 27) under Cr(III) and Cr(VI) stress. Plant Soil 265, 141–151.
Shardendu, S., Sayantan, D., Sharma, D., Irfan, S., 2012. Luxury uptake and removalof phosphorus from water column by representative aquatic plants and itsimplication for wetland management. ISRN Soil Sci. 2012, 1–9, http://dx.doi.org/10.5402/2012/516947.
Shardendu, Ambasht, R.S., 1991. Relationship of nutrients in water with biomassand nutrient accumulation of submerged macrophytes of a tropical wetland.New Phytol. 117, 493–500.
Shardendu, Salhani, Boulyga, N., Stengel, E., S.F., 2003. Phytoremediation ofselenium by two halophyte species in sub-surface flow constructed wetland.Chemosphere 50, 967–973.
Singh, B.P., Tandon, P.K., 2009. Effect of water pollution on Pistia stratiotes in riverSuheli of Dudhwa National Park and river Gomti of Lucknow city. Res. Environ.Life Sci. 2, 173–178.
Sinha, S., Saxena, R., Singh, S., 2005. Chromium induced lipid peroxidation in plantsof Pistia stratiotes L.: role of antioxidants and antioxidant enzymes. Chemo-sphere 58, 595–604.
Spence, D.H.N., Millar, E.A., 1963. An experimental study of the infertility of aShetland serpentine soil. J. Ecol. 51, 333–343.
Stohs, S.J., Bagchi, D., 1995. Oxidative mechanisms in the toxicity of metal ions. FreeRadical Biol. Med. 18, 321–336.
D. Sayantan, Shardendu / Ecotoxicology and Environmental Safety 95 (2013) 161–170170
Subrahmanyam, D., 2008. Effects of chromium toxicity on leaf photosyntheticcharacteristics and oxidative changes in wheat (Triticum aestivum L.). Photo-synthetica 46, 339–345.
Turner, M.A., Rust, R.H., 1971. Effects of chromium on growth and mineral nutritionof soybeans. Soil Sci. Soc. Am. J. 35, 755–758.
Unnikannan, P., Sundaramoorthy, P., Baskaran, L., Ganesh, K.S., Chidambaram, A.L.A.,2011. Assessment of chromium phytotoxicity in some aquatic weeds. Bot. Res.Int. 4, 13–18.
Upadhyay, R., Panda, S.K., 2010. Influence of chromium salts on increased lipidperoxidation and differential pattern in antioxidant metabolism in Pistiastratiotes L. Braz. Arch. Biol. Technol. 53, 1137–1144.
Vardanyan, L.G., Ingole, B.S., 2006. Studies on heavy metal accumulation in aquaticmacrophytes from Sevan (Armenia) and Carambolim (India) lake systems.Environ. Int. 32, 208–218.
Voronin, P.Yu, Konolvalov, P.V., Zijun, M., 2003. Photosynthesis limits carbonsequestering in the Taiga zone of northeastern Europe. Russ. J. Plant Physiol.50, 108–111.
Walinga, I., van Der Lee, J.J., Houba, V.J.G., Vark, W., Novozamsky, I., 1995. PlantAnalysis Manual. Kulwer Academic Publisher, Dordrecht, the Netherlands.
Wallace, A., Soufi, S.M., Cha, J.W., Romney, E.M., 1976. Some effects of chromiumtoxicity on bush bean plants grown in soil. Plant Soil. 44, 471–473.
Welch, E.B., Lindell, T., 1992. Nutrient cycles, In: Ecological Effects of WastewaterApplied Limnology And Pollutant Effects, second ed. F & FN Spon, Taylor andFrancis Group, UK, pp. 54-81.
Zayed, A., Lytle, C.M., Qian, J.H., Terry, N., 1998. Chromium accumulation, transloca-tion and chemical speciation in vegetable crops. Planta 206, 293–299.
Zou, J., Wang, M., Jiang, W., Liu, D., 2006. Chromium accumulation and its effects onother mineral elements in Amaranthus viridis L. Acta Biol. Crac. Ser. Bot. 48,7–12.
Zou, J., Yu, K., Zhang, Z., Jiang, W., Liu, D., 2009. Antioxidant response system andchlorophyll fluorescence in chromium (VI)- treated Zea mays L. seedlings. ActaBiol. Crac. Ser. Bot 51, 23–33.