Roger Williams UniversityDOCS@RWU
Construction Management Theses School of Engineering, Computing, andConstruction Theses
5-5-2013
American Architectural, Engineering andConstruction Companies Working in the GreenBuilding Industry in the Republic of IndiaMatthew O. HarbourRoger Williams University, [email protected]
Follow this and additional works at: http://docs.rwu.edu/construction_thesesPart of the Construction Engineering and Management Commons
This Thesis is brought to you for free and open access by the School of Engineering, Computing, and Construction Theses at DOCS@RWU. It hasbeen accepted for inclusion in Construction Management Theses by an authorized administrator of DOCS@RWU. For more information, pleasecontact [email protected].
Recommended CitationHarbour, Matthew O., "American Architectural, Engineering and Construction Companies Working in the Green Building Industry inthe Republic of India" (2013). Construction Management Theses. Paper 2.http://docs.rwu.edu/construction_theses/2
American Architectural, Engineering and Construction Companies Working in the Green
Building Industry in the Republic of India
MATTHEW O. HARBOUR
Master of Science
Construction Management
School of Engineering, Computer Science and Construction Management
Roger Williams University
May 2013
iii
Dedication
This thesis is dedicated to my mother Rev. Cecilia C. Perry, who has given me the inspiration to
attain a Master’s Degree, and to my father Clifford O. Harbour an international construction
worker, who has developed my interest in international construction, and, with whom I have
worked in Saudi Arabia.
Acknowledgements
I would like to give special thanks to my thesis chair, Dr. Gokhan Bilge Celik for his support and
advice in preparing my thesis. I would also like to give special thanks to Dr. Janet Baldwin, Dr.
Printi Panday, and Dr. Michael Emmer for their support and review of my thesis.
iv
TABLE OF CONTENTS
ACKNOWLEDGMENTS iii
LIST OF FIGURES vi
LIST OF TABLES vii
KEY TO ABBREVIATIONS vii
ABSTRACT ix
DEDICATION iii
CHAPTER ONE 1
1 INTRODUCTION 1
1.1 Problem Statement 1
1.2 Research Questions 4
1.3 Objective 5
1.4 Significance of Topic 6
2 LITERATURE REVIEW 12
2.1 The Kyoto Protocol and the Establishment of the Carbon Market 18
2.2 The Clean Development Mechanism 19
2.3 A Model of The Energy and Resources Institute 22
2.4 A Model of the Ministry of New and Renewable Energy 23
2.5 A Model of the Green Rating for Integrated Habitat Assessment 24
2.6 A Model of the Association for Development and Research on Sustainable 27
Habitats
2.7 A Model of Leadership in Energy and Environmental Design, LEED-India 28
2.8 Outline of the National and Local Building Regulations in India 30
2.9 American and Indian Business Incentives 36
2.10 Business Opportunities in India 38
2.11 A Description of the 2007 Recession 54
2.12 A Case Study of the Development Alternatives World Headquarters 58
v
2.12.1 Heating and Cooling 61
2.12.2 Building and Wall Construction 62
2.12.3 Building Structure 63
2.12.4 Water Systems 64
2.12.5 Energy Systems 64
3 METHODOLOGY 66
3.1 Literature Review 67
3.2 Implementation of LEED India 68
3.3 Survey Instrument/Questionnaire 70
3.4 Development Alternatives Case Study 72
4 RESULTS 75
4.1 Results of the Literature Review 76
4.2 Results of LEED India 78
4.3 Results of the Survey 80
4.4 Results of the Development Alternatives Case Study 100
4.5 The Process Decision Model 107
5 CONCLUSION AND RECOMMENDATIONS 112
5.1 Research Conclusion 112
5.2 Research Recommendations 115
REFERENCES 116
APPENDIX A GRIHA Registration form. 123
APPENDIX B: Questions used in interview with Development Alternatives 125
APPENDIX C : LEED India NC IGBC – 2007 and LEED NC USGBC – 2009 132
vi
APPENDIX D: Questions used in the online survey instrument 138
APPENDIX E: Construction Procedures in India 141
APPENDIX F: Steps Required to Start a Business in India 143
LIST OF FIGURES
Figure 1. Climate Zone Map of India 16
Figure 2. GRIHA Process Flow Diagram 27
Figure 3. Time Line of Building Codes-Energy Standards–Green Building Certification 35
Figure 4. Structure of India’s Building Code–Integration of Environmental Sustainability 36
Figure 5. Development Alternatives Old World Headquarters 60
Figure 6. Building Exterior - Development Alternatives 63
Figure 7. Ferro – Cement Channels - Development Alternatives 64
Figure 8. Building Exterior – Development Alternatives 65
Figure 9. Urban Pots Used as Fillers in Ceiling 65
Figure 10. Model of LEED IGBC – 2011 vs. LEED USGBC – 2009 79
Figure 11. Question One Bar Chart 82
Figure 12. Question Two Bar Chart 85
Figure 13. Question Three Bar Chart 86
Figure 14. Question Four Bar Chart 87
Figure 15. Question Five Bar Chart 89
Figure 16. Question Six Bar Chart 92
Figure 17. Question Seven Bar Chart 94
Figure 18. Question Eight Bar Chart 96
Figure 19. Question Nine Bar Chart 98
Figure 20. Process Decision Model 108
Figure 21. Process Decision Model 109
Figure 22. Process Decision Model 110
Figure 23. Process Decision Model 111
LIST OF TABLES
Table 1. Unemployment rates (in percent) Adjusted to U.S. Concepts 7
vii
Table 2. The GRIHA Rating System and Point Assignment per Rating 25
Table 3. Essential Features of ECBC 33
Table 4. Hourly Cost of Labor in India and Cost of Materials in India 41
Table 5. India - Cost of Key Trades 42
Table 6. Economic Indices: Construction Cost Indices (CCI) 43
Table 7. Comprehensive Architectural Services 45
Table 8. FDI in Foreign Countries January 21, 2013 48
Table 9. Green Goods and Services Employment by Industry Sector 57
Table 10. Question One Cross Tabulation Table 82
Table 11. Question Four Cross Tabulation Table 88
Table 12. Question Five Cross Tabulation Table 90
Table 13. Question Six Cross Tabulation Table 92
Table 14. Question Seven Cross Tabulation Table 94
Table 15. Question Eight Cross Tabulation Table 97
Table 16. Question Ten Cross Tabulation Table 99
KEY TO ABBREVIATIONS
AEC: Architectural Engineering and Construction ix
GHG: Green House Gases 3
USGBC: United States Green Building Council 3
GDP: Gross Domestic Product 6
ENR: Engineering News Record 7
LEED: Leadership in Energy and Environmental Design ix
BREEAM: Building Research Establishment Environmental Assessment Method 9
CASBEE: Comprehensive Assessment System for Built Environment Efficiency 9
GRIHA: Green Rating for Integrated Habitat Assessment ix
DGNB: German Sustainable Building Council 9
IGBC: Indian Green Building Council 10
ACPs: Alternative Compliance Path 10
IEA: International Energy Agency 13
viii
ECBC: Energy Conservation Building Code 15
SBCCI: Southern Building Code Congress International 16
BOCA: Building Officials Code Administrator International 16
ICBO: International Conference of Building Codes 16
EPBD: European Energy Performance in Buildings Directive 17
IECC: International Energy Conservation Code: 17
UNFCCC: United Nations Framework Convention on Climate Change 18
ASHRAE: American Society of Heating, Refrigeration and Air-Conditioning Engineers 19
ECBC: Energy Conservation Building Code 19
CER: Certified Emissions Reductions 20
tCER: Temporary Certified Emissions Reductions 20
lCER: Long Term Certified Emissions Reductions 20
CDM: Clean Development Mechanism 21
TERI: The Energy and Resources Institute 22
MNRE: Ministry of New and Renewable Energy 22
ADaRSH: Association for Development and Research on Sustainable Habitats 22
MNES: Ministry of Non-Conventional Energy Sources 23
NBER: National Bureau of Economic Research 28
CEA: Central Electricity Authority 31
ECA: Energy conservation Act 31
BEE: Bureau of Energy Efficiency 32
ULB: Urban Local Bodies 34
GDCR: General Development Control Regulation 35
CIDC: Construction Industry Development Council 38
COA: Council of Architecture 45
JV: Joint Venture 44
IJV: International Joint Venture 46
ICJV: International Construction Joint Venture 47
FDI: Foreign Direct Investment 48
BLS: Bureau of Labor Statistics 56
IIA: Indian Institute of Architecture 70
ix
ABSTRACT
This research paper has addressed the problem statement "Too few American Architectural,
Engineering, and Construction (AEC) companies are participating in the green building market
in the Republic of India." This paper provides a conceptual model to support American AEC
companies to become involved in the green building market in the Republic of India. This
model is a result of a literature review, an analysis of an online survey and a personal interview.
This paper addresses the need for American AEC companies to remain competitive in the green
building market in the Republic of India. This paper provides a brief history of the Kyoto
Protocol and how its goals promote green building. This paper outlines the national and local
building regulations in India. This paper has researched the steps, which need to be taken by
American AEC companies to successfully apply for and implement Green Rating for Integrated
Habitat Assessment (GRIHA), and or Leadership in Energy and Environmental Design (LEED)
India.
Chapter One
Introduction
The increased interest in green building taking place in India is creating opportunities for growth
in the green building industry that is unprecedented. With the use of green building principles,
India has the opportunity to create urban townships that will allow its citizens to live in
communities with a healthy and sustainable environment. At the same time, India can meet the
challenges that climate change presents by using materials and building methods that reduce the
emissions of greenhouse gases. Unlike developed countries that must retrofit their existing
buildings to meet energy efficiency goals, India has the opportunity to design and construct
buildings that will be energy efficient for its future generations. While India creates a healthy
living environment for its residents, it also has the opportunity to educate and train its citizens for
jobs that will use the latest technologies, to manufacture building materials that meet green
building standards. This research paper will explore opportunities for American companies to
bring their knowledge, skills, and technologies into the growing, green building market in India.
1.1 Problem Statement
Green building and sustainable building practices are becoming more common in the design and
construction of building taking place in developing countries across the globe. The Office of the
Federal Environmental Executive of the United States of America defines green building as “the
practice of increasing the efficiency with which buildings and their sites use energy, water, and
materials, and reducing building impacts on human health and the environment, through better
2
siting, design, construction, operation, maintenance, and removal – the complete building life
cycle” (Hennicke, Schleicher, & Shrestha, 2011). One of the developing countries where this is
taking place is the Republic of India. “In India, with a value of 22%, the construction sector is
responsible for the highest share of carbon dioxide emissions, and previous research has
demonstrated that the use of alternative building technologies can reduce drastically (up to 50%)
the embodied energy of the production processes” (Kotak, Pittet, 2009). Embodied energy is,
the energy that is expended during the manufacturing of a product, from the point the raw
materials are extracted from the earth, to the point where the finished product is delivered and
installed for use. (Basiago, 1998) states “The doctrine of “sustainable development” derives
from a discipline in economics that has been evolving for almost two centuries.” Basiago (1998)
goes on to say “In An Essay on the Principle of Population (1798), Malthus framed the
fundamental tenet of environmentalism-namely, that because human population tends to grow in
a geometric progression while subsistence can grow in only an arithmetic progression,
population growth is determined to be checked by natural resource depletion and inevitable
human want and misery.” World leaders, environmentalists, architects, engineers and
constructors have come to understand that there is a relationship between the philosophy and
methods used to construct buildings, and the state of the global environment. “As we enter a
new century we are recognizing the “side effects” of our activities: pollution, landfills at
capacity, toxic waste, global warming, resource and ozone depletion, and deforestation. These
efforts are straining the limits of the Earth’s “carrying capacity” - its ability to provide the
resources required to sustain life while retaining the capacity to regenerate and remain viable.”
(United States Green Building Council, 1996). To meet the challenges that accompany this new
awareness regarding our environment, sustainability, and green building have been recognized as
3
a means, which will begin to reduce green house gases (GHG) and other pollutants that are now
depleting the resources of the earth.
There are a number of rating systems, which are used to accomplish the goal of becoming
certified as a green building to include:
“Leadership in Energy and Environmental Design” (LEED) “The United States Green
Building Council” (USGBC) system.
In the United Kingdom, the green building rating systems is “Building Research
Establishment Environmental Assessment Method” (BREEAM).
The rating system in Germany is known as the “German Sustainable Building
Council” (DGNB).
Japan has its own rating system the “Comprehensive Assessment System for Built
Environment Efficiency” (CASBEE).
The Republic of India uses the “Green Rating for Integrated Habitat Assessment”
(GRIHA).
The Indian Green Building Council (IGBC) that offers several rating systems. They
are the IGBC Green Homes; IGBC Green Townships; IGBC SEZ; IGBC Green
Factory Building; IGCB Green Landscape; LEED India for New Construction; LEED
India for Core and Shell. This research paper will provide analysis and a model for
LEED India 2011 for New Construction & Major Renovations.
Several different countries are now witnessing their certifications systems becoming popular in
other countries. A scheme of BREEAM can be used in several countries such as the
4
Netherlands, Norway, Spain, and Sweden. LEED now offers a draft Alternative Compliance
Path (ACPs) which can be used for projects outside of the United States. An article in the New
York Times published on March 7th
2012, and written by Kate Galbraith (2012), “International
Interest Grows in Green-Building Certification,” reports, “about 5,700 projects outside the
United States have registered for LEED. Of these, the largest number (including both
certifications and registrations) are in China, followed by the United Arab Emirates, Brazil,
Canada, India, Mexico, and Germany.”
This expansion in interest across the globe in green building has created opportunity for
companies who are interested in international construction projects. “In India the current annual
investment in construction is around $70 billion, with an identified need for an additional $50
billion and a projected annual growth rate of 15%” (Arif, Ebohon, Egbu, Abid, & Khalfan,
2009). It is estimated that over the next ten years the supporting infrastructure will need an
investment of around $163 billion (Arif et al., 2009). American AEC companies are missing a
large opportunity by not taking advantage of the potential economic rewards that can be reaped
by entering a new and emerging market in the Republic of India. Too few American AEC
companies are participating in the green building construction market in the Republic of India.
1.2 Research Questions
Questions presented in this research paper will address issues related to the current economic and
green building needs in the Republic of India:
5
Do systems presently exist, “both financially and technically,” which will allow green
building to take place at a level that will help address some of the potential
environmental problems in India?
Will the current economic differences between a developed country such as the
United States and an undeveloped country, such as the Republic of India support the
growth of American AEC companies in India?
1.3 Objective
This research paper will provide a conceptual process-decision model to support American AEC
companies to become involved in the green building market in the Republic of India. The
process-decision model will provide American AEC companies with the information necessary
to understand if the Republic of India offers a market for their companies select product or area
of expertise, by allowing the user to proceed through a step-by-step process-decision model,
which answers the following questions:
How competitive the market may be in their select area of specialization?
What professional licensing or registration may be required for their company to
practice its profession in the Republic of India?
What green building standards or requirements LEED India must meet to attain a
desired level of certification?
The Green building concepts such as those promoted by the LEED standards in the
United States, LEED India, and how they interact with each other will be detailed in
the model.
6
These models will inform American AEC companies how wide a range of opportunities exist for
American AEC companies interested in green building design and construction in the Republic
of India.
1.4 Significance of Topic
American AEC companies participating in the green building boom in the Republic of India can
serve several purposes. First: It would help employ a portion of the workers in the American
construction industry who are presently out of work, due to the deep recession in the United
States. Second: American architects with their broad understanding of green building practices,
would benefit economically by concentrating their efforts towards the green building market in
the Republic of India. Third: The emerging green building industry in the Republic of India will
benefit by learning the green building techniques that American AEC companies have already
developed to meet LEED, USGBC requirements. Fourth: The United States would maintain a
competitive edge in the growing technology that manufactures products used in green building.
It would also promote the United States position as a key player in the drive to reduce the
negative effect that GHG’s have because of our present building methods and technologies.
Table 1 presents the unemployment rates and Gross Domestic Product (GDP) growth rates in the
United States and other developed countries from 2006 to 2010. Accompanying this 2007 to
2009 recession was a drop in residential house prices. This had the result of slowing down, if not
bringing to a halt in some regions of the country the private construction sector. In the
construction and extraction industries, the number of workers who became unemployed
7
increased by 483,000 during the year 2010, which was a drop in employment in these industries
for the fourth consecutive year. (Hipple, Theodossiou, 2010). “Since its recent peak in the
fourth quarter of 2006, employment in this occupational category has declined 2.8 million.”
(Hipple, Theodossiou, 2010).
Table 1. Unemployment rates (in percent, listed as top statistic) Adjusted to U.S. Concepts.
Table includes GDP rates (listed as bottom statistic).
Year United
States
France Italy Sweden UK Germany Canada Australia Japan Nether-
lands
2006
GDP
4.6
2.7
8.9
2.5
6.9
2.2
7.0
4.3
5.5
2.6
10.3
3.7
5.5
2.8
4.8
3.1
3.6
2.0
4.3
3.4
2007
GDP
4.6
1.9
8.1
2.3
6.2
1.7
6.1
3.3
5.4
3.5
8.7
3.3
5.2
2.2
4.4
3.6
3.6
2.4
3.6
3.9
2008
GDP
5.8
-0.0
7.
-0.1
6.8
-1.2
6.0
-0.6
5.0
-1.1
7.6
1.1
5.3
0.7
4.2
3.8
4.7
-1.2
3.1
1.8
2009
GDP
9.3
-3.5
9.2
-2.7
7.9
-5.1
8.2
-5.2
7.7
4.4
7.8
-5.1
7.3
-2.8
5.6
1.4
4.8
-6.3
3.7
-3.5
2010
GDP
9.6
3.0
9.4
1.5
8.6
1.5
8.3
5.6
7.9
2.1
7.2
3.7
7.1
3.2
5.2
2.3
4.8
4.0
4.5
1.7
Unemployment rates adopted from March 30, 2011 U.S. Bureau of Labor Statistics, Division of
International Labor Comparisons, “International Comparisons of Annual Labor Force Statistics,”
Table 1-2. GDP rates adopted from (data.worldbank.org/indicator/NY.GDP.MKTP.KD.ZG)
Engineering News Record (ENR) has published a list of “The Top 200 International Design
Firms” (Reina, Tulacz, 2011) for 2011. Of the top 200 international design firms sixty-three or
31 percent are listed as based in the United States. Seventeen or 8.5 percent of these
international design firms are architectural firms or provide architectural services. Assume these
seventeen architectural firms have a combined twenty-one offices located in the Republic of
India. ENR has also listed “The Top 225 International Contractors” (Reina, Tulacz, 2011) for
2011. Of the top 225 international contractors, seventeen or 7.5 percent are based in the United
8
States. Assume these seventeen contractors have a combined twenty-three offices located in the
Republic of India. The Council of Architecture web site (Architecture, Registration Statistics,
2013) provides the following information regarding the number of architects in India.
“Qualification Wise Registration (As on 30.09.2011) Total: 40,901.” If it were assumed that
there is one American architect or one American constructor in every one of the combined forty-
four American company’s office, it would mean that there was one American architect or
constructor for every nine hundred and thirty architects that were not from the United States in
the Republic of India.
There are several countries, which are competing to gain an advantage in the global green
building or renewable energy market. Many of our nation’s leaders recognize this.
For example Muro, Rothwell, Saha (2010) states that “…..this year President Obama spoke in his
State of the Union Address of “the promise of renewable energy” and environmental pursuits
that will “strengthen our security, protect our planet, and create countless new jobs for our
people.” Since then, a global “race to clean” has gained new urgency with numerous nations-
such as China, Japan, and the United Kingdom-all having made new commitments to invest in
the low-carbon and environmental goods sector as a source of quality jobs, exports, and industry
growth.” It is imperative that the United States remain at the front of the pack when competing
with these countries in the green or renewable energy market. The Republic of India is one such
market that the United States should focus its support for AEC companies and workforce at to
remain competitive in these new emerging technologies. It is important for the leaders in
American government to recognize the importance of government incentives in supporting the
availability of funds for new startup companies and technology in this new and growing market.
9
One way this can be achieved is by supporting American AEC companies that are interested in
participating in the green building construction market in the Republic of India.
This research paper will benefit its readers by giving them an understanding of American
unemployment factors, which may contribute to American AEC companies working in a foreign
country. Economic benefits will also be realized as the reader will understand what economic
similarities and differences exist between different countries in their individual AEC industries.
Technological benefits that effect the environment will be recognized, from a greater
understanding of green building practices that may lead to further technological development in
the green building industry.
ORGANIZATION OF THESIS
This thesis will be organized in the following format:
The Table of Contents:
The table of contents informs the reader of the specific sections of the thesis, and their
page number.
The Abstract:
The Abstract informs the reader what the highlights of the thesis are.
The Introduction:
The introduction provides the reader with the purpose of the thesis and provides a broad
view of the topic.
The Literature Review:
10
The Literature review informs the reader where the current body of knowledge stands
regarding the topic of the thesis.
The Methodology:
The methodology section informs the reader what steps were taken to complete the
different research parts of the thesis, and what choices were made to do the analysis of
the thesis.
The Results:
The results section of the thesis presents and explains the data collected, because of the
research.
The Conclusion:
The conclusion will provide a proposition proposed by the researcher that has been
reached through the process of inference.
References:
The reference section documents the research sources that have been used by the
researcher.
Appendices:
The appendices provide tables and charts used to support the thesis.
LIMITATIONS
The limitations of this research paper are the geographical distance, which separates the
researcher and certain aspects of the topic being studied. Statistical data identifying the
American unemployment rate, India’s environmental need to build green and how it may reduce
11
GHG’s, and economic factors and how they pertain to wages, cost of local labor, material and
construction procedures are available, and do not present limitations to the research. A study of
the cultural norms that create the fabric of the different sectors of Indian society may be
researched. However, the research will not be able to accurately convey how something as
simple as a person’s sense of time may affect interaction between the research and persons
participating in the research. A statement as simple as “time is fleeting” may have an entirely
different meaning to a person who has been acclimated to daily life by the amount of time they
have spent experiencing what is accepted as normal, as opposed to a person who may be
attempting to meet deadlines the participant is unaware of or has not experienced. These
differences may exist between the researcher and the participants of the culture being researched,
and could present limitations to the research.
SUMMARY
The pace and volume of construction that is taking place in the Republic of India provides the
American AEC industry the opportunity to become accepted in a part of the world where
development will continue for years to come. By using a process decision model, companies
will be able to identify if a market exists in India for their specific niche, and companies will be
able to apply their resources efficiently to take advantage of potential areas of growth. Both
American and Indian companies will be able to advance their green building technology and
understanding of how it can be applied in a country with a climate as diverse as India’s. By
helping the Republic of India meet the level of green building taking place, American companies
will maintain a competitive position in the growing global interest in green building.
12
Chapter Two
Literature Review
The current practices, processes, and procedures in the AEC community are reflective of the
acceptance of sustainable building practices in each individual country. “In the global context,
sustainable construction is defined as a holistic process starting with the extraction of raw
materials, continuing with the planning, design, and construction of buildings, and ending with
their demolition and management of the resultant waste” (Erten, Korkmaz, Potbhare, & Syal,
2009). The needs of energy efficiency and sustainable construction require that developed and
developing countries apply policies that create codes and standards that governing bodies can use
to monitor and control the design, construction, demolition and recycling of building materials,
to meet the goals and ideals of the view stated in the article by Erten, Korkmaz, Potbhre, and
Syal. (2009) It will be important for each country to assess its own social and economic needs
in relation to the global community as we live in a world with a collection of differing values,
view points, and climates, where countries seek to improve their own population’s interests
through the reduction of energy use and waste management, as it pertains to sustainable
construction.
Over the course of this century, the relationship between the human world and the
planet that sustains it has undergone a profound change. When the century began,
neither human numbers nor technology had the power to radically alter planetary
systems. As the century closes, not only do vastly increased human numbers and
their activities have the power, but the major, unintended changes are occurring in
the atmosphere, in soils, in waters, among plants and animals, and in the
relationships among all of these. The rate of change is outstripping the ability of
scientific disciplines and our current capabilities to assess and advise. It is
frustrating the attempts of political and economic institutions, which evolved in a
different, more fragmented world, to adapt and cope. (Report of the World
Commission on Environment and Development, 1987) (WCED)
13
These views put forth in the WCED 1987 report and many like them are believed to have been
one of the milestones in the green building movement in the United States. Following this
introduction is an assessment of sustainable practices, processes, and procedures and a brief
history of their formation with codes and regulations as they currently exist in the AEC industry.
“The way countries achieve sustainable development will vary among the many different
political and economic systems around the world. Government differs greatly in their capacity to
monitor and evaluate sustainable development, and many will need assistance” (Erten, Korkmaz,
Potbhare, & Syal, 2009).
Although it is understood that many human practices waste energy, it was the oil crisis in the
1970’s that ignited the current concern over energy efficiency, which has evolved during the
1980’s and 1990’s to its present state. An organization that has played a key role in the global
drive for energy efficiency is the International Energy Agency (IEA). “The IEA is an
autonomous body which was established in November 1974 within the framework of the
Organization for Economic Co-operation and Development to implement an international energy
programme” (Laustsen, 2008). The IEA has many functions that promote the balance of oil
supply and distribution on the global stage. Several of the goals of the IEA work hand in hand
with the concept of energy efficiency and sustainability. These are:
“To improve the world’s energy supply and demand structure by developing
alternative energy sources and increasing the efficiency of energy use.”
To support the international community to work together on energy technology.
To help integrate energy and environmental policies (Laustsen, 2008).
14
The IEA statistics for energy balance for 2004-2005, (2007 edition) has reported that world
energy use is 7209 Mtoe (Mega Tonnes Oil Equivalents), and is distributed among the following
sectors at the following percentage: Industry usage is 29.0%, Residential usage is 27.1%
Commercial usage is 8.8%, Other sectors are 4.8%, Transport is 30.3%. The energy used in the
commercial and residential sectors is 35.9% combined, and is used mainly within buildings.
Lausten (2008) states “the energy efficiency of new buildings determines the building sectors
energy consumption for far longer than other end-use sectors components determine their sectors
efficiency. Buildings will typically be constructed to be used for many decades and, in some
cases, for more than a hundred years. In other energy end uses, the capital lifetime for efficiency
improvement will be, at most, a few decades.” It is good practice that energy efficiency becomes
a goal for every building. The proportion of buildings that exist, which were not designed or
built with energy efficiency as the main criteria, is greater in number in developed countries. In
some developing countries such as China or India, which are now experiencing a development
boom in buildings, the opportunity still exists to design and construct buildings, which can meet
current energy efficiency goals. “In developing countries a high consumption in new buildings
will increase the demand for new supply and grid capacity. In these nations, the general benefit
of improved efficiency in new buildings can be seen more quickly and will be felt more
profoundly” (Laustsen, 2008). In an article written by Sarosh Bana (2012) the author states
“Grid-connected renewable power today accounts for as much as 20.2 GW – or 11% - of India’s
182.3 GW of installed power capacity. The majority share – 55%, or 99.8 GW – is still
accounted for by coal-based thermal power. Gas-fired thermal power, totaling 17.7 GW,
contributes an additional 10%, while the 38.7 GW of hydropower accounts for 21%, and nuclear
2.6% with 4780 MW.” Although this shows advancement in the use of energy production from
15
renewable sources, the amount of energy production from non-renewable sources will be used to
power buildings being constructed for many years to come.
The standards and building codes which a country chooses to adopt and use have a large
influence over its ability to meet energy efficiency goals as they pertain to buildings. In essence
the practices, processes and procedures which influence the AEC industry as it relates to energy
efficiency and sustainable building are in a large part due to the current standards and building
codes. Building codes can be developed at a national or regional level. Developed countries
with a large government usually develop building codes at a national level. Some countries still
have codes, which are developed at a regional level, however, this is no longer considered
common. Countries that have varying climates such as regions that are considered desert and
regions that experience a winter season where temperatures can average below freezing for days
at a time usually provide variables in their national codes, which can be prescribed at the local
level. One example of climate classification is the Koppen Climate Classification system. This
system “proposes six general climate types: A) tropical; B) dry; C) mild latitude; D) severe
latitude; E) polar; and H) for highland. Each of these classes is divided into sub categories
according to the type of winter or summer. The 6 basic climates are subdivided into at least 23
different sub-climates” (Laustsen, 2008). India’s Energy Conservation Building Code (ECBC)
recognizes five different climate zones. Figure one, illustrates, the Climate Zone Map of India.
“The five climate zones illustrated in the following map are normally designated as hot and dry;
warm and humid; composite; temperate and cold. The classification of climates for different
types of buildings is an aid to the functional design of the building” (Energy Conservation
Building Code (ECBC) Users Guide 2011).
16
Figure 1. Climate Zone Map of India
Energy Conservation Building Code (ECBC) Users Guide
The United States had regional building codes up until the 1990’s. The Building Officials Code
Administrator International (BOCA) was used on the East coast and in the Midwest. The
Southern Building Code Congress International (SBCCI) was used in the South East. The
International Conference of Building Codes (ICBO) was used in the West and the Mid West. In
1997, these regional building codes ceased to be developed and were replaced by the
International building Code. Many countries have established their own energy efficiency
17
standards or are in the process of doing so. Some “examples are the US based energy efficiency
standards (IECC 204 and ASHRAE 2004) which are used in US and Canada, and the European
Energy Performance in Buildings Directive (EPBD) that required member states of the European
Union to establish requirements for energy efficiency in new buildings, effective January 2006”
(Laustsen, 2008). Some countries have developed their own energy efficient codes, however;
they have not been adopted as mandatory codes. An example is India’s Energy Conservation
Building Code. “ECBC sets the minimum energy performance standards for large commercial
buildings after taking into account the five major climatic regions of India” (Satish Kumar &
Ravi Kapoor, 2010).
There are several ways energy efficiency requirements are used; a brief description of each
method follows:
Prescriptive”: Energy efficiency requirements are set for each component of the
building” (Lassen, 2008).
Trade-off: “The trade-off method sets values for individual building parts and / or for
parts of the installations, akin to the prescriptive method” (Lassen, 2008).
Model Building: In model building method “values are set for each building part and /
or for the parts of the technical installations” (Lassen, 2008).
Energy frame: “The Energy Frame for a building sets a maximum of energy loss from
the building. This is usually set as a total frame for the building, a value pr. m
squared building area or as a combination” (Lassen, 2008).
18
Energy Performance: “a total requirement for the building is set based on the supply
of energy or the resulting environment impact, for instance in the form of CO2
emissions” (Lassen, 2008).
2.1 The Kyoto Protocol and the Establishment of the Carbon Market
“The Kyoto Protocol to the United Nations Framework Convention on Climate Change was
adopted in Kyoto, Japan, in December 1997 and entered into force on 16 February 2005”
(UNFCCC, 2008). It is the overall goal of the Kyoto Protocol to establish and keep an
accounting of the amount of GHG that is produced by the parties that have signed the Protocol.
One of the ways this is being done is by the putting a price on pollution and selling carbon
credits on the carbon market. “Conventional environmental economic theory holds that the way
to reduce the largest amount of pollution is to implement the most efficient pollution abatement
methods first (i.e. those which cost the least money per unit of pollution reduction)” (Fisher,
2009). Fisher goes on to point out in his report that “According to the World Bank the cost of
abating a ton of carbon dioxide is from $25 to well over $50 in developed countries, versus less
than $5 in developing countries” (Fisher, 2009). By restricting the amount of pollution allowed
to be emitted in developing countries, developed countries are able to continue emitting GHG by
not having to incorporate restrictions on their GHG producing industries. This is also called Cap
and Trade. Cap and Trade allows developed countries or annex B countries as they are known in
the Kyoto Protocol to continue to emit green house gases into the atmosphere, by purchasing
“certified emission reductions” (CER) on the carbon market from developing countries also
known as non-annex B countries. CER’s can be purchased on the Carbon Market using one of
19
the three market based mechanisms provided under the Kyoto Protocol. The global impact of
metric ton of a GHG as defined by the Protocol being Carbon dioxide (CO2); Methane (CH4);
Nitrous oxide (N2O); Hydro fluorocarbons (HFCs); per fluorocarbons (PFCs); and Sulphur
hexafluoride (SF6) is equal to one CER. The three mechanisms provided under the Kyoto
Protocol to trade on the Carbon Market are Emissions Trading; Clean Development Mechanism
(CDM) and Joint Implementation. This research paper will explain in the upcoming section how
a CDM is used as a mechanism to take advantage of cap and trade policies on the Carbon
Market, as this is one of the three mechanisms that is required to be associated with a specific
project.
2.2 The Clean Development Mechanism
The Clean Development Mechanism is an innovative mechanism that gives countries a degree of
flexibility in meeting the GHG emission reduction targets set by the Convention of Parties in
Kyoto Japan in 1998 (Cheng, C., Pouffary, S., Svenningsen, N., Callaway, M., 2008). “The
CDM was designed to meet two objectives, to assist Annex B Parties in complying with their
emission limitation and reduction commitments and to assist non Annex B Parties in achieving
sustainable development and in contributing to the ultimate objective of the United Nations
Convention on Climate Change” (UNFCCC, 2012). It is the ultimate objective of the UNFCCC
(2012) to “achieve a stabilization of atmospheric GHG concentrations at a level that will prevent
dangerous human induced interference with the climate system.” Through the creation of CER’s
this mechanism can also help some Annex B countries avoid placing restrictions on their existing
20
output of GHG by allowing Annex B countries to purchase CER’s, which can be traded on the
carbon market. This can also help in the funding of projects in developing countries.
Owners of projects that have CDM’s sell CER’s to buyers in developed countries. The money
that is acquired from the sale, minus the costs of the transaction, goes to the owner of the project.
Most of these owners are in developing countries. The money generated by the sale of CER’s is
estimated using the number of CER’s moved from the CDM registry, to the buyer, and
information of CER prices (UNFCCC, 2012). However, there is not a consistent use of CDMs
across all sectors of the building industry. As noted in the Kyoto Protocol Reference Manual
UNFCCC (2008) “CDM projects result in three types of Kyoto units. Certified emission
reductions (CERs) are issued for projects that reduce emissions, while temporary CERs (tCERs)
and long-term CERs (lCERs) may be issued for projects that enhance removals through
afforestation and reforestation projects.” One CER is equivalent to the removal or elimination of
one tone of CO2. “There is great interest among the promoters of Indian project, institutions
involved in financing, and, investing parties in the opportunities emerging out of the CDM”
(Michaelowa, Purohit, 2008). India has shown it is willing to support projects that use the CDM.
Due in part to government support, India has more registered CDM projects and CERs than any
country in the world except China. In March of 2009, India was host to 26.93% of the world’s
CDM projects. This accounted for 408 registered CDM projects. (Fisher, 2009) An example of
how the CDM and its use have grown can be shown, by the published information about the
number of projects using the CDM. In an article by Michaelowa and Purohit (2008) it is noted,
“The CDM project pipeline now contains 2,783 CDM projects (excluding the 46 rejected and the
9 withdrawn projects) until November 2007. 859 of the projects are now registered and a further
149 are in the registration process. 295 projects out of these are located in India.” In a Press
21
release by the United Nations Climate Change Secretariat dated 15 November 2012, the
following information was presented: “The Kyoto Protocol’s clean development mechanism
(CDM), the international market-based tool that incentivizes greenhouse gas emission reduction
projects in developing countries, has registered its 5,000th
project” (Abbass, 2012). The press
release goes on to read, “In less than 10 years, the CDM has attracted more than USD 215 billion
in investment in mitigation and has proven that carbon markets and market-based mechanisms
have the ability to bring in substantial private sector support for mitigation and sustainable
development” (Abbass, 2012).
It should be noted that some believe the CDM has not had the effect on energy reduction in
buildings as was intended. Cheng, C. et al. (2008) states “out of more than 3,000 Clean
Development Mechanism (CDM) projects in the pipeline (as of May 2008) only six seek to
reduce energy demand in buildings.” There are several reasons for CDM’s not having a greater
effect on the reduction of energy use in buildings. One of these is the additionality requirement.
The additionality requirement is defined by the Marrakech Accords as follows: “A CDM project
activity is additional if anthropogenic emissions of greenhouse gases by sources are reduced
below those that would have occurred in the absence of the registered CDM project activity”
(Cheng, C., Pouffary, S., Svenningsen, N., Callaway, M., 2008). It has been difficult to separate
what is based on policy and mandatory standards and what would be considered additionality.
“Mandatory standards and other policies are among the most effective mechanisms to mobilize
stakeholders to pursue energy efficiency improvements in buildings. By their inherent nature,
however, emissions reductions based on policies and standards can be argued not to be additional
to those that would occur otherwise, i.e., under law” (Cheng, C., Pouffary, S., Svenningsen, N.,
22
Callaway, M., 2008). In essence, it is up to those promoting the specific project to show that all
alternatives have been explored in enforcing mandatory regulations and if the applicable
regulations have not been enforced the project must prove this. “If the proposed project activity
is the only alternative amongst the ones considered by the project participants that is in
compliance with mandatory regulations with which there is general compliance, then the
proposed CDM project activity is not additional” (Cheng, C., Pouffary, S., Svenningsen, N.,
Callaway, M., 2008). The work involved to prove or disprove additionality may be a deterrent in
itself for the promoters of a specific project. These promoters may be working with a limited
administration budget and the costs of proving additionality may prevent the required procedure
from taking place.
2.3 A Model of the Energy and Resources Institute
Several agencies or entities are integral to green building in the Republic of India and deserve
definition. They are The Energy and Resources Institute (TERI); the Ministry of New and
Renewable Energy (MNRE); the Green Rating for Integrated Habitat Assessment (GRIHA); and
the Association for Development and Research on Sustainable Habitats. (ADaRSH) This
section will focus on TERI and its role in green building in India. The organization, TERI, was
created in 1974. It is the goal of TERI to address the problems humankind may face, that result
from the depletion of earth’s limited energy resources, that are non-renewable and cause
pollution through their use (TERI, 2012). TERI is a not for profit research organization.
23
TERI presently has its headquarters located in New Delhi, India. TERI also has offices in
Washington, DC; the United Kingdom; Addis Ababa, Ethiopia; Dubai; Malaysia and Tokyo,
Japan. As stated by R.K. Pachauri, the Director-General of TERI in the 2010-2011 annual report
……”TERI is now engaged in major development and dissemination of technologies related to
renewable energy-based lighting devices, modernization of cook stoves, and the spread of
technologies in agriculture and forestry, which are based on organic materials and their
derivatives” (TERI, 2012). This is one of TERI’s efforts in working to protect the environment
through its research in the fields of energy and sustainable resources. On April 24-25, 2012 the
“U.S. – India Energy Partnership Summit 2012” fostering innovations for a sustainable future
was held in Washington, D. C. The summit was organized by TERI, North America, and Yale
University. Some of the notable attendees were R.K. Pachauri. Dr. Richard C. Levin, President
of Yale University. Al Gore Jr., 45th Vice President of the United States of America, was
present via a video address. Dr. Charles K. Ebinger Senior Fellow and Director-Energy Security
Initiative, the Brookings Institute, and Mr. R. V. Kanoria, President, Federation of Indian
Chambers of Commerce, and Industry (FICCI) also attended the summit. This is the third year
the summit has been sponsored by TERI North America.
2.4 A Model of the Ministry of New and Renewable Energy
The MNRE addresses all matters that affect new and renewable energy, in India and is a
Ministry of the government of India. The MNRE was first established as the Ministry of Non-
Conventional Energy Sources (MNES) in 1992. The name was changed to the present name
MNRE in 2006. “The broad aim of the Ministry is to develop and deploy new and renewable
24
energy for supplementing the energy requirements of the country” (MNRE, 2012). Many
countries are beginning to view their dependence on fossil fuels as a security risk. One of the
reasons for this is in both the developed world and the developing world much of a countries
infrastructure depends on a continuous supply of energy, which is still mostly provided by fossil
fuels supplied by other countries. “The role of new and renewable energy has been assuming
increasing significance in recent times with the growing concern for the country’s energy
security. Energy self-sufficiency was identified as the major driver for new and renewable
energy in the country in the wake of the two oil shocks of the 1970’s” (MNRE, 2012). To
address the need for energy self-sufficiency the MNRE has undertaken the oversight of such
projects as the Jawaharlal Nehru National Solar Mission, which was launched on January 11th
2010.
2.5 A Model of the Green Rating for Integrated Habitat Assessment (GRIHA)
GRIHA is one of the rating systems that are used in India as the evaluation system for green
buildings. GRIHA is a Sanskrit word meaning adobe. GRIHA was conceived by TERI and the
MNRE. GRIHA was introduced in November of 2007 and has become accepted as a rating
system, which addresses an environment that is affected over the entire life cycle of the building.
The rating system of GRIHA has four categories, which contain thirty-four criteria. Each
criterion is assigned a number of points. A project that meets the criterion identified in the four
categories listed below would qualify for the points.
Site Selection and Site Planning: Objective: “To maximize the conservation and
utilization of resources (land, water, natural habitat, avi fauna, and energy
25
conservation) and enhance efficiency of the systems and operations” (GRIHA, Green
Rating for Integrated Habitat Assessment, 2012).
This category contains criteria one through nine.
Building Planning and Construction Stage: Objective: “To maximize resource
(water, energy, and materials) conservation and enhance efficiency of the system and
operations” (GRIHA, Green Rating for Integrated Habitat Assessment, 2012).
This category contains criteria ten through thirty-one.
Building Operation and Maintenance: Objective: “Validate and maintain ‘green’
performance levels/adopt and propagate green practices and concepts” (GRIHA,
Green Rating for Integrated Habitat Assessment, 2012).
This category contains criteria thirty-two and thirty-three.
Innovation: Commitment: “Four innovation points are available under the rating
system for adopting criteria which enhance the green intent of a project, and the
applicant can apply for the bonus points” (GRIHA, Green Rating for Integrated
Habitat Assessment, 2012).
GRIHA has a one hundred point rating system, as shown in Table 2. In order for a building to be
certified, a minimum of fifty points must be achieved.
Table 2. GRIHA Rating System and Point Assignment per Rating.
Points scored Rating
50-60 One star
61-70 Two star
26
71-80 Three star
81-90 Four star
91-100 Five star
The GRIHA Rating System (GRIHA, Green Rating for Integrated Habitat Assessment, 2012)
The GRIHA website, “Compendium” notes on May 5, 2013 under its “Registered Projects”
section that three hundred and twenty five buildings have been registered. Several of the
completed projects are the following:
CSE (Centre for Environmental Sciences & Engineering) Bldg.
IIT Kanpur, Uttar Pradesh.
Development Center ICT Link Road, adjoining Western Express Highway, Opposite
Bisleri Factory Andheri E, Mumbai 400 099.
Hindustan Unilever Limited.
GRIHA has earned its place among the green building rating systems that are used in India.
GRIHA is a rating system that has been prepared specifically to meet the needs of India, and has
done so by providing ratings for non air-conditioned and partial air-conditioned buildings.
The energy used in building construction, and, the energy used by existing buildings is
responsible for “40% of global energy use and 42% of the world’s greenhouse gas emissions”
(Majumdar, 2010). The process of implementing GRIHA begins with filling out and filing the
GRIHA registration Form online. An example of the GRIHA registration form can be found in
Appendix A. A Process Flow Diagram which shows the steps, which need to be taken to
27
successfully implement the GRIHA rating system has been provided in the “GRIHA Process
Flow Diagram” see Figure 2.
Figure 2. GRIHA Process Flow Diagram
Taken from: TERI User Manual – Information
Draft Version 1.0 November – 2011
2.6 A Model of the Association for Development and Research on Sustainable Habitats
The Association for Development and Research of Sustainable Habitats (ADaRSH) is the body
that is responsible for evaluating all buildings that apply for GRIHA rating. This is similar to the
role the Green Building Certification Institute (GBCI) has in its relationship with the United
States Green Building Council (USGBC). “All activities related to issuance of GRIHA Rating
are carried out by ADaRSH” (GRIHA, 2012). ADaRSH was founded by TERI and the MNRE.
A group of experts experienced in sustainability contributed to the establishment of ADaRSH. It
is also a responsibility of ADaRSH to promote the training of personnel who contribute to the
evaluation process, and for those who are interested in bringing a project to GRIHA for
28
certification. To do this ADaRSH offers training sessions and workshops. “To enable the active
dissemination of knowledge and skills necessary for designing new green buildings, ADaRSH
organizes a series of open registration workshops across the country” (GRIHA, Green Rating for
Integrated Habitat Assessment, 2012). ADaRSH is also in the process of engaging the
construction industry to develop an awareness of sustainability and green building to that sector
of the industry.
2.7 A Model of Leadership in Energy and Environmental Design, LEED 2011-India
LEED India 2011 for New Construction & Major Renovations, which is part of the IGBC green
building rating system, is a voluntary building rating system. It has been adopted to apply a
rating system specifically to new construction and major renovations in buildings. LEED India
consists of seven categories:
Sustainable Sites
Water Efficiency
Energy and Atmosphere
Materials & Resources
Indoor Environmental Quality
Innovation in Design Process
Regional Priority
“The LEED India rating system is managed by the IGBC, promoted by Confederation of Indian
Industry (CII) Godrej Green Business Centre. IGBC is comprised of key stakeholders in the
29
construction industry, including government, companies, architects, products manufacturers, and
research institutions” (Satish Kumar & Ravi Kapoor, 2010). LEED has become a rating system,
which is accepted on an international level; however, there is a debate over, which is the
appropriate rating system to use in India. Many of the commercial buildings presently being
built in India take advantage of the glass curtain wall systems of construction. These buildings
can be built at a relatively fast rate; however, they require heating and cooling systems which
may be more appropriate for a western style of construction that being a building which is
designed to use full time heating and cooling as opposed to a building that uses more of an
indigenous design and would use only part time heating and cooling. “Some of India’s recent
buildings have extremely high energy consumption for cooling owing to large glass surfaces
with very little sun protection” (Laustsen, 2008). In an article written by Mukhopadyay and Revi
(2009) it has been pointed out that these new buildings are designed and built to accommodate
behavior and customs, which have more of a western view of comfort. “There is also a
considerable role for behavior in determining actual energy consumption, especially so since
thermal comfort expectations vary widely across cultures” (Mukhopadyay & Revi 2009). It
should also be noted that many of the materials used in buildings that are built using glass curtain
walls and materials such as aluminum, are materials that have a high embodied energy level. As
noted, these types of commercial buildings do not use GRIHA as a rating system but use LEED
India. A model depicting the similarities of the LEED India NC IGBC – 2011 and LEED NC
USGBC – 2009 rating systems is provided in Chapter Four of this paper. A Comparative listing
of LEED India NC IGBC – 2011 and LEED NC USGBC – 2009 can be found in Appendix C.
30
2.8 Outline of the National and Local Building Regulations in India
This section provides an overview of the National and Local building Regulations that are
pertinent to sustainable green buildings in India. These National and Local building Regulations
should be understood by American (AEC) companies that are interested in participating in the
green building market in India.
Included in this Chapter and are:
Table 4 Essential Features of ECBC (May 2008 revised version)
A model of the development Time Line of Building Codes - Energy Standards –
Green Building Certification, including India’s three different building codes. The
National Building Code of India, The Environment Impact Assessment and
Clearance, and The Energy Conservation Building Code, which is not yet mandatory.
Refer to Appendix E for the table of “Construction Procedures in India.” These are
procedures that an AEC company would proceed through to begin and complete the
construction process.
Building codes have been in use since early civilization. This is due to the need to have a set of
building requirements or standards that protect the lives of the individuals who inhabit a
structure, and those who may be affected by structures in their surroundings. “One of the earliest
examples of regulations for buildings is Hammurabi’s law from Mesopotamia, established
around 1790 BC. Among the 282 rules or contracts which regulated every part of society, six
concern the construction of houses and penalties for builders” (Laustsen, 2008). The following
31
section will address the national and local building codes in India, both mandatory and those that
are not yet mandatory. The following paragraphs will show how these national and local codes
are instrumental in the use of energy efficiency design and construction methods as they effect
green building and how these methods should be utilized by those AEC companies interested in
working in the green building market in India.
With building energy usage amounting to “33%” (Satish Kumar & Ravi Kapoor, 2010) of
India’s energy consumption, India’s energy needs will increase dramatically over the next
several decades if India continues to develop its building infrastructure at the current pace. The
development of a standard or building code, which influences the construction of a building and
its energy use, is an important step in the process of controlling energy consumption by the use
of design and construction planning, and materials and methods. “According to the Central
Electricity Authority (CEA), electricity consumption in the commercial sector in India at present
accounts for about 9% of the total electricity consumption in the country” (Satish Kumar and
Ravi Kapoor, 2010). One of the advantages that India will have over developed countries is,
many of the buildings are a result of new construction. This will allow India to incorporate
energy efficiency into a larger portion of its building infrastructure. “Central Electricity
Authority (CEA) is a Statutory Body, constituted under the erstwhile Electricity (Supply) Act,
1948, hereinafter replaced by the Electricity Act 2003, where similar provisions exist, and the
office of the CEA is an “Attached Office” of the Ministry of Power” (CEA, 2012). To assist in
meeting the needs of the growing energy demand, “India has addressed the problem of energy
consumption in commercial buildings by enacting the Energy Conservation Act” (ECA 2001),
which came into force in 2001. The ECA promotes energy efficiency and conservation
32
domestically. ECA 2001 mandated the creation of the Bureau of Energy Efficiency (BEE),
which was established under the Ministry of Power in 2002. “The mission of the Bureau of
Energy Efficiency is to assist in developing policies and strategies with a thrust on self-
regulation and market principles, within the overall framework of the Energy Conservation Act
2001” (Bureau of Energy Efficiency, 2012). It is the primary goal of the ECA to reduce the
energy intensity of the economy in India. “ECA 2001 also authorized BEE to establish an
energy conservation building code” (Evans, Shui, & Somasundaram, 2009). This is an important
step in India’s recognition of its need to provide regulations, which will begin to assist the bodies
that regulate the design and construction of green buildings. Understanding and implementing
these regulations will allow the AEC community to help India meet goals, which are to prevent
India’s future energy needs from becoming a contributor to green house gases. One of the
regulations aimed at reducing India’s energy needs is the Energy Conservation Building Code,
2007 (ECBC). “In 2007, the Ministry of Power and BEE issued ECBC – the first stand alone
national building energy code in India” (Evans, Shui, & Somasundaram, 2009). Parts of the
ECBC have been modeled after ASHRAE 90.1 and several of the committee members of
ASHRAE were involved in the preparation of ECBC. “ECBC sets minimum energy
performance standards for commercial buildings that have an electrical connected load of 500kW
or greater or a contract demand of 600 kVA or more” (Satish Kumar & Ravi Kapoor, 2010). The
ECBC addresses the building envelope, HVAC and mechanical systems, lighting both interior
and exterior, hot water systems, the electrical power system, and motors (Satish Kumar & Ravi
Kapoor, 2010). The ECBC recognizes the five climate zones present in India. Refer to Table 3,
for the essential features of ECBC.
33
Table 3. Essential Features of ECBC (May 2008 revised version)
Section Number and Title Description
1 & 2. Purpose and Scope Minimum requirements for energy-efficient design and
construction of buildings and building complexes with
a connected load of 500kW or greater, or a contract
demand of 600 kVA or greater and a conditioned area
of >1,000 square meters.
3. Administration and Enforcement Mandatory (5) compliance for all applicable new
buildings, additions, and major renovations to existing
buildings.
Envelope Mandatory provisions and prescription criteria or trade-
off options
HVAC Mandatory provisions and either the prescriptive
criteria.
Service Hot Water and Pumping Mandatory provisions, including solar water heating for
at least 1/5 of design capacity, unless systems use heat
recovery.
Lighting Mandatory provisions and prescriptive criteria for
interior and exterior lighting features.
Electrical Power Mandatory provisions and prescriptive criteria for
interior and exterior lighting features.
Appendix A-Definitions,
Abbreviations, and Acronyms.
Definitions of terms, abbreviations, and acronyms in
the context of this code.
Appendix B –Whole Building
Performance Method
An alternative to the prescriptive requirements of the
code.
(CEA, 2012)Appendix C-Default
values for Typical Constructions.
Procedure for determining window efficiency (also
known as fenestration product U-factor), and the Solar
Heat Gain Coefficient (SHGC), as well as typical
thermal properties of common building and insulating
materials (from ASHRAE fundamentals Handbook,
2001)
Appendix D – Building Envelope
Tradeoff Method.
Procedure for calculating envelope performance factor
(EPF) and tables for EPF coefficients for the five
climate zones and the two buildings occupancy
schedules(6)
34
Appendix E – Building Zone Map
of India.
From the National Building Code 2005, Part 8, Figure
2.
Appendix F – Air-Side
Economizer Acceptance
Procedures.
Construction inspection and procedure for equipment
testing.
Appendix G – Compliance Forms. Envelope Summary, Building permit plans checklist,
mechanical summary, mechanical checklist, lighting
summary, and lighting permit checklist.
Source: (Evans, Shui, & Somasundaram, 2009)
Although it is an important step to create codes, which will regulate the construction of buildings
to reduce energy requirements, it is just as important that there be governing bodies that will
institute and administer these codes. “The responsibility for the implementation of codes
pertaining to building lies with the State Level Urban Local Bodies (ULBs)” (Satish Kumar &
Ravi Kapoor, 2010). Urban Local Bodies are the entities in India that provide a delivery
mechanism for the following services & utilities: power, water, telecommunications, sanitation,
solid waste disposal, land development, transportation, housing development, and numerous
other services (Garg & Sundar, 2005). India has three different building codes: The National
Building Code of India, The Environment Impact Assessment and Clearance, and The Energy
Conservation Building Code, which is not yet mandatory. A model of the development time line
of these Building codes, Energy Standards and Green Building Certification is shown in Figure
3. A model, which shows the Structure of India’s Building Code and the Integration of
Environmental Sustainability into the 2005 National Building Code of India, is shown in
Figure 4.
35
Time Line 1970 to 2011
1974 Establishment of The Energy and
Resources Institute (TERI)
1986 Environmental Protection Act was
passed in Parliament
2001 Formation of the Indian Green Building Council
2002 The Bureau of Energy Efficiency (BEE) was formed
1970 National Building Code Of
India. Amendments issued, two in 1987
and the third in 1997
2006 Environmental Clearance from State
Level Environment Impact Assessment Authority, Required
Jan. 2007 LEED India (established) LEED India Version 1.0
May 2007 Energy Conservation
Building Code (ECBC)
Nov 2007 GRIHA (Established)
2009 ECBC User Guide for Building
with 500kW or 600kVA
2010 ECBC for Building with 100kW
or 120 kVA
2005 National Building Code of
India (NBC 2005) is brought out.
2010 GRIHA Manual (published)
Latest Edition of LEED 2011 for India,
For New Construction &
Major Renovations
Figure 3. Time Line of Building Codes - Energy Standards – Green Building
Certification. - Information modified from (Hennicke, Schleicher, & Shrestha,
International comparison of energy labeling and standards for energy efficient and green
buildings, 2011)
As noted, the ECBC is not yet mandatory; however, as sections of the code become accepted it
would fall under the jurisdiction of the ULB to enforce its standard. This will require that
specialists at the local level, as appointed by the ULB become familiar with the ECBC and
prepare persons to become authorized as representatives to provide inspections and enforce the
code. The ULB would control enforcing the ECBC the same way it regulates developments such
as land use and construction of buildings. “Each ULB in a state governs these developments at
the town/city level through its General Development Control Regulation (GDCR) – a document
which lays down the framework for individual plot level building regulations called building by-
laws. GDCR covers all aspects of building construction including structural integrity, fire safety,
seismic design, lighting, electrical, plumbing, sanitary facilities, ventilation, etc. (Satish Kumar
& Ravi Kapoor, 2010)
36
Structural Design
Building Materials
Constructional Practices and
Safety
Building Services
Plumbing Services
Landscaping Design and
Outdoor Display
Structures
Fire and Life Saftey
Administration, Development Controls Rules and General
Building Requirements
National Building Code of India 2005
Energy Conservation Building Code 2007
Energy Conservation and Efficiency
Energy Efficiency
Solid Waste Management
Resource Conservation
Energy Conservation and Efficiency
Water Conservation
Solid Waste Management
Soil and Water
Conservation
Air Pollution Control
Integration of Environmental Sustainability
Figure 4. Structure of India’s Building Code – Integration of Environmental Sustainability
Information modified from United Nations, Economic and Social Commission for Asia and the
Pacific (ESCAP) & Asian Institute of Technology (AIT), “Integrating Environmental
Sustainability, and Disaster Resilience in Building Codes.” (2012)
2.9 American and Indian Business Incentives
This section will address how the United States and Indian governments in conjunction with
Indian civil agencies provide incentives for American AEC companies to participate in the
sustainable green building market in India. An example is President Obama’s first official trade
mission to India in March 2009. This trip was a “Solar Energy Trade Mission.” There were
fourteen American companies that participated in the trip. All fourteen were sponsored by the
US Department of Commerce, targeting US-India trade in solar energy technologies. Another
trade mission to India, organized by the United States Department of Commerce, International
37
Trade Administration, was the “Architecture Services Trade Mission in India.” The trade
mission, which took place on October 15 - 19, 2012 was to "introduce U.S. firms to India's
rapidly expanding market for architectural and design services, including project management
services, and to assist U. S. companies to pursue export opportunities in this sector”
(Export.Gov, 2012). Participants in this trade mission had the opportunity to visit Chennai,
Kolkata, and Bangalore. “The mission will include one-on-one business appointments with pre-
screened potential buyers, agents, distributors and joint venture partners; meetings with state and
local government officials and industry leaders; and networking events” (Export.Gov, 2012).
Trade missions of this type exist for American companies to get first hand information regarding
what type of opportunities are available in expanding cities in India. This particular opportunity
was for Architectural design services and Project management services; however, this was just
one type of trade mission offered in the fall of 2012. In September 3rd
– 5th
of 2012, a trade
mission focusing on photovoltaic panels took place at the Bangalore International Exhibition
Center in Bangalore India. “Organized by SEMI (Semi Conductor Equipment and Materials
International), the global industry association serving the manufacturing supply chains for the
microelectronic, display and photovoltaic industries, and the PV group SOLARCON”
(Export.gov, 2012).
Other incentives provided by the government of India can be found in the annex of the GRIHA
Manual Volume 1 published by the The Energy and Resources Institute. These incentives
include the Incentive to Architects/Design Consultants provided by the Government of India,
Ministry of New and Renewable Energy, solar Thermal Group. These incentives will provide
exemption from the registration fee for Government public sector buildings in the percentages
listed. Incentives may also be provided to Building Owners who meet sq.m. building
38
requirements, and a minimum of a one star rating. Tax incentives are also offered for many
types of business opportunities in India.
2.10 Business Opportunities in India
This section of the study will concentrate on the business opportunities that are available in India
for the AEC community. For those interested in starting a business, or establishing a business
presence in India, there are important steps or criteria, which should be understood. The United
States Department of Commerce is one of the best sources to find what opportunities are
available when researching, which sectors of the Indian economy may provide potential business
opportunities. The United States Department of Commerce lists the following Indian sectors in
the top ten “best prospect sectors and business opportunities” (U.S. & Foreign Commercial
Service and U.S. Department of State, 2010).
Architecture, Construction and Engineering Services (ACE)
Civil Aviation
Environment and Water
Infrastructure (Roads, Ports and Railways)
Power and Renewable Energy
The Indian Construction Industry Development Council (CIDC) is another source, which
those interested in researching potential business opportunities in India may look to
for guidance. In a report produced by the (CIDC) 2006 – 2007, the following areas would
provide Construction Opportunity and Activity:
39
Civil Aviation: Domestic and international air traffic in India is estimated to grow at
an annual rate of 12.5 percent and 7 percent respectively over the next ten years.
Domestic and International cargo traffic is estimated to grow at 4.5 percent and 12
percent (CIDC, 2013).
Ports: Plans for the major ports was listed as Rs 32 billion (US$0.9 billion) (CIDC,
2013).
Roads: Including the following types; Expressways, National Highways, State
Highways, Major District Roads, District Roads, and village roads are all expected to
experience growth in construction (CIDC, 2013).
Railways: Railways should see a continued increase in growth in India (CIDC, 2013).
Rapid Mass Transport System: Delhi Metro’s first section was inaugurated on the 24th
of December 2002. The project has three lines, totaling (62 km) (CIDC, 2013).
Urban Infrastructure: One of the most well known Government programs in India is
Jawaharlal Nehru National Urban Renewal Mission (JNURM). The urban
infrastructure of 63 cities is being renewed for a cost of US $ 28 Billion (CIDC,
2013).
Water Supply: This sector could see privatization introduced where new townships
and projects occur in the area of planning, designing source development, execution
of works, operation, and maintenance including billing and collection (CIDC, 2013).
Urban Public Transport: Mass Rapid Transit Systems (MRTS) and Light rail Transit
Systems (LRTS), may see an increase in private investment (CIDC, 2013).
40
Housing: The Ministry of Urban Affairs and Employment is moving forward on
facilitating construction of 7 lakh more housing units in urban areas annually, under
the 2 million Housing Programme (CIDC, 2013).
Land and Township Infrastructure Development: The returns on projects where
development of land in extended areas of large cities and new townships may be far
above 20 percent (CIDC, 2013).
In addition to the twelve requirements to start, a business in India, shown in Appendix F there
are items, which should be, reviewed carefully, that, while not essential, will certainly make the
process of establishing a business or project in India more successful. Establishing contacts in
India is a very important step in establishing an on-the-ground business presence in India. If a
company can find an agent or representative to assist in creating contacts, it will make the
process easier as India has a very diverse collection of spoken languages and customs. A
company such as an AEC firm may need to have many items provided by local suppliers.
Establishing relationships with an agent who is familiar with the vendors and suppliers in a
geographical area can be helpful in assuring that the supplies, materials, and equipment can be
purchased at a competitive price. Selection of the correct agent or representative is important
and should include the following considerations. “When evaluating a distributor or agent the
Indian firm’s business reputation, financial resources, willingness and ability to invest, marketing
strength, regional coverage, industry expertise, and credit worthiness should be considered”
(Commerce, 2012). It is important to understand that the size of a company, which offers the
service of providing agents, is not always the metric, which should be used in the selection of
such a company. India is a rapidly growing country and a company that provides a service of
41
creating introductions and contacts can change their allegiance to a particular product or business
line rather quickly to meet the demands of market that is changing. It is also possible for a
company offering the services of an agent to be unable to provide each potential client with an
agent or representative with the experience needed to logistically negotiate their way through an
infrastructure that is, unlike a developed nation, still in the process of establishing itself. “U. S.
companies should exercise pragmatic skepticism when the potential representative offers a long
list of foreign clients. These lists may be outdated and the relationships may no longer exist”
(Commerce, 2012). Just as with purchasing any service or becoming involved in any potential
business transaction, a foreign company should be prudent in its selection of agents or companies
offering to provide introductions to potential business service providers.
Understanding the costs of providing construction services such as labor and material is an
important part of understanding the building environment in India. Many companies provide
construction cost indices, which can be purchased or downloaded from the internet in printable
format. An example of this would be the “Turner & Townsend, International Construction Cost
Survey 2012.” In their 2012 report, compiled by Guy Emmett; Economist, the following tables
are provided; Hourly cost of Labor in India and Cost of Materials in India, as shown in Table 4.
Table 4. Hourly Cost of Labor in India and Cost of Materials in India
India – hourly cost of labour (including overheads)
2010 INR 2011 INR 2011 USD
Group 1 tradesman – eg plumber, electrician 45 56 1.2
Group 2 tradesman – eg carpenter, bricklayer 45 50 1.1
Group 3 tradesman – eg carpet layer, tiler, plasterer 40 38 0.8
42
General labourer 18 20 0.4
Site foreman 80 80 1.7
India – cost of materials
Concrete 30 mpa (m^3) (1,500 m^3 job) 3,500 5,000 109
Reinforcement bar 16mm (tonne) (120 tonne job ) 35,000 40,500 884
Concrete block (400 x 200) per 1,000 (>10,000 block job) 20,000 35,000 764
Standard brick per 1,000 7,000 6,250 136
Structural steel beams (tonne) (>100 tonne job) 65,000 50,000 1,091
Glass pane 6mm (m^2) 500 500 11
Softwood timber for framing 100mm x 50mm (m) 150 275 6
Plasterboard 13mm (m^2) 250 280 6
Emulsion paint (litre) 300 340 7
Copper pipe 15mm (m) (>1,000m job) 1,400 1,300 28
Copper cable (m) (3C + E, 2.5mm PVC) (>100,000m job) 2,200 2,450 53
Source: Turner & Townsend, International Construction Cost Survey 2012 (Emmett, 2012)
It is also important that companies, which are interested in working in the Indian green building
market research the cost of placing material in the field. Shown in Table 5 is: India – Cost of Key
Trades, which lists the cost associated with key trades in India.
Table 5. India – Cost of Key Trades
India – key trades (excluding preliminaries and builders
margins)
2010 INR 2011 INR 2011 USD
Excavate basement (m^3) (1,800m^3 job) 900 750 16
Excavate footings (m) 400 475 10
Concrete in slab (m^3) (1,500m^3 job) 5500 6500 142
Reinforcement in beams (tonne) 55,000 56,000 1,222
Formwork to soffit of slab (m^2) 500 525 11
43
Block work in wall (m^2) (10,000 block job) 1,000 1,075 23
Structural steel beams (tonne) 65,000 82,500 1,801
Pre-cast concrete wall (m^2) 6,000 8,250 1,80
Curtain wall glazing incl support system (m^2) (1,000m^2 job) 7,000 9,250 202
Plasterboard 13mm thick to stud wall (m^2) (3,000m^2 job) 3,500 2,250 49
Single solid core door incl frame and hardware (no) (50 door
job)
30,000 27,500 600
Painting to walls primer + 2 coats (m^2) 200 200 4
Ceramic tiling (m^2) (1,000m^2 job) 2,800 2,800 61
Vinyl flooring to wet areas (m^2) (500m^2 job) 1,800 2,100 46
Carpet medium tufted (m^2) (4,500m^2 job) 1,500 2,350 51
Lighting Installation (m^2) (>5,000m^2 job) 2,800 2,900 63
Copper pipe 15mm to wall (m) (>1,000m job) 1,500 1,775 39
Fire sprinklers (per m^2) (5,000m^2 job) 1,200 825 18
Air conditioning incl main plant (m^2) (>5,000m^2 jobs) 5,000 3,625 79
Source: Turner & Townsend, International Construction Cost Survey 2012 (Emmett, 2012)
An understanding of the cost indices that should be applied when determining the price of
materials and labor in different cities of India is important. The CIDC provides cost indices from
2007 to 2013, and they can be found on the CIDC website. Provided below in Table 6 are the
Economic Indices: Construction Cost Indices for April 2012 and January 2013 for six cities in
India. The categories Mineral Plant, Transmission and Maintenance have been deleted from the
table shown. In May 2012 the CIDC began publishing data for 68 cities. As noted in Table 6, the
Base 100.00 is dated October 2007.
Table 6. Economic Indices: Construction Cost Indices (CCI)
Construction Industry Development Council (CIDC)
Construction Cost Indices (New Series – Provisional)
Base – 100.00 October 2007.
44
SI Month Roads Bridges Dams Power Railways Medium
Industry
Urban
Infra
Building
A Delhi
Apr - 12 124.47 126.14 125.02 125.23 125.60 124.44 126.21 125.31
Jan - 13 144.86 138.97 143.41 141.80 143.08 138.00 137.62 143.91
B Mumbai
Apr - 12 124.06 123.55 123.68 123.83 122.91 125.35 125.92 124.37
Jan - 13 141.87 140.52 141.15 138.81 137.69 136.21 137.41 134.72
C Chennai
Apr - 12 125.64 125.71 125.50 125.01 125.66 124.75 126.00 126.18
Jan - 13 136.69 131.81 136.39 135.87 137.47 131.20 128.80 136.76
D Bangalore
Apr - 12 129.13 139.46 129.36 119.09 128.73 126.09 125.69 126.55
Jan - 13 139.57 141.12 139.51 137.88 137.69 133.30 130.64 137.49
E Kolkata
Apr - 12 125.03 126.42 126.38 125.77 125.74 124.17 124.24 124.93
Jan - 13 139.96 138.68 140.47 140.54 142.13 136.88 135.84 139.77
F Hyderabad
Apr - 12 124.96 125.94 126.36 127.41 124.11 124.86 124.04 125.08
Jan - 13 137.68 134.45 139.00 136.39 137.53 133.38 131.69 138.11
Source: Construction Industry Development Council www.cidc.in/new/cci-new.html
For an AEC company interested in establishing a business office or starting a project in India the
Joint Venture method is thought to be a method that will be the most successful. The Joint
Venture (JV) relationship has a history in India dating back to the 1960’s. “The Guidelines for
Foreign Collaboration, first issued in 1968, stated that local consultant would be the prime
contractor in such collaboration. The objective of such an imposition was to develop local
design capabilities parallel with the inflow of imported technology and skills” (Mukherjee,
45
2001). This was encouraged to promote international construction companies and consultants to
develop joint ventures with the local businesses (Mukherjee, 2001). Establishing a joint venture
in India may be the initial step in interfacing with other companies as an established office in
India. This would require an understanding of what services are typically provided by a
company. An example of the services provided by Architects in India is detailed in Table 7 as
listed in the “Conditions of Engagement and Scale of Charges Preamble” by the Council of
Architecture (COA) in New Delhi, India.
Table 7. Comprehensive Architectural Services
1.1 Taking Clients instructions and preparation of design brief.
1.2 Site evaluation, analysis and impact of existing and / or proposed development on its
immediate environs.
1.3 Design and site development.
1.4 Structural design.
1.5 Sanitary, plumbing, drainage, water supply and sewerage design.
1.6 Electrical, electronic, communication systems and design.
1.7 Heating, ventilation and air conditioning design (HVAC) and other mechanical systems.
1.8 Elevators, escalators, etc.
1.9 Fire detection, Fire protection and Security systems etc.
1.10 Periodic inspection and evaluation of Construction works.
(Council of Architecture, 2013) www.coa.gov.in/practice/practice.htm
The concept of a JV meets the needs of companies that recognize that to provide the best
possible project performance, the formation of a Joint Venture is often the viable arrangement,
and, as noted above, was the only way for a foreign AEC company to establish a business
presence in India. It is advisable for a company interested in establishing an office in India to
become familiar with the Ministry of Finance website, as the liberalization of business
46
regulations has resulted in many changes regarding the requirements for entering into a business
in India.
“A JV involves at least two partner organizations that contribute equity and resources to a
semiautonomous legally separate entity. An international JV (IJV) is defined as a JV with a least
one partner headquartered outside the JV’s country of operation” (Arditi, Birgonul, Dikmen, &
Ozorhon, 2010). The establishment of a Joint Venture requires much preliminary research in
order to assure that the project performance meets both the clients and the Joint Venture’s needs.
“Project Performance is defined as an objective measure of project targets including completion
of the project on schedule, within budget, in good quality, and with maximum client satisfaction”
(Arditi, Birgonul, Dikmen, & Ozorhon, 2010). In order to work in a relationship of this type, it
is advisable that a due diligence exercise be carried out prior to the formal creation of a JV.
When a company is interested in establishing a JV there are two methods of doing so, that are
commonly used. These are the private limited company, and, the public limited company. The
private limited company is the method of creating a JV that is most often used (Ladwa & Shukla,
2007). When establishing a private limited company there are several important items that
should be researched, and all parties should be aware of:
“A private limited company requires a minimum paid up capital of INR100, 000
(about EUR 1,706 or US$ 2,270). If the company uses certain words such as “India”
or “Hindustan” in its name then the minimum paid up capital requirement is
INR500,000 (about EUR 8,533 or US$ 11,351)” (Ladwa & Shukla, 2007).
“A private limited company requires a minimum of two directors and two
shareholders. The directors need not be Indian nationals or residents. However, for
47
practical reasons (for example, signing of routine regulatory or statutory documents),
it is advisable that at least one of the directors is resident in India” (Ladwa & Shukla,
2007).
“It is important to agree the proposed management structure and to identify which
party has control early in the joint venture process. Ideally, management structure,
control, and safeguards should be agreed when preparing the memorandum of
understanding” (Ladwa & Shukla, 2007).
Whether using the services of an agent in India to establish contacts, or services provided by the
U.S. government such as the “Architectural Services Trade Mission to India,” which took place
in October of 2012, the successful creation, and operation of a Joint Venture to meet the
complexities of a construction project is one that requires trust. “In international construction
joint ventures (ICJVs), inter-organizational trust is granted without prior knowledge and without
time to develop. Such trust is necessitated by the overwhelming task complexity, it is not an
option” (Brockmann & Girmscheid, 2010). American companies can avoid many possible
pitfalls when seeking to establish contacts in India by taking advantage of services and trade
missions offered and arranged by the U.S. Department of Commerce, International Trade
Administration.
The trend in India and globally has been towards turn-key management delivery methods. This
has led Joint Ventures to take advantage of “build-own-operate” and “build-operate-transfer”
projects. Many Indian companies have problems overcoming domestic constraints. This can
prevent them from bidding on large domestic infrastructure projects. An Indian company can
48
benefit from the Joint Venture relationship with a large American company to overcome some of
these domestic constraints. One of the main problems that Indian construction companies, and,
consultancy companies have, is the ability to provide financing. “Investments in construction
and related activities require a smooth flow of finances and many Indian companies find it
difficult to fund the initial investigation and viability studies, to provide for the bid bond and
security deposits, or find funds for procurement of equipment and machinery, etc” (Mukherjee,
2001).
Foreign investment in a developing country is driven by many factors. The United Nations
Conference on Trade and Development (UNCTAD) defines FDI as “an investment involving a
long-term relationship and reflecting a lasting interest and control by a resident entity in one
economy in an enterprise resident in an economy other than that of the foreign direct investor”
(Niederberger & Saner, 2005). To state this more simply, “FDI involves direct investment in
productive assets by a company established in a foreign country, as opposed to minority
investments of less than 10% by foreign entities in local companies” (Niederberger & Saner,
2005). Refer to table 8. for a listing of FDI in Foreign Countries.
Table 8. FDI in Foreign Countries January 21, 2013
Year United States UK China Brazil India
2008 332,734,000,000 261,535,060,280 171,534,650,310 50,716,402,711 43,406,277,076
2009 139,557,000,000 4,059,411,049 131,057,052,870 31,480,931,700 35,581,372,930
2010 270,986,000,000 61,325,946,152 243,703,434,560 53,344,632,547 26,502,000,000
2011 257,528,000,000 28,306,353,717 220,143,285,430 71,538,657,409 32,190,000,000
Information from: The World Bank; Foreign Direct Investment, Net Inflows (BoP, current US$)
Website: http://data.worldbank.org/indicator/BX.KLT.DINV.CD.WD
49
One of the potential investment areas that draw Foreign Direct Investment into a country is the
market for “Kyoto mechanisms.” By investing in projects in a foreign country, a transnational
corporation can take advantage of the certified emission reduction (CER) credits that are
considered “additional to any emission reductions that would otherwise occur” (Neiderberger &
Saner, 2005). As mentioned earlier in this paper, this is the additionality requirement that must
be shown in order for a project to be allowed to become a CDM project. Presently there are
three countries that have the lead in producing CDM projects. These are Brazil, China and India.
India who is the leader in creating CDM projects is also the under achiever in FDI compared to
the other two countries Brazil and China. India is leading in CDM transactions, and has more
CDM projects in in the pipeline than any other host country in the Kyoto pre-compliance market
(Neiderberger & Saner, 2005).
Competitiveness in the global construction market has changed over the last several decades. The
AEC industry and green building market in India is experiencing unprecedented growth and
change. The following statistics about the architecture, engineering and construction industries
are provided to give the reader an understanding the number of each discipline that presently
exists in India, and may provide potential entrants in the green building market with an
indication of how competitive their select fields may be.
The CIDC website provides the following information:
“Construction industry cannot be visualized as a single industry in view of the wide
range of types and sizes of construction works. It covers a spectrum of activities
carried out by a group of linked organizations providing design and engineering,
50
supplying materials and equipment, carrying out construction work and providing
operation and maintenance services” (CIDC, 2013).
“Construction industry can be broadly classified into two sectors i.e. organized and
unorganized. The organized sector includes more than 30,000 organizations whereas
the standalone contractors in the unorganized sector number more than 120,000”
(CIDC, 2013).
The following articles provide estimated numbers of engineers graduating from institutions in
India:
“The estimates have been incorporated in a study by Rangan Banerjee and Vinayak
Purushottam Muley, both associated with the IIT, Bombay. The study, published in
form of a book “Engineering Education in India” will be released on Monday by
Human resource Development Minister Kapil Sibal. In 2008, It is estimated that 3.5
lakh engineering degrees, 23,000 engineering masters degrees and about 1,000 PhDs
were awarded in India” (Mukherjee S. , 2013). “A recent study by Duke University
says that for every one million citizens, the U.S. is producing roughly 750 technology
specialists, compared with 500 by China and 200 by India. “ “…..according to the
AICTE, India produced 4.01 lakh engineers in 2003-2004, of which 35% were
computer engineers” (Chhapia, 2008).“The number of graduates swelled to 5.2 lakh
in 2005-06; by 2006-07, the number of colleges had increased to 1,503 which
admitted 5.83 lakh students in all. Five Indian states – TamilNadu, Andhra Pradish,
Maharashtra, Karnataka and Kerala – account for almost 69% of the country’s
51
engineers. Uttar Pradesh, Bihar, Gujarat, Rajasthan and Orissa account for only 14%”
(Chhapia, 2008).
The Council Of Architecture web site www.coa.gov.in/ provides the following demographics
regarding architects in India.
“Ratio of Male/female Architects (Total: 40,901) (as on 30.09.2011) Female 36%
15,766, and Male 64% 25,135.” “Qualification Wise Registration (As on 30.09.2011)
Total: 40,901” (Architecture, 2013)
a. “B.Arch.: 33,388
b. GD.Arch.:3,874
c. Membership of I.I.A.: 1,794
d. DIP. Arch.: 1,223
e. U/S: 5(B)
f. N.D.Arch.: 227
g. Other: 71” (Architecture, 2013)
It is important for a company interested in establishing a presence in India to understand how
India is increasing the quality of its shipping and transportation infrastructure. The following
paragraphs of this section will provide a brief examination of some of the advancements that
India has recently pursued in its transportation infrastructure. According to the (Indian Ports
Association), “the major ports in india in 1995-1996 were; Calcutta, Paradip, Visakhapatnam,
Chenai (Madras), Tuticorin, Cochin, New Mangalore, Mormugao, Mumbai (Bombay), JNPT and
52
Kandla.” “During 1995-1996 these ports were handling 92% of the country’s total port traffic.”
(Behrens & Haralambides, 2000)
Although the major ports were handling a large part of the country’s import and export shipping
needs, their capacity was considered to be inadequate. “The major ports handled about 179.02
million tonnes of traffic in 1993-94 as against an estimated capacity of about 173.04 million
tonnes implying a capacity over-utilization of almost 3.5%. This figure rose to a peak of 21.5%
in the year 1995-96 before it started declining” (Ray, 2004). These figures show the major ports
in India were unprepared to meet the demands of globalization and potential expansion that
would take place in the future. “In the new international economic order, ports were no longer
mere modal interfaces between surface transport and sea transport. They were now logistics and
distributional platforms in the supply chain network that drove trade competitiveness” (Ray,
2004). India is in the process of transforming its present shipping ports. It is proposed that some
of this is being done by using private sector participation in which “…the government decided to
adopt the landlord port model propagated by the World Bank. This particular model
distinguishes between the port owner and the port operator” (Ray, 2004). There are many
changes now taking place in India regarding its infrastructure construction sector. In a recent
article in Engineering News-Record it is reported that “The shipping Ministry is set to award by
March two port projects with a total annual capacity of 245 million metric tons, in the south
Indian state of Andhra Pradesh and the eastern state of West Bengal” (Mathews, 2013). In tables
prepared by Amit Ray showing Performance Indicators of Major Ports of India over the period
1995-2003, Amit Ray listed the following as India’s major ports.
Chennai
Cochin
53
Haldia
Jawaharlal Nehru Port
Kandla
Kolkata
Mormuhaon
Mumbai
New Mangalore
Paradip
Tuticorin
Vishakhapatnam
The railways are also a potential major shipping route for material and equipment that can be
moved within India. There are plans to build 3,300 kilometers of new railway. This is being
promoted by the recent changes in the government. “The Ministry of Railways is expediting its
construction decision-making process, creating a separate holding company to free up resources
and changing its concession cost-sharing models on projects” (Mathews, 2013). The proposed
railway will consist of two corridors. “The eastern corridor, starting from Ludhiana in Punjab
state, will pass through the states of Haryana, Uttar Pradesh, and Bihar and terminate at Dankuni
in West Bengal. The western corridor will traverse the distance from Dadri to Mumbai, passing
through the states of Delhi, Haryana, Rajasthan, Gujarat and Maharashtra” (Mathews, 2013).
India’s highway systems are experiencing an expansion. In an article written by Tudor Van
Hampton, which appeared in ENR in September 2012, it is reported that “Within the next month,
54
National Highway Authority of India (NHAI) plans to release around 40 new EPC highway
projects totaling 2,485 miles and worth approximately $3 billion” (Van Hampton, 2012). This
expansion in highway may have the effect of reducing the amount of time spent traveling from
one area to another. One of the ways this can benefit the AEC community in India is by
reducing time lost due to travel requirements. “India increasingly relies on newer roads to
untangle traffic and enable its national economic engine. For example, the country last month
opened a $2.4 billion, 103 mile highway between New Delhi and Agra, site of the Taj Mahal, a
boon to tourism, the six lane yamuna expressway reduces round-trip travel times to under four
hours from at least six” (Van Hampton, 2012). In addition to the potential boon to tourism, there
may be areas along this route that become accessible for new developments and hotels, which are
increasingly becoming a source of green building opportunity in India. Van Hampton’s article
goes on to read, “During its current five-year plan, India hopes to build between 3,100 and 3,700
miles of highways per year through 2017” (Van Hampton, 2012)
2.11 A Description of the 2007 Recession
A description of the 2007-2009 recession is provided to allow the reader to understand what the
economic status of the U.S. is, during this time period. In December of 2007, the United States
entered into a recession. The National Bureau of Economic Research (NBER) defines a
recession as “a period of falling economic activity spread across the economy, lasting more than
a few months, normally visible in real GDP, real income, employment, industrial production, and
wholesale-retail sales” (NBER, 2012). The trough or recession technically ended in June of
2009. During this recession “The number of unemployed persons reached a peak of 15.3 million
55
in the fourth quarter of 2009 and fell to 14.8 million by the fourth quarter of 2010” (Hipple,
Theodossiou, 2010). In a speech on January 3rd
2010 given to the Meeting of the American
Economic Association in Atlanta, Georgia, Ben S. Bernanke, who is currently the chairman of
the Federal Reserve, described the financial crisis that led to the recession as follows: “The
financial crisis that began in August 2007 has been the most severe of the post-World War II era,
and, very possibly once one takes into account the global scope of the crisis, its broad effects on
a range of markets and institutions, and the number of systemically critical financial institutions
that failed or came close to failure--the worst in modern history” (Bernanke, 2010). Bernanke
goes on to say: because of steps taken by policymakers, a complete collapse of the global
financial system was avoided in the fall of 2008 (Bernanke, 2010). This recession is also the
cause of high unemployment in several other developed countries.
One industry that is expected to provide jobs in the United States and may help reduce the
unemployment rate will be the jobs created by the green building industry. These new jobs can
provide employment opportunities in several different ways. A study prepared by Allen, Booz
and Hamilton for the U.S. Green Building Council Green Jobs Study, defines the effects of the
jobs created by green building as one of three types. Direct effects, would be a construction
company constructing a green building, and carpenters become employed. Indirect effects are
the result of a contractor buying building supplies from a lumberyard, and lumberyard workers
are employed. Induced effects are the economic impact of the construction company and the
lumberyard employee’s spending money for everyday items similar to, gas for their cars or food
items for their families. This would result in jobs for gas station attendants or store clerks
(Allen, Booz & Hamilton., 2008). The study states that the term “Green Jobs or Green collar
56
jobs” is not well defined, and has used two methods to provide its data. “First, the study
estimates all jobs supported by green construction expenditures. Under this approach, the study
considers the total value of a green building, not just the share of expenditures that can be traced
to green technologies or processes” (Allen, Booz & Hamilton., 2008). The study goes on to
define the second method as, “the study estimates the jobs created as a direct result of the LEED
rating system. To do this, we conducted an analysis of 10 reports and studies covering 69
LEED-certified buildings” (Allen, Booz & Hamilton., 2008). Exhibit 2-5 of the report prepared
by Allen, Booz, and Hamilton indicates that between the years 2000 to 2008, “1,039,177 direct
jobs were created, 600,758 indirect jobs were created, and 819, 956 induced jobs were created”
(Allen, Booz & Hamilton., 2008).
The Bureau of Labor Statistics (BLS) also publishes data regarding the contribution of Green
jobs to the employment number in the United States. The BLS defines green jobs using two
definitions as the following. The first being, “Jobs in business that produce goods and provides
services that benefit the environment or conserve natural resources. These goods and services
are sold to customers, and include research and development, installation, and maintenance
services” (BLS, 2012). The BLS goes on to define the second as, “Jobs in which worker’s duties
involve making their establishment’s production processes more environmentally friendly or use
fewer natural resources” (BLS, 2012). As shown in Table 9 the private sector had 2,268,824
jobs, and government jobs had 860,289 jobs between the federal government, state government,
and local government, for a total of combined private and government jobs of 3,129,113 jobs.
57
Table 9. Green Goods and Services (GGS) employment by industry sector, 2010 annual
averages.
Industry NAICS,1 GGS, 1,2
Employment
GGS,3
Percent
Total, 4,5
Employment
Total, all industries 3,129,112 2.4 127,820,442
Total private 2,268,824 2.1 106,201,232
Natural resources and mining 11,21 65,050 3.6 1,798,593
Utilities 22 65,664 11.9 551,287
Construction 23 372,077 6.8 5,489,499
Manufacturing 31-33 461,847 4.0 11,487,496
Trade 42,44-45 202,370 1.0 19,947,787
Transportation and warehousing 48-49 245,057 6.2 3,943,659
Information 51 37,163 1.4 2,703,886
Financial activities 52,53 190 0.0 7,401,812
Professional, scientific, and technical services 54 349,024 4.7 7,457,913
Management of companies and enterprises 55 34,711 1.9 1,854,778
Administrative and waste services 56 319,915 4.3 7,399,320
Education and health services 61,62 37,069 0.2 18,656,159
Leisure and hospitality 71,72 22,510 0.2 13,006,814
Other services, except public administration 81 56,174 1.3 4,349,563
Federal government 156,707 5.3 2,980,813
State government 227,103 4.9 4,606,001
Local government 476,479 3.4 14,032,396
Table taken from “BLS-Employment in Green Goods and Services – 2010”
NAICS: North American Industry Classification System, 2007
GGS employment: is the number of jobs related to the production of Green Goods and Services.
GGS percent: is the percentage of the GGS employment compared to the total employment. This
value is derived by dividing the GGS employment by total employment.
58
NOTE: Data may not add to total or sub-total due to rounding.
Although the sources and methods may differ between the reports, U.S. Green Building Council
Green Jobs Study, 2008 and BLS-Employment in Green Goods and Services – 2010 the BLS
report indicates that there were 669,222 more green jobs in 2010 that were accumulated over the
period of 2000 to 2008 as shown in the USGBC jobs study. This indicates that the number of
green jobs continued to rise during the recession and may have played a part in providing jobs
for unemployed workers (Allen Booz, & Hamilton, 2008).
2.12 A Case Study of the Development Alternatives World Headquarters
This paper will provide a case study of the Development Alternatives new World Headquarters
and its features. “Development Alternatives has been recognized amongst the top 100 think-
tanks influencing global public policy” (Development Alternatives, 2012). Their new world
headquarters in New Delhi, India has been built to accommodate their growing organization. In
using the Development Alternative new World Headquarters this case study provides an example
of green buildings that strive to meet many of the practices noted in the definition of green
building stated in Chapter One of this paper, however, do not seek certification by LEED IGBC
or GRIHA. Green buildings, which do not use a green building rating system, but incorporate
green buildings concepts into their design and construction, may provide another market in India
for AEC companies.
“Ever since its inception in 1982, Development Alternatives has acted as a research and action
organization, designing and delivering eco-solutions for the poor and the marginalized”
59
(Development Alternatives, 2012). Development Alternatives old world headquarters, which
was located in New Delhi, was built in1986, and was used as the Development Alternatives
headquarters until it was demolished. The old world headquarters was replaced with the new
Development Alternatives world headquarters building. In response to the following question
presented to a Development Alternatives representative during an online video conference, “Was
the process of exploring the objective, scope, and benefits of a new building driven by?” The
Development Alternatives representative replied, “It was basically because we were growing as
an organization and the building outgrew its one life and the space that was required.” Referring
to the old building; “It was a much smaller building, and then we tore the building down and,
using the same materials built the one that we’re currently in” (Nagrath, 2013). The existing site
was used as the location for the new building. The Development Alternatives building has
received the “NDTV-Toyota Green Award 2010 in the category of Green Design” (Development
Alternatives, 2013). The NDTV-Toyota Green Award was presented to a Development
Alternatives representative during the televised ceremony, by the President of India.
A photograph of the old Development Alternatives World headquarters is shown below in
Figure 5.
60
Figure 5. Old World Headquarters – Development Alternatives
Source: www.devalt.org/walk-with-us-DAbuilding.aspx
Several of the key Features of the new Development Alternatives world headquarters are listed
below. A brief explanation of the building systems is also presented.
Architect: Ashok Lall
Lifecycle “cradle to grave” approach to assess energy content of materials
40 per cent less operational energy
100 percent waste water recycled
15 percent recycled materials
30 percent less steel
CFC free building
Orientation of building to movement of sun
30 per cent less cement
Planting on building façade. (Development Alternatives, 2013)
61
2.12.1 Heating and Cooling
The design criteria accepted by the final building occupants has allowed for the use of a hybrid
heating and cooling system. The building occupants have agreed to accept a cooler environment
during the cool season of the year and warmer temperatures during the warmest season of the
year. “Instead of 22 to 25 degrees centigrade the occupants agreed to accept temperatures of 18
to 19 degrees when it is very cold” (Banerji, 2010). When it is very hot at 30 degrees centigrade,
the occupants will also dress appropriately.
Air handling units have been designed for use on every floor of the building. “The
System is hybrid and is a combination of a desert cooler and air conditioning systems
as well as a heat recovery system” (Banerji, 2010). During the seasons where there is
the need for cooler air, “in summer the air is pushed into the rooms acting as large
coolers. In the monsoon, the compressors set in. The compressors are compact, and
use environment friendly non CFC gas” (Banerji, 2010).
Alternative cooling methods have been used at the exterior of the building to reduce
the temperature at the exterior wall of the building. These alternative cooling
methods include plantings on the exterior of the building, and a trickle fountain has
been provided in the center courtyard. Both of these features help to maintain a lower
temperature at the exterior wall of the building and reduce heat gain. “We use that
courtyard space to have a trickle fountain” (Banerji, 2010). This “reduces the
temperature within the courtyard during the dry season and thereby reduces the heat
gain from the courtyard” (Banerji, 2010).
62
2.12.2 Building and Wall Construction
Materials from the old world headquarters has been reused in the new world
headquarters. “The mud used in the old building has been recycled into blocks, they
have a little bit of cement, and a little bit of sand, and they are customized precisely
for usage in this building” (Banerji, 2010).
Three different kinds of bricks have been used in the construction. “Waste Fly Ash
from thermal power stations is recycled into high strength and quality bricks. These
are used to form the outer wall. See Figure 6. Compressed mud blocks to form the
inner wall. The conventional red brick made in more energy efficient kilns developed
by Development Alternatives, were interspersed throughout the building” (Banerji,
2010).
Where many buildings may use a white membrane or a white metal roof to achieve
solar reflectance, Development Alternatives innovation persists by the use of the
following materials; “The roof of the building is covered with a reflective surface
made of left over broken white tiles and broken sanitary ware, creating a homogenous
surface reflecting the rays of the sun” (Banerji, 2010).
The building is designed to catch and absorb as little heat as possible, which will
reduce the heat gain of the building. “This has been done by the orientation of the
building to the sun. The West and East surfaces of the building are kept blank”
(Banerji, 2010).
63
Figure 6. Building Exterior – Development Alternatives
Source: www.devalt.org/walk-with-us-DAbuilding.aspx
2.12.3 Building Structure
The amount of structural steel in the building has been reduced by the use of “structural roofing
channels or roofing shells. See Figure 7. These are prefabricated elements that work on the
principle of very thin slender egg shells, and are made exactly to size” (Banerji, 2010).
“The thickness of these shells is 1” compared to 4” for an RCC slab” (Banerji, 2010).
This has allowed for the use of only “one third to one quarter of the material, which is
cement sand and no aggregate“ (Banerji, 2010).
“These channels were wider and required new fabrication equipment. Theses panels
were also used on five floors. There are over 200 of these channels used in the
building” (Banerji, 2010).
“Using Ferro cement and shallow domes, set between a skeletal frame, made the total
consumption of steel for a five story building about 30% less than what would have
been used to construct a conventional building” (Banerji, 2010).
64
“The ceiling also has filler slabs instead of concrete. Urban pots are used as fillers
instead of concrete. See Figure 9. This allowed the structural integrity of the roof to
not be compromised. This has also enhanced the aesthetics of the roof” (Banerji,
2010).
Figure 7. Ferro - Cement Channels – Development Alternatives
Source: www.devalt.org/walk-with-us-DAbuilding.aspx
2.12.4 Water Systems
The drainage and piping have been designed and placed to ensure that rainfall will
recharge the water table. “No single drop of rainwater will be allowed to move out of
this land, where it falls it shall be conserved” (Banerji, 2010). “The slopes drainage
and piping are all designed to ensure that the rainwater will recharge the water table
with permeable pavements and recharge wells. Even once used water is not to be
wasted and will be recycled back” (Banerji, 2010).
2.12.5 Energy Systems
65
Solar panels cover the roof and, help in the conservation of energy (Banerji, 2010).
These panels are used for water heating and help meet the energy needs of the
building. Passive lighting techniques have been used to light work areas “reducing
the dependence on electricity, and further reducing the stress on energy consumption”
(Banerji, 2010). See Figure 8.
Figure 8. Building Exterior – Development Alternatives
Source: www.devalt.org/walk-with-us-DAbuilding.asp
Figure 9. Urban Pots are used as Fillers in Ceiling
Source: www.devalt.org/walk-with-us-DAbuilding.aspx
66
Chapter Three
Methodology
Introduction
This chapter describes the research steps taken during this study to achieve the objectives stated
in Chapter One. The methods used to conduct this research were an extensive literature review,
consisting of a study of the current practices, processes, and procedures that are used to define
the current state of green building, concentrating exclusively on how green building has evolved
globally to help alleviate climate change through the use of green building techniques. A case
study has been prepared of the world headquarters of the Development Alternatives group, an
organization located in New Delhi, India. An online survey has been conducted, which consisted
of a questionnaire and an invitation letter to take the survey. For a list of questions presented in
the online survey instrument, refer to Appendix D. A personal interview with the Development
Alternatives group has been conducted using the online video program Skype. For a list of
questions presented in the personal interview with the Development Alternatives group, refer to
Appendix B.
The methodology used to conduct the research for this study was a qualitative research method
as opposed to a quantitative research method. The qualitative method has been used because the
purpose of this study is more exploratory in nature. “Qualitative research includes an array of
interpretive techniques, which seek to describe, decode, translate, and otherwise come to terms
with the meaning, not the frequency, of certain more or less naturally occurring phenomena in
67
the social world” (Schindler & Cooper, 2011) “Quantitative research attempts precise
measurement of something. In business research, quantitative methodologies usually measure
consumer behavior, knowledge, opinions, or attitudes.” (Schindler & Cooper, 2011)
3.1 Literature Review
This section describes the steps that were taken to complete the literature review. A variety of
sources has been used as research material to complete the literature review. These sources are
published transcripts of conferences; textbooks: articles from trade magazines; periodicals;
online web sites: and an interview with the Development Alternatives group. The following
topics are included in Chapter Two, the literature review:
The Kyoto Protocol and the Establishment of the Carbon Market
The Clean Development Mechanism
A Model of The Energy and Resources Institute
A Model of the Ministry of New and Renewable Energy
A Model of the Green Rating for Integrated Habitat Assessment
A Model of the Association for Development and Research on Sustainable Habitats
A Model of Leadership in Energy and Environmental Design, LEED-India
Outline of the National and Local Building Regulations in India
American and Indian Business Incentives
Business Opportunities in India
A Description of the 2007 Recession
68
A Case Study of the Development Alternatives World Headquarters
To begin the research process, a problem statement was defined. The problem statement was the
result of study, and personal interests of the researcher, developed, while attending the master’s
program at the institution this researcher was enrolled in. The significance of the topic, and the
objectives of the research were defined through a study of areas that would effect and contribute
to the researchers understanding of, how to create solutions that would address the problem
statement. Once these areas of study were broadly defined, the researcher proceeded with the
literature review. The main source of materials mentioned in the opening paragraph was
researched using the online resources of the library at the institution the researcher attended. To
establish the topics that would contribute to the literature review, the research materials were
reviewed, and notes critical to the development of the specific topics being studied were created.
The notes that were significant to the research were used as a foundation to create drafts sections
of each specific topic of the literature review. The draft sections were analyzed to identify and
understand themes that that would support the continued development of the draft section. The
topic of each draft section that was essential to meet the objectives of the study were further
researched and developed to create the final sections that are provided in the literature review.
The results of the literature review can be found in Chapter Four of this paper.
3.2 Implementation of LEED India
This section will provide a description of the methods used to research the green building rating
systems GRIHA and LEED India IGBC, NC. This section will also inform the reader of the
69
steps used to research the relationship, and, similarities between LEED USGBC, and LEED
India. To begin researching GRIHA, the researcher became familiar with the organizations that
support GRIHA, both the MNRE and TERI. The organization ADaRSH was also researched, as
it is the arm of GRIHA that is responsible for evaluating all buildings that apply for a GRIHA
rating. To do a complete analysis of GRIHA the researcher has studied published reports, and,
articles appearing in periodicals. The researcher has analyzed the philosophy of GRIHA, and
with diagrams, and tables outlined the certification process used by GRIHA. In addition, the use
of published documents, research was carried out using the organizations websites.
The steps used to research IGBC LEED India; NC involved researching material published in
reports, technical papers, and the LEED 2011 for India reference guide available at the IGBC
website. The requirements for registering a project with LEED India were researched. The
rating system and application of points to meet certification requirements was also researched.
An analysis of LEED India was done by reviewing the seven different categories of LEED India,
and inputting the criteria and points system into a spreadsheet for review. To meet the objectives
of this study it was also necessary to research LEED 2009 USGBC. This was done by preparing
a comparative list of the criteria and points system of the seven different sections included in
both LEED India and LEED USGBC. The results of the comparison of LEED India 2011 and
LEED USGBC 2009 can be found in a graphic model provided in Chapter Four. A table
comparing the different categories and the point system of LEED India and LEED USGBC can
be found in Appendix C.
70
3.3 Survey Instrument/Questionnaire
This section will outline the methods used to develop and implement the online survey
instrument. It is the goal of the online survey to solicit responses from a sample population of
the Indian AEC community that has worked with, understands, and can respond with information
that explains how the Indian AEC community applies project management principles that meet
the challenges of implementing a green building project in India. To determine what sample of
the Indian AEC community would be sent the letter of invitation to take the survey; several
sources were researched to determine, which would provide the broadest sample of the AEC
community in India. The sources researched were the following:
Engineering News Record (ENR) list of “The Top 200 International Design Firms”
(Reina, Tulacz, 2011) for 2011.
Engineering News Record (ENR) list of “The Top 225 International Contractors”
(Reina, Tulacz, 2011) for 2011.
“Directory of American Firms Operating in Foreign Countries” (2009)
Council of Architecture (COA) located at India Habitat Centre, Core-6A, first Floor,
Lodhi Road, New Delhi-110003. A hard copy of the 9th
edition of “Directory of
Architects” can be purchased through the COA [email protected] for the price
of Rs3200, ($58 US dollars). (At the writing of this paper).
The Indian Institute of Architects (IIA) located at Prospect Chambers Annexe, 5th
flr.
Dr. D. N. road, fort Mumbai- 400 001. A directory of architects can be purchased
through the IIA [email protected] for 5000Rs or ($90.78 US dollars). (At
the writing of this paper).
71
NIIR Project Consultancy Services, located at 106-E, Kamia Nagar (Nr. Delhi
University), DELHI – 110 007 (INDIA). A directory in MS EXCEL format on a CD
of Architects, Interior Decorators, Building Contractors, Builders & Construction
Materials, can be purchased through the NIIR Project Consultancy Services
[email protected] for the price of ($200.00 US dollars) plus (30.00 US dollars) shipping
costs. (At the writing of this paper).
After researching each of the sources listed above, the decision to purchase the NIIR Project
Consultancy Services directory was made, as it would provide the broadest sample of building
industry professionals in India. This being the largest selection or potential sample of the Indian
AEC community. Included in the database purchased from NIIR is the individual company
name, the address of the company, the city or cities where the company is located, the area of
specialization for each company, and the e-mail address of the company.
To determine what online program to use to send letters of invitation, and to collect and analyze
data, several internet based survey programs were researched. The online survey programs
Survey Monkey and Qualtrics were both researched to determine, which program would provide
the services best suited for the research. The decision was made to use Qualtrics as the
researcher had access to advanced analytic tools provided in the program, for an extended period,
at no cost. The researcher created a survey instrument consisting of ten questions. The ten
questions to be used in the survey instrument were designed with the purpose of contributing to
meeting the stated objectives of this study.
72
A preliminary copy of the survey was sent to a trial sample of persons working in the academic
field, at the institution where the researcher was conducting the study. The trial sample was
invited to provide comments that would identify areas of the survey that may require revisions.
The final recipients or sample group that the survey instrument was sent to, were listed using e-
mail addresses on ten panels or ten lists of e-mail addresses. A letter of invitation to take the
survey accompanied each survey instrument, sent to sample group. To complete the survey a
total of 5,402 e-mail addresses or potential recipients were sent a letter of invitation and the
survey instrument. Each panel or list consisting of e-mail addresses was sent eleven times using
the “distribute survey” function in the Qualtrics program. The survey instrument was sent over
the time from August 2012 until January 2013.
The limitations of the survey are a low response rate. Some of the reasons for a low response
rate may have been the following:
The letter of invitation sent to the sample was written in English, and the national
language of India is Hindi.
The letter of invitation was not sent representing an entity with a recognizable brand
name, and, the letter of invitation to take the survey did not have a recognizable logo
attached to it.
3.4 Development Alternatives Case Study
A case study has been prepared of the Development Alternatives World headquarters located at:
New Delhi, India
B-32 TARA Crescent,
73
Qutub Institutional Area
New Delhi – 110016, India
This section will describe the methodology used to prepare a case study, which includes an
online interview with the Development Alternatives group. The researcher was made aware of
the Development Alternatives group through a personal contact who regularly visits India and is
actively involved with programs to promote environmental awareness. The researcher was
provided with the name of Dr. K. Vijaya Lakshimi who is a representative with the Development
Alternatives group, and, holds the position of vice president. The researcher contacted Dr. K.
Vijaya Lakshimi, on October 6, 2012 and expressed an interest in green building in India. Dr. K.
Vijaya Lakshimi responded on October 10, 2012 and offered her assistance in the study, and the
help of her staff.
To prepare a case study of the Development Alternatives group new world headquarters, the
researcher has used the group’s website, reports prepared by the group, and three online
YouTube video clips, highlighting the design and construction of the groups world headquarters.
A report prepared by the architect has also been researched to gain an understanding of the
building and of the mechanical systems used in the building. Photographs of the interior and
exterior of the buildings features have been included in the case study and are taken from the
Development Alternatives web site. The case study culminated in a personal interview held
between the researcher and representatives at the Development Alternatives group, as described
in the following paragraph.
74
In preparation for a personal interview with the Development Alternatives group, a list of
fourteen questions was prepared that were designed to gain an understanding of the project
management methods used during the design and construction of the Development Alternatives
new world headquarters. The questionnaire was sent to the attention of Dr. K. Vijaya Lakshimi
of the Development Alternatives group on November 17, 2012 by e-mail. Dr. K. Vijaya
Lakshimi of the Development Alternatives group was contacted on January 31, by e-mail, and
agreed to participate in an online video interview using the program Skype. An interview with
the researcher as the moderator, took place with Dr. K. Vijaya Lakshimi and Kriti Nagrath on
February 1, 2013. At the time of the interview, both Dr. K. Vijaya Lakshimi and Kriti Nagrath
were located at the Development Alternatives world headquarters in New Delhi, India. The
moderator was located at his residence in Swansea, Massachusetts U.S.A. The interview
followed a structured format using the list of fourteen questions as a guide. The results of the
interview with the Development Alternatives group can be found in Chapter Four.
75
Chapter Four
Results
Introduction
This chapter will provide the results of the Literature review and other steps that are described in
the methodology chapter as well as the online questionnaire and the interview. The results of an
extensive online survey were collected for a period of over four months from architects,
engineers, constructors, and vendors presently working in India. A questionnaire sent to the
Development Alternatives group, which examines how its personnel have met the challenges of
working and implementing a project in India using green building principles. The results
provided in the presentation of the Literature review, online survey and questionnaire would
support this paper’s objective of providing a conceptual process-decision model to support
American AEC companies to become involved in the green building market in the Republic of
India. The process-decision model will provide American AEC companies with the information
necessary to understand if the Republic of India offers a market for their company’s select
product or area of expertise, by allowing the user to proceed through a step-by-step process-
decision model, which answers the following questions. How competitive the market may be in
their select area of specialization. What professional licensing or registration may be required
for their company to practice its profession in the Republic of India? What green building
standards or requirements (LEED India) must be met to meet the desired level of certification.
76
4.1 Results of the Literature Review
The results of the literature review are provided in this section. These results show that there is
infrastructure in place that will support the introduction of an American AEC companies project
management skills, and technology into the green building market of India. This study supports
the view that the best possible route for American AEC companies to enter the Indian business
community is by establishing a joint venture. The vehicle that is most commonly used to
establish a joint venture in India is the private limited company. The remainder of this section
will provide the results of the literature review that support the steps shown in the process
decision model.
The literature review provides results that show that persons interested in becoming educated to
understand the rating systems used in India for the certification of green buildings can do so.
The results of the literature review also show there exists an established means to become
certified through GRIHA and LEED India to be able to practice ones specific profession within
the green building market. The literature provides the support to do so by first, directing the
reader to develop an understanding of the rating system most commonly used in the United
States of America, LEED USGBC. Once this has been done the reader may become educated in
the IGBC LEED India rating system. The results of the literature review also present the
information that can be used to contact GRIHA, and ADaRSH to become educated about their
rating system and become certified as an evaluator.
77
The results of the literature review support a company to use the services and incentives for
doing business in India, that are available through the United States Government, Department of
Commerce. Examples of specific trade missions that have been completed can be reviewed by
the reader, with internet web sites for use as a source to find future trade missions. The literature
review also provides areas of opportunity as listed by an Indian organization the CIDC. The
results of the literature review are able to inform companies about the professional licensing and
registration requirements that a company may need to understand to assure that their employees,
that travel to India, will be able to meet the requirements of the India Licensing bodies. The
licensing bodies webs site are provided in the literature review and the process decision model.
The literature review will support the reader in becoming knowledgeable about the building
codes in India, that are necessary to understand, to successfully implement a green building
project. The literature review will provide the reader with an understanding of the methods used
in the development of codes. The literature review provides a history of the Indian building
codes in the form of a timeline, which shows at what point in time the building codes were
introduced. These include both the mandatory building codes, and building codes that are not
yet mandatory. The results of the literature review shows where sustainability has been
incorporated into the National Building Code of India. A basic understanding of the building
codes used in India is essential for those interested in working at a project management level.
Having an understanding of the building codes will increase the effectiveness of American AEC
project management.
78
Having an understanding of the competitiveness of an industry may effect the ability of a
company to establish a business presence when entering a foreign country. The results of the
literature review provide information regarding the number of persons that are graduating from
institutions in the engineering professional fields in India and the number of those persons who
are registered, to practice architecture in India. The estimated number of contractors is provided
in the literature review. These are contractors from both the organized and the unorganized
sector of the industry. Understanding the competition in any of the AEC fields in India supports
an American companies chances of successfully establishing a presence in their specific area of
expertise.
4.2 Results of LEED India Study
This section provides the results of the research of LEED India. In addition, this section
provides a graphic model depicting the similarities between LEED India and LEED USGBC.
The results show, domestically developed ratings like the Green Rating for Integrated Habitat
Assessment (GRIHA) also exist for sustainable buildings, but according to one estimate, the
number of green building area registered under LEED India is more than that under GRIHA.
Although GRIHA has been developed to take advantage of the traditional building methods,
which include passive air cooling, it is apparent that LEED India continues to be the choice of
those who seek certification for green buildings in India. As of October 7, 2012 the Indian
Green Building Council website (IGBC, 2012) scorecard listed “1,756 registered buildings, 276
certified buildings, and 1.24 billion sq.ft Green building footprint.” Many of these buildings
being LEED certified. On the same date, the GRIHA website provided information stating
79
“250 projects are being evaluated by GRIHA and 9 buildings have been rated so far.” (GRIHA,
2012) In light of these findings this paper will provide a model of LEED India as opposed to
GRIHA, since the majority of projects in India are presently using IGBC, LEED India as the
rating system to certify their green buildings. Shown in Figure 10 are the sections of both LEED
India NC IGBC – 2011 and LEED NC USGBC – 2009.
LEED India NC IGBC - 2011
Sustainable Sites26 Points Available
Water Efficiency10 Points Available
Energy & Atmosphere
35 Points Available
Material & Resources
14 Points Available
Indoor Environmental
Quality15 Points Available
Sustainable Sites26 Points Available
Water Efficiency10 Points Available
Energy and Atmosphere
35 Points Available
Materials and Resources
14 Points Available
Indoor Environmental
Quality15 Points Available
LEED NCUSGBC - 2009
Innovation in Design6 Points Available
Regional Priority4 Points Available
Model of LEED India 2011 IGBC vs. LEED USGBC 2009
Regional Priority4 Points Available
Figure 10. Model of LEED IGBC – 2011 and LEED NC USGBC – 2009
For a detailed comparative listing of the credits and points available in both LEED India NC
IGBC – 2011 and LEED NC USGBC – 2009, refer to Appendix C.
80
4.3 Results of the Survey
The goal of this survey is to understand the present green building environment in India. The
purpose of the survey is to present questions whose answers will provide insight into various
aspects, views, and experiences of the AEC community presently working in India. It is the
intent of this study to, not only understand the views of individuals who are normally considered
professionals or hold a degree from an institution, but to also understand the views and
experiences of those persons who may be contributing to green building at a level that may not
require a degree or professional licensing.
To elicit responses from such a wide sample, invitations to take an anonymous survey were sent
to persons and companies representing Architects, Interior Decorators, Building Contractors,
Builders & Construction Materials vendors. The letter of invitation provides a brief explanation
about the purpose of the survey. A link to a URL was provided within the invitation letter that
directs the recipient to a web site where the internet survey can be completed. The recipient,
who received the invitation to take the survey, was made aware that the survey would be used for
educational purposes only, and that all survey responses will remain anonymous.
The survey template that was used has allowed the respondent to choose an answer choice that
best represented their particular view or experience. Questions one through nine allowed for a
multiple-choice answer. Question ten requests that the respondent provide a comment to their
specific experience or understanding of the AEC industry in India, and the respondent is not
allowed to select an answer, from multiple answers. Question one, two, three, four, six, seven,
81
eight, and nine allow the respondent to provide input in the form of a comment or short
paragraph, in addition to having a multiple answer choice.
The results of the survey are provided to the reader using the following analytical tools and
methods. The Original question as it was presented on the survey instrument to the respondent is
provided. A brief explanation of the purpose of the question and how it is intended to contribute
to meet the objective of this research is presented. A graphic interpretation of the results is
provided, which will allow the reader to have a visual understanding of the results. The graphic
is provided in one of the following formats; a horizontal bar graph, or a combination of a
horizontal bar graph and a cross tabulation chart, or a cross tabulation chart. 5,402 recipients
were sent the letters of invitation and an accompanying survey instrument. A total of 29
responses were received. This provides a response rate of .005.
Survey results:
Question One: What area of the building industry do you or your company specialize in? See
Figure 11.
The sample group has been asked to respond to question one to provide an understanding of what
specific sector of the industry; the companies were from, that responded to the survey. Question
one will also be used in a cross tabulation analysis with question nine. This will provide the
reader with an understanding how each of the industry sectors views the potential introduction of
management skills and technologies, to the Indian work environment by American companies.
82
Figure 11. Question One Bar Chart
N = 29
As shown Table 10 when question one “What area of the building industry do you or your
company specialize in?” and question nine “Do you believe that project management skills and
technology provided by American companies will benefit sustainable or green building design
and construction in India?” are cross tabulated, the following results are observed.
Do you believe that project management skills and technology provided by American companies will benefit sustainable or green building design and construction in India?
Yes No No opinion Please provide additional comments in
the space provided below Total
What area of the building industry do you or your company specialize in?
Architectural Design 0 3 1 2 6
Engineering Design 0 0 0 0 0
Construction Services 1 0 1 0 2
Architecture, Engineering and Construction (AEC)
1 0 0 0 1
Manufacturing or vendor (Please specify manufacturer and product name)
8 0 1 0 9
Other (Please Specify) 0 1 0 0 1
Total 10 4 3 2 19
Table 10. Question One Cross Tabulation Table
83
The results to the cross tabulation table and written comments provided indicate that green
building design and construction would benefit from project management skills and technology
provided by American companies. The architectural sector provided written responses indicating
that these skills would benefit in some cases. However, it should be noted that the architectural
sector has also indicated by several of their responses these skills would not benefit green
building design and construction. It is understood that those who have responded from the
architectural sector may have professional training in these areas. The results also indicate that
manufacturing and vendors believe that project management by American companies would
benefit green building design and construction. This sector of the AEC industry may not have
received professional training as a group, and may look forward to the introduction of these skills
into the AEC industry.
The following are the written comments that were provided by the architectural respondents:
Maybe in some specific areas.
Mostly since the specifications for green buildings need to be interpreted. Local
methods need to be reinterpreted.
Question one allowed the “Manufacturers or vendors” of the sample group to specify the product
type, which their company represented. The following are a few of the products that were listed:
Rockwool, Polyurethane Foam
Polisocyanuratee foam, prefab panels
Roofing Fasteners (Company name deleted)
Fly Ash Brick, Precast Products
Washer, Nuts and Bolts (Company name deleted)
84
Manufacturers of Bathroom faucets
Blinds and Fabric Structures
Steel Roofing Structures, Gates and Grills
Suppliers of Steel (Company name deleted)
Manufacturing of critical parts for concrete pumps
Question Two: On sustainable or green building projects that you or your company have worked
on, what was the country of origin of the project management? See Figure 12.
The sample group was asked to answer this question to provide responses that will allow the
reader to understand if persons with project management experience and skills are being
provided by native Indian population, or, if companies are relocating persons with these skills to
India. This information may also provide an understanding of what language skills may be
required in India, as there may be different languages spoken between project management and
the skilled labor on the job.
The results to this question indicate that project management skills are available within the
Indian AEC population. This may reduce the possibility of a language barrier between project
management and the labor force working on a project. It may also reduce the need for American
AEC companies to relocate project management from the United States to fill every position.
Although it is not possible to determine the level of skills of the available project management
pool in india from this question, Chapter Two of this paper provides information regarding the
number of professionals registered as architects and graduating from engineering schools in
India. There was one answer which indicated project management was provided by a foreign
85
company. The respondent has provided a written response stating that the project management
referenced were from Israel.
Figure 12. Question Two Bar Chart
N = 28
Question Three: On sustainable or green projects that you or your company have worked on,
what was the country of origin of the skilled labor and equipment operators? See Figure 13.
This question has been presented to the sample group to provide the reader with an
understanding of whether or not there is a pool of skilled labor and equipment operators in India
that a company interested in working in India can hire. This question may also provide a
company interested in working in India, with the information needed to determine whether or not
housing and services such as laundry, food preparation, may be required as part of a contract.
86
Figure 13. Question Three Bar Chart
N = 28
This question may indicate that there is skilled labor and equipment operators available in india
within the local population that can be hired to work on individual projects. It would take further
analysis to understand if different geographical areas of India develop skills in a labor pool that
are specific to a certain region. Further understanding of this specific area of the Indian AEC
labor market would be required to determine if an American company interested in working in
India would be required to provide housing and services such as laundry and food preparation for
a skilled labor force hired in India.
Question Four: What types of projects do you or your company usually work on? See Figure
14.
This question was provided to the sample group with the intent that it will help identify, what
sector of the industry, green building is taking place. It is also the intent that this question will
87
help identify what type of skilled labor may be in India and may be available to hire, by possibly
identifying companies that hire carpenters, iron workers, electrical workers, or workers skilled in
transportation work.
Figure 14. Question Four Bar Chart.
N = 25
The respondents were able to select “Other (please specify)” as a answer selection to question
four. Of those respondents that choose “Other (Please specify) as an answer choice, five
provided the following input, shown below:
Industrial, Residential, commercial
Industrial
Industrial
Vendors to OEMs and spares market.
Residential, commercial
These responses indicate that several of the respondents categorized themselves as working in
the Industrial sector. The answer selection “industrial” was not provided as an answer choice in
88
the survey. Although a specific type of industrial work was not identified, such as chemical, or
fertilizers, these respondents clearly identified themselves as separated from the sectors that were
listed as possible answers. This may identify a limitation of this survey question. Two of the
respondents that provided a write in answer listed their area of work as involving more than one
sector. This may indicate that these particular responses may be from a larger company, that has
a skill set that allows them to work on a variety of different types of projects.
Provided in Table 11 are the results when question four, “What types of projects do you or your
company usually work on?” is cross tabulated with question six, “Have you or your company
attempted to use Clean Development Mechanisms to achieve Certified Emissions Reduction
credits on your projects?”
Have you or your company attempted to use Clean Development Mechanisms to achieve Certified Emission...
Yes No Not familiar with Clean Development Mechanisms
(Please specify) Total
What types of projects do you or your company usually work on?
Institutional 1 3 3 7
Residential 5 4 1 10
Transportation 0 1 0 1
Renewable Energy
1 0 0 1
Other (Please specify)
2 2 2 6
Total 9 10 6 25
Table 11. Question Four Cross Tabulation Table.
It is not possible to determine the types of work that is being done within the different sectors.
However, this cross tabulation table does provide information to companies interested in
working in India, what specific sectors of the AEC industry are using the CDM to help finance
their projects and reduce costs.
89
Question Five: What size projects have you or your company worked on? See Figure 15.
This question is provided to identify the value of the projects that the respondents to this survey
are participating on.
Figure 15. Question Five Bar Chart.
N = 26
Shown in Table 12 are the results, when question five, “What size projects have you or your
company worked on?” And question one, “What area of the building industry do you or your
company specializes in?” is cross tabulated. Cross tabulating these questions will show, which
sectors of the industry have been working on projects of a designated value. This question may
also help a company determine whether the construction environment is attractive within a
specific industry sector.
90
What size projects have you or your company worked on?
Less than 1 million
US dollars
1 million US
dollars to 50 million
US dollars
50 million US
dollars to 100
million US dollars
100 million US dollars to
150 million US
dollars
150 million US dollars to
200 million US
dollars
200 million US dollars to
250 million US
dollars
Above 250
million US
dollars
Total
What area of the building
industry do you or your
company specialize in?
Architectural Design
6 2 0 1 0 0 0 9
Engineering Design
0 0 0 0 0 0 0 0
Construction Services
2 0 0 0 0 0 0 2
Architecture, Engineering and Construction (AEC)
1 0 0 0 0 0 0 1
Manufacturing or vendor (Please specify manufacturer and product name)
6 6 1 0 0 0 0 13
Other (Please Specify)
0 0 0 1 0 0 0 1
Total 15 8 1 2 0 0 0 26
Table 12. Question Five Cross Tabulation Table.
The results of the cross tabulation table show that the majority of projects occurred in two
sectors, the architectural design sector, and the manufacturing or vendor sector. Although the
respondents were not asked to identify what types of projects they had worked on when making
these answer choices, it may be possible to conclude that projects under 1 million dollars in
value were residential or smaller buildings and may even be work to existing buildings. Both
the architectural design sector and manufacturing vendor sector also worked on a project in
value of up to 150 million dollars. It is not possible to speculate what type of building or
project these may have been. However, American companies may gain an understanding of the
91
Question Six: Have you or your company attempted to use Clean Development Mechanisms to
achieve Certified Emissions Reduction credits on your projects? See Figure 16.
This question was prepared to provide an indication of what size projects are using CDM’s and
whether or not CDM’s are acting as an incentive within the green building market.
The responses indicate that seventy six point nine percent of the twenty six who responded had
enough of an understanding of CDM’s to respond with a “Yes” or “No” answer. Twenty three
percent were not familiar with CDM’s. This may be interpreted as, a little over three quarters of
the sample that responded to the question may be aware of the fact that there are incentives
available, which promote the reduction of GHG’s and may provide financial benefits to the
promoters or developers of green or sustainable projects. Although it may be desirable to see a
higher response rate at this point in time, indicating that more projects had attempted to use
CDM’s, the findings of this paper indicate that over a period of a few years, 2008 to 2012 the
number of projects registered to use CDM’s has almost doubled. It can be said that the rate of
increase in the use of CDM’s over a four year period is a positive step in the use of this
mechanism.
value of projects are that are taking place in India in each specific sectors shown on this table.
92
Figure 16. Question Six Bar Chart.
N = 26
As shown in Table 13 when question five “What size projects have you or your company worked
on?” and question six “Have you or your company attempted to use Clean Development
Mechanisms to achieve Certified Emissions Reductions credits on your projects?” are cross
tabulated the following results are observed.
Have you or your company attempted to use Clean Development Mechanisms to achieve Certified Emissions Reductions credits on your projects?
Yes No Not familiar with Clean Development Mechanisms
(Please specify) Total
What size projects have you or your company worked on?
Less than 1 million US dollars
6 7 2 15
1 million US dollars to 50 million US dollars
1 4 3 8
50 million US dollars to 100 million US dollars
1 0 0 1
100 million US dollars to 150 million US dollars
1 0 1 2
150 million US dollars to 200 million US dollars
0 0 0 0
200 million US dollars to 250 million US dollars
0 0 0 0
Above 250 million US dollars
0 0 0 0
Total 9 11 6 26
Table 13. Question Six Cross Tabulation Table.
93
The results to the cross tabulation table show that although there were more respondents that had
worked on projects that did not attempt to use CDM’s to achieve CER’s on their projects, those
projects that did attempt to use CDM’s to achieve CER’s were spread throughout a larger range
of value. The projects that had attempted to use CDM’s ranged in value from less than 1 million
to 150 million. This may indicate that of the companies that responded to this survey, the ones
that are working on large value projects had attempted to use the CDM as a means to provide
financing or control cost for the project. Although these responses are small in number, this
survey question may have identified the CDM being for the purpose it was intended.
Question Seven: Did your project apply for certification with the Green Rating for Integrated
Habitat Assessment (GRIHA) or Leadership in Energy and Environmental Design (LEED) India
rating systems? See Figure 17.
This question was presented to identify, which of the rating systems is being used in India to
certify green buildings. This question will also indicate if the respondents, were not attempting
to use a rating system to achieve certification. Or, if rating systems other than GRIHA or LEED
India are being used to provide certification for green buildings in India.
94
Figure 17. Question Seven Bar Chart.
N = 20
When question seven “Did your project apply for certification with the Green Rating for
Integrated Habitat Assessment (GRIHA) or Leadership in Energy and Environmental Design
(LEED) India rating systems?” is cross tabulated with question four “What types of projects do
you or your company usually work on?” the following results were observed, in Table 14.
Did your project apply for certification with the Green Rating for Integrated Habitat Assessment (GRIHA) or Leadership in Energy and Environmental
Design (LEED) India rating systems?
GRIHA LEED India
Did not attempt to use rating system to achieve
certification
Used other rating system to achieve certification (Please
specify) Total
What types of projects do you or your
company usually work on?
Institutional 0 0 6 1 7
Residential 0 1 6 0 7
Transportation 0 0 1 0 1
Renewable Energy
0 1 0 0 1
Other (Please specify)
0 0 3 1 4
Total 0 2 16 2 20
Table 14. Question Seven Cross Tabulation Table.
95
The results of the cross tabulation table show that the majority of buildings that respondents had
worked on did not attempt to use green rating to achieve certification. This may imply that the
buildings being worked on were not incorporating green building principles. However, this may
also be an indication of green building princples being used to provide different aspects of the
building or building systems, while not attempting to meet all of the requirements needed to
receive a rating that would allow a building to be certified. The high number of responses that
indicate a rating system was not used may indicate there are a substantial number of buildings
similar to the building used as a case study in this paper, the Development Alternatives world
headquarters. The Development world headquarters used many aspects of green building,
however, did not attempt to become certified through a recognized rating system. The two
respondents that choose “Used other rating system to achieve certification (Please specify)” as
an answer, indicated that IGBC was used as a rating system. This may indicate that these were
buildings that did not fall under the classification of buildings that can be rated using IGCB
LEED India, but did meet the certification requirements of other systems used by the IGBC. The
answers provided that indicated LEED India was used does confirm that LEED India is being
used in India as a rating system. The fact that none of the respondents had used GRIHA as a
rating system is consistent with the findings of this paper in the fact that LEED India is being
used as a rating system more often the GRIHA.
Question Eight: What type of delivery method do you or your company prefer to use on
sustainable or green projects in India? See Figure 18.
96
This question will provide an indication of what type of delivery methods are being used in
India. When cross tabulated with other questions in this survey, question eight may inform a
company which delivery methods are being used by what sectors of the building industry for a
particular delivery method on green building projects. This may provide and indication of what
type of delivery methods a company’s project managers should have experience in to deliver a
successful project in India.
Figure 18. Question Eight Bar Chart
N = 19
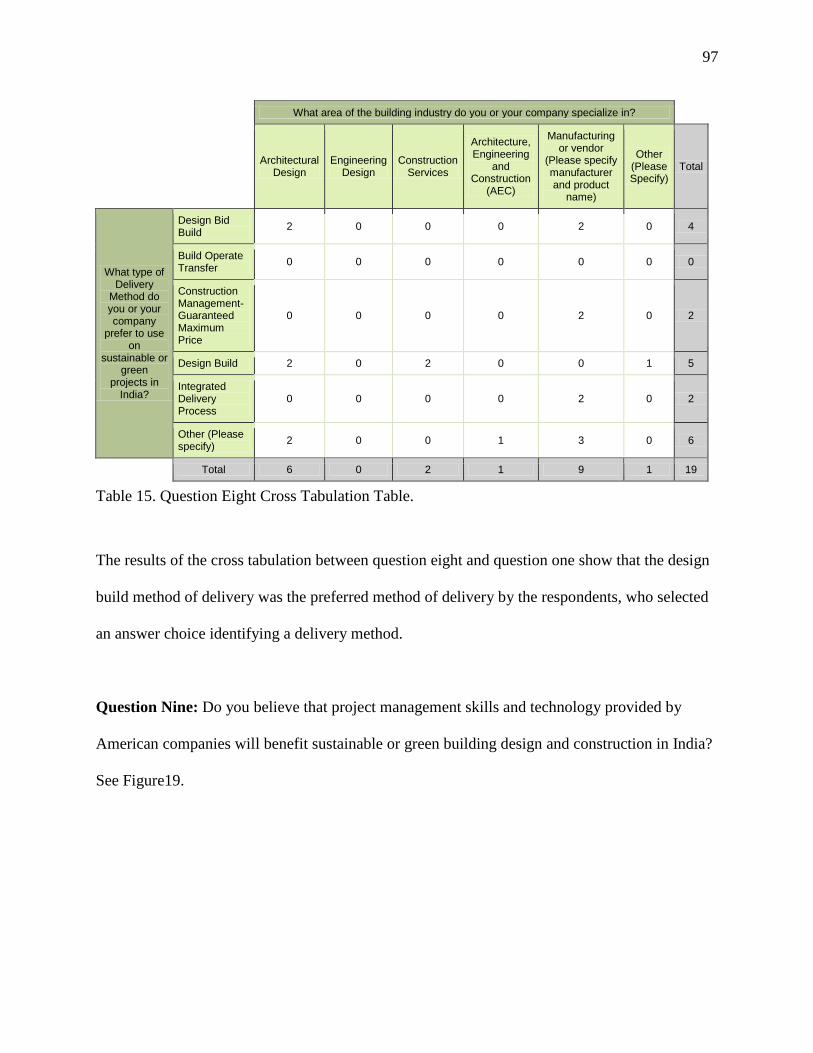
When question eight “What type of delivery Method do you or your company prefer to use on
sustainable or green projects in India?” was cross tabulated with question one “What area of the
building industry do you or your company specialize in?” the following results were noted as
shown in Table 15.
97
What area of the building industry do you or your company specialize in?
Architectural Design
Engineering Design
Construction Services
Architecture, Engineering
and Construction
(AEC)
Manufacturing or vendor
(Please specify manufacturer and product
name)
Other (Please Specify)
Total
What type of Delivery
Method do you or your company
prefer to use on
sustainable or green
projects in India?
Design Bid Build
2 0 0 0 2 0 4
Build Operate Transfer
0 0 0 0 0 0 0
Construction Management-Guaranteed Maximum Price
0 0 0 0 2 0 2
Design Build 2 0 2 0 0 1 5
Integrated Delivery Process
0 0 0 0 2 0 2
Other (Please specify)
2 0 0 1 3 0 6
Total 6 0 2 1 9 1 19
Table 15. Question Eight Cross Tabulation Table.
The results of the cross tabulation between question eight and question one show that the design
build method of delivery was the preferred method of delivery by the respondents, who selected
an answer choice identifying a delivery method.
Question Nine: Do you believe that project management skills and technology provided by
American companies will benefit sustainable or green building design and construction in India?
See Figure19.
98
Figure 19. Question Nine Bar Chart
N = 19
This researcher believes it is important to elicit as much information as possible from the AEC
industry presently working in India regarding how receptive the environment may be to
American project management skills and technology. It may be an advantage to an American
company to provide project management and technology as the first wave of personal that is
introduced in any foreign working relationship. This may reduce the need for a large capital
investment in office space and equipment by a foreign company attempting to establish a
presence in India. It may also allow a foreign company to enter a particular market or niche at a
faster pace, leading to greater competitiveness.
Question Ten: As a company with experience in the AEC industry in India, please provide any
additional comments you may have for those planning to get involved in the AEC industry in
India. See Table 16.
99
As a company with experience in the AEC industry in India, please provide any additional comments you may have for those planning to get involved in the AEC industry.
(Please specify) Total
What area of the building industry do you or your company specialize in?
Architectural Design 4 4
Engineering Design 0 0
Construction Services 1 1
Architecture, Engineering and Construction (AEC)
1 1
Manufacturing or vendor (Please specify manufacturer and product name)
7 7
Other (Please Specify) 0 0
Total 13 13
Table 16. Question Ten Cross Tabulation Table.
As shown on the cross tabulation table there were 13 responses to question ten. It is not possible
to determine, what area of the building industry provided which response, as it was the intent to
provide an anonymous survey. The unedited responses received from those presently working in
the Indian AEC industry are as follows:
Get good information from your country of origin.
If affordable cost is there, there will be more place for Green Buildings. Right now it
seems to belong to rich only.
India is unique and standard systems used in US may not work. One needs to
understand the process of Indian AEC market and adapt.
Get product services that are country specific and not copy/paste solutions. What
works there might not work here.
Understand local scenario, know how, common knowledge and common sense used
by local people and how they work with budgetary constraints to produce quality
products.
100
Green or not green, what works in India are cost effective measures. Instead of
explaining to them the environmental impact of green technology explain to them
how it will help save money and your job will be much easier.
We are ready to listen to your advice and implement the same, if we are convinced its
for the benefit of all.
Study the specific requirements India has in materials and management.
The responses from the AEC industry listed above provide common sense advise to those
interested in working in the AEC industry in India. These responses request that good business,
and, engineering practices be followed. This can be seen in the responses indicating that good
information should be obtained both from the companies country of origin and from the Indian
AEC community. The need for good business and engineering practices are also shown by the
respondents commenting on the need for understanding and controlling the costs associated with
green building. This advise if followed, can benefit both the AEC company and the client. Using
sound business and engineering practices can result in the AEC company’s ability to finance
additional work and there being possible repeat work from a satisfied client.
4.4 Results of the Development Alternatives Case Study
The results of the Development Alternative group case study provide an understanding of the
design and construction methods used to build a green building in New Delhi, India. These
results are from an online video conversation with representatives of the Development
Alternatives organization. Note: (Another employee) has been inserted in the answers provided
101
by the Development Alternatives representatives, to replace the name of an employee who did
not participate in the online video conversation. The questions provided to the Development
Alternatives group prior to the conversation can be found in Appendix B.
Meeting Date: February 1, 2013
Purpose: Response to attached questionnaire regarding Development Alternatives Building.
Attendees: Dr. K. Vijaya Lakshimi; (Development Alternatives, Vice President), Kriti Nagrath;
(Development Alternatives, Environmental Scientist), Matthew Harbour; Interviewer
Start Time: 11:30AM IST or 1:00AM EST
End Time: 12:00PM IST or 1:30AM EST
Venue: Skype
Question One: Was the process of exploring the objective, scope, and benefits of a new building
driven by:
Answer: “It was basically because we were growing as an organization and the building outgrew
its one life, and the space that was required.” “It was a much smaller building, and then we tore
the building down and using the same materials built the one that we’re currently in” K. Nagrath
(Personal Communication, February 1, 2013).
Question Two: When Development Alternatives made the decision to build a new world
headquarters in New Delhi, was a team created within the Development Alternatives
organization that would act as the steering committee during the design process?
102
Answer: “The design process was actually very closely driven from within the organization; we
have a couple of architect and planners who were working with us, so they were part of the
scheme. But, it was a very people driven process. It was a collaborative joint effort of the
Architect and the people working in the organization” K. Nagrath (Personal Communication,
February 1, 2013).
Question Three: How were the services of the architect and design team chosen? Was one of
the following Procurement Procedures used?
Answer: “The senior most person in our organization, and who is the president now, and he was
involved in negotiating most of the bids. (Another employee) person is more of a materials and
the insuring the green building. (Another employee) was an employee of Development
Alternatives for the last twenty two years, she grew in the organization, she was an architect
originally, but she developed the program in all eco materials, and we learned on the job and she
was not radically overseeing but advising, and was part of the team, as we mentioned it was a
participative process between the engineers, the builders, the architect. The architect also is a
very high level person in India, very well recognized, and he was advising” Dr. K. Vijaya
Lakshimi (Personal Communication, February 1, 2013)
Question Four: How was the delivery method chosen? The delivery method is the agreement,
which is entered into between the owner, designer, and constructor and determines the
relationship between these three parties and how services are to be provided during the contract.
103
Answer: “In terms of who decided who will be the contractor and the designer that was a
collaborative group within the organization?” “So, within Development Alternatives who made
these calls? The final decision was taken by them” K. Nagrath (Personal Communication,
February 1, 2013).
Question Five: Was one of the following Delivery Methods used?
Answer: The Development Alternatives representatives believed that “Integrated Delivery
Process” was the closest of the delivery methods that were provided as possible answers.
Question Six: Was a contract prepared which consisted of: Drawings, which portray the
structure to be built? Specifications, which describe the qualities of materials and workmanship
to be provided by the contractor. Contract clauses, setting forth specific features that apply to the
work and concern the obligations of the parties?
Answer: “There is a contract, drawings were given, specifications were given, material
specifications as well as design specifications. But, the exact legal nature of that contract or
what those clauses are, I don’t think I will be able to answer that question” K. Nagrath (Personal
Communication, February 1, 2013).
Question Seven: Was one of the following Contract Payment Provisions used?
104
Answer: Contract Payment Provisions were addressed by Development Alternatives upper
management personal who were not present during the February 1, 2013 Skype interview. The
type of Contract Payment Provisions used was not known by those attending the interview.
Question Eight: Were bid bonds, performance bonds and payment bonds required from the
construction companies working on the project?
Answer: Bonding requirements were addressed by Development Alternatives upper
management personal who were not present during the February 1, 2013, Skype interview. The
requirements for bid bonds, performance bonds and payment bonds was not known by those
attending the interview. However, the Development Alternatives representatives provided the
following input. “In terms of the actual financial and legal implications of the contract, that was
not expertise that lies here, this was a decision that was taken at management level” K. Nagrath
(Personal Communication, February 1, 2013).
Question Nine: Has the new Development Alternatives World Headquarters received a rating
from LEED IGBC or GRIHA? If so, what rating did it receive?
Answer: “We haven’t, and we have consciously not applied for any of these ratings; part of the
reason is that because we believe that these ratings are quite restricting in terms of they look at a
very small percentage of what goes into a green building whereas we have adopted a far more
realistic approach looking at everything right from the materials to the design of the plan,
105
orientation everything, and all of these factors don’t really get considered in either of the ratings”
K. Nagrath (Personal Communication, February 1, 2013).
Question Ten: Did the architect act as the green building consultant, or was a person or team
brought onto the project whose sole purpose was to provide consulting services to meet green
building requirements?
Answer: “A lot of input did come from the architect, but we as an organization have been
working on issues of habitat eco friendly building material and design since our inception which
is about thirty years, a lot of the input came from the in house team, as well in terms of the
materials used these are some of the technologies we’ve been through working over the years”
K. Nagrath (Personal Communication, February 1, 2013).
Question Eleven: Was a charette or multiple charette’s held during the design phase of the
project? A charette is an intensive design process, which involves the collaboration of all project
stakeholders at the beginning of a project to develop a comprehensive plan or design.
Answer: “Yes, these were done, this was an interactive theme which came both from people
working within the organization, and different parts of the organization, so materials, design,
green building and of course the architects schemes” K. Nagrath (Personal Communication,
February 1, 2013).
Question Twelve: At what stage of the design process was the decision made to “go green” or to
attempt to meet LEED IGBC or GRIHA certification requirements?
106
Answer: “Always, even the building we had before this was a mud construction so that was also
a green building. This is something that we work on; we are an organization that actually
practices what we preach. So our buildings, whether it’s this one, or the one prior to this, or our
eco centers on the field, there all very green. It’s the whole cradle to grave approach. This
building is made out of material that came from dismantling the building that was built before
this” K. Nagrath (Personal Communication, February 1, 2013).
Question Thirteen: At what stage of the design process were the constructors and vendors
brought onto the team to provide value management services when considering green building
concepts?
Answer: “In terms of how to actually construct, the contractors, and vendors were in the back
point of time because using such technologies a mid-rise building has not been constructed
before. So there were a lot of details” K. Nagrath (Personal Communication, February 1, 2013).
“There was structural stability, which was established, how do you hoist the Ferro cement
channels, they were brought in on the early stage so they would have a good understanding of the
actual construction and not just on paper” K. Nagrath (Personal Communication, February 1,
2013).
Question Fourteen: Can you provide a brief written description of the commissioning process,
which was used, including the criteria used to carry out the commissioning process?
107
Answer: “They are not meeting any of the eco, green building labels, but we still have to abide
by the regulations of the local bodies” K. Nagrath (Personal Communication, February 1, 2013).
“They check once at the drawing stage and then once the building is complete they come and
have a look, they make sure all regulations are being followed, and they give you an occupation
certificate” K. Nagrath (Personal Communication, February 1, 2013).
4.5 The Process Decision Model
On the following pages, shown as Figures 20; 21; 22; 23 is a systematic step-by-step process-
decision model to support American AEC companies to become involved in the green building
market in India. This model is supported by the research presented in this paper, and the results
of the online survey. The model is provided to assist American AEC companies in
understanding how competitive the market may be in their select area of specialization. What
professional licensing or registration may be required for their company to practice its profession
in the Republic of India? What green building standards or requirements of LEED India NC
must be met to attain a desired level of certification?
108
Do you have USGBC
LEED training?
Do you have experience
in green building?
Yes No
Acquire USGBC LEED
Training new.usgbc.o
rg/leed
Acquire LEED India
Training www.igbc.in
Yes No
Read Chapter 2 Literature
Review
Are you interested in
green building in
India?
Yes No
Refer to Page 2
This process decision model is provided for persons or companies interested in green building in India
See Appendix C Comparative listing of LEED India NC IGBC
and LEED NC USGBC
Figure 20. Process Decision Model
109
Refer to Page 3
No
Have you done
business in India?
Yes
Read Chapter 2
Section 2.10
Are you interested in
using US GOV
services
Yes No
Refer to export.gov.i
ndia/
“Invest India”
www.investindia.gov.in
See export.gov Calendar of Events for
2013
Yes NoRefer to Chapter 2 Section 2.10 to find US Gov. list of areas of opportunity in India
Refer to Chapter 2 Section 2.10 to find a CIDC list of areas of opportunity in India
There are Gov services in India that can provide information about business in India
Are you interested in
US Gov Trade Events
Refer to 2010 Country Commercial Guide for U.S.
Companies
www.renewableenergyindiaexpo.com/ for information on renewable energy India Expo – 12 – 14 September 2013
Refer to Appendix F, Steps Required to Start a Business in India
Figure 21. Process Decision Model – Continued.
110
Are your employees licensed in
their field in India?
Yes No
Foreign Engineers going to India, refer to “The Institution of Engineers India” www.ieindia.org/Prof.aspx
Foreign Architects going to India, refer to “Council of Architecture ” www.coa.gov.in/
Foreign Constructors going to India, refer to “Construction Industry Development Council ” www.cidc.in/
Are you familiar with the building
codes in India?
Yes No
Refer to Ch. 2 Section 2.8 Outline of National and Local Building Regulations in India
Bureau of Indian Standards for National Building Code of India. www.bis.org/sf/nbc.htm
Refer to Page 4
Energy Conservation Building Code User Guide v 2.0 (April 2011) Web site: eco3.org/
Ministry of Environment and Forests, Government of India Web site: envfor.nic.in/
Figure 22. Process Decision Model - Continued
111
Do you know how competitive your area of specialization is in Architecture, Engineering and Construction in India?
Yes No
Refer to Ch. 2 Section 2.10 Business Opportunities in
India
Are you aware of the construction procedures
in India?
Yes No
Refer to Appendix E to review Construction Procedures in
India
End of Process Decision Model
Refer to Chapter 2 Section 2.10 to find US Gov. list of areas of opportunity in India
Refer to Chapter 2 Section 2.10 to find a CIDC list of areas of opportunity in India
Figure 23. Process Decision Model – Continued
112
Chapter Five
Conclusion and Recommendations
5.1 Research Conclusion
The Republic of India and its AEC community are incorporating changes into the current
building design and construction practices that promote green building as a means to create
healthy indoor living environments, reduce the depletion of precious natural resources, control
the rising cost of energy and reduce the emissions of GHG into the environment. These changes
are supported by the research and work done by the MNRE, TERI and the IGBC with their
ongoing effort to make available the methods to incorporate green building principles into the
design and construction of building projects in India. It is because of the work of these
organizations that the Indian AEC community is now able to meet the needs of green building
through the implementation of the GRIHA and LEED India rating systems. In addition, private
organizations such as the Development Alternatives group promote green building principles and
sustainable technology by providing low carbon economic solutions for use by small and
medium business. The methods used to design and build their new Development Alternatives
World headquarters in New Delhi, India is one of the indicators of their commitment to green
building. This research has addressed the problem statement “too few American AEC
companies are participating in the green building construction market in the Republic of India,
and provides support to show that there are opportunities for the American AEC community to
become involved in the green building market in the Republic of India. As a result of this thesis,
a decision model was developed, to be used as a guide to access this market.
113
As green building technology evolves and the costs of incorporating green building materials
into the design and construction of buildings becomes more attractive to owners and developers,
the green building market in India will continue to expand. Coupled with India’s expected
consistent rate of growth; its status as a Non-Annex I country; and its ability to produce projects
that sell CER’s on the carbon market to support sustainable development and reduce GHG
emissions, the green building market in India is an attractive source of overseas opportunity for
American AEC companies. With the continued support of United States government initiatives,
such as those sponsored by the US Department of Commerce, and the knowledge that the Indian
AEC community will receive project management skills and technologies introduced by
American AEC companies positively, American AEC companies may find opportunities in the
green building construction market of India.
There are systems in India that can contribute to, controlling or reducing the potential
environmental problems in India, which are caused by building construction, and, the effects that
are inherent to non-sustainable buildings. These potential environmental problems can be
controlled or reduced through the use of green building practices. Systems are in place, which
promote the use of FDI in the Republic of India. The FDI that is entering India can be through
the establishment of AEC companies as joint ventures that are interested in the design and
construction of green buildings. FDI can also take place in the form of manufacturing or the
distribution of equipment parts and the technology that supports green building. These
equipment and parts can be for items such as solar panels, climate control systems for buildings,
or pump parts used for water recycling systems. The use of the CDM and the transfer of CER’s
114
is also a system that will financially support addressing India’s potential environmental
problems.
Through the use of the building codes such as the National Building Code of India, the
Environment Impact Assessment and Clearance, the Energy Conservation Building Code, and
green building rating systems such as GRIHA and IGBC LEED, some of India’s, potential
environmental problems are being addressed. Many of the green building concepts that have
become popular in India; have only been introduced within the last few decades. The green
building rating systems in India that support these concepts have only been introduced within the
last decade. Although these systems are relatively new, their positive effect on India’s potential
environmental problems may continue to grow in the coming decades.
The economic differences between India, a developing country and, the United States of
America, a developed country, will support the introduction of American AEC project
management or technology into India. There are a substantial difference in the wages, which are
offered to the average skilled craftsman in India and the average skilled craftsman in the United
States of America. For this reason, it is more likely that American craftsmen would find work in
India in a supervisory position. This type of position may require that an American worker have
both the technical understanding of their particular trade, and have the ability to apply project
management theory.
This paper supports the concept that the joint venture arrangement may be the most successful
method for an American AEC company to become established in the green building market in
115
the Republic of India. For an American company interested in establishing such a business
arrangement, the economic differences between India and the United States will support an
American AEC company that is interested in relocating professionals to India. The most
successful candidates for these positions may be those who are educated as architects, engineers,
or construction managers, and, are interested in working in the green building market in the
Republic of India.
5.2 Research Recommendations
Suggested future research in the field of green building may be of materials specific to India that
are used to meet the IGBC LEED India, “Regional Materials” and “Rapidly Renewable
Materials” requirements for certification. This research may focus on the possible relationships
between the Indian Ministry of Environment & Forests, Sustainable Forest Management
programs, and using wood grown in these forests to meet the Regional Materials and Rapidly
Renewable Materials requirements for certification.
Additional suggested research might be done regarding the number of building projects in India
that seek green building certification. Area of focus may be: What can be done in addition to
using the policies and incentives mentioned in this study, that will increase awareness in green
building within the AEC communities and the general public in the Republic of India. A study
of this type may seek to define strategies to further promote green building, with the result of
increasing the number of buildings that seek certification.
116
References:
(n.d.).
Abbass, D. (2012, November 15). Kyoto Portocol's clean development mechanism registers
5,000th project. Press Release - Kyoto Portocol's clean development mechanism registers
5,000th project. Bonn, North Rhine- Westphalia, Germany: United Nations Climate
Change Secretariat.
Allen, Booz, & Hamilton. (2008). U.S. Green Building Council, Green Jobs Study. Washington,
DC: U.S.Green Building Council.
Alternatives, Development (2012). Annual Report . New Delhi: Development Alternatives.
Alternatives, Development (2012, November 27). Development Alternatives - About us.
Retrieved November 27, 2012, from Development Alternatives: www.devalt.org
Architecture, C. o. (2013, February 16). Conditions of Engagement and Scale of Charges
Preamble. Retrieved from Council of Architecture:
www.coa.gov.in/practice/practice.htm
Architecture, C. o. (2013, March 1). Registration Statistics. Retrieved from Council of
Architecture: www.coa.gov.in/home/regstats.htm
Arditi, D., Birgonul, M. T., Dikmen, I., & Ozorhon, B. (2010, October). Performance of
International Joint Ventures in Construction. Journal of Management in Engineering, pp.
209-222.
Arif, M., Ebohon, J., Egbu, C., Haleem, A., & Khalfan, M. (2009). Green Construction in India:
Gaining a Deeper Understanding. Journal of Architecture Engineering ASCE.
Assessment, G. R. (2012, October 10). Green Rating for Integrated Habitat Assessment.
Retrieved from Green Rating for Integrated Habitat Assessment:
www.grihaindia.org/#&home
Bana, S. (2012, November 12). India Powers ahead on Renewable Energy. Retrieved from
Renewable Energy Focus.com: www.renewableenergyfocus.com/view/29336/india-
powers-ahead-on-renewable-energy/
117
Banerji, R. (Director). (2010). Greenest Building in New Delhi [Motion Picture].
Basiago, A. (1999). Economic, social and environmental sustainability in development theory
and urban planning practice. The Environmentalist, pp. 145-161.
Behrens, R., & Haralambides, H. (2000). Port Restructuring in a Global Economy: An Indian
Perspective. International Journal of Transport Economics, 19-39.
Bernanke, B. S. (2010). Policy and the Housing Bubble. Board of Governors of the Federal
Reserve System at the Meeting of the American Economic Association , (pp. 1-36).
Atlanta, Georgia.
Bhatt, D., Bhatt, R., Macwan, J., & Patel, V. (2010). Analytic Hierachy Process Approach for
Criteria Ranking of Sustainable Building Assessment: A Case Study. World Applied
Sciences Journal , 881-888.
Brockmann, C., & Girmscheid, G. (2010, March). Inter- and Intraorganizational Trust in
International Construction Joint Ventures. Journal of Construction Engineering and
Management, pp. 353-360.
Bureau of Energy Efficiency. (2012, June 25). Retrieved June 25, 2012, from http://www.bee-
india.nic.in
CEA, I. D. (2012, June 25). Government of India Ministry of Power. Retrieved June 25, 2012,
from Central Electricity Authority: http://www.cea.nic.in/
Cheng, C., Pouffary, S., Svenningsen, N., & Callaway, M. (2008). The Kyoto Protocol, The
Clean Development Mechanism and the Building and Construction Sector - A Report for
the UNEP Sustainable Buildings and Construction Initiative. Paris: United Nations
Environment Programme.
Chhapia, H. (2008, May 6). Number of engineers in India inflated, says study. Retrieved from
The Times of India: articles.timesofindia.indiatimes.com
118
CIDC. (2013, April 15). Construction Industry Development Council. Retrieved from
Construction Industry Development Council: www.cidc.in/new/
CIDC. (2013, March 30). Report of The Working Group on Human Resource Development for
Construction Sector 12th Plan. Retrieved from Construction Industry Development
Council: www.cidc.in/
Commerce, U. D. (2012, October 10). U.S. Commercial Services. Retrieved from International
Trade Administration: www.trade.gov/cs/
Committee, Business, Cycle, & Dating. (2010). Business Cycle Dating Committee, National
Bureau of Economic Research. Cambridge: National Bureau of Economic Research.
Council, U. S. (1996). Sustainable Building Technical Manual. Public Technology Inc.
Development Alternatives. (2012, November 27). Development Alternatives. Retrieved
November 27, 2012, from Development Alternatives - About us: www.devalt.org
Development Alternatives. (2013, February 20). Development Alternatives Our Green Building.
Retrieved from Develpment Alternatives: www.devalt.org/our-green-building.aspx
Efficiency, B. o. (2011). Energy Conservation Building Code Users Guide. New Delhi: Bureau
of Energy Efficiency.
Emmett, G. (2012). Turner & Townsend International Construction Cost Survey 2012.
Queensland: Turner & Townsend.
Erten, D., Korkmaz, S., Potbhare, V., & Syal, M. (2009). A Review of Green Building
Movement Timelines in Developed and Developing countries to build an International
Adoption Framework. Collaboration and Integration in Engineering, Management and
Technology. Istanbul: Fifth International Conference on Construction in the 21st Century
(CITC-V).
Evans, M., Shui, B., & Somasundaram, S. (2009). Country report on Building Codes in India.
Richland, Washington: Pacific Northwest National Laboratory.
119
Export.Gov. (2012, August 12). Export.gov - Indian Architecture Mission Statement. Retrieved
August 12, 2012, from Export.gov Helping U.S. Companies Export:
http://export.gov/trademissions/indiaarchitecture/eg_main_050064.asp
Export.gov. (2012, August 16). Export.gov - show_detail_trade_events. Retrieved August 16,
2012, from Export.Gov Helping U.S. Companies Export:
http://export.gov/eac/show_detail_trade_export.asp?EventID=33135&InputType=EVEN
T
Fisher, K. (2009). Carbon Offsets & Climate Finance in India. Bangkok: Focus on the Global
South.
Garg, S., & Sundar, D. K. (2005). M-Governance: A Framework for Indian Urban Local Bodies.
GRIHA. (2012, October 10). Green Rating for Integrated Habitat Assessment. Retrieved from
Green Rating for Integrated Habitat Assessment: www.grihaindia.org/#&home
GRIHA. (2012, October 7). GRIHA Registered Projects. Retrieved October 7, 2012, from
GRIHA - Home: www.grihaindia.org/
Gujral, A. (2009). International Green Building Perspectives: India. Washington DC: USGBC
NCR.
Hennicke, P., Schleicher, T., & Shrestha, S. (2011). International comparison of energy labeling
and standards for energy efficient and green buildings. Eleventh International Conference
Enhanced Building Operations (pp. 1-10). New York City: Wuppertal Institute for
Climate, Environmental and Energy.
Hipple, S., & Theodossiou, E. (2010). Unemployment remains high in 2010 . Retrieved April 16,
2012, from Bureau of Labor Statistics: http://www.bls.gov/
IGBC. (2011). LEED 2011 for India Green Building Rating System for New Construction &
Major Renovations. Hyderabad: Confederation of Indian Industry.
120
IGBC. (2012, October 7). Indian Green Building Council. Retrieved October 7, 2012, from
Indian Green Building Council: www.igbc.in/site/igbc/index.jsp
India, G. o. (2007). Report of the Working Group on Construction for the; 11th Five Year Plan .
New Delhi: Government of India.
Institute, T. E. (2012, November 24). The Energy and Resources Institute. Retrieved from The
Energy and Resources Institute: www.teriin.org/index.php
Iyer, K., & Jha, K. (2005). Factors affecting cost performance: evidence from Indian
construction projects. International Journal of Project Management, 283-295.
Kibert, C. (2008). Sustainable Construction, Green Building Design and Delivery. John Wiley
and Sons, Inc. 2nd Edition .
Kotak, T., & Pittet, D. (2009). Environmental impact of buildings technologies A comparative
study in Kutch District, Gujarat State, India. Gujarat.
Ladwa, M., & Shukla, V. (2007). Establishing a Joint Venture in India, An Overview. London:
MLS Chase.
Lakshimi, V. (2013, February 1). Dr. (M. Harbour, Interviewer)
Laustsen, J. (2008). Energy Efficiency Requirements in Buildings Codes, Energy Efficiency
Policies For New Buildings. Paris: International Energy Agency.
Mathews, N. (2011). India Plans Airport System Expansion. Engineering News-Record.
Mathews, N. (2013). Growth in India's Infrastructure Markets Projected. Engineering News-
Record.
MNRE. (2012, July 16). Government of India Ministry of New and Renewable Energy. Retrieved
from Government of India Ministry of New and Renewable Energy: www.mnre.gov.in/
121
Mukherjee, A. (2001). Trade In Construction And Consultancy Services: India And The GATS.
New Delhi: Indian Council for Research on International Economic Relations.
Mukherjee, S. (2013, March 31). Deccan Herald. Retrieved from Number of engineers on rise:
www.deccanherald.com
Mukhopadhyay, P., & Revi, A. (2009). Keeping India's Economic Engine Going: Climate
Change and the Urbanisation Question. Ecomomic & Political Weekly, 59-70.
Muro, M., Rothwell, J., & Saha, D. (2010). Sizing the Clean Economy, A National Regional
Green Jobs Assessment. Brookings Institute|Metropolitan Policy Program.
Nagrath, K. (2013, February 1). Environmental Scientist. (M. Harbour, Interviewer)
NBER. (2012, April 18). National Bureau of Economic Research. Retrieved from National
Bureau of Economic Research: http://www.nber.org/cycles.html
Neiderberger, A. A., & Saner, R. (2005). Exploring the relationship between FDI flows and
CDM potential. United Nations Conference on Trade and Development Division on
Investment, Technology and Enterprose Development (pp. 1-41). New York and Geneva:
United Nations .
Niederberger, A., & Saner, R. (2005, April n.d.). Exloring the relationship between FDI flows
and CDM potential. Transnational Corporations, p. 10.
Purohit, P., & Michaelowa, A. (2008). CDM potential of solar water heating systems in India.
Solar Energy, 799-811.
Ray, A. S. (2004). Managing Port Reforms in India. New Delhi: Jawaharlal Nehru University.
Reina, P., & Tulacz, G. (2011). The Top 200 International Design Firms. ENR/Engineering News
Record.
Reina, P., & Tulacz, G. (2011, August). The Top 225 International Contractors.
ENR/Engineering News Record.
122
Renewable Energy Focus.com. (2012, November 14). India powers ahead on renewable energy.
Amsterdam, North Holland, Netherlands.
Satish Kumar and Ravi Kapoor, I. R. (2010). Developing an Energy Conservation Building Code
Implementation Strategy in India. ACEEE Summer Study on Energy Efficiency in
Buildings, pp. 8-209 8-224.
Schindler, P. S., & Cooper, D. R. (2011). Business Research Methods. New York: McGraw-
Hill/Irwin.
Statistics, B. o. (2012, March 22). Bureau of Labor Statistics U.S. Department of Labor.
Retrieved from BLS News Release:
www.bls.gov/news.release/archives/ggqcew_03222012.pdf
Statistics, B. o. (2012, March 22). Employment in Green Goods and Services - 2010. Retrieved
from Bureau of Labor Statistics - U.S.Department of Labor: http://www.bls.gov/ggs
Summit Level Group of Developing Countries, G. o. (2010). A Survey of Foreign Driect
Investment in G-15 Countries. Working Paper, Volume 7 February 2010.
TERI. (2012, November 16). The Energy and Resources Institute. Retrieved from The Energy
and Resources Institute: www.terinin.org/index.php
U.S. & Foreign Commercial Service and U.S. Department of State, 2. (2010). Export.gov
Helping U.S. Companies Export. Retrieved August 31, 2012, from Doing Business in
India: 2012 Country Commercial Guide for U.S. Companies: http://export.gov/india/
UNFCCC. (2008). Kyoto Protocol Reference Manual. Bonn: United Nations Framework
Convention on Climate Change.
UNFCCC. (2012). Benifits of The Clean Development Mechanism. Bonn: United Nations
Framework Convention on Climate Change.
123
Van Hampton, T. (2012, September 17). Amid PPP Slowdown, India Turns to Cash Contracts.
Engineering News-Record.
Appendix A
GRIHA Registration form.
Project Details
Project Title:
Address:
Phone:
Fax:
Email:
Project Description:
(Kindly provide the relevant project brief as this
may be displayed on the website later.)
Project contact information
Name:
Organization:
Address:
Phone:
Fax:
Email:
(Will be used for further correspondence.)
124
Project team information
Owner of building
Architect
Project Manager:
Consultants
Landscape design:
Plumbing:
HVAC:
Structural Engineer:
Lighting Design:
Others:
Project Information:
Site area (sq.m):
Built up area, excluding basement (sq.m):
Expected date of completion:
Type of building:
(Commercial, residential, institutional, mixed use,
any other)
Location:
Air Conditioned Area (sq.m):
Non-air-conditioned area (sq.m):
Time of use:
No. of occupants (permanent and floating):
No. of stories:
125
Additional Information:
Top soil preservation to be undertaken. In case no,
please attach certificate from landscape architect
stating reason Soil quality test report for ICAER
authorized laboratory.
Yes No
Number of mature trees on site area:
Hot water demand per day:
Waste Water demand per day: Litre/day
Waste Water quantity generated per day: KL/day
Rain water recharge into ground water If No,
attached water table report to prove that recharge is
not advisable as per norms specified by Central
Ground Water Board.
Yes No
Quantity of organic waste generation per day: Kg
Documents
Please attach a copy of the project drawings to help
us understand your projects better.
Yes No
If you also have a 3d model view of the envisaged
project, it can help us understand the project in
greater detail.
Yes No
Appendix B
1. Was the process of exploring the objective, scope and benefits of a new building driven
by:
126
a. The need to accommodate growth and expansion within the organization
b. The need to replace a building which had passed its functional use
c. A combination of both a and b
d. Other
Would you be able to provide a brief written description of the situation or initiative
that began the process of exploring the need for a new building?
2. When Development Alternatives made the decision to build a new world headquarters in
New Delhi, was a team created within the Development Alternatives organization that
would act as the steering committee during the design process?
If so, were these individuals chosen with regard to their:
a. Technical background in building design and construction
b. Understanding of the Development Alternatives organization and its expansion needs
c. A combination of both a and b
d. Other
If a steering committee existed, would you be able to provide a brief description of
the credentials and skills of the personal on this team?
Would you be able to provide a brief description of the green building credentials that
were held by the personal on this team, either Leadership in Energy and
Environmental Design (LEED) IGBC or Green Rating for Integrated Habitat
Assessment (GRIHA)?
127
3. How were the services of the architect and design team chosen? Was one of the
following Procurement Procedures used?
a. Low Bid
b. Best Value
c. Competitively Negotiated
d. Qualification Based
Would you be able to provide a brief written description of the process that
Development Alternatives used to procure the services of the architect and design
team members?
4. How was the delivery method chosen? The delivery method is the agreement, which is
entered into between the owner, designer, and constructor and determines the relationship
between these three parties and how services are to be provided during the contract.
a. By the Development Alternatives organization
b. By the Architect
c. By a Constructor
d. By a Collaborative
e. By a Consultant familiar with (LEED) IGBC or (GRIHA) requirements
Would you be able to provide a brief written description of the process that took place
in making this decision?
128
5. Was one of the following Delivery Methods used?
a. Design Bid Build
b. Construction Management at Risk
c. Construction Management – Guaranteed Maximum Price
d. Design Build
e. Integrated Delivery Process
f. Project Alliance
Would you be able to provide a brief written description of the relationship that
existed as the delivery method between the Development Alternatives organization,
the architect, the Construction Company or construction personal in the design and
construction process of the new building?
6. Was a contract prepared which consisted of: Drawings, which portray the structure to be
built? Specifications, which describe the qualities of materials and workmanship to be
provided by the contractor. Contract clauses, setting forth specific features that apply to
the work and concern the obligations of the parties?
a. Yes
b. No
Would you be able to provide a brief description of who signed a contract with whom
and the time or phase during the project where this took place?
129
7. Was one of the following Contract Payment Provisions used?
a. Single Fixed Price contract
b. Unit Price contract
c. Cost Plus a Fee contract
d. Guaranteed Maximum Price contract (GMP)
e. Other
Would you be able to provide a brief written description of the format used to create
the contract, such as the American Institute of Architects (AIA), the Associated
General Contractors (AGC) or the International Federation of Consulting Engineers
(FIDIC)
8. Were bid bonds, performance bonds and payment bonds required from the construction
companies working on the project?
a. Yes
b. No
9. Has the new Development Alternatives World Headquarters received a rating from
LEED IGBC or GRIHA? If so, what rating did it receive?
a. Would it be possible to provide the application document or written description of the
LEED or GRIHA credits that were applied for?
130
b. Would it be possible to provide a document or written description of which credits
were received?
10. Did the architect act as the green building consultant, or was a person or team brought
onto the project whose sole purpose was to provide consulting services to meet green
building requirements?
Would you be able to provide a brief written description of the process that took
place to explore potential credits from LEED IGBC or GRIHA?
11. Was a charette or multiple charette’s held during the design phase of the project? A
charette is an intensive design process, which involves the collaboration of all project
stakeholders at the beginning of a project to develop a comprehensive plan or design.
a. Yes
b. No
Would you be able to provide a brief written description of the method used to hear
the input or opinions of the project stakeholders, community, or parties that may be
affected by the construction of a new Development Alternatives world headquarters?
12. At what stage of the design process was the decision made to “go green” or to attempt to
meet LEED IGBC or GRIHA certification requirements?
a. Programming/Feasibility studies
b. Conceptual design phase
131
c. Schematic design phase
d. Design development phase
e. 100% Construction Documents
f. Other.
g. The decision to “go green” was made during the construction phase
13. At what stage of the design process were the constructors and vendors brought onto the
team to provide value management services when considering green building concepts?
a. Programming/Feasibility studies
b. Conceptual design phase
c. Schematic design phase
d. Design development phase
e. 100% Construction Documents
f. Constructors and vendors did not comment on the green building aspects of the
project until the construction phase
14. Can you provide a brief written description of the commissioning process, which was
used, including the criteria used to carry out the commissioning process?
132
Appendix C
Comparative listing of LEED India NC IGBC – 2011 and LEED NC USGBC – 2009
LEED India - IGBC LEED - USGBC
Section Description Points Available Section Description
Points Available
Sustainable Sites (Max 26 points)
Sustainable Sites
(14 Possible Points)
SS Prerequisite 1
Construction Activity Pollution Prevention Required
SS Prerequisite 1
Construction Activity Pollution Prevention Required
SS Credit 1 Site Selection 1 SS Credit 1 Site Selection 1
SS Credit 2
Development Density & Community Connectivity 5 SS Credit 2
Development Density & Community Connectivity 1
SS Credit 3 Brownfield Redevelopment 1 SS Credit 3
Brownfield Development 1
SS Credit 4.1
Alternative Transportation, Public Transportation Access 6 SS Credit 4.1
Alternative Transportation: Public Transportation 1
SS Credit 4.2
Alternative Transportation - Bicycle Storage and Changing Rooms 1 SS Credit 4.2
Alternative Transportation: Bicycle Storage & Changing Rooms 1
Ss Credit 4.3
Alternative Transportation -Low-Emitting and Fuel Efficient Vehicles 3 SS Credit 4.3
Alternative Transportation: Low Emitting & Fuel Efficient Vehicles 1
SS Credit 4.4
Alternative Transportation – Parking Capacity 2 SS Credit 4.4
Alternative Transportation: Parking Capacity 1
SS Credit 5.1
Site Development - Protect or Restore Habitat 1 SS Credit 5.1
Site Development: Protect or Restore Habitat 1
133
SS Credit 5.2
Site Development – Maximize Open Space 1 SS Credit 5.2
Site Development: Maximize Open Space 1
SS Credit 6.1
Stormwater Design - Quantity Control 1 SS Credit 6.1
Stormwater Design: Quantity Control 1
SS Credit 6.2
Stormwater Design - Quality Control 1 SS Credit 6.2
Stormwater Design: Quality Control 1
SS Credit 7.1
Heat Island Effect - Non - Roof 1 SS Credit 7.1
Heat Island Effect: Non-Roof 1
SS Credit 7.2 Heat Island Effect - Roof 1 SS Credit 7.2
Heat Island Effect: Roof 1
SS Credit 8 Light Pollution Reduction 1 SS Credit 8 Light Pollution 1
Total Points 26 Total Points 14
LEED India - IGBC LEED - USGBC
Water Efficiency (Max 10 points)
Water Efficiency
(5 Possible Points)
Prerequisite 1 Water Use Reduction Required
WE Credit 1 Water Efficient Landscaping 2 - 4 WE Credit 1.1
Water Efficient Landscaping: Reduce by 50% 1
WE Credit 1.2
Water Efficient Landscaping: No Potable Water Use or No Irrigation 1
WE Credit 2
Innovative Wastewater Treatment and Re-use 2 WE Credit 2
Innovation Wastewater Technologies 1
WE Credit 3 Water Use Reduction 2-4 WE Credit 3.1
Water Use Reduction: 20% Reduction 1
WE Credit 3.2
Water Use Reduction: 30% Reduction 1
Total Points 10 Total Points 5
134
LEED India - IGBC LEED - USGBC
Energy & Atmosphere (Max 35points)
Energy & Atmosphere
(17 Possible Points)
EA Prerequisite 1
Fundamental Commissioning of Building Energy Systems Required
EA Prerequisite 1
Fundamental Commissioning of the Building Energy Systems Required
EA Prerequisite 2
Minimum Energy Performance Required
EA Prerequisite 2
Minimum Energy Performance Required
EA Prerequisite 3
Fundamental Refrigerant Management Required
EA Prerequisite 3
Fundamental Refrigerant Management Required
EA Credit 1
Optimize Energy Performance 1-9 EA Credit 1
Optimize Energy Performance 1 to 10
EA Credit 2
On-site Renewable Energy 1-7 EA Credit 2
On-Site Renewable Energy 1 to 3
EA Credit 3 Enhanced Commissioning 2 EA Credit 3
Enhanced Commissioning 1
EA Credit 4
Enhanced Refrigerant Management 2 EA Credit 4
Enhanced Refrigerant Management 1
EA Credit 5 Measurement and Verification 3 EA Credit 5
Measurement & Verification 1
EA Credit 6 Green Power 2 EA Credit 6 Green Power 1
Total Points 35 Total Points 17
LEED India - IGBC LEED - USGBC
Material & Resources (Max 14 Points)
Materials & Resources
(13 Possible Points)
MR Prerequisite 1
Storage and Collection of Recyclables Required
MR Prerequisite 1
Storage and Collection of Recyclables Required
MR Credit 1.1
Building Reuse- Maintain Existing walls, floors and Roof 1-3 MR Credit 1.1
Building Reuse: Maintain 75% of Existing Walls, Floors & Roof 1
MR Credit 1.2
Building Reuse- Maintain Interior 1 MR Credit 1.2
Building Reuse: Maintain 95% of Existing 1
135
Nonstructural Elements
Walls, Floors & Roof
MR Credit 1.3
Building Reuse: Maintain 50 % of interior Non-Structural Elements 1
MR Credit 2
Construction Waste Management 1-2 MR Credit 2.1
Construction Waste Management: Divert 50% From Disposal 1
MR Credit 2.2
Construction Waste Management: Divert 75% From Disposal 1
MR Credit 3 Materials Reuse 1-2 MR Credit 3.1
Materials Reuse: 5% 1
MR Credit 3.2 Materials Reuse: 10% 1
MR Credit 4 Recycled Content 1-2 MR Credit 4.1
Recycled Content: 10% (post-consumer + 1/2 pre-consumer) 1
MR Credit 4.2
Recycled Content: 20% (post-consumer + 1/2 pre-consumer) 1
MR Credit 5 Regional Materials 1-2 MR Credit 5.1
Regional Materials: 10% Extracted, Processed & Manufactured Regionally 1
MR Credit 5.2
Regional Materials: 20% Extracted, Processed & Manufactured Regionally 1
MR Credit 6 Rapidly 1 MR Credit 6 Rapidly 1
136
Renewable Materials
Renewable Materials
MR Credit 7 Certified Wood 1 MR Credit 7 Certified Wood 1
Total Points 14 Total Points 13
LEED India - IGBC LEED - USGBC
Indoor Environmental Quality (Max 15 points)
Indoor Environmental Quality
(15 Possible Points)
IEQ Prerequisite 1
Minimum IAQ Performance Required
EQ Prerequisite 1
Minimum IAQ Performance Required
IEQ Prerequisite 2
Environmental Tobacco Smoke (ETS) Control Required
EQ Prerequisite 2
Environmental Tobacco Smoke (ETS) Control Required
IEQ Credit 1
Outdoor Air Delivery Monitoring 1 EQ Credit 1
Outdoor Air Delivery Monitoring 1
IEQ Credit 2 Increased Ventilation 1 EQ Credit 2
Increased Ventilation 1
IEQ Credit 3.1
Construction IAQ Management Plan, During Construction 1 EQ Credit 3.1
Construction IAQ Management Plan: During Construction 1
IEQ Credit 3.2
Construction IAQ Management Plan, Before Occupancy 1 EQ Credit 3.2
Construction IAQ Management Plan: Before Occupancy 1
IEQ Credit 4.1
Low-Emitting Materials, Adhesive & Sealants 1 EQ Credit 4.1
Low Emitting Materials: Adhesives & Sealants 1
IEQ Credit 4.2
Low-Emitting Materials, Paints & Coatings 1 EQ Credit 4.2
Low Emitting Materials: Paints and Coatings 1
IEQ Credit 4.3
Low-Emitting Materials – Flooring Systems 1 EQ Credit 4.3
Low Emitting Materials: Carpet Systems 1
IEQ Credit 4.4
Low-Emitting Materials, Composite 1 EQ Credit 4.4
Low Emitting Materials: Composite 1
137
Wood & Agrifiber products
Wood & Agrifiber Products
IEQ Credit 5
Indoor Chemical & Pollutant Source Control 1 EQ Credit 5
Indoor Chemical & Pollutant Source Control 1
IEQ Credit 6.1
Controllability of Systems - Lighting 1 EQ Credit 6.1
Controllability of Systems: Lighting 1
IEQ Credit 6.2
Controllability of Systems, Thermal Comfort 1 EQ Credit 6.2
Controllability of Systems: Thermal Comfort 1
IEQ Credit 7.1
Thermal Comfort, Design 1 EQ Credit 7.1
Thermal Comfort: Design 1
IEQ Credit 7.2
Thermal Comfort, Verification 1 EQ Credit 7.2
Thermal Comfort: Verification 1
IEQ Credit 8.1
Daylight and Views - Daylight 1 EQ Credit 8.1
Daylight & Views: Daylight 75% of Spaces 1
EQ Credit 8.2 Daylight and Views - Views 1 EQ Credit 8.2
Daylight & Views: Views for 90% of Spaces 1
Total Points 15 Total Points 15
LEED India - IGBC LEED - USGBC
Innovation in Design (Max 6 points)
Innovation & Design Process
(5 Possible Points)
ID Credit 1 Innovation in Design 1-5 ID Credit 1.1
Innovation in Design 1
ID Credit 1.2 Innovation in Design 1
ID Credit 1.3 Innovation in Design 1
ID Credit 1.4 Innovation in Design 1
ID Credit 1.5 Innovation in Design 1
ID Credit 2
LEED Accredited Professional 1
138
Total Points 6 Total Points 5
LEED India - IGBC
Regional Priority (Max 4 points)
Regional Priority
(4 Possible Points)
RP Credit 1 Regional Priority 1-4 Credit 1
Regional Priority 1-4
Total Points 4 Total Points 4
All information shown above as Appendix C is taken from LEED India NC IGBC – 2011 and
LEED NC USGBC - 2009
Appendix D
Questions used in Online Survey Instrument
1. What area of the building industry do you or your company specialize in?
a. Architectural Design
b. Engineering Design
c. Construction Services
d. Architectural, Engineering and Construction (AEC)
e. Manufacturing or vendor (Please specify manufacturer and product name)
f. Other (Please Specify)
2. On sustainable or green building projects you or your company has worked on, what was the
country of origin of the project management?
a. India
b. United States of America
139
d. Combination of Indian company and a foreign company (Please specify name of country)
e. Project management was provided by a company from a foreign country (Please specify name
of country)
3. On sustainable or green projects that you or your company has worked on, what was the
country of origin of the skilled labor and equipment operators?
a. India
b. United States of America
d. Combination of Indian company and a foreign company (Please specify name of country)
e. Skilled labor and equipment operators were provided completely by a company from a foreign
country (Please specify name of country)
4. What types of projects do you or your company usually works on?
a. Institutional
b. Residential
c. Transportation
d. Renewable Energy
e. Other (Please Specify)
5. What size projects have you or your company worked on?
a. Less than 1 million US dollars
b. 1 million US dollars to 50 US million dollars
c. 50 million US dollars to 100 US million dollars
140
d. 100 million US dollars to 150 US million dollars
e. 150 US million dollars to 200 US million dollars
f. 200 million US dollars to 250 US million dollars
g Above 250 million US dollars
6. Have you or your company attempted to use Clean Development Mechanisms to achieve
Certified Emissions Reductions credits on your projects.
a. Yes
b. No
c. Not familiar with Clean Development Mechanisms (Please Specify)
7. Did your project apply for certification with the Green Rating for Integrated Habitat
Assessment (GRIHA) or Leadership in Energy and Environmental Design (LEED) India rating
systems?
a. GRIHA
b. LEED India
c. Did not attempt to use rating system to achieve certification
d. Used other rating system to achieve certification (Please Specify)
8. What type of Delivery Method do you or your company prefer to use on sustainable or green
projects in India?
a. Design Bid Build
b. Build Operate Transfer
141
c. Construction Management-Guaranteed Maximum Price
d. Design Build
e. Integrated Delivery Process
f. Other (Please Specify)
9. Do you believe that project management skills and technology provided by American
companies will benefit sustainable or green building design and construction in India?
a. Yes
b. No
c. No opinion
d. Please provide additional comments in the space provided below
10. As a company with experience in the AEC industry in India, please provide any additional
comments you may have for those planning to get involved in the AEC industry in India?
a. (Please Specify)
Appendix E
Construction Procedures in India
Construction Procedure in the Republic of India Time to
Complete
Associated
Costs
1 Submit application and design plans at Building Proposal office of BMC and
pay Scrutiny fee.
1 day INR 36,417
2 Receive Site Inspection from Building Proposal Office. 1 day No Charge
3 Obtain Intimation of approval from the Building Proposal Office and Pay
fees.
60 days INR 1,301
142
4. Submit structural plans approved by a structural engineer to BMC 1day No Charge
5. Apply for NOC from tree Authority. 1 day No Charge
6 Receive inspection from Tree Authority. 1 day No Charge
7. Obtain NOC from Tree Authority. 30 days INR 4,500
8. Request and obtain NOC from Storm Water and Drain Department. 7 days No Charge
9. Request and obtain NOC from Electric Department. 7 days INR 77,306
10. Request and obtain NOC from Electric Department. 7 days No Charge
11. Request and obtain NOC from Environmental Department. 7 days No Charge
12. Request and obtain NOC from Traffic & Coordination Department
13. Request and obtain NOC from CFO. 7 days INR 13,006
14. Obtain Commencement Certificate from Building Proposal Office and pay
Development Charges.
10 days INR 836,100
15. Request and receive inspection of plinth. 1 day No Charge
16. Submit letter-stating completion of building works to obtain an Occupancy
Certificate and Certificate of completion.
1 day No Charge
17. Request and obtain completion NOC from Tree Authority. 3 days No Charge
18. Request and obtain completion NOC from Storm Water and Drain
Department.
3days No Charge
19. Request and obtain completion NOC from Sewerage Department. 3 days No Charge
20. Request and obtain completion NOC from Electric Department. 3 days No Charge
21. Request and obtain completion NOC from Environment Department. 3 days No Charge
22. Request and Obtain completion NOC from Traffic & Coordination
Department.
3 days No Charge
23. Request and obtain completion NOC from CFO. 3 days INR 70,000
24. Request and receive competition inspection from BMC. 1 day No Charge
25. Obtain Occupancy Certificate. 1 day No Charge
143
26. Obtain Completion Certificate. 30 days No Charge
27. Apply for permanent water connection. 1 day No Charge
28. Receive on-site inspection for connection to water by Water Supply
Department.
1 day No Charge
29. Obtain permanent water connection. 45 days INR 1,210
30. Apply for permanent sewerage connection. 1 day No Charge
31. Receive on-site inspection for connection to sewerage by Sewerage
Department
1 day No Charge
32. Obtain permanent sewerage connection 30 days INR 50,000
33. Apply for telephone connection 1 day INR 500
34. Receive on-site inspection and connection to telephone by the utility
provider. days
1. Table reproduced from The World Bank Doing Business web site, Ease of Doing Business in
India-“Dealing with Construction Permits.”
2. One Indian Rupee (INR) is equivalent to 0.01904412 U.S. Dollars, or one U.S. Dollar is
equivalent to 52.50964 INR
Appendix F
Steps Required to Start a Business in India.
1. Obtain Director Identification number on-line. 1 Day INR100
2. Obtain digital signature certificate on-line. 1-6 days INR 400-2650
3. Reserve the company name with the Registrar
Of Companies. (ROC) on-line.
2-3 days INR 500
4. Pay stamp duties on-line, file all corporation
forms and documents on-line, and obtain
certificate of incorporation.
3-7 days INR 20-100
5. Make a seal. 1 day INR 350
144
6. Visit an authorized franchise or agent
appointed by National Securities Depository
Services Limited (NSDL) or Unit Trust of
India (UTI) investors services Ltd to obtain a
Permanent Account Number (PAN
7. Days INR 94 for fee and INT 5 for
application form if not
downloaded.
7. Obtain a tax account bumper for income taxes
deducted at source from the Accessing Office
in Mumbai Income Tax Department.
7 days simultaneously
with procedure 6.
INR 62
8. Register with Office of Inspector. Mumbai
Shops and Establishment Act.
2days simultaneously
with procedure 7.
INR 2000 with registration
fee + 3 times registration fee
for trade refuse charges (INR
6000).
9. Register for VAT on-line. 10 days simultaneously
with procedure 8.
INR 500 (Registration fee) +
INR 25 (Stamp Duty) for
compulsory VAT registration.
10. Registrar for profession tax. 2 days simultaneous
with procedure 9.
No Charge
11. Register with Employees Provident Fund
Organization.
12 days simultaneous
with procedure 10.
No Charge
12. Register for Medical Insurance (ESIC). 9 days simultaneous
with procedure 10.
No Charge
1. Table reproduced from The World Bank-Doing Business web site, Ease of Doing Business in
India-“Starting a Business.”
2. One Indian Rupee (INR) is equivalent to 0.01904412 U.S. Dollars, or one U.S. Dollar is
equivalent to 52.50964 INR.