Older Americans With a Disability: 2008-2012 American Community Survey Reports Wan He and Luke J. Larsen Issued December 2014 ACS-29 U.S. Department of Health and Human Services National Institutes of Health NATIONAL INSTITUTE ON AGING U.S. Department of Commerce Economics and Statistics Administration U.S. CENSUS BUREAU
Transcript
Older Americans With a Disability: 2008−2012American Community Survey Reports
Wan He and Luke J. Larsen
Issued December 2014 ACS-29
U.S. Department of Health and Human ServicesNational Institutes of HealthNATIONAL INSTITUTE ON AGING
U.S. Department of CommerceEconomics and Statistics AdministrationU.S. CENSUS BUREAU
This report was prepared by Wan He and Luke J. Larsen, under the general direction of James D. Fitzsimmons, Acting Assistant Division Chief, International Programs Center for Demographic and Economic Studies, Population Division. Victoria A. Velkoff, former Chief, Population Division provided overall direction. Additional direction was provided by Loraine A. West, Acting Chief, Aging Studies Branch.
Research for and production of this report were supported under an interagency agreement with the Division of Behavioral and Social Research, National Institute on Aging (NIA), Richard M. Suzman, Director.
The authors are grateful to many people, both within and outside the Census Bureau, who have generously provided valuable com-ments and constructive suggestions. The authors give special thanks to Matthew W. Brault, Social, Economic, and Housing Statistics Division; Elizabeth M. Grieco, Population Division; Marjorie Hanson, Office of Demographic Programs; and anonymous review-ers from NIA. The authors are especially grateful to Frank Hobbs and Bashiruddin Ahmed, Population Division, for their thorough review and insightful comments.
The authors give special thanks to Mary Beth Kennedy, Andrea Miles, and Iris Poe, Population Division, for verification, table and graph production, and general report preparation. We also thank Xiang Li and Hsin Hsing Lee, American Community Survey Office, for data verification; Michael D. Starsinic, Decennial Statistical Studies Division, for statistical testing review; and Steven G. Wilson, Population Division, for cartographic work.
Janet Sweeney, Musbaw Alawiye, and Faye Brock of the Center for New Media and Promotion, U.S. Census Bureau, provided publica-tion management, graphics design and composition, and editorial review for print and electronic media.
Joel Pugatsky of the Census Bureau’s Administrative and Customer Services Division provided printing management.
Acknowledgments
U.S. Department of Commerce Penny Pritzker,
Secretary
Bruce H. Andrews, Deputy Secretary
Economics and Statistics Administration Mark Doms,
Under Secretary for Economic Affairs
U.S. CENSUS BUREAU
John H. Thompson, Director
ACS-29
Older Americans With a Disability: 2008−2012 Issued December 2014
Issued December 2014 ACS-29
American Community Survey ReportsOlder Americans With a Disability: 2008−2012
Wan He and Luke J. Larsen
U.S. Department of Health and Human ServicesNational Institutes of HealthNATIONAL INSTITUTE ON AGING
U.S. Department of CommerceEconomics and Statistics AdministrationU.S. CENSUS BUREAU
Suggested Citation He, Wan and Luke J. Larsen,
U.S. Census Bureau, American Community Survey Reports,
ACS-29, Older Americans With a Disability: 2008–2012,
U.S. Government Printing Office, Washington, DC, 2014.
Economics and Statistics Administration Mark Doms, Under Secretary for Economic Affairs
U.S. CENSUS BUREAU John H. Thompson, Director
Nancy A. Potok, Deputy Director and Chief Operating Officer
Enrique J. Lamas, Associate Director for Demographic Programs
Karen Humes, Chief, Population Division
ECONOMICS
AND STATISTICS
ADMINISTRATION
U.S. Census Bureau Older Americans With a Disability: 2008–2012 iii
Figure 1. Population Aged 65 and Over by Number of Disabilities and Age: 2008−2012 . . . . . . . . . . . . . . . . . . . . . . . . . . . . . . 2
Figure 2. Share of Top Nine States Among Total Population Aged 65 and Over With a Disability: 2008−2012 . . . . . . . . . . . . . . . . . 5
Figure 3. Percentage With a Disability Among County Population Aged 65 and Over: 2008−2012 . . . . . . . . . . . . . . . . . . . . . . . 6
Figure 4. Living Arrangements of Population Aged 65 and Over With a Disability by Selected Characteristics: 2008−2012 . . . . . . . . 9
Figure 5. Percentage With a Disability and Living Alone Among County Population Aged 65 and Over: 2008−2012 . . . . . . . 10
Figure 6. Percentage in Poverty Among Household Population Aged 65 and Over With a Disability, by Selected Characteristics: 2008−2012 . . . . . . . . . . . . . . . . . . . . . . . . . . . . . . . . . . . . . 11
Figure 7. Percentage With a Disability and Living Below 150 Percent of Poverty Threshold Among County Household Population Aged 65 and Over: 2008−2012 . . . . . . . . . . . . . . . . . . . . . . 12
iv Older Americans With a Disability: 2008–2012 U.S. Census Bureau
TABLES
Table 1. Population Aged 65 and Over With a Disability by Type of Disability, Age, and Sex: 2008–2012 . . . . . 3
Table 2. State Population Aged 65 and Over With a Disability by Selected Characteristics: 2008–2012 . . . . . . . 4
Table 3. Percentage of Population Aged 65 and Over With a Disability by Educational Attainment, Marital Status, and Selected Characteristics: 2008–2012 . . . . . . . . . . . . . . . . . . . . . . . . . . . . . . . . . . . . . . . . 8
APPENDIX TABLES
Appendix Table 1. Margin of Error for Population Aged 65 and Over With a Disability by Type of Disability, Age, and Sex: 2008–2012 . . . . . . . . . . . . . . . . . . . . . . . . . . . . . . . . . . . . . . . . . . . . . . . . 17
Appendix Table 2. Margin of Error for State Population Aged 65 and Over With a Disability by Selected Characteristics: 2008–2012 . . . . . . . . . . . . . . . . . . . . . . . . . . . . . . . . . . . . . . . . . . . . . . . 18
Appendix Table 3. Margin of Error for Percentage of Population Aged 65 and Over With a Disability by Educational Attainment, Marital Status, and Selected Characteristics: 2008–2012 . . . . . . 20
U.S. Census Bureau Older Americans With a Disability: 2008–2012 1
HOW THE ACS MEASURES DISABILITY
The ACS questions cover six
disability types:
Hearing difficulty—deaf or
having serious difficulty hearing.
Vision difficulty—blind or having
serious difficulty seeing, even when
wearing glasses.
Cognitive difficulty—because of
a physical, mental, or emotional
problem, having difficulty remem-
bering, concentrating, or making
decisions.
Ambulatory difficulty—having
serious difficulty walking or
climbing stairs.
Self-care difficulty—having
difficulty bathing or dressing.
Independent living difficulty—
because of a physical, mental, or
emotional problem, having difficulty
doing errands alone, such as visit-
ing a doctor’s office or shopping.
Respondents who report any one of
the six disability types are consid-
ered to have a disability.
The ACS identifies serious difficulty
with four basic areas of function-
ing—hearing, vision, cognition,
and ambulation. The ACS supple-
ments the functional limitations
with questions about selected
activities from the Katz Activities
of Daily Living (ADL)—difficulty
dressing and bathing; and from the
Lawton Instrumental Activities of
Daily Living (IADL) scales—difficulty
performing errands, such as visit-
ing a doctor’s office or shopping.
However, the ACS does not gather
information on the severity or tim-
ing of onset of the disability, or on
the use of technology or assistance.
INTRODUCTION
Disability, as defined by the Americans With Disabilities Act, is an individual’s physical or mental impairment that substantially limits one or more major life activities of that individual.1 Studies consistently find that disability rates rise with age (Altman and Bernstein, 2008; Brault, 2012). Beyond age 65, the oldest old (aged 85 and over) are at highest risk for disease and dis-ability (National Institutes of Health, 2010), and among them, disability prevalence increases rapidly with age (He and Muenchrath, 2011).
Changes in population age struc-ture are contributing to a growing number of older people with a dis-ability. In the past several decades, the U.S. older population itself has been aging—the proportion of the oldest-old segment (aged 85 and over) of the older population has increased from 8.8 percent in 1980 to 13.6 percent in 2010 (West et al., 2014). Given higher prevalence rates among the oldest old, this changing composition of the older population has increased the num-ber with a disability.
Baby Boomers started to enter the older age ranks in 2011, and they will swell the size of the older population in the next 2 decades.2 The number of older people with a disability could also expand rapidly. Thus, it is important to identify those among the older popula-tion most at risk for disability in order to help older people with a disability and their families plan
1 This definition is from the 2008 Amendment Act to the Americans With Disabilities Act of 1990 (ADA). For more information, see <www.ada.gov/pubs /adastatute08.htm#12102note>.
2 The Baby Boom includes people born from mid-1946 to 1964. The Baby Boom is distinguished by a dramatic increase in birth rates following World War II and comprises one of the largest generations in U.S. history.
strategies to deal with daily activity difficulties.
In recent decades, the concept of disability has shifted from an individual, medical perspective to a social model in which dis-ability is viewed as the result of social and physical barriers (World Health Organization and the World Bank, 2011). The International Classification of Functioning, Disability, and Health recognizes the value of both models and views disability as arising from the interaction of health conditions and environmental and personal factors (Leonardi et al., 2006). The U.S. Census Bureau modified the American Community Survey (ACS) questions on disability starting in 2008 to better reflect this new paradigm.
This report presents an overview of the older population with a dis-ability during 2008–2012. Data for this report come from the ACS 5-year estimates with interviews conducted in 2008 to 2012 pooled together. The 5-year estimates are ideal for conducting meaningful and statistically reliable analyses of special population groups, such as the older population with a disabil-ity, not only for the entire nation, but also for states and counties. The report examines the demo-graphic and socioeconomic charac-teristics, as well as the geographic distribution of the older population with a disability, with a focus on those in poverty or living alone.
STATUS, NUMBER, AND TYPE OF DISABILITY
Disability status
In 2008–2012, there were 40.7 million people aged 65 and over in the United States, representing 13.2 percent of the total popula-tion. Among this older population, about 15.7 million, or 38.7 percent,
2 Older Americans With a Disability: 2008–2012 U.S. Census Bureau
Figure 1. Population Aged 65 and Over by Number of Disabilities and Age: 2008−2012(Percentage distribution. For information on confidentiality protection, sampling error, nonsampling error, and definitions, see www.census.gov/acs/www)
Source: U.S. Census Bureau, American Community Survey, 5-year estimates, 2008−2012.
OneNone Three or moreTwo
85 and over
75 to 84
65 to 74
65 and over
55.0
15.9 8.0 14.7
13.9 5.5 7.0
17.1
73.6
27.5 13.9 41.5
18.7 9.8 16.5
61.3
reported having one or more dis-abilities. The older population with a disability was disproportionately concentrated among the oldest old—those aged 85 and older rep-resented 13.6 percent of the total older population, but accounted for 25.4 percent of the older popula-tion with a disability, with 65- to 74-year-olds and 75- to 84-year-olds about evenly split for the remainder (37.0 percent and 37.6 percent, respectively). Furthermore, women composed 59.0 percent of the older population experienc-ing disabilities (higher than their 56.8 percent share of the total older population). This translates into a sex ratio of 69 men per 100 women for the older population with a disability.
Number of disabilities
Among the older population, 61.3 percent reported having no disabilities among the six types defined on the ACS questionnaire, 15.9 percent reported having only one type of disability, 8.0 percent reported two types of disabilities, and 14.7 percent reported three or more types of disabilities (Figure 1). The patterns of the number of disabilities differed by age. When this percentage distribution was examined by three broad age groups, the share without a dis-ability declined as age rose, while the shares with one, two, and three or more disabilities generally rose with age. The contrast is particu-larly salient when it comes to three or more types of disabilities. For the youngest age group (65 to 74),
only 7.0 percent reported three or more types of disabilities, the pro-portion more than doubled to 16.5 percent for those aged 75 to 84, and reached 41.5 percent for those aged 85 and older.
Type of disability
Of the six ACS disability items, ambulatory difficulty was the most frequently reported by the older population in 2008–2012.3 About 10 million people, or two-thirds (66.5 percent) of the total older population with a disability, reported having serious difficulty walking or climbing stairs (Table 1). Difficulty with independent living, such as visiting a doctor’s office or shopping, was a distant second
3 This analysis does not include combinations of types of disabilities.
U.S. Census Bureau Older Americans With a Disability: 2008–2012 3
Table 1.Population Aged 65 and O2008–2012(Numbers in thousands. For information on confiwww.census.gov/acs/www)
ver With a Disability by Type o
dentiality protection, sampling
f Disability, Age, and Sex:
error, nonsampling error, and defi nitions, see
Type of disability1Total
Age Sex
65 to 74 75 to 84 85 and over Male Female
Number Percent Number Percent Number Percent Number Percent Number Percent Number Percent
1 Percentages for type of disability are the proportion of each type of disability among the total population aged 65 and over with a disability . A person may have one or more types of disability and, as such, the percentages add to more than 100 .
Source: U .S . Census Bureau, American Community Survey, 5-year estimates, 2008–2012 .
(47.8 percent), followed by serious difficulty hearing (40.4 percent). The order for these top three types of disability was consistent across age groups, except for those aged 65 to 74, where the prevalence of hearing difficulty (34.9 percent) was higher than that of indepen-dent living (34.0 percent).
The prevalence rate for all dis-ability types increased with age as expected, but interesting contrasts existed between men and women. Older women were more likely than older men to have five of the six types of disability included in the ACS, especially that of ambulatory difficulty (73.1 percent for women versus 57.1 percent for men). Older women’s higher prevalence rates for disability may partly be a function of their age composition compared with that of older men.
Older men, however, stood out with a higher proportion reporting serious difficulty hearing (52.0 per-cent, compared with 32.3 percent for women). Men’s higher likelihood for having a hearing disability may reflect the life-long occupational differentials between men and women, that men may be more likely to have worked in industries such as mining, manufacturing,
or construction—industries docu-mented to cause noise-induced hearing loss (Agrawal, Platz, and Niparko, 2008; Zhan et al., 2010). Some of these studies also pointed to smoking as having a possible correlation with hearing impairment at older ages (also see Cruickshanks et al., 1998).
GEOGRAPHIC DISTRIBUTION
Health statistics show wide dis-parities in the health of the older population across states. According to the Centers for Disease Control and Prevention (CDC), where one lives in the United States affects how long and how healthfully one lives (CDC, 2013). Residents in the South, regardless of race or sex, had lower healthy life expectancy (HLE) at age 65 than residents in other regions.4
4 Healthy life expectancy (HLE) is a population health measure which estimates expected years of life in good health or free from disability. The CDC calculated state-specific HLE at age 65 using mortality data from the National Vital Statistics System, population estimates from the Census Bureau, and self-reported health status from the Behavioral Risk Factor Surveillance System. For more information, see <www.cdc.gov /mmwr/pdf/wk/mm6228.pdf>.
The South region was home to 6.1 million older people with a dis-ability (Table 2), equivalent to 38.7 percent of the total older population with a disability living in the United States.5 The other three regions each contained approximately one-fifth of the total—the Midwest, 3.5 million; the West, 3.3 million; and the Northeast, 2.9 million. The regional distribution of the older population with a disability is simi-lar to that for the total older popula-tion reported in the 2010 Census, where 37 percent resided in the South, and the remaining 63 percent were split fairly equally among the Northeast, the Midwest, and the West regions (West et al., 2014).
5 The four regions of the United States as defined by the Census Bureau—Northeast: Connecticut, Maine, Massachusetts, New Hampshire, New Jersey, New York, Pennsylvania, Rhode Island, and Vermont; Midwest: Illinois, Indiana, Iowa, Kansas, Michigan, Minnesota, Missouri, Nebraska, North Dakota, Ohio, South Dakota, and Wisconsin; South: Alabama, Arkansas, Delaware, District of Columbia, Florida, Georgia, Kentucky, Louisiana, Maryland, Mississippi, North Carolina, Oklahoma, South Carolina, Tennessee, Texas, Virginia, and West Virginia; and West: Alaska, Arizona, California, Colorado, Hawaii, Idaho, Montana, Nevada, New Mexico, Oregon, Utah, Washington, and Wyoming. In this report, the District of Columbia is treated as a state equivalent.
4 Older Americans With a Disability: 2008–2012 U.S. Census Bureau
Table 2. State Population Aged 65 and Over With a Disability by Selected Characteristics: 2008–2012—Con.(Numbers in thousands. For information on confidentiality protection, sampling error, nonsampling error, and definitions, see www.census.gov/acs/www)
Region and state
With a disability
Percentage of population with a disability
Number of disabilities Living arrangement1
Household
Group quarters
Total 65 and over Number
Percentage of total
One disability
Two or more disabilities
Living alone
Living with others
United States . . . . 40,671 15,729 38 .7 41 .1 58 .9 29 .9 60 .9 9 .2
U.S. Census Bureau Older Americans With a Disability: 2008–2012 5
Table 2. State Population Aged 65 and Over With a Disability by Selected Characteristics: 2008–2012—Con.(Numbers in thousands. For information on confidentiality protection, sampling error, nonsampling error, and definitions, see www.census.gov/acs/www)
1 The percentages may not add to 100 .0 due to rounding .Source: U .S . Census Bureau, American Community Survey, 5-year estimates, 2008–2012 .
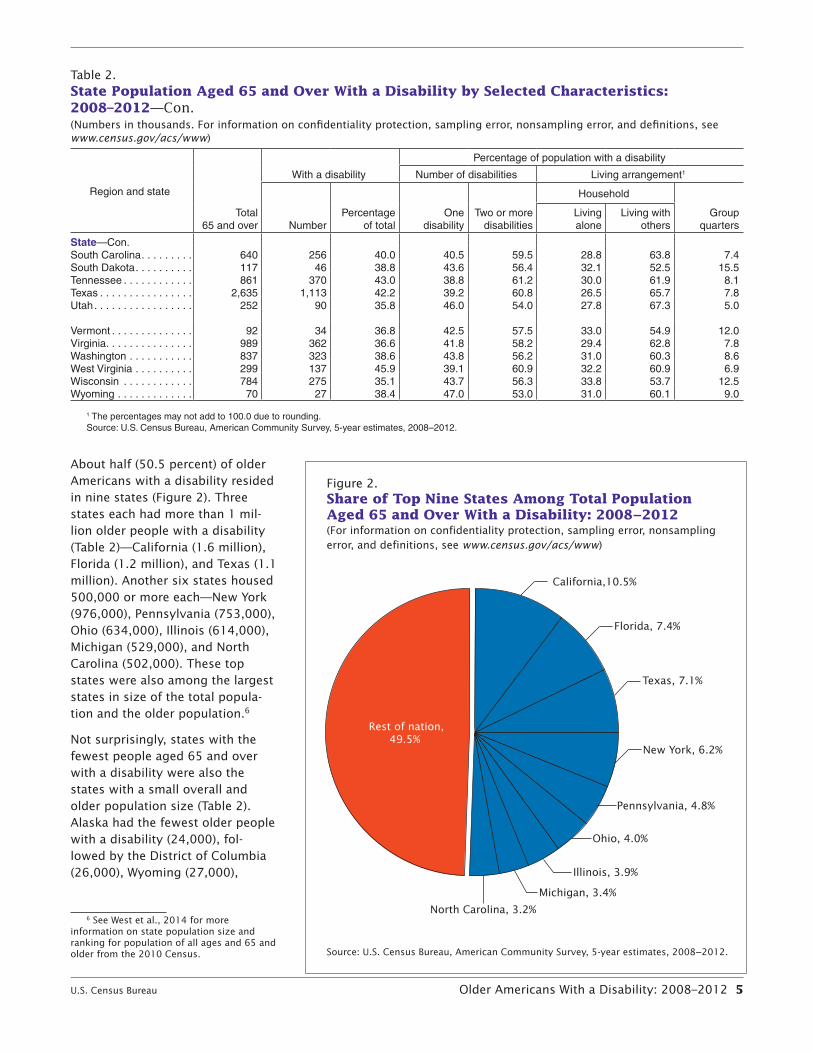
About half (50.5 percent) of older Americans with a disability resided in nine states (Figure 2). Three states each had more than 1 mil-lion older people with a disability (Table 2)—California (1.6 million), Florida (1.2 million), and Texas (1.1 million). Another six states housed 500,000 or more each—New York (976,000), Pennsylvania (753,000), Ohio (634,000), Illinois (614,000), Michigan (529,000), and North Carolina (502,000). These top states were also among the largest states in size of the total popula-tion and the older population.6
Not surprisingly, states with the fewest people aged 65 and over with a disability were also the states with a small overall and older population size (Table 2). Alaska had the fewest older people with a disability (24,000), fol-lowed by the District of Columbia (26,000), Wyoming (27,000),
6 See West et al., 2014 for more information on state population size and ranking for population of all ages and 65 and older from the 2010 Census.
Figure 2. Share of Top Nine States Among Total Population Aged 65 and Over With a Disability: 2008−2012(For information on confidentiality protection, sampling error, nonsampling error, and definitions, see www.census.gov/acs/www)
Source: U.S. Census Bureau, American Community Survey, 5-year estimates, 2008−2012.
Rest of nation,49.5%
California,10.5%
Florida, 7.4%
Texas, 7.1%
New York, 6.2%
Pennsylvania, 4.8%
Ohio, 4.0%
Illinois, 3.9%
Michigan, 3.4%
North Carolina, 3.2%
6 Older Americans With a Disability: 2008–2012 U.S. Census Bureau
010
0M
iles
020
0M
iles
010
0M
iles
Note
: C
ounti
es w
ith c
oef
fici
ent
of
vari
atio
n les
sth
an 3
0 p
erce
nt
and 5
0 o
r m
ore
unw
eighte
d r
esponden
tsag
ed 6
5 a
nd o
ver
mee
t st
atis
tica
l st
andar
ds
for
relia
bili
ty.
AK
HI
Figure
3.
Perc
en
tage W
ith
a D
isab
ilit
y A
mon
g C
ou
nty
Pop
ula
tion
Aged
65
an
d O
ver:
20
08
−2
01
2
(For
info
rmat
ion o
n c
onfi
den
tial
ity
pro
tect
ion,
sam
plin
g e
rro
r, n
onsa
mplin
g e
rro
r, a
nd d
efin
itio
ns,
se
e w
ww
.cen
sus.
gov
/acs
/ww
w)
46
.00
or
more
37
.00
to 4
5.9
9
Less
than
37
.00
Perc
enta
ge
do
es n
ot
mee
tst
atis
tica
l st
andar
ds
for
relia
bili
ty
Perc
ent
U.S
. per
cent:
38
.67
Sourc
e: U
.S. C
ensu
s Bu
reau
, A
mer
ican
Com
munity
Surv
ey,
5-y
ear
estim
ates
, 2
00
8−
20
12
.
U.S. Census Bureau Older Americans With a Disability: 2008–2012 7
Vermont (34,000), North Dakota (38,000), South Dakota (46,000), and Delaware (47,000).7
However, a different pattern emerges when proportion, not population size, is examined. California’s 1.6 million older people with a disability represented 38.4 percent of the state’s popula-tion aged 65 and older, close to the national average (38.7 per-cent). In comparison, at 184,000, Mississippi’s older population with a disability was equivalent to 48.0 percent of the state’s total older population, the highest disability prevalence rate in the nation (Table 2). Arizona (34.6 percent) had one of the lowest disability rates.
Figure 3 displays the percentage with a disability among the popu-lation aged 65 and over for each county. Most of the nine top states in the size of older population with a disability, including Michigan, New York, and Pennsylvania, con-tained few counties with a high proportion of people with a dis-ability. On the other hand, clusters of counties with high concentra-tions can be seen in central and north central Appalachia, the Mississippi Delta, some counties in the coastal plain from southern Virginia to the Florida Panhandle, eastern Oklahoma, along the Texas-Mexico border, and in a number of American Indian reservations in Arizona and New Mexico. These patterns are consistent with CDC’s estimates of state-level HLE at age 65. HLE was estimated to be the lowest in Mississippi (10.8 years), followed by West Virginia (11.0 years), Kentucky (11.0 years), Alabama (11.1 years), and Tennessee (11.9 years; CDC, 2013).
7 The estimates for South Dakota and Delaware are not statistically different from each other.
DEMOGRAPHIC AND SOCIOECONOMIC CHARACTERISTICS
Educational attainment
Higher educational attainment has been linked to better health, as people with higher education are shown to be more likely to have a better understanding or willing-ness to use assistive technology or have home modification to mitigate functional difficulties in their daily lives (Melzer et al., 2001; Agree, Freedman, and Sengupta, 2004). Examination of the percentage of the population aged 65 and over with a disability by educational attainment (Table 3) supports the positive role education plays in the health conditions of older people and their ability to deal with environmental factors affecting disability.
Table 3 shows disability prevalence for each of three broad catego-ries of educational attainment by selected characteristics. More than half (54.4 percent) of the older population who had not graduated from high school had a disabil-ity, twice the rate of those with a bachelor’s degree or higher (26.0 percent). This inverse relationship between educational attainment and likelihood of having a disability can be found across age, sex, race, and Hispanic origin.
While the general pattern holds true for all characteristics exam-ined, there are variations within the subgroups. Regardless of educa-tional attainment level, disability prevalence rates rose with age. For example, among those with a college degree, just 16 percent of the youngest group (aged 65 to 74) reported having a disability; in contrast, the disability rate of
the oldest old was four times this level. Similarly, for those with less than a high school education, 41.5 percent of those aged 65 to 74 had a disability, while the share increased to nearly 8 out of 10 for the oldest old.
Disability rates were higher for women than men at all education levels. Among the race groups, older Asians had the lowest disabil-ity prevalence across all three edu-cational categories. Older Blacks who had not completed high school had the highest disability rate at 57.9 percent.8
Marital status
Marital status can have an impact on people’s wellbeing; this is especially true at older ages when the likelihood of widowhood rises (Moon et al., 2011; DiGiacomo et al., 2013). In 2008–2012, disability rates were lower for the married older population as compared to those who were widowed or in other categories of marital status (Table 3).9 For example, among the population aged 65 to 74, about one in five who were married had a disability, while about one in three who were widowed or in other marital categories had a disability.
Disability prevalence rates rise with age for all categories of marital sta-tus. For example, for both married and widowed, the percentage with a disability increased continuously across the older age groups, with the rate for the age group 85 and
8 Race groups in this report refer to single race groups, or race alone, not in combination. For more information on the concepts of race and Hispanic origin, see Humes, Jones, and Ramirez, 2011.
9 “Married” refers to respondents who were married (excluding separated) at the time the survey was administered.
8 Older Americans With a Disability: 2008–2012 U.S. Census Bureau
Table 3. Percentage of Population Aged 65 and Over With a Disability by Educational Attainment, Marital Status, and Selected Characteristics: 2008–2012(For information on confi dentiality protection, sampling error, nonsampling error, and defi nitions, see www.census.gov/acs/www)
Educational attainment Marital statusAge, sex, race, High school Bachelor’s
and Hispanic origin Less than graduate/ degree Total high school some college or above Married Widowed Other1
1 “Other” in marital status includes the categories of divorced, separated, and never married .2 “Other” in race includes the categories of American Indian or Alaska Native, Native Hawaiian or Other Pacifi c Islander, Some Other Race, and Two or More Races .Note: Percentages derived by the number of people aged 65 and over with a disability divided by the total population aged 65 and over in each category .Source: U .S . Census Bureau, American Community Survey, 5-year estimates, 2008–2012 .
over more than twice the rate for ages 65 to 74.
Thus, the combination of being widowed and being among the 85 and older age group dramatically increases the likelihood of having a disability (76.0 percent), as com-pared with those who are married and aged 65 to 74 (22.3 percent). The 2008–2012 ACS recorded 2.6 million oldest-old widows or wid-owers with a disability.
Disability prevalence differences between older men and older women by marital status showed interesting contrasts. While mar-ried older men were more likely than married older women to have a disability (33.0 percent and 26.7 percent, respectively), older wid-owers had a lower likelihood than older widows (52.3 percent and 53.6 percent, respectively).
Differences in percentages with a disability can also be found among the race and Hispanic origin groups. Older Asians had the low-est disability rates among both the married and widowed.
Living arrangement
The living arrangements of the older population are closely related to their age and marital status. Widowhood increases the likelihood of living alone or living in a nursing home (Russell, 2009; Noël-Miller, 2010). While living alone might be preferable to some older people, living alone may present difficulties for people unable to perform every-day activities independently.
During 2008–2012, 29.9 percent of the older population with a disabil-ity lived alone, 9.2 percent lived in group quarters, such as a nursing
home, and the rest lived with oth-ers in households (Table 2 and Figure 4).10 As age increases, the proportion of the population living alone or living in group quarters also increases. Among the older population with a disability, 24.4 percent of the youngest age group (65 to 74) lived alone in a house-hold, and this proportion increased to 30.0 percent for those aged 75 to 84, and 37.7 percent for the oldest old. Older women with a dis-ability were nearly twice as likely to live alone as older men with a disability (36.6 percent compared with 20.2 percent).
Living arrangements varied by race and Hispanic origin—almost
10 Nursing homes, a part of the category referred to as “institutional group quarters” by the Census Bureau, provide skilled care including 24-hour access to aides and skilled nurses.
U.S. Census Bureau Older Americans With a Disability: 2008–2012 9
one-third of older Whites and Blacks with a disability lived alone, whereas just one in seven older Asians lived alone (Figure 4). Older Hispanics with a dis-ability also had a low proportion living alone, about one in five, compared with almost one in three living alone among non-Hispanics. Research has shown that Asians and Hispanics are more likely than Whites, Blacks, or non-Hispanics to live with families and less likely to live alone. In part, this is because a larger share of Asians and Hispanics are immigrants and immigrants are more likely to live with extended families out of eco-nomic need or for cultural reasons
(Kritz, Gurak, and Chen, 2000; Zhou, 2006; Van Hook and Glick, 2007).
Among the older population with a disability, Rhode Island and Minnesota had among the highest proportions living alone in a house-hold among the 50 states, with a similar proportion of about 34 percent (Table 2). Older people with a disability living in the District of Columbia had a higher proportion living alone in a household than any state (40.3 percent). On the other end of the spectrum, Hawaii had the lowest proportion living alone among all states (18.6 percent), fol-lowed by Nevada (24.9 percent).
Figure 5 shows the percentage of people with a disability and living alone among the county population aged 65 and over. Counties with a low percentage were observed in parts of Arizona, California, Hawaii, Nevada, and Utah in the West, as well as Florida, Maryland, and Virginia in the South.
Poverty status
People living in poverty are disad-vantaged and challenged socio-economically and may have fewer options than those with financial resources to obtain human or technology assistance for the needs of everyday functioning. In
Figure 4. Living Arrangements of Population Aged 65 and Over With a Disability by Selected Characteristics: 2008−2012(Percentage distribution. For information on confidentiality protection, sampling error, nonsampling error, and definitions, see www.census.gov/acs/www)
Source: U.S. Census Bureau, American Community Survey, 5-year estimates, 2008−2012.
Not Hispanic
Hispanic
Asian alone
Black alone
White alone
Female
Male
85 and over
75 to 84
65 to 74
Total
10.8
6.8
9.3
10.3
5.2
29.9 60.9 9.2
62.0
45.037.7
30.0
24.4
8.0
17.4
17.1
70.8 4.8
27.5
9.5
5.4
73.0
52.6
60.2
54.4
80.0
20.2
36.6
30.5
31.4
14.8
21.1
30.6
73.5
59.9
61.3
Group quartersHousehold living alone Household living with others
10 Older Americans With a Disability: 2008–2012 U.S. Census Bureau
010
0M
iles
020
0M
iles
010
0M
iles
Note
: C
ounti
es w
ith c
oef
fici
ent
of
vari
atio
n les
sth
an 3
0 p
erce
nt
and 5
0 o
r m
ore
unw
eighte
d r
esponden
tsag
ed 6
5 a
nd o
ver
mee
t st
atis
tica
l st
andar
ds
for
relia
bili
ty.
AK
HI
Figure
5.
Perc
en
tage W
ith
a D
isab
ilit
y a
nd
Liv
ing A
lon
e A
mon
g C
ou
nty
Pop
ula
tion
Aged
65
an
d O
ver:
20
08
−2
01
2(F
or
info
rmat
ion o
n c
onfi
den
tial
ity
pro
tect
ion,
sam
plin
g e
rro
r, n
onsa
mplin
g e
rro
r, a
nd d
efin
itio
ns,
se
e w
ww
.cen
sus.
gov
/acs
/ww
w)
15
.00
or
more
10
.00
to 1
4.9
9
Less
than
10
.00
Perc
enta
ge
do
es n
ot
mee
tst
atis
tica
l st
andar
ds
for
relia
bili
ty
Perc
ent
U.S
. per
cent:
11
.56
Sourc
e: U
.S. C
ensu
s Bu
reau
, A
mer
ican
Com
munity
Surv
ey,
5-y
ear
estim
ates
, 2
00
8−
20
12
.
U.S. Census Bureau Older Americans With a Disability: 2008–2012 11
2008–2012, 12.6 percent of the older household population with a disability were living in poverty (Figure 6); in comparison, 7.2 per-cent of the older household popu-lation without a disability were in poverty.11
11 The poverty status of people living in group quarters such as nursing homes is not available. For information on how the Census Bureau measures poverty, poverty thresholds, people whose poverty status cannot be determined, and how poverty is calculated in the ACS, see <www.census.gov/hhes/www /poverty/methods/definitions.html>.
Among older adults with a disabil-ity, poverty rates were relatively stable across age groups. The older age groups with a disability had lower proportions in poverty than the youngest age group (12.2 percent for ages 75 to 84, 12.0 percent for ages 85 and older, com-pared with 13.4 percent for ages 65 to 74). Older women with a dis-ability were more likely than their male counterparts to be in poverty (15.2 percent for women and 9.2 percent for men).
Figure 6. Percentage in Poverty Among Household Population Aged 65 and Over With a Disability, by Selected Characteristics: 2008−2012(For information on confidentiality protection, sampling error, nonsampling error, and definitions, see www.census.gov/acs/www)
Source: U.S. Census Bureau, American Community Survey, 5-year estimates, 2008−2012.
Not Hispanic
Hispanic
Asian alone
Black alone
White alone
Female
Male
85 and over
75 to 84
65 to 74
Total
12.0
9.2
15.2
23.7
16.8
22.9
11.8
12.6
13.4
12.2
10.8
While older Asians and Hispanics are much less likely than Whites to live alone, poverty status by race and Hispanic origin shows that older Asians and Hispanics are more economically disadvantaged than Whites. Among the older popula-tion with a disability, Blacks had the highest poverty rate (23.7 percent), followed by Asians (16.8 percent), and then Whites (10.8 percent). At 22.9 percent, older Hispanics with a disability were almost twice as likely as their non-Hispanic counter-parts to live in poverty.
12 Older Americans With a Disability: 2008–2012 U.S. Census Bureau
010
0M
iles
020
0M
iles
010
0M
iles
Note
: C
ounti
es w
ith c
oef
fici
ent
of
vari
atio
n les
sth
an 3
0 p
erce
nt
and 5
0 o
r m
ore
unw
eighte
d r
esponden
tsag
ed 6
5 a
nd o
ver
mee
t st
atis
tica
l st
andar
ds
for
relia
bili
ty.
AK
HI
Figure
7.
Perc
en
tage W
ith
a D
isab
ilit
y a
nd
Liv
ing B
elo
w 1
50
Perc
en
t of
Povert
y T
hre
sh
old
Am
on
g C
ou
nty
Hou
seh
old
Pop
ula
tion
Aged
65
an
d O
ver:
20
08
−2
01
2(F
or
info
rmat
ion o
n c
onfi
den
tial
ity
pro
tect
ion,
sam
plin
g e
rro
r, n
onsa
mplin
g e
rro
r, a
nd d
efin
itio
ns,
se
e w
ww
.cen
sus.
gov
/acs
/ww
w)
15
.00
or
more
10
.00
to 1
4.9
9
Less
than
10
.00
Perc
enta
ge
do
es n
ot
mee
tst
atis
tica
l st
andar
ds
for
relia
bili
ty
Perc
ent
U.S
. per
cent:
10
.47
Sourc
e: U
.S. C
ensu
s Bu
reau
, A
mer
ican
Com
munity
Surv
ey,
5-y
ear
estim
ates
, 2
00
8−
20
12
.
U.S. Census Bureau Older Americans With a Disability: 2008–2012 13
Figure 7 provides the distribution by county for the percentage of the older population with a dis-ability living below 150 percent of poverty among the household population aged 65 and over. It can be observed that some coun-ties with high proportions of older people with a disability and living in or near poverty were concen-trated in the coastal plain areas from southern Virginia to the Florida Panhandle, in central and north central Appalachia, along the Texas-Mexico border, in a number of American Indian reservations in Arizona and New Mexico, and in states along the Middle and Lower Mississippi River. Some of these concentrations may reflect local economic conditions. For example, the Appalachian Regional Commission (ARC) has consis-tently classified some counties in Kentucky, Mississippi, Ohio, Tennessee, and West Virginia as economically distressed from 2002 to 2013 (ARC, 2014).12
CONCLUSION
This report provides data on older Americans with disabilities. In 2008–2012, most older people with a disability had more than one type of disability, and they were likely to
12 For more information on economically distressed counties in the Appalachian Region, see <www.arc.gov/research /RegionalDataandResearch.asp>.
be women, aged 85 and over, with less than high school education, widowed, living alone, or living in or near poverty. There were also differences by race and Hispanic origin; older Blacks and Hispanics with a disability had higher rates of poverty, and older Blacks and Whites with a disability had higher rates of living alone. Populous states such as California, Florida, New York, and Texas had the larg-est number of older people with a disability. Southern counties, espe-cially in central Appalachia or the Mississippi Delta, tended to have higher prevalence rates of disability.
With the improvements in life expectancy, the focus of popula-tion aging in the United States has now moved to quality of life for the older population in their late life. Increases in both total life expectancy and disability-free life expectancy have been linked to delays in the onset of disability and increases in the rates of recovery from disability (Crimmins et al., 2009). Disability can be reduced with improved medical treatment, positive behavioral changes, wider use of assistive technologies, rising education levels, and improve-ments in socioeconomic status (National Institutes of Health, 2010).
With the first Baby Boomers having entered the 65-and-older ranks in
2011, the United States may experi-ence a rapid expansion in the num-ber of older people with a disability in the next 2 decades. The future of disability among older Americans will be affected by how this country prepares for and manages a com-plex array of demographic, fiscal, medical, technological, and other developments that will unfold in the next several decades (National Research Council, 2007).
The ACS allows comprehensive analyses of the demographic and socioeconomic characteristics of the total U.S. older population with a disability, including both the noninstitutionalized population and those living in nursing homes. The ACS also facilitates analysis on geographic details that few other surveys permit; it enables exami-nations of the characteristics of this special population at state and county levels. With this ACS report on older population with a disabil-ity as a baseline, future studies can use ACS data for trend analysis on subnational levels.
The data provided in this report can help anticipate future disability prevalence in the older population. In addition, the data can help those with a disability, their families, and society at large prepare for daily life tasks and old-age care.
14 Older Americans With a Disability: 2008–2012 U.S. Census Bureau
WHAT IS THE AMERICAN COMMUNITY SURVEY?
The American Community Survey (ACS) is a nationwide survey designed to provide communities with reliable and timely demo-graphic, social, economic, and housing data for congressional districts, counties, places, and other localities every year. It has an annual sample size of about 3.5 million addresses across the United States and includes both housing units and group quar ters (e.g., nursing homes and pris ons). The ACS is conducted in every county throughout the nation. Single-year, 3-year, and 5-year estimates from the ACS are all “period” estimates that represent data collected within particular intervals of time—12 months, 36 months, and 60 months, respectively. For informa-tion on the ACS sample design and other topics, visit <www.census.gov/acs/www>.
SOURCE AND ACCURACY
The data presented in this report are based on the ACS sample interviewed from January 2008 through December 2012. The estimates based on this sample describe the average values of person, household, and housing unit characteristics over this period of collection. Sampling error is the uncertainty between an estimate based on a sample and the cor-responding value that would be obtained if the estimate were based on the entire population (as from a census). Measures of sampling error are provided in the form of margins of error for key estimates included in this report. All com-parative statements in this report have undergone statistical testing and comparisons are significant at the 90 percent level, unless other-wise noted. In addition to sampling error, nonsampling error may be introduced during any of the opera-tions used to collect and process survey data such as editing, review-ing, or keying data from question-naires. For more information on sampling and estimation methods, confidentiality protection, and sampling and nonsampling errors, please see the ACS Multiyear Accu-racy of the Data document located at <www.census.gov/acs/www /Downloads/data_documentation /Accuracy/MultiyearACSAccuracy ofData2012.pdf>.
U.S. Census Bureau Older Americans With a Disability: 2008–2012 15
REFERENCES
Agrawal, Yuri, Elizabeth A. Platz, and John K. Niparko, “Prevalence of Hearing Loss and Differences by Demographic Characteristics Among U.S. Adults: Data From the National Health and Nutrition Examination Survey, 1999–2004,” Archives of Internal Medicine, 2008, Vol. 168, No. 14:1522–30.
Agree, Emily M., Vicki A. Freedman, and Manisha Sengupta, “Factors Influencing the Use of Mobility Technology in Community-Based Long-Term Care,” Journal of Aging and Health, 2004, Vol. 16, No. 2: 267–307.
Altman, Barbara M. and Amy B. Bernstein, Disability and Health in the United States, 2001–2005, National Center for Health Statistics, Hyattsville, MD, 2008.
Appalachian Regional Commission, The Appalachian Region, available at <www.arc.gov/appalachian _region/CountyEconomicStatusandDistressedAreas inAppalachia.asp>, accessed on January 22, 2014.
Brault, Matthew W., Americans With Disabilities: 2010, Current Population Reports, P70-131, U.S. Census Bureau, Washington, DC, U.S. Government Printing Office, 2012.
Centers for Disease Control and Prevention, “State-Specific Healthy Life Expectancy at Age 65 Years—United States, 2007–2009,” Morbidity and Mortality Weekly Report, 2013, Vol. 62, No. 28: 561–566.
Crimmins, Eileen M., Mark D. Hayward, Aaron Hagedorn, Yasuhiko Saito, and Nicolas Brouard, “Change in Disability-Free Life Expectancy for Americans 70 Years Old and Older,” Demography, 2009, Vol. 46, No. 3: 627–646.
Cruickshanks, Karen J., Ronald Klein, Barbara E. Klein, Terry L. Wiley, David M. Nondahl, and Ted S. Tweed, “Cigarette Smoking and Hearing Loss: The Epidemiology of Hearing Loss Study,” Journal of the American Medical Association, 1998, Vol. 279, No. 21:1715–1719.
DiGiacomo, Michelle, Joanne Lewis, Marie T. Nolan, Jane Phillips, and Patricia M. Davidson, “Health Transitions in Recently Widowed Older Women: A Mixed Methods Study,” BMC Health Services Research, 2013, 13:143.
He, Wan and Mark N. Muenchrath, 90+ in the United States: 2006–2008, American Community Survey Reports, ACS-17, U.S. Census Bureau, Washington, DC, U.S. Government Printing Office, 2011.
Humes, Karen, Nicholas Jones, and Roberto Ramirez, Overview of Race and Hispanic Origin: 2010, 2010 Census Briefs, c2010br-02, U.S. Census Bureau, 2011, available at <www.census.gov/prod/cen2010 /briefs/c2010br-02.pdf>.
Kritz, Mary M., Douglas T. Gurak, and Likwang Chen, “Elderly Immigrants: Their Composition and Living Arrangements,” Journal of Sociology and Social Welfare, 2000, Vol. XXVII, No. 1: 85–114.
Leonardi, Matilde, Jerome Bickenbach, Tevfik Bedirhan Ustun, Nenad Kostanjsek, and Somnath Chatterji, “The Definition of Disability: What Is in a Name?” The Lancet, 2006, Vol. 368, Issue 9543: 1219–1221.
Melzer, David, Grant Izmirlian, Suzanne G. Leveille, and Jack M. Guralnik, “Educational Differences in the Prevalence of Mobility Disability in Old Age: The Dynamics of Incidence, Mortality, and Recovery,” Journal of Gerontology: SOCIAL SCIENCES, 2001, Vol. 56B, No. 5: S294–S301.
Moon, J. Robin, Naoki Kondo, M. Maria Glymour, and S. V. Subramanian, “Widowhood and Mortality: A Meta-Analysis,” PLoS ONE, 2011, 6(8): e23465. Available at <www.plosone.org>, accessed on March 7, 2014.
National Institutes of Health, Fact Sheet—Disability in Older Adults, 2010, available at <report.nih.gov /NIHfactsheets/Pdfs/DisabilityinOlderAdults %28NIA%29.pdf>, accessed on February 4, 2014.
National Research Council, The Future of Disability in America, Washington, DC, The National Academies Press, 2007.
Noël-Miller, Claire, “Spousal Loss, Children, and the Risk of Nursing Home Admission,” Journals of Gerontology Series B: Psychological Sciences and Social Sciences, 2010, Vol. 65B, No. 3: 370–380.
Russell, David, “Living Arrangements, Social Integration, and Loneliness in Later Life: The Case of Physical Disability,” Journal of Health and Social Behavior, 2009, Vol. 50, No. 4, 460–475.
Van Hook, Jennifer, and Jennifer E. Glick, “Immigration and Living Arrangements: Moving Beyond Economic Need Versus Acculturation,” Demography, 2007, Vol. 44, No. 2: 225–249.
West, Loraine A., Samantha Cole, Daniel Goodkind, and Wan He, 65+ in the United States: 2010, Current Population Reports, P23-212, U.S. Census Bureau, Washington, DC, U.S. Government Printing Office, 2014.
16 Older Americans With a Disability: 2008–2012 U.S. Census Bureau
World Health Organization and the World Bank, World Report on Disability, 2011, Available at <www.who .int/disabilities/world_report/2011/report/en /index.html>.
Zhan, Weihai, Karen J. Cruickshanks, Barbara E. K. Klein, Ronald Klein, Guan-Hua Huang, James S. Pankow, Ronald E. Gangnon, and Theodore S. Tweed, “Generational Differences in the Prevalence of Hearing Impairment in Older Adults,” American Journal of Epidemiology, 2010, 171:260–266.
Zhou, Min, “Negotiating Culture and Ethnicity: Intergenerational Relations in Chinese Immigrant Families in the United States,” in Ram Mahalingam, ed., Cultural Psychology of Immigrants, Lawrence Erlbaum, Mahwah, NJ, 2006, 315–336.
U.S. Census Bureau Older Americans With a Disability: 2008–2012 17
Appendix Table 1.Margin of Error for PopulatioAge, and Sex: 2008–2012(Numbers in thousands. For information on confiwww.census.gov/acs/www)
n Aged 65 and Over With a
dentiality protection, sampling
Disability by Type of Disability,
error, nonsampling error, and defi nitions, see
Type of disabilityTotal
Age Sex
65 to 74 75 to 84 85 and over Male Female
Number Percent Number Percent Number Percent Number Percent Number Percent Number Percent
Note: Data are based on a sample and are subject to sampling variability . A margin of error is a measure of an estimate’s variability . The larger the margin of error is in relation to the size of the estimate, the less reliable the estimate . When added to and subtracted from the estimate, the margin of error forms the 90 percent confi dence interval .
Source: U .S . Census Bureau, American Community Survey, 5-year estimates, 2008–2012 .
18 Older Americans With a Disability: 2008–2012 U.S. Census Bureau
Appendix Table 2. Margin of Error for State Population Aged 65 and Over With a Disability by Selected Characteristics: 2008–2012—Con.(Numbers in thousands. For information on confidentiality protection, sampling error, nonsampling error, and definitions, see www.census.gov/acs/www)
Region and state
Total 65 and over
With a disabilityPercentage of population with a disability
Number of disabilities Living arrangement
NumberPercentage
of totalOne
disabilityTwo or more
disabilities
Household
Group quarters
Living alone
Living with others
United States . . . . 4 21 0 .1 0 .1 0 .1 0 .3 0 .3 Z
U.S. Census Bureau Older Americans With a Disability: 2008–2012 19
Appendix Table 2. Margin of Error for State Population Aged 65 and Over With a Disability by Selected Characteristics: 2008–2012—Con.(Numbers in thousands. For information on confidentiality protection, sampling error, nonsampling error, and definitions, see www.census.gov/acs/www)
Region and state
Total 65 and over
With a disabilityPercentage of population with a disability
Z Rounds to zero .Note: Data are based on a sample and are subject to sampling variability . A margin of error is a measure of an estimate’s variability . The larger the margin of
error is in relation to the size of the estimate, the less reliable the estimate . When added to and subtracted from the estimate, the margin of error forms the 90 percent confidence interval .
Source: U .S . Census Bureau, American Community Survey, 5-year estimates, 2008–2012 .
20 Older Americans With a Disability: 2008–2012 U.S. Census Bureau
Appendix Table 3.Margin of Error for Percentage of Population Aged 65 and Over With a Disability by Educational Attainment, Marital Status, and Selected Characteristics: 2008–2012(For information on confidentiality protection, sampling error, nonsampling error, and definitions, see www.census.gov/acs/www)
1 “Other” in marital status includes the categories of divorced, separated, and never married .2 “Other” in race includes the categories of American Indian or Alaska Native, Native Hawaiian or Other Pacific Islander, Some Other Race, and Two or More Races .Note: Data are based on a sample and are subject to sampling variability . A margin of error is a measure of an estimate’s variability . The larger the margin of
error is in relation to the size of the estimate, the less reliable the estimate . When added to and subtracted from the estimate, the margin of error forms the 90 percent confidence interval .
Source: U .S . Census Bureau, American Community Survey, 5-year estimates, 2008–2012 .
24 Older Americans With a Disability: 2008–2012 U.S. Census Bureau