63
American Express Company
| Date post: | 18-Nov-2014 |
| Category: |
Economy & Finance |
| Upload: | finance8 |
| View: | 1,247 times |
| Download: | 0 times |

American Express Company
American Express Tower
World Financial Center
New York, New York 10285212.640.2000
American Express Company

Various forward-looking statements are made in this Annual Report, which generally include the words “believe,” “expect,” “anticipate,”
“optimistic,” “intend,” “aim,” “will” and similar expressions. Certain factors that may affect these forward-looking statements, including
American Express Company’s ability to achieve its goals referred to herein, are discussed on page 58.
AMERICAN EXPRESS COMPANY
American Express Company is a global travel, financial and network services provider. Founded in1850, the Company serves individuals with charge and credit cards, Travelers Cheques and other storedvalue products. It also offers financial planning, brokerage services, mutual funds, insurance and otherinvestment products.
Through its family of Corporate Card services, American Express helps companies and institutionsmanage their travel, entertainment and purchasing expenses. It provides investment management servicesand administers pension and other employee benefit plans. The Company also offers accounting andtax preparation services to small businesses, and financial education services to employees at their placesof work.
As the world’s largest travel agency, American Express offers travel and related consulting services toindividuals and corporations around the globe. The Company also provides banking services to wealthyindividuals, retail customers, corporations and financial institutions outside the United States.
EXECUTIVE OFFICESAmerican Express Company200 Vesey StreetNew York, New York 10285212-640-2000
INFORMATION AVAILABLE ONTHE INTERNETCopies of the Company’s Form 10-K,proxy statement and other documents, aswell as information on financial results,products, services and Company pressreleases are available through theAmerican Express home page on theInternet at the following address:www.americanexpress.com.
INFORMATION AVAILABLE ON REQUESTCopies of the Company’s Form 10-K filed with the Securities and ExchangeCommission, philanthropic grants andpolitical contributions for 1998 are avail-able without charge upon written requestto the Secretary’s Office at the aboveaddress.
TRANSFER AGENT ANDREGISTRARChaseMellon Shareholder Services, L.L.C.Overpeck Centre85 Challenger RoadRidgefield Park, New Jersey 076601-800-463-5911 or 201-329-8660Hearing Impaired:1-800-231-5469 or 201-329-8354www.chasemellon.com
STOCK EXCHANGE LISTINGSCommon Shares:New York Stock Exchange (Symbol: AXP)Chicago Stock ExchangePacific Stock ExchangeLondon Stock ExchangeSwiss Stock ExchangeDusseldorf Stock ExchangeFrankfurt Stock ExchangeParis Stock Exchange
INDEPENDENT AUDITORSErnst & Young LLP787 Seventh AvenueNew York, New York 10019
ANNUAL MEETINGThe Annual Meeting of Shareholders ofAmerican Express Company will be heldat the executive offices of the Company,200 Vesey Street, New York, New York10285, on Monday, April 26, 1999 at10:00 a.m., local time. A written tran-script or an audio cassette of the meetingwill be available upon written request tothe Secretary’s Office. There will be amodest fee to defray production and mail-ing costs.
DIRECT DEPOSIT OFDIVIDENDSThe Company has established anElectronic Direct Deposit of Dividendsservice for the electronic payment ofquarterly dividends on the Company’scommon shares. With this service, regis-tered shareholders may have their dividendpayments sent electronically to their check-ing account or financial institution on thepayment date.
Shareholders interested in enrolling in thisservice should call ChaseMellon at 1-800-463-5911.
STOCK PURCHASE PLANThe Company’s Shareholder’s Stock Pur-chase Plan provides shareholders and newinvestors with a convenient way to purchasecommon shares through cash contributionsand reinvestment of dividends.
For a prospectus and other inquiriesregarding the Shareholder’s Stock PurchasePlan, contact:
The Chase Manhattan Bankc/o ChaseMellon Shareholder Services,L.L.C.P.O. Box 3336So. Hackensack, NJ 076061-800-842-7629
SHAREHOLDER AND INVESTOR INQUIRIESWritten shareholder inquiries may be sent either to ChaseMellon ShareholderServices, L.L.C., P.O. Box 3315, So.Hackensack, NJ 07606 or to theSecretary’s Office, American ExpressCompany, 200 Vesey Street, New York,New York 10285. Written inquiries fromthe investment community should be sentto Investor Relations, American ExpressCompany, at the above address.
TRADEMARKS AND SERVICE MARKSThe following trademarks, service marksand copyrighted material of AmericanExpress Company and its affiliates appearin the text of this report:ADVISORLINKTM
AMERICAN EXPRESS Box Logo®
AMERICAN EXPRESS Box Logo and Sunburst DesignSM
AMERICAN EXPRESS Card Design®
AMERICAN EXPRESS CORPORATE
Card Design®
AMERICAN EXPRESS
Travelers Cheque Design®
AMERICAN EXPRESS
WORLD SERVICE & Design®
AXI®
CENTURIONSM
Gladiator Head®
MEMBERSHIP REWARDS®
OPTIMA®
PLATINUM CARD®
©1998 American Express CompanyAll rights reserved.
Printed on premium grade recycled paper;fully recyclable.
GENERAL INFORMATION
DE
SIG
N:
Belk
Mign
ogna
Asso
ciates
, New
York
PH
OT
OG
RA
PH
Y:G
raha
m H
aber,
pro
duct
photo
grap
hy, J
ohn
Abbo
tt, ex
ecutiv
e pho
togra
phP
RIN
TIN
G:
Gra
phic
Arts
Cen
ter

TABLE OF CONTENTS
2 CONSOLIDATED HIGHLIGHTS
Key financial and statistical information for the past two years.
3 LETTER TO SHAREHOLDERS
Chairman and Chief Executive Officer Harvey Golub’s and President and Chief Operating OfficerKenneth I. Chenault’s discussion of significant events of the past year and plans for the future.
22 FINANCIAL REVIEW
Three years of financial results for American Express and for each of the major business segments, as well as a discussion of key revenue and expense components, statistical information,risk management and financial condition.
32 CONSOLIDATED STATEMENTS OF INCOME
33 CONSOLIDATED BALANCE SHEETS
34 CONSOLIDATED STATEMENTS OF CASH FLOWS
35 CONSOLIDATED STATEMENTS OF SHAREHOLDERS’ EQUITY
36 NOTES TO CONSOLIDATED FINANCIAL STATEMENTS
The Company’s significant accounting policies as well as significant income statement,balance sheet and off-balance sheet categories.
56 REPORT OF MANAGEMENT
A discussion of management’s responsibility in preparing and presenting financial statements andin ensuring accuracy of other financial information included in the annual report.
56 REPORT OF ERNST & YOUNG LLP INDEPENDENT AUDITORS
Opinion of independent auditors about the fairness of the Company’s financial condition andresults of operations as presented in the consolidated financial statements and accompanying notes.
57 CONSOLIDATED FIVE-YEAR SUMMARY OF SELECTED FINANCIAL DATA
Five-year summary of key operating results, assets and liabilities, common share statistics and number of employees.
59 THE PLANNING AND POLICY COMMITTEE
60 BOARD OF DIRECTORS

CONSOLIDATED HIGHLIGHTSAMERICAN EXPRESS COMPANY
PercentIncrease
(Dollars in millions, except per share amounts) 1998 1997 (Decrease)
Revenues $ 19,132 $ 17,760 7.7%
Net income:
As reported $ 2,141 $ 1,991 7.5
Adjusted (a) $ 2,201 $ 1,991 10.5
Diluted earnings per common share:
As reported $ 4.63 $ 4.15 11.6
Adjusted (a) $ 4.76 $ 4.15 14.7
Cash dividends declared per share $ .90 $ .90 —
Book value per share (b) $ 20.24 $ 19.29 4.9
Average common shares outstanding for diluted
earnings per common share (millions) 463 479 (3.4)
Total assets $ 126,933 $ 120,003 5.8
Shareholders’ equity $ 9,698 $ 9,574 1.3
Common share cash dividends declared $ 410 $ 421 (2.7)
Common share repurchases $ 1,890 $ 1,259 —
Return on average shareholders’ equity (b) 24.0% 23.5% —
Number of employees 84,732 73,620 15.1
(a) Adjusted to exclude the following 1998 first quarter items: a $138 million (after-tax) credit loss provision at American Express Bank relating to its Asia/Pacificportfolio, as well as income of $78 million (after-tax) representing gains on the sale of First Data Corporation shares and a preferred dividend based on LehmanBrothers’ earnings.
(b) Excludes the effect of SFAS No. 115.

3
growth in our corporate and small business cardactivities, increased spending per card and on-going improvement in our merchant coverage.Although market share figures for industry vol-ume are not yet available for the second half ofthe year, we are encouraged by our progress. And,in spite of huge mergers and portfolio acquisi-tions by many banks, we maintained our positionas the number one card issuer in the world basedon volume. • Prudent deployment of capital through strategic acquisi-tions that helped strengthen our competitive position in anumber of businesses. Acquisitions announced dur-ing the year include: Securities America, a fullservice broker/dealer that will provide our finan-cial advisors with increased choice in how they
Nineteen ninety-eight was a tough year. With eco-nomic turmoil and market volatility around theworld, it seemed at times as if we were facing oneproblem after another. We certainly did not han-dle every issue perfectly. But, overall, we did fine.As a result, we are pleased to report another yearof strong financial performance and continuedprogress on our strategies. The underlying strengthof our businesses and talented leadership through-out the organization enabled us to achieve goodresults, both on an absolute basis and relative tomany of our competitors.
Highlights of the past year include:• Continued United States market share gains in charge andcredit card volume and in lending balances. This reflectsa number of initiatives, including continued
TO OUR FELLOW SHAREHOLDERS
Harvey Golub (left), Chairman and Chief Executive Officer,and Kenneth I. Chenault, President and Chief Operating Officer.


5
met our target of at least eight percent revenuegrowth for the second year in a row. In all fair-ness though, we met the EPS and revenue targetsthrough rounding the numbers to the nearest per-centage point.
However, if we exclude significant items in thefirst quarter (American Express Bank reservingactions in Asia, and two partially offsettingcorporate gains) as well as the negative effect ofcurrency translation, we comfortably exceeded allour targets. Feel free to judge our performance oneither basis.
Net income for 1998 was $2.14 billion, up 8 percent from $1.99 billion in 1997. On adiluted per share basis, earnings were $4.63, up12 percent from $4.15. Revenues for the yearreached $19.1 billion, up 8 percent from $17.8 bil-lion. Excluding the first quarter items mentionedabove, income rose 11 percent to $2.2 billion anddiluted earnings per share increased 15 percentto $4.76.
Overall operating margins remained stabledespite the effect of acquisitions and substantialinvestment in the business, as well as the firstquarter provision at American Express Bank.
Our solid capital position and ongoing abilityto add to it from earnings gives us the flexibilityto make attractive investments and continue ouraggressive share repurchase program. In all, wehave repurchased 97 million shares in the openmarket since we began the program in September1994. More than 19 million of these shares wererepurchased in 1998.
In spite of our strong overall performance andnumerous accomplishments, we encountered dis-appointments during the year as well. The difficulteconomic environment in many countries topsthis list. Faltering economies, particularly in Asia,negatively affected American Express Bank’sresults as well as growth in international travelsales and spending on our cards. These econ-omies also affected our customers, who respondedin part by curtailing travel and entertainmentrelated spending.
While the United States economy remainedrelatively healthy throughout the year, volatilefinancial markets, particularly in the third and fourth quarters, presented challenges forAmerican Express Financial Advisors. Even so,Financial Advisors turned in another year ofrecord results.
We dealt with these and other challenges bycontinuing our focus on three basic operatingprinciples: offering superior value to customers,continually driving toward best-in-class econom-ics, and building the American Express brand.The Company’s performance in 1998 once againvalidated the wisdom of that focus and of ourbusiness strategies.
FINANCIAL RESULTS
For the sixth year in a row, we met or exceededtwo of our long-term financial targets — toincrease earnings per share (EPS) 12 to 15 per-cent and to earn a return on equity (ROE) of 18to 20 percent, on average and over time. We also
During the year, we continued to make investments in online firms to expand our electronic commerce capabilities. Our aim is to use the Internet to distributeproducts and services, to increase the value of these offerings and to create newbusiness opportunities.

6
this area as we forge new partnerships and deepenrelationships with our existing partners.
EXTENDING FINANCIAL SERVICES PRESENCE
Our goal is to become as widely known for financialservices as we are for the card and travel businesses.
We are positioning Financial Advisors, thecenterpiece of this effort, to become the companyof choice for delivery of financial advice, prod-ucts and services anytime and anywhere.
We are establishing a broad-based presence inthe marketplace through a strong network ofmore than 10,000 trained advisors, Internet-based services, institutional distribution —including 401(k) products — and third-partydistribution through banks and credit unions.During 1998, the cross-selling of financial ser-vices to our Cardmembers gained additionalmomentum. About one-third of new FinancialAdvisors clients were Cardmembers. Nonetheless,we have not made as much progress as we wouldhave liked.
EXPANDING INTERNATIONALLY
The third component of our growth strategy is toexpand our business internationally. Despite dif-ficulties in many markets outside the UnitedStates, we continued these efforts in 1998 becauseour view of the long-term potential in this arenais unchanged.
During the year we introduced in excess of 30new proprietary card products outside the United
THREE AVENUES FOR GROWTH
In our letter last year, we spoke to you about ourthree themes for growth: opening the AmericanExpress Card network to banks and other institutions, expanding our financial services busi-nesses, and building our presence in marketsoutside the United States. We remain committedto these themes and, in 1998, we made progress onall three.
OPENING THE NETWORK
As noted earlier, we added 16 new bank partnersto our network. New arrangements announcedduring the year include joint ventures with CreditSuisse in Switzerland and Generale Bank inBelgium and our first network card in Australiawith AMP Banking.
Although the United States market remainseffectively closed because of illegal restraints bythe bankcard associations, we hope that we willbe able to partner with United States banks in thefuture to offer consumers a broader range ofmore competitive products. We are seeing signsof discontent with the card associations fromsome of the larger issuers, perhaps foreshadowinga fundamental change in the relationship betweenVisa/MasterCard and their members.
In the meantime, the value we offer to banksoutside the United States continues to generatesignificant growth and consumer benefits. Businessbilled on network cards increased 30 percent in1998. We anticipate continued strong progress in
Partnering with banks and other financial institutions is a key growth area. In 1998,we added 16 new bank partners, helping them develop innovative products and ser-vices that operate on our card network. In total, the business billed on networkcards increased by 30 percent over the prior year.

7
As we have stated, our goal over the next sev-eral years is to expand our overseas operations tothe point where they contribute half of our earn-ings (excluding Financial Advisors). That wouldrepresent an increase from about one-third today.Our aim is to achieve that level against a back-drop of continued strong growth in the UnitedStates, thus implying international expansion of25 to 30 percent annually, on average. We fellwell short of that rate in 1998. The ongoingeconomic difficulties in some countries meanthis goal will take longer to achieve than we orig-inally thought.
States. These new products helped to increase ourcustomer base and the business billed on ourcards. This, in turn, fueled momentum in otherparts of the business, bolstering efforts to addnew merchants who accept our cards. The per-centage of Cardmembers’ general purpose plasticspending that can be accommodated on our mer-chant network outside the United States reached83 percent, up from 80 percent a year ago. Thatnumber continues to climb.
Separately, we are refocusing AmericanExpress Bank on businesses geared toward indi-vidual clients: Personal Financial Services andPrivate Banking.
American Express is enhancing theway it works with financial advisorsand clients.We acquired Securities America, a
broker/dealer that will help form the basis of a new
platform that provides operating support and invest-
ment products to independent financial advisors. We
launched a new computer-based service that allows
advisors to generate more sophisticated financial
plans for their clients. Our 401(k) website now allows
participating employees at registered client compa-
nies to view their retirement accounts online.

8
We continued to enhance our three primarydistribution channels for financial services. Theseinclude: a retail channel, consisting of our finan-cial advisor field force, as well as direct (online,telephone and mail) services; an institutionalchannel with expanded 401(k) and defined bene-fit capabilities; and a third-party distributionchannel, consisting of banks and thrift institu-tions we partner with to offer our products totheir customers.
Retail Channel — We have one of the best advi-sor retention rates of any firm in retail financialservices. Nonetheless, we think there is a largeopportunity to do even better. To help continueto attract and retain a top-quality field force, weare putting in place three alternatives that willallow advisors to choose the level of structure,services and compensation they receive. They are:(1) an American Express-branded employee
We hope that gives you a sense of the overallprogress at American Express. The next severalpages will provide additional details on theresults, accomplishments and challenges in eachof our major business areas.
BUSINESS RESULTS
U.S . FINANCIAL SERVICES
American Express Financial Advisors continued its impressive growth and, once again, deliveredrecord financial results. Income increased 16 per-cent from 1997 and revenues climbed 11 percent.Financial Advisors’ goal of helping clients meettheir financial objectives is closely linked withexpanding the base of assets we manage for them.At the end of 1998, we had $212 billion inowned, managed or administered assets, up from$182 billion at year-end 1997.
AMERICAN EXPRESS FINANCIAL ADVISORSASSETS OWNED, MANAGED OR ADMINISTERED
Assets owned, managed or administered by American Express Financial Advisors increased 17 percent in
1998, reaching $212 billion. Continued growth despite market volatility demonstrates the value of working
with clients as part of a long-term financial planning relationship.
’89 ’90 ’91 ’92 ’93 ’94 ’95 ’96 ’97 ’98
$225
$200
$175
$150
$125
$100
$75
$50
$25
(in billions)

9
includes 401(k) services and separate accountasset management services for corporate, publicand union retirement funds. We added severallarge clients and now serve nearly 600 institutions.
Third-party Channel — We distribute annuitiesto consumers through alliances with otherfinancial institutions. Our focus here is onexpanding the number of partners we workwith and the range of products they offer totheir customers.
Superior service continues to be a competitiveadvantage for Financial Advisors. Once again weimproved our already high client satisfaction sur-vey ratings. These surveys include direct feedbackon advisors and are intended to ensure that wemaintain our high service levels.
Despite a strong overall performance, therewere areas of disappointment as well in 1998.Some mutual funds posted stellar results, but ouroverall fund performance was below expectations.In addition, sales of annuities declined for thesecond year in a row.
INTERNATIONAL FINANCIAL SERVICES
We are capitalizing on the large and growingopportunity to meet the financial services needs ofcustomers outside the United States by leveragingFinancial Advisors’ strength in asset management,the marketing expertise of our card business, andAmerican Express Bank’s global presence.
platform with high levels of structure and cor-porate support; (2) an American Express-brandedplatform of independent contractors withmoderate levels of support; and (3) a non-branded platform of independent contractorswith a minimal level of support. Our goal is forall advisors to select a platform within the nexttwo years.
In 1998, we took a significant step in thisdirection with the purchase of Securities America,an independent broker/dealer that serves finan-cial planners and distributes mutual funds,annuities and insurance. This acquisition addedapproximately 1,100 financial advisors to ourfield force and will form the basis of our non-branded platform.
We strengthened our American Express-branded financial advisor field force during theyear as well. Together with Securities America, wehad 10,350 financial advisors at year end.
We are also working to strengthen advisorretention by providing a new generation oftechnology support and tools. All AmericanExpress-branded advisors now have access toAdvisorLink, an integrated desktop financialplanning, client management and communica-tions software package that helps them generatemore sophisticated, easy-to-read financial plansmore quickly.
Institutional Channel — During the year, weexpanded our institutional business, which
During the year, we made progress in selling additional American Express productsand services to our existing customers. For example, American Express Bank increasedclient holdings in investment certificates manufactured by American Express FinancialAdvisors by more than $1 billion; Cardmembers accounted for one-third of all newclients of Financial Advisors; and the number of Cardmembers purchasing fee-basedservices from American Express Relationship Services increased by 7 percent.

10
due to losses in its Corporate Banking business.We set aside a $138 million (after-tax) credit lossprovision related to the Bank’s Asia/Pacific busi-ness, primarily in Indonesia. We also took steps toensure that the Bank remains well capitalized.
At year-end, total loans outstanding world-wide were approximately $5.6 billion, down from$6.2 billion at the end of 1997. The declineresulted from a decision to deemphasize corpo-rate and correspondent banking loans.
As in the United States, we expanded programsto cross-sell investment and savings products toCardmembers. And, within the Private Bankinggroup, we increased cross-selling of productsmanufactured by Financial Advisors, particularlyPremium Deposits Investment Certificates. PrivateBanking client holdings increased 22 percent and
Economic conditions had a negative impact onour international efforts, particularly in Asia.Nevertheless, we made progress in establishing abroader foundation for the future.
In January 1999, we announced the formationof American Express Financial Advisors in Japan,the world’s second largest economy.
Elsewhere, American Express Bank launched afamily of euro-denominated mutual funds inFrance and Germany at the beginning of 1999,coinciding with the introduction of the euro. Thesame funds will be available in Italy and will beoffered in pounds sterling in the United Kingdomlater this year. We also introduced personal mort-gages in Greece and auto loans in India.
Overall, though, American Express Bank deliv-ered very disappointing results in 1998, primarily
We are capitalizing on the introduction ofa new pan-European currency, the euro.American Express was among the first to launch euro-
denominated products, including Travelers Cheques and a
family of mutual funds. Both were introduced in early 1999
to coincide with the introduction of the new currency.Our
correspondent banking center in Frankfurt has established
a dedicated group to process euro-denominated transac-
tions for other banks.

11
emerging markets. In early 1999, we began sellingthe new euro-denominated Travelers Cheque, oneof the first payment instruments denominated inthe new pan-European currency. Gift Chequesales increased 26 percent during the year.
Although we continued to gain share, TravelersCheques do not represent a high-growth business.We continue to focus on controlling expenses andhave realized benefits from combining facilitiesand leveraging marketing and sales initiatives withAmerican Express Bank.
INTERNATIONAL CARD AND TRAVEL
We strengthened our international card businessduring the year. New products helped to increasethe total number of cards in force and the chargevolume billed on those cards. We launched morethan 30 new proprietary card products outside
client volumes in Personal Financial Services,which include loans, deposits and mutual funds,increased 23 percent.
The Bank’s Global Trading unit benefitedfrom volatility in financial and foreign exchangemarkets, and turned in excellent results.
Our long-term focus for the Bank will be onindividual clients. The private banking and personal financial services we provide to theseclients offer the most financial potential and tie inmost directly with the rest of the Company.
In 1998, we began reporting Travelers Chequeresults with those of the Bank. Worldwide sales ofTravelers Cheques were $24 billion, down from$25 billion a year ago. However, we continued togain sales from competitors, resulting in a slightincrease in our total share of the industry. We alsoenjoyed significantly higher sales in a number of
One of the ways in which American Express isexpanding its card and travel business out-side the U.S. is by providing a broader range ofproduct choice to our customers.We introduced a
number of new proprietary card products in international mar-
kets in 1998, including an American Express Gold Card in
India, a co-branded card with Cheung Kong real estate hold-
ings in Hong Kong, a Platinum Card in Brazil and a Blue Card,
offering a cash rebate on purchases, in Canada.

12
and for bankcards in some parts of the world.We have launched an aggressive campaign in keyinternational markets to curtail this behavior,similar to the successful program we have used inthe United States.
We strengthened our corporate travel businessduring the year with the acquisition of HavasVoyages, the largest travel agency in France, anda joint venture with BBL Travel in Belgium andLuxembourg. In addition to bolstering our posi-tion as the world’s leader in travel, these alliancesprovide a good platform for Corporate Cardsales and further increase the importance ofour customer base to key travel suppliers. Thisleverage is important in the current travel agencybusiness environment, with ongoing pressure to reduce commissions by major airlines andother suppliers.
Difficult economic conditions top the list ofdisappointments for our international card andtravel businesses. Corporate and personal traveldeclined if you net out the benefit of various
the United States during the year, including a Small Business Corporate Card in the UnitedKingdom and Blue Cards in the United King-dom, Germany, Canada and Singapore. The BlueCards, a revolving credit product targeted toyoung consumers, have proven very popular. Wealso launched Platinum Cards in Argentina,Taiwan, Malaysia, Brazil and Singapore and co-branded cards with Aeromexico in Mexico,Thai Airways and the Dusit Group in Thailand,and Air France, Accor and Credit Lyonnais in France.
We continued to expand our merchant net-work during the year. As noted earlier, spendingcoverage reached 83 percent. Key merchant sign-ings included Woolworth’s in Australia, C&Adepartment stores in Germany, Lojas Ameri-canas in Brazil and the Liquor Control Board of Ontario.
Suppression — when merchants that acceptAmerican Express encourage a customer to useanother card or cash — remains an issue for us
In keeping with its commitment to increaseits businesses outside the U.S., AmericanExpress continues to introduce cards withcustomized benefits designed for specificmarkets. During 1998, we launched new cards with AirMiles
in Canada, Aeromexico in Mexico, Thai Airways and the Dusit
Group in Thailand and with Telepiu in Italy.

13
part by introducing existing Cardmembers tosome of our other card products, includingupgrades from the Personal Card to the AmericanExpress Gold Card or the Rewards Plus GoldCard, and to the Platinum Card.
We added Return Protection to the AmericanExpress Gold and Platinum Cards. This serviceallows Cardmembers to return purchases to usfor up to 90 days, even when a store will notaccept them.
We increased usage of lending products suchas Sign & Travel and the Special PurchaseAccount. These programs allow Cardmembersto extend payment on selected purchases.We selectively expanded the size of credit linesand encouraged Cardmembers to transfer out-standing balances from other card issuers to ourproducts. As a result, we increased lendingbalances at double-digit rates and continuedto capture a greater share of the credit cardlending market.
acquisitions. Spending billed on our cards soft-ened in some markets during the year althoughbilled business increased overall. This is not anexcuse for our performance, but clearly we wereaffected by generally more negative conditions.
U.S . CONSUMER CARD SERVICES
In its fortieth year in the United States, theAmerican Express Card continues to be the stan-dard bearer for our brand. Financial results werestrong and business billed on the card increasedfor the year. We attribute a portion of this growthto innovative marketing initiatives that helped fuelCardmember spending. In addition to spurringcard usage, these programs help enhance thebrand and reinforce the notion of using the cardfor everyday purchases at grocery stores, gas sta-tions and major retailers.
Deepening relationships with core Card-members was a goal for the year, and we focusedefforts on gaining a greater share of the plasticspending of our customers. We made progress in
We are forming new partnerships with banksand other financial institutions to issue cardson our network. We established 16 new network
arrangements in 1998, launching cards with Generale Bank
in Belgium, Banco Popular in Puerto Rico, AMP Banking in
Australia and Komercni Banka in the Czech Republic,
among others.

14
Our Membership Rewards program remainsvery popular and is a distinct competitive advan-tage for us. It is the largest program of its kindwith more than seven-and-one-half millionenrollees around the world. For the second yearin a row, it was voted “Best Affinity Card” byreaders of Business Traveler International. We contin-ued to expand the range of reward options in theprogram, adding Gap, as well as Foot Locker andThe Sharper Image in early 1999. MembershipRewards is a very successful program, but it isexpensive to maintain. We are exploring ways ofholding down expenses associated with the pro-gram while maintaining its market advantages.
We also made good progress in providingadditional products and services to Cardmembers.The number of Cardmembers using American
During 1998 we launched a card that offersspecial services and discounts to NationalRestaurant Association members. We alsobegan issuing a cash rebate card, which givesCardmembers up to two percent cash back ontheir purchases.
Of course, not all of the growth came fromnew products. The Platinum Card remains anoutstanding performer, and we saw strong growthin 1998. An increasing number of customerswant the significant value that this premiumproduct delivers.
We continue to refine our infrastructure andimprove our ability to customize products andservices to meet Cardmember needs. CustomExtras,for example, offers unique merchant discountsdirectly to Cardmembers on their monthly billingstatements based on past card usage.
Rewards programs help drive spend-ing and encourage Cardmember loyalty.We expanded our Membership Rewards program and
launched several new products in the U.S., including
a cash rebate card that offers up to two percent cash
back on purchases; a card that offers special services
and discounts to members of the National Restaurant
Association; and a gift card, which works like an elec-
tronic gift certificate, with merchants such as Chanel.

15
American Express Relationship Services alsomanages our interactive and smart card initiatives.We have made a number of minority investmentsin Internet firms over the past few years, and weinvested in four additional companies in 1998:Ticketmaster Online-CitySearch, which suppliesonline information guides and event ticketing forconsumers and merchants; Concur Technologies,which provides employee desktop solutions includingtravel and expense management; SaveSmart, whichoffers personalized electronic promotions fromparticipating merchants; and @Back-up, whichoffers computer back-up services over the Internet.
We also invested in Proton World, a leadingdeveloper and licenser of smart card electronicpurse and related technology, and became a licenseeof the MULTOS smart card operating system.Each of these investments is modest in size.
Express Relationship Services’ fee-based services,such as airflight and baggage insurance, grew7 percent during 1998.
We added to these traditional products bylaunching three new fee-based services: CreditProtection for the Charge Card, which providescoverage for outstanding balances in the event ofdisability or involuntary unemployment; HomeServices, providing discounts on home repair and improvement; and Home Protection, whichextends warranties for major home systems and appliances.
During the year, we launched electronic giftcards with Tower Records and Chanel. Theseproducts, which work like an electronic gift certi-ficate, are designed to help merchants increasebusiness and customer loyalty.
WORLDWIDE ANNUAL SPENDING PER CARDAMERICAN EXPRESS VS. V ISA/MASTERCARD CARDS
American Express
Visa/MasterCard
Purchases of goods and services only. American Express figures exclude network cards as well as spending on those cards.
*Estimate for Visa/MasterCard figures. Source: The Nilson Report, Oxnard, Calif.
’94 ’95 ’96 ’97 ’98*
$6,000
$5,000
$4,000
$3,000
$2,000
$1,000
Average annual spending on American Express Cards is significantly higher than on Visa or MasterCard
products — due in part to the appeal of rewards programs and to our expanded merchant coverage. This
higher spending volume helps us maintain our position as the single largest card issuer in the world.
16
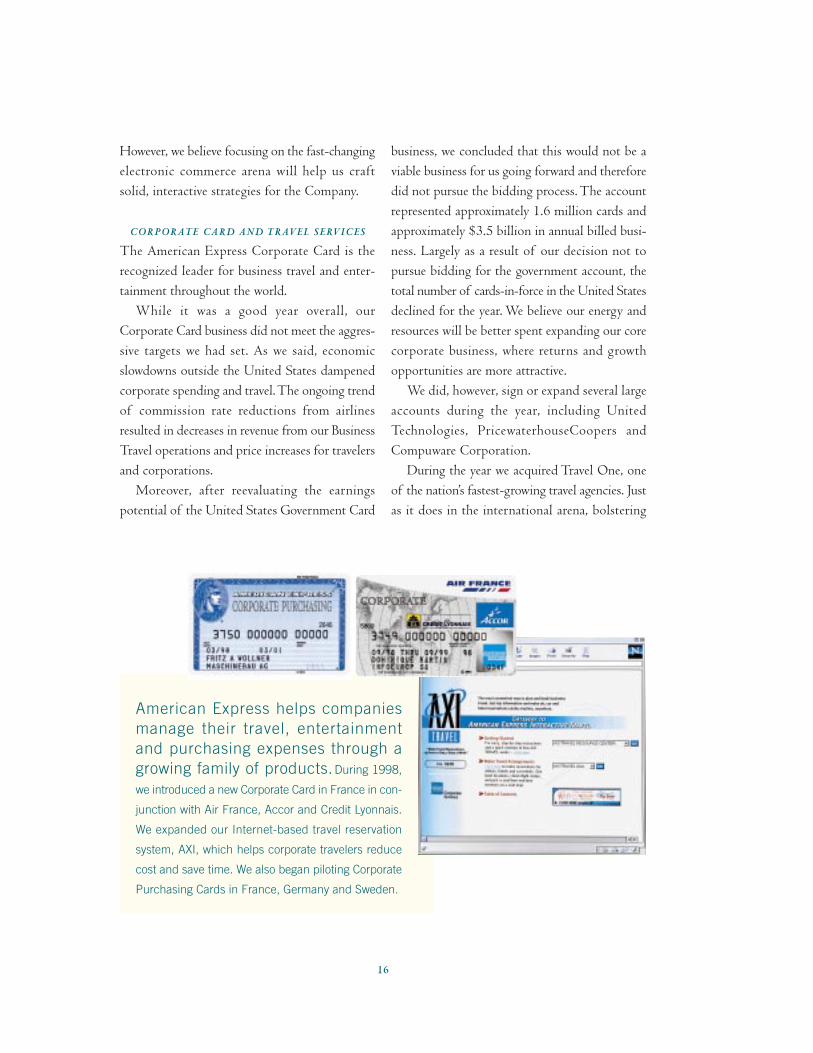
business, we concluded that this would not be aviable business for us going forward and thereforedid not pursue the bidding process. The accountrepresented approximately 1.6 million cards andapproximately $3.5 billion in annual billed busi-ness. Largely as a result of our decision not topursue bidding for the government account, thetotal number of cards-in-force in the United Statesdeclined for the year. We believe our energy andresources will be better spent expanding our corecorporate business, where returns and growthopportunities are more attractive.
We did, however, sign or expand several largeaccounts during the year, including UnitedTechnologies, PricewaterhouseCoopers andCompuware Corporation.
During the year we acquired Travel One, oneof the nation’s fastest-growing travel agencies. Justas it does in the international arena, bolstering
However, we believe focusing on the fast-changingelectronic commerce arena will help us craftsolid, interactive strategies for the Company.
CORPORATE CARD AND TRAVEL SERVICES
The American Express Corporate Card is therecognized leader for business travel and enter-tainment throughout the world.
While it was a good year overall, ourCorporate Card business did not meet the aggres-sive targets we had set. As we said, economicslowdowns outside the United States dampenedcorporate spending and travel. The ongoing trendof commission rate reductions from airlinesresulted in decreases in revenue from our BusinessTravel operations and price increases for travelersand corporations.
Moreover, after reevaluating the earningspotential of the United States Government Card
American Express helps companiesmanage their travel, entertainmentand purchasing expenses through agrowing family of products.During 1998,
we introduced a new Corporate Card in France in con-
junction with Air France, Accor and Credit Lyonnais.
We expanded our Internet-based travel reservation
system, AXI, which helps corporate travelers reduce
cost and save time. We also began piloting Corporate
Purchasing Cards in France, Germany and Sweden.

17
our travel industry presence increases our lever-age with key suppliers, helping us reduce profitmargin pressure while we provide superior valueto clients.
We further strengthened our roster of BusinessTravel clients in 1998 and focused efforts ondeepening our partnerships with major airlinesand hotel companies. We are also expanding thisbusiness through new electronic commerce services. We strengthened our leadership in on-line travel systems, enhancing AXI TRAVEL
(American Express Interactive), which now hasnearly 250,000 registered users. Although this listis growing, we plan to expand the percentage ofbusiness travel our clients book online. Severalinitiatives are underway to make Internet transac-tions easier for our clients.
We also launched a service that allows customersto file an expense report online by combining
To help American Express become theprimary source of financial and travelservices to U.S. small businesses, weare expanding our product line. During
the year, we added FedEx to the list of merchants
offering discounts to our Small Business Card-
members and launched an Internet site that helps
small businesses pay international vendors in local
currency. Outside the U.S., we introduced a new Gold
Card for small businesses in the United Kingdom.
Corporate Card charges with travel information.Co-branded with Concur Technologies, thisservice helps business travelers get reimbursedmore quickly.
In addition to traditional travel and enter-tainment expense management programs, we alsoexpanded the Corporate Purchasing Card, whichhelps companies manage the acquisition of sup-plies, equipment and services. Business billed onthe Purchasing Card grew significantly in 1998.This area is profitable and we aim to continueexpanding our presence in this market.
SMALL BUSINESS SERVICES
As we reported last year, we aspire to be the pri-mary source of financial and travel services forsmall businesses in the United States. We madetremendous strides in 1998. Our Small BusinessCorporate Card business continues to grow, with

18
United States to pay international vendors inmore than 40 foreign currencies, 24 hours aday, seven days a week.
Providing financial and tax advice to smallbusinesses is also part of our drive to be a leaderin meeting the needs of this growing sector. Weacquired an additional 14 accounting firms dur-ing the year.
Consumer Travel, which is managed with ourSmall Business Services unit, achieved strong salesgrowth. This was due in part to the acquisitionof Travel Impressions, a major travel packager. Inaddition to expanding our position in leisuretravel, this acquisition will enable us to takeadvantage of the increasing popularity of vaca-tion packages.
all indicators — billed business, cards-in-forceand spending per card — up for the year.
Equipment financing is a key lending categoryfor small business owners. We expanded thisbusiness in 1998 with the acquisition of equip-ment financing company CapitaFinance, in whichwe previously had a 50 percent investment. Inaddition, we announced an agreement to purchaseRockford Industries, a firm that provides point-of-purchase equipment financing. This transactionclosed in early 1999. We also made a minorityinvestment in Administaff, which provides pro-fessional employer services to our small businesscustomer base.
We introduced an International Paymentssite on the Internet to provide a convenient andcost effective way for small businesses in the
MERCHANT COVERAGE
We continue to increase the number and range of merchants that accept American Express Cards. In the
United States, our merchant network now accommodates more than 94 percent of Cardmembers’ general
purpose plastic spending. In 1998, we made strong gains in signing supermarkets and retail outlets. Outside
the United States, our merchant network now accommodates 83 percent of Cardmembers’ spending.
1996
1997
1998
Outside U.S. Supermarkets Retail Oil T&Ethe U.S.
TOTAL PLASTIC SPENDING U.S . BY INDUSTRY
100
90
80
70
60
50
40
30
20
10
(in percents)

19
competitive threats throughout the industry. Akey priority is communicating the added value inaccepting the American Express Card, includingthe benefits of Cardmember loyalty and higheraverage spending per card. This added valuedirectly affects our ability to maintain a premiumpricing structure. Our average discount rate,the fee merchants pay for accepting our cards,remained flat versus last year, after several yearsof slight reductions.
Visa continues their “We Prefer Visa” cam-paigns targeting specific merchants, industriesand individual markets. In effect, these programspay off one merchant or locale while ignoringothers. We thwarted most of their campaignsduring the year, but we expect Visa to continuethese efforts.
FUTURE SUCCESS
Overall, 1998 was a positive year for AmericanExpress Company. Although economic and mar-ket gyrations affected results in certain areas, wehave repeatedly stated that we will not be dis-tracted by short-term market movements. We aimto build long-term value for our shareholders.
We will continue to focus on our growth strate-gies. Our targets for 1999 and beyond are veryaggressive, but given our talent, superior productsand tenacity, we remain optimistic about the futureof our business.
Our dedicated employees and outstandingmanagement teams represent significant assets.We are committed to helping employees developthroughout their careers with the Company andwe continue to gauge how well we meet theirneeds through an annual Employee Survey. In 1998, a record 80 percent of our entire work-force participated in the survey. Employees ratedthe Company higher than in previous years in
MERCHANT SERVICES
We have been strengthening our relationships withmerchants that accept our cards through anexpanded roster of services, including softwareand Internet-based programs that help them man-age and reconcile transactions.
During the year, we increased our merchantcoverage among supermarkets, retailers, furniturestores, government agencies and charitable organi-zations. The number of new merchants signed inthe United States in 1998 increased 16 percentover 1997. Given those numbers, it is not surpris-ing that Credit Card Management magazine namedAmerican Express “Acquirer of the Year.”The per-centage of total Cardmember plastic spendingthat can be accommodated by our United Statesmerchant network now exceeds 94 percent.
Key signings in the United States during theyear included: AT&T residential service, Ameri-tech, Meijers supermarkets, the largest furniturechains, Heilig-Meyers and Levitz Furniture, andNEW JERSEY TRANSIT.
We conducted a number of highly successfulmarketing programs during the year, like the“Double Membership Rewards” program thathelped increase Cardmembers’ spending at gasstations and supermarkets. A similar programduring the fourth quarter with the world’slargest retailer, Wal-Mart, produced equallystrong results.
We expanded our ATM business in 1998 withthe acquisition of three networks totaling nearly3,000 terminals. We are now the ninth largestoperator of ATMs in the United States and planto use this network to deliver a range of servicesto Cardmembers and to help build retail salesfor merchants.
Merchant satisfaction with American Expressimproved, even amid pricing pressures and

20
lead TRS International and Al Kelly to headConsumer Card Services. Both had senior levelresponsibilities in their groups and our ability toreplace departing executives with such outstand-ing staff is a testament to our management depth.
We move into 1999 with great confidence inour strategy and our people. We will work hardto strengthen and leverage our worldwide repu-tation across all our businesses to achieve ourvision for American Express: to become theworld’s most respected service brand. We lookforward to continuing to deliver the superiorvalue our shareholders expect.
Sincerely,
Harvey GolubChairman and Chief Executive Officer
Kenneth I. ChenaultPresident and Chief Operating Officer
February 22, 1999
the majority of categories we measure, and weare nearing world-class targets for certain keydimensions. Scores among different racial groupsin the United States, an area of focus for us,improved from the previous year, but we can stilldo better. We will continue to address theseissues in our ongoing efforts to foster a highlyeffective organization.
Leadership is also key to our future success,and we were pleased to welcome Richard McGinn,Chairman and Chief Executive Officer of LucentTechnologies, as a new member of our Board ofDirectors. We will benefit from his insight andguidance as we continue to reach for ambitiousgrowth targets in an era of increasing competition.
Charles Duncan, a member of our Board since1981, has reached the mandatory retirement agefor Directors and will not stand for reelection.Charles is an extraordinary individual who com-bines intelligence, integrity and wisdom. We werefortunate and proud to have him serve as a mem-ber of our Board. We are sorry to lose him.
During the year, Vice Chairman Chuck Farrleft the Company to pursue other opportunities.We benefited from Chuck’s counsel and contri-butions and wish him well in his future endeavors.
Tom Ryder left TRS International to becomeCEO of Reader’s Digest and Phillip Riese leftConsumer Card Services to become CEO ofOptiMark Technologies. We were sorry to seethem go. However, we named Jim Cracchiolo to

F INANCIAL INDEX
22 FINANCIAL REVIEW
32 CONSOLIDATED STATEMENTS OF INCOME
33 CONSOLIDATED BALANCE SHEETS
34 CONSOLIDATED STATEMENTS OF CASH FLOWS
35 CONSOLIDATED STATEMENTS OF SHAREHOLDERS’ EQUITY
36 NOTES TO CONSOLIDATED FINANCIAL STATEMENTS
56 REPORT OF MANAGEMENT
56 REPORT OF ERNST & YOUNG LLP INDEPENDENT AUDITORS
57 CONSOLIDATED FIVE-YEAR SUMMARY OF SELECTED FINANCIAL DATA

1998 was another solid year for American ExpressCompany (the Company). We posted strong financialresults and made further progress on our strategies,notwithstanding the difficult economic environments inmany areas and volatile financial markets. We prudentlydeployed capital through strategic acquisitions that helpedstrengthen our competitive position in a number of busi-nesses, successfully launched card products outside theUnited States and partnered with other institutions toissue cards on our network. At the core of our perfor-mance is a determined focus on three basic operatingprinciples: offering superior value to customers, continu-ally driving toward best-in-class economics and buildingthe American Express brand.
The Company reported record 1998 net income of$2.14 billion, 8 percent higher than net income of$1.99 billion in 1997. The 1998 results include several firstquarter items: a $138 million (after-tax) credit loss provi-sion at American Express Bank (AEB) relating to itsAsia/Pacific portfolio, as well as income in the Corporatesegment of $78 million (after-tax) representing gains onthe sale of First Data Corporation (FDC) shares and a pre-ferred dividend based on Lehman Brothers’ earnings.Excluding these items, 1998 income was $2.2 billion, anincrease of 11%. In 1996, operating income was $1.74 bil-lion, excluding two fourth quarter items: a $300 million(after-tax) gain on the exchange of Debt Exchangeable forCommon Stock (DECS) for shares of common stock ofFDC and a $138 million (after-tax) restructuring charge.The Company’s 1998 results were in line with its long-termtargets of achieving, on average and over time: 12-15 per-cent earnings per share growth and at least 8 percent growthin revenues, but were at the low end of the range. Returnon equity exceeded the Company’s long-term target of18-20 percent.
Diluted earnings per share were $4.63, $4.15 and$3.89 in 1998, 1997 and 1996, respectively. After adjust-ing 1998 for the above-mentioned AEB credit lossprovision and the Corporate gains and after adjusting 1996for the restructuring charge and the DECS gain, dilutedearnings per share were $4.76, $4.15 and $3.56 in 1998,1997 and 1996, respectively. On this basis, 1998 earningsper share rose 15%. The rise in adjusted earnings per sharefor 1998 and 1997 reflects revenue growth, marginimprovement and a reduction in average shares outstanding.
Consolidated revenues rose 7.7 percent in 1998 to$19.1 billion, compared with $17.8 billion and $16.4 bil-lion in 1997 and 1996, respectively. Revenues, net ofAmerican Express Financial Advisors’ provisions for lossesand benefits, rose 8.3 percent and 9.2 percent in 1998 and1997, respectively. Contributing to both years’ results wereincreases in worldwide billed business, higher managementand distribution fees and greater loans outstanding andinterest margins in Cardmember lending. Growth in 1998was also enhanced by travel acquisitions.
YEAR 2000The Year 2000 (Y2K) issue is the result of computer pro-grams having been written using two digits rather than fourto define a year. Some programs may recognize a date using“00” as the year 1900 rather than 2000. This misinter-pretation could result in the failure of major systems ormiscalculations, which could have a material impact on theCompany and its businesses or subsidiaries through busi-ness interruption or shutdown, financial loss, reputationaldamage and legal liability to third parties. The Companybegan addressing the Y2K issue in 1995 and has estab-lished a plan for resolution, which involves the remediation,decommissioning and replacement of relevant systems,including mainframe, mid-range and desktop computers,application software, operating systems, systems software,date back-up archival and retrieval services, telephone andother communications systems, and hardware peripheralsand facilities dependent on embedded technology. As apart of our plan, we have generally followed and utilizedthe specific policies and guidelines established by theFederal Financial Institutions Examination Council, as wellas other U.S. and international regulatory agencies.Additionally, we continue to participate in Y2K relatedindustry consortia sponsored by various partners and sup-pliers. Progress is reviewed regularly with the Company’ssenior management and Board of Directors.
Our Y2K compliance effort related to informationtechnology (IT) systems is divided into two initiatives. Thefirst, which is the much larger initiative, is known internallyas “Millenniax,” and relates to mainframe and other tech-nological systems maintained by the American ExpressTechnologies organization (AET). The second, known as“Business T,” relates to the technological assets that areowned, managed or maintained by the Company’s individ-ual business units. Business T also encompasses theremediation of non-IT systems. These initiatives involve asubstantial number of employees and external consultants.This multiple sourcing approach is intended to mitigatethe risk of becoming dependent on any one vendor orresource. While the vast majority of our systems thatrequire modification are being remediated, in some caseswe have chosen to migrate to new applications that arealready Y2K compliant.
The Company’s plans for remediation with respectto Millenniax and Business T include the following pro-gram phases: (i) employee awareness and mobilization, (ii) inventory collection and assessment, (iii) impactanalysis, (iv) remediation/decommission, (v) testing and(vi) implementation. As part of the first three phases,we have identified the Company’s mission-critical sys-tems for purposes of prioritization. The Company’sgoals are to complete testing of critical systems by early1999, and to continue compliance efforts, including butnot limited to, the testing of systems on an integratedbasis and independent validation of such testing,
F INANCIAL REVIEWC O N S O L I D AT E D R E S U LT S O F O P E R AT I O N S
22

through 1999.* We are currently on schedule to meetthese goals. With respect to systems maintained by theCompany, the first three phases referred to above havebeen substantially completed for both Millenniax andBusiness T. In addition, remediation of critical systemsis substantially complete. As of December 31, 1998, forMillenniax, the remediation/decommission, testing andimplementation phases for critical and non-critical systemsin total are 82%, 75% and 60% complete, respectively.For Business T, such phases are 85%, 70% and 69%complete, respectively. Certain critical systems have alreadybeen made Y2K compliant, such as the WorldwideCredit Authorization System, and we have completedtesting of the global point of sale infrastructure. As aresult, we have begun issuing Year 2000 dated charge andcredit cards.
Our most commonly used methodology for reme-diation is the sliding window. Once an application/systemhas been remediated, we apply specific types of tests, suchas stress, regression, unit, future date and baseline toensure that the remediation process has achieved Y2Kcompliance while maintaining the fundamental data pro-cessing integrity of the particular system. To assist withremediation and testing, we are using various standardizedtools obtained from a variety of vendors.
The Company’s cumulative costs since inceptionof the Y2K initiatives were $383 million throughDecember 31, 1998 and are estimated to be in the rangeof $135-$160 million for the remainder through 2000.*These include both remediation costs and costs related toreplacements that were or will be required as a result ofY2K. These costs, which are expensed as incurred, relateto both Millenniax and Business T, and have not had, norare they expected to have, a material adverse impact on theCompany’s results of operations or financial condition.*Costs related to Millenniax, which represent most of thetotal Y2K costs of the Company, are managed by andincluded in the Corporate and Other segment; costsrelated to Business T are included in the business seg-ments. Y2K costs related to Millenniax represent 14%,6% and 1% of the AET budget for the years 1998, 1999and 2000, respectively. The Company has not deferredother critical technology projects or investment spendingas a result of Y2K. However, because the Company mustcontinually prioritize the allocation of finite financial andhuman resources, certain non-critical spending initiativeshave been deferred.
The Company’s major businesses are heavily depen-dent upon internal computer systems, and all havesignificant interaction with systems of third parties, bothdomestically and internationally. The Company is work-ing with key external parties, including merchants, clients,counterparties, vendors, exchanges, utilities, suppliers,agents and regulatory agencies to mitigate the potentialrisks to us of Y2K. The failure of external parties toresolve their own Y2K issues in a timely manner couldresult in a material financial risk to the Company. As part
of our overall compliance program, the Company isactively communicating with third parties through face-to-face meetings and correspondence, on an ongoing basis,to ascertain their state of readiness. Although numerousthird parties have indicated to us in writing that they areaddressing their Y2K issues on a timely basis, the readi-ness of third parties overall varies across the spectrum.Because the Company’s Y2K compliance is dependent onkey third parties being compliant on a timely basis, therecan be no assurances that the Company’s efforts alone willresolve all Y2K issues.
At this point, the Company is in the process of per-forming an assessment of reasonably likely Y2K systemsfailures and related consequences. The Company is alsopreparing specific Y2K contingency plans for all keyAmerican Express business units to mitigate the potentialimpact of such failures. This effort is a full-scale initiativethat includes both internal and external experts under theguidance of a Company-wide steering committee. Ourcontingency plans, which will be based in part on anassessment of the magnitude and probability of potentialrisks, will primarily focus on proactive steps to preventY2K failures from occurring, or if they should occur, todetect them quickly, minimize their impact and expeditetheir repair. The Y2K contingency plans will supplementdisaster recovery and business continuity plans already inplace, and are expected to include measures such as select-ing alternative suppliers and channels of distribution, anddeveloping our own technology infrastructure in lieu ofthose provided by third parties. Development of the Y2Kcontingency plans is expected to be substantially completeby the end of the first quarter of 1999, and will continueto be refined throughout 1999 as additional informationrelated to our exposures is gathered.*
*Statements in this Y2K discussion marked with anasterisk are forward-looking statements which are subjectto risks and uncertainties. Important factors that couldcause results to differ materially from these forward-looking statements include, among other things, theability of the Company to successfully identify systemscontaining two-digit codes, the nature and amount ofprogramming required to fix the affected systems, thecosts of labor and consultants related to such efforts, thecontinued availability of such resources, and the abilityof third parties that interface with the Company to suc-cessfully address their Y2K issues.
ACCOUNTING DEVELOPMENTSIn June 1997, the Financial Accounting Standards Board(FASB) issued Statement of Financial Accounting Standards(SFAS) No. 131, “Disclosures about Segments of an Enter-prise and Related Information,” which was effective for fiscalyears beginning after December 15, 1997 and redefines howoperating segments are determined. The Company adoptedthe provisions of SFAS No. 131 in the first quarter of 1998.As a result, the Travelers Cheque Group, which had beenincluded in the Travel Related Services segment, is now
23

reported in the same segment as American Express Bank,consistent with our management structure.
In March 1998, the American Institute of CertifiedPublic Accountants (AICPA) issued Statement of Position(SOP) 98-1, “Accounting for the Costs of ComputerSoftware Developed or Obtained for Internal Use.” TheSOP, which the Company will adopt on January 1, 1999,requires the capitalization of certain costs incurred todevelop or obtain software for internal use. The Company’spolicy has been to expense such costs as incurred. As aresult of adopting the new SOP, the Company expects tocapitalize approximately $250 million in 1999 that other-wise would have been expensed as incurred. The Companyplans to increase investment spending by the amount cap-italized, net of depreciation, and therefore, expects nosignificant effect on net income.
In December 1997, the AICPA issued SOP 97-3,“Accounting by Insurance and Other Enterprises forInsurance-Related Assessments.” The SOP, which theCompany will adopt on January 1, 1999, provides guidance
on accounting by insurance and other enterprises for assess-ments related to insurance activities. Adoption of thisstatement will not have a material effect on the Company’sfinancial position or results of operations.
In June 1998, the FASB issued SFAS No. 133,“Accounting for Derivative Instruments and HedgingActivities,”which is effective January 1, 2000. This Statementestablishes accounting and reporting standards for derivativeinstruments, including certain derivative instruments embed-ded in other contracts, and hedging activities. It requires thatan entity recognize all derivatives as either assets or liabili-ties on the balance sheet and measure those instruments atfair value. The accounting for changes in the fair value of aderivative depends on the intended use of the derivative andthe resulting designation. The ultimate financial effect of thenew rule will be measured based on the derivatives in placeat adoption and cannot be estimated at this time. Based onthe Company’s current derivatives position, the effect on theCompany’s earnings and financial position upon adoptionwould not be significant.
24
RESULTS OF OPERATIONS
STATEMENTS OF INCOME(Amounts in millions)Years Ended December 31, 1998 1997 1996
Net Revenues:Discount Revenue $ 6,115 $ 5,666 $ 5,024
Net Card Fees 1,587 1,604 1,668
Travel Commissions and Fees 1,647 1,489 1,422
Other Revenues 2,534 2,211 2,175
Lending:Finance Charge Revenue 2,007 1,848 1,575
Interest Expense 653 604 507
Net Finance ChargeRevenue 1,354 1,244 1,068
Total Net Revenues 13,237 12,214 11,357
Expenses:Marketing and Promotion 1,130 1,027 957
Provision for Losses and Claims:Charge Card 701 858 743
Lending 922 817 635
Other 56 57 73
Total 1,679 1,732 1,451
Charge Card Interest Expense 809 743 688
Net Discount Expense 665 597 554
Human Resources 3,544 3,076 2,907
Other Operating Expenses 3,346 3,254 3,190
Total Expenses 11,173 10,429 9,747
Pretax Income 2,064 1,785 1,610
Income Tax Provision 700 621 559
Operating Income 1,364 1,164 1,051
Restructuring Charge (net of tax) – – 125
Net Income $ 1,364 $ 1,164 $ 926
Travel Related Services (TRS) reported earnings of$1.36 billion in 1998, a 17 percent increase from $1.16 bil-lion in 1997. 1996 earnings were $1.05 billion, excludinga $125 million ($196 million pretax) restructuring charge.
TRS’ net revenues rose 8 percent in both 1998 and1997 compared with the previous year. In both years,TRS’ net revenues benefited from growth in worldwidebilled business and Cardmember loans outstanding, as wellas wider interest margins. 1998 results also reflect highertravel commissions and fees, primarily from acquisitionsduring the year. In both 1998 and 1997, growth inbilled business resulted from higher spending per BasicCardmember and growth in average cards outstanding.Greater spending per Basic Cardmember resulted fromseveral factors, including the benefits of rewards programsand expanded merchant coverage. In 1998, substantialgrowth in cards in force outside the United States was off-set by the cancellation of 1.6 million U.S. Governmentcards late in the fourth quarter, as a result of the Company’sdecision to withdraw from the U.S. Government Cardbusiness. The international increase includes growth inproprietary products, as well as the addition of a substan-tial number of new network cards over the past year. Thegrowth in worldwide cards in force in 1997 was primar-ily attributable to new credit card product launches anda broader product portfolio.
T R AV E L R E L AT E D S E RV I C E S

Discount revenue rose 8 percent in 1998 and 13 per-cent in 1997 as a result of higher billed business in theUnited States and internationally. The 1998 increase wasparticularly noteworthy because of the economic turmoilin many international markets, slower growth in the U.S.card industry and general tightening by corporations oftravel and entertainment expenses in the latter half of theyear. Net card fees decreased in both years due to declinesin consumer charge cards and the effect of TRS’ strategyof building its lending portfolio through the issuance oflow- and no-fee credit cards. Travel commissions and feesimproved in 1998 as a result of travel acquisitions duringthe year, which increased revenues and expenses but did nothave a material effect on net income. Both 1998 and 1997reflect increased sales volumes, offset in part by the con-tinued efforts by airlines to reduce distribution costs andby corporate travel and entertainment expense containmentefforts. The increase in other revenues in 1998 and 1997reflects higher card assessments and fees; 1998 also in-cludes the effect of acquisitions. Lending net finance chargerevenue was reduced by $1 billion loan securitizations inthe second quarter of 1998, the third quarter of 1997 andthe second quarter of 1996. See TRS’ Liquidity andCapital Resources discussion. Excluding the effect ofsecuritizations, lending net finance charge revenue rose18 percent and 24 percent in 1998 and 1997, respectively.The increase in both 1998 and 1997 is due to higherworldwide lending balances and a widening of interestmargins in the U.S. portfolio resulting from a smaller por-tion of the portfolio being subject to lower introductoryinterest rates.
SELECTED STATISTICAL INFORMATION(Amounts in billions, except percentages and where indicated)Years Ended December 31, 1998 1997 1996
Total Cards in Force (millions): United States 27.8 29.6 29.2
Outside the United States 14.9 13.1 12.3
Total 42.7 42.7 41.5
Basic Cards in Force (millions): United States 21.7 23.3 22.5
Outside the United States 11.5 10.0 9.6
Total 33.2 33.3 32.1
Card Billed Business:United States $ 165.6 $ 150.5 $ 131.0
Outside the United States 61.9 58.7 53.3
Total $ 227.5 $ 209.2 $ 184.3
Average Discount Rate* 2.73% 2.73% 2.75%
Average Basic Cardmember Spending (dollars)* $ 6,885 $ 6,473 $ 6,074
Average Fee per Card (dollars)* $ 38 $ 39 $ 42
Travel Sales $ 19.9 $ 17.4 $ 15.8
Travel Commissions and Fees/Sales 8.3% 8.6% 9.0%
Owned and Managed Charge CardReceivables:**Total Receivables $ 24.0 $ 23.5 $ 22.5
90 Days Past Due as a % of Total 2.7% 3.1% 3.2%
Loss Reserves (millions) $ 897 $ 951 $ 923
% of Receivables 3.7% 4.0% 4.1%
% of 90 Days Past Due 138% 132% 128%
Net Loss Ratio 0.46% 0.50% 0.51%
Owned and Managed U.S. CardmemberLending:**Total Loans $ 16.7 $ 14.6 $ 12.7
Past Due Loans as a % of Total:30-89 Days 2.2% 2.4% 2.4%
90+ Days 0.9% 1.1% 0.9%
Loss Reserves (millions):Beginning Balance $ 589 $ 488 $ 443
Provision 961 867 607
Net Charge-Offs/Other (931) (766) (562)
Ending Balance $ 619 $ 589 $ 488
% of Loans 3.7% 4.0% 3.8%
% of Past Due 120% 116% 117%
Average Loans $ 15.0 $ 13.3 $ 10.8
Net Write-Off Rate 6.4% 6.0% 5.2%
Net Interest Yield 9.5% 9.1% 8.8%
* Computed excluding cards issued by strategic alliance partners and indepen-dent operators as well as business billed on those cards.
** Owned and managed Cardmember receivables and loans include securitizedassets not reflected in the Consolidated Balance Sheets.
25

The growth in marketing and promotion expense in both1998 and 1997 reflected higher media and merchant-related advertising costs. In 1998, the worldwide ChargeCard provision declined due to improved loss rates; thisprovision rose in 1997, primarily as a result of volumegrowth. The worldwide lending provision increased in bothyears as a result of portfolio growth; the increase alsoincluded greater bankruptcy losses in 1998 and higherdelinquencies in 1997. The growth in the lending provi-sion was partly offset by the securitizations of U.S.Cardmember loans in both years. Charge Card interestexpense rose in 1998 and 1997 as a result of higher vol-umes, partly offset by lower borrowing rates. The growthin human resources expense primarily reflected increasedbusiness volumes and higher systems programmers’ costsfor technology projects and merit increases in both years;additionally, the growth in 1998 reflects higher employeelevels, in part due to acquisitions during the year. Otheroperating expenses rose in 1998 and 1997 due toCardmember loyalty programs, business growth and invest-ment spending.
TRS’ asset securitization programs increased fee rev-enue by $293 million, $195 million and $157 million in1998, 1997 and 1996, respectively. The Charge Cardsecuritization program resulted in net discount expenseof $665 million, $597 million and $554 million in1998, 1997 and 1996, respectively. The program alsoreduced the Charge Card provision by $293 million,$247 million and $246 million in 1998, 1997 and 1996,respectively, and Charge Card interest expense by $231 mil-lion, $230 million and $183 million in 1998, 1997 and1996, respectively. The revolving credit securitizationprogram also reduced lending net finance charge revenueby $306 million, $167 million and $75 million and thelending provision by $171 million, $120 million and$43 million, in 1998, 1997 and 1996, respectively. Thesesecuritizations had no material effect on net income forany year presented.
L IQUIDITY AND CAPITAL RESOURCES
SELECTED BALANCE SHEET INFORMATION
(Amounts in billions, except percentages)December 31, 1998 1997
Accounts Receivable, net $ 21.3 $ 20.5
U.S. Cardmember Loans $ 13.7 $ 12.6
Total Assets $ 44.7 $ 40.7
Short-term Debt $ 22.9 $ 20.9
Long-term Debt $ 5.1 $ 6.0
Total Liabilities $ 39.8 $ 36.1
Total Shareholder’s Equity $ 4.9 $ 4.6
Return on Average Equity* 27.8% 25.1%
Return on Average Assets* 3.3% 3.0%
* Excluding the effect of SFAS No. 115.
The American Express Credit Account Master Trust(the Trust) securitized $1 billion of loans in June 1998and $1 billion in August 1997, through the public
issuance of two classes of investor certificates and a pri-vately placed collateral interest in the assets of the Trust.The securitized assets consist of loans arising in a port-folio of designated Optima Card, Optima Line of Creditand Sign & Travel revolving credit accounts owned byAmerican Express Centurion Bank (Centurion Bank), awholly-owned subsidiary of TRS. At December 31,1998 and 1997, TRS had securitized a total of $3 billionand $2 billion of loans, respectively, which are not on theConsolidated Balance Sheets.
In addition, the American Express Master Trust(the Master Trust) securitizes charge card receivables gen-erated under designated American Express Card, GoldCard and Platinum Card consumer accounts through theissuance of trust certificates. In May 1998, the MasterTrust issued an additional $1 billion of Class A FixedRate Accounts Receivable Trust Certificates. In September1998, $300 million Class A Fixed Rate Accounts ReceivableTrust Certificates matured from the Charge Card securiti-zation portfolio. At December 31, 1998 and 1997, TRShad securitized $3.95 billion and $3.25 billion, respec-tively, of receivables, which are not on the ConsolidatedBalance Sheets.
In February 1998, American Express Credit Cor-poration (Credco), a wholly-owned subsidiary of TRS,issued $150 million 1.125% Cash Exchangeable Notesdue February 2003. These notes are exchangeable for anamount in cash which is linked to the price of the com-mon stock of the Company. Credco has entered intohedging agreements designed to fully hedge its obligationsunder these Notes.
In 1997, Credco issued and sold, exclusively outsidethe United States and to non-U.S. persons, $400 millionFloating Rate Notes and an additional $400 million of6.5% Fixed Rate Notes. These notes are listed on theLuxembourg Stock Exchange, and will mature in 2002.At December 31, 1998, Credco had approximately$2.4 billion of medium and long-term debt and warrantsavailable for issuance under shelf registrations filed withthe Securities and Exchange Commission.
TRS, primarily through Credco, maintained com-mercial paper outstanding of approximately $16.1 billionat an average interest rate of 5.3% and approximately$14.5 billion at an average interest rate of 6.0% atDecember 31, 1998 and 1997, respectively. Unused linesof credit of approximately $8.2 billion, which expire inincrements from 1999 through 2002, were available atDecember 31, 1998 to support a portion of TRS’ com-mercial paper borrowings.
Borrowings under bank lines of credit totaled $1.6 billion and $1.7 billion at December 31, 1998 and1997, respectively.
In January 1999, TRS issued and sold, exclusivelyoutside the United States and to non-U.S. persons,$500 million 5.625% Fixed Rate Notes. These notes arelisted on the Luxembourg Stock Exchange, and willmature in 2004.
26

27
RESULTS OF OPERATIONS
STATEMENTS OF INCOME(Amounts in millions)Years Ended December 31, 1998 1997 1996
Revenues:Investment Income $ 2,437 $ 2,339 $ 2,267
Management and Distribution Fees 1,851 1,486 1,205
Other Revenues 807 774 638
Total Revenues 5,095 4,599 4,110
Expenses:Provision for Losses and Benefits:
Annuities 1,150 1,214 1,208
Insurance 489 452 420
Investment Certificates 275 200 197
Total 1,914 1,866 1,825
Human Resources 1,441 1,229 1,034
Other Operating Expenses 548 482 366
Total Expenses 3,903 3,577 3,225
Pretax Income 1,192 1,022 885
Income Tax Provision 374 315 291
Net Income $ 818 $ 707 $ 594
American Express Financial Advisors (AEFA) reportedincreases in revenues of 11 percent and 12 percent, andearnings of 16 percent and 19 percent for 1998 and 1997,respectively. Revenues and earnings in both years benefitedprimarily from higher fees due to growth in managedassets and record mutual fund sales. Revenues net ofrelated provisions for fixed annuities, insurance and invest-ment certificate products, which are essentially spreadbusinesses, rose 16 percent and 20 percent for 1998 and1997, respectively.
The improvement in investment income reflectedhigher average investments of 3 percent and 4 percent in1998 and 1997, respectively. Management and distributionfees rose 25 percent and 23 percent in 1998 and 1997,respectively; the growth in both years was due to greatermanagement fee revenue from higher managed and separateaccount assets. These assets increased due to strong marketappreciation and positive net sales in both years. Distri-bution fees also improved in both years reflecting strongmutual fund sales. Other revenues rose in both years fromincreased life insurance contract charges and premiums andhigher financial planning fees.
In 1998, the provision for losses and benefits for fixedannuities declined due to lower business in force andaccrual rates and the provision for insurance increased fromhigher accrual rates and in force levels. Provisions for annu-ities and insurance grew in 1997 due to greater business inforce, partially offset by lower accrual rates. In 1998, theprovision for investment certificates rose reflecting higherin force levels. This increase also reflects growth in the pro-vision for the stock market certificate product, which ishedged by index options and resulted in a corresponding
increase in investment income, with minimal impact on netincome. Human resources expense rose in both years,reflecting rising financial advisors’ compensation fromgrowth in sales and asset levels and a greater number ofemployees to support business expansion. The increase inother operating expenses in both years primarily resultedfrom higher data processing, technology and advertisingexpenditures. 1997 also included increased occupancy andequipment costs. The effective tax rate in 1998 and 1997includes tax credits from affordable housing investments.
SELECTED STATISTICAL INFORMATION(Amounts in millions, except percentages and where indicated)Years Ended December 31, 1998 1997 1996
Revenues, Net of Provisions $ 3,181 $ 2,732 $ 2,285
Life Insurancein Force (billions) $ 81.1 $ 74.5 $ 67.3
Deferred Annuitiesin Force (billions) $ 42.8 $ 41.7 $ 37.5
Assets Owned, Managed orAdministered (billions): Assets managed
for institutions $ 45.9 $ 40.8 $ 37.3
Assets owned, managed oradministered for individuals:
Owned Assets: Separate Account Assets 27.3 23.2 18.5
Other Owned Assets 37.3 36.6 34.2
Total Owned Assets 64.6 59.8 52.7
Managed Assets 87.9 72.8 59.4
Administered Assets 14.0 8.4 4.2
Total $ 212.4 $ 181.8 $ 153.6
Market Appreciation (Depreciation) During the Period:
Owned Assets: Separate Account Assets $ 3,547 $ 3,170 $ 1,937
Other Owned Assets $ (110) $ 262 $ (232)
Managed Assets $ 13,787 $11,735 $ 9,063
Sales of Selected Products: Mutual Funds $ 20,766 $17,179 $14,331
Annuities $ 2,559 $ 3,473 $ 4,311
Investment Certificates $ 1,976 $ 1,194 $ 736
Life and OtherInsurance Products $ 389 $ 421 $ 449
Number of Financial Advisors 10,350* 8,776 8,340
Fees from FinancialPlans (thousands) $ 72,366 $60,809 $48,072
Product Sales Generatedfrom Financial Plans as aPercentage of Total Sales 65.4% 65.7% 64.0%
* Includes advisors from the acquisition of Securities America in the first quarter of 1998.
A M E R I C A N E X P R E S S F I N A N C I A L A D V I S O R S

L IQUIDITY AND CAPITAL RESOURCES
SELECTED BALANCE SHEET INFORMATION
(Amounts in billions, except percentages)December 31, 1998 1997
Investments $ 30.9 $ 30.7
Separate Account Assets $ 27.3 $ 23.2
Total Assets $ 64.6 $ 59.8
Client Contract Reserves $ 30.3 $ 30.2
Total Liabilities $ 60.6 $ 56.1
Total Shareholder’s Equity $ 4.1 $ 3.7
Return on Average Equity* 22.5% 21.8%
* Excluding the effect of SFAS No. 115.
AEFA’s total assets and liabilities rose primarily due togrowth in separate account assets as a result of marketappreciation and positive net sales for both years.Investments comprised primarily corporate bonds andmortgage-backed securities, including $3.4 billion and$3.0 billion in below investment grade debt securities, inaddition to $3.8 billion in mortgage loans at December 31,1998 and 1997. Investments are principally funded by salesof insurance and annuities and by reinvested income.Maturities of these investments are matched, for the mostpart, with the expected future payments of insurance andannuity obligations. Separate account assets, primarilyinvestments carried at market value, are for the exclusivebenefit of variable annuity and variable life insurance con-tract holders. AEFA earns investment management andadministration fees from the related accounts.
28
RESULTS OF OPERATIONS
STATEMENTS OF INCOME(Amounts in millions)Years Ended December 31, 1998 1997 1996
Net Revenues:Interest Income $ 854 $ 897 $ 845
Interest Expense 564 579 537
Net Interest Income 290 318 308
Travelers ChequeInvestment Income 330 331 349
Foreign Exchange Income 145 101 72
Commissions, Fees andOther Revenues 237 374 337
Total Net Revenues 1,002 1,124 1,066
Expenses:Human Resources 322 306 289
Other Operating Expenses 537 517 511
Provision for Losses 272 52 52
Total Expenses 1,131 875 852
Pretax (Loss)/ Income (129) 249 214
Income Tax Benefit (172) (23) (33)
Net Income $ 43 $ 272 $ 247
American Express Bank/Travelers Cheque (AEB/TC)1998 net income was lower than the prior year primarilyreflecting a $138 million ($213 million pretax) first quar-ter credit loss provision related to AEB’s business in theAsia/Pacific region, particularly Indonesia. The results for1997 included approximately $62 million ($96 millionpretax) of increased recognition of recoveries on aban-doned property related to the Travelers Cheque business.These recoveries are included in Commissions, Fees andOther Revenues.
The economic downturn in Asia contributed toreduced net interest income and lower commissions, feesand other revenues in 1998. In particular, net interestincome was down in 1998 due to lower corporate bankingrevenues, primarily reflecting a lower overall loan portfolioand an increase in nonperforming loans in Indonesia. Thesedeclines were partially negated by growth in AEB’s twobusinesses oriented to individuals, Private Banking andPersonal Financial Services, which resulted from greaterdeposits and loans. In 1997, net interest income grew com-pared with the prior year due to higher average balances inloans and trading securities. Foreign exchange income rosesignificantly in 1998 and 1997, reflecting strong tradingresults, primarily in the Asia/Pacific region.
SELECTED STATISTICAL INFORMATION(Amounts in billions, except percentages)Years Ended December 31, 1998 1997 1996
American Express Bank:Assets Managed/Administered* $ 6.2 $ 5.0 $ 4.8
Assets of Non-ConsolidatedJoint Ventures $ 2.6 $ 2.4 $ 1.3
Travelers Cheque: Sales $ 24.0 $ 25.0 $ 26.0
Average Outstandings $ 6.0 $ 5.9 $ 6.0
Average Investments $ 5.8 $ 5.6 $ 5.6
Tax Equivalent Yield 9.0% 9.2% 9.4%
* Includes assets managed by American Express Financial Advisors.
AMERICAN EXPRESS BANK /TRAVELERS CHEQUE

L IQUIDITY AND CAPITAL RESOURCES
SELECTED BALANCE SHEET INFORMATION
(Amounts in billions, except percentages and where indicated)December 31, 1998 1997
Travelers Cheque Investments $ 6.3 $ 5.9
Total Loans $ 5.6 $ 6.2
Total Nonperforming Loans (millions) $ 180 $ 47
Other Nonperforming Assets (millions) $ 63 $ 11
Reserve for Credit Losses (millions)* $ 259 $ 137
Loan Loss Reserve as a Percentage ofTotal Loans 3.8% 2.1%
Total Assets $ 18.5 $ 19.6
Deposits $ 8.3 $ 8.5
Travelers Cheques Outstanding $ 5.8 $ 5.6
Total Liabilities $ 17.3 $ 18.4
Total Shareholder’s Equity (millions) $ 1,197 $ 1,248
Return on Average Assets** 0.23% 1.40%
Return on Average Common Equity** 4.9% 28.7%
Risk-Based Capital Ratios:Tier I 9.8% 8.8%
Total 12.6% 12.3%
Leverage Ratio 5.5% 5.3%
* Allocation (millions)
Loans $ 214 $ 131
Other Assets, primarily derivatives 43 6
Other Liabilities 2 —
Total Credit Loss Reserves $ 259 $ 137
** Excluding the effect of SFAS No. 115.
AEB had approximately $5.6 billion outstanding in world-wide loans at December 31, 1998, down from $6.2 billionat December 31, 1997. The decline from the prior year waslargely in the Asia/Pacific region; corporate and correspon-dent banking loans fell by $0.8 billion, however consumerand private banking loans rose by $0.3 billion. Other bank-ing activities, such as securities, unrealized gains on foreignexchange and derivatives contracts, various contingencies andmarket placements, added approximately $7.6 billion toAEB’s credit exposures at December 31, 1998 (comparedwith $8.1 billion at December 31, 1997). The decline inthese other exposures from December 31, 1997 mainlyreflects lower exposures in the Asia/Pacific region. The 1998reserve for credit losses reflects an increase due to a $213 mil-lion provision, which was partially offset by write-offs relatedto the Asia/Pacific region, particularly Indonesia. Besides thedecrease in total loans, AEB/TC total assets declined mainlydue to lower unrealized gains on foreign exchange and deriv-ative contracts, primarily in Asia.
The Company has taken steps to ensure that AEBremains well capitalized, as defined by regulatory guide-lines. In April 1998, the Company purchased $225 millionof deferred tax assets from AEB, thereby reducing non-qualifying assets and increasing regulatory capital. TheCompany expects to be able to utilize these deferred taxassets over time within its consolidated tax return and,therefore, realize full value.
29
C O R P O R AT E A N D O T H E R
C O N S O L I D AT E D L I Q U I D I T Y A N D C A P I TA L R E S O U R C E S
Corporate and Other reported net expenses of $84 mil-lion and $152 million in 1998 and 1997, respectively, andincome of $134 million in 1996. 1998 results includeincome of $78 million after-tax ($106 million pretax)comprising a $39 million after-tax ($60 million pretax) gainfrom sales of common stock of First Data Corporation anda $39 million after-tax ($46 million pretax) preferred stockdividend based on earnings from Lehman Brothers. The1996 amount includes a $300 million after-tax ($480 mil-lion pretax) gain on the exchange of the Company’s DECSand a $13 million after-tax ($20 million pretax) charge pri-marily related to the early retirement of debt. Excluding
the above items, Corporate and Other had net expenses of$162 million in 1998 and $153 million in 1996.
Results for all three years include a benefit due to anearnings payout from Travelers Inc. (Travelers), related tothe 1993 sale of the Shearson Lehman Brothers Division (the 1993 sale). 1998 also reflects a benefit from the sale ofsecurities and adjustment of valuation allowances related tocertain corporate assets. 1996 results include the Company’sshare of a participation in Travelers’ revenue, in accordancewith the 1993 sale. The above items were offset by busi-ness building initiatives and Y2K costs related to Millenniaxin all three years.
The Company believes allocating capital to businesses witha return on risk-adjusted equity in excess of its cost ofequity and sustained earnings growth in its core businesswill continue to build shareholder value.
The Company’s philosophy is to retain enough earn-ings to help achieve its goals of earnings per share growthin the 12 to 15 percent range. As further described inNote 6 to the Consolidated Financial Statements, theCompany has undertaken a systematic share repurchaseprogram to offset new share issuances. To the extentretained earnings exceed investment opportunities, theCompany has returned excess capital to shareholders.
F INANCING ACTIVITIESThe Company has procedures to transfer immediatelyshort-term funds within the Company to meet liquidityneeds. These internal transfer mechanisms are subject to andcomply with various contractual and regulatory constraints.
The parent company generally meets its short-termfunding needs through an intercompany dividend policy andby the issuance of commercial paper. The Board of Directorshas authorized a parent company commercial paper programthat is supported by a $1.3 billion multi-purpose credit facil-ity that expires in increments from 1999 through 2002. Noborrowings have been made under this credit facility. There

was no parent company commercial paper outstanding dur-ing 1998 or 1997.
Total parent company long-term debt outstanding was$1.1 billion at December 31, 1998 and 1997. At December31, 1998 and 1997, the parent company had $2,050 mil-lion and $550 million, respectively, of debt or equitysecurities available for issuance under shelf registrations filedwith the Securities and Exchange Commission. In addition,TRS, Centurion Bank, Credco, American Express OverseasCredit Corporation Limited and AEB have established pro-grams for the issuance, outside the United States, of debtinstruments to be listed on the Luxembourg StockExchange. The maximum aggregate principal amount ofdebt instruments outstanding at any one time under theprogram will not exceed $3 billion. At December 31, 1998and 1997, $1.1 billion of debt has been issued under thisprogram. In January 1999, an additional $500 million ofdebt was issued under this program.
In July 1998, American Express Company CapitalTrust I, a wholly-owned subsidiary of the Company, estab-lished as a Delaware statutory business trust (the Trust),completed a public offering of 20 million shares (carryingvalue of $500 million) of 7.0% Cumulative QuarterlyIncome Preferred Shares Series I (liquidation preferenceof $25 per share). Proceeds of the issue, which representthe sole assets of the Trust, were invested in JuniorSubordinated Debentures (the Debentures) issued by theCompany, due 2028. The Company used the proceedsfrom the Debentures for general corporate purposes. SeeNote 5 to the Consolidated Financial Statements for fur-ther information.
RISK MANAGEMENTManagement establishes and oversees implementation ofBoard-approved policies covering the Company’s funding,investments and use of derivative financial instruments andmonitors aggregate risk exposures on an ongoing basis.The Company’s objective is to realize returns commen-surate with the level of risk assumed while achievingconsistent earnings growth. Individual business segmentsare responsible for managing their respective exposureswithin the context of Board-approved policies. SeeNote 7 to the Consolidated Financial Statements for adiscussion of the Company’s use of derivatives.
The following sections include sensitivity analyses ofthree different tests of market risk and estimate the effectsof hypothetical sudden and sustained changes in the applic-able market conditions on the ensuing year’s earnings, basedon year-end positions. The market changes, assumed to occuras of year end, are a 100 basis point increase in market inter-est rates, a 10% strengthening of the U.S. dollar versus allother currencies, and a 10% decline in the value of equitysecurities under management at AEFA. Computations of theprospective effects of hypothetical interest rate, foreignexchange rate and equity market changes are based on numer-ous assumptions, including relative levels of market interestrates, foreign exchange rates and equity prices, as well as the
levels of assets and liabilities. The hypothetical changes andassumptions will be different from what actually occurs inthe future. Furthermore, the computations do not anticipateactions that may be taken by management if the hypotheti-cal market changes actually occur over time. As a result,actual earnings effects in the future will differ from thosequantified below.
TRS’ hedging policies are established, maintainedand monitored by a central treasury function. TRS generallymanages its exposures along product lines. A variety ofinterest rate and foreign exchange hedging strategies areemployed to manage interest rate and foreign currency risks.
For Charge Card products, TRS funds its Cardmemberreceivables using both on-balance sheet sources, such aslong-term debt, medium-term notes, commercial paper andother debt, and an asset securitization program. Suchfunding is predominantly obtained by Credco and its sub-sidiaries. Interest rate exposure is managed through theissuance of long- and short-term debt and the use of inter-est rate swaps to achieve a targeted mix of fixed and floatingrate funding. During 1998 and 1997, TRS targeted this mixto be approximately 100 percent floating rate. In early 1998,TRS purchased interest rate caps to limit the adverse effectof an interest rate increase on substantially all Charge Cardfunding costs. The majority of these caps matured during1998. In 1999, TRS is entering into a series of interest rateswaps to convert a majority of its funding from floating rateto fixed rate. It is anticipated that this process will be com-pleted by the end of the first quarter of 1999.
For its lending products, TRS funds its Cardmemberloans using a mixture of long- and short-term debt, and anasset securitization program, primarily through CenturionBank. The interest rates on TRS’ lending products are gen-erally linked to a floating rate base and typically reprice eachmonth. Centurion Bank generally swaps its fixed-term debt,paying rates that reprice similarly with changes in the baserate of the underlying loans.
The detrimental effect on TRS pretax earnings of ahypothetical 100 basis point increase in interest rates wouldbe approximately $170 million and $169 million, based on1998 and 1997 year-end positions, respectively. This effectis primarily due to the variable rate funding of the ChargeCard products. Had the series of swaps purchased in early1999 been in effect at December 31, 1998, the 1998 effectwould have been substantially lower. Similarly, had the inter-est rate caps purchased in early 1998 been in effect atDecember 31, 1997, the 1997 effect would be reduced bynearly half.
TRS’ foreign exchange risk arising from cross-currency charges and balance sheet exposures is managedprimarily by entering into agreements to buy and sell cur-rencies on a spot or forward basis. In the latter part of 1998and 1997, foreign currency forward contracts were bothsold ($569 million and $562 million, respectively) and pur-chased ($34 million and $92 million, respectively) tomanage a majority of anticipated cash flows in major over-seas markets for the subsequent year.
30

Based on the year-end 1998 and 1997 foreignexchange positions, but excluding the forward contractsmanaging the anticipated overseas cash flows for the subse-quent year, the effect on TRS’ earnings of the hypothetical10% strengthening of the U.S. dollar would be immaterial.With respect to the forward contracts related to anticipatedcash flows for the subsequent year, the 10% strengtheningwould create a hypothetical pretax gain of $54 million and$41 million related to the 1998 and 1997 year-end posi-tions, respectively. Such gains, if any, would mitigate thenegative impact that a strengthening U.S. dollar wouldhave on overseas earnings for the subsequent year.
AEFA’s owned investment securities are, for the mostpart, held by its life insurance and investment certificatesubsidiaries, which primarily invest in long-term and inter-mediate-term fixed income securities to provide their clientswith a competitive rate of return on their investments whileminimizing risk. Investment in fixed income securities pro-vides AEFA with a dependable and targeted margin betweenthe interest rate earned on investments and the interest ratecredited to clients’ accounts. AEFA does not invest in secu-rities to generate trading profits for its own account.
AEFA’s life insurance and investment certificate sub-sidiaries’ investment committees meet regularly to reviewmodels projecting different interest rate scenarios and theirimpact on the profitability of each subsidiary. The commit-tees’ objective is to structure their investment securityportfolios based upon the type and behavior of the prod-ucts in the liability portfolios, to achieve targeted levels ofprofitability and meet contractual obligations.
Rates credited to customers’ accounts are generally resetat shorter intervals than the maturity of underlying invest-ments. Therefore, AEFA’s margins may be impacted bychanges in the general level of interest rates. Part of the com-mittees’ strategies include the purchase of derivatives, suchas interest rate caps, swaps and floors, for hedging purposes.
AEFA’s fees earned on the management of fixed incomesecurities in variable annuities and mutual funds are gener-ally based on the value of the portfolios. To manage the levelof 1999 fee income, AEFA has entered into a series of swapsdesigned to mitigate the negative effect on fees that wouldresult from an increase in interest rates.
The negative effect on AEFA’s pretax earnings of a100 basis point increase in interest rates, which assumesrepricings and customer behavior based on the application ofproprietary models to the book of business at December 31,1998 and 1997, would be approximately $55 million and$40 million for 1998 and 1997, respectively.
AEFA’s fees earned on the management of equity secu-rities in variable annuities and mutual funds are generallybased on the value of the portfolios. To manage the level offee income in the subsequent year, AEFA has entered intoa series of stock index option transactions designed to mit-igate, for a substantial portion of the portfolios, the negativeeffect on fees that would result from a decline in the equitymarkets. The negative effect on AEFA’s pretax earnings ofthe 10% decline in equity markets discussed above would
be approximately $72 million and $20 million based onassets under management and the index options as ofDecember 31, 1998 and 1997, respectively.
AEB/TC employs a variety of on- and off-balancesheet financial instruments in managing its exposure tofluctuations in interest and currency rates. Derivative instru-ments consist principally of foreign exchange spot andforward contracts, interest rate swaps, foreign currencyoptions and forward rate agreements. Generally, they are usedto manage specific on-balance sheet interest rate and foreignexchange exposures related to deposits and long-term debt,equity, loans and securities holdings.
The negative effect of the 100 basis point increase ininterest rates on AEB/TC’s pretax earnings would be negli-gible as of December 31, 1998 and 1997. The impact onearnings of the 10% strengthening of the U.S. dollardescribed above would be negligible and, with respect totranslation exposure of foreign operations, would result in a$14 million pretax charge against equity as of December 31,1998 and 1997.
AEB utilizes foreign exchange and interest rate prod-ucts to meet the needs of its customers. Customer positionsare usually, but not always, offset. They are evaluated interms of AEB’s overall interest rate or foreign exchangeexposure. AEB also takes limited proprietary positions.Potential daily exposure from trading activities is calculatedusing a Value at Risk methodology. This model employs aparametric technique using a correlation matrix based onhistorical data. The Value at Risk measure uses a 99%confidence interval to estimate potential trading losses overa one day period. During 1998 and at December 31, 1997,the Value at Risk for AEB was less than $3 million.
Asset/liability and market risk management at AEBare supervised by the Asset and Liability Committee. Thiscommittee comprises senior business managers and theChairman of AEB. The committee meets monthly andmonitors (a) liquidity, (b) capital levels, (c) market riskand (d) investment portfolios. The committee evaluatescurrent market conditions and determines AEB’s tacticswithin risk limits approved by AEB’s Board of Directors.AEB’s treasury, risk management and global trading man-agement issue policies and control procedures anddelegate risk limits throughout AEB’s regional tradingcenters.
AEB’s overall credit policies are approved by theFinance and Credit Policy Committee of AEB’s Board ofDirectors. Credit lines are based on a tiered approval lad-der, with levels of authority delegated to each country,geographic area, AEB’s senior management, and AEB’sBoard of Directors. Approval authorities are based on fac-tors such as type of borrower, nature of transaction,collateral, and overall risk rating. AEB controls the creditrisk arising from derivative transactions through the sameprocedures. The Credit Audit department reviews allsignificant exposures periodically. Risk of all foreignexchange and derivative transactions is reviewed by AEBon a regular basis.
31

32
Years Ended December 31, (millions, except per share amounts) 1998 1997 1996
Revenues
Discount revenue $ 6,115 $ 5,666 $ 5,024
Interest and dividends, net 3,277 3,175 3,289
Management and distribution fees 1,851 1,486 1,205
Net card fees 1,587 1,604 1,668
Travel commissions and fees 1,647 1,489 1,422
Other commissions and fees 1,657 1,475 1,261
Cardmember lending net finance charge revenue 1,354 1,244 1,068
Life and other insurance premiums 469 424 395
Other 1,175 1,197 1,048
Total 19,132 17,760 16,380
Expenses
Human resources 5,380 4,700 4,325
Provisions for losses and benefits:
Annuities and investment certificates 1,425 1,414 1,405
Life insurance, international banking and other 822 567 544
Charge card 701 858 743
Cardmember lending 922 817 635
Interest 999 924 1,116
Occupancy and equipment 1,250 1,139 1,126
Marketing and promotion 1,228 1,118 1,071
Professional services 1,191 1,028 951
Communications 474 450 445
Other 1,815 1,995 1,355
Total 16,207 15,010 13,716
Pretax income 2,925 2,750 2,664
Income tax provision 784 759 763
Net income $ 2,141 $ 1,991 $ 1,901
Earnings per Common Share
Basic $ 4.71 $ 4.29 $ 4.02
Diluted $ 4.63 $ 4.15 $ 3.89
Average common shares outstanding for
earnings per common share:
Basic 454 464 472
Diluted 463 479 488
See notes to consolidated financial statements.
CONSOLIDATED STATEMENTS OF INCOMEAMERICAN EXPRESS COMPANY

33
December 31, (millions, except share data) 1998 1997
Assets
Cash and cash equivalents $ 4,092 $ 4,179
Accounts receivable and accrued interest:
Cardmember receivables, less reserves: 1998, $524; 1997, $640 19,176 19,275
Other receivables, less reserves: 1998, $75; 1997, $72 3,048 2,499
Investments 41,299 39,648
Loans:
Cardmember lending, less reserves: 1998, $593; 1997, $576 14,721 13,183
International banking, less reserves: 1998, $214; 1997, $131 5,404 6,062
Other, net 929 864
Separate account assets 27,349 23,215
Deferred acquisition costs 2,990 2,894
Land, buildings and equipment — at cost, less accumulated depreciation:
1998, $2,067; 1997, $1,838 1,637 1,533
Other assets 6,288 6,651
Total assets $ 126,933 $ 120,003
Liabilities and Shareholders’ Equity
Customers’ deposits $ 10,398 $ 9,444
Travelers Cheques outstanding 5,823 5,634
Accounts payable 5,373 4,876
Insurance and annuity reserves:
Fixed annuities 21,172 22,112
Life and disability policies 4,261 4,053
Investment certificate reserves 4,854 4,149
Short-term debt 22,605 20,570
Long-term debt 7,019 7,873
Separate account liabilities 27,349 23,215
Other liabilities 7,881 8,503
Total liabilities 116,735 110,429
Guaranteed preferred beneficial interests in the Company’sjunior subordinated deferrable interest debentures 500 —
Shareholders’ Equity
Common shares, $.60 par value, authorized 1.2 billion shares; issued and
outstanding 450.5 million shares in 1998 and 466.4 million shares in 1997 270 280
Capital surplus 4,809 4,624
Retained earnings 4,148 4,188
Other comprehensive income, net of tax:
Net unrealized securities gains 583 579
Foreign currency translation adjustments (112) (97)
Accumulated other comprehensive income 471 482
Total shareholders’ equity 9,698 9,574
Total liabilities and shareholders’ equity $ 126,933 $ 120,003
See notes to consolidated financial statements.
CONSOLIDATED BALANCE SHEETSAMERICAN EXPRESS COMPANY

34
Years Ended December 31, (millions) 1998 1997 1996
Cash Flows from Operating Activities
Net income $ 2,141 $ 1,991 $ 1,901
Adjustments to reconcile net income
to net cash provided by operating activities:
Provisions for losses and benefits 2,491 2,307 2,009
Depreciation, amortization, deferred taxes and other (212) 187 266
Changes in operating assets and liabilities, net of effects of
acquisitions and dispositions:
Accounts receivable and accrued interest (665) (227) 290
Other assets 92 334 567
Accounts payable and other liabilities 131 517 (297)
Increase (decrease) in Travelers Cheques outstanding 253 (111) 141
Increase in insurance reserves 182 172 224
FDC gain — — (162)
Net cash provided by operating activities 4,413 5,170 4,939
Cash Flows from Investing Activities
Sale of investments 1,656 1,778 4,634
Maturity and redemption of investments 7,331 4,827 6,573
Purchase of investments (10,176) (7,898) (10,896)
Net increase in Cardmember receivables (1,510) (2,575) (2,770)
Cardmember loans/receivables sold to Trust, net 1,683 516 2,242
Proceeds from repayment of loans 24,791 25,591 22,696
Issuance of loans (27,587) (29,304) (27,277)
Purchase of land, buildings and equipment (391) (343) (438)
Sale of land, buildings and equipment 26 164 238
(Acquisitions) dispositions, net of cash acquired/sold (471) 23 (4)
Net cash used by investing activities (4,648) (7,221) (5,002)
Cash Flows from Financing Activities
Net increase (decrease) in customers’ deposits 1,039 733 (133)
Sale of annuities and investment certificates 5,337 5,888 5,411
Redemption of annuities and investment certificates (5,690) (4,965) (5,508)
Net increase in debt with maturities of 3 months or less 1,239 3,823 4,885
Issuance of debt 7,373 11,439 13,578
Principal payments on debt (7,426) (11,604) (17,384)
Issuance of Trust preferred securities 500 — —
Issuance of American Express common shares 137 168 176
Repurchase of American Express common shares (1,890) (1,259) (1,041)
Dividends paid (414) (423) (436)
Net cash provided (used) by financing activities 205 3,800 (452)
Effect of exchange rate changes on cash (57) (247) (8)
Net (decrease) increase in cash and cash equivalents (87) 1,502 (523)
Cash and cash equivalents at beginning of year 4,179 2,677 3,200
Cash and cash equivalents at end of year $ 4,092 $ 4,179 $ 2,677
See notes to consolidated financial statements.
CONSOLIDATED STATEMENTS OF CASH FLOWSAMERICAN EXPRESS COMPANY

35
AccumulatedOther
Preferred Common Capital Comprehensive RetainedThree Years Ended December 31, 1998 (millions) Total Shares Shares Surplus Income Earnings
Balances at December 31, 1995 $ 8,220 $ 200 $ 290 $ 3,781 $ 790 $ 3,159
Comprehensive income:
Net income 1,901 1,901
Change in net unrealized securities
gains (489) (489)
Foreign currency translation adjustments (4) (4)
Total comprehensive income 1,408
Repurchase of common shares (1,041) (13) (177) (851)
Net put options activity 124 124
Conversion of preferred shares into
common — (200) 3 197
Other changes, primarily employee plans 252 4 266 (18)
Cash dividends declared:
Preferred (6) (6)
Common, $.90 per share (429) (429)
Balances at December 31, 1996 8,528 — 284 4,191 297 3,756
Comprehensive income:
Net income 1,991 1,991
Change in net unrealized securities
gains 193 193
Foreign currency translation adjustments (8) (8)
Total comprehensive income 2,176
Repurchase of common shares (1,259) (10) (153) (1,096)
Exchange of Lehman Brothers Holdings, Inc.
preferred shares for American Express
common shares 337 3 334
Other changes, primarily employee plans 213 3 252 (42)
Cash dividends declared:
Common, $.90 per share (421) (421)
Balances at December 31, 1997 9,574 — 280 4,624 482 4,188
Comprehensive income:
Net income 2,141 2,141
Change in net unrealized securities
gains 4 4
Foreign currency translation adjustments (15) (15)
Total comprehensive income 2,130
Repurchase of common shares (1,890) (12) (196) (1,682)
Other changes, primarily employee plans 294 2 381 (89)
Cash dividends declared:
Common, $.90 per share (410) (410)
Balances at December 31, 1998 $ 9,698 $ — $ 270 $ 4,809 $ 471 $ 4,148
See notes to consolidated financial statements.
CONSOLIDATED STATEMENTS OF SHAREHOLDERS ’ EQUITYAMERICAN EXPRESS COMPANY

36
The accompanying Consolidated Financial Statementsinclude the accounts of American Express Company andits subsidiaries (the Company). All significant intercom-pany transactions are eliminated. Some amounts arebased on estimates and assumptions, e.g., reserves forCardmember Receivables and Loans; Deferred Acqui-sition Costs; and Insurance and Annuity Reserves. Thesereflect the best judgment of management and actualresults could differ.
Certain amounts from prior years have been reclass-ified to conform to the current presentation.
REVENUES
Cardmember Lending Net Finance Charge Revenue ispresented net of interest expense of $653 million,$604 million and $507 million for the years endedDecember 31, 1998, 1997 and 1996, respectively. Interestand Dividends is presented net of interest expense relatedprimarily to the Company’s international banking activ-ities of $572 million, $588 million and $536 millionfor the years ended December 31, 1998, 1997 and1996, respectively.
MARKETING AND PROMOTION
The Company expenses advertising costs in the year inwhich the advertising first takes place.
CASH AND CASH EQUIVALENTS
The Company has defined cash equivalents to includetime deposits with original maturities of 90 days or less,excluding those that are restricted by law or regulation.
SEPARATE ACCOUNT ASSETS AND L IABIL ITIES
Separate account assets and liabilities are funds held forthe exclusive benefit of variable annuity and variable lifeinsurance contract holders. The Company receives invest-ment management fees, mortality and expense assurancefees, minimum death benefit guarantee fees and cost ofinsurance charges from the related accounts.
ACCOUNTING CHANGES
In 1998, the Company adopted Statement of FinancialAccounting Standards (SFAS) No. 130, “ReportingComprehensive Income.” Comprehensive income consistsof net income and other comprehensive income; the latterincludes unrealized gains and losses on available-for-salesecurities and foreign exchange translation adjustments and is presented in the Consolidated Statements ofShareholders’ Equity. The adoption of SFAS No. 130had no effect on shareholders’ equity. Prior year financialstatements have been reclassified to conform to the SFASNo. 130 requirements.
NOTES TO CONSOLIDATED F INANCIAL STATEMENTSNOTE 1 S U M M A RY O F S I G N I F I C A N T A C C O U N T I N G P O L I C I E S
NOTE 2 I N V E S T M E N T S
The following is a summary of investments included inthe Consolidated Balance Sheets at December 31:
(millions) 1998 1997
Held to Maturity, at amortized cost $ 10,526 $ 11,871
Available-for-Sale, at fair value 26,764 23,727
Investment mortgage loans (fair value: 1998, $4,089; 1997, $4,026) 3,840 3,831
Trading 169 219
Total $ 41,299 $ 39,648

37
Held to Maturity
1998 1997
Gross Gross Gross GrossUnrealized Unrealized Fair Unrealized Unrealized Fair
(millions) Cost Gains Losses Value Cost Gains Losses Value
U.S. Government and
agencies obligations $ 60 $ 5 — $ 65 $ 53 $ 3 — $ 56
State and municipal obligations 1,087 81 — 1,168 1,224 75 — 1,299
Corporate debt securities 7,099 500 $ 28 7,571 8,226 452 $ 8 8,670
Foreign government bonds
and obligations 107 20 — 127 118 11 — 129
Mortgage-backed securities 1,614 31 — 1,645 1,992 27 8 2,011
Other 559 9 — 568 258 7 1 264
Total $ 10,526 $ 646 $ 28 $ 11,144 $ 11,871 $ 575 $ 17 $ 12,429
Investments classified as Held to Maturity and Available-for-Sale at December 31 are distributed by type andmaturity as presented below:
Available-for-Sale
1998 1997
Gross Gross Gross GrossUnrealized Unrealized Fair Unrealized Unrealized Fair
(millions) Cost Gains Losses Value Cost Gains Losses Value
U.S. Government and
agencies obligations $ 45 $ 3 — $ 48 $ 46 $ 1 — $ 47
State and municipal obligations 4,282 343 — 4,625 4,273 311 — 4,584
Corporate debt securities 10,854 362 $ 223 10,993 7,667 266 $ 37 7,896
Foreign government bonds
and obligations 972 41 4 1,009 956 27 6 977
Mortgage-backed securities 7,914 188 5 8,097 9,027 200 7 9,220
Equity securities 481 168 4 645 467 159 3 623
Other 1,347 1 1 1,347 380 — — 380
Total $ 25,895 $1,106 $ 237 $ 26,764 $ 22,816 $ 964 $ 53 $ 23,727
Held to Maturity Available-for-Sale
Fair FairDecember 31, 1998 (millions) Cost Value Cost Value
Due within 1 year $ 870 $ 877 $ 1,878 $ 1,893
Due after 1 year through 5 years 4,179 4,424 3,952 4,090
Due after 5 years through 10 years 2,646 2,850 6,459 6,649
Due after 10 years 1,217 1,348 5,211 5,390
8,912 9,499 17,500 18,022
Mortgage-backed securities 1,614 1,645 7,914 8,097
Equity securities — — 481 645
Total $ 10,526 $ 11,144 $ 25,895 $ 26,764

38
1998 1997
Held to Available- Held to Available-(millions) Maturity for-Sale Maturity for-Sale
Purchases $ 692 $ 9,927 $ 64 $ 7,323
Sales $ 243 $ 1,413 $ 274 $ 1,504
Maturities $ 2,191 $ 5,524 $ 1,513 $ 2,965
Mortgage-backed securities primarily include GNMA,FNMA and FHLMC securities at December 31, 1998and 1997. The table below includes purchases, sales and
maturities of investments classified as Held to Maturityand Available-for-Sale for the years ended December 31:
Investments classified as Held to Maturity were sold dur-ing 1998 and 1997 due to credit deterioration. Grossrealized gains and losses on sales were negligible.
The change in the Net Unrealized Securities Gainscomponent of Shareholders’ Equity was an increase of$4 million, an increase of $193 million and a decrease of$489 million for the years ended December 31, 1998,1997 and 1996, respectively. The increase in 1997 wasdue to a decrease in the general level of interest rates. Thedecrease in 1996 primarily reflected the exchange of theCompany’s Debt Exchangeable for Common Stock(DECS) for shares of First Data Corporation (FDC) heldby the Company, which resulted in the realization of a$300 million after-tax gain. An increase in the general levelof interest rates also contributed to the decline in 1996.
Gross realized gains and (losses) on sales of securi-ties classified as Available-for-Sale, using the specificidentification method, were $130 million and ($42 mil-lion), $67 million and ($10 million) and $65 millionand ($25 million) for the years ended December 31,1998, 1997 and 1996, respectively.
The increase in net unrealized gains on Tradingsecurities, which is included in income, was $3 million,$24 million and $28 million for the years endedDecember 31, 1998, 1997 and 1996, respectively.
In connection with the spin-off of Lehman BrothersHoldings Inc. (Lehman) in 1994, the Company acquired928 shares and Nippon Life Insurance Company(Nippon Life) acquired 72 shares of Lehman’s redeemablevoting preferred stock for a nominal dollar amount. Thissecurity entitles its holders to receive an aggregate annualdividend of 50 percent of Lehman’s net income in excess
of $400 million for each of eight years ending inMay 2002, with a maximum of $50 million in any oneyear. Prior to 1997, the Company received no dividendsin connection with the earnout. In 1998 and 1997, theCompany received a dividend of $46 million and $7 mil-lion on these shares, respectively. In addition, theCompany and Nippon Life are entitled to receive92.8 percent and 7.2 percent, respectively, of certaincontingent revenue and earnings-related payouts fromTravelers Inc. (Travelers), which were assigned by Lehmanto the Company and Nippon Life in connection with thespin-off transaction. The Travelers revenue-related payoutwas for three years and ended in 1996. The Companyreceived $46 million in 1996. The earnings-related pay-out, which is 10 percent of after-tax profits of SmithBarney, a subsidiary of Travelers, in excess of $250 mil-lion per year, was for five years and ended in 1998. Theamounts recognized in relation to this payout wereapproximately the same in each of the three years endedDecember 31, 1998, 1997 and 1996.
The change in net unrealized securities gains recog-nized in Other Comprehensive Income includes twocomponents: (1) unrealized gains (losses) that arose dur-ing the period from changes in market value of securitiesthat were held during the period (Holding gains (losses)),and (2) gains or losses that were previously unrealized, buthave been recognized in current period Net Income dueto sales of Available-for-Sale securities (Reclassificationfor realized gains). This reclassification has no effect ontotal Comprehensive Income or Shareholders’ Equity.
The following table presents these components ofother comprehensive income:
(millions, net of tax) 1998 1997 1996
Holding gains (losses) $ 61 $ 230 $ (463)
Reclassification for realized gains (57) (37) (26)
Increase (decrease) in net unrealized securities gains
recognized in other comprehensive income $ 4 $ 193 $ (489)

39
The following table presents changes in Reserves forCredit Losses related to loans:
NOTE 3 L O A N S
NOTE 4 S H O RT- A N D L O N G - T E R M D E B T A N D B O R R O W I N G A G R E E M E N T S
Loans at December 31 consisted of:
(millions) 1998 1997
Cardmember and Consumer Loans $ 16,765 $ 14,981
Commercial Loans:
Commercial and industrial 2,265 2,793
Mortgage and real estate 516 490
Loans to banks and other institutions 1,649 1,966
Other, principally policyholders’ loans 671 586
21,866 20,816
Less: Reserves for credit losses 812 707
Total $ 21,054 $ 20,109
Note: American Express Financial Advisors (AEFA) mortgage loans of $3.8 billion in 1998 and 1997 are included in Investment Mortgage Loans and are shown in Note 2.
(millions) 1998 1997
Balance, January 1 $ 707 $ 601
Provision for credit losses 1,165 837
Write-offs (1,134) (890)
Recoveries of amounts previously written-off 74 159
Balance, December 31 $ 812 $ 707
SHORT-TERM DEBT
At December 31, 1998 and 1997, the Company’s totalshort-term debt outstanding was $22.6 billion and$20.6 billion, respectively, with weighted average interestrates of 5.68% and 6.12%, respectively. At December 31,1998 and 1997, $0.5 billion and $1.6 billion, respec-tively, of short-term debt outstanding was covered by
interest rate swaps. The year-end weighted average effec-tive interest rates were 5.68% and 6.17% for 1998 and1997, respectively. The Company generally paid float-ing rates of interest under the terms of interest rateswaps. Unused lines of credit to support commercialpaper borrowing were approximately $8.2 billion atDecember 31, 1998.

40
LONG-TERM DEBT
December 31, (dollars in millions) 1998 1997
Year-End Year-EndYear-End Effective Year-End Effective
Notional Stated Interest Notional Stated InterestOutstanding Amount of Rate on Rate with Maturity of Outstanding Amount of Rate on Rate with Maturity of
Balance Swaps Debt (a,b) Swaps (a,b) Swaps Balance Swaps Debt (a,b) Swaps (a,b) Swaps
Notes due
June 23, 2004 $ 499 — 6.75% — — $ 499 — 6.75% — —
Notes due
August 12, 2002 400 $ 400 6.50% 5.40% 2002 400 $ 400 6.50% 5.78% 2002
Notes due
June 15, 2000 300 300 6.125% 5.34% 2000 300 300 6.125% 5.70% 2000
Notes due
November 15, 2001 299 299 6.125% 5.54% 2001 299 299 6.125% 5.98% 2001
Notes due
August 15, 2001 299 — 8.50% — — 299 — 8.50% — —
Floating Rate Notes due
May 1, 2002 399 399 5.27% 5.31% 2002 399 399 5.80% 6.00% 2002
Floating Rate Notes due
December 18, 2001 300 — 5.35% — — 300 — 6.03% — —
Other Fixed Senior Notes 1999- 1998-
due 1998-2022 1,631 1,315 7.10% 6.39% 2012 1,509 1,200 7.59% 6.71% 2005
Other Floating
Senior Notes 1999- 1998-
due 1998-2002 2,170 150 5.52% 5.55% 2000 3,106 320 5.94% 5.98% 1999
Other Floating Rate Notes
due 1999-2004 486 150 6.34% 6.53% 2004 506 150 6.52% 6.70% 2004
Other Fixed Rate Notes
due 1998-2006 236 34 4.95% 4.98% 2006 256 31 4.38% 4.40% 2006
Total $ 7,019 $ 3,047 $ 7,873 $ 3,099
(a) For floating rate debt issuances, the stated and effective interest rates were based on the respective rates at December 31, 1998 and 1997; these rates are notan indication of future interest rates.
(b) Weighted average rates were determined where appropriate.
The above interest rate swaps generally require theCompany to pay a floating rate, with a predominantindex of LIBOR (London Interbank Offered Rate).
The Company paid interest (net of amounts capi-talized) of $2.6 billion, $2.5 billion and $2.4 billion in1998, 1997 and 1996, respectively.
Aggregate annual maturities of long-term debt forthe five years ending December 31, 2003 are as follows(millions): 1999, $2,126; 2000, $1,316; 2001, $1,464;2002, $915; and 2003, $145.

41
NOTE 5 C U M U L AT I V E Q U A RT E R LY I N C O M E P R E F E R R E D S H A R E S
On July 16, 1998, American Express Company CapitalTrust I, a wholly-owned subsidiary of the Company,established as a Delaware statutory business trust (theTrust), completed a public offering of 20 million shares(carrying value of $500 million) of 7.0% CumulativeQuarterly Income Preferred Shares Series I (QUIPS) (liq-uidation preference of $25 per share). Proceeds of theissue were invested in Junior Subordinated Debentures(the Debentures) issued by the Company due 2028 whichrepresent the sole assets of the Trust. The QUIPS are sub-ject to mandatory redemption upon repayment of theDebentures at maturity or their earlier redemption. TheCompany has the option to redeem the Debentures, inwhole or in part, at any time on or after July 16, 2003,which will result in the redemption of a correspondingamount of QUIPS.
The Company has unconditionally guaranteed alldistributions required to be made by the Trust, but onlyto the extent the Trust has funds legally available for suchdistributions. The only source of funds for the Trust isthe Company’s interest payments on the Debentures. TheCompany has the right to defer such interest paymentsup to 20 consecutive quarters; as a consequence, quarterlydividend payments on the QUIPS can be deferred by theTrust during any such interest payment period. If theCompany defers any interest payments, the Company maynot, among other things, pay any dividends on its capi-tal stock until all interest in arrears is paid to the Trust.Distributions on the QUIPS are reported as InterestExpense in the Consolidated Statements of Income.
NOTE 6 C O M M O N A N D P R E F E R R E D S H A R E S
COMMON SHARES
In September 1998, the Company’s Board of Directorsauthorized the Company to repurchase up to 40 millioncommon shares over the next two to three years, subjectto market conditions. In 1998, all repurchases were madeunder previous authorizations. The Company has repur-chased approximately 97 million shares since 1994. Theseplans are designed to allow the Company to purchaseshares systematically, both to offset the issuance of newshares as part of employee compensation plans and toreduce shares outstanding.
Of the common shares authorized but unissued atDecember 31, 1998, 67 million shares were reserved forissuance for employee stock, employee benefit and divi-dend reinvestment plans, as well as debentures.
In 1987, Nippon Life purchased 13 million shares ofLehman 5% Series A Preferred Stock for $508 million.
In 1990, the Company gave Nippon Life the right toexchange these shares (subsequently exchanged by Lehmanfor Series B shares) into 6.24 million common shares ofthe Company at any time through December 1999 at anexchange price of $81.46. In 1996, Nippon Lifeinformed the Company that it had reduced its holding ofsuch preferred shares by approximately 30 percent butmaintained the exchange rights related to the shares sold.In 1997, Nippon Life exchanged all of its remainingholdings of these preferred shares for approximately4.4 million common shares of the Company. In January1998, the Company purchased all of Nippon Life’sremaining exchange rights.
Common shares activity for each of the last three yearsended December 31 was:
(thousands) 1998 1997 1996
Shares outstanding at beginning of year 466,417 472,859 483,108
Repurchases of common shares (19,400) (17,010) (22,200)
Conversion of Convertible Exchangeable
Preferred shares — — 4,706
Exchange of Lehman preferred shares for
American Express common shares — 4,399 —
Other, primarily employee plans 3,451 6,169 7,245
Shares outstanding at end of year 450,468 466,417 472,859

42
The Company uses derivative financial instruments fornontrading purposes to manage its exposure to interestand foreign exchange rates, financial indices and its fund-ing costs. In addition, American Express Bank (AEB)enters into derivative contracts both to meet the needsof its clients and, to a limited extent, for proprietarytrading purposes.
There are a number of risks associated with deriv-atives. Market risk is the possibility that the value ofthe derivative financial instrument will change. TheCompany is not exposed to market risk related to deriv-atives held for nontrading purposes beyond that inherentin cash market transactions. AEB is generally not subjectto market risk when it enters into a contract with a client,as it usually enters into an offsetting contract or uses theposition to offset an existing exposure. AEB takes pro-prietary positions within approved limits. These positionsare monitored daily at the local and headquarters levelsagainst Value at Risk (VAR) limits. The Company doesnot enter into derivative contracts with features thatwould leverage or multiply its market risk.
Credit risk related to derivatives and other off-balance sheet financial instruments is the possibility thatthe counterparty will not fulfill the terms of the contract.It is monitored through established approval procedures,including setting concentration limits by counterpartyand country, reviewing credit ratings and requiring col-lateral where appropriate. For its trading activities withclients, AEB requires collateral when it is not willingto assume credit exposure to counterparties for eithercontract mark-to-market or delivery risk. A significantportion of the Company’s transactions are with counter-parties rated A or better by nationally recognized creditrating agencies. The Company also uses master nettingagreements which allow the Company to settle multiplecontracts with a single counterparty in one net receipt orpayment in the event of counterparty default. Credit riskapproximates the fair value of contracts in a gain posi-tion (asset) and totaled $0.8 billion and $1.4 billion atDecember 31, 1998 and 1997, respectively. The fair valuerepresents the replacement cost and is determined by mar-ket values, dealer quotes or pricing models.
The following tables detail information regardingthe Company’s derivatives at December 31:
NOTE 7 D E R I VAT I V E A N D O T H E R O F F - B A L A N C E S H E E T F I N A N C I A L I N S T R U M E N T S
NONTRADING 1998
Notional Carrying Value Fair Value(millions) Amount Asset Liability Asset Liability
Interest Rate Products:
Interest rate swaps $ 13,548 $ 81 $ 72 $ 234 $ 174
Interest rate caps and floors purchased 7,025 17 — 21 1
Forward rate agreements 384 — — — —
Total Interest Rate Products 20,957 98 72 255 175
Foreign currency forward and spot contracts 5,965 49 52 59 54
Other Products 2,339 147 65 137 92
Total $ 29,261 $ 294 $ 189 $ 451 $ 321
PREFERRED SHARES
In January 1990, the Company sold four million of theCompany’s $3.875 Convertible Exchangeable Preferredshares (Convertible Preferred shares) to Nippon Life for$200 million. In May 1996, after receiving a redemp-tion notice from the Company, Nippon Life converted
all of the Convertible Preferred shares into 4,705,882of the Company’s common shares.
The Board of Directors is authorized to permit theCompany to issue up to 20 million preferred shareswithout further shareholder approval.
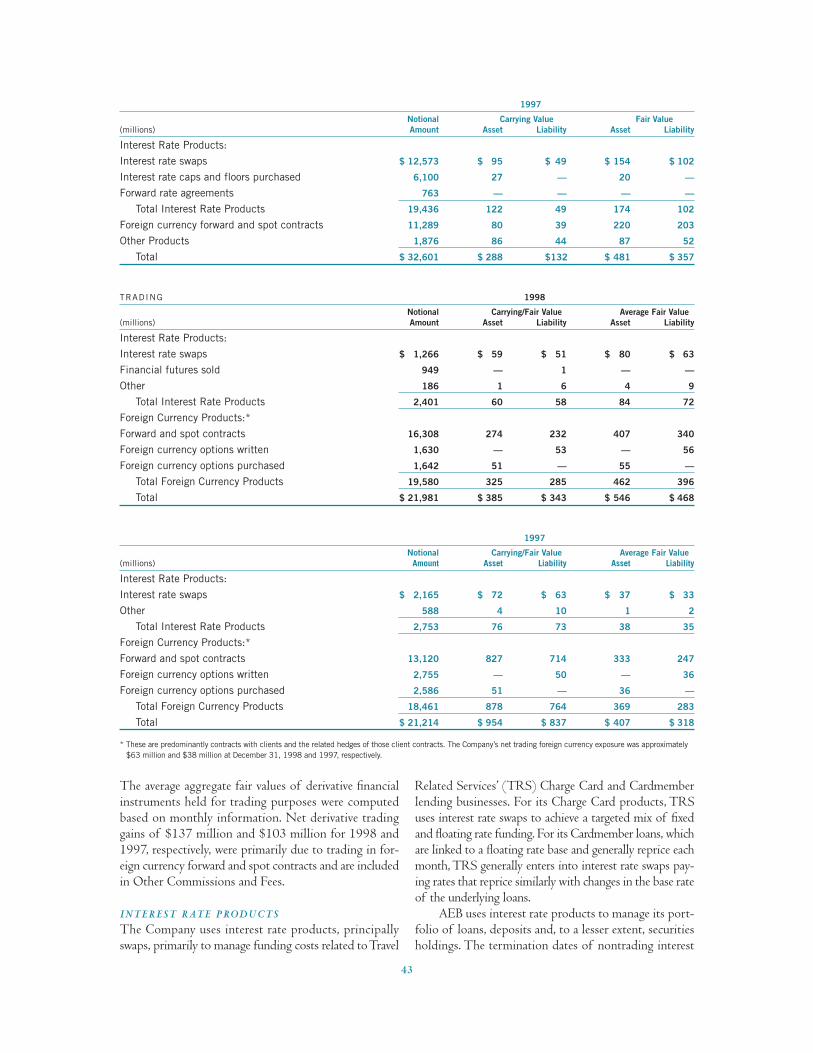
43
The average aggregate fair values of derivative financialinstruments held for trading purposes were computedbased on monthly information. Net derivative tradinggains of $137 million and $103 million for 1998 and1997, respectively, were primarily due to trading in for-eign currency forward and spot contracts and are includedin Other Commissions and Fees.
INTEREST RATE PRODUCTS
The Company uses interest rate products, principallyswaps, primarily to manage funding costs related to Travel
Related Services’ (TRS) Charge Card and Cardmemberlending businesses. For its Charge Card products, TRSuses interest rate swaps to achieve a targeted mix of fixedand floating rate funding. For its Cardmember loans, whichare linked to a floating rate base and generally reprice eachmonth, TRS generally enters into interest rate swaps pay-ing rates that reprice similarly with changes in the base rateof the underlying loans.
AEB uses interest rate products to manage its port-folio of loans, deposits and, to a lesser extent, securitiesholdings. The termination dates of nontrading interest
1997
Notional Carrying Value Fair Value(millions) Amount Asset Liability Asset Liability
Interest Rate Products:
Interest rate swaps $ 12,573 $ 95 $ 49 $ 154 $ 102
Interest rate caps and floors purchased 6,100 27 — 20 —
Forward rate agreements 763 — — — —
Total Interest Rate Products 19,436 122 49 174 102
Foreign currency forward and spot contracts 11,289 80 39 220 203
Other Products 1,876 86 44 87 52
Total $ 32,601 $ 288 $132 $ 481 $ 357
TRADING 1998
Notional Carrying/Fair Value Average Fair Value(millions) Amount Asset Liability Asset Liability
Interest Rate Products:
Interest rate swaps $ 1,266 $ 59 $ 51 $ 80 $ 63
Financial futures sold 949 — 1 — —
Other 186 1 6 4 9
Total Interest Rate Products 2,401 60 58 84 72
Foreign Currency Products:*
Forward and spot contracts 16,308 274 232 407 340
Foreign currency options written 1,630 — 53 — 56
Foreign currency options purchased 1,642 51 — 55 —
Total Foreign Currency Products 19,580 325 285 462 396
Total $ 21,981 $ 385 $ 343 $ 546 $ 468
1997
Notional Carrying/Fair Value Average Fair Value(millions) Amount Asset Liability Asset Liability
Interest Rate Products:
Interest rate swaps $ 2,165 $ 72 $ 63 $ 37 $ 33
Other 588 4 10 1 2
Total Interest Rate Products 2,753 76 73 38 35
Foreign Currency Products:*
Forward and spot contracts 13,120 827 714 333 247
Foreign currency options written 2,755 — 50 — 36
Foreign currency options purchased 2,586 51 — 36 —
Total Foreign Currency Products 18,461 878 764 369 283
Total $ 21,214 $ 954 $ 837 $ 407 $ 318
* These are predominantly contracts with clients and the related hedges of those client contracts. The Company’s net trading foreign currency exposure was approximately$63 million and $38 million at December 31, 1998 and 1997, respectively.

44
rate swaps are generally matched with the maturity datesof the underlying assets and liabilities.
For interest rate swaps that are used for nontradingpurposes and meet the criteria for hedge accounting, inter-est is accrued and reported in Other Receivables andInterest and Dividends or Accounts Payable and InterestExpense, as appropriate. Products used for trading pur-poses are reported at fair value in Other Assets or OtherLiabilities, as appropriate, with unrealized gains and lossesrecognized currently in Other Revenues.
AEFA uses interest rate caps, swaps and floors toprotect the margin between the interest rates earned oninvestments and the interest rates credited to holders ofinvestment certificates and fixed annuities. Interest ratecaps, swaps and floors generally mature within five years.The costs of interest rate caps and floors are reported inOther Assets and amortized into Interest and Dividendson a straight-line basis over the term of the contract;benefits are recognized in income when earned.
In 1998, AEFA also began using interest rate swapsto manage the level of 1999 fee income earned on themanagement of fixed income securities in variable annu-ities and mutual funds. These swaps are used for nontradingpurposes and meet the criteria for hedge accounting.Interest is accrued and reported in Other Receivables orAccounts Payable, as appropriate, and Management andDistribution Fees.
See Note 4 for further information regarding theCompany’s use of interest rate products related to short-and long-term debt obligations.
FOREIGN CURRENCY PRODUCTS
The Company uses foreign currency products primarilyto hedge net investments in foreign operations and tomanage transactions denominated in foreign currencies.In addition, AEB enters into derivative contracts both tomeet the needs of its clients and, to a limited extent, fortrading purposes, including taking proprietary positions.
Foreign currency exposures are hedged, where prac-tical and economical, through foreign currency contracts.Foreign currency contracts involve the purchase and saleof a designated currency at an agreed upon rate for set-tlement on a specified date. Foreign currency forwardcontracts generally mature within one year, whereas foreign currency spot contracts generally settle withintwo days.
For foreign currency products used to hedge netinvestments in foreign operations, unrealized gains and
losses as well as related premiums and discounts arereported in Shareholders’ Equity. For foreign currencycontracts related to transactions denominated in foreigncurrencies, unrealized gains and losses are reported inOther Assets and Other Commissions and Fees or OtherLiabilities and Other Expenses, as appropriate. Relatedpremiums and discounts are reported in Other Assets orOther Liabilities, as appropriate, and amortized intoInterest Expense and Other Expenses over the term of thecontract. Foreign currency products used for trading pur-poses are reported at fair value in Other Assets or OtherLiabilities, as appropriate, with unrealized gains and lossesrecognized currently in Other Commissions and Fees.
The Company also uses foreign currency forwardcontracts to hedge its firm commitments. In addition,for selected major overseas markets, the Company usesforeign currency forward contracts to hedge futureincome, generally for periods not exceeding one year;unrealized gains and losses are recognized currently inincome. In the latter part of 1998 and 1997, foreign cur-rency forward contracts were both sold ($569 millionand $562 million, respectively) and purchased ($34 mil-lion and $92 million, respectively) to manage a majorityof anticipated future cash flows in major overseas mar-kets. The impact of these activities was not material.
OTHER PRODUCTS
Included in Other Products are purchased and writtenindex options used by AEFA to hedge against adversechanges in the U.S. equities markets, which affect revenuesearned on assets under management. Index options are car-ried at market value and included in Other Assets or OtherLiabilities, as appropriate. Gains and losses on theseoptions are deferred until the related revenues are earned.At December 31, 1998 and 1997, the notional value ofthese options was $1.2 billion and $1.0 billion, respectively.
OTHER OFF -BALANCE SHEET F INANCIAL
INSTRUMENTS
The Company’s other off-balance sheet financial instru-ments principally relate to extending credit to satisfy theneeds of its clients. The contractual amount of theseinstruments represents the maximum accounting loss theCompany would record assuming the contract amountis fully utilized, the counterparty defaults and collateralheld is worthless. Management does not expect anymaterial adverse impact to the Company’s financial posi-tion to result from these contracts.
December 31, (millions) 1998 1997
Unused Credit Available to Cardmembers $ 44,626 $ 37,668
Loan Commitments and Other Lines of Credit $ 1,197 $ 1,053
Standby Letters of Credit and Guarantees $ 1,270 $ 1,301
Commercial and Other Letters of Credit $ 400 $ 618

45
The Company is committed to extend credit tocertain Cardmembers as part of established lendingproduct agreements. Many of these are not expected tobe drawn; therefore, total unused credit available toCardmembers does not represent future cash require-ments. The Company’s Charge Card products have nopreset spending limit and are not reflected in unusedcredit available to Cardmembers.
The Company may require collateral to support itsloan commitments based on the creditworthiness ofthe borrower.
Standby letters of credit and guarantees primarily rep-resent conditional commitments to insure the performance
of the Company’s customers to third parties. These com-mitments generally expire within one year.
The Company issues commercial and other lettersof credit to facilitate the short-term trade-related needsof its clients, which typically mature within six months.At December 31, 1998 and 1997, the Company held$829 million and $744 million, respectively, of col-lateral supporting standby letters of credit and guaranteesand $215 million and $276 million, respectively, of col-lateral supporting commercial and other letters of credit.
Other financial institutions have committed to extendlines of credit to the Company of $10.3 billion and$9.7 billion at December 31, 1998 and 1997, respectively.
NOTE 8 FA I R VA L U E S O F F I N A N C I A L I N S T R U M E N T S
The following table discloses fair value information formost on- and off-balance sheet financial instruments.Certain financial instruments, such as life insuranceobligations, employee benefit obligations and investmentsaccounted for under the equity method are excluded. The
fair values of financial instruments are estimates basedupon market conditions and perceived risks at December31, 1998 and 1997 and require management judgment.These figures may not be indicative of their futurefair values.
December 31, (millions) 1998 1997
Carrying Fair Carrying FairValue Value Value Value
Financial AssetsAssets for which carrying values approximate fair values $ 55,434 $ 55,434 $ 51,037 $ 51,037
Investments $ 41,299 $ 42,166 $ 39,648 $ 40,401
Loans $ 21,258 $ 21,029 $ 20,269 $ 20,206
Derivative financial instruments, net $ 147 $ 172 $ 273 $ 241
Financial LiabilitiesLiabilities for which carrying values approximate fair values $ 48,404 $ 48,404 $ 44,383 $ 44,383
Fixed annuity reserves $ 19,855 $ 19,145 $ 20,731 $ 19,882
Investment certificate reserves $ 4,821 $ 4,830 $ 4,112 $ 3,979
Long-term debt $ 7,019 $ 7,222 $ 7,873 $ 7,903
Separate account liabilities $ 25,005 $ 24,179 $ 21,489 $ 20,708
The carrying and fair values of other off-balance sheetfinancial instruments are not material as of December 31,1998 and 1997. See Notes 2 and 7 for carrying and fairvalue information regarding investments and derivativefinancial instruments. The following methods were usedto estimate the fair values of financial assets and finan-cial liabilities:
F INANCIAL ASSETS
Assets for which Carrying Values Approximate FairValues: The carrying values of Cash and Cash Equivalents,Accounts Receivable and Accrued Interest, Separate
Account Assets and applicable Other Assets approximatetheir fair values.
Loans: For variable rate loans that reprice within ayear where there has been no significant change in coun-terparties’ creditworthiness, fair values are based oncarrying values. The fair values of all other loans, exceptfor loans with significant credit deterioration, are esti-mated using discounted cash flow analysis, based oncurrent interest rates for loans with similar terms to bor-rowers of similar credit quality. For loans with significantcredit deterioration, fair values are based on revisedestimates of future cash flows discounted at rates com-mensurate with the risk inherent in the revised cash flow

46
projections, or for collateral dependent loans, oncollateral values.
F INANCIAL L IABIL ITIES
Liabilities for which Carrying Values Approximate FairValues: The carrying values of Customers’ Deposits,Travelers Cheques Outstanding, Accounts Payable, Short-Term Debt and applicable Other Liabilities approximatetheir fair values.
Fixed Annuity Reserves: Fair values of annuities indeferral status are estimated as the accumulated valueless applicable surrender charges and loans. For annu-ities in payout status, fair value is estimated usingdiscounted cash flow, based on current interest rates.The fair value of these reserves excludes life insurance-related elements of $1.3 billion in 1998 and 1997.
Investment Certificate Reserves: For variable rateinvestment certificates that reprice within a year, fair val-ues approximate carrying values. For other investmentcertificates, fair value is estimated using discounted cashflow analysis, based on current interest rates. The valua-tions are reduced by the amount of applicable surrendercharges and related loans.
Long-Term Debt: For variable rate long-term debtthat reprices within a year, fair values approximate carry-ing values. For other long-term debt, fair value isestimated using either quoted market prices or discountedcash flow based on the Company’s current borrowingrates for similar types of borrowing.
Separate Account Liabilities: Fair values of theseliabilities, after excluding life insurance-related elementsof $2.3 billion and $1.7 billion in 1998 and 1997,respectively, are estimated as the accumulated value lessapplicable surrender charges.
NOTE 9 S I G N I F I C A N T C R E D I T C O N C E N T R AT I O N S
A credit concentration may exist if customers areinvolved in similar industries. The Company’s customersoperate in diverse economic sectors. Therefore, manage-ment does not expect any material adverse consequences
to the Company’s financial position to result from creditconcentrations. Certain distinctions between categoriesrequire management judgment.
Under the 1998 Incentive Compensation Plan and prev-iously under the 1989 Long-Term Incentive Plan (thePlans), awards may be granted to officers and other keyemployees and other key individuals who perform ser-vices for the Company and its participating subsidiaries.These awards may be in the form of stock options, stockappreciation rights, restricted stock, performance grantsand other awards deemed by the Compensation and
Benefits Committee of the Board of Directors to be con-sistent with the purposes of the Plans. The Companyalso has options outstanding pursuant to a Directors’Stock Option Plan. Under these plans, there were a totalof 53.1 million, 25.9 million and 32.1 million commonshares available for grant at December 31, 1998, 1997and 1996, respectively. Each option has an exercise priceat least equal to the market price of the Company’s
December 31, (dollars in millions) 1998 1997
Financial institutions(a) $ 13,755 $ 13,074
Individuals(b) 82,762 74,708
U.S. Government and agencies(c) 15,836 16,706
All other 25,433 25,343
Total $ 137,786 $ 129,831
Composition:
On-balance sheet 65% 69%
Off-balance sheet 35 31
Total 100% 100%
(a) Financial institutions primarily include banks, broker-dealers, insurance companies and savings and loan associations.
(b) Charge Card products have no preset spending limit; therefore, the quantified credit amount includes only Cardmember receivables recorded on the ConsolidatedBalance Sheets.
(c) U.S. Government and agencies represent the U.S. Government and its agencies, states and municipalities, and quasi-government agencies.
NOTE 10 S T O C K P L A N S

47
common stock on the date of grant and a maximumterm of 10 years. Options generally vest at 331/3 per-cent per year. The Company also sponsors the AmericanExpress Incentive Savings Plan, under which purchasesof the Company’s common shares are made by or onbehalf of participating employees.
In 1998, the Compensation and Benefits Committeeadopted a restoration stock option program applicableto existing and future stock option awards. This programprovides that employees who exercise options that havebeen outstanding at least five years by surrendering pre-viously owned shares as payment will automaticallyreceive a new (restoration) stock option with an exerciseprice equal to the market price on the date of exercise.The size of the restoration option is equal to the num-ber of shares surrendered plus any shares surrendered orwithheld to satisfy the employees’ income tax require-ments. The term of the restoration option, which isexercisable six months after grant, is equal to the remain-ing life of the original option. Senior officers must be in
compliance with their stock ownership guidelines toexercise restoration options.
The Company granted 0.1 million, 1.4 million and1.4 million restricted stock awards with a weightedaverage grant date value of $88.97, $67.08 and $46.14per share for 1998, 1997 and 1996, respectively. Restric-tions generally expire four years from date of grant. Thecompensation cost that has been charged against incomefor the Company’s restricted stock awards was $36 mil-lion, $48 million and $39 million for 1998, 1997 and1996, respectively.
The Company has elected to follow APB OpinionNo. 25, “Accounting for Stock Issued to Employees,”and related Interpretations in accounting for its employeestock options. Therefore, no compensation cost has beenrecognized related to stock options. If the Company hadelected to account for its stock options under the fairvalue method of SFAS No. 123, “Accounting for Stock-Based Compensation,” the Company’s net income andearnings per common share would have been reduced tothe pro forma amounts indicated below:
(millions, except per share amounts) 1998 1997 1996
Net income:
As reported $ 2,141 $ 1,991 $ 1,901
Pro forma $ 2,060 $ 1,948 $ 1,877
Basic EPS:
As reported $ 4.71 $ 4.29 $ 4.02
Pro forma $ 4.53 $ 4.20 $ 3.96
Diluted EPS:
As reported $ 4.63 $ 4.15 $ 3.89
Pro forma $ 4.45 $ 4.07 $ 3.84
1998 1997 1996
Dividend yield 2.0% 2.6% 3.1%
Expected volatility 23% 20% 23%
Risk-free interest rate 5.5% 6.2% 5.9%
Expected life of stock option 5 years 5 years 7 years
The fair value of each option is estimated on the date ofgrant using a Black-Scholes option-pricing model withthe following weighted average assumptions used forgrants in 1998, 1997 and 1996, respectively:

48
The following table summarizes information about thestock options outstanding at December 31, 1998:
1998 1997 1996
(shares in thousands) Weighted Weighted WeightedAverage Average Average
Shares Exercise Price Shares Exercise Price Shares Exercise Price
Outstanding at beginning
of year 20,041 $ 44.32 21,116 $ 32.60 23,479 $ 27.41
Granted 11,494 $ 88.53 6,295 $ 66.74 5,778 $ 46.02
Exercised (4,410) $ 35.16 (6,566) $ 27.65 (7,104) $ 25.64
Forfeited/Expired (1,572) $ 65.87 (804) $ 48.12 (1,037) $ 38.49
Outstanding at end
of year 25,553 $ 64.46 20,041 $ 44.32 21,116 $ 32.60
Options exercisable at end
of year 9,718 $ 40.11 9,124 $ 30.58 10,641 $ 26.05
Options Outstanding Options Exercisable
(shares in thousands) WeightedAverage Weighted Weighted
Number Remaining Average Number AverageRange of Exercise Prices Outstanding Contractual Life Exercise Price Exercisable Exercise Price
$19.40 - $39.99 5,745 4.9 $ 28.65 5,745 $ 28.65
$40.00 - $49.99 3,686 7.1 $ 45.90 2,208 $ 45.88
$50.00 - $79.99 5,185 8.1 $ 66.61 1,575 $ 66.38
$80.00 - $113.97 10,937 8.9 $ 88.51 190 $ 101.71
$19.40 - $113.97 25,553 7.6 $ 64.46 9,718 $ 40.11
The dividend yield reflects the assumption that the cur-rent dividend payout will continue with no anticipatedincreases. The expected life of the options is based on his-torical data and is not necessarily indicative of exercisepatterns that may occur. The weighted average fair value
per option was $21.70, $14.76 and $11.43 for optionsgranted during 1998, 1997 and 1996, respectively.
A summary of the status of the Company’s stockoption plans as of December 31 and changes during eachof the years then ended is presented below:
NOTE 11 R E T I R E M E N T P L A N S
PENSION PLANS
In 1998, the FASB issued SFAS No. 132, “Employers’Disclosures about Pensions and Other PostretirementBenefits,” which revises employers’ disclosures about pen-sion and other postretirement benefit plans. The followingdisclosures reflect the requirements of the new rule.
The Company sponsors the American ExpressRetirement Plan (the Plan), a noncontributory definedbenefit plan, under which the cost of retirement benefitsfor eligible employees in the United States is measuredby length of service, compensation and other factors andis currently being funded through a trust. In addition,the Company sponsors an unfunded, nonqualified sup-plemental plan. Funding of retirement costs for the Plancomplies with the applicable minimum funding require-
ments specified by the Employee Retirement IncomeSecurity Act of 1974, as amended. Employees’ accruedbenefits are based on nominal account balances whichare maintained for each individual and are credited withadditions equal to a percentage, based on age plus service,of base pay, certain commissions and bonuses, overtimeand shift differential, each pay period. Employees’ bal-ances are also credited annually with a fixed rate ofinterest based on the daily average of published five-yearTreasury Note yields. Lump sum payout at terminationor retirement is available.
Most employees outside the United States are cov-ered by local retirement plans, some of which are funded,or receive payments at the time of retirement or termi-nation under applicable labor laws or agreements. Benefits

Net pension cost consisted of the followingcomponents:
49
under these local plans are generally expensed and are not funded.
Plan assets consist principally of equities and fixedincome securities.
(millions) 1998 1997 1996
Service cost $ 88 $ 76 $ 77
Interest cost 90 82 77
Expected return on plan assets (91) (86) (78)
Amortization of:
Prior service cost (9) (9) (9)
Transition obligation 1 1 2
Reversion gain (4) (4) (4)
Recognized net actuarial loss 3 — 4
Settlement/Curtailment gain (15) (11) (12)
Net periodic pension benefit cost $ 63 $ 49 $ 57
The funded status of the Company’s pension plans isbased on valuations as of September 30. The followingtables provide a reconciliation of the changes in theplans’ benefit obligation and fair value of assets:
Reconciliation of change in benefit obligation(millions) 1998 1997
Benefit obligation at October 1, $ 1,199 $ 1,040
Service cost 88 76
Interest cost 90 82
Benefits paid (43) (39)
Actuarial loss 156 103
Settlements/Curtailments (81) (40)
Foreign currency exchange rate changes 4 (23)
Benefit obligation at September 30, $ 1,413 $ 1,199
Reconciliation of change in fair value of plan assets(millions) 1998 1997
Fair value of plan assets at October 1, $ 1,279 $ 1,103
Actual return on plan assets 2 228
Employer contributions 47 39
Benefits paid (43) (39)
Settlements/Curtailments (71) (41)
Foreign currency exchange rate changes 2 (11)
Fair value of plan assets at September 30, $ 1,216 $ 1,279

50
The following table provides the amounts recognized onthe Consolidated Balance Sheets as of December 31:
The prior service costs are amortized on a straight-line basis over the average remaining service period ofactive participants. Gains and losses in excess of 10% ofthe greater of the benefit obligation and the market-related value of assets are amortized over the averageremaining service period of active participants.
The weighted average assumptions used in theCompany’s defined benefit plans were:
(millions) 1998 1997
Accrued benefit liability $ (294) $ (242)
Prepaid benefit cost 78 53
Intangible asset 14 10
Net amount recognized at December 31, $ (202) $ (179)
1998 1997
Discount rates 6.6% 7.3%
Rates of increase in compensation levels 4.1% 4.6%
Expected long-term rates of return on assets 9.3% 9.1%
The projected benefit obligation, accumulated benefitobligation and fair value of plan assets for the pensionplans with accumulated benefit obligations in excessof plan assets were $540 million, $477 million and$286 million, respectively, as of December 31, 1998,and $186 million, $153 million and $8 million, respec-tively, as of December 31, 1997.
OTHER POSTRETIREMENT BENEFITS
The Company sponsors postretirement benefit plans thatprovide health care, life insurance and other postretirementbenefits to retired U.S. employees. Net periodic post-retirement benefit expenses were $17 million, $15 millionand $18 million in 1998, 1997 and 1996, respectively.The liabilities recognized on the Consolidated BalanceSheets for the Company’s defined postretirement benefitplans (other than pension plans) at December 31, 1998and 1997 were $204 million.
The Company also has a defined contribution retirementplan, principally involving a profit sharing plan and a 401(k) savings plan, covering most employees in theUnited States. The defined contribution plan expensewas $106 million, $101 million and $98 million in1998, 1997 and 1996, respectively.
The following table reconciles the plans’ funded status to theamounts recognized on the Consolidated Balance Sheets:
Funded status(millions) 1998 1997
Funded status at September 30, $ (197) $ 80
Unrecognized net actuarial loss (gain) 38 (198)
Unrecognized prior service cost (67) (75)
Unrecognized net transition obligation 4 5
Fourth quarter contributions (net of benefit payments) 20 9
Net amount recognized at December 31, $ (202) $ (179)

51
(millions) 1998 1997 1996
Current $ 883 $ 824 $ 846
Deferred (99) (65) (83)
Total $ 784 $ 759 $ 763
(millions) 1998 1997
Deferred tax assets $ 2,921 $ 2,767
Deferred tax liabilities 1,680 1,609
Net deferred tax assets $ 1,241 $ 1,158
The Company’s net deferred tax assets at December 31 were:
No. 115 of $320 million and $318 million, respectively;and accelerated depreciation of $158 million and $150million, respectively.
The principal reasons that the aggregate income taxprovision is different from that computed by using theU.S. statutory rate of 35 percent are:
Deferred tax assets primarily reflect: reserves not yetdeducted for tax purposes of $1.8 billion for both yearsand deferred Cardmember fees of $225 million and$238 million at December 31, 1998 and 1997, respec-tively. Deferred tax liabilities for 1998 and 1997 mainlycomprise deferred acquisition costs of $853 million and$826 million, respectively; liabilities related to SFAS
The provisions for income taxes were:
(millions) 1998 1997 1996
Federal $ 465 $ 453 $ 468
State and local 35 46 74
Foreign 284 260 221
Total $ 784 $ 759 $ 763
aggregated $249 million, have not been provided onthose earnings.
The current and deferred components of the pro-vision for income taxes were:
Accumulated net earnings of certain foreign subsidiaries,which totaled $1.2 billion at December 31, 1998, areintended to be permanently reinvested outside the UnitedStates. Accordingly, federal taxes, which would have
NOTE 12 I N C O M E TA X E S
(millions) 1998 1997 1996
Combined tax at U.S. statutory rate $ 1,024 $ 962 $ 933
Changes in taxes resulting from:
Tax-exempt interest income (122) (132) (153)
Tax-exempt element of dividend income (38) (22) (22)
Foreign income taxed at rates other than
U.S. statutory rate (44) (13) (35)
State and local income taxes 23 29 47
All other (59) (65) (7)
Income tax provision $ 784 $ 759 $ 763
Net income taxes paid by the Company during 1998, 1997and 1996 were $977 million, $878 million and $548 mil-lion, respectively, and include estimated tax payments andcash settlements relating to prior tax years.
The items composing comprehensive income in theConsolidated Statements of Shareholders’ Equity arepresented net of income tax provision (benefit). The
changes in net unrealized securities gains are presentednet of tax provision (benefit) of $2 million, $104 mil-lion and ($263 million) for 1998, 1997 and 1996,respectively. Foreign currency translation adjustmentsare presented net of tax (benefits) of ($8 million),($4 million) and ($2 million) for 1998, 1997 and1996, respectively.

52
SFAS No. 128, “Earnings per Share,” requires the pre-sentation of basic and diluted earnings per common share(EPS) in the income statement. Under these require-ments, basic EPS is computed using the average actualshares outstanding during the period. Diluted EPS is
basic EPS adjusted for the dilutive effect of stock options,restricted stock awards (RSAs) and other securities thatmay be converted into common shares. The following isa reconciliation of the numerators and denominators ofthe basic and diluted EPS computations:
In the fourth quarter of 1996, the Company recorded a$138 million charge ($216 million pretax) primarily forrestructuring costs related to a series of reengineering ini-tiatives that were implemented in 1997. Of the total charge,$125 million ($196 million pretax) related to TRS,approximately two-thirds of which applied to internationalbusinesses. Most of the remaining $13 million ($20 mil-lion pretax) was due to the early retirement of debt at the
Corporate level. The pretax charge was included in OtherExpenses in the Consolidated Statements of Income. TheTRS restructuring charge included $109 million pretax inseverance costs and $87 million pretax to close certainleased facilities, to consolidate or outsource certain opera-tions and to write-down certain assets. As of December31, 1997, the Company had substantially completed allrestructuring activities.
(millions, except per share amounts) 1998 1997 1996
Numerator:Net income $ 2,141 $ 1,991 $ 1,901
Less: Preferred dividends — — 5
Numerator for basic EPS $ 2,141 $ 1,991 $ 1,896
Effect of dilutive securities:
7.75% Convertible Preferred Shares — — 5
Numerator for diluted EPS $ 2,141 $ 1,991 $ 1,901
Denominator: Denominator for basic EPS — weighted-average shares 454.4 464.2 472.2
Effect of dilutive securities: Stock Options and RSAs 8.3 8.8 8.2
5% Exchangeable Lehman Brothers Holdings, Inc.
Preferred Shares (see Note 6) — 6.1 6.2
7.75% Convertible Preferred Shares — — 1.6
Other 0.1 0.1 0.1
Potentially dilutive common shares 8.4 15.0 16.1
Denominator for diluted EPS 462.8 479.2 488.3
Basic EPS $ 4.71 $ 4.29 $ 4.02
Diluted EPS $ 4.63 $ 4.15 $ 3.89
NOTE 13 E A R N I N G S P E R C O M M O N S H A R E
NOTE 14 R E S T R U C T U R I N G C H A R G E

53
INDUSTRY SEGMENTS
In 1998, the Company adopted SFAS No. 131,“Disclosures about Segments of an Enterprise andRelated Information.” As a result, the Travelers Chequeoperations, which were previously included in the TRSsegment, have been reported in the same segment asAEB since January 1, 1998, consistent with our man-agement structure.
The Company is principally engaged in providingtravel related, financial advisory and international bank-ing services throughout the world. TRS’ products andservices include, among others, Charge Cards, consumerlending products, and corporate and consumer travel ser-vices. American Express Financial Advisors’ services and
products include financial planning and advice, invest-ment advisory services and a variety of products,including insurance and annuities, investment certificatesand mutual funds. American Express Bank/TravelersCheque (AEB/TC) products and services includeTravelers Cheques and providing correspondent, corpo-rate and private banking, consumer financial services andglobal trading. The Company operates on a global basis,although the principal market for financial advisory services is the United States.
The following table presents certain informationregarding these industry segments at December 31,1998, 1997 and 1996 and for each of the yearsthen ended.
NOTE 15 I N D U S T RY S E G M E N T S A N D G E O G R A P H I C O P E R AT I O N S
AmericanAmerican Express
Travel Express Bank/ Corporate AdjustmentsRelated Financial Travelers and and
(millions) Services Advisors Cheque Other Eliminations Consolidated
1998
Revenues $ 13,237 $ 5,095 $ 1,002 $ 112 $ (314) $ 19,132
Interest and dividends, net 283 2,437 620 103 (166) 3,277
Cardmember lending
net finance charge revenue 1,354 — — — — 1,354
Interest expense 959 21 28 149 (158) 999
Pretax income (loss) 2,064 1,192 (129) (202) — 2,925
Income tax provision (benefit) 700 374 (172) (118) — 784
Net income (loss) 1,364 818 43 (84) — 2,141
Assets $ 44,682 $ 64,637 $ 18,496 $ 3,606 $ (4,488) $ 126,933
1997
Revenues $ 12,214 $ 4,599 $ 1,124 $ 123 $ (300) $ 17,760
Interest and dividends, net 295 2,339 649 101 (209) 3,175
Cardmember lending
net finance charge revenue 1,244 — — — — 1,244
Interest expense 921 18 33 129 (177) 924
Pretax income (loss) 1,785 1,022 249 (306) — 2,750
Income tax provision (benefit) 621 315 (23) (154) — 759
Net income (loss) 1,164 707 272 (152) — 1,991
Assets $ 40,700 $ 59,828 $ 19,573 $ 3,374 $ (3,472) $ 120,003

54
Income tax provision (benefit) is calculated on a sepa-rate return basis; however, benefits from operating losses,loss carrybacks and tax credits (principally foreign taxcredits) recognizable for the Company’s consolidatedreporting purposes are allocated based upon the tax shar-ing agreement among members of the American ExpressCompany consolidated U.S. tax group.
Assets are those that are used or generated exclu-sively by each industry segment. The adjustments andeliminations required to determine the consolidatedamounts shown above consist principally of the elimi-nation of intersegment amounts.
Most services of the Company are provided on an inte-grated worldwide basis. Therefore, it is not practical toseparate precisely the U.S. and international services.
Accordingly, the data in the above table are, in part, basedupon internal allocations, which necessarily involve man-agement judgments.
AmericanAmerican Express
Travel Express Bank/ Corporate AdjustmentsRelated Financial Travelers and and
(millions) Services Advisors Cheque Other Eliminations Consolidated
1996
Revenues $ 11,357 $ 4,110 $ 1,066 $ 129 $ (282) $ 16,380
Interest and dividends, net 438 2,267 657 112 (185) 3,289
Cardmember lending
net finance charge revenue 1,068 — — — — 1,068
Interest expense 1,037 19 33 180 (153) 1,116
Pretax income 1,414 885 214 151 — 2,664
Income tax provision (benefit) 488 291 (33) 17 — 763
Net income 926 594 247 134 — 1,901
Assets $ 36,414 $ 52,670 $ 18,870 $ 3,158 $ (2,600) $ 108,512
AdjustmentsUnited and
(millions) States Europe Asia/Pacific All Other Eliminations Consolidated
1998
Revenues $ 14,535 $ 2,476 $ 1,332 $ 1,444 $ (655) $ 19,132
Pretax income (loss) $ 2,520 $ 340 $ (59) $ 124 — $ 2,925
1997
Revenues $ 13,449 $ 2,209 $ 1,378 $ 1,277 $ (553) $ 17,760
Pretax income $ 2,111 $ 219 $ 256 $ 164 — $ 2,750
1996
Revenues $ 12,107 $ 2,123 $ 1,355 $ 1,129 $ (334) $ 16,380
Pretax income $ 2,083 $ 210 $ 257 $ 114 — $ 2,664
GEOGRAPHIC OPERATIONS
The following table presents the Company’s revenues andpretax income (loss) in different geographic regions.

55
The Securities and Exchange Commission requires thedisclosure of certain restrictions on the flow of funds toa parent Company from its subsidiaries in the form ofloans, advances or dividends.
Restrictions on the transfer of funds exist underdebt agreements and regulatory requirements of certainof the Company’s subsidiaries. These restrictions havenot had any effect on the Company’s shareholder divi-dend policy and management does not anticipate anyeffect in the future.
At December 31, 1998, the aggregate amount ofnet assets of subsidiaries that may be transferred to theparent Company was approximately $6.8 billion. Shouldspecific additional needs arise, procedures exist to per-mit immediate transfer of short-term funds between theCompany and its subsidiaries, while complying with thevarious contractual and regulatory constraints on theinternal transfer of funds.
NOTE 17 T R A N S F E R O F F U N D S F R O M S U B S I D I A R I E S
NOTE 18 Q U A RT E R LY F I N A N C I A L D ATA ( U N A U D I T E D )
(millions, except per share amounts) 1998 1997
Quarter Ended 12/31 9/30 6/30 3/31 12/31 9/30 6/30 3/31
Revenues $ 5,062 $ 4,787 $ 4,761 $ 4,521 $ 4,674 $ 4,500 $ 4,422 $ 4,164
Pretax income 713 799 800 614 690 718 702 640
Net income 530 574 578 460 493 524 520 454
Earnings per common share:
Basic 1.18 1.27 1.27 1.00 1.07 1.13 1.12 .97
Diluted 1.16 1.25 1.24 .98 1.04 1.10 1.08 .94
Cash dividends declared per
common share .225 .225 .225 .225 .225 .225 .225 .225
Common share prices:
High 109.06 118.63 114.00 98.13 91.50 85.25 79.75 70.00
Low 67.00 68.00 91.88 78.38 72.00 73.69 57.50 53.63
The Company leases certain office facilities and operat-ing equipment under noncancellable and cancellableagreements. Total rental expense amounted to $388 mil-lion, $384 million and $397 million in 1998, 1997 and1996, respectively. At December 31, 1998, the minimumaggregate rental commitment under all noncancellableleases (net of subleases) was (millions): 1999, $290;
2000, $236; 2001, $201; 2002, $153; 2003, $113 andthereafter, $1,216.
The Company is not a party to any pending legalproceedings that, in the opinion of management, wouldhave a material adverse effect on the Company’s finan-cial position.
NOTE 16 L E A S E C O M M I T M E N T S A N D O T H E R C O N T I N G E N T L I A B I L I T I E S

56
The management of American Express Company (theCompany) is responsible for the preparation and fair pre-sentation of its consolidated financial statements, whichhave been prepared in conformity with generally acceptedaccounting principles appropriate in the circumstances,and include amounts based on the best judgment of man-agement. The Company’s management is also responsiblefor the accuracy and consistency of other financial infor-mation included in this annual report.
In recognition of its responsibility for the integrityand objectivity of data in the financial statements, theCompany maintains a system of internal control overfinancial reporting which is designed to provide reasonable,but not absolute, assurance with respect to the reliabilityof the Company’s financial statements. The concept ofreasonable assurance is based on the notion that the costof the internal control system should not exceed thebenefits derived.
The internal control system is founded on an ethi-cal climate and includes: (i) an organizational structure
REPORT OF MANAGEMENT
REPORT OF ERNST & YOUNG LLP INDEPENDENT AUDITORS
with clearly defined lines of responsibility, policies andprocedures, (ii) a Code of Conduct, and (iii) the carefulselection and training of employees. Internal auditorsmonitor and assess the effectiveness of the internal con-trol system and report their findings to management andthe Board of Directors throughout the year. TheCompany’s independent auditors are engaged to expressan opinion on the year-end financial statements and, withthe coordinated support of the internal auditors, reviewthe financial records and related data and test the inter-nal control system over financial reporting.
The Audit Committee of the Board of Directors,which has only outside directors, meets regularly withthe internal auditors, management and independentauditors to review their work and discuss the Company’sfinancial controls and audit and reporting practices. Theindependent auditors and the internal auditors indepen-dently have full and free access to the Committee, withoutthe presence of management, to discuss any matters whichthey feel require attention.
T H E S H A R E H O L D E R S A N D B O A R D O F D I R E C T O R S
O F A M E R I C A N E X P R E S S C O M PA N Y
We have audited the accompanying consolidated balancesheets of American Express Company as of December31, 1998 and 1997, and the related consolidated state-ments of income, shareholders’ equity, and cash flows foreach of the three years in the period ended December 31,1998. These financial statements are the responsibilityof the management of American Express Company. Ourresponsibility is to express an opinion on these financialstatements based on our audits.
We conducted our audits in accordance with gener-ally accepted auditing standards. Those standards requirethat we plan and perform the audit to obtain reasonableassurance about whether the financial statements are freeof material misstatement. An audit includes examining,on a test basis, evidence supporting the amounts and
disclosures in the financial statements. An audit alsoincludes assessing the accounting principles used andsignificant estimates made by management, as well asevaluating the overall financial statement presentation.We believe that our audits provide a reasonable basis forour opinion.
In our opinion, the financial statements referred toabove present fairly, in all material respects, the consoli-dated financial position of American Express Companyat December 31, 1998 and 1997, and the consolidatedresults of its operations and its cash flows for each of thethree years in the period ended December 31, 1998, inconformity with generally accepted accounting principles.
New York, New YorkFebruary 4, 1999

CONSOLIDATED F IVE-YEAR SUMMARY OF SELECTED F INANCIAL DATA
(millions, except per share amounts and where italicized) 1998 1997 1996 1995 1994
Operating ResultsRevenues $ 19,132 $ 17,760 $ 16,380 $ 15,921 $ 14,342Percent increase 8% 8% 3% 11% 8%Expenses 16,207 15,010 13,716 13,738 12,451Income from continuing operations:
As reported 2,141 1,991 1,901 1,564 1,380Adjusted(a) 2,201 1,991 1,739 1,564 1,380
Net income 2,141 1,991 1,901 1,564 1,413Return on average shareholders’ equity(b) 24.0% 23.5% 22.8% 22.0% 20.3%
Balance SheetCash and cash equivalents $ 4,092 $ 4,179 $ 2,677 $ 3,200 $ 3,433Accounts receivable and accrued interest, net 22,224 21,774 20,491 19,914 17,147Investments 41,299 39,648 38,339 42,561 40,108Loans, net 21,054 20,109 18,518 16,091 14,722Total assets 126,933 120,003 108,512 107,405 97,006Customers’ deposits 10,398 9,444 9,555 9,889 10,013Travelers Cheques outstanding 5,823 5,634 5,838 5,697 5,271Insurance and annuity reserves 25,433 26,165 25,674 25,157 24,849Short-term debt 22,605 20,570 18,402 17,654 14,810Long-term debt 7,019 7,873 6,552 7,570 7,162Shareholders’ equity 9,698 9,574 8,528 8,220 6,433
Common Share StatisticsEarnings per share from continuing operations:
Basic $ 4.71 $ 4.29 $ 4.02 $ 3.19 $ 2.74Basic adjusted(a) $ 4.84 $ 4.29 $ 3.67 $ 3.19 $ 2.74Diluted $ 4.63 $ 4.15 $ 3.89 $ 3.10 $ 2.69Diluted adjusted(a) $ 4.76 $ 4.15 $ 3.56 $ 3.10 $ 2.69Percent increase (decrease):Basic 10% 7% 26% 16% (16%)Basic adjusted (a) 13% 17% 15% 16% 17%Diluted 12% 7% 25% 15% (15%)Diluted adjusted(a) 15% 17% 15% 15% 16%
Earnings per share:Basic $ 4.71 $ 4.29 $ 4.02 $ 3.19 $ 2.81Diluted $ 4.63 $ 4.15 $ 3.89 $ 3.10 $ 2.75
Cash dividends declared per share:Actual $ .90 $ .90 $ .90 $ .90 $ .925Pro forma $ .90 $ .90 $ .90 $ .90 $ .90
Book value per share: Actual $ 21.53 $ 20.53 $ 18.04 $ 16.60 $ 12.57Pro forma(b) $ 20.24 $ 19.29 $ 17.22 $ 14.79 $ 13.35
Market price per share:High $ 118.63 $ 91.50 $ 60.38 $ 45.13 $ 32.00Low $ 67.00 $ 53.63 $ 38.63 $ 29.00 $ 23.17Close $ 102.50 $ 89.25 $ 56.50 $ 41.38 $ 29.50
Average common shares outstandingfor earnings per share:Basic 454 464 472 485 492Diluted 463 479 488 499 512
Shares outstanding at year end 450 466 473 483 496Number of shareholders of record 51,597 53,576 55,803 57,010 60,520
Other StatisticsNumber of employees at year end:
United States 50,266 44,691 43,688 41,700 43,421Outside United States 34,466 28,929 28,611 28,647 28,991
Total 84,732 73,620 72,299 70,347 72,412
Note: Historical common share prices for 1994 have been adjusted to reflect the Lehman spin-off at a ratio based on the trading prices of the Company’s commonshares and shares of Lehman common stock on May 31, 1994. Pro forma cash dividends declared have also been adjusted to reflect the Lehman spin-off.
(a) 1998 is adjusted to exclude the following first quarter items: $138 million credit loss provision at American Express Bank relating to its Asia/Pacific portfolio, aswell as income of $78 million representing gains on the sale of First Data Corporation shares and a preferred dividend based on Lehman Brothers’ earnings.1996is adjusted to exclude a $300 million gain on the exchange of the Company’s DECS and a $138 million restructuring charge.
(b) Return on average shareholders’ equity is based on adjusted income from continuing operations in 1996 and excludes the effect of SFAS No. 115. In addition,book value per share excludes the effect of SFAS No. 115.
57

5858
I N F O R M AT I O N R E L AT I N G T O F O RWA R D - L O O K I N G S TAT E M E N T S
This Annual Report includes forward-looking statements.These are subject to certain risks and uncertainties, includ-ing those identified below, which could cause actual resultsto differ materially from such statements. The words“believe,” “expect,” “anticipate,” “optimistic,” “intend,”“aim,” “will” and similar expressions identify forward-looking statements. Readers are cautioned not to placeundue reliance on these forward-looking statements,which speak only as of the date on which they are made.American Express Company undertakes no obligation toupdate publicly or revise any forward-looking statements.Factors that could cause actual results to differ materiallyfrom the forward-looking statements, including theCompany’s goals referred to herein, include but are notlimited to the inability of American Express Companyto: (i) extend the value of the American Express brand tothe financial services industry, (ii) succeed in its ongoingreengineering efforts and in achieving best-in-class eco-nomics while also maintaining high service levels,(iii) increase distribution channels for financial, travel,card and other products and services, (iv) invest success-fully in, and compete at the leading edge of, technologyacross all businesses, (v) expand its overall revenues, whichdepend in part on its ability to increase consumer and/or
business spending on its credit and charge cards, gain mar-ket share and develop new or enhanced products thatcapture a greater share of customers’ total spending onAmerican Express Cards and other cards issued on itsnetwork, and enhance significantly its international oper-ations, (vi) retain Cardmembers in consumer lendingproducts after low introductory rate periods have expired,(vii) sustain premium discount rates, (viii) increase mer-chant coverage, (ix) manage effectively consumer debt,business loans and other credit exposures in the U.S. andabroad, including unseasoned balances in its new lendingportfolios, all of which could be affected by general eco-nomic conditions, including interest rates, consumercredit trends, the rate of bankruptcies and movements incurrency valuations, (x) increase AEFA’s field force andimprove its mutual fund performance, (xi) adequatelyaddress its Y2K issues, successfully identify its systemscontaining two digit codes, the nature and amount ofprogramming required to fix the affected systems and thecosts of labor and consultants related to such effort, con-tinue to have access to such resources and ensure thatthird parties that interface with the Company successfullyaddress their Y2K issues and (xii) successfully developand implement a single company-wide interactive strategy.

59
THE PLANNING AND POLICY COMMITTEE
O F F I C E O F T H E C H I E F E X E C U T I V E
HARVEY GOLUB
Chairman and Chief Executive Officer
KENNETH I . CHENAULT
President and Chief Operating Officer
RICHARD KARL GOELTZ
Vice Chairman and Chief Financial Officer
JONATHAN S . LINEN
Vice Chairman
B U S I N E S S E X E C U T I V E S
STEVEN W. ALESIO
PresidentSmall Business Servicesand Consumer Travel
ANNE M. BUSQUET
PresidentAmerican Express Relationship Services
JAMES M. CRACCHIOLO
PresidentTRS International
EDWARD P. GILLIGAN
PresidentCorporate Services
DAVID C . HOUSE
PresidentEstablishment Services Worldwide
DAVID R. HUBERS
President and Chief Executive OfficerAmerican Express Financial Advisors
ALFRED F. KELLY, JR .
PresidentConsumer Card Services Group
JOHN A. WARD, III
Chairman and Chief Executive OfficerAmerican Express Bank; HeadTravelers Cheque Group
C O R P O R AT E E X E C U T I V E S
URSULA F. FAIRBAIRN
Executive Vice PresidentHuman Resources and Quality
JOHN D. HAYES
Executive Vice PresidentGlobal Advertising
ALLAN Z . LOREN
Executive Vice President andChief Information Officer
LOUISE M. PARENT
Executive Vice President andGeneral Counsel
THOMAS SCHICK
Executive Vice President Corporate Affairs and Communications

60
BOARD OF DIRECTORS
DANIEL F. AKERSON
Chairman and Chief Executive OfficerNextel Communications, Inc.
ANNE L . ARMSTRONG
Regent Texas A&M University System
EDWIN L . ARTZT
Chairman of the Executive CommitteeThe Procter & Gamble Company
WILLIAM G . BOWEN
PresidentThe Andrew W. Mellon Foundation
KENNETH I . CHENAULT
President and Chief Operating OfficerAmerican Express Company
ROBERT L . CRANDALL*
Former Chairman and Chief Executive OfficerAMR Corporation and American Airlines
CHARLES W. DUNCAN, JR . **
ChairmanDuncan Interests
HARVEY GOLUB
Chairman and Chief Executive OfficerAmerican Express Company
BEVERLY SILLS GREENOUGH
ChairmanLincoln Center for the Performing Arts
F. ROSS JOHNSON
Chairman and Chief Executive OfficerRJM Group
VERNON E . JORDAN, JR .
Senior Executive PartnerAkin, Gump, Strauss, Hauer & Feld, LLP
JAN LESCHLY
Chief ExecutiveSmithKline Beecham PLC
DREW LEWIS
Former Chairman and Chief Executive OfficerUnion Pacific Corporation
RICHARD A. McGINN
Chairman, Chief Executive Officer and PresidentLucent Technologies, Inc.
FRANK P. POPOFF
Chairman of the BoardThe Dow Chemical Company
A D V I S O R S T O T H E B O A R D O F D I R E C T O R S
HON. GERALD R. FORD
Former President of the United States of America
ROBERT L . GENILLARD
Vice Chairman of the Supervisory BoardTBG Holdings N.V.
HENRY A. KISSINGER
Chairman, Kissinger Associates, Inc.Former Secretary of State of the United States of America
* Effective March 1, 1999.**Having reached retirement age, Mr. Duncan is not standing for reelection.

Various forward-looking statements are made in this Annual Report, which generally include the words “believe,” “expect,” “anticipate,”
“optimistic,” “intend,” “aim,” “will” and similar expressions. Certain factors that may affect these forward-looking statements, including
American Express Company’s ability to achieve its goals referred to herein, are discussed on page 58.
AMERICAN EXPRESS COMPANY
American Express Company is a global travel, financial and network services provider. Founded in1850, the Company serves individuals with charge and credit cards, Travelers Cheques and other storedvalue products. It also offers financial planning, brokerage services, mutual funds, insurance and otherinvestment products.
Through its family of Corporate Card services, American Express helps companies and institutionsmanage their travel, entertainment and purchasing expenses. It provides investment management servicesand administers pension and other employee benefit plans. The Company also offers accounting andtax preparation services to small businesses, and financial education services to employees at their placesof work.
As the world’s largest travel agency, American Express offers travel and related consulting services toindividuals and corporations around the globe. The Company also provides banking services to wealthyindividuals, retail customers, corporations and financial institutions outside the United States.
EXECUTIVE OFFICESAmerican Express Company200 Vesey StreetNew York, New York 10285212-640-2000
INFORMATION AVAILABLE ONTHE INTERNETCopies of the Company’s Form 10-K,proxy statement and other documents, aswell as information on financial results,products, services and Company pressreleases are available through theAmerican Express home page on theInternet at the following address:www.americanexpress.com.
INFORMATION AVAILABLE ON REQUESTCopies of the Company’s Form 10-K filed with the Securities and ExchangeCommission, philanthropic grants andpolitical contributions for 1998 are avail-able without charge upon written requestto the Secretary’s Office at the aboveaddress.
TRANSFER AGENT ANDREGISTRARChaseMellon Shareholder Services, L.L.C.Overpeck Centre85 Challenger RoadRidgefield Park, New Jersey 076601-800-463-5911 or 201-329-8660Hearing Impaired:1-800-231-5469 or 201-329-8354www.chasemellon.com
STOCK EXCHANGE LISTINGSCommon Shares:New York Stock Exchange (Symbol: AXP)Chicago Stock ExchangePacific Stock ExchangeLondon Stock ExchangeSwiss Stock ExchangeDusseldorf Stock ExchangeFrankfurt Stock ExchangeParis Stock Exchange
INDEPENDENT AUDITORSErnst & Young LLP787 Seventh AvenueNew York, New York 10019
ANNUAL MEETINGThe Annual Meeting of Shareholders ofAmerican Express Company will be heldat the executive offices of the Company,200 Vesey Street, New York, New York10285, on Monday, April 26, 1999 at10:00 a.m., local time. A written tran-script or an audio cassette of the meetingwill be available upon written request tothe Secretary’s Office. There will be amodest fee to defray production and mail-ing costs.
DIRECT DEPOSIT OFDIVIDENDSThe Company has established anElectronic Direct Deposit of Dividendsservice for the electronic payment ofquarterly dividends on the Company’scommon shares. With this service, regis-tered shareholders may have their dividendpayments sent electronically to their check-ing account or financial institution on thepayment date.
Shareholders interested in enrolling in thisservice should call ChaseMellon at 1-800-463-5911.
STOCK PURCHASE PLANThe Company’s Shareholder’s Stock Pur-chase Plan provides shareholders and newinvestors with a convenient way to purchasecommon shares through cash contributionsand reinvestment of dividends.
For a prospectus and other inquiriesregarding the Shareholder’s Stock PurchasePlan, contact:
The Chase Manhattan Bankc/o ChaseMellon Shareholder Services,L.L.C.P.O. Box 3336So. Hackensack, NJ 076061-800-842-7629
SHAREHOLDER AND INVESTOR INQUIRIESWritten shareholder inquiries may be sent either to ChaseMellon ShareholderServices, L.L.C., P.O. Box 3315, So.Hackensack, NJ 07606 or to theSecretary’s Office, American ExpressCompany, 200 Vesey Street, New York,New York 10285. Written inquiries fromthe investment community should be sentto Investor Relations, American ExpressCompany, at the above address.
TRADEMARKS AND SERVICE MARKSThe following trademarks, service marksand copyrighted material of AmericanExpress Company and its affiliates appearin the text of this report:ADVISORLINKTM
AMERICAN EXPRESS Box Logo®
AMERICAN EXPRESS Box Logo and Sunburst DesignSM
AMERICAN EXPRESS Card Design®
AMERICAN EXPRESS CORPORATE
Card Design®
AMERICAN EXPRESS
Travelers Cheque Design®
AMERICAN EXPRESS
WORLD SERVICE & Design®
AXI®
CENTURIONSM
Gladiator Head®
MEMBERSHIP REWARDS®
OPTIMA®
PLATINUM CARD®
©1998 American Express CompanyAll rights reserved.
Printed on premium grade recycled paper;fully recyclable.
GENERAL INFORMATION
DE
SIG
N:
Belk
Mign
ogna
Asso
ciates
, New
York
PH
OT
OG
RA
PH
Y:G
raha
m H
aber,
pro
duct
photo
grap
hy, J
ohn
Abbo
tt, ex
ecutiv
e pho
togra
phP
RIN
TIN
G:
Gra
phic
Arts
Cen
ter


