16
American Express (NYSE: AXP) An Analysis and Valuation of American Express By James Cullen April 23rd, 2008
| Date post: | 12-Nov-2014 |
| Category: |
Documents |
| Upload: | collegeanalysts |
| View: | 813 times |
| Download: | 1 times |
American Express
(NYSE: AXP)
An Analysis and Valuation of
American Express By James Cullen
April 23rd, 2008
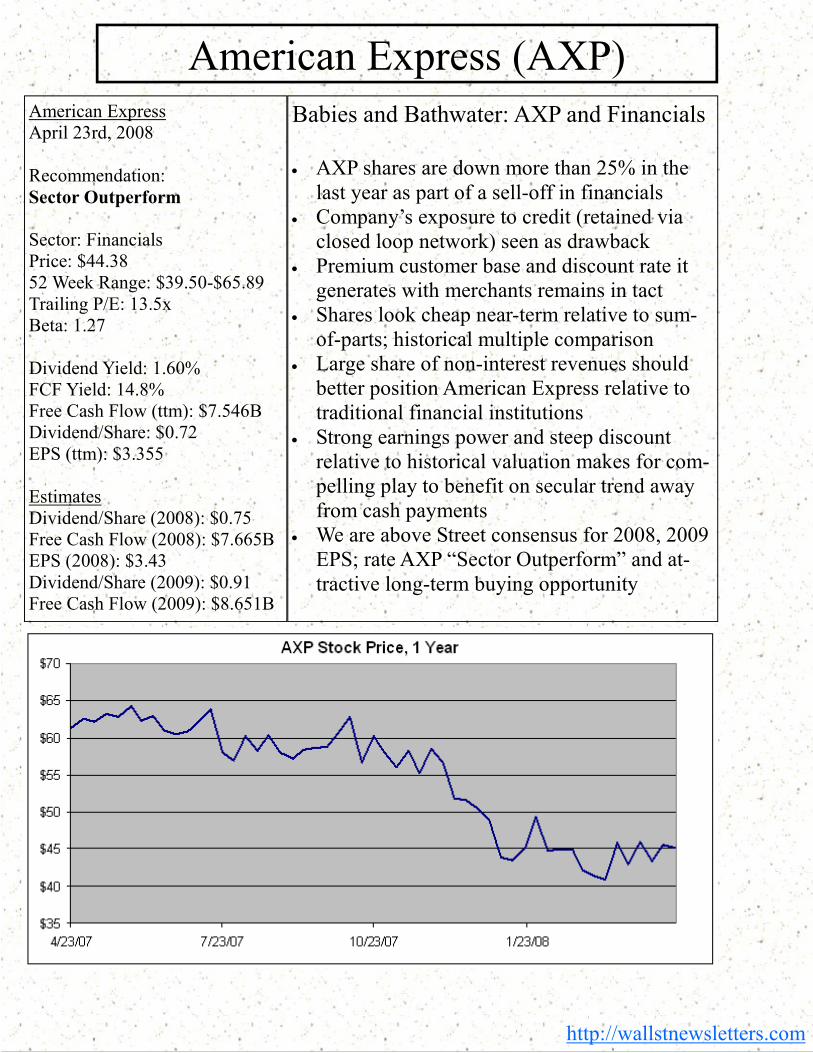
American Express April 23rd, 2008 Recommendation: Sector Outperform
Sector: Financials Price: $44.38 52 Week Range: $39.50-$65.89 Trailing P/E: 13.5x Beta: 1.27 Dividend Yield: 1.60% FCF Yield: 14.8% Free Cash Flow (ttm): $7.546B Dividend/Share: $0.72 EPS (ttm): $3.355 Estimates Dividend/Share (2008): $0.75 Free Cash Flow (2008): $7.665B EPS (2008): $3.43 Dividend/Share (2009): $0.91 Free Cash Flow (2009): $8.651B
American Express (AXP) Babies and Bathwater: AXP and Financials • AXP shares are down more than 25% in the last year as part of a sell-off in financials
• Company’s exposure to credit (retained via closed loop network) seen as drawback
• Premium customer base and discount rate it generates with merchants remains in tact
• Shares look cheap near-term relative to sum-of-parts; historical multiple comparison
• Large share of non-interest revenues should better position American Express relative to traditional financial institutions
• Strong earnings power and steep discount relative to historical valuation makes for com-pelling play to benefit on secular trend away from cash payments
• We are above Street consensus for 2008, 2009 EPS; rate AXP “Sector Outperform” and at-tractive long-term buying opportunity
http://wallstnewsletters.com
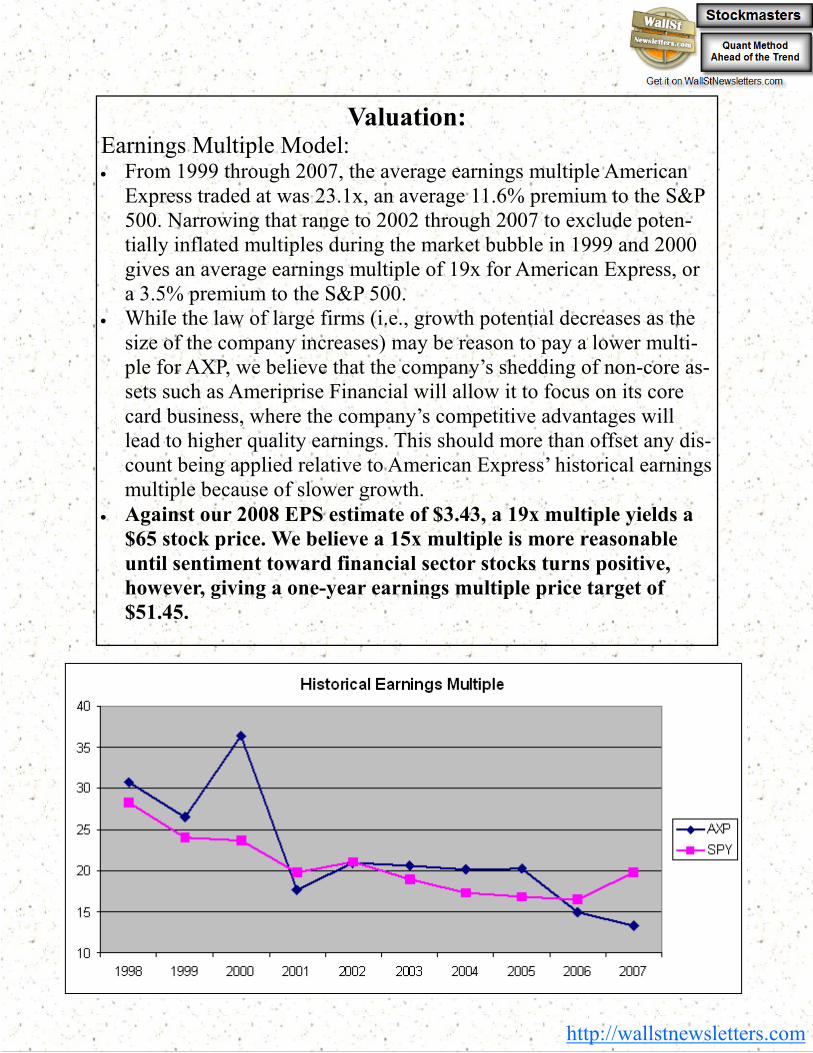
Valuation: Earnings Multiple Model: • From 1999 through 2007, the average earnings multiple American Express traded at was 23.1x, an average 11.6% premium to the S&P 500. Narrowing that range to 2002 through 2007 to exclude poten-tially inflated multiples during the market bubble in 1999 and 2000 gives an average earnings multiple of 19x for American Express, or a 3.5% premium to the S&P 500.
• While the law of large firms (i.e., growth potential decreases as the size of the company increases) may be reason to pay a lower multi-ple for AXP, we believe that the company’s shedding of non-core as-sets such as Ameriprise Financial will allow it to focus on its core card business, where the company’s competitive advantages will lead to higher quality earnings. This should more than offset any dis-count being applied relative to American Express’ historical earnings multiple because of slower growth.
• Against our 2008 EPS estimate of $3.43, a 19x multiple yields a
$65 stock price. We believe a 15x multiple is more reasonable
until sentiment toward financial sector stocks turns positive,
however, giving a one-year earnings multiple price target of
$51.45.
http://wallstnewsletters.com
Valuation: Relative Valuation Model: • As a unique company in the financial services industry, we feel it is most appropriate to use a sum-of-parts valuation because American Express has no one natural comparable. Unlike major competitors Visa and MasterCard, American Express acts as more than a pay-ment processor and carries card member loans on its balance sheet. While this exposes it to credit and interest rate risk and has resulted in the company’s shares being punished by the markets, we believe that the long-term value of this approach will eventually be realized. Our sum-of-parts thus takes into account American Express’ interest stream, its non-interest streams, as well as the fees generated by its travel business.
Non-interest related: • MasterCard trades for approximately 26x operating earnings and is estimated to grow at 19% annually by analysts over the next five years. Because American Express’ long-term growth target is ap-proximately half that rate, we will apply a 13x multiple to non-interest operating earnings from American Express. We derive non-interest operating earnings by taking the sum of next year’s esti-mated revenues from discount fees, net card fees, and other commis-sions and fees, and subtracting all expenses due to MPRS, as well as expenses related to HR, professional services, occupancy & equip-ment and communications by the weighted average of revenues at-tributable to non-interest earnings (approximately 76% in 2008). This yields a value for non-interest earnings of $61.9 billion.
Interest-related: • According to Yahoo Finance’s sector overview, “Financials” as a group trade for 11x net earnings; using a standard 35% tax rate im-plies that the group trades for 7.15x operating income. To derive in-terest-related income, we use a process roughly similar to that of non-interest related income – first finding interest revenue plus secu-ritization income net of expenses and loss provisions, then subtract
http://wallstnewsletters.com
Valuation: Relative Valuation Model: • ing out costs related to HR, professional services, occupancy & equipment as well as communications by the weighted average of revenues attributable to interest-related earnings (approximately 24% in 2008). This value is currently negative by nearly $1.5 billion due to the unusually large loss provisions being realized in this year. To account for that, we have averaged the estimated interest-related stream in 2008 with the estimated interest-related stream in 2012, which yields a value of negative $950 million, which we multiply by the 7.15x operating income multiple given to financials. This yields a cumulative negative value of $6.8 billion for American Express’ interest-related earnings.
Travel Commissions: • Expedia trades at a price-to-sales ratio of 2.6x, with analyst consen-sus estimates being for growth of roughly 12% annually over the next five years. We estimate travel commissions for American Ex-press will grow at about 3.5% over the long-term, and adjust the P/S multiple of Expedia to account for American Express’ slower growth. The net value is 0.76x sales, which we apply to 2008 esti-mated revenues for the segment to attain a value of $1.7 billion.
Other: • We apply a 5x multiple to net operating income attributable to other, undisclosed operations. We feel this multiple is appropriate because it leaves a margin of safety to account for the difficulty in estimating these inflows and outflows, even though we believe they will remain positive over time.
The summation of the values of the above segments is $59.4 billion,
relative to American Express’ current market capitalization value
of approximately $51 billion. This implies the sum-of-parts value of
American Express is $51/share, or 16% above the current market
price.
http://wallstnewsletters.com
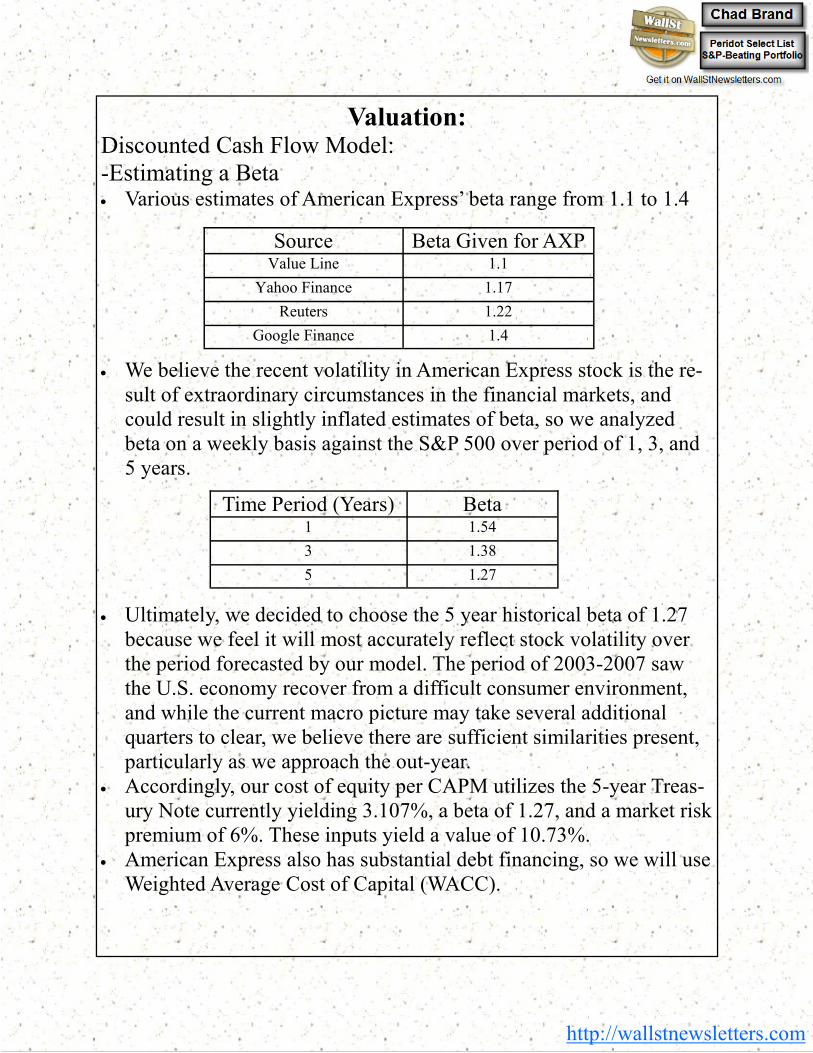
Valuation: Discounted Cash Flow Model: -Estimating a Beta • Various estimates of American Express’ beta range from 1.1 to 1.4 • We believe the recent volatility in American Express stock is the re-sult of extraordinary circumstances in the financial markets, and could result in slightly inflated estimates of beta, so we analyzed beta on a weekly basis against the S&P 500 over period of 1, 3, and 5 years.
• Ultimately, we decided to choose the 5 year historical beta of 1.27 because we feel it will most accurately reflect stock volatility over the period forecasted by our model. The period of 2003-2007 saw the U.S. economy recover from a difficult consumer environment, and while the current macro picture may take several additional quarters to clear, we believe there are sufficient similarities present, particularly as we approach the out-year.
• Accordingly, our cost of equity per CAPM utilizes the 5-year Treas-ury Note currently yielding 3.107%, a beta of 1.27, and a market risk premium of 6%. These inputs yield a value of 10.73%.
• American Express also has substantial debt financing, so we will use Weighted Average Cost of Capital (WACC).
Source Beta Given for AXP Value Line 1.1
Yahoo Finance 1.17
Reuters 1.22
Google Finance 1.4
Time Period (Years) Beta 1 1.54
3 1.38
5 1.27
http://wallstnewsletters.com
Valuation: Discounted Cash Flow Model: -Estimating WACC • With our cost of equity of 10.73%, we must now find the cost of debt and the weightings of the two.
• In 2007, American Express had total Interest Expense of $3.826 bil-lion. The combined average of short-term and long-term debt was $65.478 billion, implying an average cost of debt of 5.843%.
• Taking the respective weightings of the financings and accounting for their costs, along with any tax benefits, gives a weighted average cost of capital for the company of 7%.
-Estimating Value • To estimate operating cash flow relative to net income, we looked at the historical relationship between the two. Since 2002, the range has been between 0.757x and 3.081x; removing the highest and low-est values leaves a much tighter range of 2.096x to 2.627x. We then applied a simple linear regression, projecting the relationship from 2004 through 2007 into the future.
• To estimate CapEx, we looked at the relationship between CapEx and Operating Cash Flow. CapEx as a percentage of OCF was 8.4% in 2006 and 10.4% in 2007, so our forward estimate of CapEx spending is a simple average equal to 9.4% of OCF.
• From our out-year of 2012, we applied a 2% terminal long-term growth target to FCF; while this rate is slightly below the long-term growth target of the US economy, we feel it is reasonable to leave a discount given the inherently difficult nature of forecasting business trends far into the future.
• Taking the sum of the present value of the cash flows and netting out debt leaves an estimated value of $98.753 billion. Against our esti-mate of shares outstanding in 2012, this would give a long-term fair value target of $93/share.
http://wallstnewsletters.com
Valuation: Discounted Cash Flow Model: -Is $93/share Reasonable? • Given the size of the discrepancy between the current market price ($44) and our long-term fair value target given by DCF, this is a rea-sonable question to ask.
• If American Express were to achieve a $93/share price in 2012, it would amount to a capital gains return of more than 110% (excludes dividends). This annualizes out to a 16% return; and unless the broader markets were to undergo a nearly unprecedented bull run, this would likely result in significant alpha generation for the Ameri-can Express shareholder.
• Another way to think of this is to consider what American Express’ stock price might be in 2012 under the earnings multiple methodol-ogy, as delineated earlier.
• Our 2012 EPS estimate is $6.82; a 19x multiple (AXP’s historical earnings multiple over the last decade, excluding bubble years) would yield a $129.50 stock. The present value of that amount, dis-counted back at 7%? $92.36.
http://wallstnewsletters.com
Recommendation: Short-Term: • Shares of American Express, like most financial companies, have been out of favor with the market over the last year.
• Concerns over the quality of the company’s loan portfolio have been central to the bearish argument on American Express; the company has had to take increased loss provisions against rising delinquencies and defaults.
• At the same time, we do not see American Express as being a lender first and a processor second. As shown in our relative valuation, 76% of revenues are non-interest related, and this (along with the premium cardholder base) is where the value is.
• Market sentiment right now greatly favors the pure-play processors (i.e. Mastercard, Visa) over companies with any exposure to credit (i.e. American Express). It will take some time for that to change. Still, we see undeniable strength in the American Express brand, and feel that it will be one of the best performers among large-cap finan-cial stocks.
• Our short-term price target is $51/share, in-line with the projections of our earnings multiple model and relative valuation.
• Our 2008 EPS estimate of $3.43 is above Street consensus ($3.34), and our 2009 EPS estimate of $3.95 is also above Street consensus ($3.64) and on the top end of the range ($3.15 to $4.00).
• Accordingly, we rate American Express as a “Sector Outperform”
http://wallstnewsletters.com
Risk Analysis: Firm Risks: • As electronic forms of payment have increased market share, the fees charged by payment processors have come under increased scrutiny. If legislation were to be put in place capping or otherwise regulating these fees, it could have a substantial adverse impact on American Express’ profitability.
• Card companies are seeking growth by moving “down market” to capture smaller transactional amounts typically paid for in cash (i.e. convenience store purchases). American Express has introduced its swipe-less “ExpressPay” feature to try to take advantage of this op-portunity. This is an unconventional niche and there is no guarantee American Express will prove successful in profiting off of it.
• American Express retains card member loans, and thus is subject to credit/repayment risk.
Capital Structure: • American Express has a debt/equity ratio of 6.623 • While this is high relative to traditional hard-goods companies, this is not excessive given the business American Express operates in.
• Like other financials, American Express essentially makes short-term loans to consumers which it funds with a combination of short– and long-term borrowing. While customer repayment rates have his-torically been very good, there are signs of rising delinquencies and defaults by AmEx card holders. This has resulted in greater loss pro-visions being taken, impairing the profitability of lending.
• While higher loss provisions are not good for the company, we would note that American Express’ spend-centric model means it uses its lending activities to drive higher discount fee revenues, and thus the immediate profitability of lending operations is not of pri-mary concern.
http://wallstnewsletters.com
Recommendation: Long-Term: • If American Express shares approach our long-term fair value esti-mate as given by the discounted cash flow analysis, the stock would likely outperform any broader market benchmark by a substantial amount.
• We believe American Express is a unique financial company with sustainable competitive advantages that will allow it to earn above-average profits over the long-term. Companies of this caliber de-serve premium valuations to the broader market, something the mar-ket is currently not rewarding American Express with.
• American Express has a tradition of rewarding shareholders by cre-ating value over the long-term. This is consistent with our assess-ment that the company possesses significant sustainable competitive advantages. We believe this will eventually be acknowledged by the market as financials move back into favor. As explained in our earn-ings multiple model, an average earnings multiple for American Ex-press of about 19x is reasonable. Against out-year (2012) EPS esti-mates of $6.82, this gives a stock price of $129.50, or a present value of $93/share discounted back to present at WACC of 7%.
• As noted in our short-term outlook, our earnings estimates are on the top end of analyst ranges. Regardless of specific EPS forecasts, we believe the key driver of American Express’ stock price will be an earnings multiple expansion that should take place once concerns about consumer spending and loan portfolios clear. For the patient investor, we believe this stock will be an excellent addition to a port-folio seeking exposure to the financial sector via high-quality com-panies with dependable earnings streams.
• Five-year fair value target: $93/share
http://wallstnewsletters.com
Model Forecasting: Methodology: Discount Fees:
American Express has targeted 8-10% intermediate-term growth in this segment. We believe that 2008 revenues will come in on the low end of that range at 8%, as spend-conscious consumers pull back on overall spending and the mix moves toward lower end merchants, where a lower discount rate is realized. Additionally, the spend-centric nature of American Express cards should add some additional pressure here, as more stressed consumers should favor lend-centric cards (i.e. Visa, MasterCard) where carrying a balance is typical. However, we believe the company’s guidance is reasonable as the economic cycle moderates toward more normalized times.
Net Card Fees:
Average fee per card has consistently trended down as consumer de-mand trends have shifted to a desire for “no annual fee.” American Ex-press has responded by offering a variety of cards with no annual fee, and this shift in card mix has resulted in only nominal growth in net card fees since 2005. Because of the demographics of American Ex-press’ clientele, and the value added by the company’s premium cards that carry an annual fee, we do not believe this source of revenue is high risk, but we do not believe it will grow substantially in the future either. We have estimated 1% annual growth for this segment through-out our model.
Travel Commissions:
Our outlook for this segment is cautious given the slowing economy and tightened budgets by both businesses and consumers. While we be-lieve this area adds value to American Express as a whole, we antici-pate slow growth (1% this year, 3% in 2009, and 4% in years 2010-2012) as cost pressures and increased competition (i.e. online discount players) push the marginal consumer away from American Express for travel services.
http://wallstnewsletters.com
Model Forecasting: Methodology: Other Commissions + Fees:
We assume 4% annual growth, a slightly conservative estimate of American Express’ ability to continue generating service fees, earn spreads on foreign currency exchanges, and other charges.
Securitization:
Because this segment revenue correlates closely with total billed busi-ness and discount fees, we believe its growth will move roughly in-line with discount fees. Given the cautious nature of the credit market for structured finance products, however, we are going to assume securiti-zation revenues grow at a rate equal to discount fee growth less 100 ba-sis points.
Other Revenues:
Our 3% annual growth estimate assumes the company’s other opera-tions grow at roughly the rate of the U.S. economy over the long-term.
Lending Finance:
Like securitization, revenues in this segment are closely correlated to total billed business and discount fees. Unlike securitization, however, these revenues have a direct cost – interest expense – that will be ad-dressed separately. Our assumptions for growth in lending finance reve-nues are equal to those of discount fee growth.
Interest Expense: Net finance revenue/average loans moves roughly opposite the interest rate cycle, as American Express can borrow at a less expensive rate while the fixed interest income associated with lending to card mem-bers stays relatively constant as a percentage. With the yield curve at fairly low rates - approximately 2% - on the short end, this should help American Express earn a slightly greater spread on its lending activi-ties. While these gains will likely be offset, and then some, by the need
http://wallstnewsletters.com
Model Forecasting: Methodology: for greater loss provisions and charge-offs, that will be addressed sepa-rately. Thus, we estimate total interest expense will grow at a rate equal to that of discount fees less 25 basis points in 2008 and 2009, and at the rate of discount fees plus 25 basis points in 2011 and 2012.
Marketing, Promo, Rewards + Services:
This expense has recently averaged about 50% of discount rate reve-nues, a number which should hold fairly constant over time with some scaling advantages to be found in marketing realized over time. For 2010 and 2011, we assume this will decrease to 49% of discount fee revenues, and in 2012 we assume this will be 48% of discount fee reve-nues.
HR and Professional Services: Our model assumes 5% annual growth to account for increased head-count and necessary cost-of-living adjustments to existing employees.
Occupancy & Equipment:
We believe a 4% annual increase in expense here from 2008-2010 as the company continues to build out its infrastructure is reasonable, with the annual increase dropping 100 basis points to 3% in years 2011-2012 as the company benefits from the scalability of operations.
Communications:
We believe 2% annual growth here is a reasonable estimate, given that competition from the supply-side has historically weighed down the potential for cost increases.
Other Expenses, Net:
We assume 4% annual growth, net of $280 million annually in pay-ments due from the Visa settlement which should be realized in each of
http://wallstnewsletters.com
Bear, Stearns and Co.; February 7th, 2008 Research Update on American Express
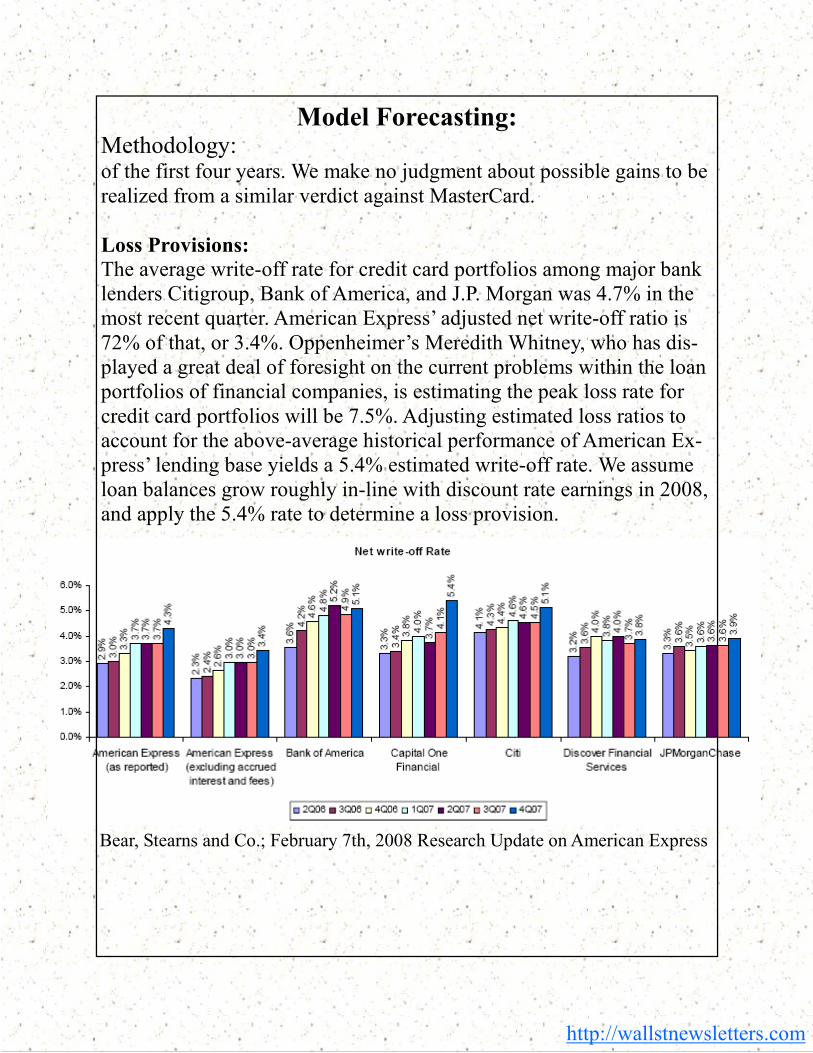
Model Forecasting: Methodology: of the first four years. We make no judgment about possible gains to be realized from a similar verdict against MasterCard.
Loss Provisions:
The average write-off rate for credit card portfolios among major bank lenders Citigroup, Bank of America, and J.P. Morgan was 4.7% in the most recent quarter. American Express’ adjusted net write-off ratio is 72% of that, or 3.4%. Oppenheimer’s Meredith Whitney, who has dis-played a great deal of foresight on the current problems within the loan portfolios of financial companies, is estimating the peak loss rate for credit card portfolios will be 7.5%. Adjusting estimated loss ratios to account for the above-average historical performance of American Ex-press’ lending base yields a 5.4% estimated write-off rate. We assume loan balances grow roughly in-line with discount rate earnings in 2008, and apply the 5.4% rate to determine a loss provision.
http://wallstnewsletters.com

Notes and Disclosures
• This report is by no means a recommendation to take action for
your personal portfolio. It is recommended that you consult your own investment, legal, and/or tax advisor before acting on any
information contained within this report. Failure to seek profes-
sional, personally tailored advice before acting could lead you to
act in a manner contrary to your best interests; consequences
include but are not limited to loss of money. • Equity valuation involves the use of theoretical pricing models
and estimates of factors such as future earnings growth and eco-
nomic trends, none of which are guaranteed to be accurate.
• At the time of this report, the author and/or his family owned shares of American Express (AXP), however, the author reserves
the right to change his position at a later date without notice.
• This report was prepared independently, and the author has no
relationship with American Express. All opinions, estimates, and/
or other subjective statements are the author’s own. • To contact the author, email James Cullen at [email protected]
http://wallstnewsletters.com


![American Express Co. (NYSE: AXP) [Type text] Sector: Financials · 2014. 9. 12. · American Express is very selective with whom they issue cards to. There are fewer transactions](https://static.documents.pub/doc/80x56/613ec995c500cf75ab361ce3/american-express-co-nyse-axp-type-text-sector-financials-2014-9-12-american.jpg)


