46
American Express Fixed Investor Presentation February 2012
American Express Fixed Investor Presentation
February 2012
■ AXP Overview
■ Performance
■ AXP Capital & Funding Management
Agenda
2
AXP Franchise
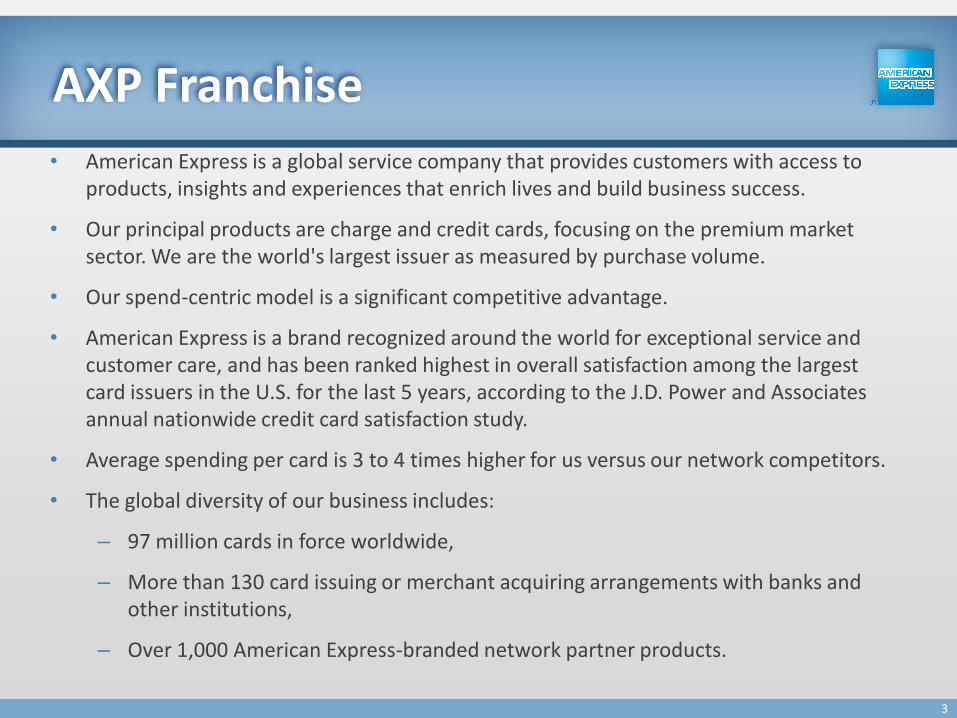
• American Express is a global service company that provides customers with access to products, insights and experiences that enrich lives and build business success.
• Our principal products are charge and credit cards, focusing on the premium market sector. We are the world's largest issuer as measured by purchase volume.
• Our spend-centric model is a significant competitive advantage.
• American Express is a brand recognized around the world for exceptional service and customer care, and has been ranked highest in overall satisfaction among the largest card issuers in the U.S. for the last 5 years, according to the J.D. Power and Associates annual nationwide credit card satisfaction study.
• Average spending per card is 3 to 4 times higher for us versus our network competitors.
• The global diversity of our business includes:
– 97 million cards in force worldwide,
– More than 130 card issuing or merchant acquiring arrangements with banks and other institutions,
– Over 1,000 American Express-branded network partner products.
3
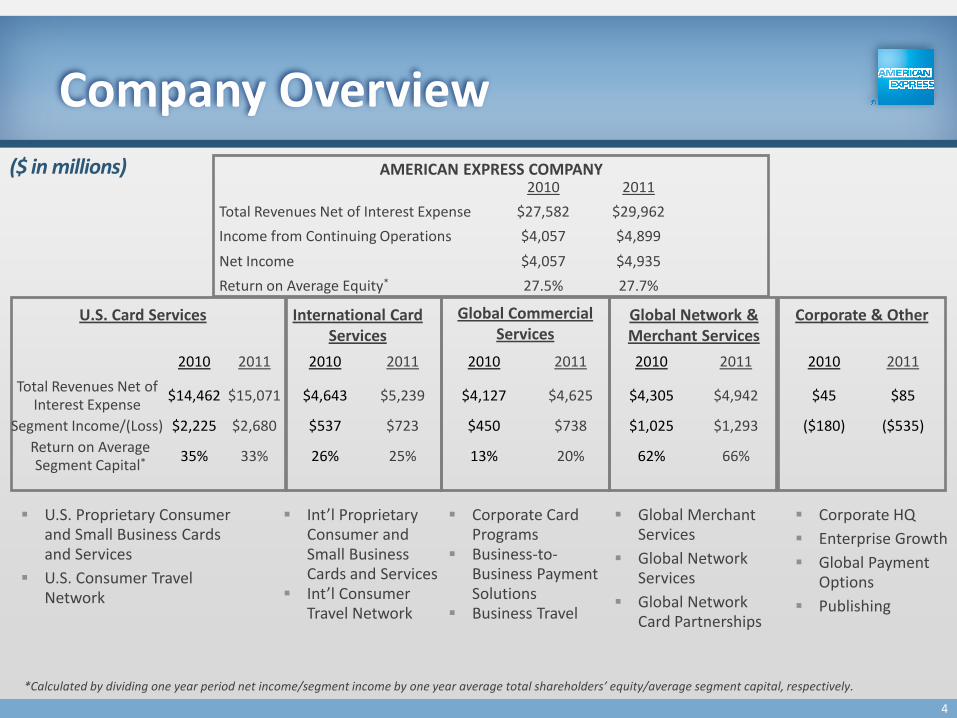
2010 2011
Total Revenues Net of Interest Expense $27,582 $29,962
Income from Continuing Operations $4,057 $4,899
Net Income $4,057 $4,935
Return on Average Equity* 27.5% 27.7%
AMERICAN EXPRESS COMPANY
*Calculated by dividing one year period net income/segment income by one year average total shareholders’ equity/average segment capital, respectively.
U.S. Proprietary Consumer and Small Business Cards and Services
U.S. Consumer Travel Network
Int’l Proprietary Consumer and Small Business Cards and Services
Int’l Consumer Travel Network
Global Merchant Services
Global Network Services
Global Network Card Partnerships
Corporate HQ
Enterprise Growth
Global Payment Options
Publishing
Corporate & Other
U.S. Card Services
International Card Services
Global Network & Merchant Services
Global Commercial Services
2010 2011 2010 2011 2010 2011 2010 2011 2010 2011
Total Revenues Net of Interest Expense
$14,462 $15,071 $4,643 $5,239 $4,127 $4,625 $4,305 $4,942 $45 $85
Segment Income/(Loss) $2,225 $2,680 $537 $723 $450 $738 $1,025 $1,293 ($180) ($535)
Return on Average Segment Capital* 35% 33% 26% 25% 13% 20% 62% 66%
Corporate Card Programs
Business-to-Business Payment Solutions
Business Travel
($ in millions)
Company Overview
4
5
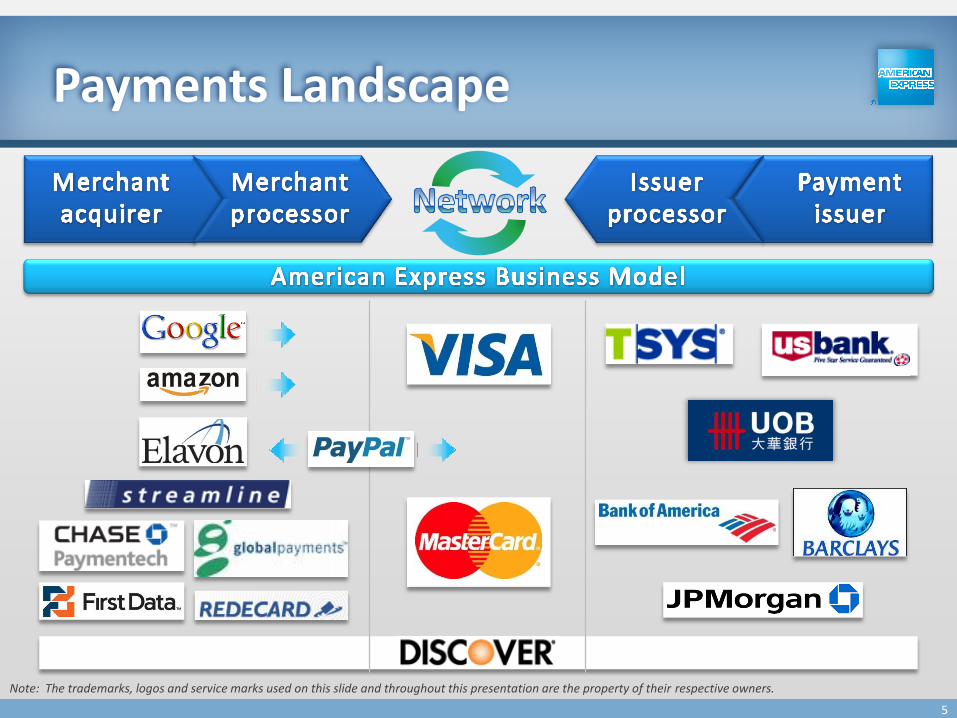
Payments Landscape
Note: The trademarks, logos and service marks used on this slide and throughout this presentation are the property of their respective owners.
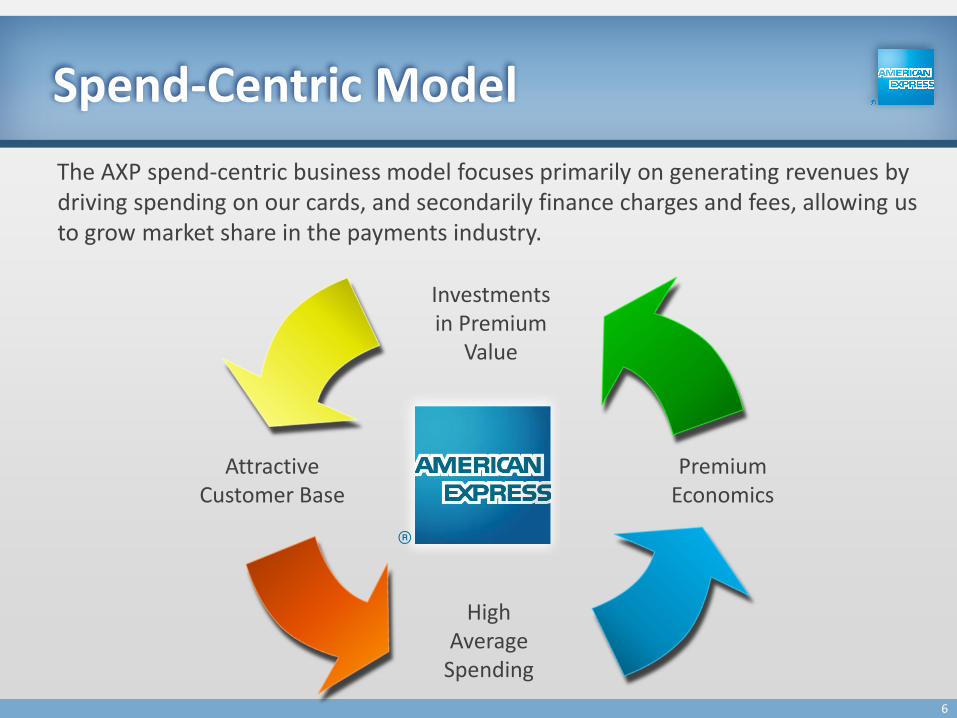
Spend-Centric Model
High Average
Spending
Investments in Premium
Value
Premium Economics
Attractive Customer Base
The AXP spend-centric business model focuses primarily on generating revenues by driving spending on our cards, and secondarily finance charges and fees, allowing us to grow market share in the payments industry.
6
■ AXP Overview
■ Performance
■ AXP Capital & Funding Management
Agenda
7
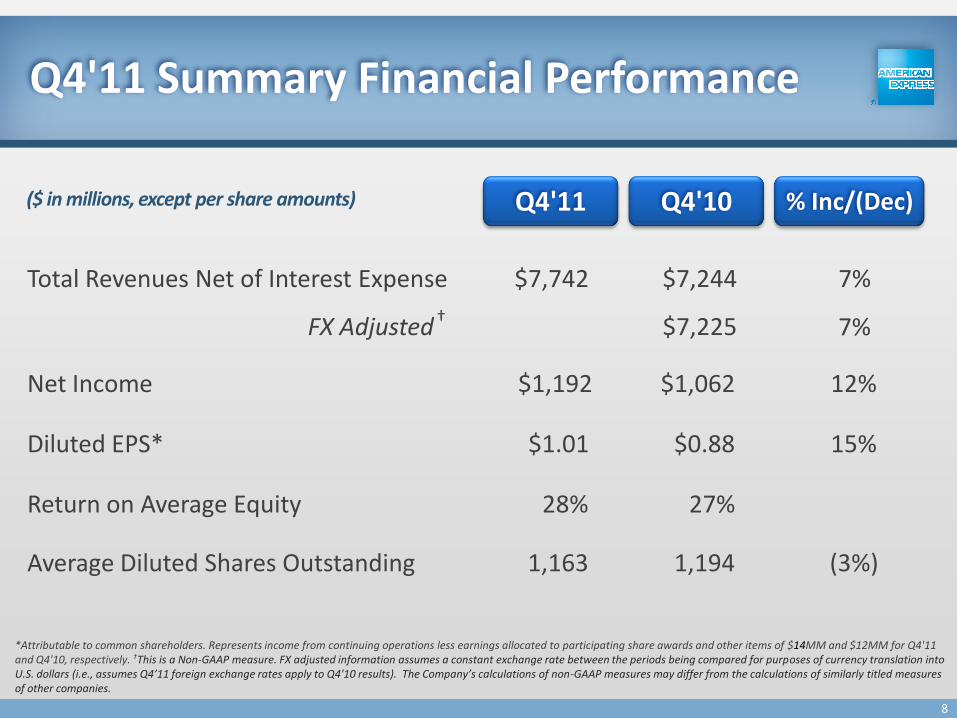
Q4'11 Summary Financial Performance
Total Revenues Net of Interest Expense
Return on Average Equity
Net Income
Diluted EPS*
12%
7% $7,244
27%
$1,062
$7,742
15% $0.88 $1.01
28%
$1,192
(3%) 1,194 1,163 Average Diluted Shares Outstanding
($ in millions, except per share amounts)
*Attributable to common shareholders. Represents income from continuing operations less earnings allocated to participating share awards and other items of $14MM and $12MM for Q4'11 and Q4'10, respectively. †This is a Non-GAAP measure. FX adjusted information assumes a constant exchange rate between the periods being compared for purposes of currency translation into U.S. dollars (i.e., assumes Q4’11 foreign exchange rates apply to Q4'10 results). The Company’s calculations of non-GAAP measures may differ from the calculations of similarly titled measures of other companies.
Q4'11 Q4'10 % Inc/(Dec)
FX Adjusted 7% †
$7,225
8
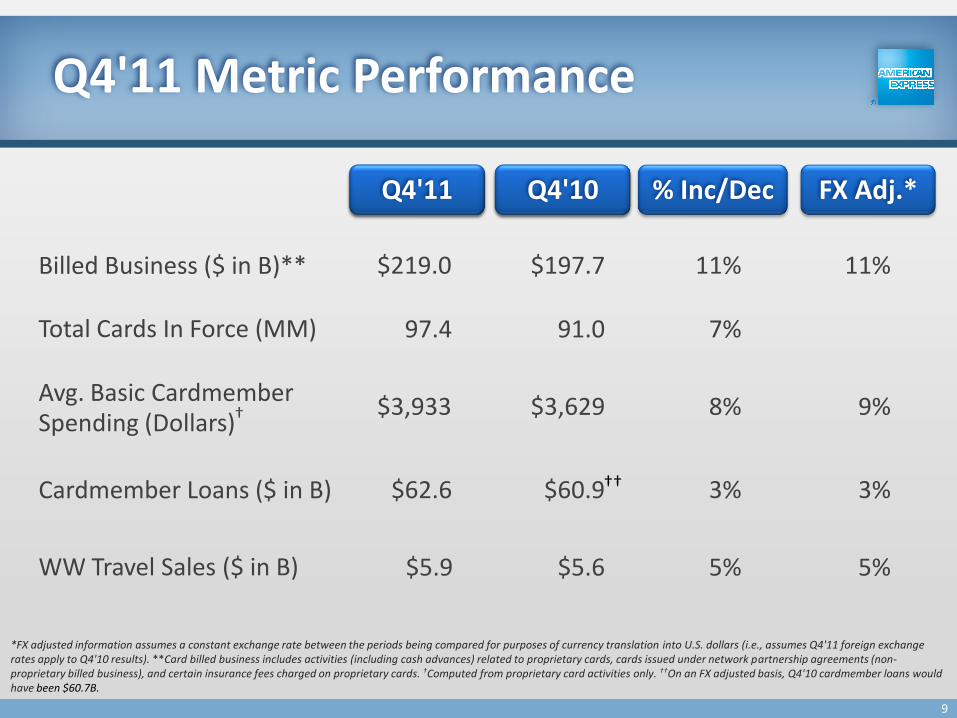
Q4'11 Metric Performance
Billed Business ($ in B)**
Total Cards In Force (MM)
Avg. Basic Cardmember Spending (Dollars)
*FX adjusted information assumes a constant exchange rate between the periods being compared for purposes of currency translation into U.S. dollars (i.e., assumes Q4'11 foreign exchange rates apply to Q4'10 results). **Card billed business includes activities (including cash advances) related to proprietary cards, cards issued under network partnership agreements (non-proprietary billed business), and certain insurance fees charged on proprietary cards. †Computed from proprietary card activities only. ††On an FX adjusted basis, Q4'10 cardmember loans would have been $60.7B.
WW Travel Sales ($ in B)
$219.0
97.4
$62.6
$3,933
11%
7%
3%
8%
$197.7
91.0
$60.9
$5.9 5% $5.6
$3,629
11%
9%
Cardmember Loans ($ in B)
5%
3% ††
1Q'10 1Q'09 FX Adj.* Q4'11 Q4'10
†
% Inc/Dec
9
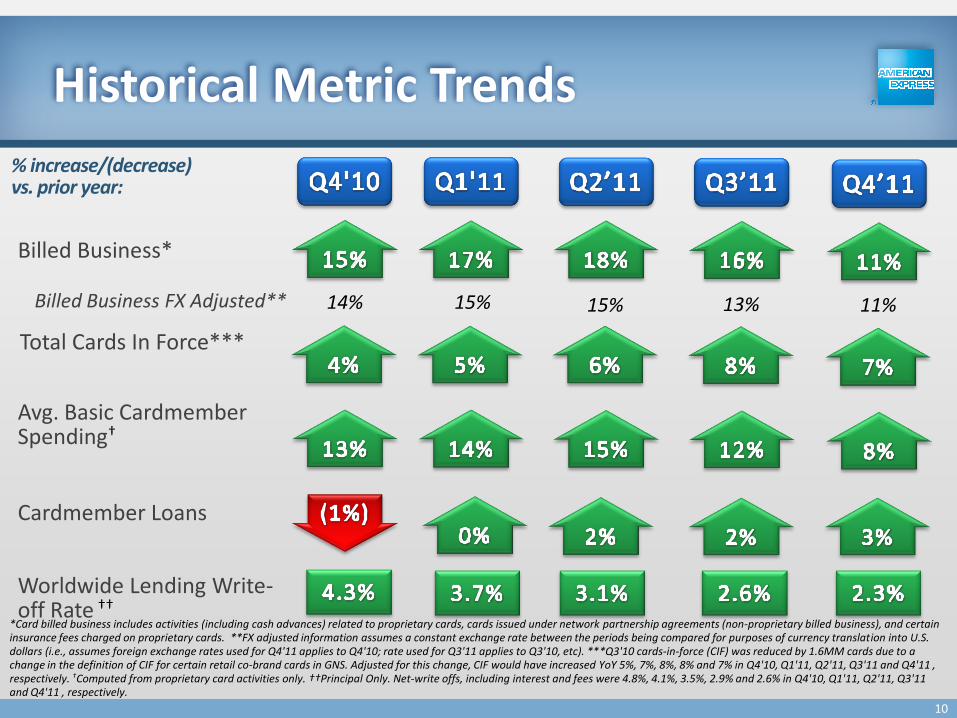
Historical Metric Trends
Cardmember Loans
Worldwide Lending Write-off Rate ††
Avg. Basic Cardmember Spending†
Total Cards In Force***
*Card billed business includes activities (including cash advances) related to proprietary cards, cards issued under network partnership agreements (non-proprietary billed business), and certain insurance fees charged on proprietary cards. **FX adjusted information assumes a constant exchange rate between the periods being compared for purposes of currency translation into U.S. dollars (i.e., assumes foreign exchange rates used for Q4'11 applies to Q4'10; rate used for Q3'11 applies to Q3'10, etc). ***Q3'10 cards-in-force (CIF) was reduced by 1.6MM cards due to a change in the definition of CIF for certain retail co-brand cards in GNS. Adjusted for this change, CIF would have increased YoY 5%, 7%, 8%, 8% and 7% in Q4'10, Q1'11, Q2'11, Q3'11 and Q4'11 , respectively. †Computed from proprietary card activities only. ††Principal Only. Net-write offs, including interest and fees were 4.8%, 4.1%, 3.5%, 2.9% and 2.6% in Q4'10, Q1'11, Q2'11, Q3'11 and Q4'11 , respectively.
Billed Business*
% increase/(decrease) vs. prior year:
10
Billed Business FX Adjusted** 14% 15% 15% 13% 11%
(25%)
(15%)
(5%)
5%
15%
25%
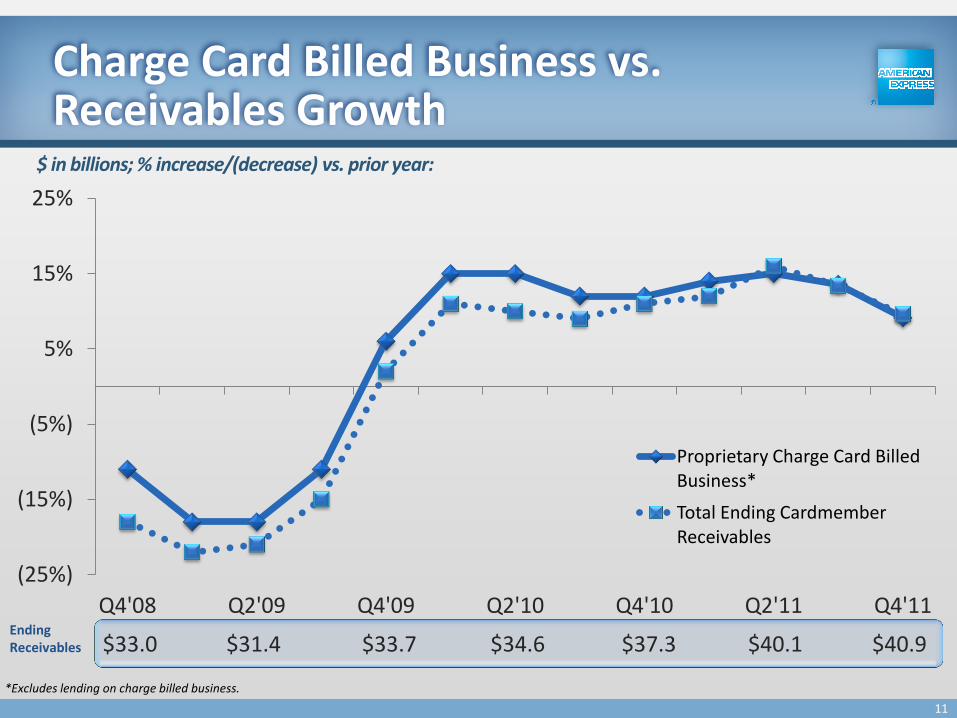
Q4'08 Q2'09 Q4'09 Q2'10 Q4'10 Q2'11 Q4'11
Proprietary Charge Card Billed Business*
Total Ending Cardmember Receivables
$ in billions; % increase/(decrease) vs. prior year:
*Excludes lending on charge billed business.
Charge Card Billed Business vs. Receivables Growth
Ending Receivables $33.0 $31.4 $33.7 $34.6 $37.3 $40.1 $40.9
11
(25%)
(15%)
(5%)
5%
15%
25%
Q4'08 Q2'09 Q4'09 Q2'10 Q4'10 Q2'11 Q4'11
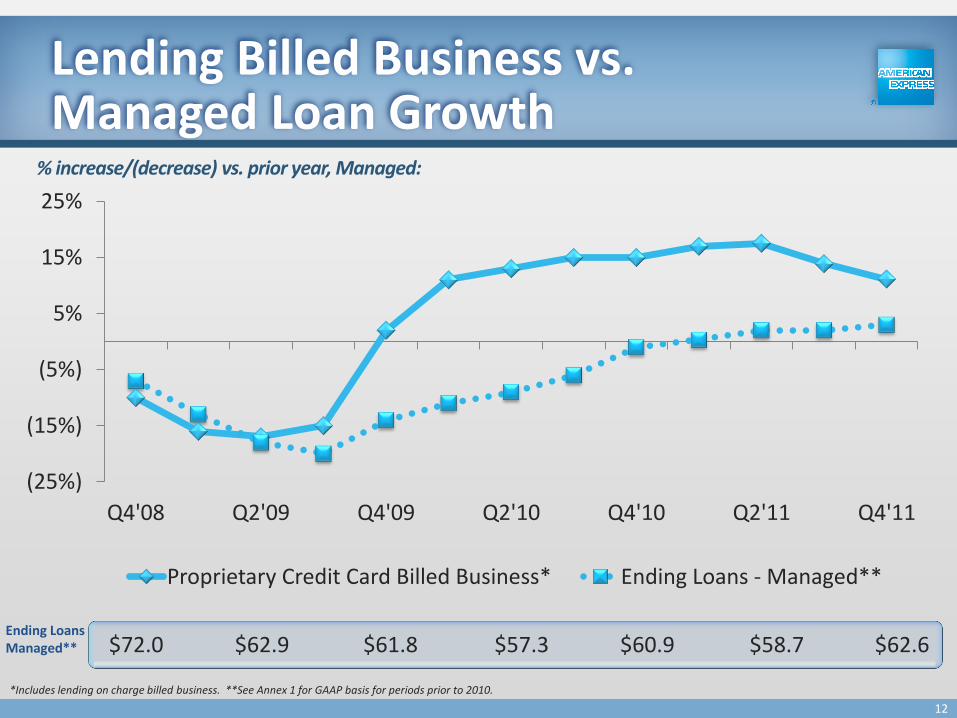
Proprietary Credit Card Billed Business* Ending Loans - Managed**
% increase/(decrease) vs. prior year, Managed:
*Includes lending on charge billed business. **See Annex 1 for GAAP basis for periods prior to 2010.
Lending Billed Business vs. Managed Loan Growth
Ending Loans Managed**
$72.0 $62.9 $61.8 $57.3 $60.9 $58.7 $62.6
12

9.1% 9.1% 8.7% 9.0% 8.9%
Q4'10 Q1'11 Q2'11 Q3'11 Q4'11
USCS Net Interest Yield Managed Cardmember Loans
See Annex 2 for reconciliation of net interest income divided by average loans, a GAAP measure, and net interest yield, a non-GAAP measure.
$51.6 $49.2 $49.9 $49.9 $53.7
$ in billions; Total Cardmember Loans, Managed
13
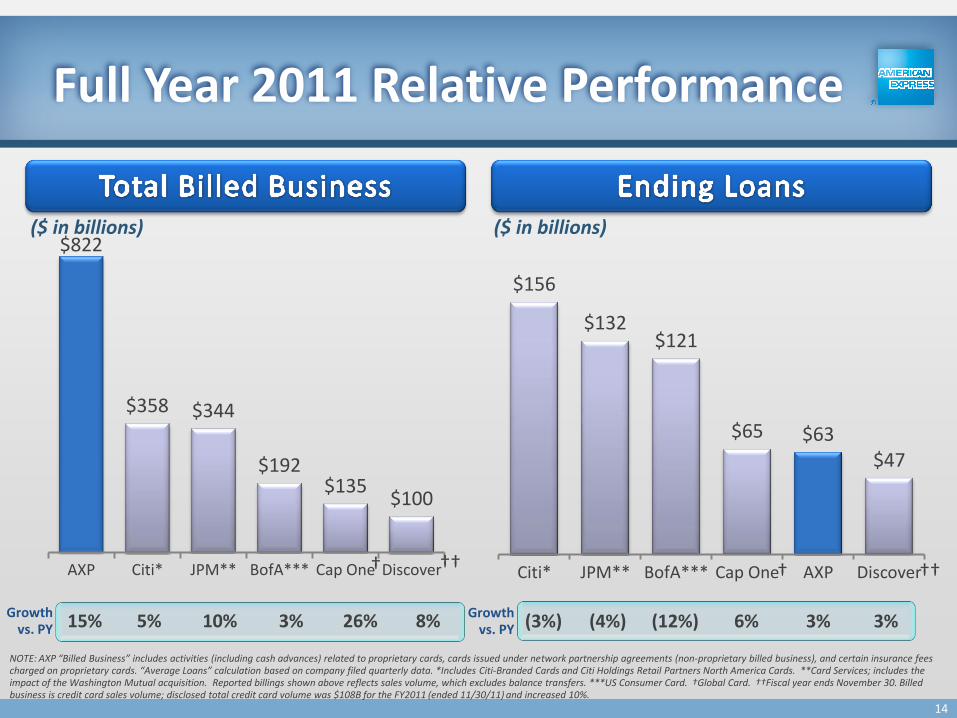
Growth vs. PY 15% 5% 10% 3% 26% 8%
$822
$358 $344
$192 $135
$100
AXP Citi* JPM** BofA*** Cap One Discover
($ in billions)
$156
$132 $121
$65 $63 $47
Citi* JPM** BofA*** Cap One AXP Discover
Full Year 2011 Relative Performance
NOTE: AXP “Billed Business” includes activities (including cash advances) related to proprietary cards, cards issued under network partnership agreements (non-proprietary billed business), and certain insurance fees charged on proprietary cards. “Average Loans” calculation based on company filed quarterly data. *Includes Citi-Branded Cards and Citi Holdings Retail Partners North America Cards. **Card Services; includes the impact of the Washington Mutual acquisition. Reported billings shown above reflects sales volume, which excludes balance transfers. ***US Consumer Card. †Global Card. ††Fiscal year ends November 30. Billed business is credit card sales volume; disclosed total credit card volume was $108B for the FY2011 (ended 11/30/11) and increased 10%.
Growth vs. PY (3%) (4%) (12%) 6% 3% 3%
($ in billions)
† †† † ††
14
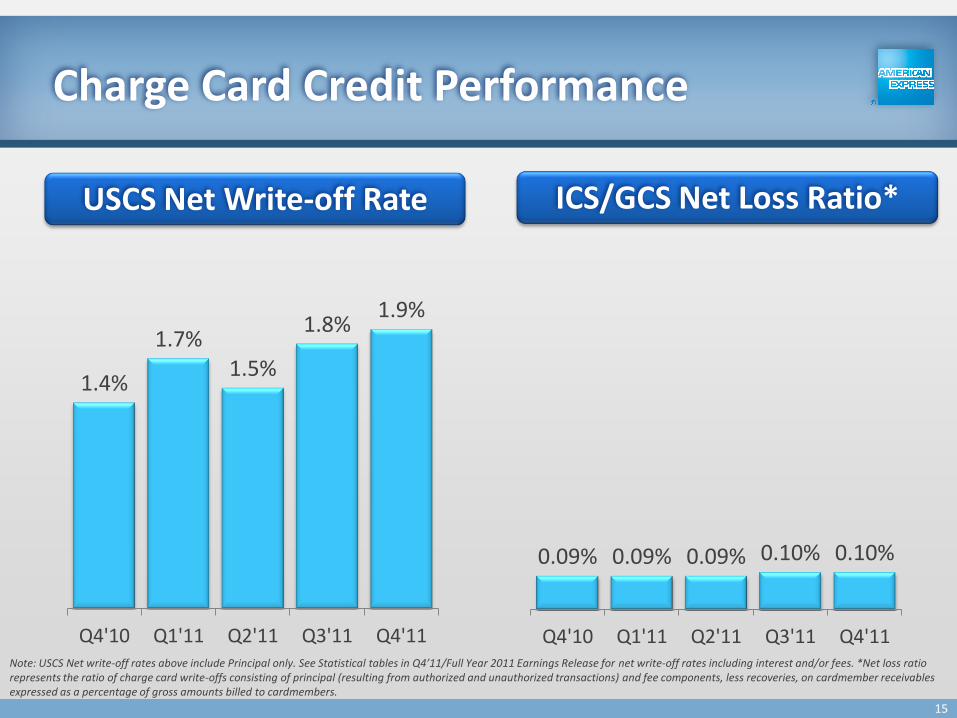
Charge Card Credit Performance
1.4%
1.7% 1.5%
1.8% 1.9%
Q4'10 Q1'11 Q2'11 Q3'11 Q4'11
USCS Net Write-off Rate ICS/GCS Net Loss Ratio*
Note: USCS Net write-off rates above include Principal only. See Statistical tables in Q4’11/Full Year 2011 Earnings Release for net write-off rates including interest and/or fees. *Net loss ratio represents the ratio of charge card write-offs consisting of principal (resulting from authorized and unauthorized transactions) and fee components, less recoveries, on cardmember receivables expressed as a percentage of gross amounts billed to cardmembers.
0.09% 0.09% 0.09% 0.10% 0.10%
Q4'10 Q1'11 Q2'11 Q3'11 Q4'11
15
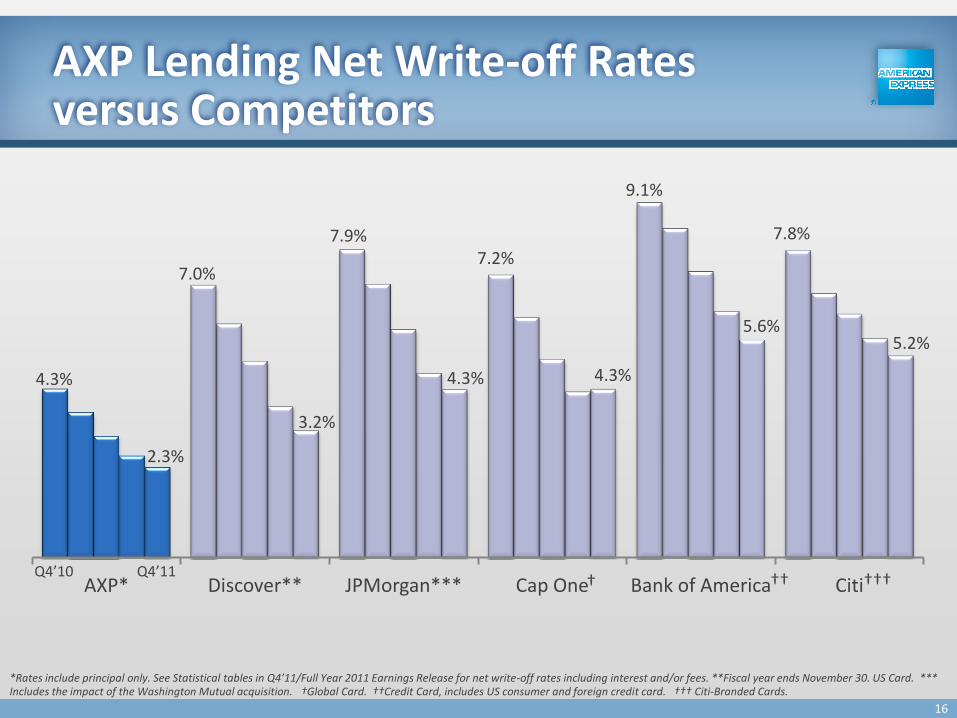
*Rates include principal only. See Statistical tables in Q4’11/Full Year 2011 Earnings Release for net write-off rates including interest and/or fees. **Fiscal year ends November 30. US Card. *** Includes the impact of the Washington Mutual acquisition. †Global Card. ††Credit Card, includes US consumer and foreign credit card. ††† Citi-Branded Cards.
AXP Lending Net Write-off Rates versus Competitors
4.3%
7.0%
7.9% 7.2%
9.1%
7.8%
2.3%
3.2%
4.3% 4.3%
5.6% 5.2%
AXP* Discover** JPMorgan*** Cap One Bank of America Citi Q4’10 Q4’11
† †† †††
16
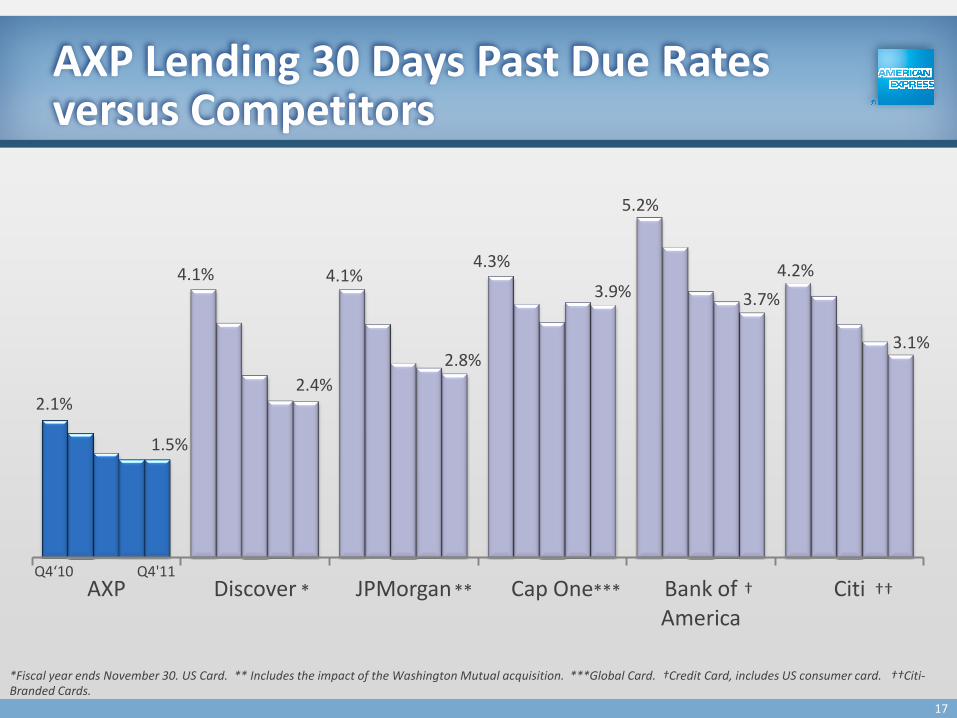
2.1%
4.1% 4.1% 4.3%
5.2%
4.2%
1.5%
2.4%
2.8%
3.9% 3.7%
3.1%
AXP Discover JPMorgan Cap One Bank of America
Citi
*Fiscal year ends November 30. US Card. ** Includes the impact of the Washington Mutual acquisition. ***Global Card. †Credit Card, includes US consumer card. ††Citi-Branded Cards.
AXP Lending 30 Days Past Due Rates versus Competitors
Q4‘10 Q4'11
*** ** * † ††
17
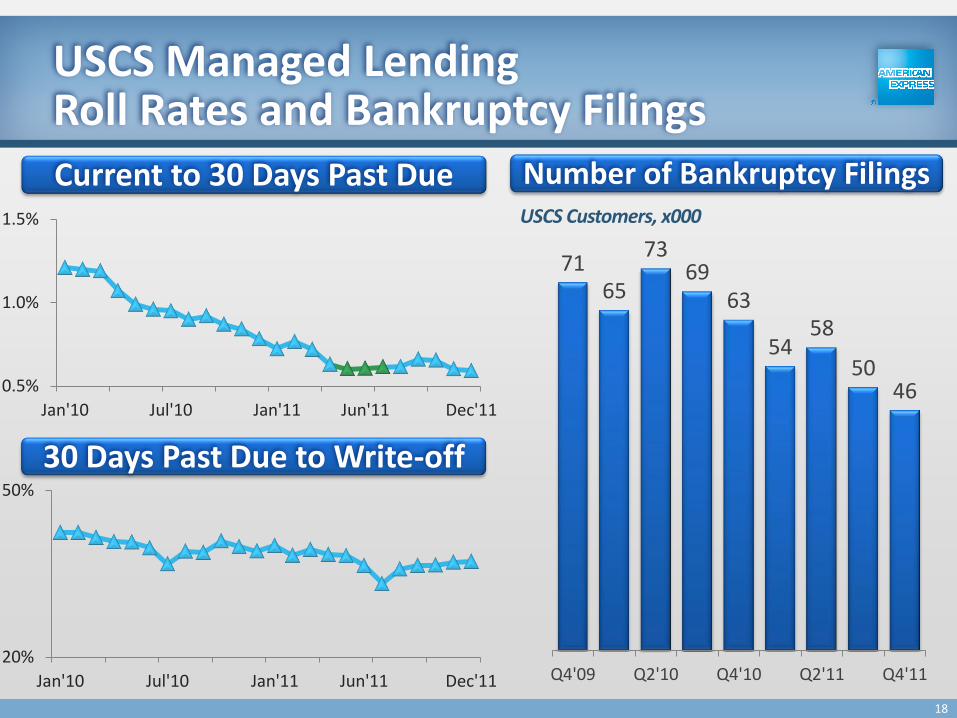
0.5%
1.0%
1.5%
Jan'10 Jul'10 Jan'11 Jun'11 Dec'11
71 65
73 69
63
54 58
50 46
Q4'09 Q2'10 Q4'10 Q2'11 Q4'11
USCS Customers, x000
USCS Managed Lending Roll Rates and Bankruptcy Filings
Current to 30 Days Past Due Number of Bankruptcy Filings
30 Days Past Due to Write-off
20%
50%
Jan'10 Jul'10 Jan'11 Jun'11 Dec'11
18
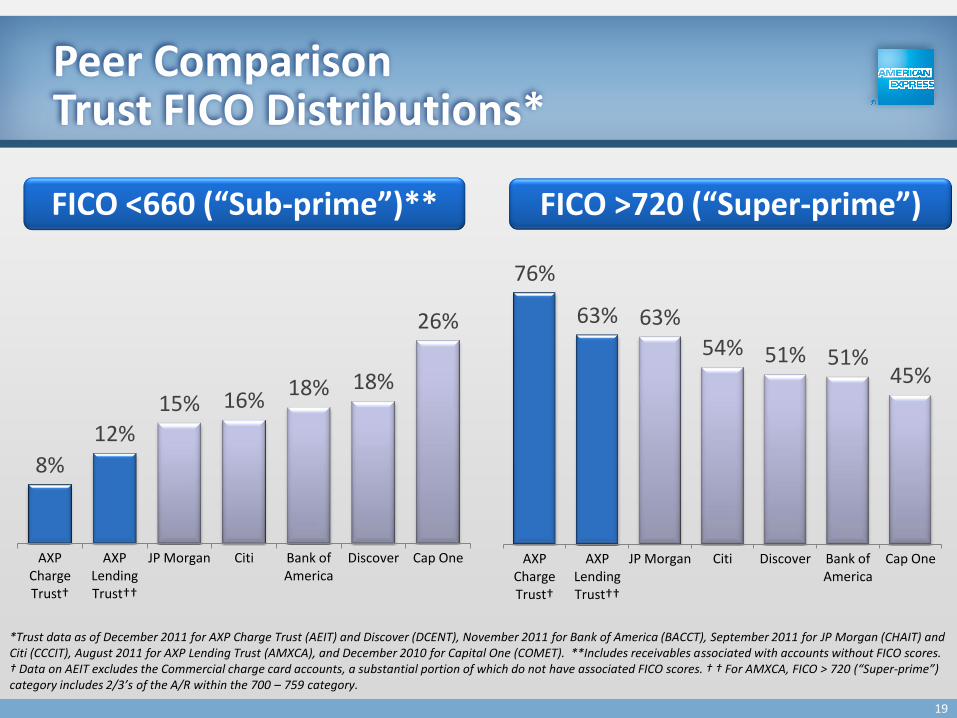
Peer Comparison Trust FICO Distributions*
*Trust data as of December 2011 for AXP Charge Trust (AEIT) and Discover (DCENT), November 2011 for Bank of America (BACCT), September 2011 for JP Morgan (CHAIT) and Citi (CCCIT), August 2011 for AXP Lending Trust (AMXCA), and December 2010 for Capital One (COMET). **Includes receivables associated with accounts without FICO scores. † Data on AEIT excludes the Commercial charge card accounts, a substantial portion of which do not have associated FICO scores. † † For AMXCA, FICO > 720 (“Super-prime”) category includes 2/3’s of the A/R within the 700 – 759 category.
19
FICO <660 (“Sub-prime”)**
76%
63% 63%
54% 51% 51% 45%
AXP Charge Trust†
AXP Lending Trust††
JP Morgan Citi Discover Bank of America
Cap One
FICO >720 (“Super-prime”)
8%
12%
15% 16% 18% 18%
26%
AXP Charge Trust†
AXP Lending Trust††
JP Morgan Citi Bank of America
Discover Cap One
■ AXP Overview
■ Performance
■ AXP Capital & Funding Management
Agenda
20
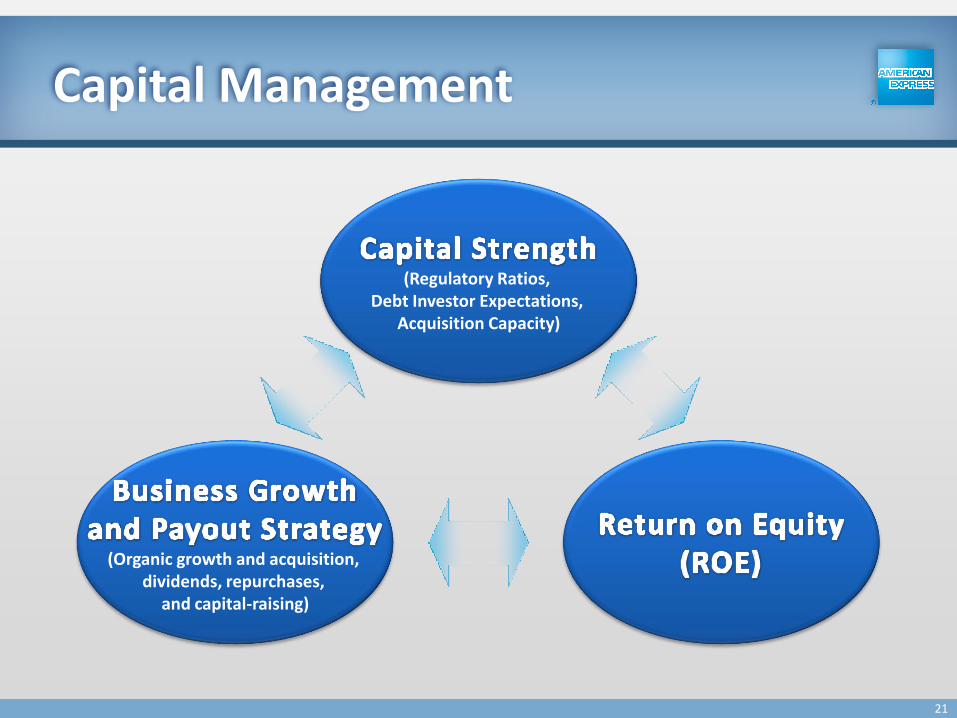
Capital Management
(Regulatory Ratios, Debt Investor Expectations,
Acquisition Capacity)
(Organic growth and acquisition, dividends, repurchases,
and capital-raising)
21
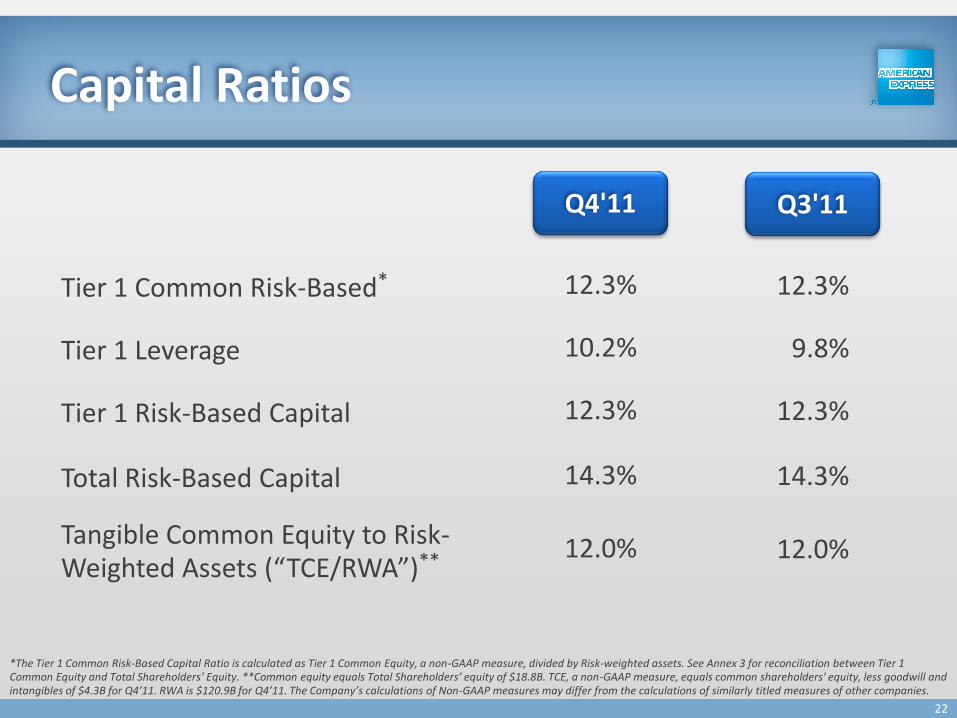
Capital Ratios
*The Tier 1 Common Risk-Based Capital Ratio is calculated as Tier 1 Common Equity, a non-GAAP measure, divided by Risk-weighted assets. See Annex 3 for reconciliation between Tier 1 Common Equity and Total Shareholders’ Equity. **Common equity equals Total Shareholders’ equity of $18.8B. TCE, a non-GAAP measure, equals common shareholders' equity, less goodwill and intangibles of $4.3B for Q4’11. RWA is $120.9B for Q4’11. The Company’s calculations of Non-GAAP measures may differ from the calculations of similarly titled measures of other companies.
Tangible Common Equity to Risk- Weighted Assets (“TCE/RWA”)**
Tier 1 Leverage
Tier 1 Risk-Based Capital
Total Risk-Based Capital
Tier 1 Common Risk-Based*
12.0%
10.2%
12.3%
14.3%
12.3%
Q4'11
12.0%
9.8%
12.3%
14.3%
12.3%
Q3'11
22
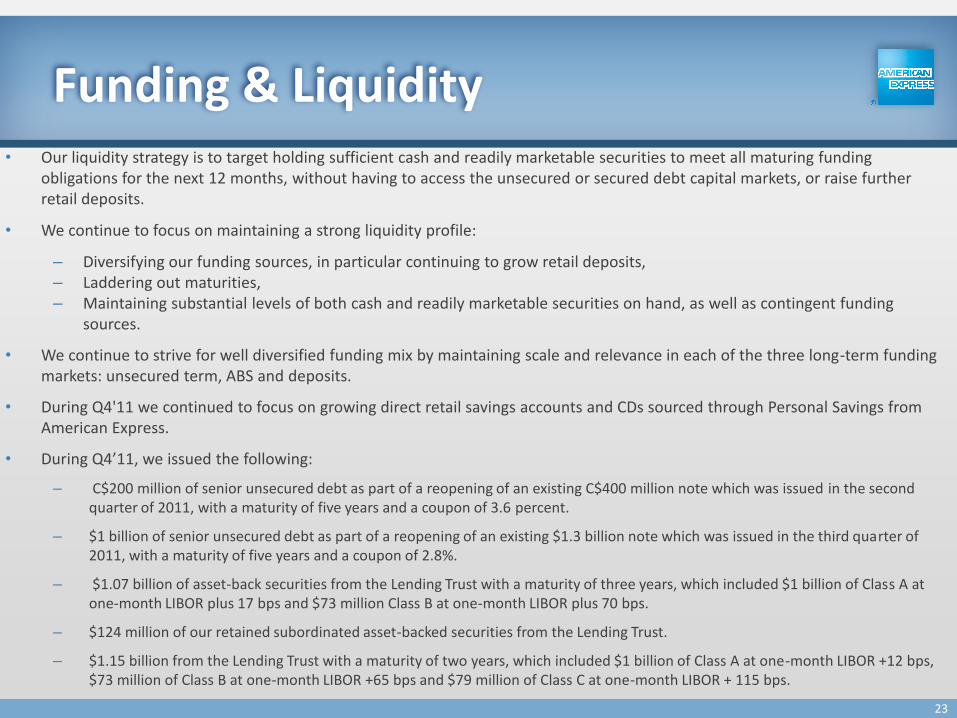
Funding & Liquidity • Our liquidity strategy is to target holding sufficient cash and readily marketable securities to meet all maturing funding
obligations for the next 12 months, without having to access the unsecured or secured debt capital markets, or raise further retail deposits.
• We continue to focus on maintaining a strong liquidity profile:
– Diversifying our funding sources, in particular continuing to grow retail deposits, – Laddering out maturities, – Maintaining substantial levels of both cash and readily marketable securities on hand, as well as contingent funding
sources.
• We continue to strive for well diversified funding mix by maintaining scale and relevance in each of the three long-term funding markets: unsecured term, ABS and deposits.
• During Q4'11 we continued to focus on growing direct retail savings accounts and CDs sourced through Personal Savings from American Express.
• During Q4’11, we issued the following:
– C$200 million of senior unsecured debt as part of a reopening of an existing C$400 million note which was issued in the second quarter of 2011, with a maturity of five years and a coupon of 3.6 percent.
– $1 billion of senior unsecured debt as part of a reopening of an existing $1.3 billion note which was issued in the third quarter of 2011, with a maturity of five years and a coupon of 2.8%.
– $1.07 billion of asset-back securities from the Lending Trust with a maturity of three years, which included $1 billion of Class A at one-month LIBOR plus 17 bps and $73 million Class B at one-month LIBOR plus 70 bps.
– $124 million of our retained subordinated asset-backed securities from the Lending Trust.
– $1.15 billion from the Lending Trust with a maturity of two years, which included $1 billion of Class A at one-month LIBOR +12 bps, $73 million of Class B at one-month LIBOR +65 bps and $79 million of Class C at one-month LIBOR + 115 bps.
23
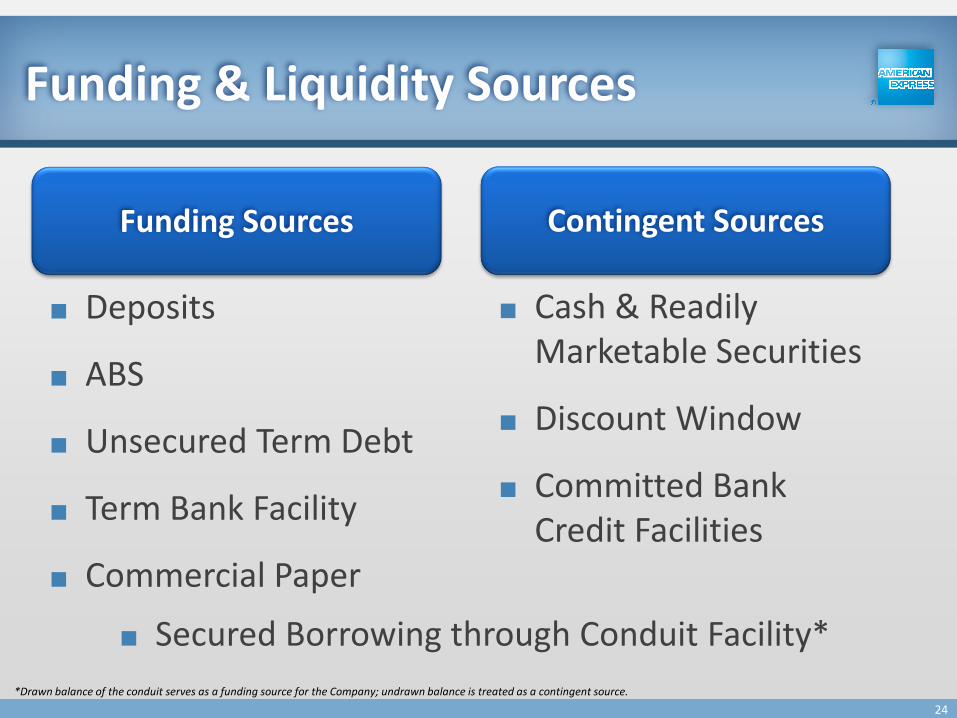
Funding & Liquidity Sources
■ Deposits
■ ABS
■ Unsecured Term Debt
■ Term Bank Facility
■ Commercial Paper
*Drawn balance of the conduit serves as a funding source for the Company; undrawn balance is treated as a contingent source.
■ Cash & Readily Marketable Securities
■ Discount Window
■ Committed Bank Credit Facilities
■ Secured Borrowing through Conduit Facility*
Funding Sources Contingent Sources
24
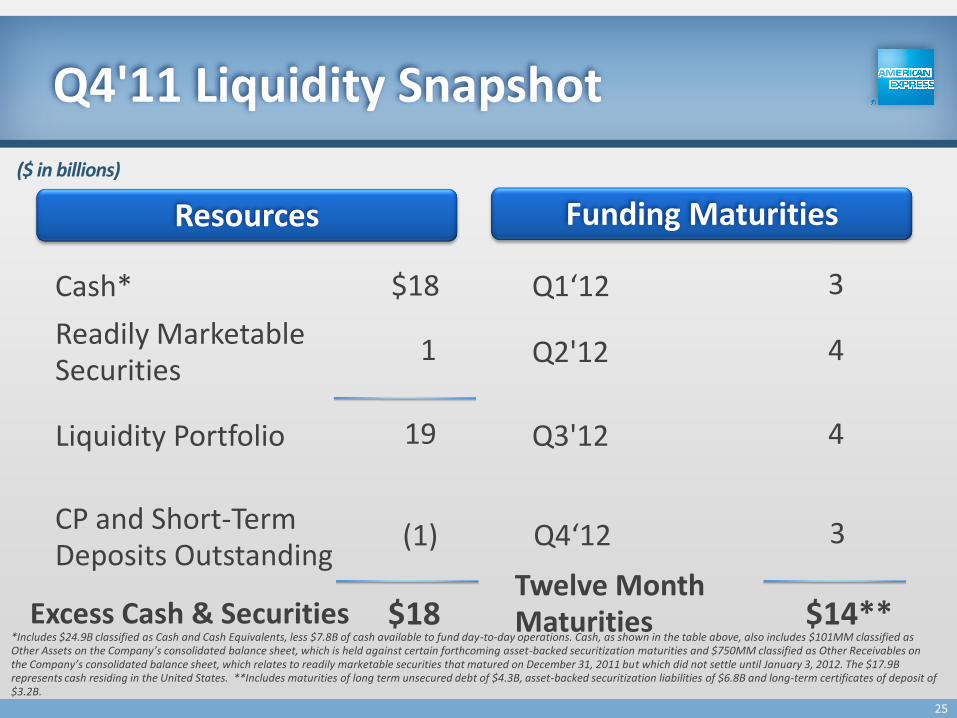
Cash* $18
Readily Marketable Securities
1
Liquidity Portfolio 19
Q1‘12 3
CP and Short-Term Deposits Outstanding
(1)
Q2'12 4
$18 $14** *Includes $24.9B classified as Cash and Cash Equivalents, less $7.8B of cash available to fund day-to-day operations. Cash, as shown in the table above, also includes $101MM classified as Other Assets on the Company’s consolidated balance sheet, which is held against certain forthcoming asset-backed securitization maturities and $750MM classified as Other Receivables on the Company’s consolidated balance sheet, which relates to readily marketable securities that matured on December 31, 2011 but which did not settle until January 3, 2012. The $17.9B represents cash residing in the United States. **Includes maturities of long term unsecured debt of $4.3B, asset-backed securitization liabilities of $6.8B and long-term certificates of deposit of $3.2B.
($ in billions)
Q3'12 4
Excess Cash & Securities Twelve Month Maturities
Q4'11 Liquidity Snapshot
Resources Funding Maturities
Q4‘12 3
25
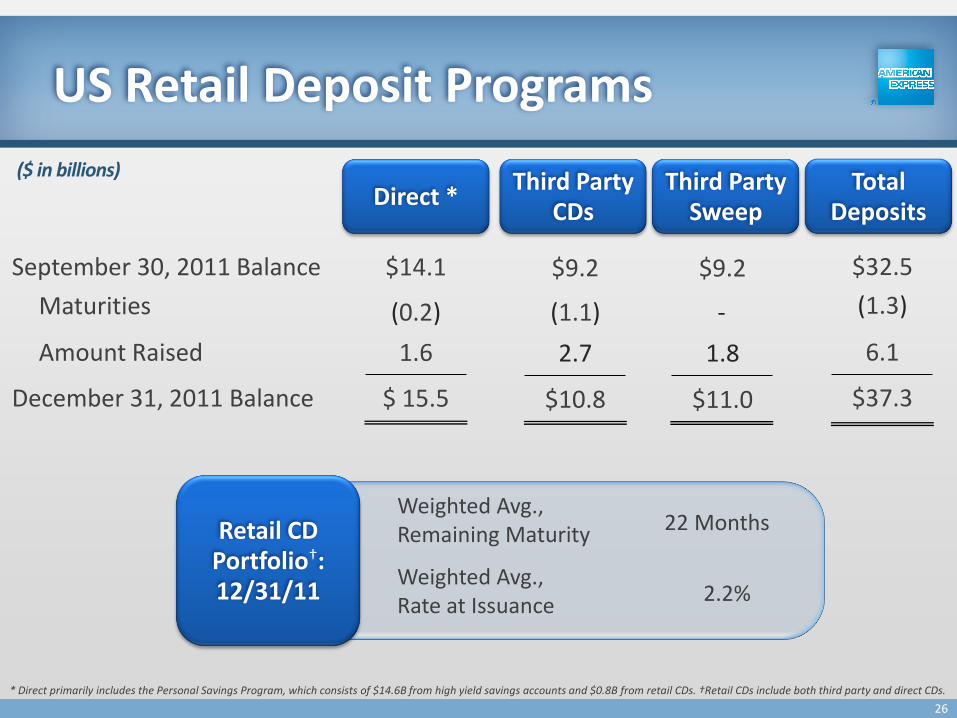
US Retail Deposit Programs
Amount Raised 1.6
December 31, 2011 Balance $10.8 $ 15.5
Maturities
September 30, 2011 Balance $9.2 $14.1
(1.3)
6.1
$37.3
$32.5
* Direct primarily includes the Personal Savings Program, which consists of $14.6B from high yield savings accounts and $0.8B from retail CDs. †Retail CDs include both third party and direct CDs.
Direct * ($ in billions)
$11.0
$9.2
Third Party CDs
Third Party Sweep
Total Deposits
(1.1)
Retail CD Portfolio†: 12/31/11
Weighted Avg., Remaining Maturity 22 Months
Weighted Avg., Rate at Issuance
2.2%
(0.2)
2.7 1.8
-
26
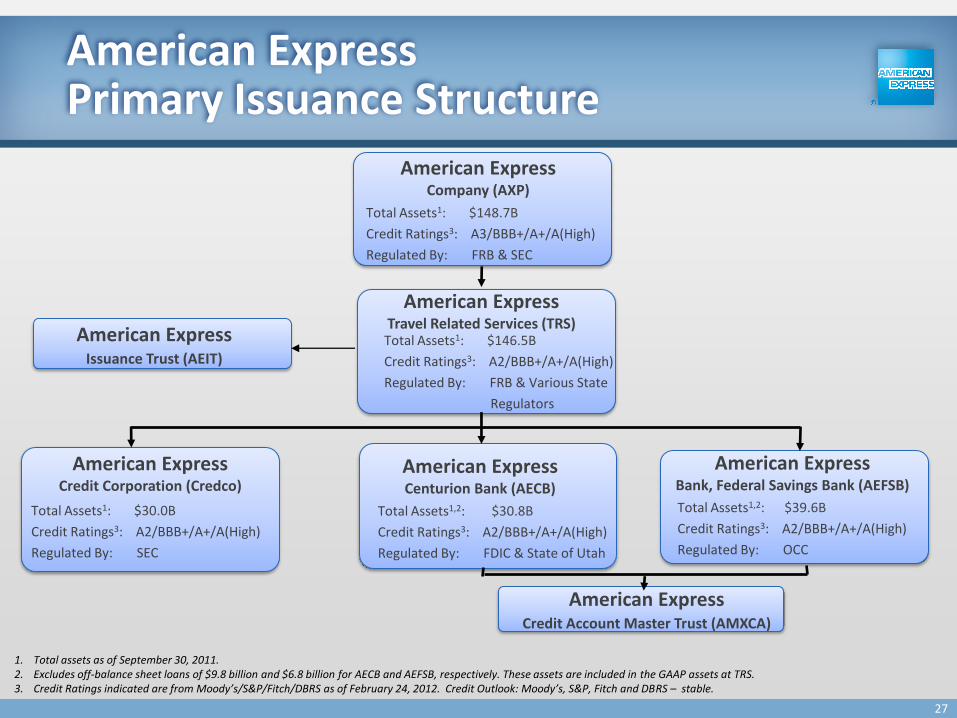
American Express Primary Issuance Structure
American Express Credit Corporation (Credco)
American Express Centurion Bank (AECB)
American Express Bank, Federal Savings Bank (AEFSB)
American Express Travel Related Services (TRS)
American Express Company (AXP)
Total Assets1,2: $39.6B
Credit Ratings3: A2/BBB+/A+/A(High)
Regulated By: OCC
Total Assets1,2: $30.8B
Credit Ratings3: A2/BBB+/A+/A(High)
Regulated By: FDIC & State of Utah
Total Assets1: $146.5B
Credit Ratings3: A2/BBB+/A+/A(High)
Regulated By: FRB & Various State
Regulators
Total Assets1: $148.7B
Credit Ratings3: A3/BBB+/A+/A(High)
Regulated By: FRB & SEC
1. Total assets as of September 30, 2011. 2. Excludes off-balance sheet loans of $9.8 billion and $6.8 billion for AECB and AEFSB, respectively. These assets are included in the GAAP assets at TRS. 3. Credit Ratings indicated are from Moody’s/S&P/Fitch/DBRS as of February 24, 2012. Credit Outlook: Moody’s, S&P, Fitch and DBRS – stable.
American Express Issuance Trust (AEIT)
American Express Credit Account Master Trust (AMXCA)
Total Assets1: $30.0B
Credit Ratings3: A2/BBB+/A+/A(High)
Regulated By: SEC
27
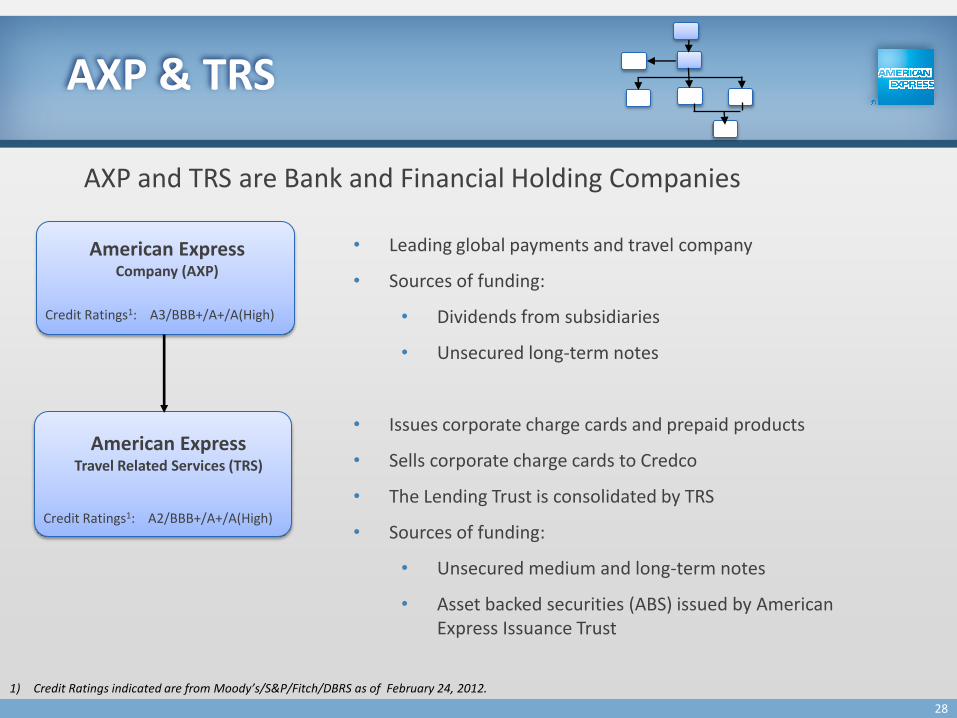
AXP & TRS
American Express Travel Related Services (TRS)
American Express Company (AXP)
Credit Ratings1: A2/BBB+/A+/A(High)
Credit Ratings1: A3/BBB+/A+/A(High)
1) Credit Ratings indicated are from Moody’s/S&P/Fitch/DBRS as of February 24, 2012.
AXP and TRS are Bank and Financial Holding Companies
• Leading global payments and travel company
• Sources of funding:
• Dividends from subsidiaries
• Unsecured long-term notes
• Issues corporate charge cards and prepaid products
• Sells corporate charge cards to Credco
• The Lending Trust is consolidated by TRS
• Sources of funding:
• Unsecured medium and long-term notes
• Asset backed securities (ABS) issued by American Express Issuance Trust
28
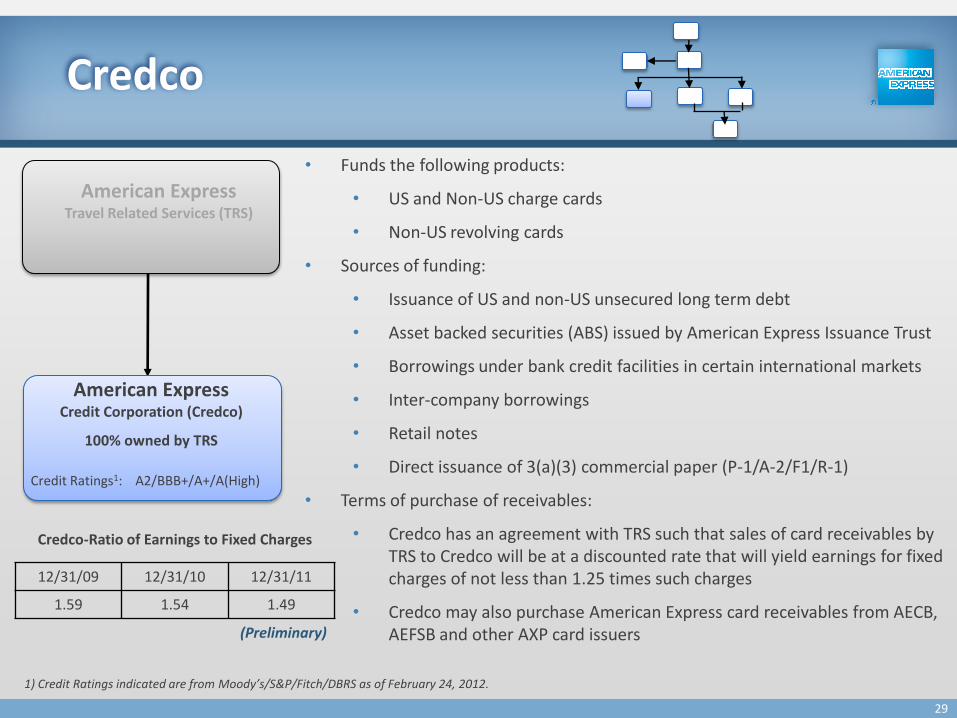
Credco
1) Credit Ratings indicated are from Moody’s/S&P/Fitch/DBRS as of February 24, 2012.
• Funds the following products:
• US and Non-US charge cards
• Non-US revolving cards
• Sources of funding:
• Issuance of US and non-US unsecured long term debt
• Asset backed securities (ABS) issued by American Express Issuance Trust
• Borrowings under bank credit facilities in certain international markets
• Inter-company borrowings
• Retail notes
• Direct issuance of 3(a)(3) commercial paper (P-1/A-2/F1/R-1)
• Terms of purchase of receivables:
• Credco has an agreement with TRS such that sales of card receivables by TRS to Credco will be at a discounted rate that will yield earnings for fixed charges of not less than 1.25 times such charges
• Credco may also purchase American Express card receivables from AECB, AEFSB and other AXP card issuers
American Express Travel Related Services (TRS)
Credit Ratings1: A2/BBB+/A+/A(High)
American Express Credit Corporation (Credco)
100% owned by TRS
12/31/09 12/31/10 12/31/11
1.59 1.54 1.49
Credco-Ratio of Earnings to Fixed Charges
29
(Preliminary)
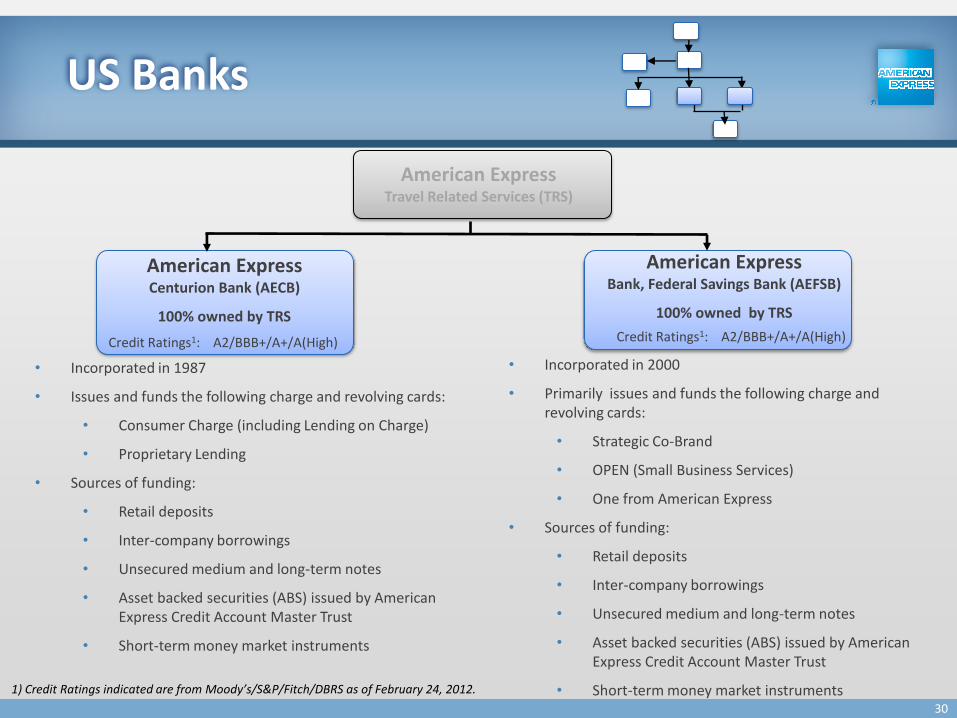
US Banks
1) Credit Ratings indicated are from Moody’s/S&P/Fitch/DBRS as of February 24, 2012.
American Express Travel Related Services (TRS)
• Incorporated in 1987
• Issues and funds the following charge and revolving cards:
• Consumer Charge (including Lending on Charge)
• Proprietary Lending
• Sources of funding:
• Retail deposits
• Inter-company borrowings
• Unsecured medium and long-term notes
• Asset backed securities (ABS) issued by American Express Credit Account Master Trust
• Short-term money market instruments
• Incorporated in 2000
• Primarily issues and funds the following charge and revolving cards:
• Strategic Co-Brand
• OPEN (Small Business Services)
• One from American Express
• Sources of funding:
• Retail deposits
• Inter-company borrowings
• Unsecured medium and long-term notes
• Asset backed securities (ABS) issued by American Express Credit Account Master Trust
• Short-term money market instruments
American Express Centurion Bank (AECB)
100% owned by TRS
Credit Ratings1: A2/BBB+/A+/A(High)
American Express Bank, Federal Savings Bank (AEFSB)
100% owned by TRS
Credit Ratings1: A2/BBB+/A+/A(High)
30
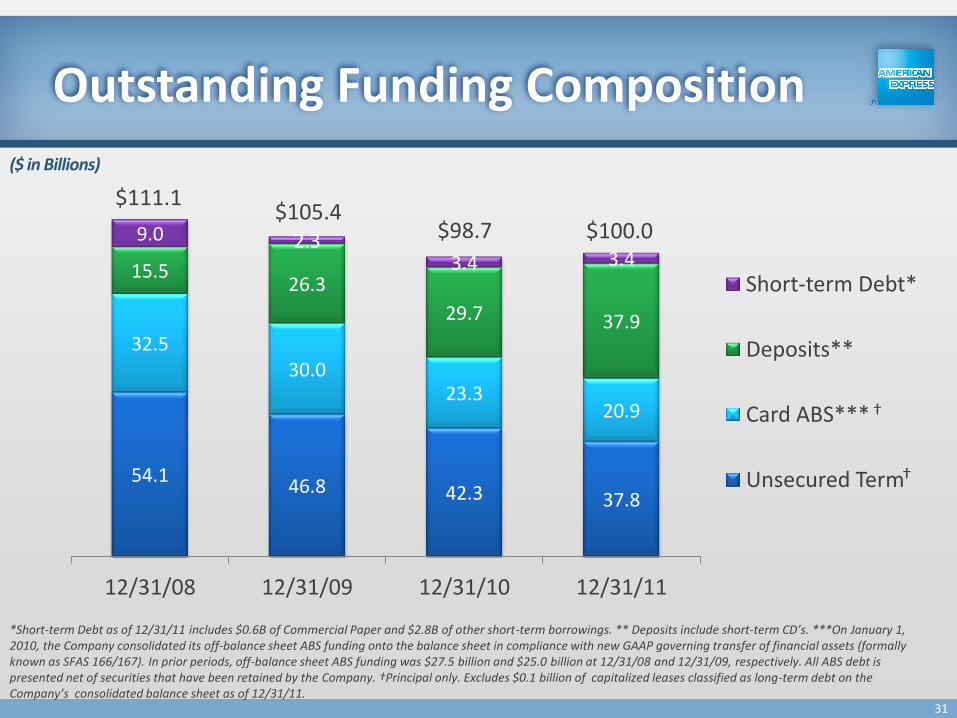
54.1 46.8 42.3 37.8
32.5 30.0
23.3 20.9
15.5 26.3
29.7 37.9
9.0 2.3 3.4 3.4
12/31/08 12/31/09 12/31/10 12/31/11
Short-term Debt*
Deposits**
Card ABS***
Unsecured Term
$111.1 $105.4
$98.7 $100.0
†
†
Outstanding Funding Composition
*Short-term Debt as of 12/31/11 includes $0.6B of Commercial Paper and $2.8B of other short-term borrowings. ** Deposits include short-term CD’s. ***On January 1, 2010, the Company consolidated its off-balance sheet ABS funding onto the balance sheet in compliance with new GAAP governing transfer of financial assets (formally known as SFAS 166/167). In prior periods, off-balance sheet ABS funding was $27.5 billion and $25.0 billion at 12/31/08 and 12/31/09, respectively. All ABS debt is presented net of securities that have been retained by the Company. †Principal only. Excludes $0.1 billion of capitalized leases classified as long-term debt on the Company’s consolidated balance sheet as of 12/31/11.
($ in Billions)
31
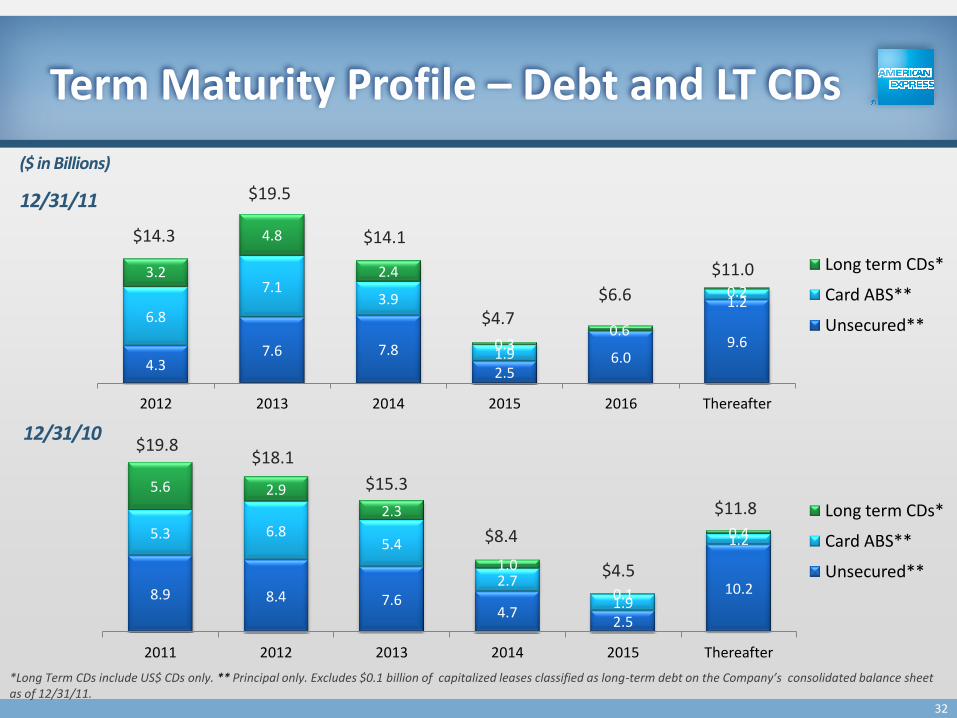
4.3 7.6 7.8
2.5 6.0
9.6
6.8
7.1 3.9
1.9
1.2
3.2
4.8
2.4
0.3 0.6
0.2
2012 2013 2014 2015 2016 Thereafter
12/31/11
($ in Billions)
Long term CDs*
Card ABS**
Unsecured**
$14.3
Term Maturity Profile – Debt and LT CDs
8.9 8.4 7.6 4.7
2.5
10.2
5.3 6.8 5.4
2.7
1.9
1.2
5.6 2.9
2.3
1.0
0.1
0.4
2011 2012 2013 2014 2015 Thereafter
12/31/10
Long term CDs*
Card ABS**
Unsecured**
$19.8 $18.1
$15.3
$8.4
$4.5
$11.8
*Long Term CDs include US$ CDs only. ** Principal only. Excludes $0.1 billion of capitalized leases classified as long-term debt on the Company’s consolidated balance sheet as of 12/31/11.
$19.5
$14.1
$4.7
$6.6
$11.0
32
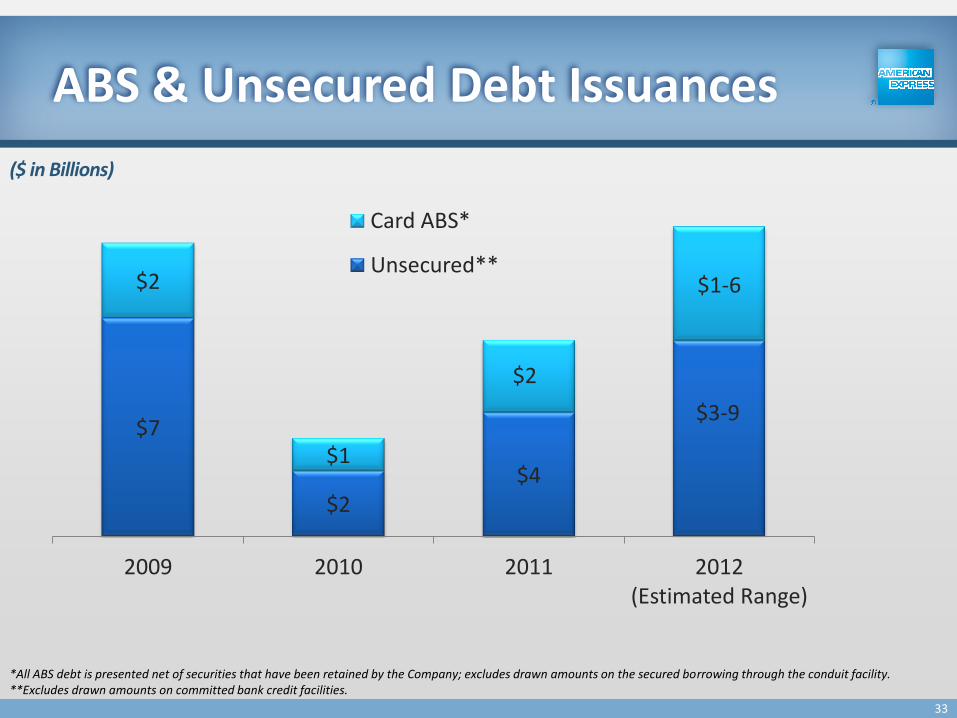
$7
$2 $4
$3-9
$2
$1
$2
$1-6
2009 2010 2011 2012 (Estimated Range)
Card ABS*
Unsecured**
ABS & Unsecured Debt Issuances
($ in Billions)
*All ABS debt is presented net of securities that have been retained by the Company; excludes drawn amounts on the secured borrowing through the conduit facility. **Excludes drawn amounts on committed bank credit facilities.
33
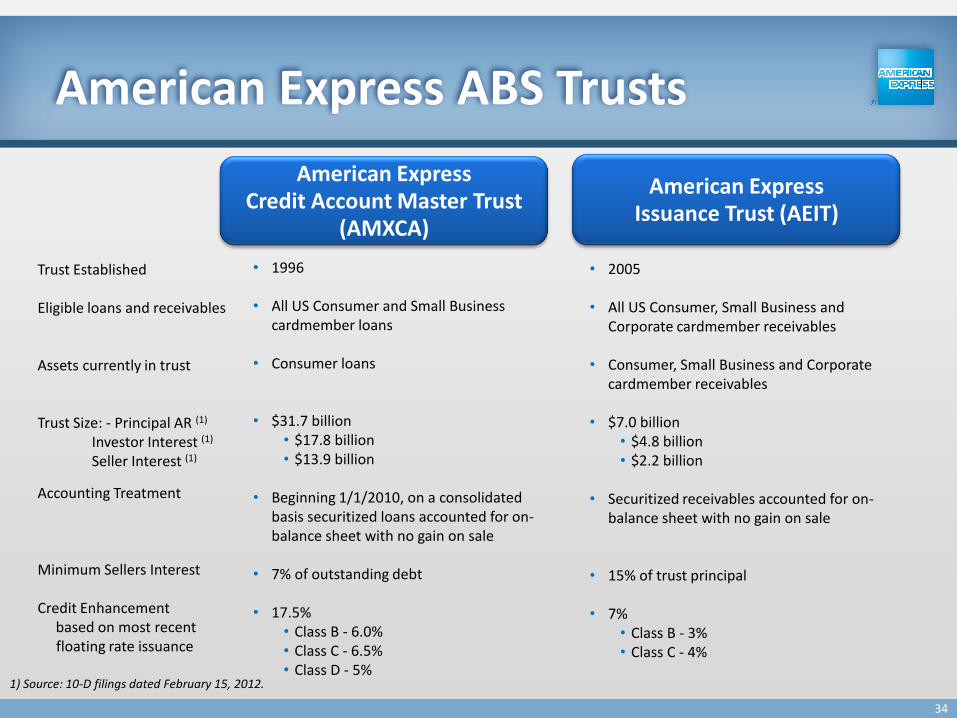
American Express ABS Trusts
Trust Established Eligible loans and receivables Assets currently in trust Trust Size: - Principal AR (1)
Investor Interest (1)
Seller Interest (1)
Accounting Treatment Minimum Sellers Interest Credit Enhancement based on most recent
floating rate issuance
• 2005
• All US Consumer, Small Business and Corporate cardmember receivables
• Consumer, Small Business and Corporate cardmember receivables
• $7.0 billion • $4.8 billion • $2.2 billion
• Securitized receivables accounted for on-
balance sheet with no gain on sale
• 15% of trust principal • 7%
• Class B - 3% • Class C - 4%
• 1996
• All US Consumer and Small Business cardmember loans
• Consumer loans
• $31.7 billion • $17.8 billion • $13.9 billion
• Beginning 1/1/2010, on a consolidated
basis securitized loans accounted for on-balance sheet with no gain on sale
• 7% of outstanding debt
• 17.5%
• Class B - 6.0% • Class C - 6.5% • Class D - 5%
1) Source: 10-D filings dated February 15, 2012.
American Express Issuance Trust (AEIT)
American Express Credit Account Master Trust
(AMXCA)
34
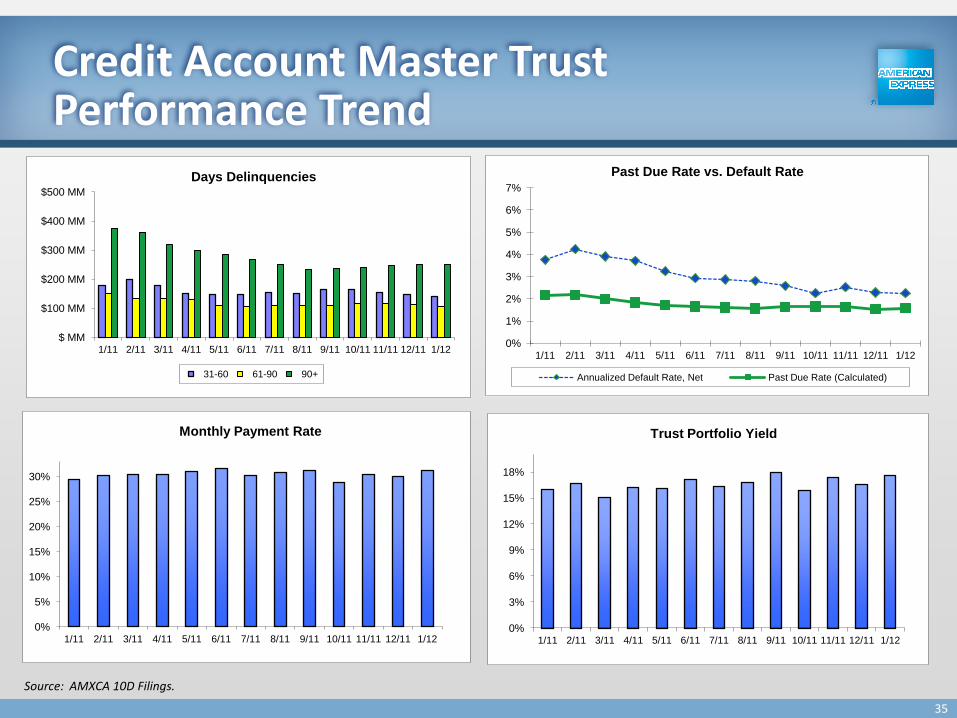
0%
3%
6%
9%
12%
15%
18%
1/11 2/11 3/11 4/11 5/11 6/11 7/11 8/11 9/11 10/11 11/11 12/11 1/12
Trust Portfolio Yield
0%
5%
10%
15%
20%
25%
30%
1/11 2/11 3/11 4/11 5/11 6/11 7/11 8/11 9/11 10/11 11/11 12/11 1/12
Monthly Payment Rate
0%
1%
2%
3%
4%
5%
6%
7%
1/11 2/11 3/11 4/11 5/11 6/11 7/11 8/11 9/11 10/11 11/11 12/11 1/12
Past Due Rate vs. Default Rate
Annualized Default Rate, Net Past Due Rate (Calculated)
$ MM
$100 MM
$200 MM
$300 MM
$400 MM
$500 MM
1/11 2/11 3/11 4/11 5/11 6/11 7/11 8/11 9/11 10/11 11/11 12/11 1/12
Days Delinquencies
31-60 61-90 90+
Credit Account Master Trust Performance Trend
Source: AMXCA 10D Filings.
35
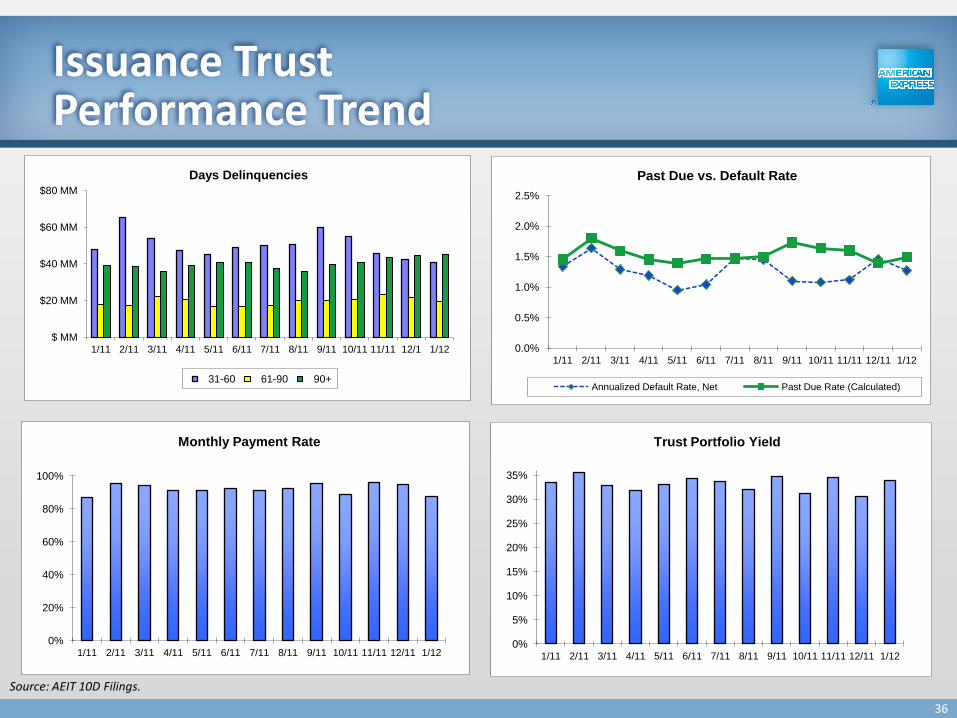
0%
5%
10%
15%
20%
25%
30%
35%
1/11 2/11 3/11 4/11 5/11 6/11 7/11 8/11 9/11 10/11 11/11 12/11 1/12
Trust Portfolio Yield
0%
20%
40%
60%
80%
100%
1/11 2/11 3/11 4/11 5/11 6/11 7/11 8/11 9/11 10/11 11/11 12/11 1/12
Monthly Payment Rate
0.0%
0.5%
1.0%
1.5%
2.0%
2.5%
1/11 2/11 3/11 4/11 5/11 6/11 7/11 8/11 9/11 10/11 11/11 12/11 1/12
Past Due vs. Default Rate
Annualized Default Rate, Net Past Due Rate (Calculated)
$ MM
$20 MM
$40 MM
$60 MM
$80 MM
1/11 2/11 3/11 4/11 5/11 6/11 7/11 8/11 9/11 10/11 11/11 12/1 1/12
Days Delinquencies
31-60 61-90 90+
Issuance Trust Performance Trend
Source: AEIT 10D Filings.
36
37
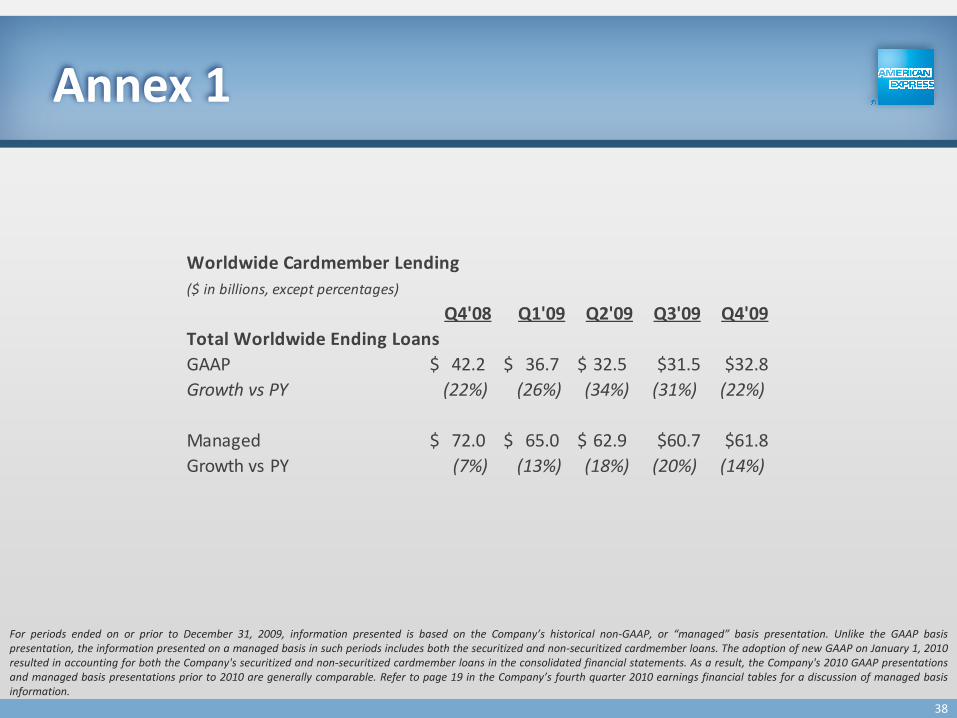
Annex 1
For periods ended on or prior to December 31, 2009, information presented is based on the Company’s historical non-GAAP, or “managed” basis presentation. Unlike the GAAP basis presentation, the information presented on a managed basis in such periods includes both the securitized and non-securitized cardmember loans. The adoption of new GAAP on January 1, 2010 resulted in accounting for both the Company's securitized and non-securitized cardmember loans in the consolidated financial statements. As a result, the Company's 2010 GAAP presentations and managed basis presentations prior to 2010 are generally comparable. Refer to page 19 in the Company’s fourth quarter 2010 earnings financial tables for a discussion of managed basis information.
Worldwide Cardmember Lending
($ in billions, except percentages)
Q4'08 Q1'09 Q2'09 Q3'09 Q4'09
Total Worldwide Ending Loans
GAAP 42.2$ 36.7$ 32.5$ $31.5 $32.8
Growth vs PY (22%) (26%) (34%) (31%) (22%)
Managed 72.0$ 65.0$ 62.9$ $60.7 $61.8
Growth vs PY (7%) (13%) (18%) (20%) (14%)
38
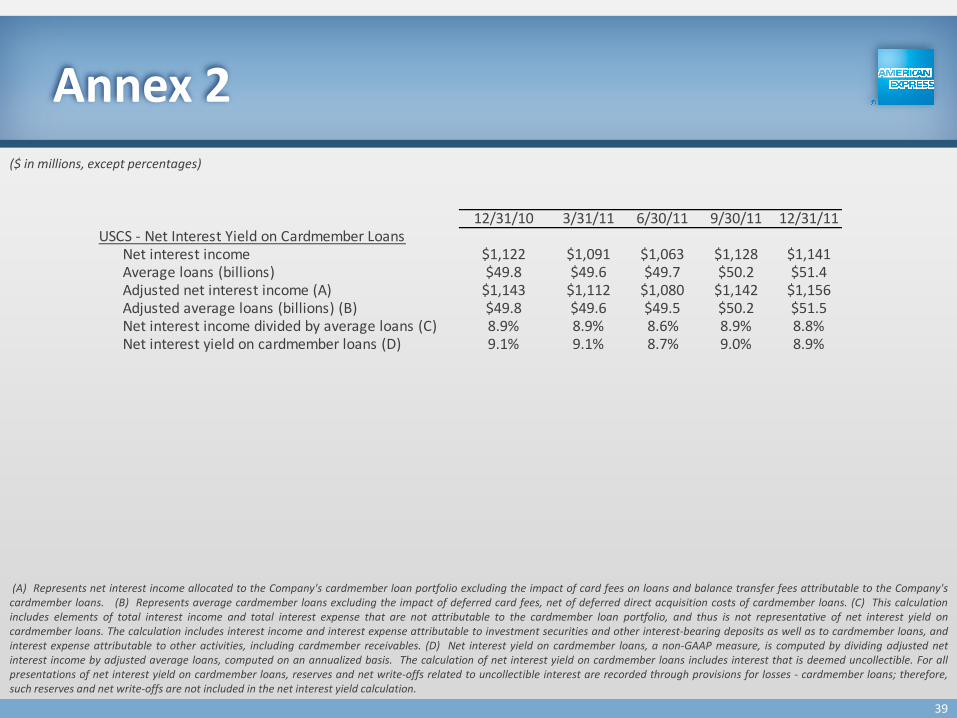
Annex 2
($ in millions, except percentages)
(A) Represents net interest income allocated to the Company's cardmember loan portfolio excluding the impact of card fees on loans and balance transfer fees attributable to the Company's cardmember loans. (B) Represents average cardmember loans excluding the impact of deferred card fees, net of deferred direct acquisition costs of cardmember loans. (C) This calculation includes elements of total interest income and total interest expense that are not attributable to the cardmember loan portfolio, and thus is not representative of net interest yield on cardmember loans. The calculation includes interest income and interest expense attributable to investment securities and other interest-bearing deposits as well as to cardmember loans, and interest expense attributable to other activities, including cardmember receivables. (D) Net interest yield on cardmember loans, a non-GAAP measure, is computed by dividing adjusted net interest income by adjusted average loans, computed on an annualized basis. The calculation of net interest yield on cardmember loans includes interest that is deemed uncollectible. For all presentations of net interest yield on cardmember loans, reserves and net write-offs related to uncollectible interest are recorded through provisions for losses - cardmember loans; therefore, such reserves and net write-offs are not included in the net interest yield calculation.
12/31/10 3/31/11 6/30/11 9/30/11 12/31/11USCS - Net Interest Yield on Cardmember Loans
Net interest income $1,122 $1,091 $1,063 $1,128 $1,141Average loans (billions) $49.8 $49.6 $49.7 $50.2 $51.4Adjusted net interest income (A) $1,143 $1,112 $1,080 $1,142 $1,156Adjusted average loans (billions) (B) $49.8 $49.6 $49.5 $50.2 $51.5Net interest income divided by average loans (C) 8.9% 8.9% 8.6% 8.9% 8.8%Net interest yield on cardmember loans (D) 9.1% 9.1% 8.7% 9.0% 8.9%
12/31/10 3/31/11 6/30/11 9/30/11 12/31/11
ICS - Net Interest Yield on Cardmember Loans
Net interest income $228 $219 $239 $215 $205
Average loans (billions) $8.7 $8.8 $8.8 $8.7 $8.5
Adjusted net interest income (A) $228 $214 $233 $214 $194
Adjusted average loans (billions) (B) $8.5 $8.7 $8.7 $8.6 $8.4
Net interest income divided by average loans (C) 10.4% 10.1% 10.9% 9.8% 9.6%
Net interest yield on cardmember loans (D) 10.6% 10.0% 10.7% 9.9% 9.2%
39
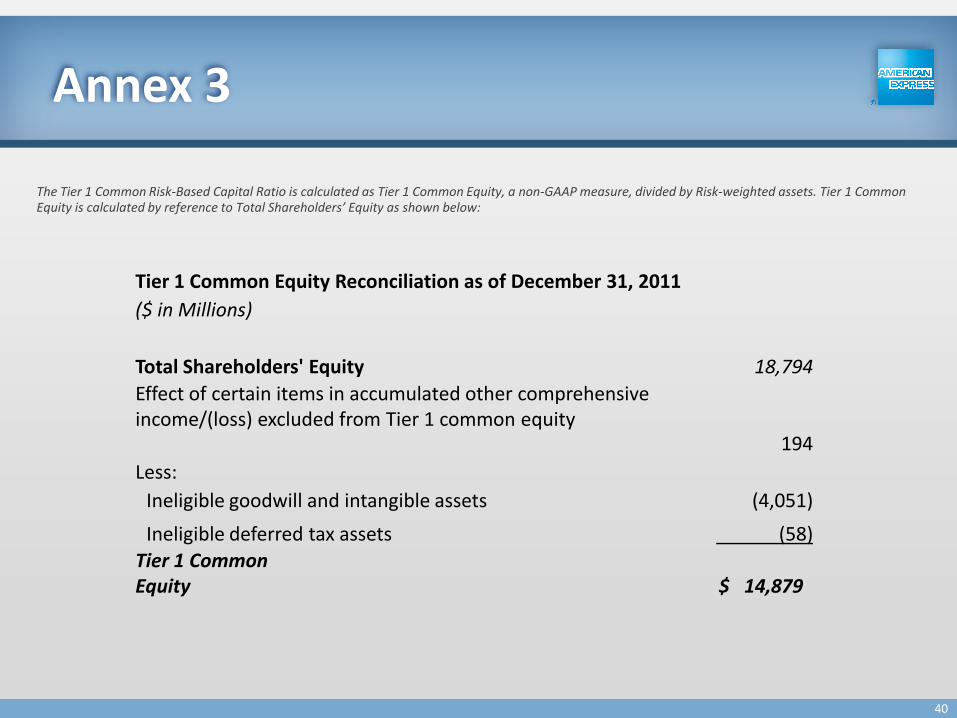
Annex 3
The Tier 1 Common Risk-Based Capital Ratio is calculated as Tier 1 Common Equity, a non-GAAP measure, divided by Risk-weighted assets. Tier 1 Common Equity is calculated by reference to Total Shareholders’ Equity as shown below:
Tier 1 Common Equity Reconciliation as of December 31, 2011
($ in Millions)
Total Shareholders' Equity 18,794
Effect of certain items in accumulated other comprehensive income/(loss) excluded from Tier 1 common equity
194
Less:
Ineligible goodwill and intangible assets (4,051)
Ineligible deferred tax assets (58)
Tier 1 Common Equity $ 14,879
40
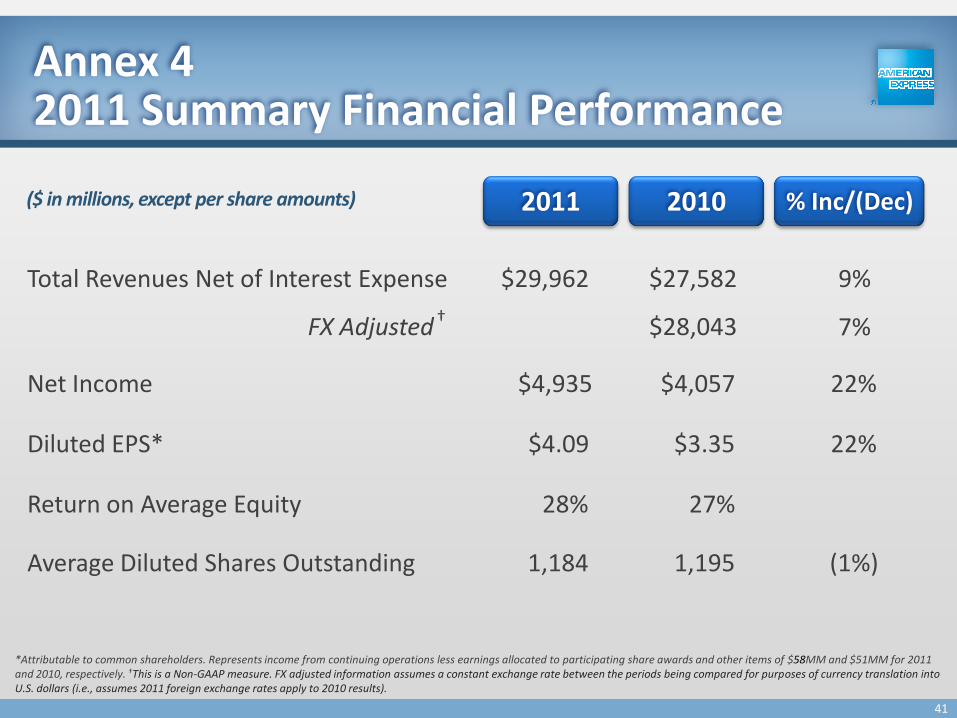
Annex 4 2011 Summary Financial Performance
Total Revenues Net of Interest Expense
Return on Average Equity
Net Income
Diluted EPS*
22%
9% $27,582
27%
$4,057
$29,962
22% $3.35 $4.09
28%
$4,935
(1%) 1,195 1,184 Average Diluted Shares Outstanding
($ in millions, except per share amounts)
*Attributable to common shareholders. Represents income from continuing operations less earnings allocated to participating share awards and other items of $58MM and $51MM for 2011 and 2010, respectively. †This is a Non-GAAP measure. FX adjusted information assumes a constant exchange rate between the periods being compared for purposes of currency translation into U.S. dollars (i.e., assumes 2011 foreign exchange rates apply to 2010 results).
2011 2010 % Inc/(Dec)
FX Adjusted 7% †
$28,043
41
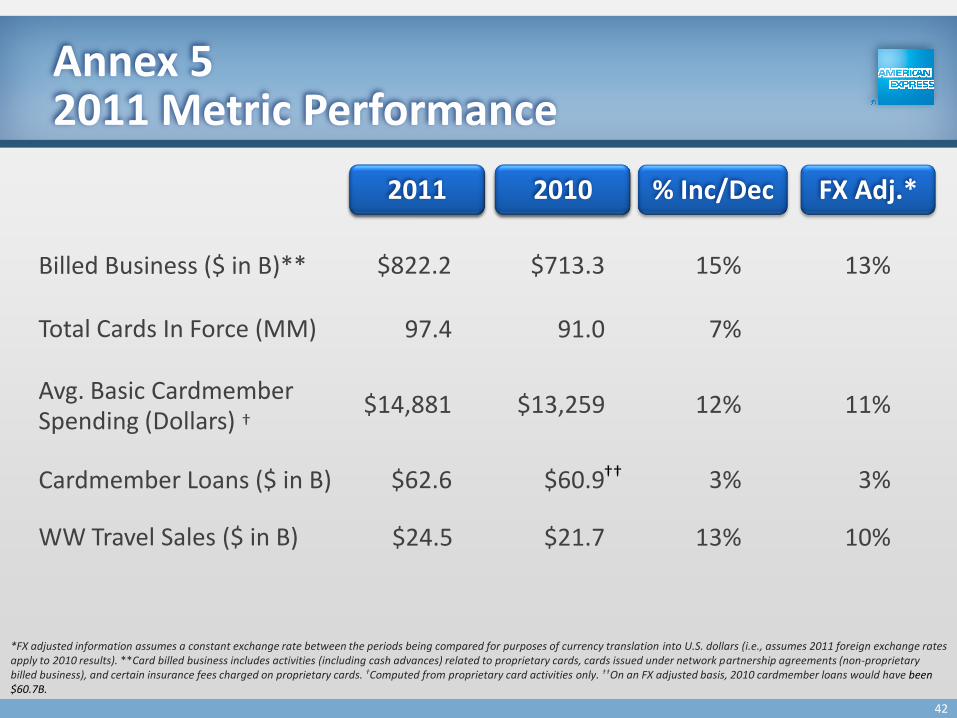
Annex 5 2011 Metric Performance
Billed Business ($ in B)**
Avg. Basic Cardmember Spending (Dollars)
*FX adjusted information assumes a constant exchange rate between the periods being compared for purposes of currency translation into U.S. dollars (i.e., assumes 2011 foreign exchange rates apply to 2010 results). **Card billed business includes activities (including cash advances) related to proprietary cards, cards issued under network partnership agreements (non-proprietary billed business), and certain insurance fees charged on proprietary cards. †Computed from proprietary card activities only. ††On an FX adjusted basis, 2010 cardmember loans would have been $60.7B.
WW Travel Sales ($ in B)
$822.2
$14,881
15%
12%
$713.3
$24.5 13% $21.7
$13,259
13%
11%
10%
1Q'10 1Q'09 FX Adj.* 2011 2010
†
% Inc/Dec
Total Cards In Force (MM) 97.4 7% 91.0
$62.6 3% $60.9 Cardmember Loans ($ in B) 3% ††
42
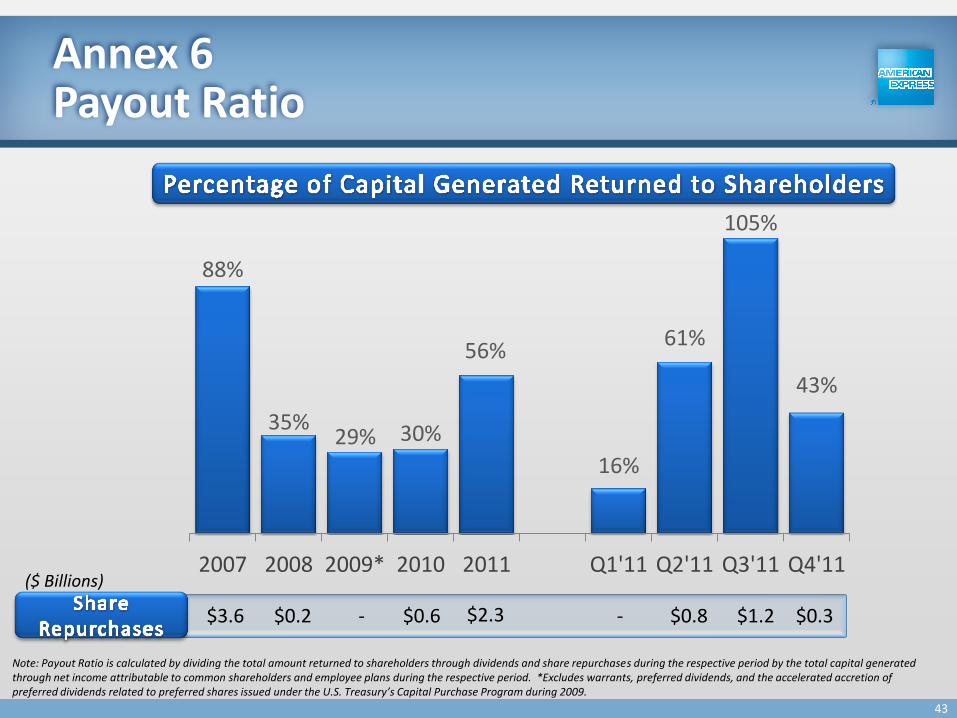
Annex 6 Payout Ratio
88%
35% 29% 30%
56%
16%
61%
105%
43%
2007 2008 2009* 2010 2011 Q1'11 Q2'11 Q3'11 Q4'11
Note: Payout Ratio is calculated by dividing the total amount returned to shareholders through dividends and share repurchases during the respective period by the total capital generated through net income attributable to common shareholders and employee plans during the respective period. *Excludes warrants, preferred dividends, and the accelerated accretion of preferred dividends related to preferred shares issued under the U.S. Treasury’s Capital Purchase Program during 2009.
$3.6 $0.2 - $0.6 - $0.8 $1.2
($ Billions)
$0.3 $2.3
43
Forward-Looking Statements This presentation includes forward-looking statements within the meaning of the Private Securities Litigation Reform Act of 1995, which are subject to risks and uncertainties. The forward-looking statements, which address the Company’s expected business and financial performance, among other matters, contain words such as “believe,” “expect,” “estimate,” “anticipate,” “optimistic,” “intend,” “plan,” “aim,” “will,” “may,” “should,” “could,” “would,” “likely,” and similar expressions. Readers are cautioned not to place undue reliance on these forward-looking statements, which speak only as of the date on which they are made. The Company undertakes no obligation to update or revise any forward-looking statements. Factors that could cause actual results to differ materially from these forward-looking statements, include, but are not limited to, the following: • changes in global economic and business conditions, including consumer and business spending, the availability and cost of credit, unemployment and political conditions, all of which may significantly affect spending on American Express cards, delinquency rates, loan balances and other aspects of the Company's business and results of operations; • changes in capital and credit market conditions, including sovereign credit worthiness, which may significantly affect the Company's ability to meet its liquidity needs, access to capital and cost of capital, including changes in interest rates; changes in market conditions affecting the valuation of the Company's assets; or any reduction in the Company's credit ratings or those of its subsidiaries, which could materially increase the cost and other terms of the Company's funding, restrict its access to the capital markets or result in contingent payments under contracts; • litigation, such as class actions or proceedings brought by governmental and regulatory agencies (including the lawsuit filed against the Company by the U.S. Department of Justice and certain state attorneys general), that could result in (i) the imposition of behavioral remedies against the Company or the Company voluntarily making certain changes to its business practices, the effects of which in either case could have a material adverse impact on the Company's financial performance; (ii) the imposition of substantial monetary damages in private actions against the Company; and/or (iii) damage to the Company's global reputation and brand; • legal and regulatory developments wherever the Company does business, including legislative and regulatory reforms in the United States, such as the Dodd-Frank Reform Act's stricter regulation of large, interconnected financial institutions, changes in requirements relating to securitization and the establishment of the CFPB, which could make fundamental changes to many of the Company's business practices or materially affect its capital requirements, results of operations, or ability to pay dividends or repurchase its stock; actions and potential future actions by the FDIC and credit rating agencies applicable to securitization trusts, which could impact the Company's ABS program; or potential changes in the federal tax system that could substantially alter, among other things, the taxation of the Company's international businesses, the allowance of deductions for significant expenses, or the incidence of consumption taxes on the Company's transactions, products and services; • the ability of the Company to generate its on-average and over-time growth targets for revenues net of interest expense, earnings per share and return on average equity, which will depend on the factors such as the Company's success in implementing its strategies and initiatives, meeting its targets for operating expenses and on factors outside management's control including changes in the economic and business environment, the effectiveness of marketing and loyalty programs, and the willingness of cardmembers to sustain spending;
44
Forward-Looking Statements
• the Company's net interest yield on U.S. cardmember loans not remaining at historical levels, which will be influenced by, among other things, the effects of the CARD Act (including the regulations requiring the Company to periodically reevaluate APR increases), interest rates, changes in consumer behavior that affect loan balances, such as paydown rates, the credit quality of the Company's portfolio and the Company's cardmember acquisition strategy, product mix, cost of funds, credit actions, including line size and other adjustments to credit availability, and potential pricing changes; • changes in the substantial and increasing worldwide competition in the payments industry, including competitive pressure that may impact the prices the Company charges merchants that accept the Company's cards and the success of marketing, promotion or rewards programs; • changes in technology or in the Company's ability to protect its intellectual property (such as copyrights, trademarks, patents and controls on access and distribution), and invest in and compete at the leading edge of technological developments across the Company's businesses, including technology and intellectual property of third parties on whom the Company relies, all of which could materially affect the Company's results of operations; • data breaches and fraudulent activity, which could damage the Company's brand, increase the Company's costs or have regulatory implications, and changes in regulation affecting privacy and data security under federal, state and foreign law, which could result in higher compliance and technology costs to the Company or the Company's vendors; • changes in the Company's ability to attract or retain qualified personnel in the management and operation of the Company's business, including any changes that may result from increasing regulatory supervision of compensation practices; • changes in the financial condition and creditworthiness of the Company's business partners, such as bankruptcies, restructurings or consolidations, involving merchants that represent a significant portion of the Company's business, such as the airline industry, or the Company's partners in Global Network Services or financial institutions that the Company relies on for routine funding and liquidity, which could materially affect the Company's financial condition or results of operations; • uncertainties associated with business acquisitions, including the ability to realize anticipated business retention, growth and cost savings, accurately estimate the value of goodwill and intangibles associated with individual acquisitions, effectively integrate the acquired business into the Company's existing operations or implement or remediate controls, procedures and policies at the acquired company; • uncertainty relating to the actual growth of operating expenses in 2012 and subsequent years, which will depend in part on the Company's ability to balance the control and management of expenses and the maintenance of competitive service levels to its businesses and customers, unanticipated increases in significant categories of operating expenses, such as consulting or professional fees, compliance or regulatory costs and technology costs, higher than expected employee levels due to lower than expected attrition rates or employee needs not currently anticipated, the impact of changes in foreign currency exchange rates on costs and results, and the level of acquisition activity and related expenses;
45
Forward-Looking Statements • changes affecting the success of the Company's reengineering and other cost control initiatives, such as the ability to execute plans during the year with respect to certain of the Company's facilities, which may result in the Company not realizing all or a significant portion of the benefits that the Company intends; • the actual amount to be spent by the Company on investments in the business, including on marketing, promotion, rewards and cardmember services and certain operating expenses, which will be based in part on management's assessment of competitive opportunities and the Company's performance and the ability to control and manage operating, infrastructure, advertising, promotion and rewards expenses as business expands or changes, including the changing behavior of cardmembers; • the effectiveness of the Company's risk management policies and procedures, including credit risk relating to consumer debt, liquidity risk in meeting business requirements and operational risk; • the Company's lending write-off rates for 2012 not remaining below the average historical levels of the last ten years, which will depend in part on changes in the level of the Company's loan balances, delinquency rates of cardmembers, unemployment rates, the volume of bankruptcies and recoveries of previously written-off loans; • the ability of the Company to maintain and expand its presence in the digital payments space, including as an online payments provider, which will depend on the Company's success in evolving its business models and processes for the digital environment, building partnerships and executing programs with companies, and utilizing digital capabilities that can be leveraged for future growth; • changes affecting the Company's ability to accept or maintain deposits due to market demand or regulatory constraints, such as changes in interest rates and regulatory restrictions on the Company's ability to obtain deposit funding or offer competitive interest rates, which could affect the Company's liquidity position and the Company's ability to fund the Company's business; • the potential failure of the U.S. Congress to renew legislation regarding the active financing exception to Subpart F of the Internal Revenue Code, which could increase the Company's effective tax rate and have an adverse impact on net income; • factors beyond the Company's control such as fire, power loss, disruptions in telecommunications, severe weather conditions, natural disasters, terrorism, "hackers" or fraud, which could affect travel-related spending or disrupt the Company's global network systems and ability to process transactions; and • the Company's funding plan for 2012 being implemented in a manner inconsistent with current expectations, which will depend on various factors such as future business growth, the impact of global economic, political and other events on market capacity, demand for securities offered by the Company, regulatory changes, ability to securitize and sell receivables and the performance of receivables previously sold in securitization transactions. A further description of these uncertainties and other risks can be found in the Company’s Annual Report on Form 10-K for the year ended December 31, 2011, the Company’s Quarterly Reports on Form 10-Q for the quarters ended March 31, June 30 and September 30, 2011, and the Company’s other reports filed with the Securities and Exchange Commission.
46


