1American Institute of Aeronautics and Astronautics
SIMULATION RESULTS ON THE PERFORMANCE OF DIGITAL POLYPHASE CHANNELIZERDr. Rajendra Kumar and Dr. Tien M. Nguyen
The Aerospace Corporation2350 E. El Segundo Blvd.
El Segundo, CA 90245-4691
ABSTRACTSimulation results are presented for theperformance of an end–to-end satellite multipleaccessing system with an FDMA modulation onthe uplink and TDMA modulation on the downlink.The system simulated on the SPW platforminvolves an onboard digital polyphase channelizerwhich first samples the uplink FDMA signal at anappropriate rate close to the minimum and thendigitally demultiplexes the FDMA signal inindividual channels. The individual channels arethen routed to their receivers for detectionpurposes. The results show negligible degradationdue to the channelizer in all the cases consideredin the simulations.
INTRODUCTIONPresent and future generations of satellites needto operate with small earth terminals, mobilevehicle or hand held terminals. In such systemsthe user terminal needs to be relatively lesscomplex and have small power, weight and lowcost requirements. An example of such a systemis mobile messaging service via satellites. In sucha system, a forward link takes messages from anearth station to the satellite, which retransmits tothe mobiles over spot beams. The return linkbegins at the mobiles, goes up to the satellite andterminates at the earth station. In such a system,the types of transmitter/receivers in the forwardand reverse link are quite different and mayinvolve different multiple accessing (MA)techniques on the uplink and downlink for optimumperformance.
In some architectures proposed earlier, the uplinkuses FDMA techniques with low cost andcomplexity terminals while the downlink usesTDMA technique to maximize the satellite radiatedpower without intermodulation noise. In suchsystems the small earth terminals do not need thecapability of transmitting at very high burst ratesand stringent satellite frame synchronizationcapabilities necessary for TDMA transmitter. Inanother architecture, the uplink is based on_____________________1Copyright 2002 by The Aerospace Corporation.Published by the The American Institute ofAeronautics and Astronautics Inc., with permission.
random access techniques while the downlink usesTDMA techniques. The feasibility of mixed mode(different MA techniques on uplink and downlink)accessing requires efficient means of translationbetween the two formats of MA techniques. Interms of implementation considerations of size,weight, cost and flexibility, direct digital techniquesof translation are expected to perform bettercompared to analog techniques. Such translationmay involve conversion of an FDMA signal into aTDM multiplexed signal, which may then gothrough digital switch to various TDMA carriersbeing transmitted over the spot beams. In anotherapplication the digital translation techniques arealso useful in the switching of FDMA carriers todifferent spot beams without requiring arrays ofanalog bandpass filters and converters .
There are several techniques investigated in theliterature1-12 for direct digital translation and/orswitching. These include Analytical Signalapproach1, Polyphase/DFT approach3, FrequencyDomain Filtering approach4 and the Multistageapproach5. These techniques have beencompared in an earlier paper6 where it is seen thatthe Polyphase/DFT approach is the most efficientin terms of computational load. Since thecomputational requirements are the primaryfactors in determining the weight and powerrequirements, the Polyphase/DFT approach isevaluated in more details in terms of simulations inthis paper. In the simulations presented in thispaper an eight channel example system isconsidered with various modulation and band-limiting methods and the performance of the end-to-end system is evaluated in terms of overall lossdue to the channelizer. It is seen from thesimulations that in most of the scenariosconsidered, the degradation attributable to thechannelizer is insignificant. The results for theeight channel case are also representative ofthose expected for higher number of channels, asthe degradation, if any, is expected to comemostly from the adjacent channels.
THE POLYPHASE DFT APPROACHIn the DFT filter bank1 each channel is separatelybandpass modulated by a complex modulator as
20th AIAA International Communication Satellite Systems Conference and Exhibit12-15 May 2002, Montreal, Quebec, Canada
American Institute of Aeronautics and Astronautics2
shown in Figure 1 wherein double lines refer tocomplex-valued signals.
Figure 1a. Single channel of a DFT filter bankanalyzer
Figure 1b. Single channel of a DFT filter banksynthesizer
In the analyzer model, the input signal is
demodulated by the exponential function e j nk− ω ,low pass filtered by the filter h(n) and the resultingsignal is down sampled by a factor M. Thesynthesizer model interpolates all the channelsignals back to their high sampling rate, filters thesignal by filter f(n) to remove the imagingcomponents and modulates the resulting signal by
complex exponential function e j nkω to translate itback to frequency ω k . The output of thesynthesizer is the sum of the K channel outputsignals, i.e.,
$( ) $ ( )x n x nkk
K= ∑
=
−
0
1 (1)
The polyphase realization of the DFT filter bank isbased on the polyphase implementation of thedecimators and interpolators4-6. Such a realizationis relatively simple for the case of criticallysampled filter banks wherein M=K. In this case thenumber of independent channels Nc is also equalto K. Designs for other choices of M and K arerelatively more complex. In the case of M=K, thecenter frequencies of the K frequency bands aregiven by
ω πk
kK
= 2; k=0,1,...,K-1; K=M
The analyzer-synthesizer model of figure 1 can beshown to be equivalent to the Integer band modelof Figure 2.
Figure 2a. Single channel of the Integer bandmodel analyzer
Figure 2b. Single channel of the Integer bandmodel synthesizer
In Figure 2 the filter impulse response functionsare given by
h n h n Wk Kkn( ) ( )= ; W e WK
j KM= =2π / (2a)
knKk W)n(f)n(f = (2b)
It is apparent from Figure 3a in view of equation(2) that
X m h n W x mM nk Mkn
n( ) ( ) ( )= −∑
=−∞
∞ (3)
With change of variables n = rM-i, and with someappropriate manipulations, equation (3) may bededuced to equation (4) below.
X m p r W x m rk i Mki
ir
r
i
M( ) ( ) ( )= −∑∑ −
=−∞
=∞
=
−
0
1(4a)
= W p m x mMki
i ii
M −
=
−⊗∑ [ ( ) ( )]
0
1 (4b)
where ⊗ denotes convolution, )m(pi is theimpulse response of the I th polyphase branchgiven in terms of h(n) as
)imM(h)m(pi −= ; I=0,1,…, M-1 (5a)
and branch input signals x mi ( ) are given byx m x mM ii ( ) ( )= + (5b)
Equation (4) leads to the polyphase DFT filterbank structure of Figure 3a.
Figure 3a. Polyphase DFT filter bank analysisstructure
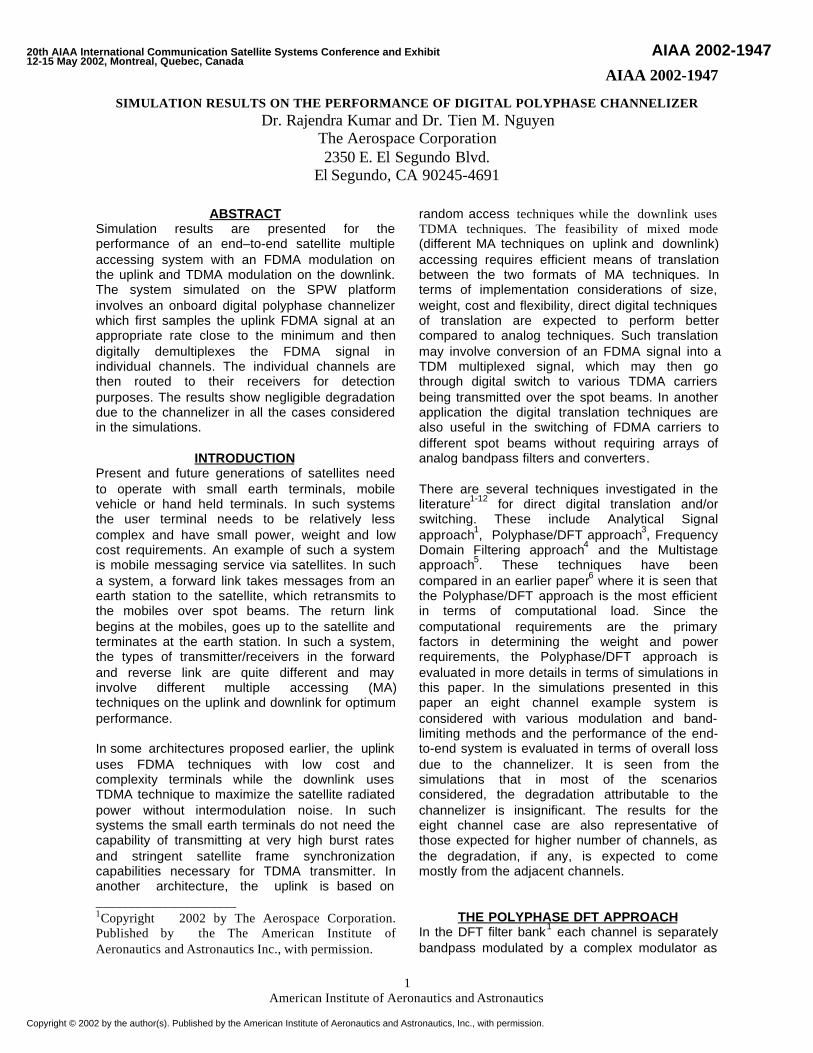
Similarly the polyphase DFT filter bank synthesisstructure is derived as shown in Figure 3b wherein
)imM(f)m(q i += ; i=0,1,..., M-1 (6)
American Institute of Aeronautics and Astronautics3
Figure 3b. Polyphase DFT filter bank synthesisstructure
The polyphase implementation has the advantageof reducing the computational requirements byorder K compared to direct form. In terms ofpolyphase branch filter design there are two broadcategories of design, viz., FIR and IIR filters7. TheFIR filters can be designed on the basis ofwindows (e.g. Hamming, Hanning or Kaiser),optimal equiripple linear phase design (e.g. basedon Chebyshev approximation and multi-exchangeRemez algorithm), Half Band filters which furtherreduce the computational requirements, and filterdesigns based on direct optimization of a criterionfunction. The IIR filter can be designed as inclassical approach or may be based on atransformation8 wherein the denominator is apolynomial in ZM and thereby exploits theInterpolator/Decimator structure to minimize thecomputational requirements3. In the examplespresented in this paper, the analyzer andsynthesizer filters are linear phase Parks-McClellan type based on Remez exchangealgorithm.
The polyphase implementation effectively allowssharing one lowpass filter among all the channelswith the help of FFT transform. The total numberof real multiplications required per second perchannel is found to be12
+−
δδ
= )N(log4)B2w(
)]10/(1log[3
2
w2M C2
21
PDFT (7)
where the parameters found in (7) have beendefined earlier.
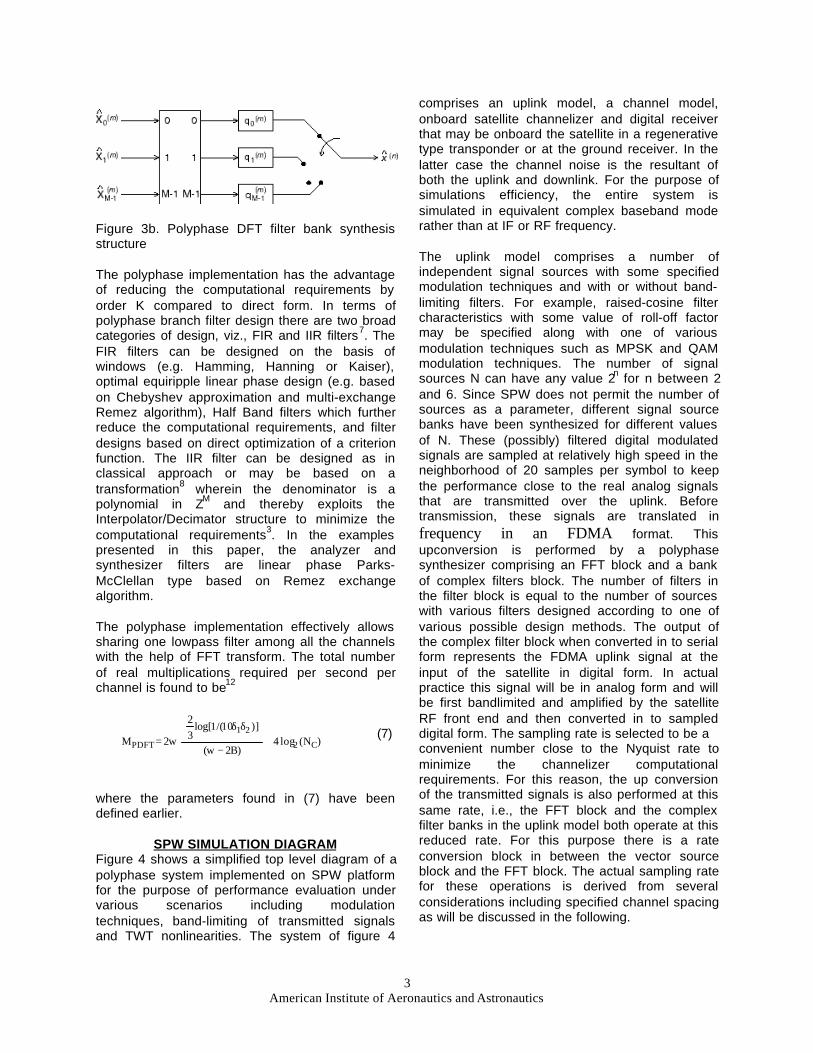
SPW SIMULATION DIAGRAMFigure 4 shows a simplified top level diagram of apolyphase system implemented on SPW platformfor the purpose of performance evaluation undervarious scenarios including modulationtechniques, band-limiting of transmitted signalsand TWT nonlinearities. The system of figure 4
comprises an uplink model, a channel model,onboard satellite channelizer and digital receiverthat may be onboard the satellite in a regenerativetype transponder or at the ground receiver. In thelatter case the channel noise is the resultant ofboth the uplink and downlink. For the purpose ofsimulations efficiency, the entire system issimulated in equivalent complex baseband moderather than at IF or RF frequency.
The uplink model comprises a number ofindependent signal sources with some specifiedmodulation techniques and with or without band-limiting filters. For example, raised-cosine filtercharacteristics with some value of roll-off factormay be specified along with one of variousmodulation techniques such as MPSK and QAMmodulation techniques. The number of signalsources N can have any value 2n for n between 2and 6. Since SPW does not permit the number ofsources as a parameter, different signal sourcebanks have been synthesized for different valuesof N. These (possibly) filtered digital modulatedsignals are sampled at relatively high speed in theneighborhood of 20 samples per symbol to keepthe performance close to the real analog signalsthat are transmitted over the uplink. Beforetransmission, these signals are translated infrequency in an FDMA format. Thisupconversion is performed by a polyphasesynthesizer comprising an FFT block and a bankof complex filters block. The number of filters inthe filter block is equal to the number of sourceswith various filters designed according to one ofvarious possible design methods. The output ofthe complex filter block when converted in to serialform represents the FDMA uplink signal at theinput of the satellite in digital form. In actualpractice this signal will be in analog form and willbe first bandlimited and amplified by the satelliteRF front end and then converted in to sampleddigital form. The sampling rate is selected to be aconvenient number close to the Nyquist rate tominimize the channelizer computationalrequirements. For this reason, the up conversionof the transmitted signals is also performed at thissame rate, i.e., the FFT block and the complexfilter banks in the uplink model both operate at thisreduced rate. For this purpose there is a rateconversion block in between the vector sourceblock and the FFT block. The actual sampling ratefor these operations is derived from severalconsiderations including specified channel spacingas will be discussed in the following.
American Institute of Aeronautics and Astronautics4
White Gaussian noise is added to the uplink.FDMA signal at the input to the satellite. Thenoisy signal is input to the polyphase channelizercomprising scalar to vector converter, a complexfilter bank, complex FFT block and a gain block. Inan other model studied, a model of TWTAnonlinearity is placed before the channelizer toevaluate the its impact on the overall performance.Individual signals at the channelizer output are
input to their receivers for digital signal detection.For simplicity the figure shows only one receiverconnected to the selected channel. The simulationstudy includes several receiver configurationsincluding one wherein carrier phase and symboltiming are assumed known to the receiver toisolate the impact of carrier and symbol timingtracking loops on the overall system performancefor comparative evaluation.
Figure 4. SPW Implementation of End –to-End Hybrid MA Satellite Communication System
SIMULATION RESULTSIn the first example, QPSK signaling is consideredwith band limiting using raised cosine filtercharacteristics with roll off factor r equal to 0.5.The number of channels N is equal to 8. Eachsource is sampled at a rate two times the sourcesymbol rate, i.e., ssymb T2T = , where symbTand Ts denote the symbol period and sampleperiod respectively. The sampling rate of thepolyphase analyzer/synthesizer is equal to
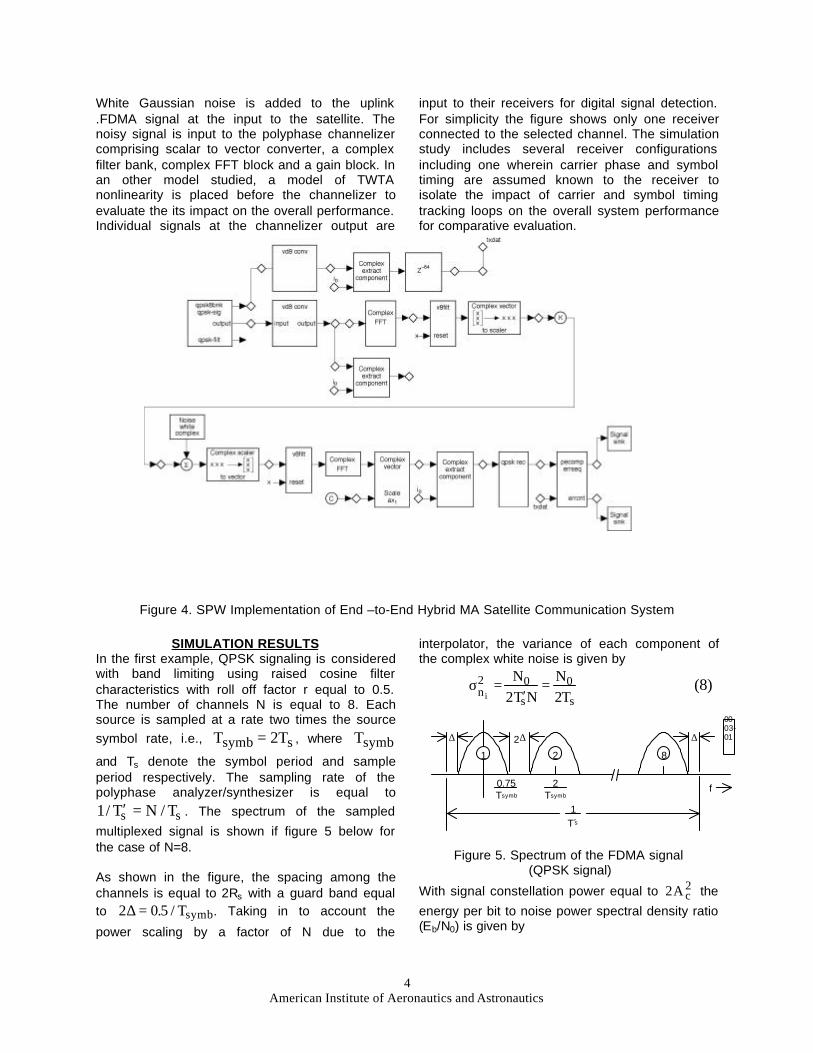
ss T/NT/1 =′ . The spectrum of the sampledmultiplexed signal is shown if figure 5 below forthe case of N=8.
As shown in the figure, the spacing among thechannels is equal to 2Rs with a guard band equalto symbT/5.02 =∆ . Taking in to account the
power scaling by a factor of N due to the
interpolator, the variance of each component ofthe complex white noise is given by
s
0
s
02n T2
NNT2
Ni
=′
=σ (8)
Figure 5. Spectrum of the FDMA signal (QPSK signal)
With signal constellation power equal to 2cA2 the
energy per bit to noise power spectral density ratio(Eb/N0) is given by
0003-01
Tsymb
0.75Tsymb
2 f
1 2 8
T´1
s
∆ 2∆ ∆
American Institute of Aeronautics and Astronautics5
2n
2c
s2n
b2c
0
b
ii
A
T2
TA2NE
σ=
σ= (9)
where Tb is the bit period. With Ac selected equalto 1 in the simulations
)N/E/(1 0b2n i
=σ
The theoretical probability of bit error for QPSKmodulation (no channelization) is given by any ofthe following expressions
( )
σ== 2
n0be i/2QN/E2QP
)/1(erfc5.0inσ= (10)
with symbol probability PE equal to 2Pe.
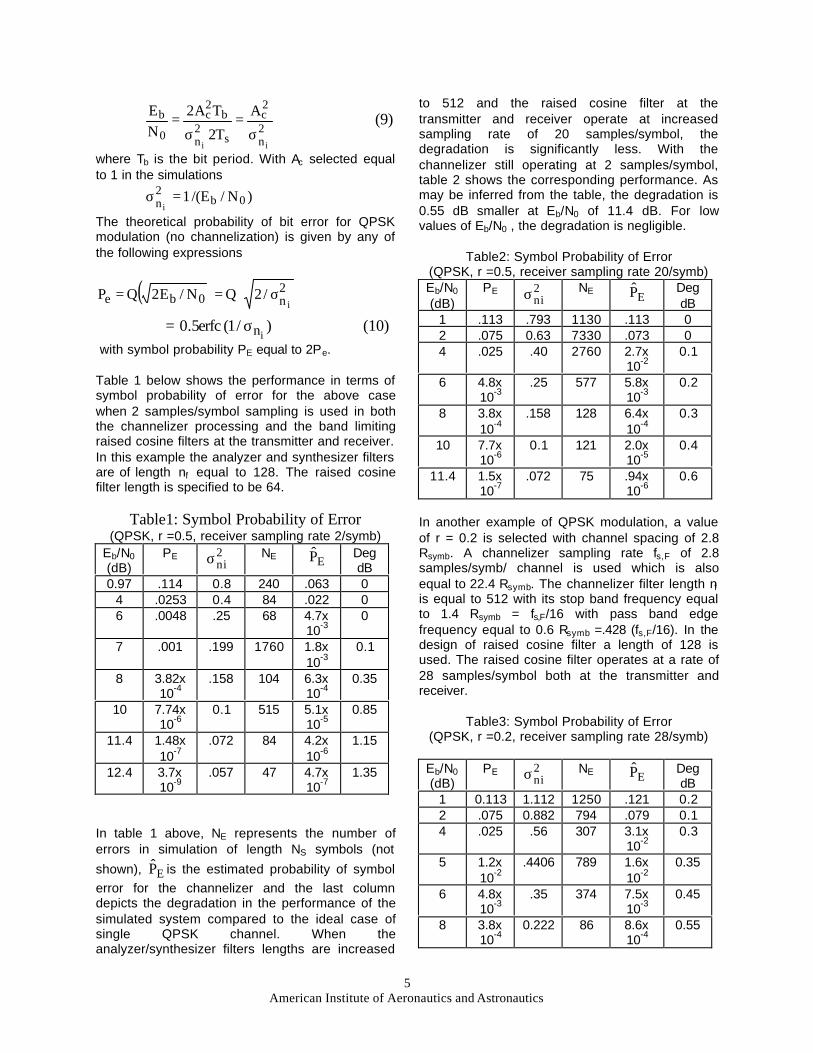
Table 1 below shows the performance in terms ofsymbol probability of error for the above casewhen 2 samples/symbol sampling is used in boththe channelizer processing and the band limitingraised cosine filters at the transmitter and receiver.In this example the analyzer and synthesizer filtersare of length nf equal to 128. The raised cosinefilter length is specified to be 64.
Table1: Symbol Probability of Error(QPSK, r =0.5, receiver sampling rate 2/symb)
Eb/N0 (dB)
PE 2niσ NE EP̂ Deg
dB0.97 .114 0.8 240 .063 0
4 .0253 0.4 84 .022 06 .0048 .25 68 4.7x
10-30
7 .001 .199 1760 1.8x10⁻³
0.1
8 3.82x10⁻⁴
.158 104 6.3x10⁻⁴
0.35
10 7.74x10⁻⁶
0.1 515 5.1x10⁻⁵
0.85
11.4 1.48x10⁻⁷
.072 84 4.2x10⁻⁶
1.15
12.4 3.7x10⁻⁹
.057 47 4.7x10⁻⁷
1.35
In table 1 above, NE represents the number oferrors in simulation of length NS symbols (notshown), EP̂ is the estimated probability of symbolerror for the channelizer and the last columndepicts the degradation in the performance of thesimulated system compared to the ideal case ofsingle QPSK channel. When theanalyzer/synthesizer filters lengths are increased
to 512 and the raised cosine filter at thetransmitter and receiver operate at increasedsampling rate of 20 samples/symbol, thedegradation is significantly less. With thechannelizer still operating at 2 samples/symbol,table 2 shows the corresponding performance. Asmay be inferred from the table, the degradation is0.55 dB smaller at Eb/N0 of 11.4 dB. For lowvalues of Eb/N0 , the degradation is negligible.
Table2: Symbol Probability of Error(QPSK, r =0.5, receiver sampling rate 20/symb)Eb/N0
In another example of QPSK modulation, a valueof r = 0.2 is selected with channel spacing of 2.8Rsymb. A channelizer sampling rate fs,F of 2.8samples/symb/ channel is used which is alsoequal to 22.4 Rsymb. The channelizer filter length nfis equal to 512 with its stop band frequency equalto 1.4 Rsymb = fs,F/16 with pass band edgefrequency equal to 0.6 Rsymb =.428 (fs,F/16). In thedesign of raised cosine filter a length of 128 isused. The raised cosine filter operates at a rate of28 samples/symbol both at the transmitter andreceiver.
Table3: Symbol Probability of Error(QPSK, r =0.2, receiver sampling rate 28/symb)
American Institute of Aeronautics and Astronautics6
8-PSK ModulationFor the case of 8 PSK modulation, in a mannersimilar to the case of QPSK modulation, the noise
variance 2n i
σ may be shown to be equal to
2c
0b
2n
A)N/E(3
1i
α=σ (11)
where α=Tsymb/Ts, and 2cA2 is equal to the
constellation power. For the case of MPSKmodulation the probability of symbol error is givenby
)}M/sin(N
Ek2{Q2P
0
bE π≅
)}M/sin(N
Ek{erfc
0
b π= (12)
where k=log2(M) and is equal to 3 for the 8 PSKcase. Substituting the expression (11) in (12)yields the following equivalent expression for the8-PSK signal.
)/5804(.erfcPinE σ= (13)
Two cases of the band-limiting filtering areconsidered for the case of 8 PSK modulation. Inthe first case a square root raised cosine filter isused both at the transmitter and receiver with a rolloff factor equal to 0.2. A sampling rate of 23samples/symbol is used for these filters, while thesampling rate fs,F equal to 2.3samples/symbol/channel is used for the digitalchannelizer. The channel spacing is equal to 2.3Rsymb with the polyphase filter passband edge
Figure 6. Spectrum of FDMA signal(8-PSK modulation)
frequency equal to 0.6 Rsymb=.261(fs,F/8) and itsband stop frequency equal to 1.15 Rsymb=.5(fs,F/8).The channelizer filter length nf is selected equal to512. Figure 6 depicts the spectrum of thepolyphase channelizer synthesizer output. Toevaluate the impact of square root raised cosine
filter length nrc, two values of this length equal to256 and 128 are considered in the simulations.
Tables 4-5 present the performance for the 8-PSKmodulation as described above. Relatively lowvalues of (Eb/N0) are considered in this simulationrepresenting the case of coded data.
Table4: Symbol Probability of Error(8-PSK, r =0.2, nrc=256,
From tables 5 and 6 one observes that whilelonger filter length for the raised cosine filter isbetter at higher (Eb/N0), the opposite is true for thelower (Eb/N0).
In the second case no-band limiting is performedon the 8-PSK signal with all other parameterssame as in the first case. However, the receiverhas a low pass filter of fifth order Butterworth typewith its pass band edge frequency equal to Rsymband an attenuation of 1 dB at this frequency. Thefilter operates at a rate of 23 samples/sec. Severalpossible filters were evaluated, however theperformance difference among different filters wasrelatively small. Note that there is a substantial
0004
-01
Tsymb
0.6Tsymb
2.3 f
1 2 8
T´1
s
∆∆
American Institute of Aeronautics and Astronautics7
improvement due to resampling and low passfiltering at the receiver compared to the casewhere the channelizer output at a rate of 2.3samples/symbol is directly input to the detector. Inthis way the computational load on board thesatellite is kept to a minimum without anyperformance loss.
Table6: Symbol Probability of Error(unfiltered 8-PSK, receiver sampling rate 23/symb)
It should be noted that most of the performanceloss in this case occurs due to the absence of anysignal spectral shaping (such as raised cosine)and the resulting inter channel interference arisingdue to adjacent channels whose spectrumoverlaps with each other. Also the degradationarises due to the sharp channel filter (provided bythe digital channelizer) resulting in intersymbolinterference. In the absence of such filter the inter-channel interference will be even higher. Thus theperformance is similar to that obtained by filteringan 8-PSK signal with a sharp filter of bandwidthclose to Rsymb as will be demonstrated below.
16-QAM SignalIn this case the variance of sampled noise in eachof the I and Q channels is given by
2c
0b
2n
A)N/E(3
1i
α=σ (14)
where as in the previous case where α =Tsymb/Ts,
and 2cA2 is equal to the constellation power. For
the case of MQAM modulation the probability ofsymbol error is given by
2MME PP2P −= (15)
with M
P denoting the probability of error for a
PAM signal (assuming that M is an integer)and given by
}N
E)
1M
3({Q)
M
11(2P
0
sM −
−= (16)
In equation (16) (Es/N0) denotes the average SNRper symbol for the QAM signal. For the case of Mequal to 16 considered here, the expressionreduces to
})N/E(8.0{Q5.1P 0bM= (17)
In this case the channel spacing is specified to be2.1Rsymb. Thus a sampling rate fs,F equal to 2.1samples/symbol/channel is selected for thepolyphase processing. A 512 order linear phaseParks-McClellan filter is used with its pass bandedge frequency equal to Rsymb= (.476/8)fs,F andstop band frequency equal to 1.05Rsymb=(.5/8)fs,F.The receiver uses a Butterworth low pass filteroperating at a rate of 21 samples/symbol beforethe detection process, as for the case of unfiltered8-PSK signal.
Table7: Symbol Probability of Error(unfiltered 16 QAM, receiver sampling rate
Impact of TWTA nonlinearityThe above simulations assumed that the systemdid not involve any nonlinearity. However, thepower amplifiers such as the TWTA amplifier onboard the satellite or the Klystron at the earthterminal do exhibit some non-linear behaviorresulting in possible performance loss. In the
American Institute of Aeronautics and Astronautics8
following simulation results are presented for themodulation schemes considered above which alsotake in to account the nonlinear model of theTWTA.
Table 8 : Symbol Probability of Error(QPSK, r =0.2, receiver sampling rate 28/symb,
Single channel with brickwall filterFrom tables 6 and 7 for the unfiltered 8 PSK and16 QAM signals respectively, it is apparent thatthere is significant performance loss compared tothe case of single channel transmission withraised-cosine filter characteristics or without anyband-limiting of the signal. Such a loss may beerroneously attributed to the channelizer.However, when a single channel is simulated witha (brickwall) receiver filter characteristics similar tothat of channelizer filter, it is observed that thesame performance loss occurs as in the case ofmultiple channel channelizer. Such a loss is thusprimarily due to the increased intersymbolinterference and some power loss due to the lowpass filter. Figure 7 shows the frequency andimpulse response of the low pass filter used in thesimulations. The filter is of 512 taps and is linearphase Parks-McClellan filter based on Remezexchange algorithm exhibiting equi-rippleresponse. The pass band and stop band edgefrequencies are equal to 1Rsymb and 1.1 Rsymb
respectively with sampling frequency equal to 20Rsymb.
Figure 7. Frequency and impulse response of theLPF
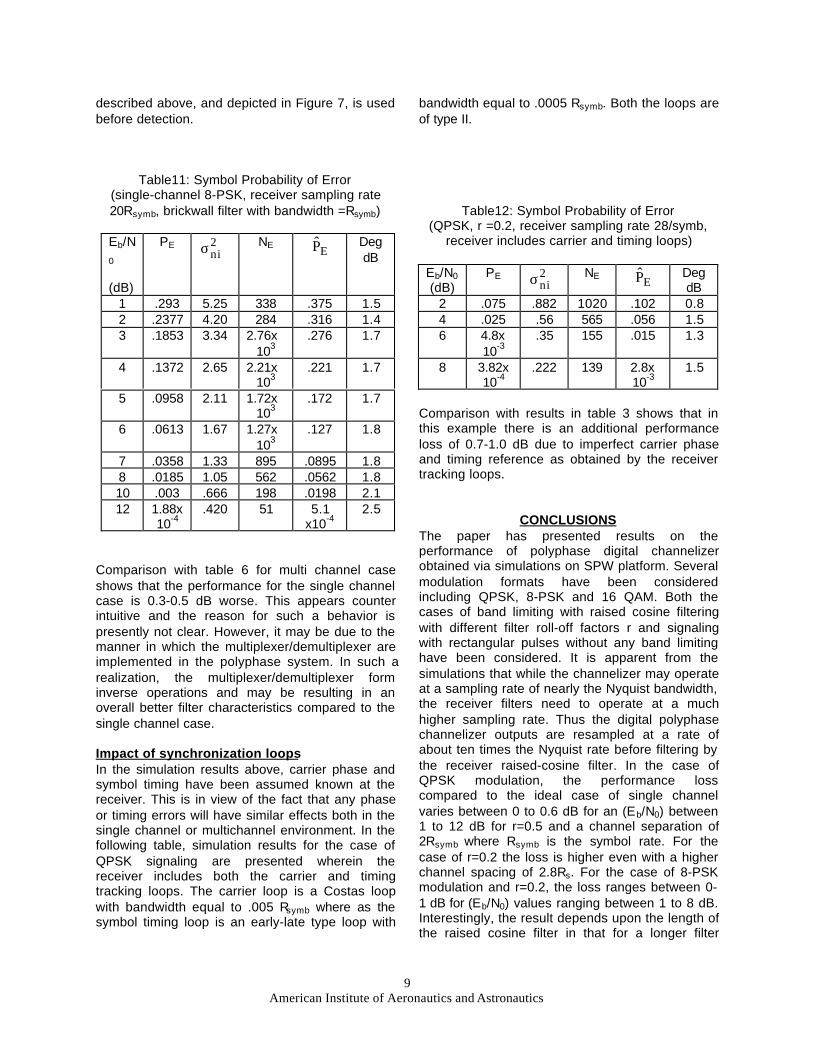
Table 11 below shows the performance of thesingle channel unfiltered 8 PSK signal when at thereceiver a low pass filter of characteristics
0002
-01
0.2
0.1
0
–0.1
Frequency response
–38
0
–68
–88
–188
3.142
0
–3.142
Mag
, dB
Pha
se, r
adia
ns
0.5 1.0 1.5
Impulse response
American Institute of Aeronautics and Astronautics9
described above, and depicted in Figure 7, is usedbefore detection.
Table11: Symbol Probability of Error(single-channel 8-PSK, receiver sampling rate20Rsymb, brickwall filter with bandwidth =Rsymb)
Comparison with table 6 for multi channel caseshows that the performance for the single channelcase is 0.3-0.5 dB worse. This appears counterintuitive and the reason for such a behavior ispresently not clear. However, it may be due to themanner in which the multiplexer/demultiplexer areimplemented in the polyphase system. In such arealization, the multiplexer/demultiplexer forminverse operations and may be resulting in anoverall better filter characteristics compared to thesingle channel case.
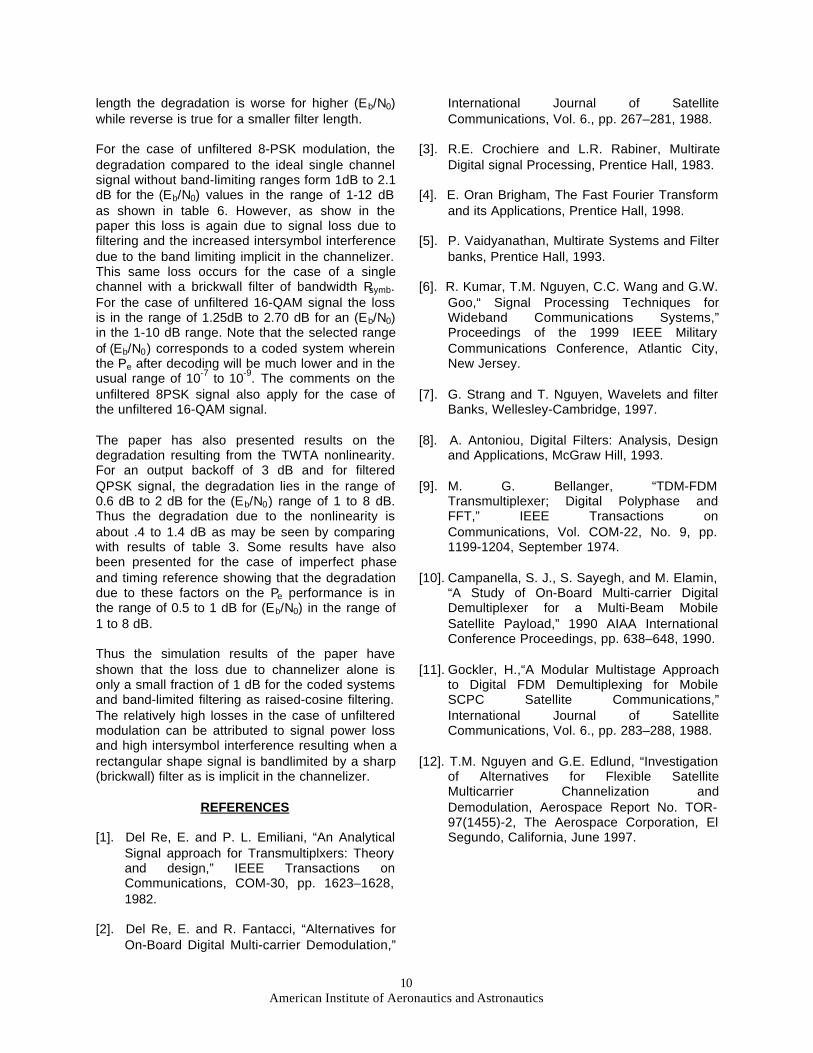
Impact of synchronization loopsIn the simulation results above, carrier phase andsymbol timing have been assumed known at thereceiver. This is in view of the fact that any phaseor timing errors will have similar effects both in thesingle channel or multichannel environment. In thefollowing table, simulation results for the case ofQPSK signaling are presented wherein thereceiver includes both the carrier and timingtracking loops. The carrier loop is a Costas loopwith bandwidth equal to .005 Rsymb where as thesymbol timing loop is an early-late type loop with
bandwidth equal to .0005 Rsymb. Both the loops areof type II.
Table12: Symbol Probability of Error(QPSK, r =0.2, receiver sampling rate 28/symb,
Comparison with results in table 3 shows that inthis example there is an additional performanceloss of 0.7-1.0 dB due to imperfect carrier phaseand timing reference as obtained by the receivertracking loops.
CONCLUSIONSThe paper has presented results on theperformance of polyphase digital channelizerobtained via simulations on SPW platform. Severalmodulation formats have been consideredincluding QPSK, 8-PSK and 16 QAM. Both thecases of band limiting with raised cosine filteringwith different filter roll-off factors r and signalingwith rectangular pulses without any band limitinghave been considered. It is apparent from thesimulations that while the channelizer may operateat a sampling rate of nearly the Nyquist bandwidth,the receiver filters need to operate at a muchhigher sampling rate. Thus the digital polyphasechannelizer outputs are resampled at a rate ofabout ten times the Nyquist rate before filtering bythe receiver raised-cosine filter. In the case ofQPSK modulation, the performance losscompared to the ideal case of single channelvaries between 0 to 0.6 dB for an (Eb/N0) between1 to 12 dB for r=0.5 and a channel separation of2Rsymb where Rsymb is the symbol rate. For thecase of r=0.2 the loss is higher even with a higherchannel spacing of 2.8Rs. For the case of 8-PSKmodulation and r=0.2, the loss ranges between 0-1 dB for (Eb/N0) values ranging between 1 to 8 dB.Interestingly, the result depends upon the length ofthe raised cosine filter in that for a longer filter
American Institute of Aeronautics and Astronautics10
length the degradation is worse for higher (Eb/N0)while reverse is true for a smaller filter length.
For the case of unfiltered 8-PSK modulation, thedegradation compared to the ideal single channelsignal without band-limiting ranges form 1dB to 2.1dB for the (Eb/N0) values in the range of 1-12 dBas shown in table 6. However, as show in thepaper this loss is again due to signal loss due tofiltering and the increased intersymbol interferencedue to the band limiting implicit in the channelizer.This same loss occurs for the case of a singlechannel with a brickwall filter of bandwidth Rsymb.For the case of unfiltered 16-QAM signal the lossis in the range of 1.25dB to 2.70 dB for an (Eb/N0)in the 1-10 dB range. Note that the selected rangeof (Eb/N0) corresponds to a coded system whereinthe Pe after decoding will be much lower and in theusual range of 10-7 to 10-9. The comments on theunfiltered 8PSK signal also apply for the case ofthe unfiltered 16-QAM signal.
The paper has also presented results on thedegradation resulting from the TWTA nonlinearity.For an output backoff of 3 dB and for filteredQPSK signal, the degradation lies in the range of0.6 dB to 2 dB for the (Eb/N0) range of 1 to 8 dB.Thus the degradation due to the nonlinearity isabout .4 to 1.4 dB as may be seen by comparingwith results of table 3. Some results have alsobeen presented for the case of imperfect phaseand timing reference showing that the degradationdue to these factors on the Pe performance is inthe range of 0.5 to 1 dB for (Eb/N0) in the range of1 to 8 dB.
Thus the simulation results of the paper haveshown that the loss due to channelizer alone isonly a small fraction of 1 dB for the coded systemsand band-limited filtering as raised-cosine filtering.The relatively high losses in the case of unfilteredmodulation can be attributed to signal power lossand high intersymbol interference resulting when arectangular shape signal is bandlimited by a sharp(brickwall) filter as is implicit in the channelizer.
REFERENCES
[1]. Del Re, E. and P. L. Emiliani, “An AnalyticalSignal approach for Transmultiplxers: Theoryand design,” IEEE Transactions onCommunications, COM-30, pp. 1623–1628,1982.
[2]. Del Re, E. and R. Fantacci, “Alternatives forOn-Board Digital Multi-carrier Demodulation,”
International Journal of SatelliteCommunications, Vol. 6., pp. 267–281, 1988.
[3]. R.E. Crochiere and L.R. Rabiner, MultirateDigital signal Processing, Prentice Hall, 1983.
[4]. E. Oran Brigham, The Fast Fourier Transformand its Applications, Prentice Hall, 1998.
[5]. P. Vaidyanathan, Multirate Systems and Filterbanks, Prentice Hall, 1993.
[6]. R. Kumar, T.M. Nguyen, C.C. Wang and G.W.Goo,“ Signal Processing Techniques forWideband Communications Systems,”Proceedings of the 1999 IEEE MilitaryCommunications Conference, Atlantic City,New Jersey.
[7]. G. Strang and T. Nguyen, Wavelets and filterBanks, Wellesley-Cambridge, 1997.
[8]. A. Antoniou, Digital Filters: Analysis, Designand Applications, McGraw Hill, 1993.
[9]. M. G. Bellanger, “TDM-FDMTransmultiplexer; Digital Polyphase andFFT,” IEEE Transactions onCommunications, Vol. COM-22, No. 9, pp.1199-1204, September 1974.
[10]. Campanella, S. J., S. Sayegh, and M. Elamin,“A Study of On-Board Multi-carrier DigitalDemultiplexer for a Multi-Beam MobileSatellite Payload,” 1990 AIAA InternationalConference Proceedings, pp. 638–648, 1990.
[11]. Gockler, H.,“A Modular Multistage Approachto Digital FDM Demultiplexing for MobileSCPC Satellite Communications,”International Journal of SatelliteCommunications, Vol. 6., pp. 283–288, 1988.
[12]. T.M. Nguyen and G.E. Edlund, “Investigationof Alternatives for Flexible SatelliteMulticarrier Channelization andDemodulation, Aerospace Report No. TOR-97(1455)-2, The Aerospace Corporation, ElSegundo, California, June 1997.
Filename: paper_simulation results_AIAADirectory: C:\milsatTemplate: C:\Program Files\Microsoft Office\Templates\NORMAL.DOTTitle: Simulation Results on the performance of Digital Polyphase
ChannelizerSubject:Author: Rajendra KumarKeywords:Comments:Creation Date: 01/29/02 10:22 AMChange Number: 22Last Saved On: 04/04/02 2:26 PMLast Saved By: Rajendra KumarTotal Editing Time: 322 MinutesLast Printed On: 04/11/02 10:40 AMAs of Last Complete Printing
Number of Pages: 10Number of Words: 4,841 (approx.)Number of Characters: 27,595 (approx.)