American Institute of Aeronautics and Astronautics
1
A Statistical Analysis of Particle Swarm Optimization With and Without Digital Pheromones
Vijay Kalivarapu* and Eliot Winer† Iowa State University, Ames, IA, 50011, USA
Particle Swarm Optimization (PSO) is a population based heuristic search method for finding global optimal values in multi-disciplinary design optimization problems. PSO is based on simple social behavior exhibited by birds and insects. Due to its simplicity in implementation, PSO has been increasingly gaining popularity in the optimization community. Previous work by the authors demonstrated superior design space search capabilities of particle swarm through implementing digital pheromones in a regular PSO. Although preliminary results showed substantial performance gains, a quantitative assessment has not yet been made to prove the claim. Through a formal statistical hypothesis testing, this paper attempts to evaluate the performance characteristics of PSO with digital pheromones. Specifically, the authors’ claim that the use of digital pheromones improves the solution quality and solution times are tested using various multi-dimensional unconstrained optimization test problems. Conclusions are drawn based on the results from statistical analysis of these test problems and presented in the paper.
I. � Introduction euristic optimization techniques such as Genetic Algorithms (GA) and Simulated Annealing (SA) are capable of exhaustively investigating design spaces to locate global optimal design points. Heuristic techniques are
primarily zero order methods that neither requires design spaces to be continuous nor need derivative information. As such, they are a very popular choice in place of traditional deterministic methods for solving multi-modal optimization problems. A drawback to these methods however is their computational expense and complexity.
PSO 1,2 is a population based heuristic method retaining many characteristics of evolutionary search algorithms such as GA and SA. It is a recent addition to global search methods 3 and one of its key features is its simplicity in implementation due to a small number of parameters to adjust 4, 5. In a regular PSO, an initial randomly generated population swarm (a collection of particles) propagates towards the global optimum over a series of iterations. Each particle in the swarm explores the design space based on the information provided by two members – the best position of a swarm member in its history trail (pBest), and the best position attained by all particles (gBest) until that iteration. This information is used to generate a velocity vector indicating a search direction towards a promising design point, and the location of each swarm member is updated. However, the drawback of this approach is that information from these two members alone is not sufficient for the swarm to propagate toward the global optimum efficiently. This either could cause the swarm to lock into a local minimum or take very long time to reach the global optimum. Previous work by the authors demonstrated promising performance improvement of PSO in terms of increased solution accuracy and decreased solution times through implementing digital pheromones in PSO 6, 7. A quantitative assessment of the developed method has not yet been made to prove the claim. Using standard multi-dimensional and multi-modal benchmark problems, this paper attempts to report the findings and conclusions obtained through statistical hypothesis testing of PSO with and without digital pheromones.
II. � Background A. Particle Swarm Optimization
* Research Assistant, Department of Mechanical Engineering, Human Computer Interaction, Virtual Reality Applications Center, 2274 Howe Hall, Iowa State University, Ames, IA, 50011, USA, Student Member. † Assistant Professor, Department of Mechanical Engineering, Human Computer Interaction, Virtual Reality Applications Center, 2274 Howe Hall, Iowa State University, Ames, IA, 50011, USA, Member.
H
48th AIAA/ASME/ASCE/AHS/ASC Structures, Structural Dynamics, and Materials Conference<br> 15th23 - 26 April 2007, Honolulu, Hawaii
American Institute of Aeronautics and Astronautics
2
PSO shares many characteristics of evolutionary search algorithms such as Genetic Algorithms (GA) and Simulated Annealing (SA) – a) Initialization with a population of random solutions, b) Design space search for optimum through updating generations and c) Update based on previous generations 8. The success of the algorithm has brought substantial attention among the research community in the recent past 9, 10. The working of the algorithm is based on a simplified social model similar to the swarming behavior exhibited by insects and birds. In this analogy, a swarm member uses its own memory and the behavior of the rest of the swarm to determine the suitable location of food (global optimum). The algorithm iteratively updates the direction of the swarm movement toward the global optimum. The mathematical formulation of the method is given in Equations (1) and (2).
‘pBest’ represents the best position attained by a swarm member in its history trail, and ‘gBest’ represents the
best position attained by the swarm in the entire iteration history. Equation (1), represents the velocity vector update of a traditional PSO method where randp() and randg() are random numbers generated between 0 and 1 each for pBest and gBest. c1 and c2 are confidence parameters. wi is called as the inertia weight 11, 12 and decreases in every iteration by a factor of λw, as represented in Equation (3). Equation (2) denotes the updated swarm location in the design space.
In addition to the originally developed PSO algorithm, significant enhancements have been proposed such as: a)
mutation factors for better design space exploration 13, 14, b) methods for constraint handling 15, 16, c) parallel implementation 17, 18, d) methods for solving multi-objective optimization problems 19, e) methods for solving mixed discrete, integer and continuous variables 20.
B. PSO and Digital Pheromones
Pheromones are chemical scents produced by insects to communicate with each other to find a suitable food source, nesting location, etc. The stronger the pheromone, the more the insects are attracted to the path. A digital pheromone is analogous to an insect generated pheromone in that they are the markers to determine whether or not an area is promising for further investigation. One of the well-known applications of digital pheromones is its use in the automatic adaptive swarm management of Unmanned Aerial Vehicles (UAVs) 21, 22. In this research, the UAVs are automatically guided towards a specific zone or target through releasing digital pheromones in a virtual environment, thereby reducing the requirement of humans physically controlling from ground stations. Other applications of digital pheromones include ant colony optimization for solving minimum cost paths in graphs 23, 24 solving network communication problems 25. The concept of digital pheromones is considerably new 26 and has not yet been explored to its full potential for investigating n-dimensional design spaces for locating an optimum.
In a regular PSO algorithm, the swarm movement obtains design space information from only two components – pBest and gBest. When coupled with an additional pheromone component, the swarm is essentially presented with more information for design space exploration and has a potential to reach the global optimum faster.
C. Statistical Hypothesis Testing
In statistical terms, a population is a group or individual that represents all members of a certain category of interest. A sample is a subset drawn from the population. Descriptive statistics apply only to the members of a sample of data collected from the population. Inferential statistics, on the other hand refer to the use of sample data to reach conclusions about the characteristics of the population that the sample represents. A hypothesis is typically a statement about the parameters in a population distribution. It is called as hypothesis because it is not known whether the statement is true or not. The primary objective of hypothesis testing is to test whether or not the values of a random sample from the population is consistent with the claimed hypothesis or not. The hypothesis is considered as ‘accepted’ if the random sample is consistent with the hypothesis under consideration. Else, the hypothesis is considered as ‘rejected’ 27, 28, 29, 30.
Previous research on digital pheromones for use in PSO has produced significant improvement strides in terms of solution quality and solution times. This paper attempts to quantitatively evaluate this claim through formal hypothesis testing. The rest of the paper is organized as follows: An overview of digital pheromones in PSO is provided followed by various considerations and steps observed for performing the hypothesis testing. The findings
American Institute of Aeronautics and Astronautics
3
Evaluate fitness value of each swarm member
Store pBest and gBest
Start Iterations
Decay digital pheromones in the design space (if any)
Populate particle swarm with random initial values
Merge pheromones based on relative distance between each
1st iteration?
Find target pheromone toward which the swarm moves
Update velocity vector and position of the swarm
Converged?
STOP!
No Yes
50% of swarm randomly chosen to release pheromones Only improved particles release pheromones
No
Yes
are reported and conclusions are then drawn based on testing the solution quality and timings of five different multi-modal multi-dimensional unconstrained optimization problems.
III. � Methodology
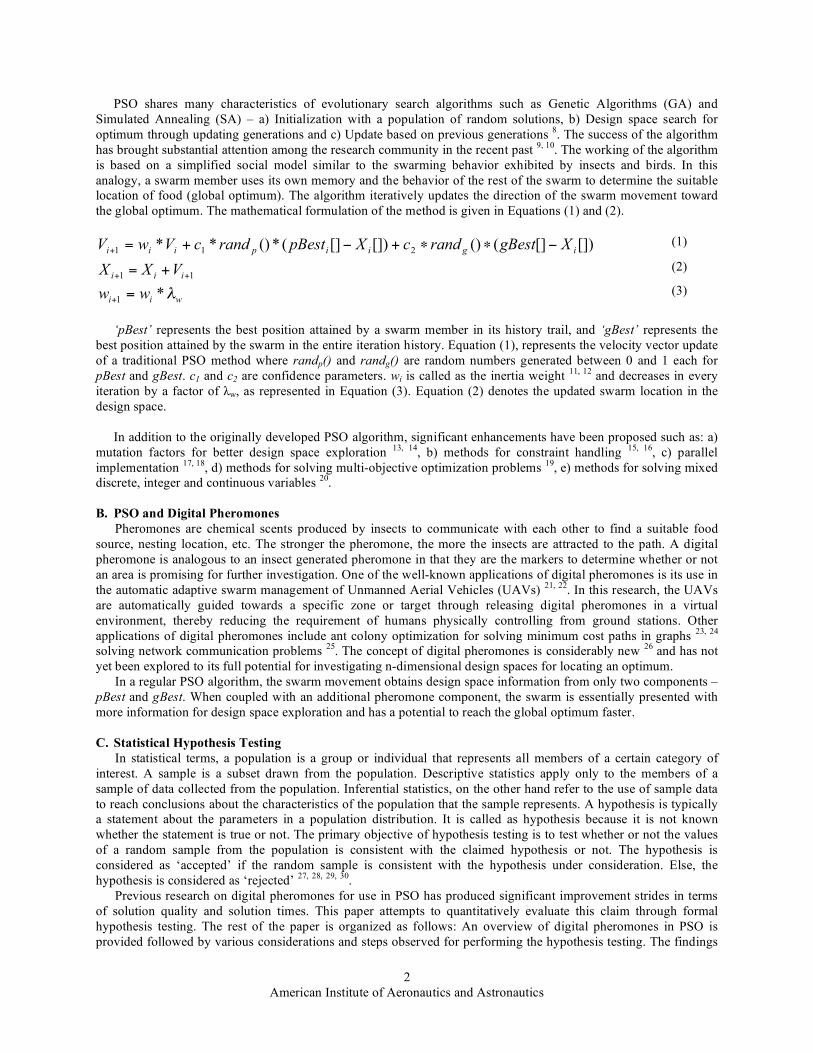
A. Overview of digital pheromones in PSO Figure 1 summarizes the procedure for PSO, with steps involving digital pheromones highlighted in blue.
Figure 1 Overview of PSO with Digital Pheromones
The initialization of pheromone-based PSO is similar to a basic PSO except that a selected percentage of particles from the swarm that find a better solution release pheromones within the design space in the first iteration. For subsequent iterations, each swarm member that finds a better objective function releases a pheromone. Pheromones
American Institute of Aeronautics and Astronautics
4
(from current as well as past iterations) that are close to each other in terms of design variable values are merged into a new pheromone location. This effectively creates a pheromone field across the design space while still keeping the number of pheromones manageable. Based on the pheromone level and its position relative to a particle, a probability is then used in a ranking process to select a target pheromone for each particle in the swarm. The target position for each particle will be a third component of the velocity vector update in addition to pBest and gBest. Following this, the objective value for each particle is recalculated and the entire process continues until the convergence criteria is satisfied.
Digital Pheromones and Merging In order to populate the design space with an initial set of digital pheromones, 50% of the population is randomly
selected to release pheromones, regardless of the objective function value. This is done so as to ensure a good design space exploration by the particle swarm in the initial stages of the optimization process. For subsequent iterations, the objective function value for each particle in the population is evaluated and only particles finding an improvement in the objective function value will release a pheromone. Any newly released pheromone is assigned a level P, with a value of 1.0. Just as natural pheromones produced by insects decay in time, a user defined decay rate, λP, defaulting to 0.95, is assigned to the pheromones released by the particle swarm. Digital pheromones are decayed as the iterations progress forward to allow the swarm to propagate toward a better design point instead of getting attracted to an older pheromone, which may not be a good design point.
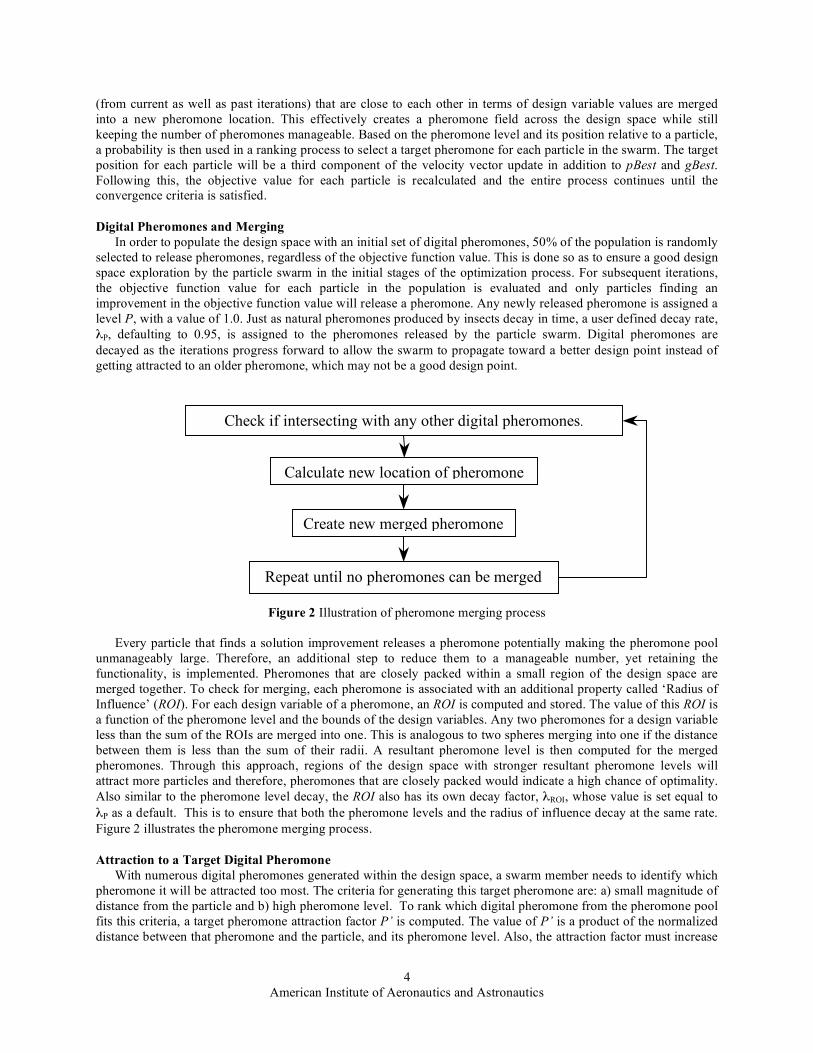
Figure 2 Illustration of pheromone merging process
Every particle that finds a solution improvement releases a pheromone potentially making the pheromone pool
unmanageably large. Therefore, an additional step to reduce them to a manageable number, yet retaining the functionality, is implemented. Pheromones that are closely packed within a small region of the design space are merged together. To check for merging, each pheromone is associated with an additional property called ‘Radius of Influence’ (ROI). For each design variable of a pheromone, an ROI is computed and stored. The value of this ROI is a function of the pheromone level and the bounds of the design variables. Any two pheromones for a design variable less than the sum of the ROIs are merged into one. This is analogous to two spheres merging into one if the distance between them is less than the sum of their radii. A resultant pheromone level is then computed for the merged pheromones. Through this approach, regions of the design space with stronger resultant pheromone levels will attract more particles and therefore, pheromones that are closely packed would indicate a high chance of optimality. Also similar to the pheromone level decay, the ROI also has its own decay factor, λROI, whose value is set equal to λP as a default. This is to ensure that both the pheromone levels and the radius of influence decay at the same rate. Figure 2 illustrates the pheromone merging process.
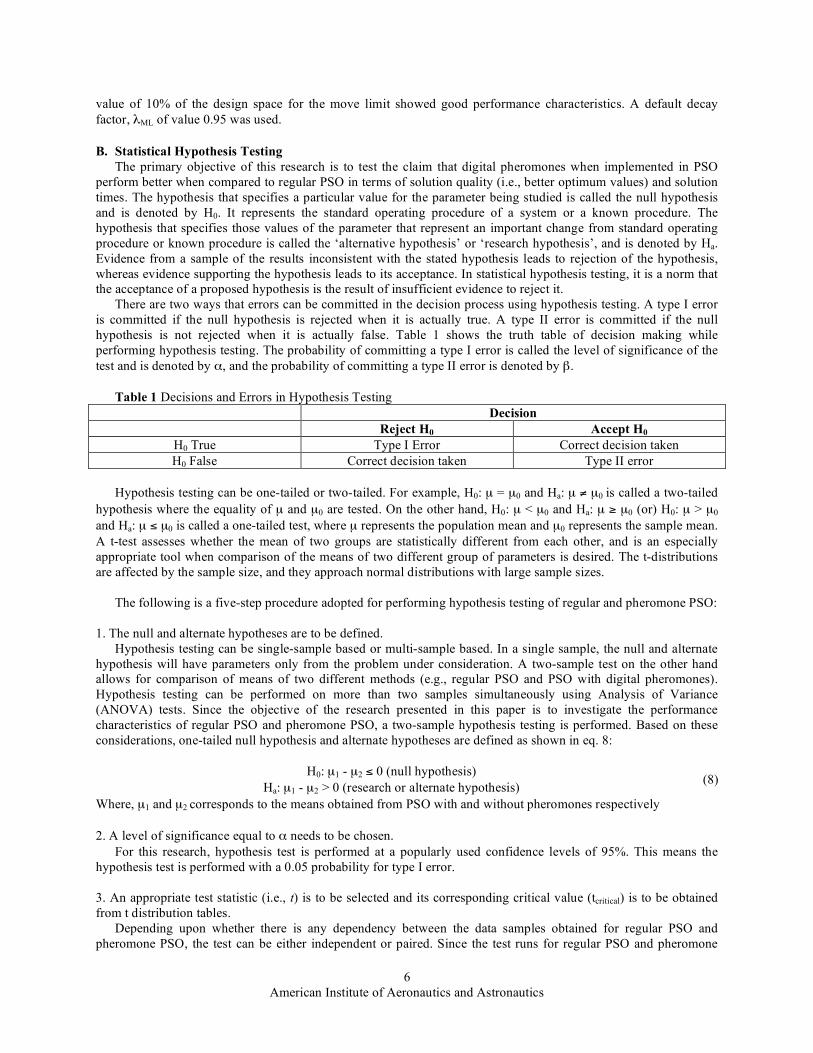
Attraction to a Target Digital Pheromone With numerous digital pheromones generated within the design space, a swarm member needs to identify which
pheromone it will be attracted too most. The criteria for generating this target pheromone are: a) small magnitude of distance from the particle and b) high pheromone level. To rank which digital pheromone from the pheromone pool fits this criteria, a target pheromone attraction factor P’ is computed. The value of P’ is a product of the normalized distance between that pheromone and the particle, and its pheromone level. Also, the attraction factor must increase
Check if intersecting with any other digital pheromones.
Calculate new location of pheromone
Create new merged pheromone
Repeat until no pheromones can be merged
American Institute of Aeronautics and Astronautics
5
when the pheromones are closer to the particles. Therefore, the attraction factor is computed as shown in Equation (5). Equation (6) computes the distance between the pheromone and each particle in the swarm. Figure 3 shows an example scenario of a particle being attracted to a target pheromone.
d)P(1P' != (5)
particle ofLocation X
pheromone ofLocation
iablesdesign var of # :1,1
2
!
!
=""#
$%%&
' != (
Xp
nkrange
XXpd
k
k
kk
(6)
In the figure, the particle will be more attracted to a pheromone with a higher P’ value, as opposed to
pheromones that are closer but with a lower P’ value.
Figure 3 Illustration of target pheromone selection
Velocity Vector Update The velocity vector update implements the pheromone component as a third term in addition to the pBest and
gBest components in a traditional PSO. This is shown in Equation (7).
[])[](*()*
[])[](()[])[](*()**
3
211
iT
igiipiii
XTargetrandc
XgBestrandcXpBestrandcVwV
!+
!""+!+=+
(7)
c3 is the confidence parameter for the pheromone component of the velocity vector, and is typically set to be larger than or equal to c1 and c2, This is done in order to increase the influence of pheromones in the velocity vector. From experimentation, it was found that a default value of 2.0 - 5.0 sufficed for most problems.
Move Limits, ML The additional pheromone term in the velocity vector update, can considerably increase the computed velocity.
To avoid this value from becoming unmanageably large, a move limit is imposed. The move limit is set to an initial value and reduced gradually as the iterations progress forward. This ensures a fair amount of freedom in exploration in the beginning and as the method approaches a solution, a smaller move limit exploits the current design point of a particle for a more constrained search towards an optimum. Although this is a user defined parameter, an initial set
Pheromones
Particle
P = 0.9 P’=0.45
P = 0.5 P’=0.325
P = 0.87 P’=0.522
P = 0.625 P’=0.50
TARGET PHEROMONE
Design Space X2
X1
d = 0.4 d = 0.35
d = 0.5
d = 0.2
1
1
2
3
4
American Institute of Aeronautics and Astronautics
6
value of 10% of the design space for the move limit showed good performance characteristics. A default decay factor, λML of value 0.95 was used.
B. Statistical Hypothesis Testing The primary objective of this research is to test the claim that digital pheromones when implemented in PSO
perform better when compared to regular PSO in terms of solution quality (i.e., better optimum values) and solution times. The hypothesis that specifies a particular value for the parameter being studied is called the null hypothesis and is denoted by H0. It represents the standard operating procedure of a system or a known procedure. The hypothesis that specifies those values of the parameter that represent an important change from standard operating procedure or known procedure is called the ‘alternative hypothesis’ or ‘research hypothesis’, and is denoted by Ha. Evidence from a sample of the results inconsistent with the stated hypothesis leads to rejection of the hypothesis, whereas evidence supporting the hypothesis leads to its acceptance. In statistical hypothesis testing, it is a norm that the acceptance of a proposed hypothesis is the result of insufficient evidence to reject it.
There are two ways that errors can be committed in the decision process using hypothesis testing. A type I error is committed if the null hypothesis is rejected when it is actually true. A type II error is committed if the null hypothesis is not rejected when it is actually false. Table 1 shows the truth table of decision making while performing hypothesis testing. The probability of committing a type I error is called the level of significance of the test and is denoted by α, and the probability of committing a type II error is denoted by β.
Table 1 Decisions and Errors in Hypothesis Testing
Decision Reject H0 Accept H0
H0 True Type I Error Correct decision taken H0 False Correct decision taken Type II error
Hypothesis testing can be one-tailed or two-tailed. For example, H0: µ = µ0 and Ha: µ ≠ µ0 is called a two-tailed
hypothesis where the equality of µ and µ0 are tested. On the other hand, H0: µ < µ0 and Ha: µ ≥ µ0 (or) H0: µ > µ0 and Ha: µ ≤ µ0 is called a one-tailed test, where µ represents the population mean and µ0 represents the sample mean. A t-test assesses whether the mean of two groups are statistically different from each other, and is an especially appropriate tool when comparison of the means of two different group of parameters is desired. The t-distributions are affected by the sample size, and they approach normal distributions with large sample sizes.
The following is a five-step procedure adopted for performing hypothesis testing of regular and pheromone PSO:
1. The null and alternate hypotheses are to be defined.
Hypothesis testing can be single-sample based or multi-sample based. In a single sample, the null and alternate hypothesis will have parameters only from the problem under consideration. A two-sample test on the other hand allows for comparison of means of two different methods (e.g., regular PSO and PSO with digital pheromones). Hypothesis testing can be performed on more than two samples simultaneously using Analysis of Variance (ANOVA) tests. Since the objective of the research presented in this paper is to investigate the performance characteristics of regular PSO and pheromone PSO, a two-sample hypothesis testing is performed. Based on these considerations, one-tailed null hypothesis and alternate hypotheses are defined as shown in eq. 8:
Where, µ1 and µ2 corresponds to the means obtained from PSO with and without pheromones respectively 2. A level of significance equal to α needs to be chosen.
For this research, hypothesis test is performed at a popularly used confidence levels of 95%. This means the hypothesis test is performed with a 0.05 probability for type I error. 3. An appropriate test statistic (i.e., t) is to be selected and its corresponding critical value (tcritical) is to be obtained from t distribution tables.
Depending upon whether there is any dependency between the data samples obtained for regular PSO and pheromone PSO, the test can be either independent or paired. Since the test runs for regular PSO and pheromone
American Institute of Aeronautics and Astronautics
7
PSO are performed independent of each other and have different random seed values for each during trial runs, independent two-sample hypothesis testing is performed. Therefore, the test statistic (or the t-value) is calculated using eq. 9 (a standard t-value estimator whose description can be looked up in any standard statistics textbook), where
!
x 1and
!
x 2 represents the means of regular and pheromone PSO respectively.
!
t =(x1 " x 2)
Sp1
n1
+1
n2
(9)
!
Sp2
=(n1"1)s
1
2+ (n
2"1)s
2
2
n1
+ n2" 2
(10)
Where, eq. (10) represents the square of the standard deviation or the variance of the sample data from regular
and pheromone PSO, with (n1+n2-2) degrees of freedom. 4. The value of the statistic (t) is to be computed from the random sample of size, n.
Most t-distribution tables in standard statistics textbooks consider degrees of freedom greater than 30 as a very near approximation to normal distribution. For all test cases used in this research, 35 trial runs are performed each for regular and pheromone PSO. The number of degrees of freedom for this hypothesis test is (n1 + n2 - 2) = 68, where n1 represents the sample size of results from regular PSO, and n2 represents the sample size of results obtained from pheromone PSO. This means that the data can be considered as normally distributed for all statistical testing purposes. 5. H0 is to be rejected if the statistic has a value in the critical region; otherwise Ha is to be rejected.
A hypothesis is accepted not because there is evidence in support of it, but it means that there is no evidence to reject it. If the value of ‘t’ calculated from eq. 9 is greater than tcritical, H0 needs to be rejected. If on the other hand, the value of ‘t’ is less than tcritical, Ha needs to be rejected. The value of tcritical is obtained from t-distribution tables corresponding to the probability of error chosen in step 2.
IV. Results
A. Problem Settings Five unconstrained test problems of varying dimensionality are used for performing hypothesis testing on their
solution quality and solution times. These problems are solved using PSO with and without digital pheromones, 35 times each to ensure normal distribution. Two hypotheses are tested for each test problem with and without pheromones: a) Whether the solution quality of PSO with digital pheromones compare better against regular PSO, and b) Whether the solution times of PSO with digital pheromones compare better against regular PSO. The hypothesis tests are performed at a 95% confidence level. This means that the tests are performed with a 0.05 probability for error. As shown in eq. 8, the null hypothesis (H0) states that regular PSO fares better in comparison to PSO with digital pheromones and the research hypothesis (Ha) states that PSO with digital pheromones has better performance characteristics than regular PSO. The five-step procedure for performing the hypothesis test is outlined in the previous section, and is similar for all the test cases. For simplicity in understanding, the hypothesis test for one test case (camelback 2D for solution quality at a confidence level of 95% with pheromone combination shown in eq. 11) is explained in detail. Results from all other test cases will be summarized in a table and discussed. The pheromone parameter combinations used in this research are shown in eq. 11 below. The tcritical value for 0.05 probability in error (95% confidence level) for 68 degrees of freedom obtained from t-distribution tables is -1.645.
American Institute of Aeronautics and Astronautics
8
The swarm size used for each test problem is chosen as 10 times the number of design variables, although this value is capped at 500. The computing platform for the trial runs is Red Hat Enterprise Linux Operating System, with a processor speed of 3.2GHz and 2GB of system memory.
B. Test Cases – Results and Discussion
Test Case 1: Six-hump camelback function This is a multi-modal optimization problem with two design variables with six local minima, two of which are
global minima. The optimization problem statement is: Minimize:
!
F(x1,x2) = 4 " 2.1x1 +x1
4
3
#
$ %
&
' ( x1
2+ x1x2 + "4 + 4x2
2( )x2
2
"3 ) x1 ) 3 and " 2 ) x2 ) 2
Table 2 explains in detail the results obtained from performing hypothesis testing on a 2D camel back function at
a 95% confidence level. Pheromone parameter combination 1 (from eq. 11) is used for this test. Table 2 Hypothesis test results for Camelback function
!
x 1 = -1.0166 (solution mean of trial runs of regular PSO)
!
x 2 = -1.03152 (solution mean of trial runs of PSO with digital pheromones) Sp = 0.000167087 (from eq. 10)
df = 68 (n1 + n2 – 2) tcalculated = -1.145509941 (using eq. 9) tcritical (α=0.05) = -1.645 (from t-distribution tables with probability of error = α)
From the table, n1 and n2 are the number of samples (trial runs) drawn from PSO with and without digital
pheromones respectively. It can be seen from table that tcalculated is greater than tcritical, which leads to the conclusion that the null hypothesis, H0 can be rejected. This means that the solution quality of regular PSO is not better than PSO when implemented with digital pheromones. Since there is no evidence to prove that regular PSO fares better than PSO with digital pheromones, the research hypothesis (Ha) that the solution quality of PSO with digital pheromones is better than a regular PSO is considered as ‘accepted’. The solution quality and solution timings for all test problems are estimated using the procedure laid out in table 2.
Table 3 below summarizes the hypothesis testing of camelback problem for solution quality and solution
timings. Table 3 Summary of hypothesis testing for Camelback 2D problem
Test Case Combination 1 Combination 2 Combination 3 Combination 4
Camelback2D tcalc H0 tcalc H0 tcalc H0 tcalc H0
Solution quality
-1.145 (> tcritical)
Reject -1.567 (> tcritical)
Reject -1.685 (< tcritical)
Accept -2.288 (< tcritical)
Accept
Solution Times
-0.488 (> tcritical)
Reject 0.210 (> tcritical)
Reject -0.495 (> tcritical)
Reject -0.322 (> tcritical)
Reject
This table shows that the null hypothesis, H0 is rejected in two different instances for solution times – when
using pheromone parameter combination 1 and 2. This means that the solution quality of regular PSO is not better than PSO with digital pheromones at a 95% confidence level. The results from hypothesis testing of solution times also concur with the fact that digital pheromones has a positive influence in reducing the solution times when compared to regular PSO. However, with the pheromone parameter combinations 3 and 4, the null hypothesis is accepted at 95% confidence level. That means regular PSO performs better when compared to PSO with digital
American Institute of Aeronautics and Astronautics
9
pheromones in terms of solution quality. However, the null hypothesis is rejected for pheromone combinations 3 and 4 for solution times. While this hypothesis test demonstrates that not all suggested pheromone parameter combinations can be beneficial, it points to the fact that slight changes in the values for pheromone parameters substantially affects the performance of PSO when implemented with digital pheromones, especially in two-dimensional optimization problems. Test Case 2: Himmelblau’s function (2D)
This is a multi-modal problem with one global minimum and three local minimums. The objective function is:
!
F(x1,x2) = (x1
2+ x2 "11)
2+ (x1 + x2
2" 7)
2
"6 # x1 # 6 and " 6 # x2 # 6
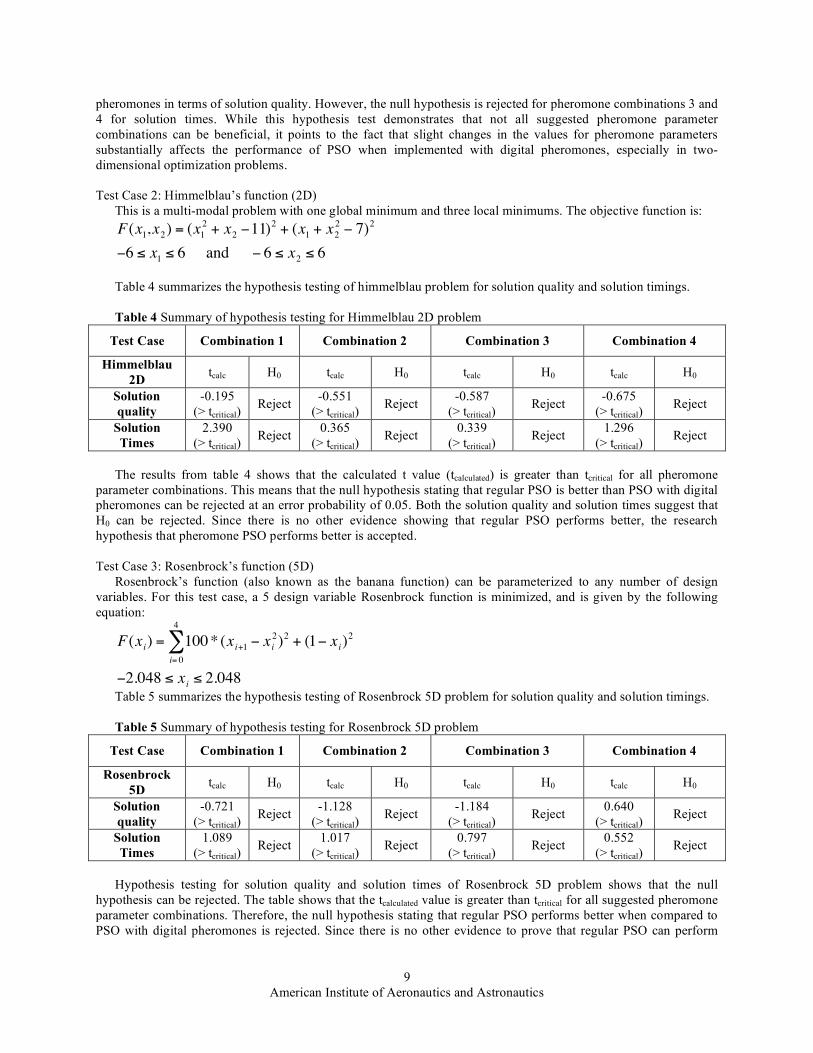
Table 4 summarizes the hypothesis testing of himmelblau problem for solution quality and solution timings. Table 4 Summary of hypothesis testing for Himmelblau 2D problem
Test Case Combination 1 Combination 2 Combination 3 Combination 4
Himmelblau 2D tcalc H0 tcalc H0 tcalc H0 tcalc H0
Solution quality
-0.195 (> tcritical)
Reject -0.551 (> tcritical)
Reject -0.587 (> tcritical)
Reject -0.675 (> tcritical)
Reject
Solution Times
2.390 (> tcritical)
Reject 0.365 (> tcritical)
Reject 0.339 (> tcritical)
Reject 1.296 (> tcritical)
Reject
The results from table 4 shows that the calculated t value (tcalculated) is greater than tcritical for all pheromone
parameter combinations. This means that the null hypothesis stating that regular PSO is better than PSO with digital pheromones can be rejected at an error probability of 0.05. Both the solution quality and solution times suggest that H0 can be rejected. Since there is no other evidence showing that regular PSO performs better, the research hypothesis that pheromone PSO performs better is accepted.
Test Case 3: Rosenbrock’s function (5D)
Rosenbrock’s function (also known as the banana function) can be parameterized to any number of design variables. For this test case, a 5 design variable Rosenbrock function is minimized, and is given by the following equation:
!
F(xi) = 100* (x
i+1 " xi2)2
+ (1" xi)2
i= 0
4
#
"2.048 $ xi$ 2.048
Table 5 summarizes the hypothesis testing of Rosenbrock 5D problem for solution quality and solution timings. Table 5 Summary of hypothesis testing for Rosenbrock 5D problem
Test Case Combination 1 Combination 2 Combination 3 Combination 4
Rosenbrock 5D tcalc H0 tcalc H0 tcalc H0 tcalc H0
Solution quality
-0.721 (> tcritical)
Reject -1.128 (> tcritical)
Reject -1.184 (> tcritical)
Reject 0.640 (> tcritical)
Reject
Solution Times
1.089 (> tcritical)
Reject 1.017 (> tcritical)
Reject 0.797 (> tcritical)
Reject 0.552 (> tcritical)
Reject
Hypothesis testing for solution quality and solution times of Rosenbrock 5D problem shows that the null
hypothesis can be rejected. The table shows that the tcalculated value is greater than tcritical for all suggested pheromone parameter combinations. Therefore, the null hypothesis stating that regular PSO performs better when compared to PSO with digital pheromones is rejected. Since there is no other evidence to prove that regular PSO can perform
American Institute of Aeronautics and Astronautics
10
better, the research hypothesis stating that PSO with digital pheromones has better performance characteristics in terms of solution quality and solution timings.
Test Case 4: Ackley’s path function (10D) Test Case 5: Ackley’s path function (100D)
The problem is scalable to any number of dimensions. The problem statement for solving the Ackley’s path function is as follows:
Minimize:
!
F(xi) = "a # e
"b#
xi
2
i
5
$
5 " e
cos c#xi( )
i
5
$
5 + a + e1
a = 20; b = 0.2; c = 2 # PI; i =1: n;
"32.768 % xi% 32.768
Table 6 summarizes the hypothesis testing of Ackley 10D problem for solution quality and solution timings. Table 6 Summary of hypothesis testing for Ackley 10D problem
Test Case Combination 1 Combination 2 Combination 3 Combination 4
Ackley 10D tcalc H0 tcalc H0 tcalc H0 tcalc H0
Solution quality
-0.418 (> tcritical)
Reject -0.443 (> tcritical)
Reject -0.429 (> tcritical)
Reject -0.423 (> tcritical)
Reject
Solution Times
-0.219 (> tcritical)
Reject 0.040 (> tcritical)
Reject 0.187 (> tcritical)
Reject -0.233 (> tcritical)
Reject
This table shows that the null hypothesis, H0 is rejected for all suggested combinations of pheromone
parameters. This means that the hypothesis testing demonstrates that regular PSO is not better than PSO with digital pheromones at a 0.05 probability for error. The fact that tcalculated value exceeds tcritical value for both solution quality and solution times suggest that the research hypothesis Ha can be accepted due to the lack of evidence to prove superior performance of regular PSO. That means that PSO with digital pheromone PSO compares better against regular PSO in terms of both solution quality and solution timings for this test problem.
Table 7 summarizes the hypothesis testing of Ackley 100D problem for solution quality and solution timings. Table 7 Summary of hypothesis testing for Ackley 100D problem
Test Case Combination 1 Combination 2 Combination 3 Combination 4
Ackley 100D tcalc H0 tcalc H0 tcalc H0 tcalc H0
Solution quality
0.233 (> tcritical)
Reject -1.247 (> tcritical)
Reject -1.038 (> tcritical)
Reject 0.314 (> tcritical)
Reject
Solution Times
-4.817 (< tcritical)
Accept -1.054 (> tcritical)
Reject -0.130 (> tcritical)
Reject -4.305 (< tcritical)
Accept
Table 7 is the result of performing hypothesis testing on a 100 design variable Ackley’s path function. The table
shows that the tcalculated values for solution quality is greater than tcritical for all combinations of suggested pheromone parameters. This means that the null hypothesis stating that regular PSO fares better in comparison to pheromone PSO can be rejected. At the same time, the hypothesis testing of solution times demonstrate that the null hypothesis can be accepted for pheromone combination 1 and 4. This means that the solution times for regular PSO is faster when compared to PSO with digital pheromones. However, it is to be noted that the null hypothesis for combinations 1 and 4 come at a cost of compromise in solution quality. This means that although regular PSO compares better against PSO with digital pheromones in terms of solution times, the quality of the solution is better with pheromone PSO rather than with regular PSO.
American Institute of Aeronautics and Astronautics
11
C. General Trend Hypothesis testing of five benchmarking test problems showed a general trend for improvement in terms of
solution quality and solution timings in PSO when digital pheromones are implemented. All test cases showed this general trend with the exception of Camelback function with pheromone combinations 3 and 4. This is possible because of a high value of c3 for a two dimensional problem. Another exception to the general trend is Ackley’s path function with 100 design variables, where pheromone parameter combinations 1 and 4 resulted in reduced solution timings. However, this came at the cost of solution quality with regular PSO. Overall, it can be generalized that digital pheromones in PSO tend to produce better quality solutions at decreased solution times.
V. � Conclusion This paper presents a quantitative assessment of the performance of PSO with and without digital pheromones
through statistical hypothesis testing. The methodology section provided a detailed procedure of how this is attained followed by discussion of results from testing five benchmarking problems. Hypothesis testing results show a promising tendency of digital pheromones to improve the design space search especially when the dimensionality of the problems increased. Comparison of performances is made between regular PSO and various pheromone parameters individually. With the exception of camelback function for combination 3 and 4 pheromone parameters, the remaining test problems showed that the solution quality has been consistently better when digital pheromones in PSO are used. Although the solution times of regular PSO is better in Ackley’s 100 dimensional path problem, the solutions were not as effective as demonstrated by digital pheromones in PSO.
Since implementation of digital pheromones is fairly new, a substantial amount of future work is required for further development and fine-tuning. Some of the future work includes performing hypothesis testing of various combinations of pheromone parameters that could potentially throw light on how sensitive the method could become based on altering them either prior to beginning actual optimization or during run-time. Multi-linear regression and ANOVA could show the extent of correlation between the pheromone parameters. Also, a formal statistical analysis of PSO with and without pheromones can be performed for solving constrained optimization problems, thereby providing a more appropriate opportunity to evaluate the performance of digital pheromones in PSO.
References
1 Kennedy, J., and Eberhart, R. C., "Particle Swarm Optimization", Proceedings of the 1995 IEEE International Conference on Neural Networks, Vol. 4, Inst. of Electrical and Electronics Engineers, Piscataway, NJ, 1995, pp. 1942-1948.
2 Eberhart, R. C., and Kennedy, J., "A New Optimizer Using Particle Swarm Theory", Proceedings of the Sixth International Symposium on Micro Machine and Human Science, Inst. of Electrical and Electronics Engineers, Piscataway, NJ, 1995, pp. 39-43.
3 Russell C. Eberhart and Yuhui Shi, “Particle swarm optimization: Developments, applications, and resources”, In Proceedings of the 2001 Congress on Evolutionary Computation 2001, 81–86.
4 J.F. Schutte. Particle swarms in sizing and global optimization. Master’s thesis, University of Pretoria, Department of Mechanical Engineering, 2001.
5 A. Carlisle and G. Dozier. An off-the-shelf pso. In Proceedings of the Workshop on Particle Swarm Optimization, 2001, Indianapolis.
6Kalivarapu, V., Foo, J. L., Winer, E. H., “Implementation of Digital Pheromones for Use in Particle Swarm Optimization”, 47th AIAA/ASME/ASCE/AHS/ASC Structures, Structural Dynamics, and Materials Conference, 2nd AIAA Multidisciplinary Design Optimization Specialist Conference, Newport, RI, 1-4 May 2006.
7 Kalivarapu, V., Foo, J., Winer, E., “A Parallel Implementation of Particle Swarm Optimization Using Digital Pheromones”, 11th AIAA/ISSMO Multidisciplinary Analysis and Optimization Conference, AIAA-2006-6908-694, Portsmouth, VA, September 2006.
8 Hu X H, Eberhart R C, Shi Y H., “Engineering Optimization with Particle Swarm”, IEEE Swarm Intelligence Symposium, 2003: 53-57.
9 G. Venter and J. Sobieszczanski-Sobieski, “Multidisciplinary optimization of a transport aircraft wing using particle swarm Optimization”, In 9th AIAA/ISSMO Symposium on Multidisciplinary Analysis and Optimization 2002, Atlanta, GA.
10 P.C. Fourie and A.A. Groenwold, “The particle swarm algorithm in topology optimization”, In Proceedings of the Fourth World Congress of Structural and Multidisciplinary Optimization 2001, Dalian, China.
11 Shi, Y., Eberhart, R., “Parameter Selection in Particle Swarm Optimization”, Proceedings of the 1998 Annual Conference on Evolutionary Computation, March 1998.
12 Shi, Y., Eberhart, R., “A Modified Particle Swarm Optimizer”, Proceedings of the 1998 IEEE International Conference on Evolutionary Computation, pp 69-73, Piscataway, NJ, IEEE Press May 1998.
13 Natsuki H, Hitoshi I., “Particle Swarm Optimization with Gaussian Mutation”, Proceedings of IEEE Swarm Intelligence Symposium, Indianapolis, 2003:72-79.
American Institute of Aeronautics and Astronautics
12
14 Hu, X., Eberhart, R., Shi, Y., “Swarm Intelligence for Permutation Optimization: A Case Study of n-Queens Problem”,
1589. 16 Hu, X., Eberhart, R., “Solving Constrained Nonlinear Optimization Problems with Particle Swarm Optimization”, 6th
World Multiconference on Systemics, Cybernetics and Informatics (SCI 2002), Orlando, USA. 17 Schutte, J., Reinbolt, J., Fregly, B., Haftka, R., George, A., “Parallel Global Optimization with the Particle Swarm
Algorithm”, Int. J. Numer. Meth. Engng, 2003. 18 Koh, B, George A. D., Haftka, R. T., Fregly, B., “Parallel Asynchronous Particle Swarm Optimization”, International
Journal For Numerical Methods in Engineering”, International Journal of Numerical Methods in Engineering, 67:578-595, 2006, Published online 31 January 2006 in Wiley InterScience, DOI: 10.1002/nme.1646
19 Hu, X., Eberhart, R., Shi, Y., “Particle Swarm with Extended Memory for Multiobjective Optimization”, Proceedings of 2003 IEEE Swarm Intelligence Symposium, pp 193-197, Indianapolis, IN, USA, April 2003, IEEE Service Center.
20 Tayal, M., Wang, B., “Particle Swarm Optimization for Mixed Discrete, Integer and Continuous Variables”, 10th AIAA/ISSMO Multidisciplinary Analysis and Optimization Conference, Albany, New York, Aug 30-1, 2004.
21 Walter, B., Sannier, A., Reiners, D., Oliver, J., “UAV Swarm Control: Calculating Digital Pheromone Fields with the GPU”, The Interservice/Industry Training, Simulation & Education Conference (I/ITSEC),Volume 2005 (Conference Theme: One Team. One Fight. One Training Future).
22 Gaudiano, P, Shargel, B., Bonabeau, E., Clough, B., “Swarm Intelligence: a New C2 Paradigm with an Application to Control of Swarms of UAVs”, In Proceedings of the 8th International Command and Control Research and Technology Symposium, 2003.
23 Colorni, A., Dorigo, M., Maniezzo, V., “Distributed Optimization by Ant Colonies”, In Proc. Europ. Conf. Artificial Life, Editors: F. Varela and P. Bourgine, Elsevier, Amsterdam, 1991.
24 Dorigo, M., Maniezzo, Colorni, A., “Ant System: Optimization by a Colony of Cooperating Agents”, In IEEE Trans. Systems, Man and Cybernetics, Part B, Vol. 26, Issue 1, pp 29-41, 1996.
25 White, T., Pagurek, B., “Towards Multi-Swarm Problem Solving in Networks”, icmas, p. 333, Third International Conference on Multi Agent Systems (ICMAS’98), 1998.
26 Parunak, H., Purcell M., O’Conell, R., “Digital Pheromones for Autonomous Coordination of Swarming UAV’s”. In Proceedings of First AIAA Unmanned Aerospace Vehicles, Systems, Technologies, and Operations Conference, Norfolk, VA, AIAA, 2002.
27 Walpole, R., Myers, R., “Probability and Statistics for Engineers and Scientists”, 2nd Ed. Macmillan Publishing Co., Inc., ISBN: 0-024-241105, 1978.
28 McClave, S., “Probability and Statistics for Engineers”, PWS Publishers, ISBN: 0-534-06486, 1986. 29 Ross, S., “Introduction to Probability and Statistics for Engineers and Scientists’, 2nd edition, Academic Press, ISBN: 0-
125-984723, 2000. 30 Urdan, T., “Statistics in Plain English”, 2nd edition, Lawrence Erlbaum Associates Publishers, ISBN: 0-805-852417, 2005.