American Institute of Aeronautics and Astronautics 1 Unexpected shelf life degradation phenomenon of the WSTF-JPL Carbon COPV test articles: An analysis and independent assessment Ken Cameron 1 , NESC NASA Engineering Safety Center, Hampton, VA, 23681, USA Pappu Murthy 2 NASA Glenn Research Center, Cleveland, Oh, 44135, USA John C. Thesken 3 Ohio Aerospace Institute, Cleveland, Oh, 44135, USA Leigh Phoenix 4 Cornell University, Ithaca, NY, 14853, USA Nathanael Greene 5 NASA White Sands Test Facility, Las Cruces, NM, USA Lorie Grimes-Ledesma 6 Jet Propulsion Laboratory, California Institute of Technology, Pasadena, CA Abstract - Carbon composite overwrapped pressure vessels (COPVs) are widely used for storing gasses under high pressure in a wide range of applications including onboard spacecraft such as the Space Shuttle and the International Space Station. The use of COPVs is currently being extended to the new crew exploration and launch vehicles as well. The National Aeronautics and Space Administration (NASA) has been supporting the development of this technology since the early 1970’s with an interest in safe application of these components, to reduce mass to orbit. NASA White Sands Test Facility (WSTF) with collaboration from NASA Jet Propulsion Laboratory (JPL) has been testing components in support of this objective since the 1980s and has been involved in test development and analysis to address effects of impact, propellant and cryogenic fluids exposure on Kevlar® and carbon epoxy. The focus of this paper is to present an analytical appraisal of an unexpected shelf life degradation phenomenon observed during the regular testing of special, uniquely designed, cylindrical carbon overwrapped pressure vessels that were a part of the stress rupture life testing program. I. Introduction ARBON composite overwrapped pressure vessels (COPVs) are widely used for storing gasses under high pressure in a wide range of applications including onboard spacecraft such as the Space Shuttle and the International Space Station. The use of COPVs is currently being planned for the Crew Exploration and launch vehicles as well. The principal advantage of the carbon COPV technology over conventional all metallic storage devices is the substantial weight savings they offer. The National Aeronautics and Space Administration (NASA) has been supporting the development of this technology since the early 1970s 1 with an interest in safe application of these components to reduce mass to orbit. NASA/Johnson Space Flight Center White Sands Test Facility (WSTF) with collaboration from NASA Jet Propulsion Laboratory (JPL) has been testing components in support of this objective since the 1980s and WSTF has been involved in test development and analysis to address effects of impact, propellant and cryogenic fluids exposure on Kevlar® and carbon epoxy 2 . 1 Deputy Director for Safety, NESC, NASA/LaRC, AIAA Member 2 Aerospace Engineer, Mechanics and Durability Branch, MS 49-7, NASA/GRC, AIAA Associate Fellow 3 Principal Scientist Research Team Manager, MS 49-7, OAI, Cleveland, Ohio 4 Prof., Department of Theoretical and Applied Mechanics, Cornell University, Ithaca NY 5 Senior Engineer, Propulsion and Materials Section, White Sands Test Facility 6 Senior Engineer, Propulsion and Materials Section, MS 125-211, Jet Propulsion Laboratory, AIAA Member C 48th AIAA/ASME/ASCE/AHS/ASC Structures, Structural Dynamics, and Materials Conference<br>15th 23 - 26 April 2007, Honolulu, Hawaii AIAA 2007-1991 This material is declared a work of the U.S. Government and is not subject to copyright protection in the United States.
Transcript
American Institute of Aeronautics and Astronautics
1
Unexpected shelf life degradation phenomenon of the WSTF-JPL Carbon COPV test articles: An analysis and
independent assessment
Ken Cameron1, NESC NASA Engineering Safety Center, Hampton, VA, 23681, USA
Pappu Murthy 2 NASA Glenn Research Center, Cleveland, Oh, 44135, USA
John C. Thesken3 Ohio Aerospace Institute, Cleveland, Oh, 44135, USA
Leigh Phoenix4 Cornell University, Ithaca, NY, 14853, USA
Nathanael Greene5 NASA White Sands Test Facility, Las Cruces, NM, USA
Lorie Grimes-Ledesma6 Jet Propulsion Laboratory, California Institute of Technology, Pasadena, CA
Abstract - Carbon composite overwrapped pressure vessels (COPVs) are widely used for storing gasses under high pressure in a wide range of applications including onboard spacecraft such as the Space Shuttle and the International Space Station. The use of COPVs is currently being extended to the new crew exploration and launch vehicles as well. The National Aeronautics and Space Administration (NASA) has been supporting the development of this technology since the early 1970’s with an interest in safe application of these components, to reduce mass to orbit. NASA White Sands Test Facility (WSTF) with collaboration from NASA Jet Propulsion Laboratory (JPL) has been testing components in support of this objective since the 1980s and has been involved in test development and analysis to address effects of impact, propellant and cryogenic fluids exposure on Kevlar® and carbon epoxy. The focus of this paper is to present an analytical appraisal of an unexpected shelf life degradation phenomenon observed during the regular testing of special, uniquely designed, cylindrical carbon overwrapped pressure vessels that were a part of the stress rupture life testing program.
I. Introduction ARBON composite overwrapped pressure vessels (COPVs) are widely used for storing gasses under high pressure in a wide range of applications including onboard spacecraft such as the Space Shuttle and the
International Space Station. The use of COPVs is currently being planned for the Crew Exploration and launch vehicles as well. The principal advantage of the carbon COPV technology over conventional all metallic storage devices is the substantial weight savings they offer. The National Aeronautics and Space Administration (NASA) has been supporting the development of this technology since the early 1970s1 with an interest in safe application of these components to reduce mass to orbit. NASA/Johnson Space Flight Center White Sands Test Facility (WSTF) with collaboration from NASA Jet Propulsion Laboratory (JPL) has been testing components in support of this objective since the 1980s and WSTF has been involved in test development and analysis to address effects of impact, propellant and cryogenic fluids exposure on Kevlar® and carbon epoxy2. 1 Deputy Director for Safety, NESC, NASA/LaRC, AIAA Member 2 Aerospace Engineer, Mechanics and Durability Branch, MS 49-7, NASA/GRC, AIAA Associate Fellow 3 Principal Scientist Research Team Manager, MS 49-7, OAI, Cleveland, Ohio 4 Prof., Department of Theoretical and Applied Mechanics, Cornell University, Ithaca NY 5 Senior Engineer, Propulsion and Materials Section, White Sands Test Facility 6 Senior Engineer, Propulsion and Materials Section, MS 125-211, Jet Propulsion Laboratory, AIAA Member
C
48th AIAA/ASME/ASCE/AHS/ASC Structures, Structural Dynamics, and Materials Conference<br> 15th23 - 26 April 2007, Honolulu, Hawaii
AIAA 2007-1991
This material is declared a work of the U.S. Government and is not subject to copyright protection in the United States.
American Institute of Aeronautics and Astronautics
2
II. Shelf Life Phenomenon The focus of this paper is to present an analytical appraisal of an unexpected shelf life degradation phenomenon
observed during the regular testing of special uniquely designed cylindrical carbon overwrapped pressure vessels. The program was sponsored jointly by NASA WSTF and JPL. The WSTF-JPL COPV test articles consisted of a thick aluminum liner with a thin, three layer carbon fiber overwrap (Torayca T-1000G Fiber) in an industry standard epoxy resin system. The test articles measured 4.23 Ø x 11.4 inches long. The manufacturer made 120 test articles in August of 1998 from one lot of fiber and resin and delivered 110 of the vessels to WSTF for test. The remaining ten test articles were burst tested at the manufacturer’s facility to establish the burst pressure and ultimate delivered fiber strength. The mean burst pressure was 4308 psi. An additional 10 burst tests were performed at WSTF. When the results from all the burst tests are combined, the mean burst strength for the group of 20 tests was found to be 4288 psi with a coefficient of variation 2.7 percent. With these values established 73 test articles were placed into stress rupture testing with achieved pressure ratios of 93.3, 91.2, 91.0, 88.7, 87.5, 87.2, 86.4, and 74.6 percent based on the average burst pressure of the 20 initial burst tests. Expected times and pressures for failure were established before test using an industry standard model3-4 based on carbon epoxy strand test results.
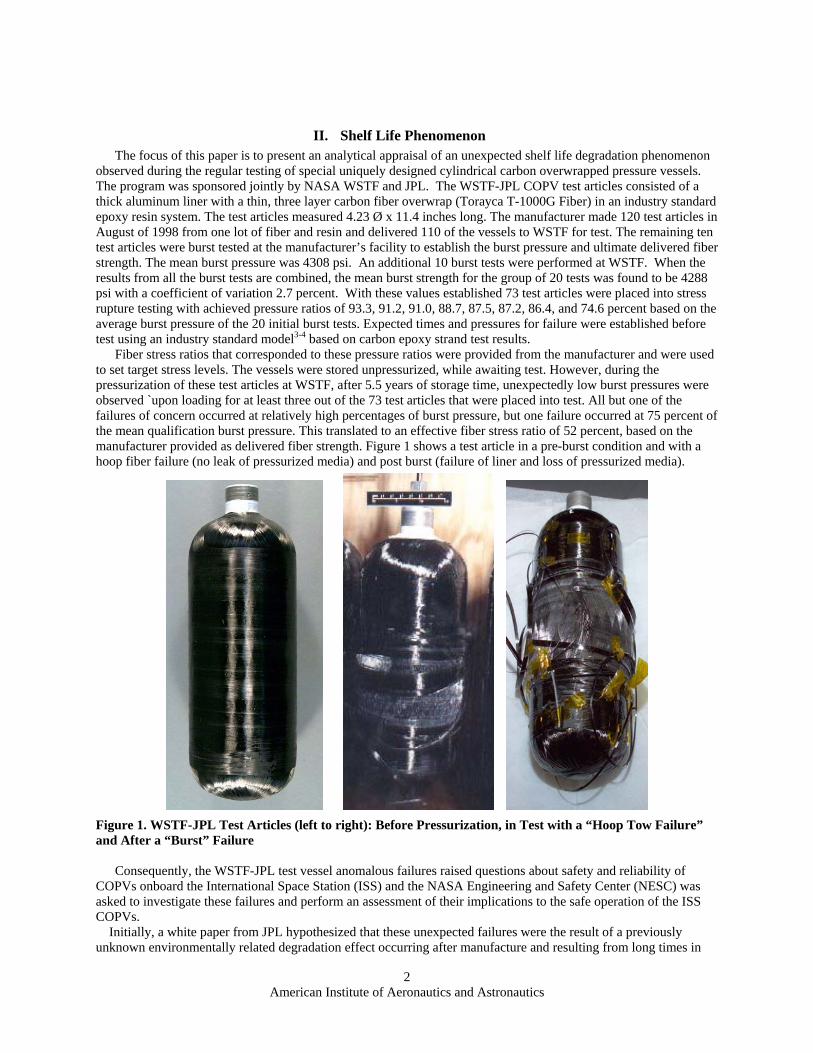
Fiber stress ratios that corresponded to these pressure ratios were provided from the manufacturer and were used to set target stress levels. The vessels were stored unpressurized, while awaiting test. However, during the pressurization of these test articles at WSTF, after 5.5 years of storage time, unexpectedly low burst pressures were observed `upon loading for at least three out of the 73 test articles that were placed into test. All but one of the failures of concern occurred at relatively high percentages of burst pressure, but one failure occurred at 75 percent of the mean qualification burst pressure. This translated to an effective fiber stress ratio of 52 percent, based on the manufacturer provided as delivered fiber strength. Figure 1 shows a test article in a pre-burst condition and with a hoop fiber failure (no leak of pressurized media) and post burst (failure of liner and loss of pressurized media).
Figure 1. WSTF-JPL Test Articles (left to right): Before Pressurization, in Test with a “Hoop Tow Failure” and After a “Burst” Failure
Consequently, the WSTF-JPL test vessel anomalous failures raised questions about safety and reliability of COPVs onboard the International Space Station (ISS) and the NASA Engineering and Safety Center (NESC) was asked to investigate these failures and perform an assessment of their implications to the safe operation of the ISS COPVs. Initially, a white paper from JPL hypothesized that these unexpected failures were the result of a previously unknown environmentally related degradation effect occurring after manufacture and resulting from long times in
American Institute of Aeronautics and Astronautics
3
storage while un-pressurized (i.e., a shelf life phenomenon). One suggestion raised was this effect might be due to low humidity during storage. After initial review of the white paper and the available data, an NESC consultation team was selected to perform an independent technical assessment of the failure anomalies and hypothesized shelf life phenomenon in carbon/epoxy COPVs, and the implications for ISS. The objective of the present paper is to report part of the COPV Independent Technical Assessment reported in Ref. 5.
III. WSTF-JPL Test Vessel Design Features The 120 vessels for this program, which had special cylindrical construction, were manufactured by the
Composite Cylinders Division of Luxfer Gas Cylinders in Riverside, California. These vessels consisted of just three layers of Torayca™ T-1000G/epoxy composite overwrap: two 19.6 degree low angle helical layers adjacent to the liner and one circumferential hoop wrap layer on the outside of the vessel. The liners were seamless cylinders (no weld) made from aluminum 6061-T6 with a wall thickness of 0.078 inches. The outside liner dimensions were 4.18 inches in diameter by 11.5 inches in length, and the flat portion for supporting the hoop windings was approximately 7.7 inches. Figure 1 shows a typical WSTF-JPL test vessel. The 120 COPVs were wrapped and cured in August 1998 using a single lot of Torayca™ T-1000G carbon fiber in a Shell EPON® 8627 epoxy resin system. For these COPVs, a single band consisted of six parallel fiber tows resulting in a tape 0.467 inches in width. Wrapping in a high angle spiral, 18 such bands occur in the hoop winding. Once placed on the surface, a single tow had a cross-sectional aspect ratio of 9.3. That is, the tow was approximately nine times as wide as it was thick (i.e., approximately 0.0773 inches wide by 0.0083 inches thick).
The two helical wraps at +/− 19.6 degrees to the vessel axis were conservatively designed in order to support the axial pressure load with no risk of failure. Thus, the vessel was designed to fail in the single hoop layer which, together with the liner, supported hoop pressure load. Table I summarizes the WSTF-JPL test vessel design information.
Table I. WSTF-JPL Test Vessel Design Information WSTF special Carbon COPV Test Vessel Design Details Outside Vessel Dimensions / Liner Thickness 4.23 inches Ø x 11.4 inches L (7.7 inches
Flat) / 0.078 inch Overwrap composite layer thicknesses 0.0083 inch hoop, 0.0166” axial Mean Burst Pressure 4288 psi Fiber/ Liner Aluminum 6061-T6 / T-1000G-12K Volume (min), liter 1
The design of these test vessels differed significantly from COPVs onboard the ISS. Because this special COPV
design was intended for stress rupture testing only, the thickness of the overwrap was minimized to force stress rupture failure to occur in the single hoop wrap layer, which was chosen to be the outermost layer to reduce the influence of “ply averaging.” However, further analysis of the COPV structural design by the consultation team showed that this design intent was not achieved as conceptualized.
IV. Stress Rupture Test Set-up Stress rupture testing of the WSTF-JPL test vessels was conducted in WSTF test cell T-270A. This test cell was
thermally conditioned to hold test temperature to within ±5 °F. The test vessels were placed into a blast enclosure to protect personnel and equipment. The blast enclosures were designed to support testing of nine test vessels in one group.
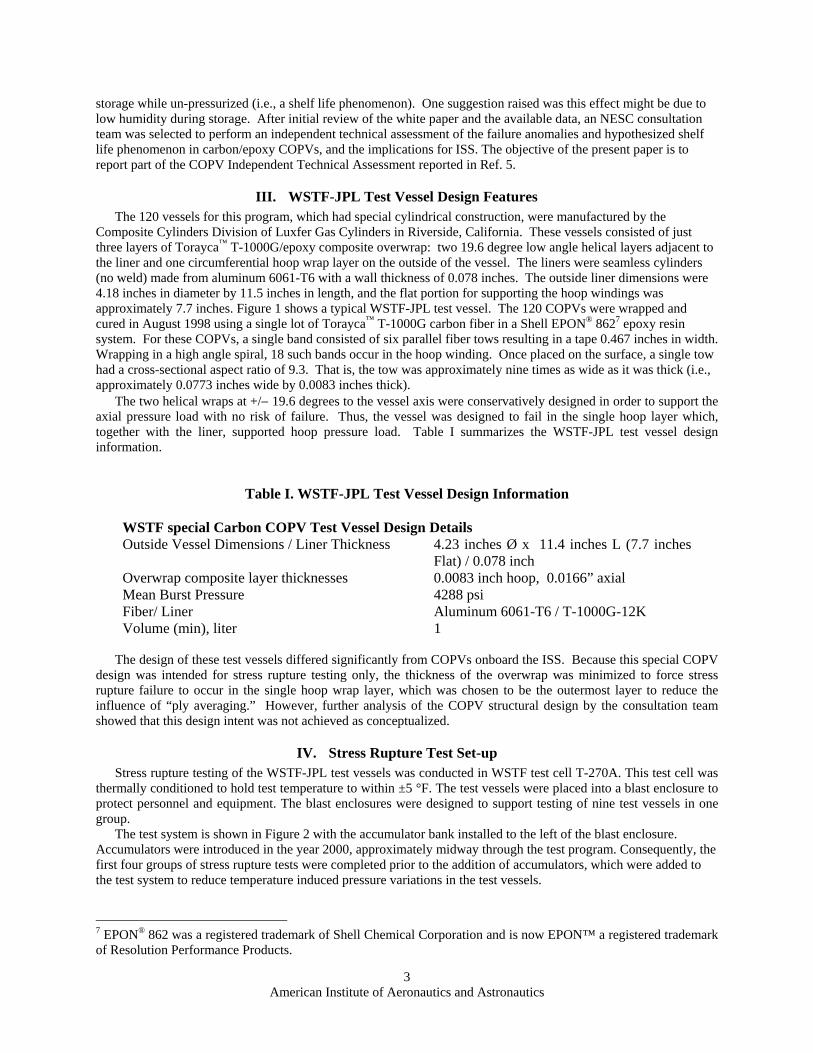
The test system is shown in Figure 2 with the accumulator bank installed to the left of the blast enclosure. Accumulators were introduced in the year 2000, approximately midway through the test program. Consequently, the first four groups of stress rupture tests were completed prior to the addition of accumulators, which were added to the test system to reduce temperature induced pressure variations in the test vessels.
7 EPON® 862 was a registered trademark of Shell Chemical Corporation and is now EPON™ a registered trademark of Resolution Performance Products.
American Institute of Aeronautics and Astronautics
4
Vessels were tested in groups of nine and were connected to the pressure source on one manifold. When one vessel burst, its eight sister vessels immediately lost pressure through the leak of media from the failed vessel. While sharing the same pressure source aids in consistency at a given pressure level, damage can occur to the liners of vessels in the same manifold, compromising the results.
Pressurization of a group of nine vessels for stress rupture testing was performed using a hand operated, hydraulic pump connected to the single manifold. The pressurizing media was food grade mineral oil.
During burst testing, pressurization-to-burst took only a few minutes. The pressurization rate for stress rupture tests was a much slower process, typically spanning several hours with intermittent pauses (sometimes overnight) due to the physically taxing nature of the manual pumping exercise. The consultation team observed that the inconsistency in pressurization rate from burst to stress rupture testing greatly complicated the consultation team’s interpretation of the results.
In a test group of nine vessels, at a given pressure, the stress rupture testing was normally halted once one of the test vessels in the group burst. There were two exceptions to this rule. Group 1 was reinstituted as Group 2 after the failed vessel was replaced (vessel S/N 2101 burst and was replaced with S/N 2100), and Group 7 was re-pressurized after the burst of S/N 1981. After re-pressurization of group 7 (now with eight test vessels) vessel S/N 2031 burst in stress rupture as is noted in Table II. Inspection of vessels in a test group often revealed one or more with failed tows or bands before and after burst of the vessel that terminated test of a group. These vessels may have been approaching failure themselves, but were stable at the time of test termination.
V. Test Results
As stated in the original white paper to the NESC, which prompted the investigation, the original vessels in question with low burst pressures or early lifetimes, were vessels S/N 2117, 2141, and 2142. Later, vessel S/N 2101 was added to the list by the consultation team. All these vessels are shown in Table II.
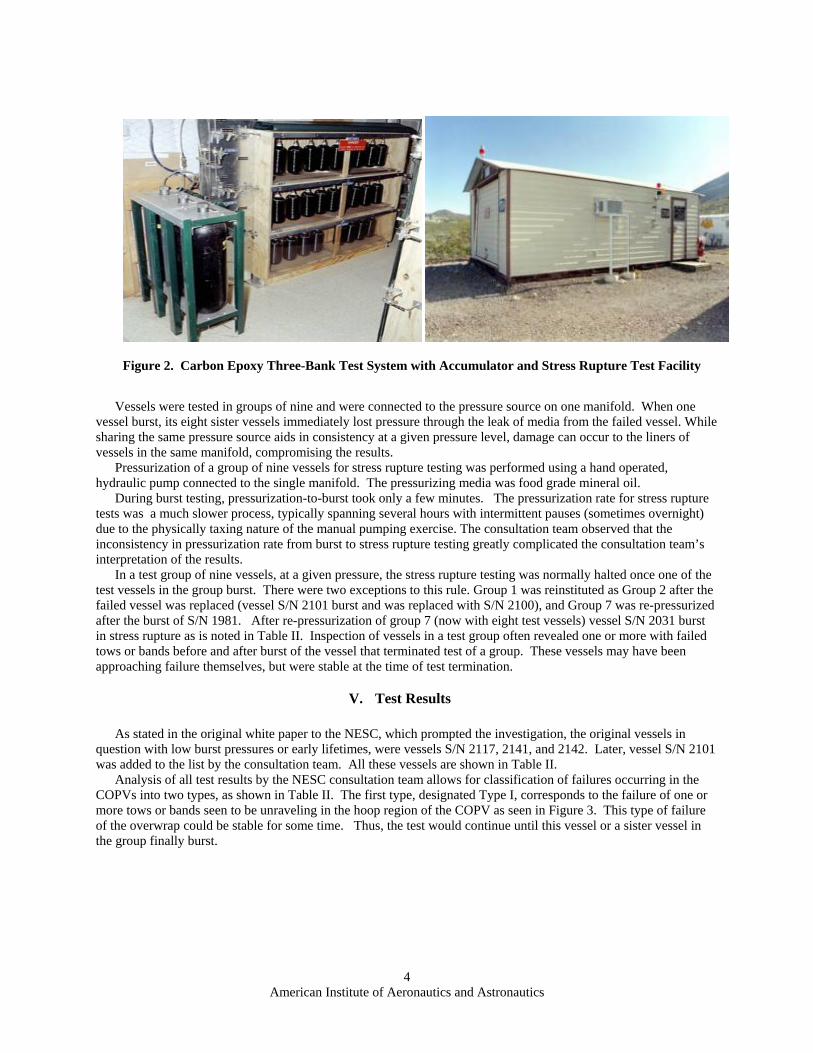
Analysis of all test results by the NESC consultation team allows for classification of failures occurring in the COPVs into two types, as shown in Table II. The first type, designated Type I, corresponds to the failure of one or more tows or bands seen to be unraveling in the hoop region of the COPV as seen in Figure 3. This type of failure of the overwrap could be stable for some time. Thus, the test would continue until this vessel or a sister vessel in the group finally burst.
Figure 2. Carbon Epoxy Three-Bank Test System with Accumulator and Stress Rupture Test Facility
American Institute of Aeronautics and Astronautics
5
Figure 3. Stable WSTF-JPL Vessel Exhibiting Type I Failures consisting of an Early Single Tow Failure (middle) and Larger Band Failures (left) Some Time Before Burst and Type II Failure representing burst of vessel
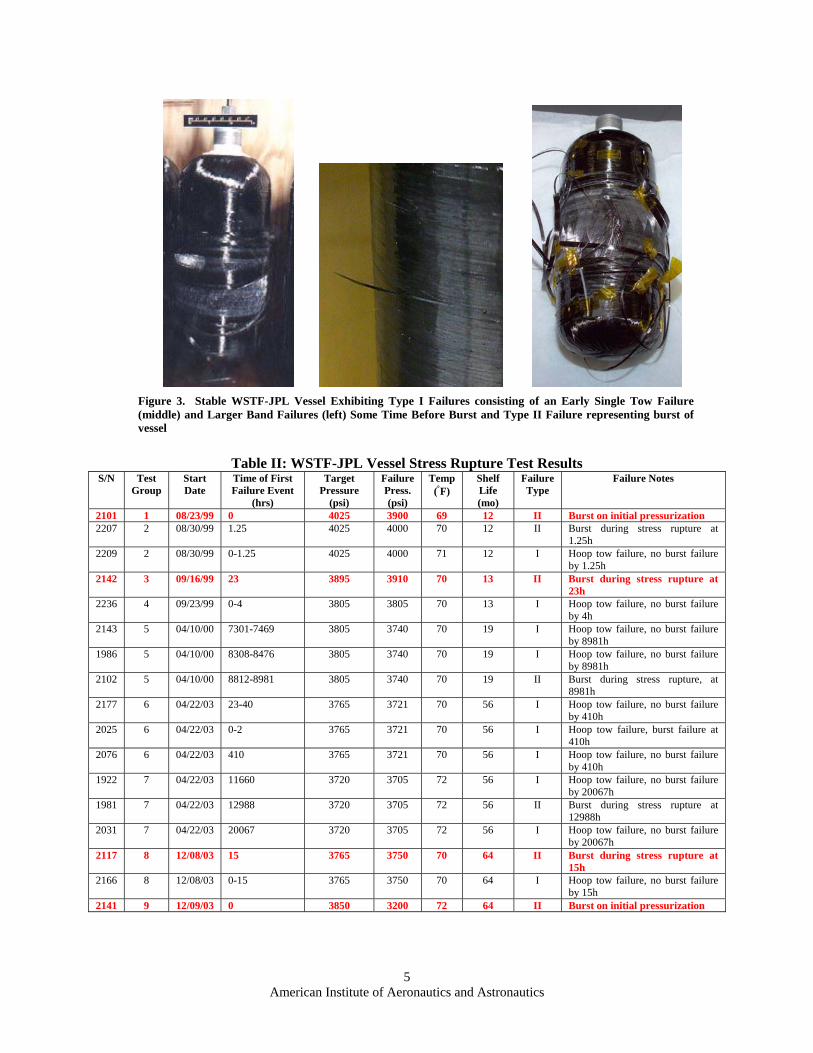
Table II: WSTF-JPL Vessel Stress Rupture Test Results
S/N Test Group
Start Date
Time of First Failure Event
(hrs)
Target Pressure
(psi)
Failure Press. (psi)
Temp (°F)
Shelf Life (mo)
Failure Type
Failure Notes
2101 1 08/23/99 0 4025 3900 69 12 II Burst on initial pressurization 2207 2 08/30/99 1.25 4025 4000 70 12 II Burst during stress rupture at
1.25h 2209 2 08/30/99 0-1.25 4025 4000 71 12 I Hoop tow failure, no burst failure
by 1.25h 2142 3 09/16/99 23 3895 3910 70 13 II Burst during stress rupture at
23h 2236 4 09/23/99 0-4 3805 3805 70 13 I Hoop tow failure, no burst failure
by 4h 2143 5 04/10/00 7301-7469 3805 3740 70 19 I Hoop tow failure, no burst failure
by 8981h 1986 5 04/10/00 8308-8476 3805 3740 70 19 I Hoop tow failure, no burst failure
by 8981h 2102 5 04/10/00 8812-8981 3805 3740 70 19 II Burst during stress rupture, at
8981h 2177 6 04/22/03 23-40 3765 3721 70 56 I Hoop tow failure, no burst failure
by 410h 2025 6 04/22/03 0-2 3765 3721 70 56 I Hoop tow failure, burst failure at
410h 2076 6 04/22/03 410 3765 3721 70 56 I Hoop tow failure, no burst failure
by 410h 1922 7 04/22/03 11660 3720 3705 72 56 I Hoop tow failure, no burst failure
by 20067h 1981 7 04/22/03 12988 3720 3705 72 56 II Burst during stress rupture at
12988h 2031 7 04/22/03 20067 3720 3705 72 56 I Hoop tow failure, no burst failure
by 20067h 2117 8 12/08/03 15 3765 3750 70 64 II Burst during stress rupture at
15h 2166 8 12/08/03 0-15 3765 3750 70 64 I Hoop tow failure, no burst failure
by 15h 2141 9 12/09/03 0 3850 3200 72 64 II Burst on initial pressurization
American Institute of Aeronautics and Astronautics
6
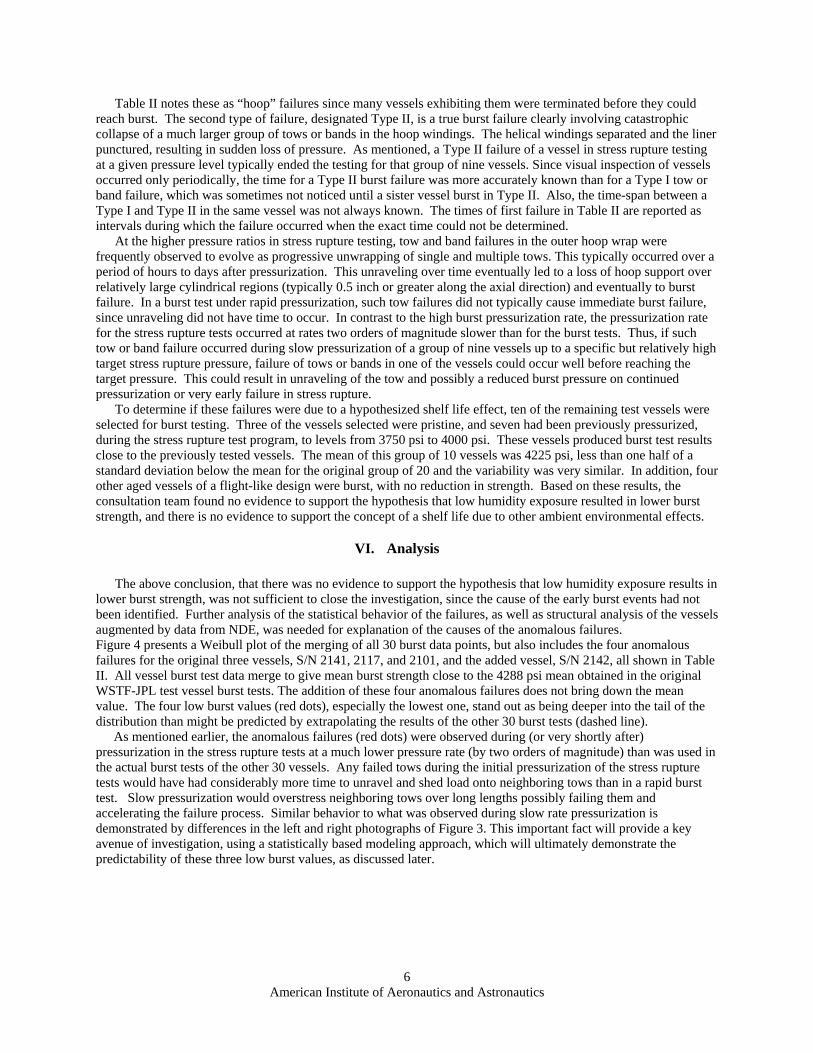
Table II notes these as “hoop” failures since many vessels exhibiting them were terminated before they could reach burst. The second type of failure, designated Type II, is a true burst failure clearly involving catastrophic collapse of a much larger group of tows or bands in the hoop windings. The helical windings separated and the liner punctured, resulting in sudden loss of pressure. As mentioned, a Type II failure of a vessel in stress rupture testing at a given pressure level typically ended the testing for that group of nine vessels. Since visual inspection of vessels occurred only periodically, the time for a Type II burst failure was more accurately known than for a Type I tow or band failure, which was sometimes not noticed until a sister vessel burst in Type II. Also, the time-span between a Type I and Type II in the same vessel was not always known. The times of first failure in Table II are reported as intervals during which the failure occurred when the exact time could not be determined.
At the higher pressure ratios in stress rupture testing, tow and band failures in the outer hoop wrap were frequently observed to evolve as progressive unwrapping of single and multiple tows. This typically occurred over a period of hours to days after pressurization. This unraveling over time eventually led to a loss of hoop support over relatively large cylindrical regions (typically 0.5 inch or greater along the axial direction) and eventually to burst failure. In a burst test under rapid pressurization, such tow failures did not typically cause immediate burst failure, since unraveling did not have time to occur. In contrast to the high burst pressurization rate, the pressurization rate for the stress rupture tests occurred at rates two orders of magnitude slower than for the burst tests. Thus, if such tow or band failure occurred during slow pressurization of a group of nine vessels up to a specific but relatively high target stress rupture pressure, failure of tows or bands in one of the vessels could occur well before reaching the target pressure. This could result in unraveling of the tow and possibly a reduced burst pressure on continued pressurization or very early failure in stress rupture.
To determine if these failures were due to a hypothesized shelf life effect, ten of the remaining test vessels were selected for burst testing. Three of the vessels selected were pristine, and seven had been previously pressurized, during the stress rupture test program, to levels from 3750 psi to 4000 psi. These vessels produced burst test results close to the previously tested vessels. The mean of this group of 10 vessels was 4225 psi, less than one half of a standard deviation below the mean for the original group of 20 and the variability was very similar. In addition, four other aged vessels of a flight-like design were burst, with no reduction in strength. Based on these results, the consultation team found no evidence to support the hypothesis that low humidity exposure resulted in lower burst strength, and there is no evidence to support the concept of a shelf life due to other ambient environmental effects.
VI. Analysis The above conclusion, that there was no evidence to support the hypothesis that low humidity exposure results in
lower burst strength, was not sufficient to close the investigation, since the cause of the early burst events had not been identified. Further analysis of the statistical behavior of the failures, as well as structural analysis of the vessels augmented by data from NDE, was needed for explanation of the causes of the anomalous failures. Figure 4 presents a Weibull plot of the merging of all 30 burst data points, but also includes the four anomalous failures for the original three vessels, S/N 2141, 2117, and 2101, and the added vessel, S/N 2142, all shown in Table II. All vessel burst test data merge to give mean burst strength close to the 4288 psi mean obtained in the original WSTF-JPL test vessel burst tests. The addition of these four anomalous failures does not bring down the mean value. The four low burst values (red dots), especially the lowest one, stand out as being deeper into the tail of the distribution than might be predicted by extrapolating the results of the other 30 burst tests (dashed line). As mentioned earlier, the anomalous failures (red dots) were observed during (or very shortly after) pressurization in the stress rupture tests at a much lower pressure rate (by two orders of magnitude) than was used in the actual burst tests of the other 30 vessels. Any failed tows during the initial pressurization of the stress rupture tests would have had considerably more time to unravel and shed load onto neighboring tows than in a rapid burst test. Slow pressurization would overstress neighboring tows over long lengths possibly failing them and accelerating the failure process. Similar behavior to what was observed during slow rate pressurization is demonstrated by differences in the left and right photographs of Figure 3. This important fact will provide a key avenue of investigation, using a statistically based modeling approach, which will ultimately demonstrate the predictability of these three low burst values, as discussed later.
American Institute of Aeronautics and Astronautics
7
Figure 4. Weibull Plot of Burst Pressure Data from Three Burst Test Groups ( green circles ) and the Four Low Burst Values (red circles)
Understanding the significance of the four low burst values shown in Figure 4 requires more advanced
statistical and mechanical modeling as well as a deeper understanding of the results from the successful NDE inspection and burst testing of the ten selected WSTF-JPL COPV test vessels. To obtain a deeper understanding, four types of vessels were selected The first type consisted of just one vessel, S/N 2189, that had been previously pressurized to 4000 psi. This level is the 93 percent pressure ratio. Vessel S/N 2189 was in the same bank as S/N 2101, which burst on initial pressurization at 3910 psi. Also failing in the same bank were vessel S/N 2207, which burst (Type II) in stress rupture after 1.2 hours, and S/N 2209, which had a hoop tow failure (Type I) by 1.2 hours. This test vessel (S/N 2189) was actually chosen as a practice vessel for application of the fiber Bragg gratings by Blue Road Research (Appendix F), but the results were still valid. The second vessel category consisted of three pristine or “green” samples (S/N 2052, 2099, and 2139) that had not previously been pressurized or proof tested in any way. These three vessels had been stored in containers at WSTF since 1998. The third group of COPVs (S/N 1894, 2069 and 2176) was previously pressurized to 3805 psi in stress rupture. They were in the same bank with vessel S/N 2236, which showed a hoop tow failure (Type I) sometime in the first four hours. The fourth group of COPVs (S/N 1903, 2175, and 2179) was previously pressurized to 3750 psi in stress rupture. These were in the same bank with vessel S/N 2117 which burst (Type II) sometime in the first 15 hours and S/N 2166 which had a tow failure (Type I) by 16 hours. As will be seen later, these previous pressure levels in the third and fourth group were clearly evident from the fiber Bragg grating strain gage results, which proved helpful in determining the delivered fiber strength in the vessels.
The NDE testing of the ten WSTF-JPL test vessels, which provided a valuable basis for determining the cause of the apparently low burst values, consisted of the following procedures and methods. The set of three pristine vessels first removed from the original packing containers after storage were studied visually. No unusual signs of damage or manufacturing irregularities were found.
Next, NDE of the vessels was performed using, Infrared (IR) Flash Thermography, Eddy Current testing (ET), Ultrasonic C-scan, and Shearography. In addition, fiber Bragg gratings were installed to measure hoop and axial surface strains during burst testing. Some minor indications were found in the NDE inspection. However, nothing was noted that would be expected to decrease the burst pressure. The third and fourth types of vessels, consisting of previously pressurized COPVs, were subjected to the same NDE methods as the pristine vessels and similar results were observed.
One important issue to consider is whether the errors in manufacturer calculated conversions from pressure ratio to effective fiber stress ratio are sufficient to explain the anomalous results. While certainly an important factor, additional statistical and micromechanical modeling and investigation of manufacturing flaws is required to fully explain the anomalous behavior.
American Institute of Aeronautics and Astronautics
8
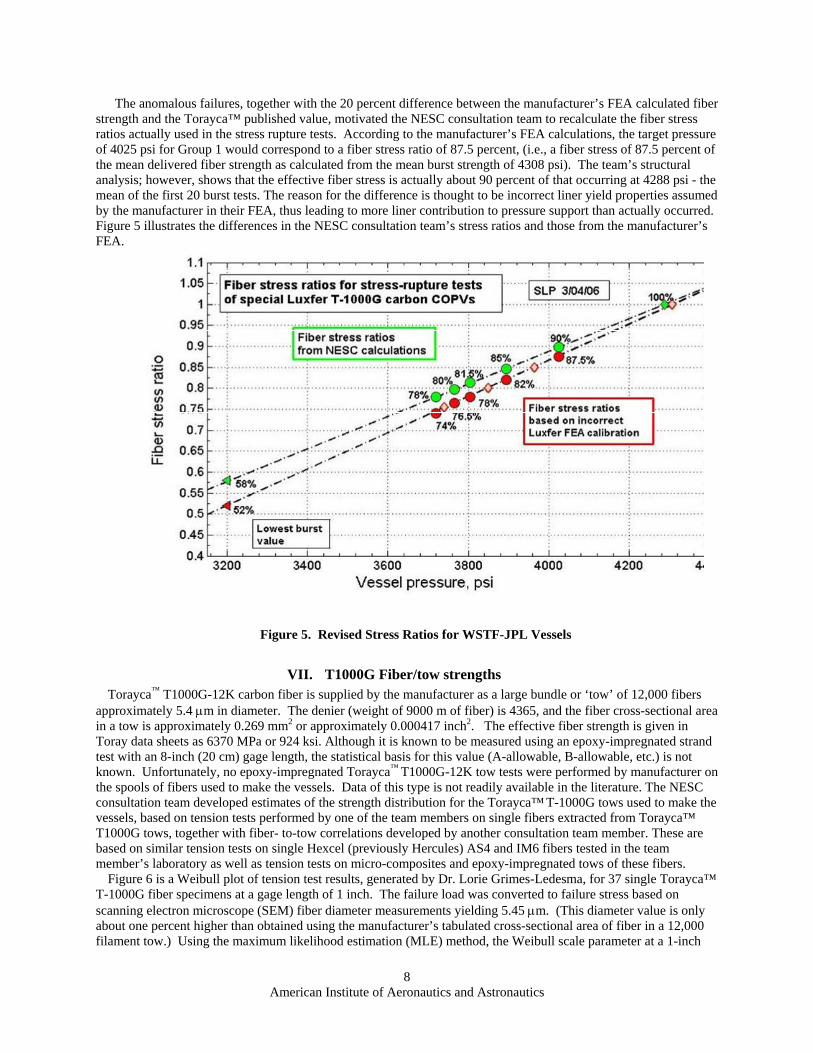
The anomalous failures, together with the 20 percent difference between the manufacturer’s FEA calculated fiber strength and the Torayca™ published value, motivated the NESC consultation team to recalculate the fiber stress ratios actually used in the stress rupture tests. According to the manufacturer’s FEA calculations, the target pressure of 4025 psi for Group 1 would correspond to a fiber stress ratio of 87.5 percent, (i.e., a fiber stress of 87.5 percent of the mean delivered fiber strength as calculated from the mean burst strength of 4308 psi). The team’s structural analysis; however, shows that the effective fiber stress is actually about 90 percent of that occurring at 4288 psi - the mean of the first 20 burst tests. The reason for the difference is thought to be incorrect liner yield properties assumed by the manufacturer in their FEA, thus leading to more liner contribution to pressure support than actually occurred. Figure 5 illustrates the differences in the NESC consultation team’s stress ratios and those from the manufacturer’s FEA.
Figure 5. Revised Stress Ratios for WSTF-JPL Vessels
VII. T1000G Fiber/tow strengths Torayca™ T1000G-12K carbon fiber is supplied by the manufacturer as a large bundle or ‘tow’ of 12,000 fibers
approximately 5.4 μm in diameter. The denier (weight of 9000 m of fiber) is 4365, and the fiber cross-sectional area in a tow is approximately 0.269 mm2 or approximately 0.000417 inch2. The effective fiber strength is given in Toray data sheets as 6370 MPa or 924 ksi. Although it is known to be measured using an epoxy-impregnated strand test with an 8-inch (20 cm) gage length, the statistical basis for this value (A-allowable, B-allowable, etc.) is not known. Unfortunately, no epoxy-impregnated Torayca™ T1000G-12K tow tests were performed by manufacturer on the spools of fibers used to make the vessels. Data of this type is not readily available in the literature. The NESC consultation team developed estimates of the strength distribution for the Torayca™ T-1000G tows used to make the vessels, based on tension tests performed by one of the team members on single fibers extracted from Torayca™
T1000G tows, together with fiber- to-tow correlations developed by another consultation team member. These are based on similar tension tests on single Hexcel (previously Hercules) AS4 and IM6 fibers tested in the team member’s laboratory as well as tension tests on micro-composites and epoxy-impregnated tows of these fibers.
Figure 6 is a Weibull plot of tension test results, generated by Dr. Lorie Grimes-Ledesma, for 37 single Torayca™
T-1000G fiber specimens at a gage length of 1 inch. The failure load was converted to failure stress based on scanning electron microscope (SEM) fiber diameter measurements yielding 5.45 μm. (This diameter value is only about one percent higher than obtained using the manufacturer’s tabulated cross-sectional area of fiber in a 12,000 filament tow.) Using the maximum likelihood estimation (MLE) method, the Weibull scale parameter at a 1-inch
American Institute of Aeronautics and Astronautics
9
gage length is 1.050 Msi, and the MLE mean value is approximately 0.995 Msi. The associated Weibull shape parameter of 5.2 is typical of high-strength carbon fibers6-11. Figure 6 also shows the Weibull distribution for fiber strength corresponding to a 1 centimeter gage length, as obtained using Weibull-weakest link scaling. The resulting Weibull scale parameter is now higher at 1.256 Msi and the mean is 1.20 Msi, but the shape parameter remains at 5.2. This Weibull extrapolation is legitimate, since many fiber strength values are observed in the region of extrapolation, especially above the 1.256 Msi value.
Figure 6. Weibull Distribution for Fiber Strength Measured by Dr. Lorie Grimes-Ledesma at 1 Inch Gage Length and Weakest-Link Extrapolation to a 1 cm Gage Length (Manufacturers strand cross-sectional area
used in calculation)
One important observation from Figure 6 is that this Torayca™ T-1000G sample of 37 single fibers had strengths ranging from about 250 ksi to almost 1,400 ksi – a variation factor of five. The low value of 250 ksi possibly reflects an outlier from testing difficulties or possibly a population of rarer but more severe flaws along the fiber not represented by a single Weibull population of typical flaws. However, in a sample of 37 such 1-inch fiber specimens, a low strength of 600 to 650 ksi is certainly anticipated from the typical flaw population, and in a sample of 100 such specimens, the lowest observed strength is typically below 500 ksi. This is important, since the weakest WSTF-JPL test vessel (S/N 2141) was found to have an effective fiber strength of 520 ksi. From this Weibull plot, it is predicted that in a 1-inch length of tow of 12,000 fibers there would likely be 2.1 percent, or 250 fibers, with strengths less than 520 ksi. Within a 1-inch long by 0.467-inch wide band of six tows there would be approximately 1500 fibers with strength below 520 ksi. This would result in fiber failure activity noticeable as acoustic emission (AE) and erratic surface strain measurements. Concepts behind these observations and assertions can be found in Mahesh and Phoenix.12. The conversion factor from single carbon fiber strength, corresponding to a 1-cm gage length, to epoxy-impregnated tow strength, measured at a 20-cm (~ 8 inch) gage length, is approximately 93 percent of the Weibull scale parameter. Also, the variability tends to be smaller by a factor of three to four as expressed in terms of the Weibull shape parameter. It is assumed that for the present analysis, the effective strength of the fiber in epoxy-impregnated Torayca™ T1000G-12K tows at an 8-inch gage length follows a Weibull distribution with scale parameter 1.174 Msi or 1,174 ksi and shape parameter 15. The effective mean fiber strength is 1133 ksi. This value is about three standard deviations above the value quoted by Toray of 924 ksi (also based on 8-inch epoxy-impregnated tow tests).
American Institute of Aeronautics and Astronautics
10
DeTeresa and Groves present strength and stress rupture results for Torayca™ T-1000G-12K “prepreg” tows using an ERL-190813 resin and called a “towpreg.” A Weibull shape parameter value of 14.73 was reported by DeTeresa and Groves for the strength of these tows.14 The scale parameter for effective fiber strength in the tow is calculated to be 6450 MPa or 935 ksi, based on a fiber volume fraction of 0.6 and a gage length of 12 inches. This corresponds to a composite strength of 3880 MPa. By Weibull extrapolation from 12 inches to 8 inches using a Weibull shape parameter of 15, the scale parameter becomes 6629 MPa or 961 ksi. Being based on towpreg material and considering clamping problems as noted by DeTeresa and Groves, this value is likely to be somewhat lower than theoretically possible. Based on this analysis of fibers and tow strength, the burst strength statistics of the WSTF-JPL test vessels were successfully predicted using the 8 inch Weibull tow strength parameters in a global load sharing (GLS) statistical model of the tow failure process that occurs during rapid pressurization. The predictions are very close to those observed experimentally. It should be noted that using lower effective fiber strength values to represent tow strength (such as the Toray tabulated value of 924 ksi, or the value, 961 ksi value representative of the results of DeTeresa and Groves) would preclude the team from obtaining the observed high delivered Weibull scale parameter for effective fiber strength in the WSTF-JPL test vessels of about 900 ksi.14 In other words, given the amount of variability in tow strength, it is necessary to begin with an effective mean fiber strength of 1133 ksi in tow form to end up with the observed strength of about 900 ksi in the COPVs. Each of these has about 1300 inches of statistically variable tow in the hoop wrap.
VIII. First Tow Failure Burst Strength Predictions The pressure was assessed at which the first tow would fail in a burst test (at a pressure rate of 50 psi/second causing burst in about 80 seconds) in a:
1. single WSTF-JPL test vessel, 2. group of three WSTF-JPL test vessels (as was the number of pristine vessels in the instrumented test of
ten), 3. group of nine WSTF-JPL test vessels (the number in one stress rupture group), and 4. group of 80 WSTF-JPL test vessels (the total number placed in stress rupture testing).
Since there are 100 hoop wraps of Torayca™ T-1000G tow in a single vessel of diameter 4.3 inches, the total
length of tow involved in the hoop windings of the four vessel groups is 1,326 inches, 3,978 inches, 11,931 inches, and 96,780 inches, respectively. Weibull weakest link scaling can be used to predict the mean strength of single tows of this length. By this scaling, tow strength diminishes in proportion to (tow length)-1/(shape parameter), relative to the Weibull mean tow strength at 8-inches gage length. Beginning with the 8-inch mean value of 1133 ksi and a shape parameter of 15, the relevant fiber stress levels and vessel pressures for first expected tow failure can be calculated as in Table III.
Table III. First Tow Failure Stress/Pressure Levels Fiber Stress Levels for First Tow Failures
807 ksi One WSTF-JPL test vessel 750 ksi Group of 3 WSTF-JPL test vessels 696 ksi Group of 9 WSTF-JPL test vessels 606 ksi Group of 73 WSTF-JPL test vessels
WSTF-JPL Test Vessel Pressure Levels at First Tow Failure 3995 psi One WSTF-JPL test vessel 3933 psi Group of 3 WSTF-JPL test vessels 3681 psi Group of 9 WSTF-JPL test vessels 3426 psi Group of 73 WSTF-JPL test vessels In a burst test of a single WSTF-JPL test vessel taking only 80 seconds, the first tow failure occurred only about five seconds before the vessel reached the mean pressure at burst of 4288 psi. It should be noted that, upon failing, a
American Institute of Aeronautics and Astronautics
11
tow did not immediately unravel but appeared as de-bonded over about a 1.5 inch length on each side of the break similar to what is seen in Figure 3. In a group of three pristine WSTF-JPL test vessels, the first tow failure might be expected at six or seven seconds before reaching the mean burst pressure (slightly earlier than in one vessel). Such tow failure is evident from the recorded data during burst testing of the 10 vessels. Strain gages were destroyed by massive preliminary failure events in these pristine vessels at pressures of 3584 psi in vessel S/N 2139, 3865 psi in S/N 2052, and 4090 psi in S/N 2099, with a major event of strain unloading occurring at 3841 psi in this last vessel. The pressures recorded for these strain-gage-destroying events are completely consistent with the above listed pressures of 3995 ksi and 3933 ksi for first tow failure in one and three vessels respectively. It should be noted that the remaining seven WSTF-JPL test vessels already saw pressures of approximately 3800 psi (and above 4000 psi for one vessel) for considerable times in a stress rupture test, since they were survivors when others had burst. The pressure for first tow failure in a group of seven such vessels would not be about 3700 psi but at least the pressure level 3800 psi in the stress rupture tests they survived. This distinction is also evident from the fiber-Bragg grating strain plots which are smooth until about 3800 psi. During pressurization of a large group of 73 WSTF-JPL test vessels, low burst values were observed. The first tow failure was calculated to occur at 3426 psi, corresponding to a fiber stress of 606 ksi. This value is well below the burst pressure values for three of the vessels in question, shown in Table II. However, vessel S/N 2141, with the lowest burst pressure of 3200 psi, had a corresponding effective fiber strength of only 520 ksi, so it is the only vessel to lie outside this prediction. However, it is most important to note that the pressurization rate was not 50 psi/second of the rapid burst test but, instead, more than two orders of magnitude slower at 0.28 psi/second. When unanticipated failure activity was first noted as audible loud pinging at about 3200 psi, pressurization was suspended and the vessel was held pressurized for approximately 30 minutes over which time the pressure decayed to 2600 psi. Afterwards, pressurization continued, and increasing the pressure from 2600 psi to 3200 psi took an estimated 20 additional minutes when the vessel finally burst. This vessel, with known tow failures, existed in a stress rupture state for roughly an hour. This is a crucial factor in explaining the low pressure at which this one vessel, S/N 2141, ultimately burst. Had the burst test continued unabated, even at the slow pressure rate, the burst pressure could have been two or three hundred psi higher, thus making this burst less singular. DeTeresa and Groves report that during loading of Torayca™ T-1000G/epoxy tows to the 92.2 percent stress ratio, six out of about 30 that failed on loading, and five more had failed by ten hours.14 At 87.1 percent, 3 out of 25 failed on loading, and another tow failed by ten hours. Thus, stress rupture-like activity is likely in strands loaded extremely slowly. These calculations essentially predict tow failures during the pressurization of larger groups of WSTF-JPL test vessels at stress levels comparable to and even lower than for three of the four low values in Figure 4. Demonstration that tow failures will rapidly convert to early burst in the stress rupture experiments was required. Certainly the stress rupture results of DeTeresa and Groves for Torayca™ T-1000G/epoxy tows and the corrected stress ratios in Figure 5 would make tow stress rupture likely for the three higher values of early/low burst failure in Figure 4.14 It is necessary to show that, in this special WSTF-JPL test vessel design with only one hoop wrap, any tow failure is likely to promote further tow failures though load redistribution and eventually vessel burst. The WSTF-JPL test vessels received cosmetic sanding and grinding to remove excess epoxy after curing. Upon close inspection by WSTF-JPL personnel, sufficient surface grinding was found to warrant requesting a second set of burst tests on ten such vessels with this surface abrasion. As described earlier, these tests did not produce significantly lower burst strength values. However, as shown through GLS modeling, the occurrence of a few nicked tows is not, in and of itself, likely to cause lower burst strength. Eighteen tows, spanning three bands, are involved in tow load-sharing. A few premature tow failures in one GLS bundle are unlikely to significantly reduce burst strength at rapid pressure rates as occurred in the burst testing, since it is the statistically weakest GLS bundle that causes failure. The bundle with the nicked tows may be masked by other tow failures and not the one that causes burst. Pressurization at a very slow rate, however, would lead to a very different failure progression, as damaged tows would have time to de-bond and unravel. This is shown to substantially reduce the burst strength or the lifetime should the target pressure actually be reached.
IX. Conclusion Based on the results of subsequent burst testing of older specimens of the special test vessels, the consultation
team found no evidence to support the hypothesis that low humidity exposure resulted in lower burst strength. There was also no evidence to support the concept of a shelf life due to other ambient environmental effects. In addition, further analysis of the low burst pressure events that initiated this study showed that the events were not anomalous. Detailed review of the structural mechanics of the vessels, and analysis of the statistics of fiber failure
American Institute of Aeronautics and Astronautics
12
and global load sharing, show that the vessel failure events were statistically predictable for a test of this type and method of execution.
Acknowledgments The authors wish to acknowledge the sponsorship provided by the NASA Engineering and Safety Center for the
Kevlar and Carbon Independent Technical Assessments.
NASA TM 73699 2 Beeson, H.; D. Davis; W.R. Ross, Sr.; and R. Tapphorn, January 2002. Composite Overwrapped Pressure Vessels,
NASA Technical Paper TP-2002-210769, Johnson Space Center, Houston Texas 3 Thomas, D. A. Long-Life Assessment of Graphite/Epoxy Materials for Space Station Freedom Pressure Vessels. AIAA Journal of Propulsion and Power, Volume 8, Number 1, January-February, 1992 4 Grimes-Ledesma, L. Babel, H. W. Comparison of Stress-Rupture Life Prediction Techniques for Composite Pressure Vessels. Proceedings of the 51st International Astronautical Congress 2-6 October 2000/Rio de Janeiro, Brazil 5 Shelf Life Phenomenon and Stress Rupture Life of Carbon/Epoxy Composite Overwrapped Pressure Vessels (COPVs) Technical Consultation Report, Vol. I and II, Dec. 2006. 6 Phoenix, S.L., P. Schwartz, and H.H. Robinson, IV. "Statistics for the strength and lifetime in creep-rupture of model carbon/epoxy composites," Composites Science and Technology, 32 (1988): 81-120. 7D. Farquhar, F. M. Mutrelle, S. L. Phoenix, and R. L. Smith, "Lifetime statistics for single graphite fibers in creep-rupture," Journal of Materials Science, 24 (1989): 2151-2164. 8H. Otani, S. L. Phoenix, and P. Petrina, "Matrix effects on lifetime statistics for carbon fiber/epoxy microcomposites in creep-rupture," Journal of Materials Science, 26 (1991): 1955-1970. 9R. Gulino, and S. L. Phoenix, "Weibull strength statistics for graphite fibers measured from the break progression in a model graphite/glass/epoxy composite," Journal of Materials Science, 26 (1991): 3107-3118. 10I. J. Beyerlein and S. L. Phoenix, "Statistics for the strength and size effects of microcomposites with four carbon fibers in epoxy," Composites Science and Technology, 56 (1996): 75-92. 11M. Kazanci, P. Schwartz, and S. L. Phoenix, “The effect of matrix stiffness on the creep-rupture lifetime of carbon fiber/epoxy composites” Composite Structures, 54 (2001): 221-223. 12 Mahesh, S., and S. L. Phoenix, “Lifetime distributions for unidirectional fibrous composites under creep-rupture loading”, Int. J. Fracture, 127 (2004): 303–360 13 ERL-1908 is a product of Amoco. 14 DeTeresa, S.J. and S.E. Groves, “Properties of fiber composites for advanced flywheel energy storage devices,” Lawrence Livermore National Laboratory Report UCRL-JC-142020, January 12, 2001