1 American Institute of Aeronautics and Astronautics An Approach to Verify a Model for Translating Convective Weather Information to Air Traffic Management Impact William N. Chan ∗ NASA Ames Research Center Moffett Field, CA 94035 Mohamad Refai † University of California Santa Cruz Moffett Field, CA 94035 Rich DeLaura ‡ Massachusetts Institute of Technology, Lincoln Laboratory Lexington, MA 02420 This paper describes a method to determine the accuracy of the Convective Weather Avoidance Model which predicts the likelihood that pilots will deviate away from specific areas of convective activity. Visual inspection with a reduced data set helped refine the algorithms used in the verification and offered some preliminary results of the model’s accuracy in today’s airspace. This model has some explanatory power in predicting regions of airspace where pilots are willing to deviate or fly through. In some instances, pilots appeared not to make an early decision to deviate around convective weather and continued on course as the region appeared more passable when they reached it. In other instances, pilots skirted the edges of regions where the model expected pilots avoid. This behavior suggests edge areas of those model regions were more passable and the convection in that region was not uniform in intensity. I. Introduction HE Federal Aviation Administration (FAA) is currently handling nearly 120,000 flights a day through its Air Traffic Management (ATM) system 1 and air traffic congestion is expected to increase substantially over the next 20 years 2 . Weather-induced impacts account for 70% of all delays with convective weather accounting for 60% of all weather related delays 3 . To improve ATM decisions in all weather conditions, weather information must not only be integrated with decision support algorithms but those data need to be translated into impact on the ATM system to minimize weather impact related delays. Another effort is directed at translating probabilistic convective weather forecasts to ATM impact 4 where the model used in this effort translates deterministic data to ATM impact. Decision support tools with integrated ATM weather impact algorithms can provide improved decision making over systems that simply overlay weather data such as the Enhanced Traffic Management System 5 . In those systems where weather data are simply overlaid, it is left to a human decision maker to determine the ATM impact. The ∗ Chief, Aviation Operation Systems Development Branch, Moffett Field MS 210-8, Senior Member. † Senior Programmer/Analyst, University of California Santa Cruz/University Affiliated Research Center, Moffett Field MS 210-8. ‡ Technical Staff, Massachusetts Institute of Technology, Lincoln Laboratory, Group 43 Weather Sensing. T 7th AIAA Aviation Technology, Integration and Operations Conference (ATIO)<BR>2nd Centre of E 18 - 20 September 2007, Belfast, Northern Ireland AIAA 2007-7761 This material is declared a work of the U.S. Government and is not subject to copyright protection in the United States.
Transcript
1
American Institute of Aeronautics and Astronautics
An Approach to Verify a Model for Translating Convective Weather Information to Air Traffic
Management Impact William N. Chan∗ NASA Ames Research Center Moffett Field, CA 94035 Mohamad Refai† University of California Santa Cruz Moffett Field, CA 94035 Rich DeLaura‡ Massachusetts Institute of Technology, Lincoln Laboratory Lexington, MA 02420
This paper describes a method to determine the accuracy of the Convective Weather Avoidance Model which predicts the likelihood that pilots will deviate away from specific areas of convective activity. Visual inspection with a reduced data set helped refine the algorithms used in the verification and offered some preliminary results of the model’s accuracy in today’s airspace. This model has some explanatory power in predicting regions of airspace where pilots are willing to deviate or fly through. In some instances, pilots appeared not to make an early decision to deviate around convective weather and continued on course as the region appeared more passable when they reached it. In other instances, pilots skirted the edges of regions where the model expected pilots avoid. This behavior suggests edge areas of those model regions were more passable and the convection in that region was not uniform in intensity.
I. Introduction
HE Federal Aviation Administration (FAA) is currently handling nearly 120,000 flights a day through its Air Traffic Management (ATM) system1 and air traffic congestion is expected to increase
substantially over the next 20 years2. Weather-induced impacts account for 70% of all delays with convective weather accounting for 60% of all weather related delays3. To improve ATM decisions in all weather conditions, weather information must not only be integrated with decision support algorithms but those data need to be translated into impact on the ATM system to minimize weather impact related delays. Another effort is directed at translating probabilistic convective weather forecasts to ATM impact4 where the model used in this effort translates deterministic data to ATM impact. Decision support tools with integrated ATM weather impact algorithms can provide improved decision making over systems that simply overlay weather data such as the Enhanced Traffic Management System5. In those systems where weather data are simply overlaid, it is left to a human decision maker to determine the ATM impact. The
∗ Chief, Aviation Operation Systems Development Branch, Moffett Field MS 210-8, Senior Member. † Senior Programmer/Analyst, University of California Santa Cruz/University Affiliated Research Center, Moffett Field MS 210-8. ‡ Technical Staff, Massachusetts Institute of Technology, Lincoln Laboratory, Group 43 Weather Sensing.
T
7th AIAA Aviation Technology, Integration and Operations Conference (ATIO)<BR> 2nd Centre of E18 - 20 September 2007, Belfast, Northern Ireland
AIAA 2007-7761
This material is declared a work of the U.S. Government and is not subject to copyright protection in the United States.
2
American Institute of Aeronautics and Astronautics
Route Availability Planning Tool (RAPT) developed by MIT/Lincoln Laboratory (MIT/LL) uses integrated convective weather data to forecast the impact on airspace capacity in the New York airspace6. RAPT can include weather translation models such as the Convective Weather Avoidance Model (CWAM)7 for improved decision making. CWAM translates convective weather information to ATM impact by identifying convective regions of airspace pilots are likely to deviate around as well as regions they may fly through. This model will help minimize lost capacity due to convection by providing more accurate regions where re-route is required. Developing routing algorithms using the CWAM is an important issue; equally important is verifying its accuracy. NASA-Ames, in collaboration with MIT/Lincoln Laboratory, is verifying the CWAM and the results of this preliminary verification study are presented in this paper. This model has been integrated into the Future ATM Concepts Evaluation Tool8 (FACET) with the intent of using it to develop ATM advisories. Data collected using FACET are analyzed with Matlab®. In addition to studying how the CWAM model is used in an ATM decision support tool, its accuracy needs to be verified. This paper presents a method to verify the accuracy of the CWAM. Verifying the model will also allow researchers to suggest improvements that will feedback to the CWAM development group. Since the initial development of CWAM there has not been a fully automatic method developed to evaluate the CWAM model. This work is an attempt to develop a methodology to automatically verify the CWAM model. In this paper, the CWAM is described followed by a description of the methodology and then some preliminary results.
II. The Convective Weather Avoidance Model The following description of the CWAM is found in DeLaura and Evans 2006 and repeated here to provide context. The CWAM developed at MIT/Lincoln Laboratory translates convective weather information to ATM capacity to help reduce the impact of convective weather-constrained regions on ATM performance. It challenges the notion that all pilots adhere to the FAA Aeronautical Information Manual guidelines that recommend pilots avoid thunderstorms characterized as severe of by an “intense radar echo” in en route airspace by at least 20 nautical miles (40 km).9 CWAM translates convective weather information to ATM impact by not only predicting convective regions pilots are likely to deviate around, but in some cases, regions they will fly through. This type of meteorological information translation should be performed for all weather data as ATM decisions using meteorological information should be less concerned with what the information reveals about the state of the atmosphere and more concerned with how that information translates to ATM impact. CWAM is based on the analysis of approximately 500 en route flight trajectories through a single Air Route Traffic Control Center (ARTCC) from five different days in 2003 with significant convective weather. Ground speed and altitude from each Enhanced Traffic Management System (ETMS) flight trajectory were used to interpolate a corresponding planned trajectory that followed the flight plan recorded in the ETMS data. Weather encounters were identified along the planned trajectory, and each encounter was classified as a deviation or non-deviation, based on the mean distance between the planned and actual trajectory over the course of the encounter. The distance threshold used to classify deviations was derived from the analysis of approximately 500 actual and planned flight trajectories from a 24-hour period of clear weather. The weather characteristics encountered along each planned trajectory provide a set of possible weather-related deviation predictors. Deviation predictors were defined from the Vertically Integrated Liquid (VIL), echo top and lightning fields using different statistical measurements (90th percentile, median, area coverage, etc.) from different route width scales (16 and 60 km wide routes, centered on the planned trajectory). VIL is the amount of liquid water that the radar detects in a vertical column of the atmosphere and is used to determine the severity of convection. High values are associated with strong convection that can be accompanied with heavy rain or hail. Echo top is the radar observed height of a convective system. The predictor sets, along with the deviation classifications, provided the inputs to the Gaussian classification algorithm. The algorithm identified the predictors that resulted in the smallest deviation classification errors and the bounding surface (in multi-dimensional predictor space) between deviations
3
American Institute of Aeronautics and Astronautics
and non-deviations. The probability of deviation, as a function of the best predictors, was defined using the observed deviation statistics. DeLaura and Evans in 2006 found that the difference between flight altitude and the radar echo top was the most accurate predictor of aircraft deviation around convective weather, with precipitation intensity playing a secondary role. Using the CWAM model, one can calculate weather avoidance contours that are a function of echo top height and precipitation intensity. Figure 1 shows a scatterplot of weather-encountering trajectories from this CWAM study and depicts the deviation prediction model boundary between deviations (gold) and non-deviations (red). In this figure, trajectory points whose fill matches the background color represent correct deviation predictions (e.g., gold boxes in the deviation half-plane); points whose fill is different from the background (e.g., red boxes in the deviation region) represent prediction errors. The predictors are represented on the scatterplot axes. The X-axis is the percentage of pixels that exhibit at least level 3 VIL in a 60 km wide neighborhood centered on the trajectory. The Y-axis is the difference between flight altitude and echo top height, where the echo top height is measured as the 90th percentile in a 16 km wide neighborhood centered on the trajectory. The horizontal black line indicates echo tops at flight altitude; points above this line represent en route flights that flew over the echo tops.
Figure 1. Scattering of deviations and non-deviations from CWAM1 study. The probabilities of deviation computed by the CWAM are based on information from the Corridor Integrated Weather System (CIWS).10 CIWS, created by MIT/Lincoln Laboratory, provides 2-hour convective forecasts updated every 5 minutes with 5-minute forecast time-steps. For example, a 2hr forecast produced at 1200Z will contain observed data for 1200Z and predictions for 1205Z, 1210Z, 1215Z, etc. The CWAM polygons are computed at the same temporal resolution as the CIWS data for altitudes ranging from 24,000 ft to 44,000 ft at 1,000 ft increments. Figure 2 shows CIWS echo top and VIL data in FACET represented as contour plots. Figure 3 shows CWAM deviation probability contours computed using these CIWS data for 25,000 ft and 32,000 ft. The contours represent probability of deviation. At the bottom right corner, below the data is the forecast time and altitude of the CWAM prediction. DP is CWAM Deviation Probability. Date, GMT time are shown in the lower right corner of each figure. Below that is the forecast time of the CIWS data used to compute these CWAM contours. The altitude of the CWAM contours is shown next to that forecast time. In Fig. 3, the forecast time is 0 min indicating these CWAM data are not based on any forecasts but on observations of CIWS data.
4
American Institute of Aeronautics and Astronautics
Figure 2. CIWS echo top (left) and VIL (right). Echo top values in the legend are in 1000’s ft. VIL values 0 – 6 are shown in the legend in the figure on the right.
Figure 3. CWAM probability contours for 25,000 ft (left) and 32,000 ft (right) computed using the CIWS data in Fig. 2. A follow-up study (CWAM2), currently in progress, will produce a revised weather avoidance model based on a much larger trajectory and weather dataset. The CWAM2 dataset will include several thousand flight trajectories from three major ARTCCs in the northeastern US and weather data from more than 100 hours of operations spanning several days. The set of weather characteristics and deviation predictors will be significantly expanded. Additional weather products will provide information about storm evolution, vertical and horizontal storm structure and weather type, as well as the precipitation intensity and storm height considered in the original CWAM study.
III. Method FACET evaluates advanced concepts in ATM decision making and is used with Matlab® in this study to validate the CWAM. FACET provides a platform to evaluate CWAM with actual aircraft and airspace data and further provides insight into some of the operational and research issues encountered when working with this model.
5
American Institute of Aeronautics and Astronautics
This analysis used aircraft track data that cover the eastern portion of the continental United States to coincide with the CIWS domain. To avoid issues of forecast accuracy, analysis of the CWAM will use only CIWS observation data. The deviation analysis of individual aircraft used to create the CWAM probabilities that define whether a pilot will choose to avoid or fly through a particular region is described below. Encounters are defined as instances when an aircraft flies through the same CWAM polygon as intersected by their flight plan. Encounters with multiple CWAM polygons are treated as a single incident if a deviation encounters all of these CWAM polygons without recapturing the flight plan in the interim. Encounters are determined using the following algorithm. Within a fifteen minute look-ahead time,
1. Find the maximum avoidance probability encountered along the planned trajectory (
!
Pmax
(%)) 2. Find the maximum avoidance probability encountered along the actual trajectory (
!
Amax
(%)) 3. If
!
Amax
" Pmax
the flight did not avoid the computed hazardous region but flew into areas the CWAM indicated had a higher probability of avoidance. 4. If
!
Amax
< Pmax
, the flight avoided the regions as predicted by the CWAM so long as it also deviated from its planned flight plan.
A fifteen minutes period was chosen as it is assumed and shown in the results that this is within the tactical decision horizon of a pilot when avoiding storms. Deviations can then be analyzed with respect to airline and aircraft type and size of CWAM probability and VIL contours. The results from this analysis can be used in an aggregate analysis to determine the accuracy of the CWAM to predict aircraft deviations in a broad sense using the following procedure.
5. Count the aircraft that encounter a specific
!
Pmax
(i.e. those whose current flight plans intersect a CWAM contour within the look-ahead horizon). 6. Of these aircraft in step 5, find the ones that deviate from their flight plan 7. For those aircraft in step 6, count the ones whose
!
Amax
is less than
!
Pmax
8. One would expect that the number of aircraft from step 7 divided by the number of aircraft from step 5 equals
!
Pmax
on the average. Essentially, the number of deviated aircraft for a specific CWAM contour is equal to the predicted deviations.
The result of procedures 1 – 8 can be summarized by the following equation. The deviation probability (
!
DP ) computes how many aircraft were correctly predicted to deviate for specific deviation probabilities and is defined as:
!
DP =ndevAC
N (1)
where
!
ndevAC
is the number of aircraft that deviated and had
!
Amax
< Pmax
for specific contours of
!
Pmax
. N is the total number for aircraft that are expected to encounter the same
!
Pmax
. If the CWAM is accurate, and if 10 aircraft are projected to encounter 80% CWAM regions, then results would show 8 of these aircraft avoid all such regions (within a suitable look-ahead time).
IV. Results This study initially expected to examine data over six case days as shown in Table 1. These days total about 116 hours with 279,523 IFR flights of which only a small percentage encountered any CWAM polygons. Traffic data were obtained from archives of 1 minute Aircraft Situation Display to Industry (ASDI) data. ASDI data show the position and flight plans of all aircraft in U.S. For each case day, there are 21 flight levels (from FL240–FL440 at 1000ft increments) and for each flight level there are 5 CWAM probability contours bins: (0%–20%), (20%–40%), (40%–60%), (60%–80%), and (80%–100%). CWAM
6
American Institute of Aeronautics and Astronautics
data are updated every 5 minutes so there were 146,160 flight levels multiplied by CWAM probability contour bins that could have been tested against the 279,523 aircraft flight plans and tracks for these 6 days. Therefore, a total of about 4x10¹⁰ CWAM contour bins and flight plan combinations (146,160 x 279,523) could have been used in this evaluation. Comparing flight plans with all possible CWAM contours increases the number of comparisons as there are multiple CWAM polygons for each contour bin. As part of this study, the altitudes of the CWAM model were corrected to pressure altitude from the geometric altitude of echo top radar observations. This correction was made using available radiosonde data to minimize error of the CWAM predictions, as en route aircraft typically fly pressure altitude not geometric. A radiosonde is a device used to measure atmospheric parameters such as temperature and pressure and is carried by weather balloons. The information can then be transmitted to a ground-based receiver. Figures 4a and 4b show plots of the storm top height as either geometric and pressure altitude. Pressure altitude was computed by interpolating atmospheric sounding data from stations throughout the CIWS domain to a geographic grid that covered the analysis region. Pressure altitude was computed for the relevant area of the CIWS domain using the atmospheric data collected by a radiosonde carried by a weather balloon. The legends are the same in both figures and show the geometric altitude is generally higher than the measured pressure altitude of about 500ft – 1000ft for these data. Other days have shown a difference up to 2000ft.
Figure 4a. Geometric altitude of storm tops as reported by CIWS radar for 2200Z July 14, 2006.
7
American Institute of Aeronautics and Astronautics
Figure 4b. Pressure altitude of storm tops from CIWS radar corrected using sounding data for 2200Z July 14, 2006.
Table 1. Number of hours and flights for each case day.
Date Time Hours Flight Plans June 19 - 20, 2006 0105Z – 0505Z 28 59,387 June 21 – 22, 2006 0505Z – 0105Z 20 57,613 June 23, 2006 0105Z – 0905Z 8 13,047 July 14 - 15, 2006 1705Z – 0105Z 8 31,488 July 21 - 22, 2006 1705Z – 0905Z 16 39,043 Sep 22 - 23, 2006 0905Z – 2105Z 36 78,945
It became clear during the preliminary analysis of these data that exhaustive verification of this model was not feasible due to available resources so a subset consisting of three altitudes (FL 320, FL340, and FL360) and the 80% CWAM probability contour was selected for preliminary analysis to verify the algorithms and methodology. Values of
!
Amax
,
!
Pmax
and
!
DP were computed for these flight levels, which are the most densely populated flight levels in the data. It is worth noting that the exclusive use of even flight altitudes biases the results towards ‘westerly’ traffic. These data were further reduced to an even smaller set when random visual inspection revealed that the number of flights whose deviations were mischaracterized was likely not negligible. Mischaracterizations of deviations include instances where the flight plan intersects a CWAM polygon but the aircraft cannot reach it within the look-ahead horizon, or has already passed it, and would be counted as a deviation. Visual inspection was undertaken for this reduced subset, which is comprised of the case days of July 14th and July 21st, 2006 for FL 320, FL 340, FL 360, and the 80% threshold CWAM probability contour. The results that follow apply to this reduced subset. Table 2 shows aggregate results for
!
DP corrected using visual analysis for each flight level for a total of 801 aircraft examined. It shows that the rate of successful deviations from CWAM contours is considerably smaller than the expectation for the 80% threshold (an 80% probability of deviation threshold covers the range 80%–100%). The lower rate of successful deviations is expected because the CWAM model employs spatial filtering on echo top and VIL, which means that CWAM contours do not define sharp deviation boundaries. Aircraft often skirted or clipped the edges of these polygons.
8
American Institute of Aeronautics and Astronautics
Table 2. Aggregate results for 2 days for aircraft that successfully deviated out of the CWAM polygon.
Total 62 317 In Table 2, an incident counts as a deviation only if the aircraft successfully clears the CWAM contour (see §III. Method). Table 3 shows aggregate results for the probability of deviation for the same flights in Table 2 (also visually corrected) but in this case counting all deviations regardless of whether or not the aircraft successfully clears the CWAM polygons. This shows that simply measuring deviations without including if the aircraft cleared the polygon will yield significantly different results. Table 3. Aggregate results for 2 days for all deviating aircraft regardless if the aircraft successfully deviated out of the CWAM polygon.
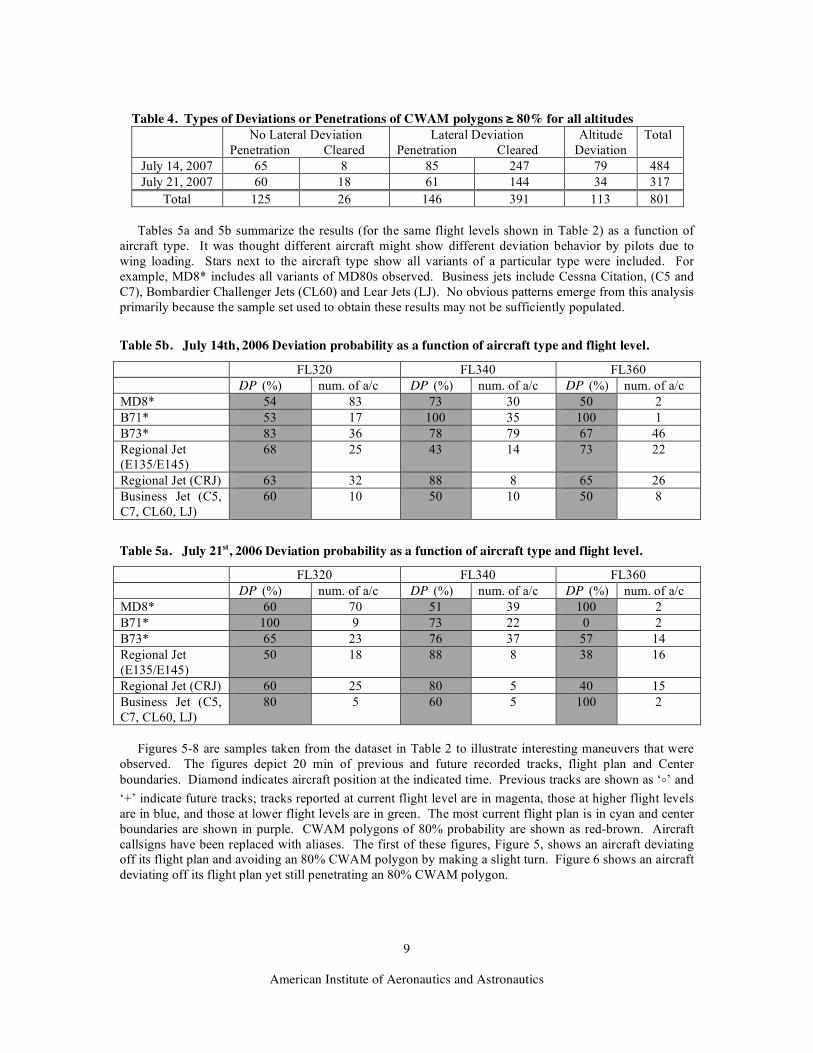
Total 75 317 Table 4 summarizes some of the observed pilot behavior relative to CWAM polygons based on the results of Tables 3. The table characterizes deviations as lateral or altitude that resulted in clearing (not penetrating) or penetrating a CWAM polygon. Altitude deviations may include both altitude and lateral deviation. Lateral deviations are where lateral maneuvers were determined to be the method used to avoid a CWAM polygon. Based on this small number of observations, pilots were more likely to avoid CWAM polygons equal to—or greater than—80% by using a lateral maneuver than stay on their flight path with the expectation of it becoming more passable. Lateral maneuvers performed to avoid CWAM polygons were observed in 83% of all deviations. Some pilots chose to deviate away from CWAM polygons but did not entirely clear it. This was noticed at a rate of 27% of all lateral deviations showing pilots deviated yet clipped the outer edge of the CWAM polygons. Observations showed pilots stayed on their flight plan and did not encounter a CWAM polygon without a deviation in 3% of all the cases. Those cases suggest the pilot chose to stay on course and timed the convective region to be passable once they reached it or CWAM over characterized intensity of the convective activity. The algorithm would count this as a penetration, but future improvements should take this type of behavior into account. Pilots used altitude maneuvers to find more favorable weather regions in roughly 17% of all deviations for all analyzed altitudes.
9
American Institute of Aeronautics and Astronautics
Table 4. Types of Deviations or Penetrations of CWAM polygons ≥ 80% for all altitudes
No Lateral Deviation Penetration Cleared
Lateral Deviation Penetration Cleared
Altitude Deviation
Total
July 14, 2007 65 8 85 247 79 484 July 21, 2007 60 18 61 144 34 317
Total 125 26 146 391 113 801 Tables 5a and 5b summarize the results (for the same flight levels shown in Table 2) as a function of aircraft type. It was thought different aircraft might show different deviation behavior by pilots due to wing loading. Stars next to the aircraft type show all variants of a particular type were included. For example, MD8* includes all variants of MD80s observed. Business jets include Cessna Citation, (C5 and C7), Bombardier Challenger Jets (CL60) and Lear Jets (LJ). No obvious patterns emerge from this analysis primarily because the sample set used to obtain these results may not be sufficiently populated.
Table 5b. July 14th, 2006 Deviation probability as a function of aircraft type and flight level.
Figures 5-8 are samples taken from the dataset in Table 2 to illustrate interesting maneuvers that were observed. The figures depict 20 min of previous and future recorded tracks, flight plan and Center boundaries. Diamond indicates aircraft position at the indicated time. Previous tracks are shown as ‘o’ and ‘+’ indicate future tracks; tracks reported at current flight level are in magenta, those at higher flight levels are in blue, and those at lower flight levels are in green. The most current flight plan is in cyan and center boundaries are shown in purple. CWAM polygons of 80% probability are shown as red-brown. Aircraft callsigns have been replaced with aliases. The first of these figures, Figure 5, shows an aircraft deviating off its flight plan and avoiding an 80% CWAM polygon by making a slight turn. Figure 6 shows an aircraft deviating off its flight plan yet still penetrating an 80% CWAM polygon.
10
American Institute of Aeronautics and Astronautics
Figure 5. Aircraft deviates off its flight plan and avoids an 80% probability CWAM polygon for FL320.
Figure 6. Aircraft penetrates CWAM polygon. An aircraft deviates but still penetrates the CWAM polygon shown in red. Figures 7a and 7b show a scenario where an aircraft executes a lateral maneuver followed by an altitude change where the storms appear less dense but then skirts a CWAM polygon. This type of maneuver was observed repeatedly for this weather scenario by other aircraft. Figure 7b depicts the situation at FL320 prior to climb. Figure 8 depicts an interesting case where the pilot navigates through what appears to be a sizable weather cell. The pilot is presumably navigating through less severe parts of a convection region or chose this longer route through a convective system due to inability to see the thinner part of this system.
11
American Institute of Aeronautics and Astronautics
Figure 8. Tracks show pilots navigating through less severe parts of a convective system which is not the shortest horizontal route through the convective region. The figures are time ordered from top left to bottom right
Figure 7. Aircraft flying through the edge of a CWAM polygon.
a b
a b
c d
12
American Institute of Aeronautics and Astronautics
V. Summary This work presents a method to verify a version of the CWAM model. More sophisticated automatic algorithms to verify the model are needed due to the large volume of data. In the absence of more sophisticated algorithms, visual inspection was used in this report to determine the accuracy of the automatic verification algorithm. Visual analysis significantly reduced the amount of data and features that could be analyzed, resulting in lower confidence of the generated statistics. The results for 2 days of analyzed data showed general agreement with CWAM deviation probabilities where aggregate results show deviations for all three analyzed altitudes above 80%. These results show VIL and storm echo tops included in this CWAM have some explanatory value for estimating pilot deviation. Visual analysis showed a small group of pilots flew towards a high CWAM probability region and continued on course without a deviation. This could be due to anticipating the convective region would be more passable once the pilots reached it. Inspection showed pilots fly through the outside edge of CWAM polygons suggesting the CWAM model overestimates storm deviation at the edges suggesting the storm is less severe around the perimeter. Future versions of CWAM will consider horizontal storm structure. An attempt to define deviations as function of leader versus follower was not successful due to a low number of aircraft on the same route flying into the same storm. This is different than near the TRACON where aircraft near arrival fixes are closer in trail showing one difference between a TRACON and En route CWAM model. Improvements to this work include addressing the correlation and cross-correlation of more features such as lighting conditions (day and night), size of CWAM polygon, Center, aircraft type and equipage, PIREPS, flight deck information, aircraft company, and exclusive passenger or cargo flights. Extensions of this work to validate other CWAM probabilities are also needed. Addressing the correlation of deviation with if the pilot is a leader or follower will require a technique that includes not only examining the movement of one aircraft, as currently used, but many aircraft. The use of PIREPS will require an automatic technique to match the PIREP, CWAM polygon, and aircraft information to determine deviation due to PIREPS for specific CWAM polygons. Also of interest is the behavior of westerly flights (even flight levels) as compared to those of easterly flights (odd flight levels). Finer CWAM probability bins may be required that are smaller than the current 20% bins. A method must also be used to determine if there is enough data to make strong conclusions such as the bootstrap or jackknife statistical method.11
Acknowledgments The authors would like to thank Mr. Bee Vue from the Massachusetts Institute of Technology for his significant improvements to the analysis of this work. Dr. Bassam Musaffar from the University of California at Santa Cruz University Affiliated Research Center (UARC) is recognized for providing computer resources and assistance in analyzing the data. The authors acknowledge Dr. Kenneth Kuhn, also from the UARC, for his interest and discussions to improve this work. Acknowledgement is also due to Rich Pawlowicz12, author of m_map, a map projection package for Matlab, which the authors used to render some of the figures.
References 1 Anon, “Operational Network (OPSNET)”, URL: http://www.apo.data.faa.gov/opsnet/entryOPSNET.asp [cited Jan 20, 2006] 2 Anon., “Next Generation Air Transportation System: Integrated Plan”, Joint Planning and Development Office, Washington DC, Nov. 2004. 3 Clifford, S. F., et al., “Weather Forecasting Accuracy for FAA Traffic Flow Management”, The National Academies Press, Washington DC, 2003, pp. 2.
13
American Institute of Aeronautics and Astronautics
4 Sheth, K., Sridhar, B., and Mulfinger, D., "Application of Probabilistic Convective Weather Forecasts for Flight Routing Decisions," Proceedings of the 7th Aviation Technology, Integration and Operations Conference, Belfast, Northern Ireland, U.K., 2007. 5 Volpe National Transportation Systems Center, U. S. Department of Transportation, “Enhanced Traffic Management System (ETMS) Functional Description Version 7.2”, 2001 6 DeLaura, R., and Allan, S., “Route Selection Decision Support in Convective Weather: A Case Study of the Effects of Weather and Operational Assumptions on Departure Throughput, ” Proceedings of the 5th Eurocontrol/FAA ATM R&D Seminar ATM-2003, Budapest, Hungary, 2003. 7 DeLaura, R., and Evans, J., “An Exploratory Study of Modeling Enroute Pilot Convective Storm Flight Deviation Behavior,” Proceedings of the 12th Conference on Aviation, Range, and Aerospace Meteorology, Atlanta, 2006. 8 Bilimoria, K., Sridhar, B., Chatterji, G. B., Sheth, K., and Grabbe, S., “FACET: Future ATM Concepts Evaluation Tool”, Air Traffic Control Quarterly, Vol. 9, No. 1, 2001, pp. 1-20. 9 Federal Aviation Administration, “Aeronautical Information Manual: Official Guide to Basic Flight Information and ATC Procedures”, Department of Transportation: Federal Aviation Administration, Feb. 16, 2006. 10 Klingle-Wilson, D., J. Evans: “Description of the Corridor Integrated Weather System (CIWS) Weather Products,” MIT Lincoln Laboratory Project Report ATC-317, Aug. 1, 2005. 11 Efron, B., “Bootstrap Methods: Another Look at the Jackknife,” The Annals of Statistics, Vol. 7, No. 1, 1979, pp. 1-26. 12 Pawlowicz, Rich, “M-Map mapping toolbox - Version 1.4,” URL: http://www.eos.ubc.ca/~rich/#M_Map [cited 19 Jun 2007].