31
AMERICAS

AMERICAS
© 2020, Amazon Web Services, Inc. or its affiliates. All rights reserved.
Quantify the business value of AWS
Michael Chu
E N T 2 0 1
Principal BDM, Cloud Economics
AWS

Two main approaches for cloud value analysis
Top-down
KPI benchmarking data
Bottom-up
Quick analysis
Value estimate
Detailed data from your organization
Greater investment of time
Higher level of accuracy

AWS Cloud Value Benchmarking (CVB)
AWS initiated value benchmarking research in 2018, we continued to expand the study in 2019, and we have plans to expand it in 2020 to provide customers with more relevant and accurate insights
1,500 customers to date
>1-year length of time on AWS
IT leaders, application and line of
business owners
USA only, global expansion in 2020
Online and phone surveys by independent third-party market research firm
Financial and business operation metrics, not technical
95% confidence level
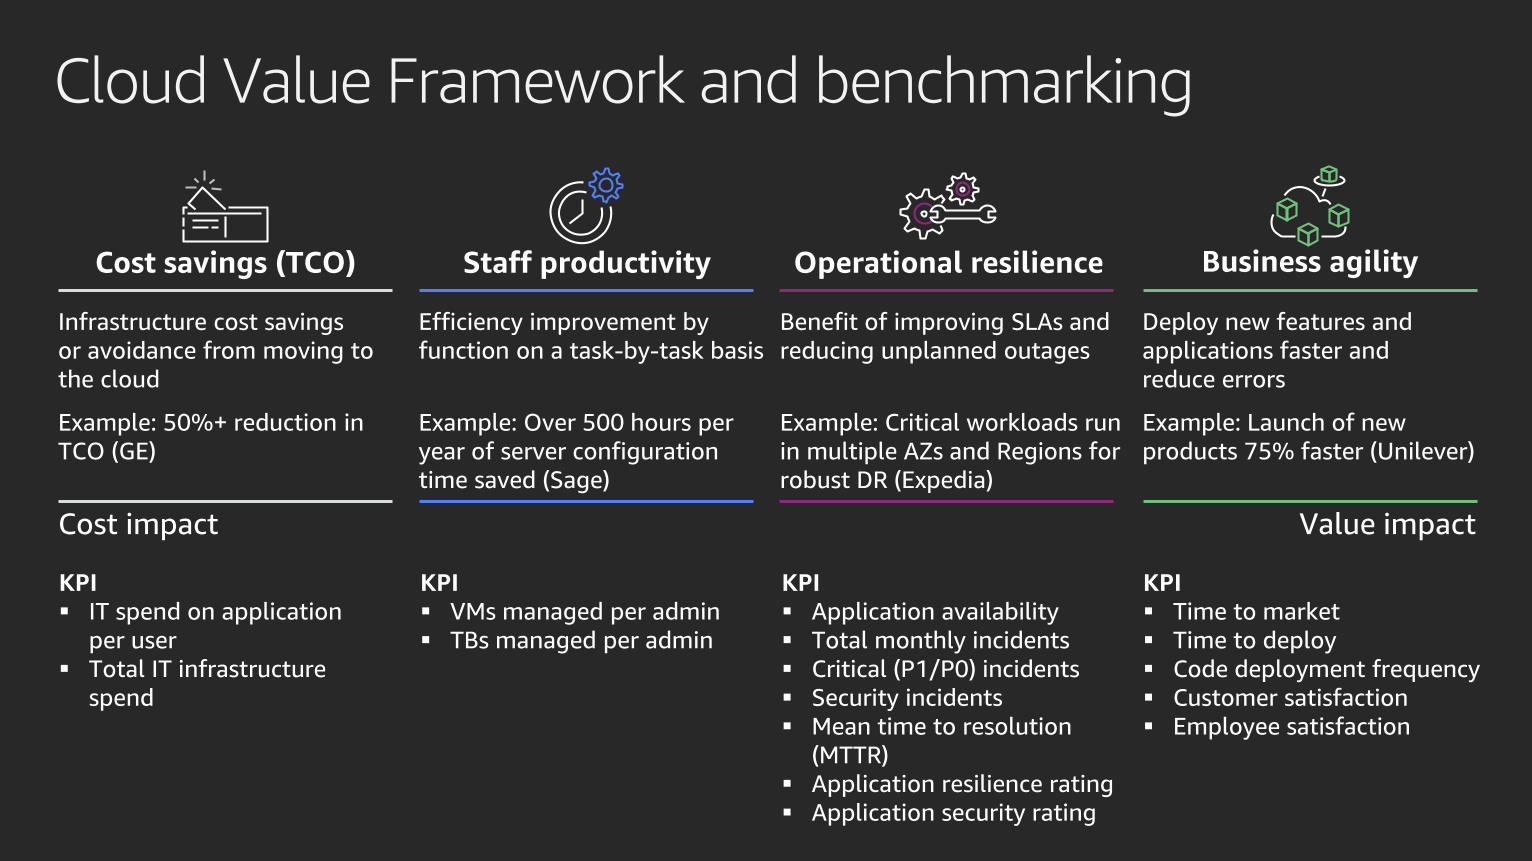
Cloud Value Framework and benchmarking
Cost savings (TCO) Staff productivity Operational resilience Business agility
KPI
Time to market
Time to deploy
Code deployment frequency
Customer satisfaction
Employee satisfaction
KPI
Application availability
Total monthly incidents
Critical (P1/P0) incidents
Security incidents
Mean time to resolution
(MTTR)
Application resilience rating
Application security rating
KPI
IT spend on application
per user
Total IT infrastructure
spend
KPI
VMs managed per admin
TBs managed per admin
Infrastructure cost savings
or avoidance from moving to
the cloud
Efficiency improvement by
function on a task-by-task basis
Benefit of improving SLAs and
reducing unplanned outages
Deploy new features and
applications faster and
reduce errors
Cost impact Value impact
Example: 50%+ reduction in
TCO (GE)
Example: Over 500 hours per
year of server configuration
time saved (Sage)
Example: Critical workloads run
in multiple AZs and Regions for
robust DR (Expedia)
Example: Launch of new
products 75% faster (Unilever)

© 2020, Amazon Web Services, Inc. or its affiliates. All rights reserved.
“Benchmarking is the practice of being humble enough to admit that someone else is better at something, and being wise enough to learn how to match them and even surpass them at it.”
American Productivity & Quality Center, 1993 philosophical definition
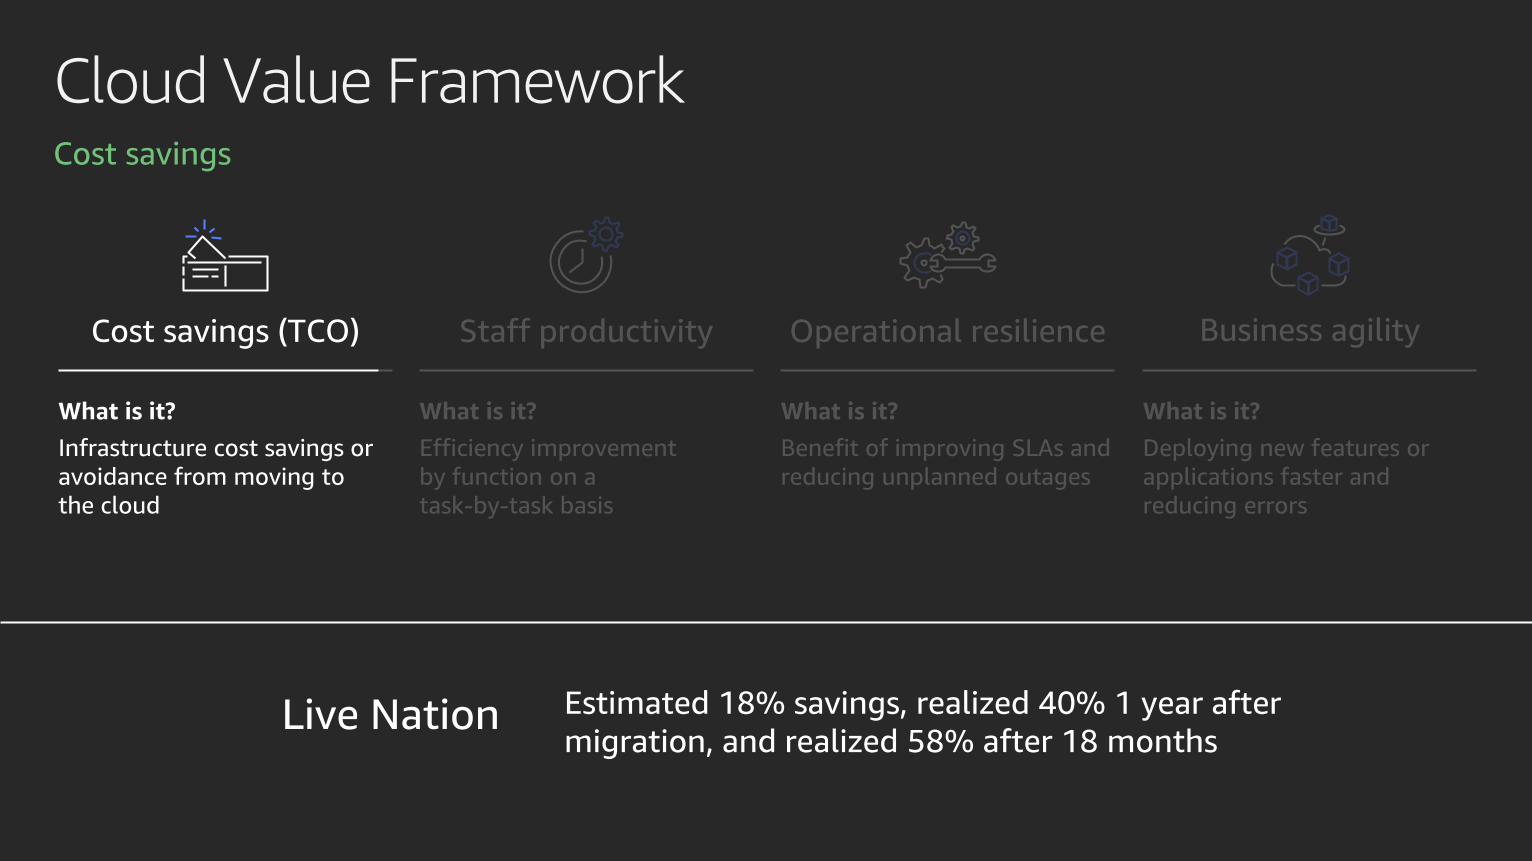
Cloud Value FrameworkCost savings
Estimated 18% savings, realized 40% 1 year after
migration, and realized 58% after 18 months
Cost savings (TCO)
What is it?
Infrastructure cost savings or
avoidance from moving to
the cloud
Staff productivity
What is it?
Efficiency improvement
by function on a
task-by-task basis
Operational resilience
What is it?
Benefit of improving SLAs and
reducing unplanned outages
Business agility
What is it?
Deploying new features or
applications faster and
reducing errors

Cost savingsEconomics of the cloud
Infrastructure
cost $
Time
Large fixed spend
Opportunity cost
Lost opportunity
Traditional hardware
Actual demand
AWS
Predicted demand
Key

Cost savingsModeling on premises
Facilities cost
Space Power Cooling
Facilities cost
Space Power Cooling
Storage software costs
(+ maintenance)
Hardware – storage disks,
SAN/FC switches2 Storage costs
Recurring ISP and
bandwidth costs
Network hardware – LAN
switches, load balancer3 Network costs
Facilities cost
Space Power Cooling1 Server costs
Software – OS,
virtualization licenses
(+ maintenance)
Hardware – server, rack
chassis PDUs, ToR
switches (+ maintenance)
Diagram doesn’t include every cost item – for example, software costs can include database, management, and middle-tier software costs;
facilities costs can include costs associated with upgrades, maintenance, building security, taxes, and other items
Illustrative

Cost savings
For an individual server, the 5-year total cost of ownership is 3.5x the cost of the hardware purchased
The cost of a server is just the beginning
36.4
7.34.9
22.9
28.5
Percentage of total cost by category
Facilities
OS licenses
Rack costs
Hardware overhead
Hardware

Cost savings Example
1 non-virtualized physical
server, 16 cores, and 64 GB
RAM at 50% utilization
1 c5.4xl (3-year TCO)
Server hardware
Maintenance
Rack
Facilities
Labor
Software
$8.0K
$3.6K
$2.0K
$10.8K
$4.0K
$0K
On premises
Total (3-year) $28.4K
Amazon EC2 3-year RI
Labor
Support
$6.5K
$1K
$1K
AWS
Total (3-year) $8.5K

Cost savingsAWS benchmarking insights
Source: AWS Cloud Economics Benchmarking
AWS reduces costs
Reduction in overall IT
infrastructure spend
19.0%Reduction in overall
spend per user
27.4%Reduction in overall
spend per user
42.4%Lower overall
spend per user vs.
multi-cloud customer
12.3%
Cost reduction grows as customersmature and scale on AWS

Cloud Value FrameworkStaff productivity
Cost savings (TCO)
What is it?
Infrastructure cost savings or
avoidance from moving to
the cloud
Staff productivity
What is it?
Efficiency improvement
by function on a
task-by-task basis
Operational resilience
What is it?
Benefit of improving SLAs and
reducing unplanned outages
Business agility
What is it?
Deploying new features or
applications faster and
reducing errors
“Building a Hadoop cluster in-house would have taken us several months, but we were using
this solution much faster because of the AWS Cloud. That was key for us, and it validated our
decision to move to the cloud.”
—Pascal Bergeron, Director of Algorithmic Trading

Staff productivityFocus on value-added work
Tactical
(undifferentiated)
Strategic
(differentiated)
Current state Lift-and-shift to AWS High-level AWS services
Act
ivit
ies
Customer maturity on AWS

TaskTypical
reductionDescription
Server budgeting and planning 90% There is no capital server budget or plan in the AWS Cloud
Server purchasing process 75%Instance purchasing requires minimal effort in comparison
to server purchasing
Long-term capacity planning 75%Capacity planning is simply a matter of initiating new instances
based on thresholds, and much of this can be automated
Project budgeting and planning 75% Project budgeting and planning effort should be significantly reduced
Prepare detailed implementation plans 75%Implementation plans will be reduced since instance initiation
is straightforward
Arrange repair for hardware on occasion
of hardware failure100% Not necessary with AWS
Installing, upgrading & removing software 50% Simplify and automate OS patching and updating
Staff productivityExample
Server administratorIllustrative

TaskTypical
reduction
Server budgeting and planning 90%
Server purchasing process 75%
Long-term capacity planning 75%
Project budgeting and planning 75%
Prepare detailed implementation plans 75%
Arrange repair for hardware on occasion
of hardware failure100%
Installing, upgrading & removing software 50%
Staff productivity Example
x75% reduction with AWS
18.8% efficiency gain
25% of time
Server administrator

Staff productivityAWS benchmarking insights
Cloud improves efficiency
Increase in
VM managed
per admin
57.9%Increase in
TB managed
per admin
67.7%Increase in
VM managed
per admin
147.7%Increase in
TB managed
per admin
153.5%
With larger gains for rearchitected applications
Source: AWS Cloud Economics Benchmarking
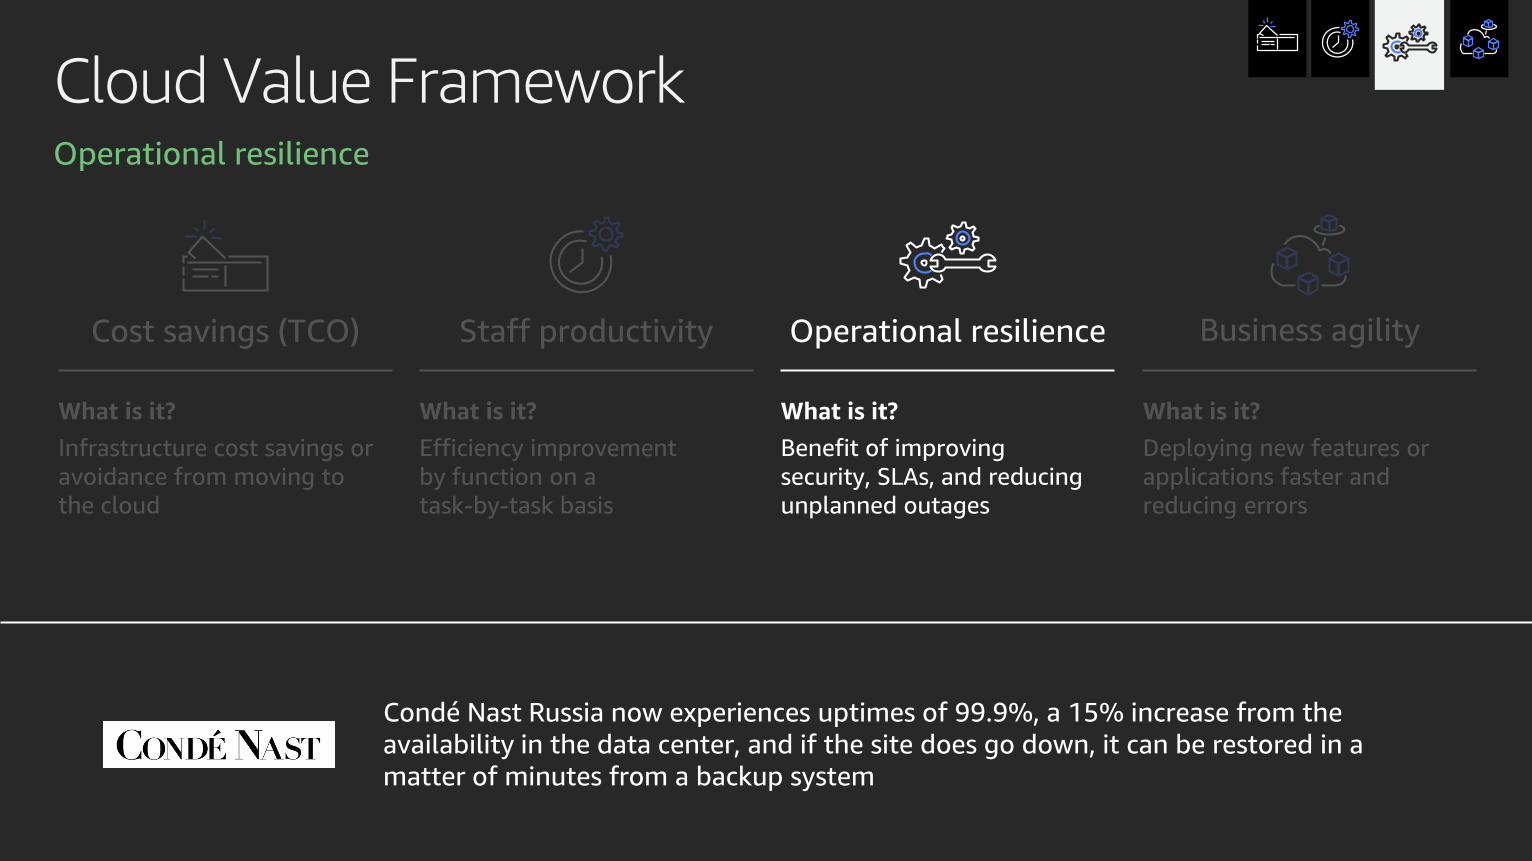
Cloud Value Framework Operational resilience
Cost savings (TCO)
What is it?
Infrastructure cost savings or
avoidance from moving to
the cloud
Staff productivity
What is it?
Efficiency improvement
by function on a
task-by-task basis
Operational resilience
What is it?
Benefit of improving
security, SLAs, and reducing
unplanned outages
Business agility
What is it?
Deploying new features or
applications faster and
reducing errors
Condé Nast Russia now experiences uptimes of 99.9%, a 15% increase from the
availability in the data center, and if the site does go down, it can be restored in a
matter of minutes from a backup system

Operational resilience Downtime costs
$1,034,640$474,000$55,560
High-impact applicationsLow-impact applications
Source: Ponemon Institute

Operational resilience Categories of downtime cost

1. Business user productivity
# of users = 1,500
Average FTE cost = $125K/year
Operational resilience Example
FTE cost = $1,500/minute
FTE cost = $750/minute
2. Other categories
~50% of cost
0.1% improvement = 525.6 minutes
x $2,250/minute
~$1.2M
Calculate cost per minute of unplanned downtimeIllustrative
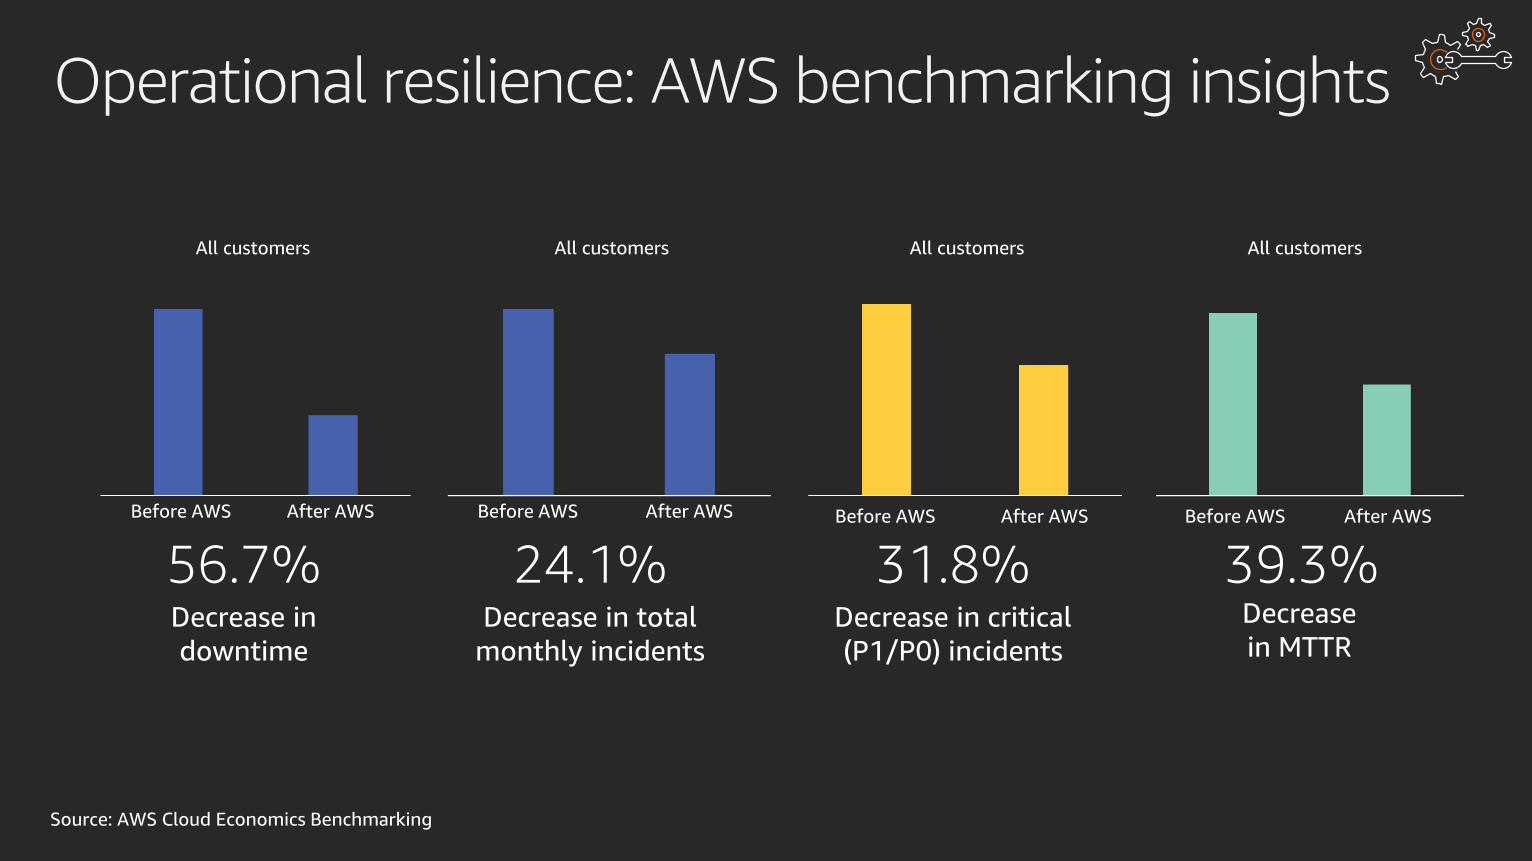
Operational resilience: AWS benchmarking insights
Decrease in
downtime
56.7%Decrease in critical
(P1/P0) incidents
31.8%Decrease
in MTTR
39.3%Decrease in total
monthly incidents
24.1%
Source: AWS Cloud Economics Benchmarking
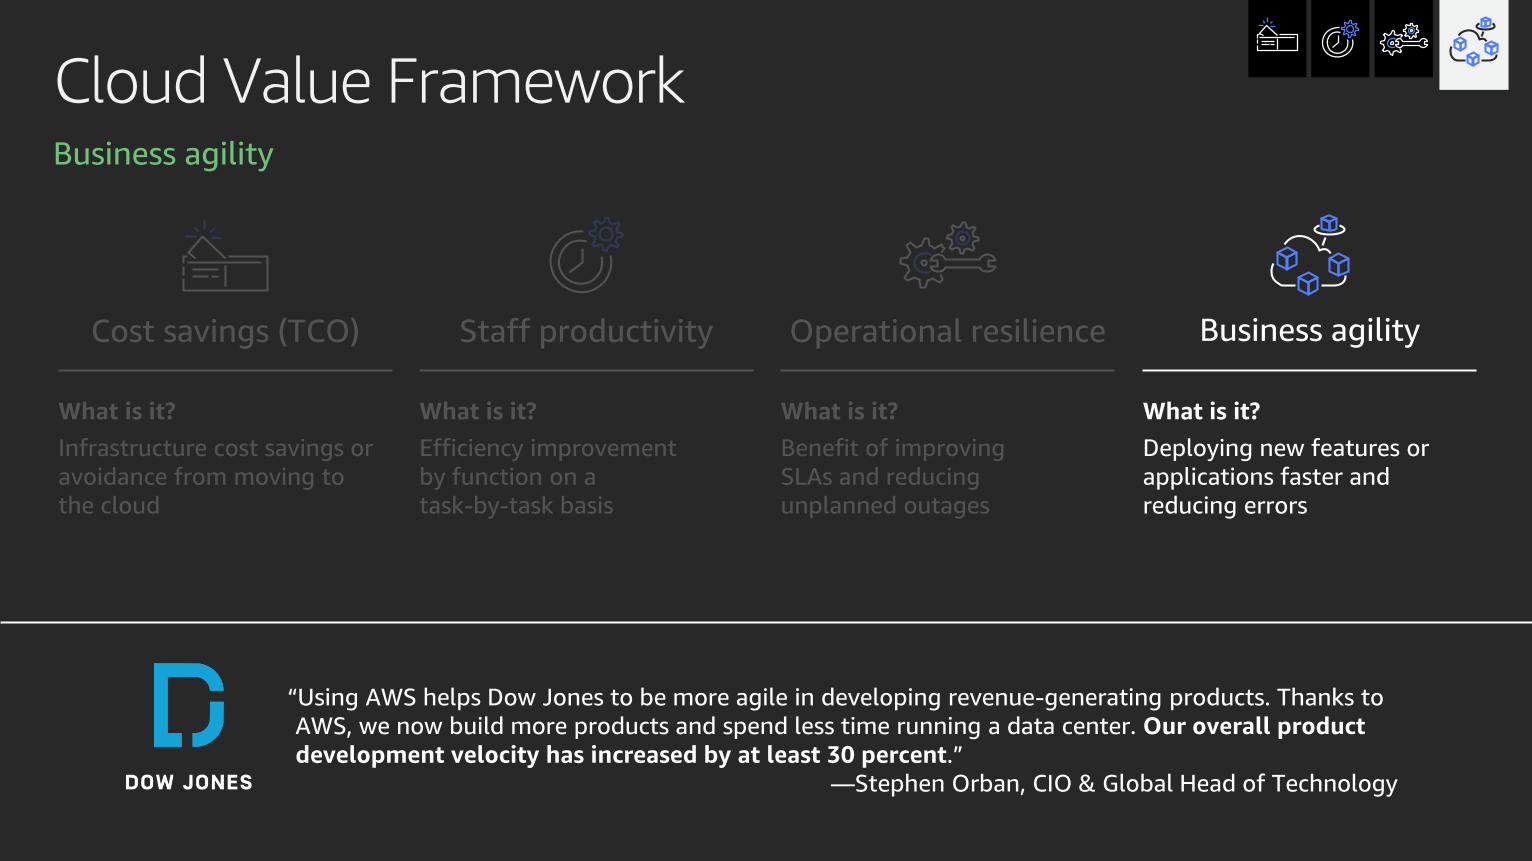
Cloud Value Framework Business agility
Cost savings (TCO)
What is it?
Infrastructure cost savings or
avoidance from moving to
the cloud
Staff productivity
What is it?
Efficiency improvement
by function on a
task-by-task basis
Operational resilience
What is it?
Benefit of improving
SLAs and reducing
unplanned outages
Business agility
What is it?
Deploying new features or
applications faster and
reducing errors
“Using AWS helps Dow Jones to be more agile in developing revenue-generating products. Thanks to
AWS, we now build more products and spend less time running a data center. Our overall product
development velocity has increased by at least 30 percent.”
—Stephen Orban, CIO & Global Head of Technology

Keys to business agility
See change as a positive;
empower all employees to identify
opportunities of improvement
Culture of
innovation
Lowering the cost of failure results
in more experiments and more
opportunities for success
Cost and speed of
experimentation
Growth of third-party innovations
has been dramatic over the past
5–10 years; those able to
incorporate these capabilities
quickly have an advantage
Take advantage of
external opportunities

Business agilityInnovate faster while reducing failure costs
Simplify requirement design by leveraging built-in operational solutions
(e.g., scaling, security) and hundreds of AWS and third-party services and
solutions to deliver cloud-native products
Increase the speed of build and test through continuous integration and delivery pipelines, and lower the cost of spinning up experimentation by shutting down environments or services quickly
Reduce maintenance cost and simplify operations with AWS providing IT infrastructure services, and AWS or third-party-managed services options
Traditional software delivery lifecycle
and average % of time spent at each step* Cloud benefits
Eliminate deployment “wait time” with automated application development and smaller deployment batches
*Meta Group/Gartner research
22%
15%
23%
17%
12%
Requirements & analysis
Design
Build
Integration & test
Deploy
11%Maintain
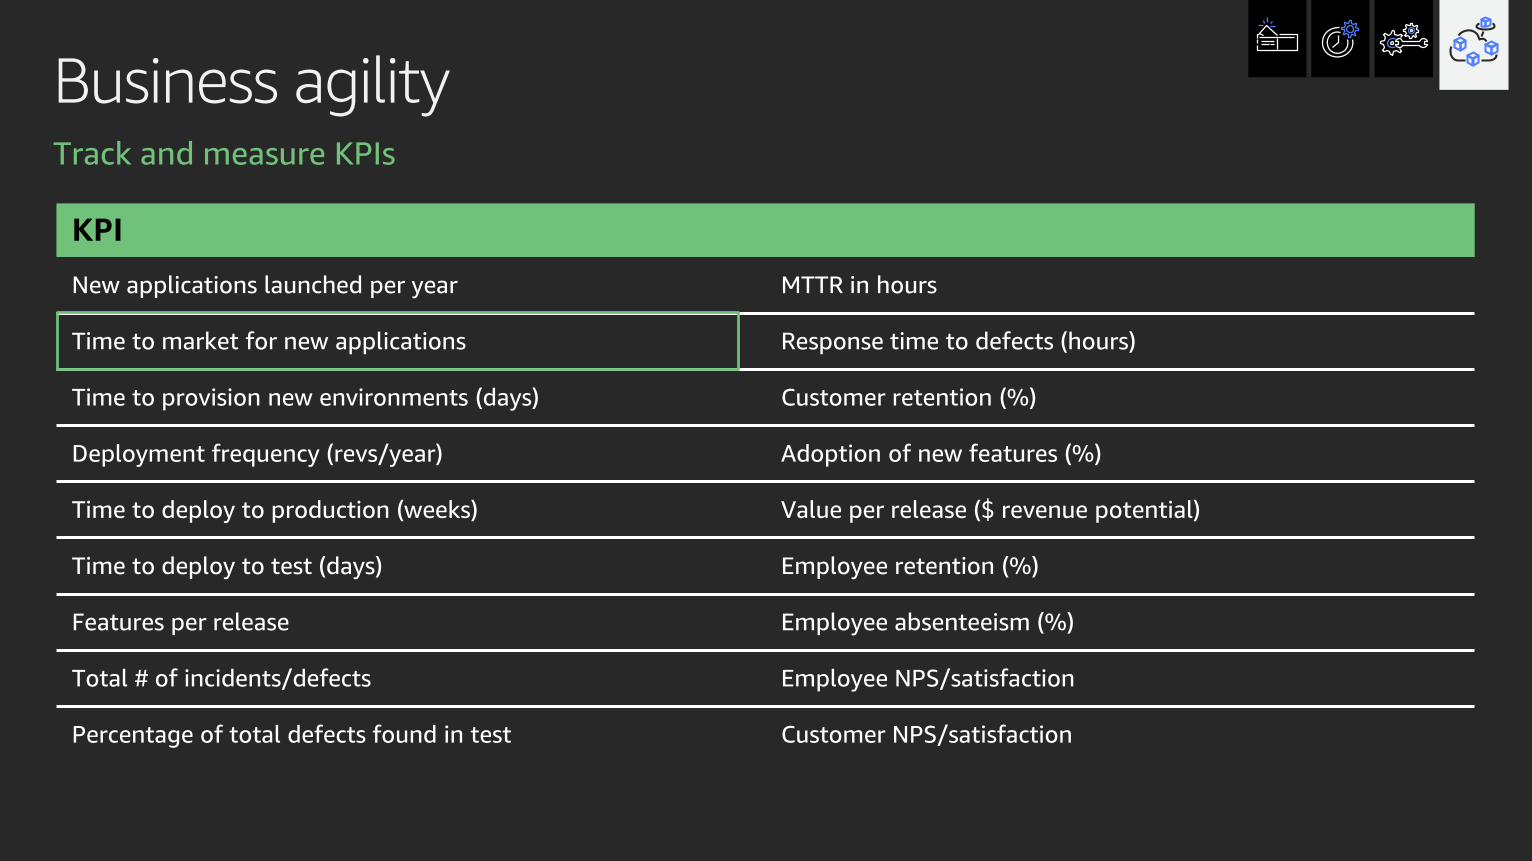
Business agilityTrack and measure KPIs
KPI
New applications launched per year MTTR in hours
Time to market for new applications Response time to defects (hours)
Time to provision new environments (days) Customer retention (%)
Deployment frequency (revs/year) Adoption of new features (%)
Time to deploy to production (weeks) Value per release ($ revenue potential)
Time to deploy to test (days) Employee retention (%)
Features per release Employee absenteeism (%)
Total # of incidents/defects Employee NPS/satisfaction
Percentage of total defects found in test Customer NPS/satisfaction
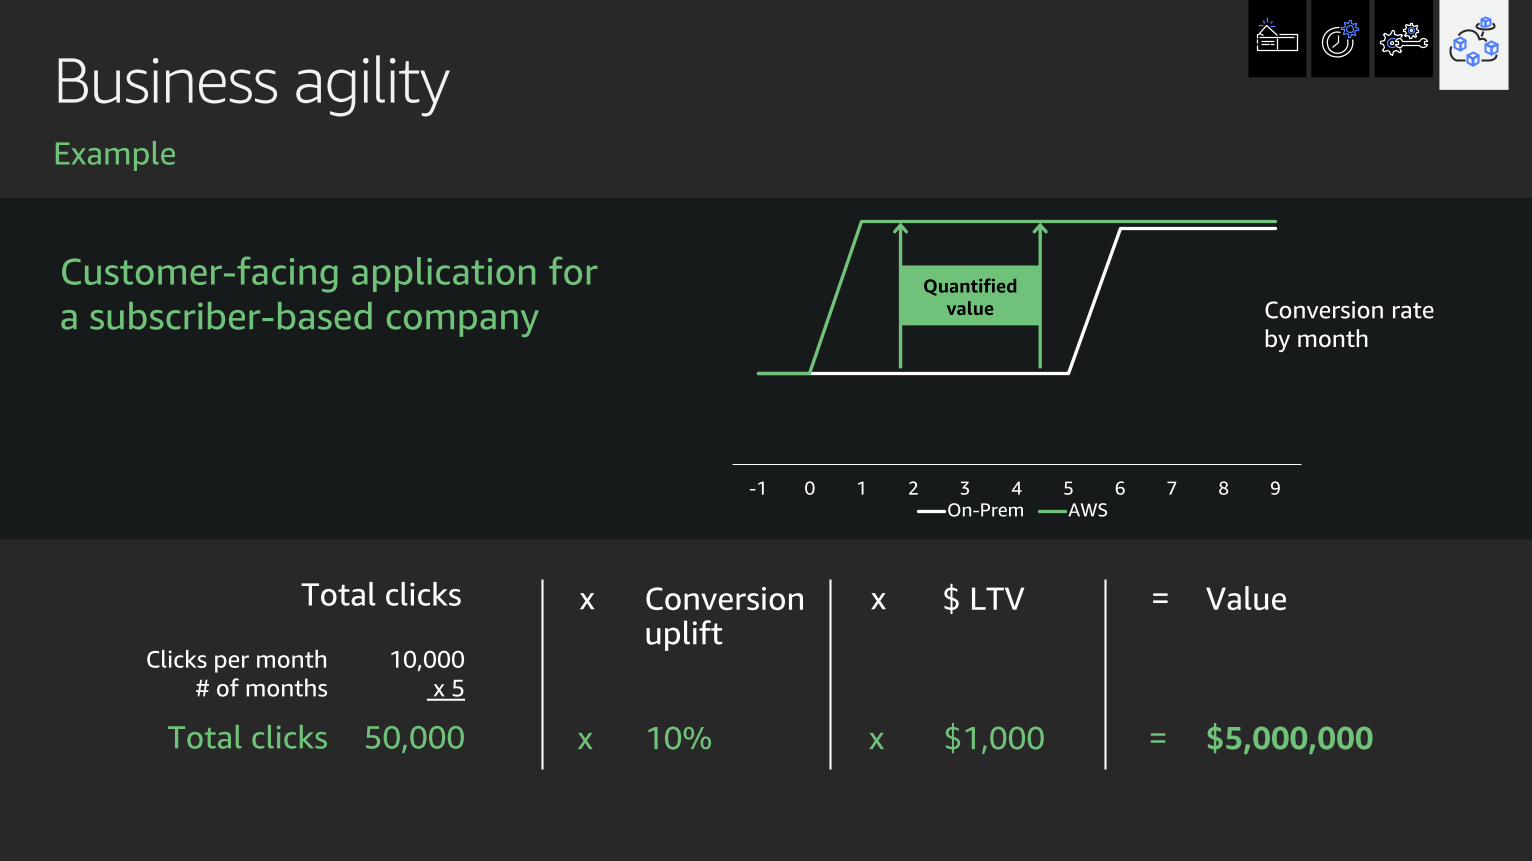
-1 0 1 2 3 4 5 6 7 8 9
On-Prem AWS
Quantified
value
Business agility Example
Customer-facing application for
a subscriber-based company
Total clicks
Clicks per month
# of months
Total clicks
10,000
x 5
50,000
Conversion uplift
10%
x
x
$ LTV
$1,000
x
x $5,000,000
Value=
=
Conversion rate
by month

Business agilityAWS benchmarking insights
Decrease in time to
market for new features
and applications
37.7%Decrease in time
to deploy to
production
39.3%Increase in code
deployment
frequency
341.5%
Source: AWS Cloud Economics Benchmarking

Best practices for communicating the cloud value
Start the business case process
early in the decision-making process
Involve the right stakeholders
(Finance, Procurement, IT,
Engineering, Business) and build the
case in multiple iterations with them
Assign value to hard areas to quantify,
like business agility
Present the overall value, not just TCO
Cloud
value

Learn to build cloud fluency in your enterpriseResources created by the experts at AWS to help you build the skills you need
Cost savings
(TCO)
Staff
productivity
Operational
resilience
Business
agility
Digital training Classroom training AWS Certification Enterprise resources Talent pipeline
Be ready for global cloud transformation with a custom training strategy
Visit our resources for enterprises page at https://aws.training/enterprise

Thank you!
© 2020, Amazon Web Services, Inc. or its affiliates. All rights reserved.


