121


i
Acknowledgements
The IEA-AMF Organization is grateful to the following countries and their representatives for their support in providing research to develop this report:
Canada – Niklas Ekstrom, Craig Fairbridge, and Cheri-Ann MacKinlay (Natural Resources Canada);
China – Zhang Fan and Tian Donglian (China Automotive Technology & Research Center);
Denmark – Kim Winther, Michael Grouleff Jensen, Lene Skov Halgaard, and Dimitar Yankow Kolev (Danish Technological Institute), Jesper Schramm (Technical University of Denmark), and Henrik Iskov and Bjørn Eliasen (Danish Gas Technology Centre);
Finland – Nils Olof Nylund, Paivi Aakko-Saksa, and Roslund Piritta (VTT Technical Research Centre of Finland);
Israel – Dr. Bracha Halaf (Ministry of Energy and Water Resources); and
United States –Steve Goguen and Kevin Stork (U.S. Department of Energy) and Larry Johnson (Argonne National Laboratory).
The authors would also like to acknowledge Don O’Connor and Ryan O’Connor of (S&T)
2 Consultants, Inc. for their
substantial GHGenius support throughout this study, including the modification of fuel pathways to better tailor the model for each country case study. Also, thank you to Dan Santini and Chuck Risch of Argonne National Laboratory for sharing information and presenting on their “Checklist for Transition to New Highway Fuel(s).”

ii
This page intentionally blank.
iii
Abbreviations
AD anaerobic digestion AMF Advanced Motor Fuels ANL Argonne National Laboratory, United States CI compression-ignition CNG compressed natural gas CO carbon monoxide CO2 carbon dioxide DME dimethyl ether DMFC direct methanol fuel cell DOE U.S. Department of Energy EIA Energy Information Administration EPA U.S. Environmental Protection Agency EU European Union EV electric vehicle FCV fuel cell vehicle FT Fischer-Tropsch GHG greenhouse gas GTL gas-to-liquid H2 hydrogen HDV heavy duty vehicle HEV hybrid electric vehicle IA implementing agreement ICE internal combustion engine ICTC The Interstate Clean Transportation Corridor IEA International Energy Agency INT integrated LDV light duty vehicle LFG landfill gas LNG liquefied natural gas LPG liquefied petroleum gas MD medium duty MOU memorandum of understanding MTG methanol to gasoline NG natural gas NGV natural gas vehicle Nm
3 meters cubed of a gas at normal temperature (0
o C) and pressure (1 atmosphere)
NOx oxides of nitrogen NREL National Renewable Energy Laboratory, United States
iv
OEM original equipment manufacturer PEV plug-in electric vehicle (includes both EVs and PHEVs) PHEV plug-in hybrid electric vehicle PM particulate matter R&D research and development RMFC reformulated methanol fuel cell SA stand-alone STG syngas to gasoline TIGAS™ Topsoe Improved Gasoline Synthesis UN United Nations US United States USD United States Dollar VAT value-added tax VOC volatile organic compound
v
Executive Summary
Introduction The widespread use of natural gas as an on-road transportation fuel has gained traction in recent decades as an alternative to traditional petroleum-based fuels due to the relative environmental benefits, including reduced volatile organic compounds (VOC), carbon monoxide (CO), nitrogen oxide (NOx), and particulate matter (PM). Likewise, fuels derived from natural gas also tend to have lower environmental impact than petroleum- or coal-based fuels. For countries with abundant supply of natural gas, it can also provide a means to gain energy independence and diversify its fuel portfolio. Natural gas production and distribution is a well-established industry in many countries; this may also mean that these countries are well-positioned to support the production and distribution of alternative transportation fuels derived from natural gas. Where fossil supplies are limited, natural gas can be obtained through imports or domestic production of biomethane from anaerobic digestion (AD), landfill gas (LFG), and other organic sources. Natural gas in its basic form can be used in either a compressed or liquefied state. Compressed natural gas (CNG) vehicles have achieved moderate popularity throughout the world, but, compared to conventional vehicles, may have less range and additional weight. A price premium is also associated with vehicles that operate on natural gas, known as NGVs. Furthermore, sufficient infrastructure for NGVs is often limited to regions where natural gas is cost-competitive with gasoline and diesel. Liquefied natural gas (LNG) has demonstrated practicality in heavy duty vehicles (HDV), but it is currently too heavy to store onboard in light duty vehicles (LDV). One key advantage of using natural gas in its natural state is the avoidance of an intermediate conversion/processing step into a different transportation fuel, which introduces extra cost and fuel efficiency losses. Natural gas is not limited to operation as CNG or LNG. Because it is primarily comprised of methane, natural gas offers a second category of candidate transportation fuels: synthetic liquid or gaseous fuels, or synfuels. Certain synthetic gas-to-liquid (GTL) fuels even chemically resemble petroleum fuels (i.e., gasoline and diesel) in some cases and can, therefore, be delivered through existing pipeline and dispensing infrastructure. Such “drop in” fuels do not even require modifications to traditional internal combustion engine (ICE) vehicles. Other fuels, such as hydrogen produced from NG (via methane reforming), may offer long-term solutions if shown to be economically feasible and if the sufficient investments in infrastructure are made. Electricity generated at a natural gas-powered plant offers a fourth candidate for fueling on-road vehicles, especially with the current emergence of plug-in electric vehicles (PEV) – including both electric vehicles (EV) and plug-in hybrid electric vehicles (PHEV) – and accompanying infrastructure worldwide. For natural gas-derived fuels to be chosen for implementation, they would need to be produced, delivered and used in vehicles at prices competitive with traditional fuels. In addition to cost, emphasis must also be placed on the environmental benefits, energy use, and energy security that each fuel pathway can offer to a particular nation. In this study, the feasibility of these different natural gas pathways used in motor vehicles were assessed to determine the advantages and disadvantages of each option. Aspects included cost, lifecycle emissions, and alignment with a country’s energy policy and goals. The goal was to identify the most cost-effective for the user and technically feasible way to utilize natural gas in transportation with the potential to emerge into the mainstream market, instead of maintaining a niche market in many countries. To demonstrate how differently each factor can weigh in, case studies were conducted in six different countries spanning three continents. Background As of 2012, the transportation sector accounted for 28% of the world’s energy consumption (International Energy Agency, 2014b) and 24% of the world’s CO2 emissions (International Energy Agency, 2014a). Oil has long been the dominant feedstock in transportation, accounting for over 90 percent of energy consumption.
vi
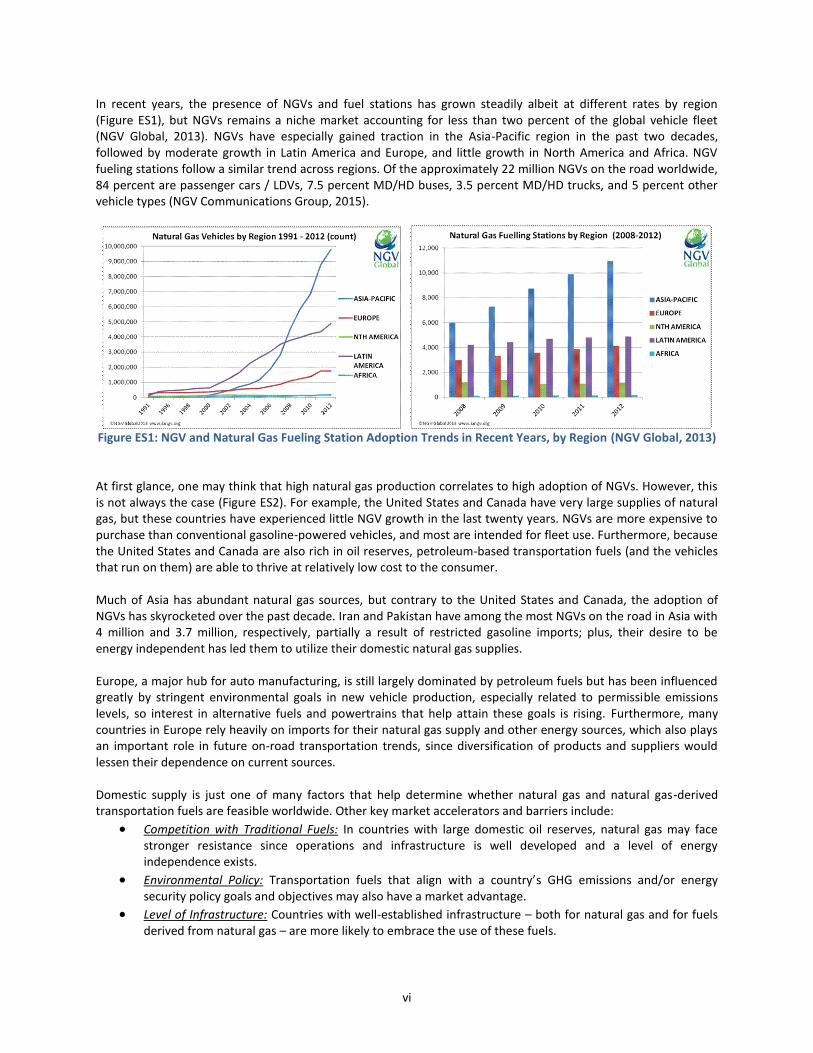
In recent years, the presence of NGVs and fuel stations has grown steadily albeit at different rates by region (Figure ES1), but NGVs remains a niche market accounting for less than two percent of the global vehicle fleet (NGV Global, 2013). NGVs have especially gained traction in the Asia-Pacific region in the past two decades, followed by moderate growth in Latin America and Europe, and little growth in North America and Africa. NGV fueling stations follow a similar trend across regions. Of the approximately 22 million NGVs on the road worldwide, 84 percent are passenger cars / LDVs, 7.5 percent MD/HD buses, 3.5 percent MD/HD trucks, and 5 percent other vehicle types (NGV Communications Group, 2015).
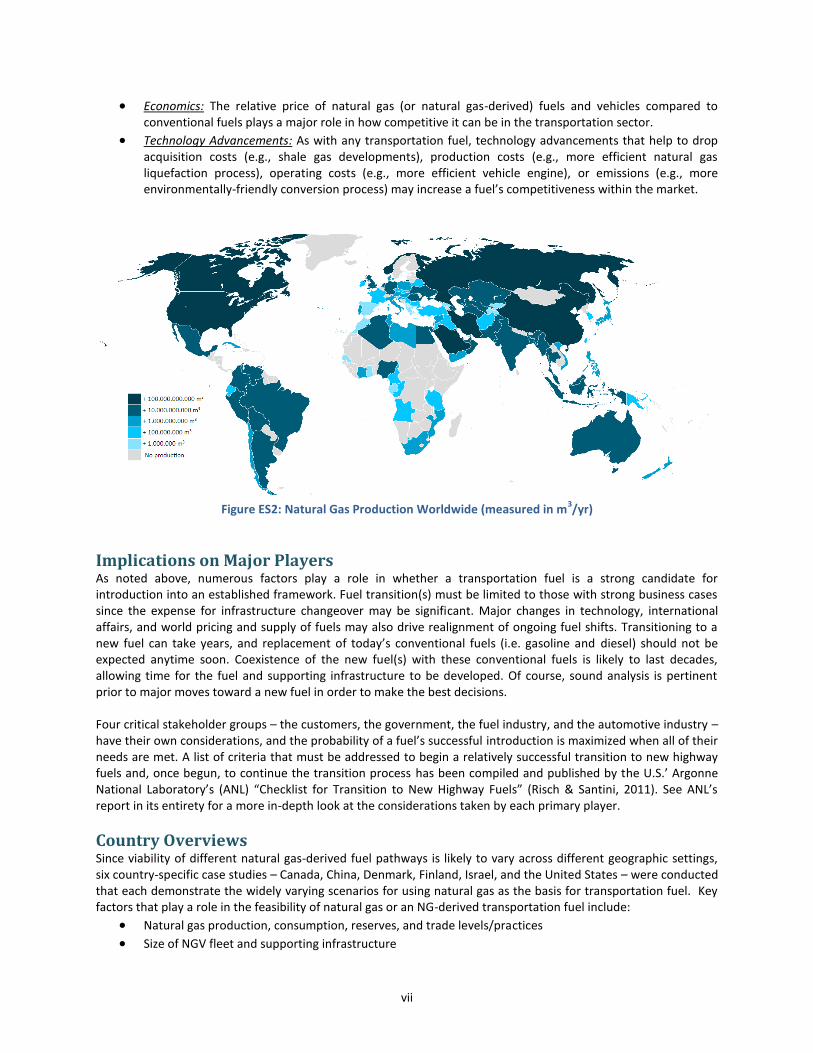
Figure ES1: NGV and Natural Gas Fueling Station Adoption Trends in Recent Years, by Region (NGV Global, 2013) At first glance, one may think that high natural gas production correlates to high adoption of NGVs. However, this is not always the case (Figure ES2). For example, the United States and Canada have very large supplies of natural gas, but these countries have experienced little NGV growth in the last twenty years. NGVs are more expensive to purchase than conventional gasoline-powered vehicles, and most are intended for fleet use. Furthermore, because the United States and Canada are also rich in oil reserves, petroleum-based transportation fuels (and the vehicles that run on them) are able to thrive at relatively low cost to the consumer. Much of Asia has abundant natural gas sources, but contrary to the United States and Canada, the adoption of NGVs has skyrocketed over the past decade. Iran and Pakistan have among the most NGVs on the road in Asia with 4 million and 3.7 million, respectively, partially a result of restricted gasoline imports; plus, their desire to be energy independent has led them to utilize their domestic natural gas supplies. Europe, a major hub for auto manufacturing, is still largely dominated by petroleum fuels but has been influenced greatly by stringent environmental goals in new vehicle production, especially related to permissible emissions levels, so interest in alternative fuels and powertrains that help attain these goals is rising. Furthermore, many countries in Europe rely heavily on imports for their natural gas supply and other energy sources, which also plays an important role in future on-road transportation trends, since diversification of products and suppliers would lessen their dependence on current sources. Domestic supply is just one of many factors that help determine whether natural gas and natural gas-derived transportation fuels are feasible worldwide. Other key market accelerators and barriers include:
Competition with Traditional Fuels: In countries with large domestic oil reserves, natural gas may face stronger resistance since operations and infrastructure is well developed and a level of energy independence exists.
Environmental Policy: Transportation fuels that align with a country’s GHG emissions and/or energy security policy goals and objectives may also have a market advantage.
Level of Infrastructure: Countries with well-established infrastructure – both for natural gas and for fuels derived from natural gas – are more likely to embrace the use of these fuels.
vii
Economics: The relative price of natural gas (or natural gas-derived) fuels and vehicles compared to conventional fuels plays a major role in how competitive it can be in the transportation sector.
Technology Advancements: As with any transportation fuel, technology advancements that help to drop acquisition costs (e.g., shale gas developments), production costs (e.g., more efficient natural gas liquefaction process), operating costs (e.g., more efficient vehicle engine), or emissions (e.g., more environmentally-friendly conversion process) may increase a fuel’s competitiveness within the market.
Figure ES2: Natural Gas Production Worldwide (measured in m
3/yr)
Implications on Major Players As noted above, numerous factors play a role in whether a transportation fuel is a strong candidate for introduction into an established framework. Fuel transition(s) must be limited to those with strong business cases since the expense for infrastructure changeover may be significant. Major changes in technology, international affairs, and world pricing and supply of fuels may also drive realignment of ongoing fuel shifts. Transitioning to a new fuel can take years, and replacement of today’s conventional fuels (i.e. gasoline and diesel) should not be expected anytime soon. Coexistence of the new fuel(s) with these conventional fuels is likely to last decades, allowing time for the fuel and supporting infrastructure to be developed. Of course, sound analysis is pertinent prior to major moves toward a new fuel in order to make the best decisions. Four critical stakeholder groups – the customers, the government, the fuel industry, and the automotive industry – have their own considerations, and the probability of a fuel’s successful introduction is maximized when all of their needs are met. A list of criteria that must be addressed to begin a relatively successful transition to new highway fuels and, once begun, to continue the transition process has been compiled and published by the U.S.’ Argonne National Laboratory’s (ANL) “Checklist for Transition to New Highway Fuels” (Risch & Santini, 2011). See ANL’s report in its entirety for a more in-depth look at the considerations taken by each primary player.
Country Overviews Since viability of different natural gas-derived fuel pathways is likely to vary across different geographic settings, six country-specific case studies – Canada, China, Denmark, Finland, Israel, and the United States – were conducted that each demonstrate the widely varying scenarios for using natural gas as the basis for transportation fuel. Key factors that play a role in the feasibility of natural gas or an NG-derived transportation fuel include:
Natural gas production, consumption, reserves, and trade levels/practices
Size of NGV fleet and supporting infrastructure
viii
Presence of fuel production plants (for domestic production)
Electricity generation mix
Governmental stance, through policy support and regulations
Market accelerators and barriers
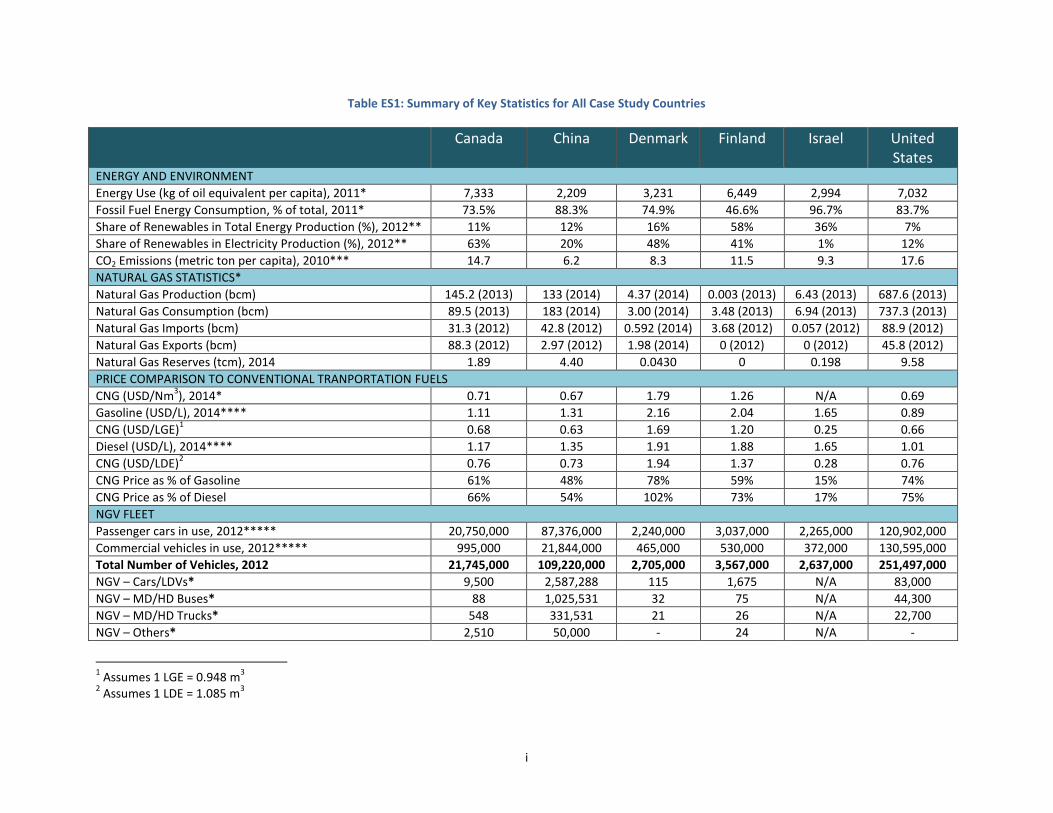
Price of natural gas relative to traditional fuels Some countries – like Canada, China, and the United States – are leading fossil natural gas producers and consumers, while others, like Finland, rely 100% on imports or domestically produce biomethane. Israel’s newly discovered offshore natural gas reserves have shifted the country’s views on which transportation fuels may be most suitable. The countries also widely range in population, from China with 1.3 billion people (the world’s largest population) to Finland with 5.4 million (The World Bank, 2015). Countries with larger populations – like China and the United States – have the potential to make a higher overall global impact when transitioning to new fuels. However, the magnitude of implementing new fuels nationwide may be more challenging than for countries with smaller vehicle fleets. Geographically speaking, the case studies will cover three continents – Asia, Europe, and North America. The makeup of NGV fleets is quite different in the case study countries. With respect to drivetrains, passenger cars and other LDVs account for over half of each country’s NGV fleet. For Canada and Finland, LDVs account for over 80% of the NGV fleet; for Denmark and the United States, LDVs only account for 50-60% of the fleet. Natural gas refueling stations vary in prevalence; Denmark and Israel, for example, have hardly any natural gas refueling stations to support NGVs, while China houses over 24% of the world’s stations. Also, some countries have extensive natural gas pipeline networks to distribute fuel nationwide, while others rely heavily on roads to transport fuel. Also, the energy mix used by each country to produce electricity varies greatly, which can significantly impact emissions. Canada, Denmark, and Finland all use sizeable amounts (40-65%) of renewables in their electricity generation production, while Israel, China, and the United States largely rely on fossil fuels. From an economic standpoint, the relative retail cost of natural gas for the consumer varies significantly across countries, and even the cost of conventional fuels (i.e. gasoline and diesel) varies by a factor of two across some of the case study countries. Consumers in Canada, China, and the United States, for example, benefit from relatively low CNG prices, while consumers in Denmark and Finland pay roughly double. To help increase use of alternative fuels into their fleets, some countries have established supportive vehicle incentives – like China, Denmark and the United States – while others (e.g., Israel) prefer to allow the market to play out naturally. Table ES1 summarizes key statistics for all case study countries.
i
Table ES1: Summary of Key Statistics for All Case Study Countries
Canada China Denmark Finland Israel United States
ENERGY AND ENVIRONMENT
Energy Use (kg of oil equivalent per capita), 2011* 7,333 2,209 3,231 6,449 2,994 7,032
Fossil Fuel Energy Consumption, % of total, 2011* 73.5% 88.3% 74.9% 46.6% 96.7% 83.7%
Share of Renewables in Total Energy Production (%), 2012** 11% 12% 16% 58% 36% 7%
Share of Renewables in Electricity Production (%), 2012** 63% 20% 48% 41% 1% 12%
CO2 Emissions (metric ton per capita), 2010*** 14.7 6.2 8.3 11.5 9.3 17.6
NATURAL GAS STATISTICS*
Natural Gas Production (bcm) 145.2 (2013) 133 (2014) 4.37 (2014) 0.003 (2013) 6.43 (2013) 687.6 (2013)
Natural Gas Consumption (bcm) 89.5 (2013) 183 (2014) 3.00 (2014) 3.48 (2013) 6.94 (2013) 737.3 (2013)
Natural Gas Imports (bcm) 31.3 (2012) 42.8 (2012) 0.592 (2014) 3.68 (2012) 0.057 (2012) 88.9 (2012)
Natural Gas Exports (bcm) 88.3 (2012) 2.97 (2012) 1.98 (2014) 0 (2012) 0 (2012) 45.8 (2012)
Natural Gas Reserves (tcm), 2014 1.89 4.40 0.0430 0 0.198 9.58
PRICE COMPARISON TO CONVENTIONAL TRANPORTATION FUELS
CNG (USD/Nm3), 2014* 0.71 0.67 1.79 1.26 N/A 0.69
Gasoline (USD/L), 2014**** 1.11 1.31 2.16 2.04 1.65 0.89
CNG (USD/LGE)1 0.68 0.63 1.69 1.20 0.25 0.66
Diesel (USD/L), 2014**** 1.17 1.35 1.91 1.88 1.65 1.01
CNG (USD/LDE)2 0.76 0.73 1.94 1.37 0.28 0.76
CNG Price as % of Gasoline 61% 48% 78% 59% 15% 74%
CNG Price as % of Diesel 66% 54% 102% 73% 17% 75%
NGV FLEET
Passenger cars in use, 2012***** 20,750,000 87,376,000 2,240,000 3,037,000 2,265,000 120,902,000
Commercial vehicles in use, 2012***** 995,000 21,844,000 465,000 530,000 372,000 130,595,000
Total Number of Vehicles, 2012 21,745,000 109,220,000 2,705,000 3,567,000 2,637,000 251,497,000
NGV – Cars/LDVs* 9,500 2,587,288 115 1,675 N/A 83,000
NGV – MD/HD Buses* 88 1,025,531 32 75 N/A 44,300
NGV – MD/HD Trucks* 548 331,531 21 26 N/A 22,700
NGV – Others* 2,510 50,000 - 24 N/A -
1 Assumes 1 LGE = 0.948 m
3
2 Assumes 1 LDE = 1.085 m
3
ii
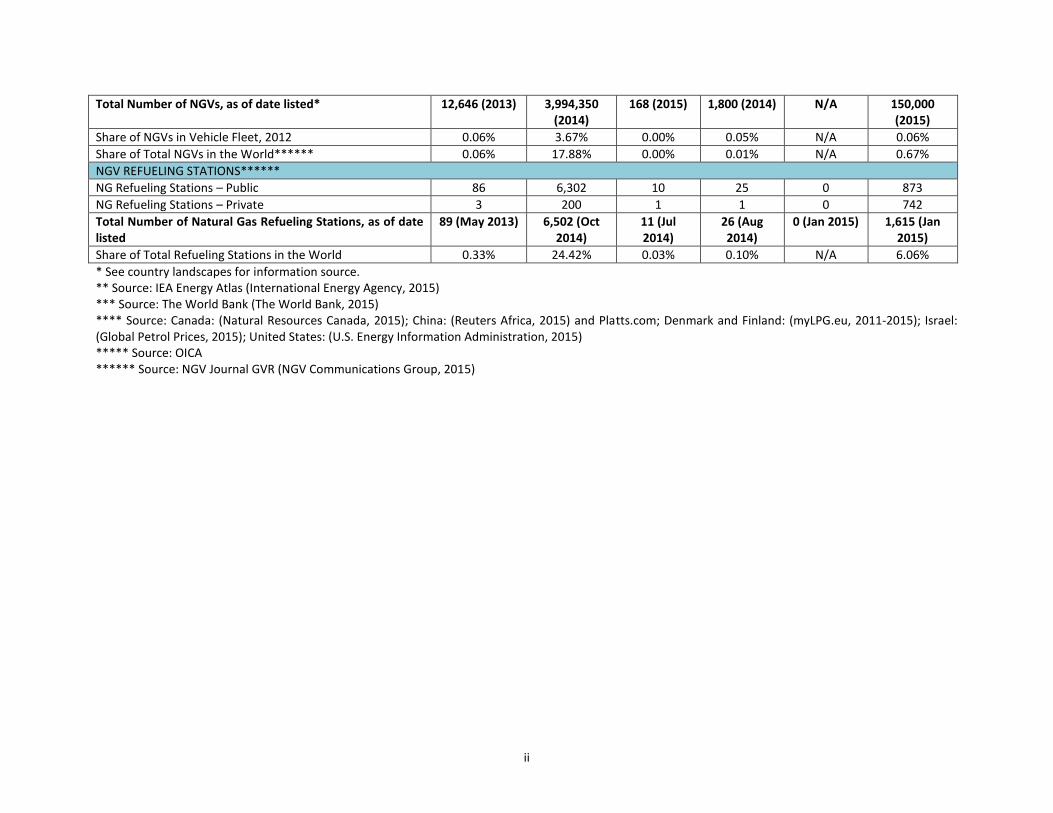
Total Number of NGVs, as of date listed* 12,646 (2013) 3,994,350 (2014)
168 (2015) 1,800 (2014) N/A 150,000 (2015)
Share of NGVs in Vehicle Fleet, 2012 0.06% 3.67% 0.00% 0.05% N/A 0.06%
Share of Total NGVs in the World****** 0.06% 17.88% 0.00% 0.01% N/A 0.67%
NGV REFUELING STATIONS******
NG Refueling Stations – Public 86 6,302 10 25 0 873
NG Refueling Stations – Private 3 200 1 1 0 742
Total Number of Natural Gas Refueling Stations, as of date listed
89 (May 2013) 6,502 (Oct 2014)
11 (Jul 2014)
26 (Aug 2014)
0 (Jan 2015) 1,615 (Jan 2015)
Share of Total Refueling Stations in the World 0.33% 24.42% 0.03% 0.10% N/A 6.06%
* See country landscapes for information source. ** Source: IEA Energy Atlas (International Energy Agency, 2015) *** Source: The World Bank (The World Bank, 2015) **** Source: Canada: (Natural Resources Canada, 2015); China: (Reuters Africa, 2015) and Platts.com; Denmark and Finland: (myLPG.eu, 2011-2015); Israel: (Global Petrol Prices, 2015); United States: (U.S. Energy Information Administration, 2015) ***** Source: OICA ****** Source: NGV Journal GVR (NGV Communications Group, 2015)
i
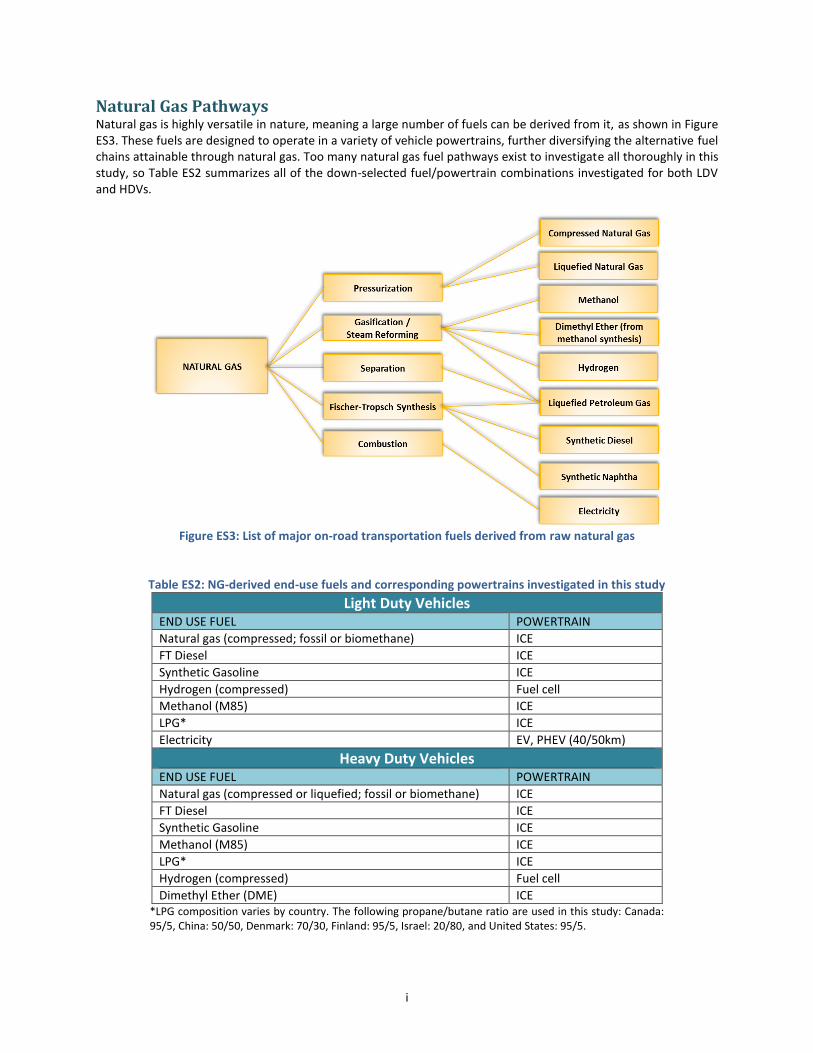
Natural Gas Pathways Natural gas is highly versatile in nature, meaning a large number of fuels can be derived from it, as shown in Figure ES3. These fuels are designed to operate in a variety of vehicle powertrains, further diversifying the alternative fuel chains attainable through natural gas. Too many natural gas fuel pathways exist to investigate all thoroughly in this study, so Table ES2 summarizes all of the down-selected fuel/powertrain combinations investigated for both LDV and HDVs.
Figure ES3: List of major on-road transportation fuels derived from raw natural gas
Table ES2: NG-derived end-use fuels and corresponding powertrains investigated in this study
Light Duty Vehicles END USE FUEL POWERTRAIN
Natural gas (compressed; fossil or biomethane) ICE
FT Diesel ICE
Synthetic Gasoline ICE
Hydrogen (compressed) Fuel cell
Methanol (M85) ICE
LPG* ICE
Electricity EV, PHEV (40/50km)
Heavy Duty Vehicles END USE FUEL POWERTRAIN
Natural gas (compressed or liquefied; fossil or biomethane) ICE
FT Diesel ICE
Synthetic Gasoline ICE
Methanol (M85) ICE
LPG* ICE
Hydrogen (compressed) Fuel cell
Dimethyl Ether (DME) ICE *LPG composition varies by country. The following propane/butane ratio are used in this study: Canada: 95/5, China: 50/50, Denmark: 70/30, Finland: 95/5, Israel: 20/80, and United States: 95/5.
ii
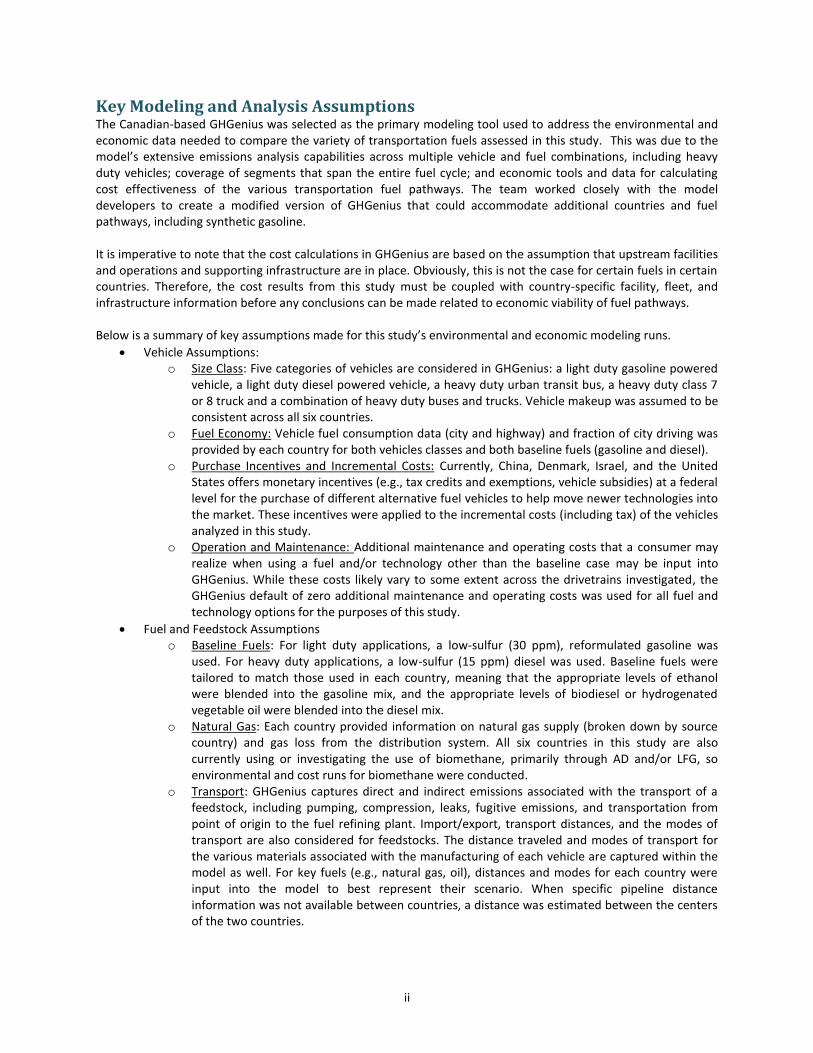
Key Modeling and Analysis Assumptions The Canadian-based GHGenius was selected as the primary modeling tool used to address the environmental and economic data needed to compare the variety of transportation fuels assessed in this study. This was due to the model’s extensive emissions analysis capabilities across multiple vehicle and fuel combinations, including heavy duty vehicles; coverage of segments that span the entire fuel cycle; and economic tools and data for calculating cost effectiveness of the various transportation fuel pathways. The team worked closely with the model developers to create a modified version of GHGenius that could accommodate additional countries and fuel pathways, including synthetic gasoline. It is imperative to note that the cost calculations in GHGenius are based on the assumption that upstream facilities and operations and supporting infrastructure are in place. Obviously, this is not the case for certain fuels in certain countries. Therefore, the cost results from this study must be coupled with country-specific facility, fleet, and infrastructure information before any conclusions can be made related to economic viability of fuel pathways. Below is a summary of key assumptions made for this study’s environmental and economic modeling runs.
Vehicle Assumptions: o Size Class: Five categories of vehicles are considered in GHGenius: a light duty gasoline powered
vehicle, a light duty diesel powered vehicle, a heavy duty urban transit bus, a heavy duty class 7 or 8 truck and a combination of heavy duty buses and trucks. Vehicle makeup was assumed to be consistent across all six countries.
o Fuel Economy: Vehicle fuel consumption data (city and highway) and fraction of city driving was provided by each country for both vehicles classes and both baseline fuels (gasoline and diesel).
o Purchase Incentives and Incremental Costs: Currently, China, Denmark, Israel, and the United States offers monetary incentives (e.g., tax credits and exemptions, vehicle subsidies) at a federal level for the purchase of different alternative fuel vehicles to help move newer technologies into the market. These incentives were applied to the incremental costs (including tax) of the vehicles analyzed in this study.
o Operation and Maintenance: Additional maintenance and operating costs that a consumer may realize when using a fuel and/or technology other than the baseline case may be input into GHGenius. While these costs likely vary to some extent across the drivetrains investigated, the GHGenius default of zero additional maintenance and operating costs was used for all fuel and technology options for the purposes of this study.
Fuel and Feedstock Assumptions o Baseline Fuels: For light duty applications, a low-sulfur (30 ppm), reformulated gasoline was
used. For heavy duty applications, a low-sulfur (15 ppm) diesel was used. Baseline fuels were tailored to match those used in each country, meaning that the appropriate levels of ethanol were blended into the gasoline mix, and the appropriate levels of biodiesel or hydrogenated vegetable oil were blended into the diesel mix.
o Natural Gas: Each country provided information on natural gas supply (broken down by source country) and gas loss from the distribution system. All six countries in this study are also currently using or investigating the use of biomethane, primarily through AD and/or LFG, so environmental and cost runs for biomethane were conducted.
o Transport: GHGenius captures direct and indirect emissions associated with the transport of a feedstock, including pumping, compression, leaks, fugitive emissions, and transportation from point of origin to the fuel refining plant. Import/export, transport distances, and the modes of transport are also considered for feedstocks. The distance traveled and modes of transport for the various materials associated with the manufacturing of each vehicle are captured within the model as well. For key fuels (e.g., natural gas, oil), distances and modes for each country were input into the model to best represent their scenario. When specific pipeline distance information was not available between countries, a distance was estimated between the centers of the two countries.
iii
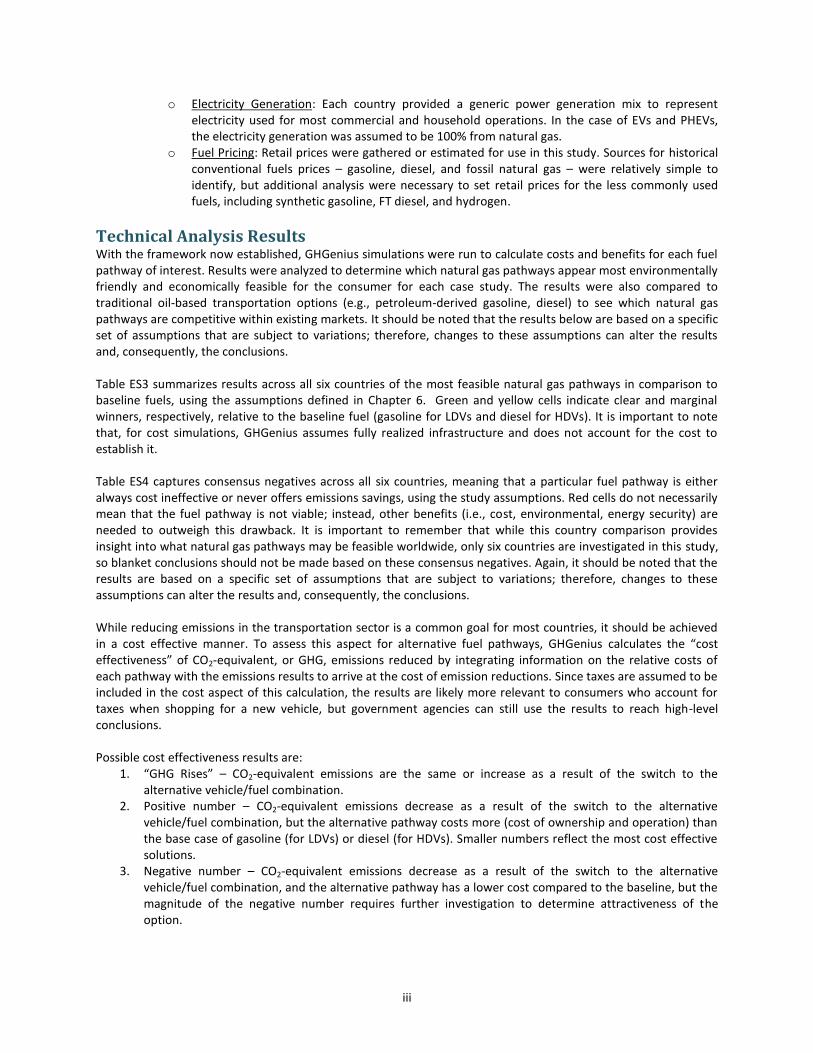
o Electricity Generation: Each country provided a generic power generation mix to represent electricity used for most commercial and household operations. In the case of EVs and PHEVs, the electricity generation was assumed to be 100% from natural gas.
o Fuel Pricing: Retail prices were gathered or estimated for use in this study. Sources for historical conventional fuels prices – gasoline, diesel, and fossil natural gas – were relatively simple to identify, but additional analysis were necessary to set retail prices for the less commonly used fuels, including synthetic gasoline, FT diesel, and hydrogen.
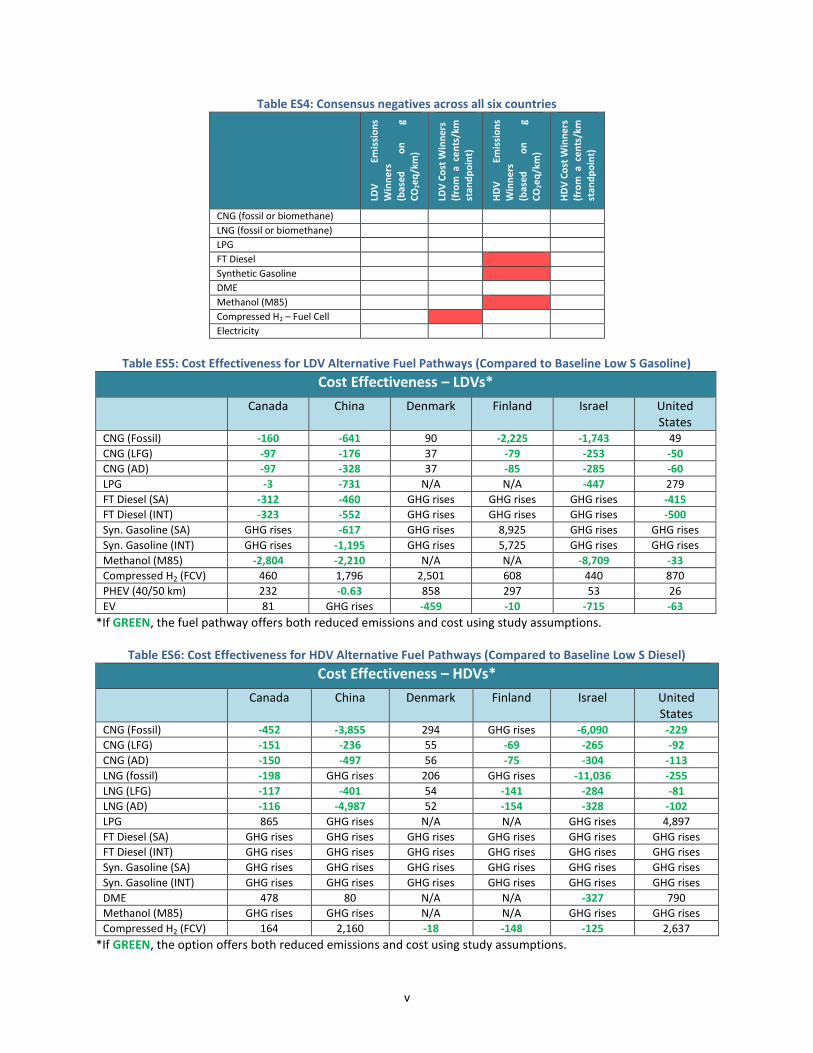
Technical Analysis Results With the framework now established, GHGenius simulations were run to calculate costs and benefits for each fuel pathway of interest. Results were analyzed to determine which natural gas pathways appear most environmentally friendly and economically feasible for the consumer for each case study. The results were also compared to traditional oil-based transportation options (e.g., petroleum-derived gasoline, diesel) to see which natural gas pathways are competitive within existing markets. It should be noted that the results below are based on a specific set of assumptions that are subject to variations; therefore, changes to these assumptions can alter the results and, consequently, the conclusions. Table ES3 summarizes results across all six countries of the most feasible natural gas pathways in comparison to baseline fuels, using the assumptions defined in Chapter 6. Green and yellow cells indicate clear and marginal winners, respectively, relative to the baseline fuel (gasoline for LDVs and diesel for HDVs). It is important to note that, for cost simulations, GHGenius assumes fully realized infrastructure and does not account for the cost to establish it. Table ES4 captures consensus negatives across all six countries, meaning that a particular fuel pathway is either always cost ineffective or never offers emissions savings, using the study assumptions. Red cells do not necessarily mean that the fuel pathway is not viable; instead, other benefits (i.e., cost, environmental, energy security) are needed to outweigh this drawback. It is important to remember that while this country comparison provides insight into what natural gas pathways may be feasible worldwide, only six countries are investigated in this study, so blanket conclusions should not be made based on these consensus negatives. Again, it should be noted that the results are based on a specific set of assumptions that are subject to variations; therefore, changes to these assumptions can alter the results and, consequently, the conclusions. While reducing emissions in the transportation sector is a common goal for most countries, it should be achieved in a cost effective manner. To assess this aspect for alternative fuel pathways, GHGenius calculates the “cost effectiveness” of CO2-equivalent, or GHG, emissions reduced by integrating information on the relative costs of each pathway with the emissions results to arrive at the cost of emission reductions. Since taxes are assumed to be included in the cost aspect of this calculation, the results are likely more relevant to consumers who account for taxes when shopping for a new vehicle, but government agencies can still use the results to reach high-level conclusions. Possible cost effectiveness results are:
1. “GHG Rises” – CO2-equivalent emissions are the same or increase as a result of the switch to the alternative vehicle/fuel combination.
2. Positive number – CO2-equivalent emissions decrease as a result of the switch to the alternative vehicle/fuel combination, but the alternative pathway costs more (cost of ownership and operation) than the base case of gasoline (for LDVs) or diesel (for HDVs). Smaller numbers reflect the most cost effective solutions.
3. Negative number – CO2-equivalent emissions decrease as a result of the switch to the alternative vehicle/fuel combination, and the alternative pathway has a lower cost compared to the baseline, but the magnitude of the negative number requires further investigation to determine attractiveness of the option.

iv
Cost effectiveness results are compiled in Tables ES5 Table ES6. Furthermore information on interpreting these numbers are accessible in “GHGenius Cost Effectiveness Methodology and Results” ((S&T)
2 Consultants Inc., 2005).
In general, results in from Tables ES3 and ES4 reflect those in Tables ES5 and ES6. If a fuel pathway has either a yellow or green cell for both emissions and cost, then it will have a favorable cost effectiveness result. Table ES3: Modeling results of the most feasible natural gas pathways, compared to established baseline fuels,
from an economic and environmental perspective
LDV
Em
issi
on
s
Win
ner
s
(bas
ed o
n g
CO
2eq
/km
)
LDV
Co
st W
inn
ers
(fro
m
a ce
nts
/km
stan
dp
oin
t)
HD
V
Emis
sio
ns
Win
ner
s
(bas
ed o
n g
CO
2eq
/km
)
HD
V C
ost
Win
ner
s
(fro
m
a ce
nts
/km
stan
dp
oin
t)
LDV
Em
issi
on
s
Win
ner
s
(bas
ed o
n g
CO
2eq
/km
)
LDV
Co
st W
inn
ers
(fro
m
a ce
nts
/km
stan
dp
oin
t)
HD
V
Emis
sio
ns
Win
ner
s
(bas
ed o
n g
CO
2eq
/km
)
HD
V C
ost
Win
ner
s
(fro
m
a ce
nts
/km
stan
dp
oin
t)
Canada China CNG (fossil) CNG (fossil) CNG (AD) CNG (LFG) LNG (fossil) LNG (fossil) LNG (AD) LNG (LFG) LPG LPG FT Diesel FT Diesel Synthetic Gasoline Synthetic Gasoline DME DME Methanol (M85) Methanol (M85) Compressed H2 – Fuel Cell Compressed H2 – Fuel Cell Electricity PHEV (40/50 km) Electricity PHEV (40/50 km) Electricity EV Electricity EV
Denmark Finland
CNG (fossil) CNG (fossil) CNG (AD/LFG) CNG (AD) LNG (fossil) LNG (fossil) LNG (AD/LFG) LNG (AD) LPG LPG FT Diesel FT Diesel Synthetic Gasoline Synthetic Gasoline DME DME Methanol (M85) Methanol (M85) Compressed H2 – Fuel Cell Compressed H2 – Fuel Cell Electricity PHEV (40/50 km) Electricity PHEV (40/50 km) Electricity EV Electricity EV
Israel United States
CNG (fossil) CNG (fossil) CNG (AD) CNG (AD) LNG (fossil) LNG (fossil) LNG (AD) LNG (AD) LPG LPG FT Diesel FT Diesel Synthetic Gasoline Synthetic Gasoline DME DME Methanol (M85) Methanol (M85) Compressed H2 – Fuel Cell Compressed H2 – Fuel Cell Electricity PHEV (40/50 km) Electricity PHEV (40/50 km) Electricity EV Electricity EV
Clear Winners Marginal Winners
Baseline is Superior Not Investigated
v
Table ES4: Consensus negatives across all six countries
LDV
Em
issi
on
s
Win
ne
rs
(bas
ed
on
g
CO
2eq
/km
)
LDV
Co
st W
inn
ers
(fro
m a
ce
nts
/km
st
and
po
int)
HD
V
Emis
sio
ns
Win
ne
rs
(bas
ed
on
g
CO
2eq
/km
)
HD
V C
ost
Win
ne
rs
(fro
m a
ce
nts
/km
stan
dp
oin
t)
CNG (fossil or biomethane) LNG (fossil or biomethane) LPG FT Diesel Synthetic Gasoline DME Methanol (M85) Compressed H2 – Fuel Cell Electricity
Table ES5: Cost Effectiveness for LDV Alternative Fuel Pathways (Compared to Baseline Low S Gasoline)
Cost Effectiveness – LDVs*
Canada China Denmark Finland Israel United States
CNG (Fossil) -160 -641 90 -2,225 -1,743 49
CNG (LFG) -97 -176 37 -79 -253 -50
CNG (AD) -97 -328 37 -85 -285 -60
LPG -3 -731 N/A N/A -447 279
FT Diesel (SA) -312 -460 GHG rises GHG rises GHG rises -415
FT Diesel (INT) -323 -552 GHG rises GHG rises GHG rises -500
Syn. Gasoline (SA) GHG rises -617 GHG rises 8,925 GHG rises GHG rises
Syn. Gasoline (INT) GHG rises -1,195 GHG rises 5,725 GHG rises GHG rises
Methanol (M85) -2,804 -2,210 N/A N/A -8,709 -33
Compressed H2 (FCV) 460 1,796 2,501 608 440 870
PHEV (40/50 km) 232 -0.63 858 297 53 26
EV 81 GHG rises -459 -10 -715 -63
*If GREEN, the fuel pathway offers both reduced emissions and cost using study assumptions.
Table ES6: Cost Effectiveness for HDV Alternative Fuel Pathways (Compared to Baseline Low S Diesel)
Cost Effectiveness – HDVs*
Canada China Denmark Finland Israel United States
CNG (Fossil) -452 -3,855 294 GHG rises -6,090 -229
CNG (LFG) -151 -236 55 -69 -265 -92
CNG (AD) -150 -497 56 -75 -304 -113
LNG (fossil) -198 GHG rises 206 GHG rises -11,036 -255
LNG (LFG) -117 -401 54 -141 -284 -81
LNG (AD) -116 -4,987 52 -154 -328 -102
LPG 865 GHG rises N/A N/A GHG rises 4,897
FT Diesel (SA) GHG rises GHG rises GHG rises GHG rises GHG rises GHG rises
FT Diesel (INT) GHG rises GHG rises GHG rises GHG rises GHG rises GHG rises
Syn. Gasoline (SA) GHG rises GHG rises GHG rises GHG rises GHG rises GHG rises
Syn. Gasoline (INT) GHG rises GHG rises GHG rises GHG rises GHG rises GHG rises
DME 478 80 N/A N/A -327 790
Methanol (M85) GHG rises GHG rises N/A N/A GHG rises GHG rises
Compressed H2 (FCV) 164 2,160 -18 -148 -125 2,637
*If GREEN, the option offers both reduced emissions and cost using study assumptions.
vi
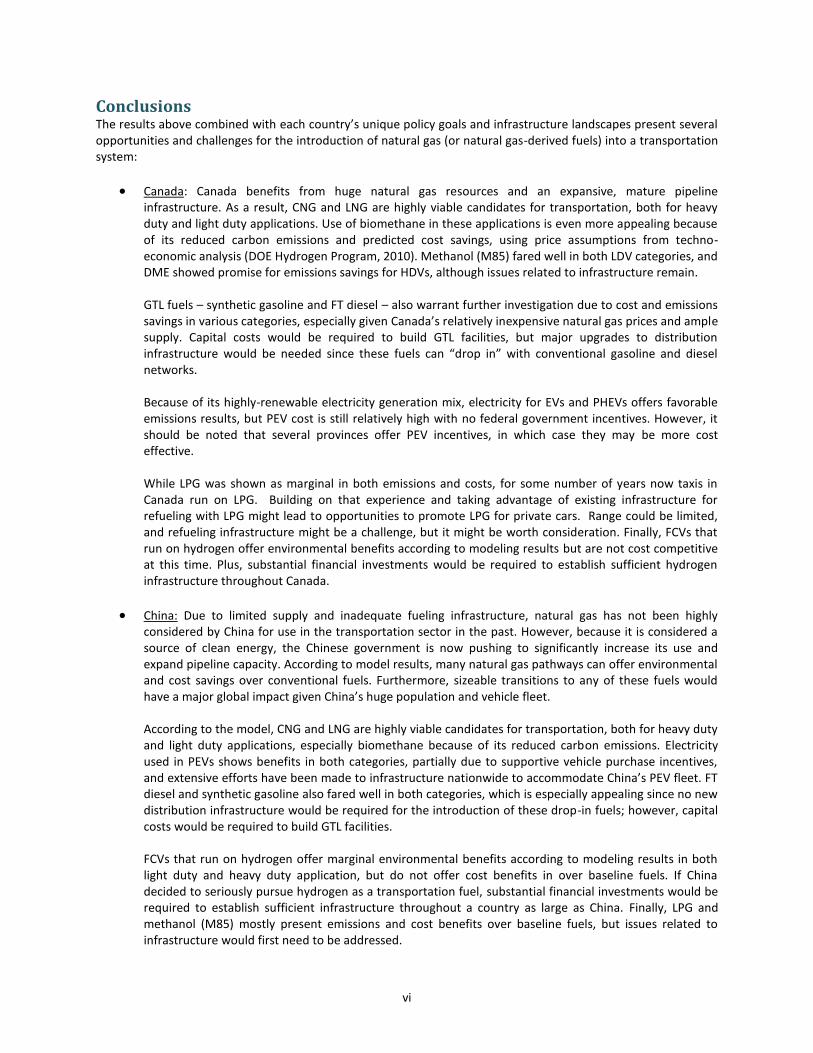
Conclusions The results above combined with each country’s unique policy goals and infrastructure landscapes present several opportunities and challenges for the introduction of natural gas (or natural gas-derived fuels) into a transportation system:
Canada: Canada benefits from huge natural gas resources and an expansive, mature pipeline infrastructure. As a result, CNG and LNG are highly viable candidates for transportation, both for heavy duty and light duty applications. Use of biomethane in these applications is even more appealing because of its reduced carbon emissions and predicted cost savings, using price assumptions from techno-economic analysis (DOE Hydrogen Program, 2010). Methanol (M85) fared well in both LDV categories, and DME showed promise for emissions savings for HDVs, although issues related to infrastructure remain.
GTL fuels – synthetic gasoline and FT diesel – also warrant further investigation due to cost and emissions savings in various categories, especially given Canada’s relatively inexpensive natural gas prices and ample supply. Capital costs would be required to build GTL facilities, but major upgrades to distribution infrastructure would be needed since these fuels can “drop in” with conventional gasoline and diesel networks. Because of its highly-renewable electricity generation mix, electricity for EVs and PHEVs offers favorable emissions results, but PEV cost is still relatively high with no federal government incentives. However, it should be noted that several provinces offer PEV incentives, in which case they may be more cost effective.
While LPG was shown as marginal in both emissions and costs, for some number of years now taxis in Canada run on LPG. Building on that experience and taking advantage of existing infrastructure for refueling with LPG might lead to opportunities to promote LPG for private cars. Range could be limited, and refueling infrastructure might be a challenge, but it might be worth consideration. Finally, FCVs that run on hydrogen offer environmental benefits according to modeling results but are not cost competitive at this time. Plus, substantial financial investments would be required to establish sufficient hydrogen infrastructure throughout Canada.
China: Due to limited supply and inadequate fueling infrastructure, natural gas has not been highly considered by China for use in the transportation sector in the past. However, because it is considered a source of clean energy, the Chinese government is now pushing to significantly increase its use and expand pipeline capacity. According to model results, many natural gas pathways can offer environmental and cost savings over conventional fuels. Furthermore, sizeable transitions to any of these fuels would have a major global impact given China’s huge population and vehicle fleet.
According to the model, CNG and LNG are highly viable candidates for transportation, both for heavy duty and light duty applications, especially biomethane because of its reduced carbon emissions. Electricity used in PEVs shows benefits in both categories, partially due to supportive vehicle purchase incentives, and extensive efforts have been made to infrastructure nationwide to accommodate China’s PEV fleet. FT diesel and synthetic gasoline also fared well in both categories, which is especially appealing since no new distribution infrastructure would be required for the introduction of these drop-in fuels; however, capital costs would be required to build GTL facilities. FCVs that run on hydrogen offer marginal environmental benefits according to modeling results in both light duty and heavy duty application, but do not offer cost benefits in over baseline fuels. If China decided to seriously pursue hydrogen as a transportation fuel, substantial financial investments would be required to establish sufficient infrastructure throughout a country as large as China. Finally, LPG and methanol (M85) mostly present emissions and cost benefits over baseline fuels, but issues related to infrastructure would first need to be addressed.
vii
Denmark: With Denmark’s ample natural gas reserves, using unconventional fuels would seem to be a good long term strategy to reduce any dependence on petroleum for transportation fuels. This falls in line with the Denmark government’s pursuit of a diverse set of fuel and vehicle options, such as NGVs, PEVs, and FCVs. The model suggests that electricity (for LDVs) and compressed hydrogen (for HDVs) might deliver twofold wins, that is, low emissions along with low cost to the consumer. For natural gas, this is primarily due to domestic supply and high conventional fuel prices; for electricity, EV cost advantages are primarily due to heavy support from vehicle registration tax exemptions. If these exemptions were to expire (which they are scheduled to do in 2016), EVs may no longer offer cost benefits. Companies in Denmark are in the process of rolling out infrastructure for EVs nationwide.
LNG (fossil or biomethane) is also very suitable for use in heavy duty trucks in Denmark since it greatly reduces emissions and provides a longer driving range compared to CNG. However, LNG for use in HDVs has a higher cost per km compared to traditional diesel, and according to the cost effectiveness value in Table ES6, the switch may not be as feasible for HDVs as other fuels like hydrogen fuel cell vehicles. Regardless, significant capital investment in infrastructure for transport and dispensing of either fuel will be needed. Industrial natural gas prices in Denmark, needed for GTL processing (i.e. FT diesel and synthetic gasoline), is still quite expensive, presenting obstacles for economic feasibility of these fuels. If overcome, existing vehicles could continue to operate even if petroleum is abandoned, and no major distribution infrastructure investments would be necessary since synthetic gasoline is a drop-in fuel. Given that Denmark has one of the highest densities of fuel stations in Europe, it may face more challenges in transitioning to a new fuel, and a relatively large amount of the fleet would need to switch to the fuel to allow reasonable payback time for the investment. It helps that baseline fuels (gasoline and diesel) are relatively expensive in Denmark so consumers may be more amenable to the introduction of new fuels compared to countries with access to inexpensive fossil fuels.
Finland: Finland has been very aggressive in recent years in the uptake of technologies for use of natural gas in transportation. This is despite the fact that natural gas is relatively expensive since it is all imported from Russia and must traverse through pipelines to Finland. Biomethane, however, can be domestically produced and currently accounts for 37% of all natural gas currently sold in Finland. Modeling results support Finland’s movement toward biomethane from anaerobic digestion as the clear environmental winner as well as being a strong cost competitor.
Electricity and hydrogen also provide potential improvements in both categories, according to GHGenius results. Finland’s PEV fleet has grown in recent years, and basic charging infrastructure is fairly well established especially since engine pre-warming is often required in the cold winters (although such climates may reduce electric range). Hydrogen, on the contrary, would require substantial financial investments to establish sufficient infrastructure across Finland. LNG (fossil or biomethane) is very suitable for use in heavy duty trucks and provides a longer driving range when compared to CNG. Availability of capital investment in infrastructure for transport and dispensing of fuel for both CNG and LNG will be crucial. With sophisticated refinery expertise in Finland, the notion of using “gas-to-liquid” to make synthetic gasoline might be considered, and it was found to have a marginal environmental edge on gasoline in certain cases. However, industrial natural gas prices in Finland, needed for GTL processing, is still quite expensive, presenting obstacles for feasibility. If overcome, existing vehicles could continue to operate even if petroleum is abandoned, and no major distribution infrastructure investments would be necessary since synthetic gasoline is a drop-in fuel.
viii
Like Denmark, Finland has one of the highest densities of fuel stations in Europe, so it may face more challenges in transitioning to a new fuel, and a relatively large amount of the fleet would need to switch to the fuel to allow reasonable payback time for the investment. It helps that baseline fuels (gasoline and diesel) are relatively expensive in Denmark so consumers may be more amenable to the introduction of new fuels compared to countries with access to inexpensive fossil fuels.
Israel: In many countries of larger land masses, there always arises a concern about vehicle range when considering natural gas as a transportation fuel. This may not be the case in Israel where the land mass is relatively small and population densities can be large. Thus, the capital investment required for sufficient fueling stations might not be as daunting as in some other nations. The results of the GHGenius model suggest that CNG and LNG, especially biomethane, can be leaders in bringing about the change that Israel seeks to achieve by getting away from petroleum and replacing oil with natural gas and electricity. Both CNG and LNG are “clean fuels” and produce considerably lower particulate emissions as well as GHGs compared to fossil fuels. Given Israel’s recent discovery of significant reserves, it seems logical that natural gas will play a key role in future transportation decisions and helping to diversify their fuel portfolio. GTL fuels – synthetic gasoline, FT diesel, and methanol – from natural gas present significant cost benefits over the baseline conventional fuels, aligning well with Israel’s energy goals. In addition to cost savings, methanol provides marginal emissions reduction for LDVs. Today’s light duty engines will accommodate synthetic gasoline and FT diesel without any modifications. Capital costs for expansion of GTL facilities may be required, but distribution infrastructure would be minimal due to GTL’s “drop-in” characteristic. For LDVs, electricity does not only offer a more environmentally friendly transportation fuel but also proves to be cost effective, at least for EVs, in part due to Israel’s emission-based vehicle tax system. Compressed hydrogen also fared well in both categories, but unlike drop-in fuels, major investments in vehicles and infrastructure would be required to realize a sizeable penetration of hydrogen in the Israeli market. DME and LPG derived from natural gas also fare well from a cost perspective.
In many countries of larger land masses, there always arises a concern about vehicle range when considering natural gas as a transportation fuel. This may not be the case in Israel where the land mass is relatively small and population densities can be large. Thus, the capital investment required for sufficient fueling stations might not be as daunting as in some other nations.
United States: A number of possible winners arose from the model results for the United States. CNG (both fossil and biomethane) scored well in both cost and emissions. The most interesting results, however, may be with the potential for synthetic gasoline and FT diesel, both made from natural gas. Both fuels offer significant cost improvements when compared to the baseline fuels and engines, and FT diesel shows emissions improvements when used in the LDV fleet. In order to pursue these avenues one must consider the capital costs of GTL facilities. In recent years some construction of such plants in the United States has been put on hold due to falling oil prices. Nevertheless, the concept of gas-to-liquid, if implemented, could likely relieve the United States of dependence on foreign oil. An added benefit would be that fact that synthetic fuels can be transported widely through existing pipelines, thus obviating the need for additional capital investment.
Results for natural gas-derived electricity for use in PEVs are very favorable for the United States, partially due to government financial support. The country already produces a lot of electricity from natural gas, and EVs and PHEVs are starting to gain traction in the market. Challenges for PEVs in America have proven to include limited driving range between recharging, lack of a sufficient charging infrastructure, and relatively slow recharging times (when fast charging options are not available). Several auto manufacturers and industry partners are working on newer technologies to help eliminate these issues. In
ix
the meantime, EVs are well suited for “day cars,” cars that might be confined to inner cities and recharged overnight, while PHEVs sufficiently address range anxiety. According to modeling results, LNG is a double winner for emissions and cost for the heavy duty sector. While the use of LNG for trucks is very small in the United States, these model results might help to spur more interest in the concept. Adequate refilling infrastructure might be a challenge. DME also fared well from an emissions standpoint, but fuel cost per km is higher than conventional fuels, and infrastructure issues would need to be addressed. Compressed hydrogen show promise for reducing emissions, but unlike drop-in fuels, major investments in vehicles and infrastructure would be required to realize a sizeable penetration of hydrogen in the U.S. market.

x
Table of Contents
Acknowledgements ........................................................................................................................................................ i
Abbreviations ................................................................................................................................................................ iii
Executive Summary ....................................................................................................................................................... v
Table of Contents .......................................................................................................................................................... x
List of Tables ............................................................................................................................................................... xiii
List of Figures .............................................................................................................................................................. xiv
1. Introduction .......................................................................................................................................................... 1
2. Background ........................................................................................................................................................... 3
2.1. Global Use of Natural Gas in Transportation ............................................................................................... 3
2.2. Environmental Impacts ................................................................................................................................ 4
2.3. Market Drivers & Barriers ............................................................................................................................ 5
3. Implications for Major “Players” ........................................................................................................................... 7
3.1. Consumers ................................................................................................................................................... 7
3.2. Government ................................................................................................................................................. 8
3.3. Fuel Industry ................................................................................................................................................ 8
3.4. Auto Industry ............................................................................................................................................... 8
4. Country Landscapes .............................................................................................................................................. 9
4.1. Canada ......................................................................................................................................................... 9
4.2. China .......................................................................................................................................................... 12
4.3. Denmark ..................................................................................................................................................... 15
4.4. Finland ........................................................................................................................................................ 17
4.5. Israel ........................................................................................................................................................... 19
4.6. United States .............................................................................................................................................. 22
4.7. Summary of Case Study Countries ............................................................................................................. 25
5. Natural Gas Pathways ......................................................................................................................................... 27
5.1. Description of Major Natural Gas Fuel Pathways ...................................................................................... 27
5.2. Direct Application of Natural Gas (Compressed and Liquefied)................................................................. 27
5.3. Natural Gas → Fischer-Tropsch Diesel ....................................................................................................... 28
5.4. Natural Gas → Synthetic Gasoline ............................................................................................................. 29
5.5. Natural Gas → LPG/Autogas ...................................................................................................................... 30
5.6. Natural Gas → Hydrogen ........................................................................................................................... 31
5.7. Natural Gas → Methanol ........................................................................................................................... 32
5.8. Natural Gas → Dimethyl Ether ................................................................................................................... 33
5.9. Natural Gas → Electricity ........................................................................................................................... 33
5.10. Condensed List of Feasible Pathways ........................................................................................................ 34
xi
6. Key Modeling & Analysis Assumptions ............................................................................................................... 35
6.1. Model Selection ......................................................................................................................................... 35
6.2. General Settings and Assumptions ............................................................................................................ 35
6.3. Vehicle Assumptions .................................................................................................................................. 36
6.3.1. Size Class ................................................................................................................................................ 36
6.3.2. Fuel Economy ......................................................................................................................................... 36
6.3.3. Operation and Maintenance .................................................................................................................. 36
6.3.4. Purchase Incentives and Incremental Costs .......................................................................................... 37
6.4. Fuel and Feedstock Assumptions ............................................................................................................... 39
6.4.1. Baseline Fuels ........................................................................................................................................ 39
6.4.2. Natural Gas ............................................................................................................................................ 39
6.4.3. Transport ............................................................................................................................................... 40
6.4.4. Electricity Generation ............................................................................................................................ 41
6.4.5. Fuel Pricing ............................................................................................................................................. 42
7. Technical Analysis Results ................................................................................................................................... 44
7.1. Environmental Impact Comparison ........................................................................................................... 44
7.1.1. Emissions by Country ............................................................................................................................. 45
7.1.2. Emissions by Natural Gas Fuel Pathway ................................................................................................ 51
7.2. Lifecycle Cost Comparison ......................................................................................................................... 60
7.2.1. Costs by Country .................................................................................................................................... 61
7.2.2. Costs by Natural Gas Fuel Pathway ....................................................................................................... 67
8. Conclusions ......................................................................................................................................................... 75
8.1. Country Summaries .................................................................................................................................... 75
8.2. Cost Effectiveness ...................................................................................................................................... 75
8.3. Country Considerations .............................................................................................................................. 78
8.3.1. Canada ................................................................................................................................................... 78
8.3.2. China ...................................................................................................................................................... 78
8.3.3. Denmark ................................................................................................................................................ 79
8.3.4. Finland ................................................................................................................................................... 80
8.3.5. Israel ...................................................................................................................................................... 81
8.3.6. United States ......................................................................................................................................... 82
9. Next Steps ........................................................................................................................................................... 83
9.1. GHGenius Enhancements ........................................................................................................................... 83
9.2. Sensitivity Studies ...................................................................................................................................... 83
9.3. Implementation Plans ................................................................................................................................ 83
Appendix: Natural Gas to Gasoline Pathway Addition in GHGenius ........................................................................... 85
References ................................................................................................................................................................... 87

xiii
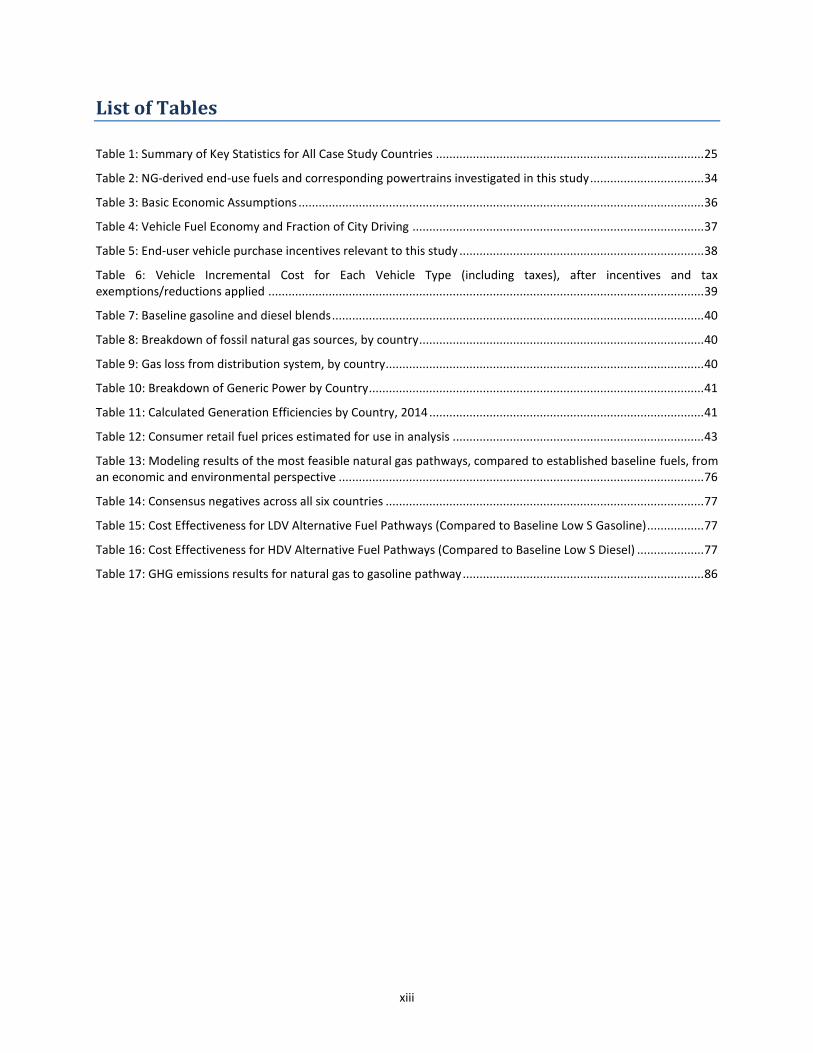
List of Tables
Table 1: Summary of Key Statistics for All Case Study Countries ................................................................................ 25
Table 2: NG-derived end-use fuels and corresponding powertrains investigated in this study .................................. 34
Table 3: Basic Economic Assumptions ......................................................................................................................... 36
Table 4: Vehicle Fuel Economy and Fraction of City Driving ....................................................................................... 37
Table 5: End-user vehicle purchase incentives relevant to this study ......................................................................... 38
Table 6: Vehicle Incremental Cost for Each Vehicle Type (including taxes), after incentives and tax exemptions/reductions applied .................................................................................................................................. 39
Table 7: Baseline gasoline and diesel blends ............................................................................................................... 40
Table 8: Breakdown of fossil natural gas sources, by country ..................................................................................... 40
Table 9: Gas loss from distribution system, by country............................................................................................... 40
Table 10: Breakdown of Generic Power by Country .................................................................................................... 41
Table 11: Calculated Generation Efficiencies by Country, 2014 .................................................................................. 41
Table 12: Consumer retail fuel prices estimated for use in analysis ........................................................................... 43
Table 13: Modeling results of the most feasible natural gas pathways, compared to established baseline fuels, from an economic and environmental perspective ............................................................................................................. 76
Table 14: Consensus negatives across all six countries ............................................................................................... 77
Table 15: Cost Effectiveness for LDV Alternative Fuel Pathways (Compared to Baseline Low S Gasoline) ................. 77
Table 16: Cost Effectiveness for HDV Alternative Fuel Pathways (Compared to Baseline Low S Diesel) .................... 77
Table 17: GHG emissions results for natural gas to gasoline pathway ........................................................................ 86
xiv
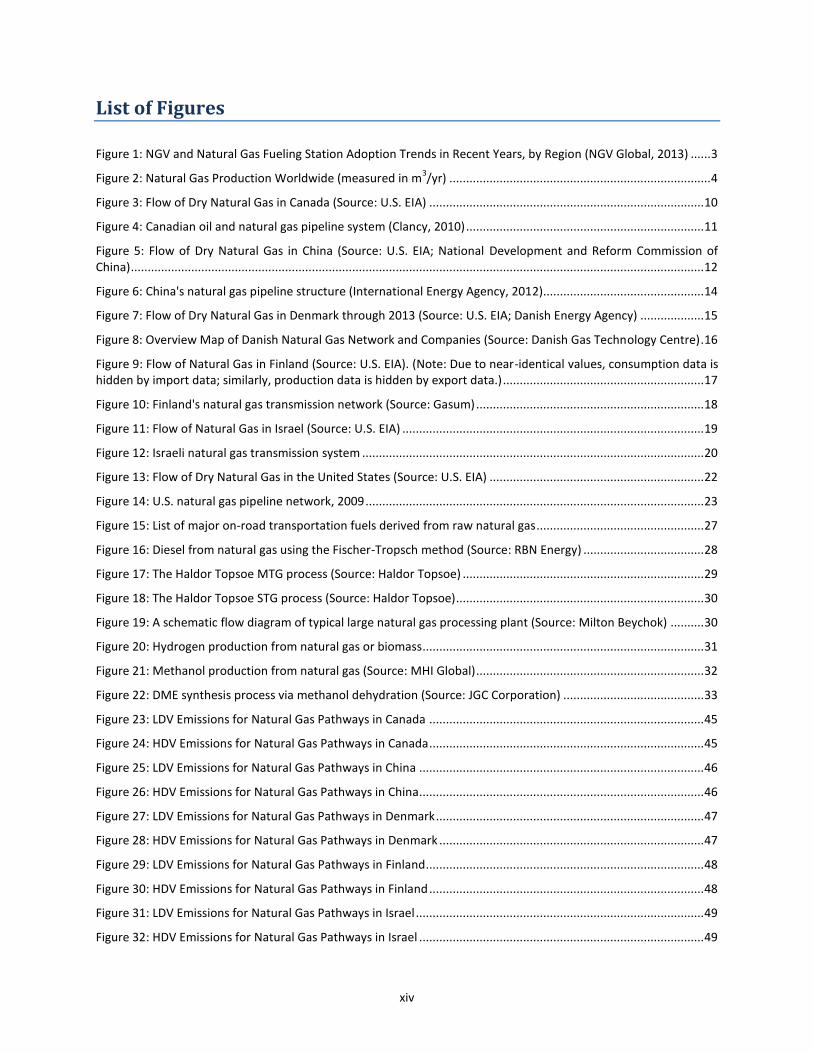
List of Figures
Figure 1: NGV and Natural Gas Fueling Station Adoption Trends in Recent Years, by Region (NGV Global, 2013) ...... 3
Figure 2: Natural Gas Production Worldwide (measured in m3/yr) .............................................................................. 4
Figure 3: Flow of Dry Natural Gas in Canada (Source: U.S. EIA) .................................................................................. 10
Figure 4: Canadian oil and natural gas pipeline system (Clancy, 2010) ....................................................................... 11
Figure 5: Flow of Dry Natural Gas in China (Source: U.S. EIA; National Development and Reform Commission of China) ........................................................................................................................................................................... 12
Figure 6: China's natural gas pipeline structure (International Energy Agency, 2012)................................................ 14
Figure 7: Flow of Dry Natural Gas in Denmark through 2013 (Source: U.S. EIA; Danish Energy Agency) ................... 15
Figure 8: Overview Map of Danish Natural Gas Network and Companies (Source: Danish Gas Technology Centre) . 16
Figure 9: Flow of Natural Gas in Finland (Source: U.S. EIA). (Note: Due to near-identical values, consumption data is hidden by import data; similarly, production data is hidden by export data.) ............................................................ 17
Figure 10: Finland's natural gas transmission network (Source: Gasum) .................................................................... 18
Figure 11: Flow of Natural Gas in Israel (Source: U.S. EIA) .......................................................................................... 19
Figure 12: Israeli natural gas transmission system ...................................................................................................... 20
Figure 13: Flow of Dry Natural Gas in the United States (Source: U.S. EIA) ................................................................ 22
Figure 14: U.S. natural gas pipeline network, 2009 ..................................................................................................... 23
Figure 15: List of major on-road transportation fuels derived from raw natural gas .................................................. 27
Figure 16: Diesel from natural gas using the Fischer-Tropsch method (Source: RBN Energy) .................................... 28
Figure 17: The Haldor Topsoe MTG process (Source: Haldor Topsoe) ........................................................................ 29
Figure 18: The Haldor Topsoe STG process (Source: Haldor Topsoe).......................................................................... 30
Figure 19: A schematic flow diagram of typical large natural gas processing plant (Source: Milton Beychok) .......... 30
Figure 20: Hydrogen production from natural gas or biomass.................................................................................... 31
Figure 21: Methanol production from natural gas (Source: MHI Global) .................................................................... 32
Figure 22: DME synthesis process via methanol dehydration (Source: JGC Corporation) .......................................... 33
Figure 23: LDV Emissions for Natural Gas Pathways in Canada .................................................................................. 45
Figure 24: HDV Emissions for Natural Gas Pathways in Canada .................................................................................. 45
Figure 25: LDV Emissions for Natural Gas Pathways in China ..................................................................................... 46
Figure 26: HDV Emissions for Natural Gas Pathways in China..................................................................................... 46
Figure 27: LDV Emissions for Natural Gas Pathways in Denmark ................................................................................ 47
Figure 28: HDV Emissions for Natural Gas Pathways in Denmark ............................................................................... 47
Figure 29: LDV Emissions for Natural Gas Pathways in Finland ................................................................................... 48
Figure 30: HDV Emissions for Natural Gas Pathways in Finland .................................................................................. 48
Figure 31: LDV Emissions for Natural Gas Pathways in Israel ...................................................................................... 49
Figure 32: HDV Emissions for Natural Gas Pathways in Israel ..................................................................................... 49
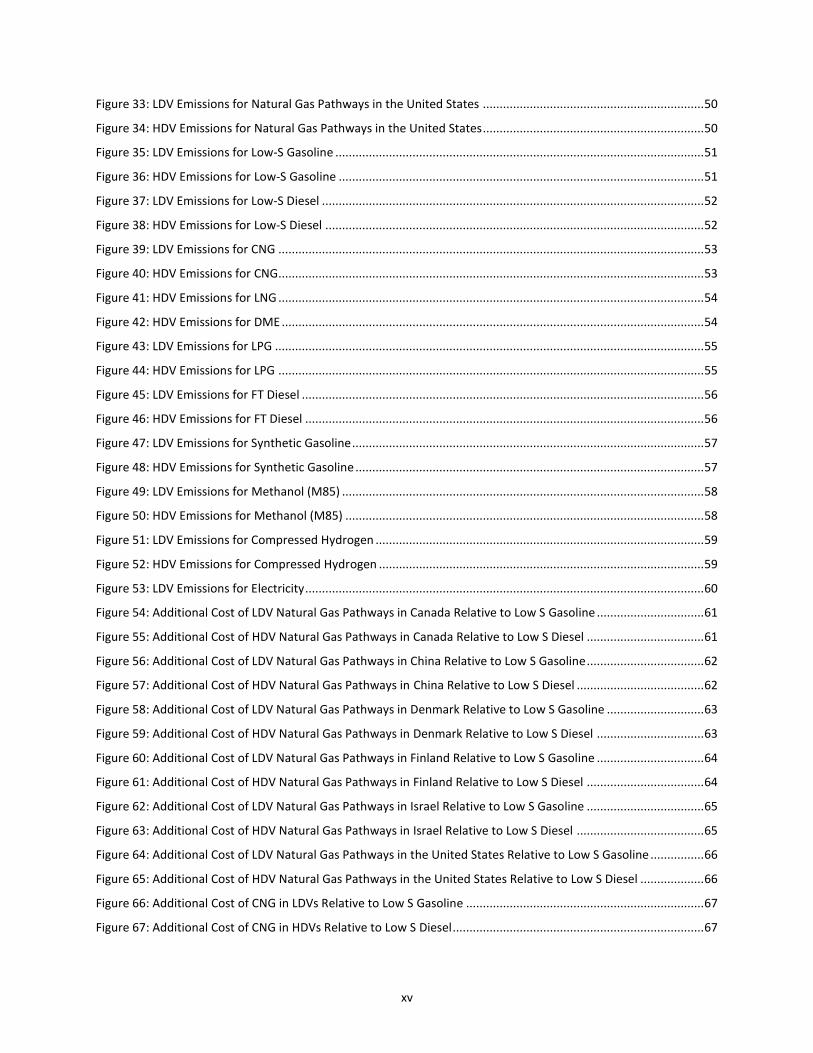
xv
Figure 33: LDV Emissions for Natural Gas Pathways in the United States .................................................................. 50
Figure 34: HDV Emissions for Natural Gas Pathways in the United States .................................................................. 50
Figure 35: LDV Emissions for Low-S Gasoline .............................................................................................................. 51
Figure 36: HDV Emissions for Low-S Gasoline ............................................................................................................. 51
Figure 37: LDV Emissions for Low-S Diesel .................................................................................................................. 52
Figure 38: HDV Emissions for Low-S Diesel ................................................................................................................. 52
Figure 39: LDV Emissions for CNG ............................................................................................................................... 53
Figure 40: HDV Emissions for CNG............................................................................................................................... 53
Figure 41: HDV Emissions for LNG ............................................................................................................................... 54
Figure 42: HDV Emissions for DME .............................................................................................................................. 54
Figure 43: LDV Emissions for LPG ................................................................................................................................ 55
Figure 44: HDV Emissions for LPG ............................................................................................................................... 55
Figure 45: LDV Emissions for FT Diesel ........................................................................................................................ 56
Figure 46: HDV Emissions for FT Diesel ....................................................................................................................... 56
Figure 47: LDV Emissions for Synthetic Gasoline ......................................................................................................... 57
Figure 48: HDV Emissions for Synthetic Gasoline ........................................................................................................ 57
Figure 49: LDV Emissions for Methanol (M85) ............................................................................................................ 58
Figure 50: HDV Emissions for Methanol (M85) ........................................................................................................... 58
Figure 51: LDV Emissions for Compressed Hydrogen .................................................................................................. 59
Figure 52: HDV Emissions for Compressed Hydrogen ................................................................................................. 59
Figure 53: LDV Emissions for Electricity ....................................................................................................................... 60
Figure 54: Additional Cost of LDV Natural Gas Pathways in Canada Relative to Low S Gasoline ................................ 61
Figure 55: Additional Cost of HDV Natural Gas Pathways in Canada Relative to Low S Diesel ................................... 61
Figure 56: Additional Cost of LDV Natural Gas Pathways in China Relative to Low S Gasoline ................................... 62
Figure 57: Additional Cost of HDV Natural Gas Pathways in China Relative to Low S Diesel ...................................... 62
Figure 58: Additional Cost of LDV Natural Gas Pathways in Denmark Relative to Low S Gasoline ............................. 63
Figure 59: Additional Cost of HDV Natural Gas Pathways in Denmark Relative to Low S Diesel ................................ 63
Figure 60: Additional Cost of LDV Natural Gas Pathways in Finland Relative to Low S Gasoline ................................ 64
Figure 61: Additional Cost of HDV Natural Gas Pathways in Finland Relative to Low S Diesel ................................... 64
Figure 62: Additional Cost of LDV Natural Gas Pathways in Israel Relative to Low S Gasoline ................................... 65
Figure 63: Additional Cost of HDV Natural Gas Pathways in Israel Relative to Low S Diesel ...................................... 65
Figure 64: Additional Cost of LDV Natural Gas Pathways in the United States Relative to Low S Gasoline ................ 66
Figure 65: Additional Cost of HDV Natural Gas Pathways in the United States Relative to Low S Diesel ................... 66
Figure 66: Additional Cost of CNG in LDVs Relative to Low S Gasoline ....................................................................... 67
Figure 67: Additional Cost of CNG in HDVs Relative to Low S Diesel ........................................................................... 67
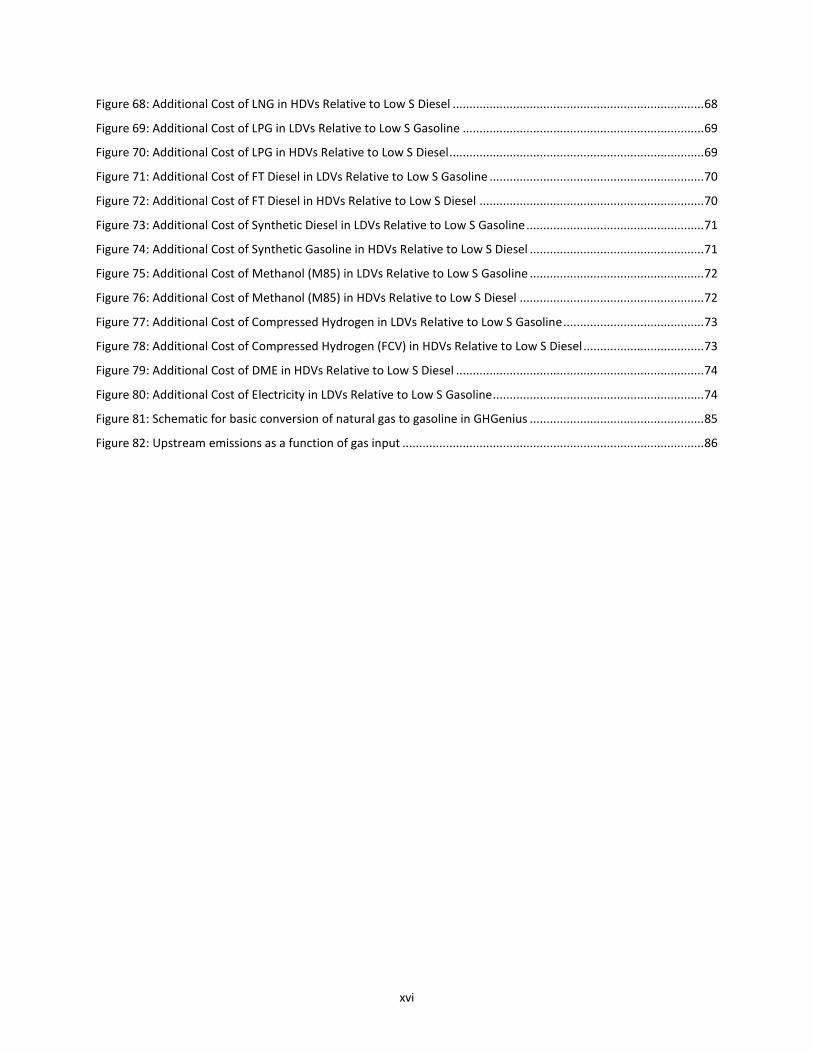
xvi
Figure 68: Additional Cost of LNG in HDVs Relative to Low S Diesel ........................................................................... 68
Figure 69: Additional Cost of LPG in LDVs Relative to Low S Gasoline ........................................................................ 69
Figure 70: Additional Cost of LPG in HDVs Relative to Low S Diesel ............................................................................ 69
Figure 71: Additional Cost of FT Diesel in LDVs Relative to Low S Gasoline ................................................................ 70
Figure 72: Additional Cost of FT Diesel in HDVs Relative to Low S Diesel ................................................................... 70
Figure 73: Additional Cost of Synthetic Diesel in LDVs Relative to Low S Gasoline ..................................................... 71
Figure 74: Additional Cost of Synthetic Gasoline in HDVs Relative to Low S Diesel .................................................... 71
Figure 75: Additional Cost of Methanol (M85) in LDVs Relative to Low S Gasoline .................................................... 72
Figure 76: Additional Cost of Methanol (M85) in HDVs Relative to Low S Diesel ....................................................... 72
Figure 77: Additional Cost of Compressed Hydrogen in LDVs Relative to Low S Gasoline .......................................... 73
Figure 78: Additional Cost of Compressed Hydrogen (FCV) in HDVs Relative to Low S Diesel .................................... 73
Figure 79: Additional Cost of DME in HDVs Relative to Low S Diesel .......................................................................... 74
Figure 80: Additional Cost of Electricity in LDVs Relative to Low S Gasoline ............................................................... 74
Figure 81: Schematic for basic conversion of natural gas to gasoline in GHGenius .................................................... 85
Figure 82: Upstream emissions as a function of gas input .......................................................................................... 86
1
For natural gas-derived fuels to be chosen for implementation, they would need to be produced, delivered and used in vehicles at prices competitive with traditional fuels.
CR
ITE
RIA
FO
R S
UC
CE
SS
1. Introduction
The widespread use of natural gas as an on-road transportation fuel has gained traction in recent decades as an alternative to traditional petroleum-based fuels due to the relative environmental benefits, including reduced volatile organic compounds (VOC), carbon monoxide (CO), nitrogen oxide (NOx), and particulate matter (PM). Likewise, fuels derived from natural gas also tend to have lower environmental impact than petroleum- or coal-based fuels. For countries with abundant supply of natural gas, it can also provide a means to gain energy independence and diversify its fuel portfolio. Natural gas production and distribution is a well-established industry in many countries; this may also mean that these countries are well-positioned to support the production and distribution of alternative transportation fuels derived from natural gas. Where fossil supplies are limited, natural gas can be obtained through imports or domestic production of biomethane from anaerobic digestion (AD), landfill gas (LFG), and other organic sources. Natural gas in its basic form can be used in either a compressed or liquefied state. Compressed natural gas (CNG) vehicles have achieved moderate popularity throughout the world, but, compared to conventional vehicles, may have less range and additional weight. A price premium is also associated with vehicles that operate on natural gas, known as NGVs. Furthermore, sufficient infrastructure for NGVs is often limited to regions where natural gas is cost-competitive with gasoline and diesel. Liquefied natural gas (LNG) has demonstrated practicality in heavy duty vehicles (HDV), but it is currently too heavy to store onboard in light duty vehicles (LDV). One key advantage of using natural gas in its natural state is the avoidance of an intermediate conversion/processing step into a different transportation fuel, which introduces extra cost and fuel efficiency losses. Natural gas is not limited to operation as CNG or LNG. Because it is primarily comprised of methane, natural gas offers a second category of candidate transportation fuels: synthetic liquid or gaseous fuels, or synfuels. The U.S. Energy Information Administration (EIA) defines a synfuel as any fuel produced from coal, natural gas, or biomass feedstocks through chemical conversion, creating a substance that is chemically the same but synthesized through artificial means. While synfuel research and development (R&D) began in the 1920s with the development of the Fischer-Tropsch (FT) process, it has peaked in recent years. To date, however, such fuels have been typically more expensive to produce than CNG and LNG, or lacking infrastructure has hindered widespread deployment. Production of synfuels will likely result in energy loss in the synthesis conversion process, but some of this expense will possibly be offset in part by elimination of other costs, such as simpler transport of fuels, higher vehicle operating efficiencies, etc. Certain synthetic gas-to-liquid (GTL) fuels even chemically resemble petroleum fuels (i.e., gasoline and diesel) in some cases and can, therefore, be delivered through existing pipeline and dispensing infrastructure. Such “drop in” fuels do not even require modifications to traditional internal combustion engine (ICE) vehicles. Other fuels, such as hydrogen produced from NG (via methane reforming), may offer long-term solutions if shown to be economically feasible and if the sufficient investments in infrastructure are made. Electricity generated at a natural gas-powered plant offers a fourth candidate for fueling on-road vehicles, especially with the current emergence of plug-in electric vehicles (PEV) – including both electric vehicles (EV) and plug-in hybrid electric vehicles (PHEV) – and accompanying infrastructure worldwide. This process presents unique logistical characteristics compared to the others since the electricity is transmitted through power lines instead of pipelines, and charging stations are used to refuel instead of liquid or gaseous dispensing stations.
2
For natural gas-derived fuels to be chosen for implementation, they would need to be produced, delivered and used in vehicles at prices competitive with traditional fuels. In addition to cost, emphasis must also be placed on the environmental benefits, energy use, and energy security that each fuel pathway can offer to a particular nation. In this study, the feasibility of these different natural gas pathways used in motor vehicles were assessed to determine the advantages and disadvantages of each option. Aspects included but were not limited to cost, lifecycle emissions, and alignment with a country’s energy policy and goals. The goal was to identify the most cost-effective for the user and technically feasible way to utilize natural gas in transportation with the potential to emerge into the mainstream market, instead of maintaining a niche market in many countries. To demonstrate how differently each factor can weigh in, case studies were conducted in six different countries spanning three continents.
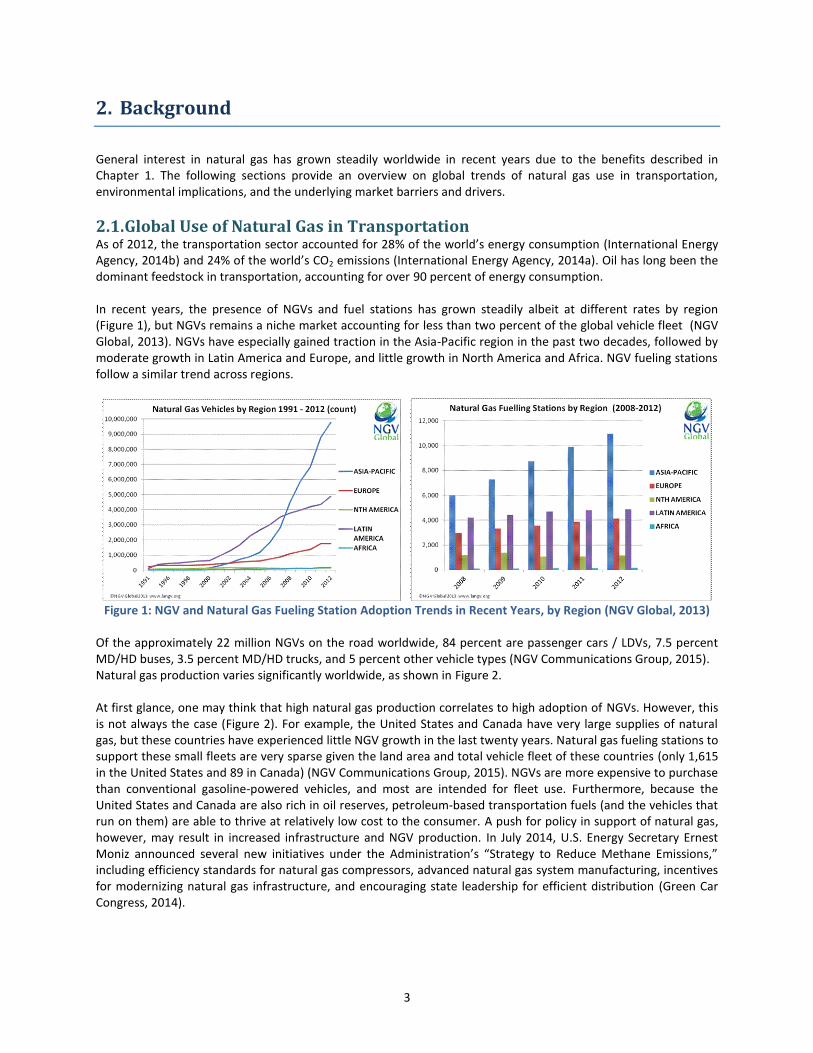
3
2. Background
General interest in natural gas has grown steadily worldwide in recent years due to the benefits described in Chapter 1. The following sections provide an overview on global trends of natural gas use in transportation, environmental implications, and the underlying market barriers and drivers.
2.1. Global Use of Natural Gas in Transportation As of 2012, the transportation sector accounted for 28% of the world’s energy consumption (International Energy Agency, 2014b) and 24% of the world’s CO2 emissions (International Energy Agency, 2014a). Oil has long been the dominant feedstock in transportation, accounting for over 90 percent of energy consumption. In recent years, the presence of NGVs and fuel stations has grown steadily albeit at different rates by region (Figure 1), but NGVs remains a niche market accounting for less than two percent of the global vehicle fleet (NGV Global, 2013). NGVs have especially gained traction in the Asia-Pacific region in the past two decades, followed by moderate growth in Latin America and Europe, and little growth in North America and Africa. NGV fueling stations follow a similar trend across regions.
Figure 1: NGV and Natural Gas Fueling Station Adoption Trends in Recent Years, by Region (NGV Global, 2013)
Of the approximately 22 million NGVs on the road worldwide, 84 percent are passenger cars / LDVs, 7.5 percent MD/HD buses, 3.5 percent MD/HD trucks, and 5 percent other vehicle types (NGV Communications Group, 2015). Natural gas production varies significantly worldwide, as shown in Figure 2. At first glance, one may think that high natural gas production correlates to high adoption of NGVs. However, this is not always the case (Figure 2). For example, the United States and Canada have very large supplies of natural gas, but these countries have experienced little NGV growth in the last twenty years. Natural gas fueling stations to support these small fleets are very sparse given the land area and total vehicle fleet of these countries (only 1,615 in the United States and 89 in Canada) (NGV Communications Group, 2015). NGVs are more expensive to purchase than conventional gasoline-powered vehicles, and most are intended for fleet use. Furthermore, because the United States and Canada are also rich in oil reserves, petroleum-based transportation fuels (and the vehicles that run on them) are able to thrive at relatively low cost to the consumer. A push for policy in support of natural gas, however, may result in increased infrastructure and NGV production. In July 2014, U.S. Energy Secretary Ernest Moniz announced several new initiatives under the Administration’s “Strategy to Reduce Methane Emissions,” including efficiency standards for natural gas compressors, advanced natural gas system manufacturing, incentives for modernizing natural gas infrastructure, and encouraging state leadership for efficient distribution (Green Car Congress, 2014).
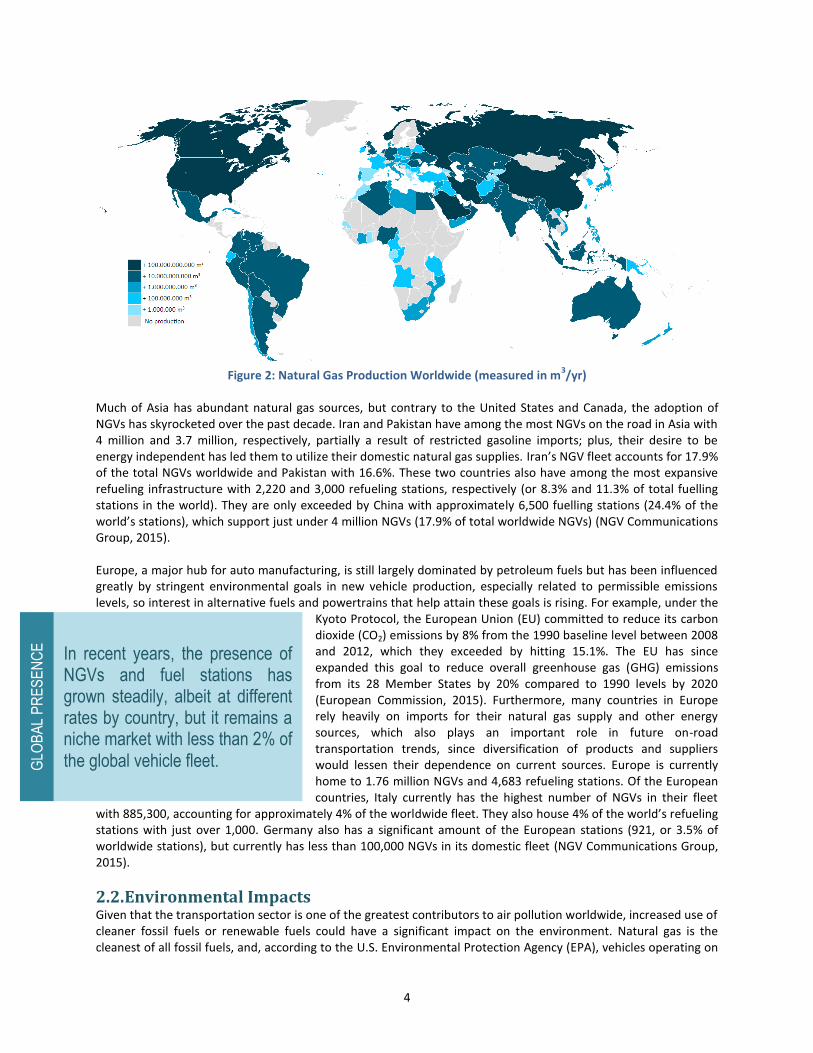
4
In recent years, the presence of NGVs and fuel stations has grown steadily, albeit at different rates by country, but it remains a niche market with less than 2% of the global vehicle fleet. G
LOB
AL
PR
ES
EN
CE
Figure 2: Natural Gas Production Worldwide (measured in m
3/yr)
Much of Asia has abundant natural gas sources, but contrary to the United States and Canada, the adoption of NGVs has skyrocketed over the past decade. Iran and Pakistan have among the most NGVs on the road in Asia with 4 million and 3.7 million, respectively, partially a result of restricted gasoline imports; plus, their desire to be energy independent has led them to utilize their domestic natural gas supplies. Iran’s NGV fleet accounts for 17.9% of the total NGVs worldwide and Pakistan with 16.6%. These two countries also have among the most expansive refueling infrastructure with 2,220 and 3,000 refueling stations, respectively (or 8.3% and 11.3% of total fuelling stations in the world). They are only exceeded by China with approximately 6,500 fuelling stations (24.4% of the world’s stations), which support just under 4 million NGVs (17.9% of total worldwide NGVs) (NGV Communications Group, 2015). Europe, a major hub for auto manufacturing, is still largely dominated by petroleum fuels but has been influenced greatly by stringent environmental goals in new vehicle production, especially related to permissible emissions levels, so interest in alternative fuels and powertrains that help attain these goals is rising. For example, under the
Kyoto Protocol, the European Union (EU) committed to reduce its carbon dioxide (CO2) emissions by 8% from the 1990 baseline level between 2008 and 2012, which they exceeded by hitting 15.1%. The EU has since expanded this goal to reduce overall greenhouse gas (GHG) emissions from its 28 Member States by 20% compared to 1990 levels by 2020 (European Commission, 2015). Furthermore, many countries in Europe rely heavily on imports for their natural gas supply and other energy sources, which also plays an important role in future on-road transportation trends, since diversification of products and suppliers would lessen their dependence on current sources. Europe is currently home to 1.76 million NGVs and 4,683 refueling stations. Of the European countries, Italy currently has the highest number of NGVs in their fleet
with 885,300, accounting for approximately 4% of the worldwide fleet. They also house 4% of the world’s refueling stations with just over 1,000. Germany also has a significant amount of the European stations (921, or 3.5% of worldwide stations), but currently has less than 100,000 NGVs in its domestic fleet (NGV Communications Group, 2015).
2.2. Environmental Impacts Given that the transportation sector is one of the greatest contributors to air pollution worldwide, increased use of cleaner fossil fuels or renewable fuels could have a significant impact on the environment. Natural gas is the cleanest of all fossil fuels, and, according to the U.S. Environmental Protection Agency (EPA), vehicles operating on
5
CNG can significantly reduce CO, CO2, NOx, and other non-methane hydrocarbon emissions, compared to traditional gasoline and diesel vehicles. Furthermore, NGVs emit fewer toxic and carcinogenic emissions and virtually no particulate matter due to its relatively simple makeup, helping to improve local air quality. Because of this, countries with mandates to reduce transportation emissions may consider natural gas a viable resource. As with most fuels, the use of natural gas as a transportation fuel (or as a source for alternative fuels) raises some environmental concerns. First, the primary component of natural gas – methane – is a GHG, which can escape into the atmosphere if not burned completely or through leaks and losses during transportation. Second, the risk of groundwater contamination and other issues associated with hydraulic fracturing, or fracking, to extract natural gas from shale and other rock formations may need to be addressed in areas of the world where shale is abundant.
2.3. Market Drivers & Barriers Domestic supply is just one of many factors that help determine whether natural gas and natural gas-derived transportation fuels are feasible worldwide. Other key market accelerators and barriers include:
Competition with Traditional Fuels: As mentioned above, petroleum has long been the dominant feedstock for fuels used in transportation worldwide. Therefore, in countries with large domestic oil reserves, natural gas may face stronger resistance since operations and infrastructure is well developed and a level of energy independence exists. Similarly, perhaps countries with little or no oil reserves are more amenable to increasing the use of natural gas (or other alternative fuels) when not as invested in petroleum.
Environmental Policy: Many countries have committed to carbon reduction plans to reduce GHG emissions (e.g., Kyoto Protocol), and migration to cleaner transportation fuels, such as natural gas, will play an important role in these plans. Transportation fuels that align with a country’s policy goals and objectives may also have a market advantage. Fuels that help achieve GHG emission goals or help secure energy independence, for example, may receive higher praise over alternatives.
Level of Infrastructure: Countries with well-established infrastructure – both for natural gas and for fuels derived from natural gas – are more likely to embrace the use of these fuels. Several scenarios are applicable for this study:
Direct Use of Natural Gas as a Fuel: When dealing directly with natural gas, this infrastructure can include pipeline, roadways suitable for transporting natural gas via truck, storage facilities, and dispensing stations. If a country has limited domestic natural gas resources, infrastructure that cost-effectively enables natural gas imports (e.g., pipeline and/or port systems) is needed.
Natural Gas as Source for Alternative Fuel: When natural gas is used as the primary ingredient for an alternative fuel, necessary infrastructure tailored to the finished fuel may include pipeline, roadways suitable for transporting natural gas via truck, storage facilities, and dispensing stations. A key factor in this scenario is at what point the fuel production takes place (e.g., prior to import, prior to distribution, at a storage facility, or at the dispensing site). If sufficient infrastructure exists for natural gas, then end-use fuel production may be better suited further downstream, but if a country is primarily set up for the end-use fuels (e.g., gasoline, diesel, gaseous fuels), upstream conversion should be highly considered to minimize national infrastructure investments.
Economics: The price of natural gas relative to conventional fuels plays a major role in how competitive it can be in the transportation sector. Temporary government incentives for natural gas (including natural-gas derived fuels) and NGVs may be used to help increase penetration into the market to a level where they can compete with traditional petroleum-based engines. For example, in some countries, natural gas benefits from preferential taxation treatment, helping to keep NGV operations at relatively low cost by increasing competitiveness with other fuels. If natural gas consumption were to increase, the taxation benefits might no longer be needed for natural gas to be competitive in the market due to economies of scale, though initially consumers may revert to using more affordable, conventional fuels. In addition, for countries with little or no domestic natural gas, cost to import may vary significantly. The economic feasibility of building new fuel production plants, such as GTL plants, is also highly dependent on market prices, as many major energy players have discovered. According to Sasol Chief Executive Officer David

6
Constable, “For a gas-to-liquids plant to make money, a barrel of oil has to trade at a ratio of about 16 times the cost of a million British thermal units of natural gas” (Olson, 2013).
Technology Advancements: As with any transportation fuel, technology advancements that help to drop acquisition costs (e.g., shale gas developments), production costs (e.g., more efficient natural gas liquefaction process), operating costs (e.g., more efficient vehicle engine), or emissions (e.g., more environmentally-friendly conversion process) may increase a fuel’s competitiveness within the market. The process for producing and delivering natural gas (and natural gas-derived fuels) to consumers is comprised of numerous steps, each with room for improvement, whether at a nominal or breakthrough level.
7
3. Implications for Major “Players”
As noted in the previous chapter, numerous factors play a role in whether a transportation fuel is a strong candidate for introduction into an established framework. Fuel transition(s) must be limited to those with strong business cases since the expense for infrastructure changeover may be significant. Major changes in technology, international affairs, and world pricing and supply of fuels may also drive realignment of ongoing fuel shifts. Transitioning to a new fuel can take years, and replacement of today’s conventional fuels (i.e. gasoline and diesel) should not be expected anytime soon. Coexistence of the new fuel(s) with these conventional fuels is likely to last decades, allowing time for the fuel and supporting infrastructure to be developed. Of course, sound analysis is pertinent prior to major moves toward a new fuel in order to make the best decisions. Four critical stakeholder groups – the customers, the government, the fuel industry, and the automotive industry – have their own considerations, and the probability of a fuel’s successful introduction is maximized when all of their needs are met. The following sections describe the criteria to begin a relatively successful transition to new highway fuels and, once begun, to continue the transition process, according to the U.S.’ Argonne National Laboratory’s (ANL) “Checklist for Transition to New Highway Fuels” (Risch & Santini, 2011). See ANL’s report in its entirety for a more in-depth look at the considerations taken by each primary player. Examples of historical highway fuel transitions that succeeded as a result of these stakeholder “checklists” being met include: gasoline to diesel in HDVs in the United States from the 1960s to the present; gasoline to diesel in European LDVs through the 1980s and 1990s; gasoline to sugar cane-based ethanol vehicles in Brazil, in two waves (1970s and early 1980s, and late 1990s to the present); and the switch from leaded to unleaded gasoline in U.S. vehicles during the 1970s and 1980s (and largely worldwide thereafter). Examples of earlier efforts that failed to gain traction have included: gasoline to methanol vehicles in the United States and Germany; and gasoline to ethanol, natural gas, or liquefied petroleum gas (LPG) vehicles in the United States. Success or failure assessments yet to be determined worldwide include electric drive powered by grid electricity, hydrogen ICEs, hydrogen fuel cell vehicles (FCV), and cellulosic ethanol (Risch & Santini, 2011). While this study attempts to address some of the checklist criteria below (e.g., environmental impacts, cost of ownership, purchase incentives, technical feasibility, feedstock adequacy and reliability), this list far exceeds our scope. Supplementary studies and sources will be needed to fully understand the true feasibility of transportation fuels on a country basis.
3.1. Consumers As they learn about new products, customers expect that they will offer net advantages over the status quo and are primarily interested in:
Environmental Impacts (addressed primarily via the government)
Safety (addressed partly via the government)
Cost of Ownership
Vehicle Function
Refueling
Unique Purchase Incentives There are two types of consumers – indirect interest groups and direct consumers. The former, often environmentalists and safety advocates, are customers of the government in the sense that they exert pressure to regulate the design of vehicles, fuel infrastructure, and the highway network. Direct consumers, on the other hand, are primarily looking to new products to provide improvements to bullets 2-6. When new products are radically different, consumers must sometimes overcome a fear associated with being an early adopter, meaning that they are more prone to early design problems, lack of supporting infrastructure, and/or the product quickly becoming obsolete.
8
3.2. Government The government is expected to implement a consistent long-term approach with special consideration for:
Environmental Impacts
Energy Efficiency
Energy Independence and Energy Security
Feedstock Adequacy and Reliability
Taxpayer Affordability
Policy Continuity
National Economic Impacts
International Considerations
3.3. Fuel Industry The fuel industry will invest in a major project when they can make a solid business plan that demonstrates a profitable return for the company’s shareholders. Therefore, analyses of all aspects of candidate fuels (e.g., feedstock supply, processing, and distribution through dispensing to the ultimate consumer) should be conducted on a short-term, mid-term, and long-term basis. Special considerations for the fuel industry include:
Technical Feasibility including legal/regulatory compliance
Transition Plan
Infrastructure Investment
Operating Financial Implications
Competing Actions from Oil Industry
Multi-national Business Strategies
Corporate Image
Feedstock Adequacy and Reliability
Lead Time
3.4. Auto Industry For the purposes of this checklist, the auto industry is comprised of automobile manufacturers, suppliers, and related entities. Their needs are similar to those of the fuel industry, meaning that they will invest in a major project when they can establish a viable business case that demonstrates a profitable return for the company’s stakeholders. Therefore, analyses of all aspects of the vehicles (e.g., materials used, manufacturing facilities, dealer networks, aftermarket repair facilities, and end-of-life recycling/disposal) should be conducted on a short-term, mid-term, and long-term basis. Special considerations for the auto industry include:
Technical Feasibility including legal/regulatory compliance
Transition Plan
Infrastructure Investment
Operating Financial Implications
Competing Actions from current auto and fuel industries
Multi-national Business Strategies
Corporate Image
Feedstock Adequacy and Reliability
Lead-Time
Consumer Acceptance
9
4. Country Landscapes
Since viability of different natural gas-derived fuel pathways is likely to vary across different geographic settings, six country-specific case studies were conducted that each demonstrate the widely varying scenarios for using natural gas as the basis for transportation fuel.
3 Key factors that play a role in the feasibility of natural gas or an
NG-derived transportation fuel include:
Natural gas production, consumption, reserves, and trade levels/practices
Size of NGV fleet and supporting infrastructure
Presence of fuel production plants (for domestic production)
Electricity generation mix
Governmental stance, through policy support and regulations
Market accelerators and barriers
Price of natural gas relative to traditional fuels Some countries – like Canada, China, and the United States – are leading fossil natural gas producers and consumers, while others, like Finland, rely 100% on imports or domestically produce biomethane. Israel’s newly discovered offshore natural gas reserves have shifted the country’s views on which transportation fuels may be most suitable. The countries also widely range in population, from China with 1.3 billion people (the world’s largest population) to Finland with 5.4 million (The World Bank, 2015). Countries with larger populations – like China and the United States – have the potential to make a higher overall global impact when transitioning to new fuels. However, the magnitude of implementing new fuels nationwide may be more challenging than for countries with smaller vehicle fleets. Geographically speaking, the case studies will cover three continents – Asia, Europe, and North America. The makeup of NGV fleets is quite different in the case study countries. With respect to drivetrains, passenger cars and other LDVs account for over half of each country’s NGV fleet. For Canada and Finland, LDVs account for over 80% of the NGV fleet; for Denmark and the United States, LDVs only account for 50-60% of the fleet. Natural gas refueling stations vary in prevalence; Denmark and Israel, for example, have hardly any natural gas refueling stations to support NGVs, while China houses over 24% of the world’s stations. Also, some countries have extensive natural gas pipeline networks to distribute fuel nationwide, while others rely heavily on roads to transport fuel. Also, the energy mix used by each country to produce electricity varies greatly, which can significantly impact emissions. Canada, Denmark, and Finland all use sizeable amounts (40-65%) of renewables in their electricity generation production, while Israel, China, and the United States largely rely on fossil fuels. From an economic standpoint, the relative retail cost of natural gas for the consumer varies significantly across countries, and even the cost of conventional fuels (i.e. gasoline and diesel) varies by a factor of two across some of the case study countries. Consumers in Canada, China, and the United States, for example, benefit from relatively low CNG prices, while consumers in Denmark and Finland pay roughly double. To help increase use of alternative fuels into their fleets, some countries have established supportive vehicle incentives – like China, Denmark and the United States – while others (e.g., Israel) prefer to allow the market to play out naturally.
4.1. Canada With a population of 35 million people, Canada consumed over 89.5 billion m
3 of natural gas in 2013, ranking
eighth in the world with respect to natural gas consumption. Natural gas production in Canada totaled 145.2 billion
3 The six countries selected for case studies represent the six countries that contributed to this study either through cost
sharing, task sharing, or both. See Acknowledgements section for more detailed on participating organizations.
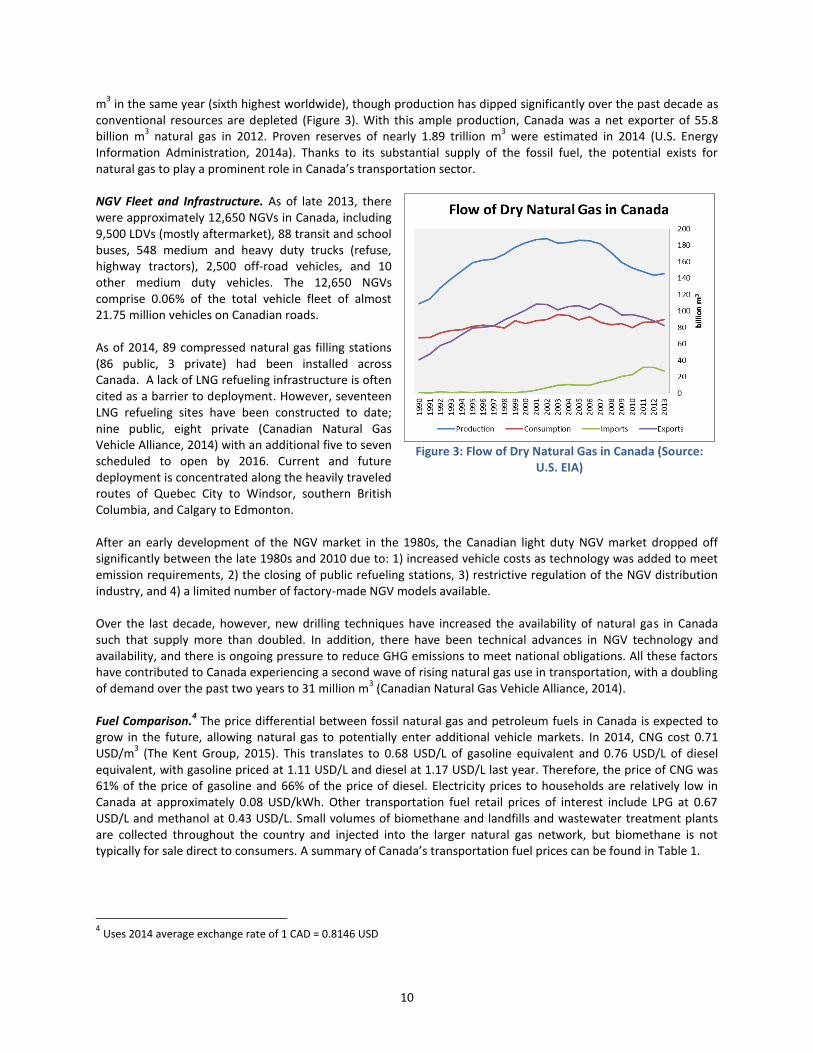
10
m3 in the same year (sixth highest worldwide), though production has dipped significantly over the past decade as
conventional resources are depleted (Figure 3). With this ample production, Canada was a net exporter of 55.8 billion m
3 natural gas in 2012. Proven reserves of nearly 1.89 trillion m
3 were estimated in 2014 (U.S. Energy
Information Administration, 2014a). Thanks to its substantial supply of the fossil fuel, the potential exists for natural gas to play a prominent role in Canada’s transportation sector. NGV Fleet and Infrastructure. As of late 2013, there were approximately 12,650 NGVs in Canada, including 9,500 LDVs (mostly aftermarket), 88 transit and school buses, 548 medium and heavy duty trucks (refuse, highway tractors), 2,500 off-road vehicles, and 10 other medium duty vehicles. The 12,650 NGVs comprise 0.06% of the total vehicle fleet of almost 21.75 million vehicles on Canadian roads. As of 2014, 89 compressed natural gas filling stations (86 public, 3 private) had been installed across Canada. A lack of LNG refueling infrastructure is often cited as a barrier to deployment. However, seventeen LNG refueling sites have been constructed to date; nine public, eight private (Canadian Natural Gas Vehicle Alliance, 2014) with an additional five to seven scheduled to open by 2016. Current and future deployment is concentrated along the heavily traveled routes of Quebec City to Windsor, southern British Columbia, and Calgary to Edmonton. After an early development of the NGV market in the 1980s, the Canadian light duty NGV market dropped off significantly between the late 1980s and 2010 due to: 1) increased vehicle costs as technology was added to meet emission requirements, 2) the closing of public refueling stations, 3) restrictive regulation of the NGV distribution industry, and 4) a limited number of factory-made NGV models available. Over the last decade, however, new drilling techniques have increased the availability of natural gas in Canada such that supply more than doubled. In addition, there have been technical advances in NGV technology and availability, and there is ongoing pressure to reduce GHG emissions to meet national obligations. All these factors have contributed to Canada experiencing a second wave of rising natural gas use in transportation, with a doubling of demand over the past two years to 31 million m
3 (Canadian Natural Gas Vehicle Alliance, 2014).
Fuel Comparison.
4 The price differential between fossil natural gas and petroleum fuels in Canada is expected to
grow in the future, allowing natural gas to potentially enter additional vehicle markets. In 2014, CNG cost 0.71 USD/m
3 (The Kent Group, 2015). This translates to 0.68 USD/L of gasoline equivalent and 0.76 USD/L of diesel
equivalent, with gasoline priced at 1.11 USD/L and diesel at 1.17 USD/L last year. Therefore, the price of CNG was 61% of the price of gasoline and 66% of the price of diesel. Electricity prices to households are relatively low in Canada at approximately 0.08 USD/kWh. Other transportation fuel retail prices of interest include LPG at 0.67 USD/L and methanol at 0.43 USD/L. Small volumes of biomethane and landfills and wastewater treatment plants are collected throughout the country and injected into the larger natural gas network, but biomethane is not typically for sale direct to consumers. A summary of Canada’s transportation fuel prices can be found in Table 1.
4 Uses 2014 average exchange rate of 1 CAD = 0.8146 USD
Figure 3: Flow of Dry Natural Gas in Canada (Source: U.S. EIA)
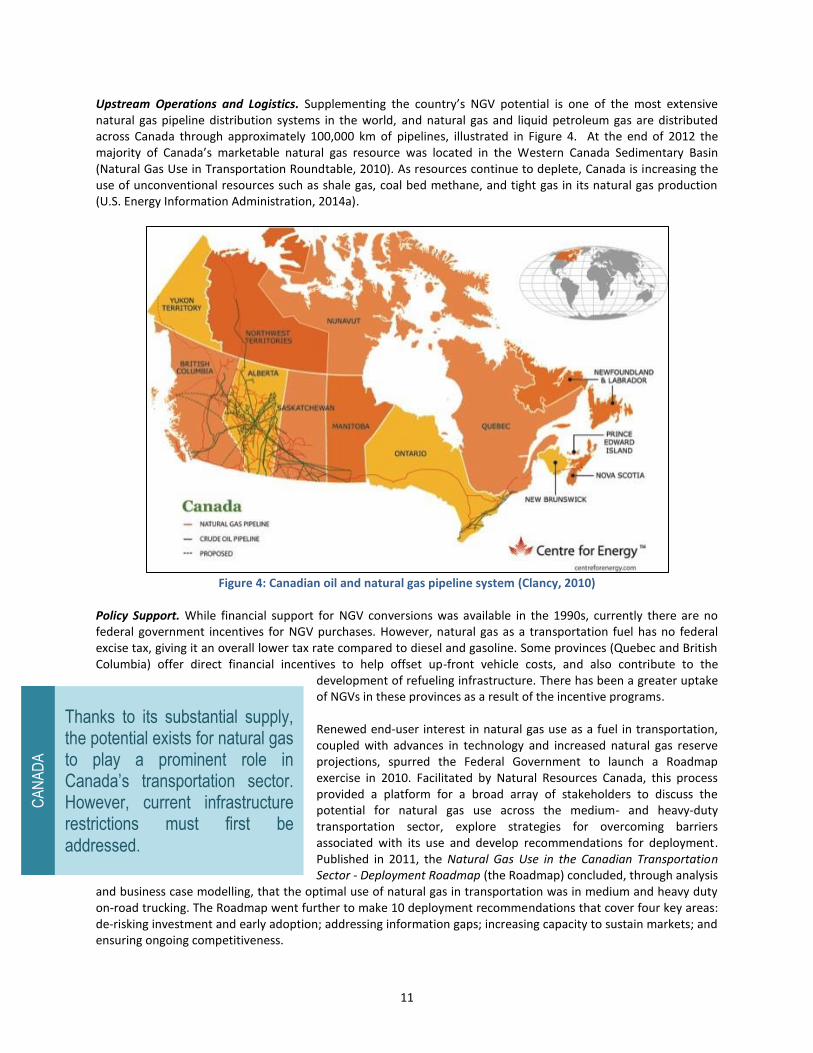
11
Thanks to its substantial supply, the potential exists for natural gas to play a prominent role in Canada’s transportation sector. However, current infrastructure restrictions must first be addressed.
CA
NA
DA
Upstream Operations and Logistics. Supplementing the country’s NGV potential is one of the most extensive natural gas pipeline distribution systems in the world, and natural gas and liquid petroleum gas are distributed across Canada through approximately 100,000 km of pipelines, illustrated in Figure 4. At the end of 2012 the majority of Canada’s marketable natural gas resource was located in the Western Canada Sedimentary Basin (Natural Gas Use in Transportation Roundtable, 2010). As resources continue to deplete, Canada is increasing the use of unconventional resources such as shale gas, coal bed methane, and tight gas in its natural gas production (U.S. Energy Information Administration, 2014a).
Figure 4: Canadian oil and natural gas pipeline system (Clancy, 2010)
Policy Support. While financial support for NGV conversions was available in the 1990s, currently there are no federal government incentives for NGV purchases. However, natural gas as a transportation fuel has no federal excise tax, giving it an overall lower tax rate compared to diesel and gasoline. Some provinces (Quebec and British Columbia) offer direct financial incentives to help offset up-front vehicle costs, and also contribute to the
development of refueling infrastructure. There has been a greater uptake of NGVs in these provinces as a result of the incentive programs. Renewed end-user interest in natural gas use as a fuel in transportation, coupled with advances in technology and increased natural gas reserve projections, spurred the Federal Government to launch a Roadmap exercise in 2010. Facilitated by Natural Resources Canada, this process provided a platform for a broad array of stakeholders to discuss the potential for natural gas use across the medium- and heavy-duty transportation sector, explore strategies for overcoming barriers associated with its use and develop recommendations for deployment. Published in 2011, the Natural Gas Use in the Canadian Transportation Sector - Deployment Roadmap (the Roadmap) concluded, through analysis
and business case modelling, that the optimal use of natural gas in transportation was in medium and heavy duty on-road trucking. The Roadmap went further to make 10 deployment recommendations that cover four key areas: de-risking investment and early adoption; addressing information gaps; increasing capacity to sustain markets; and ensuring ongoing competitiveness.
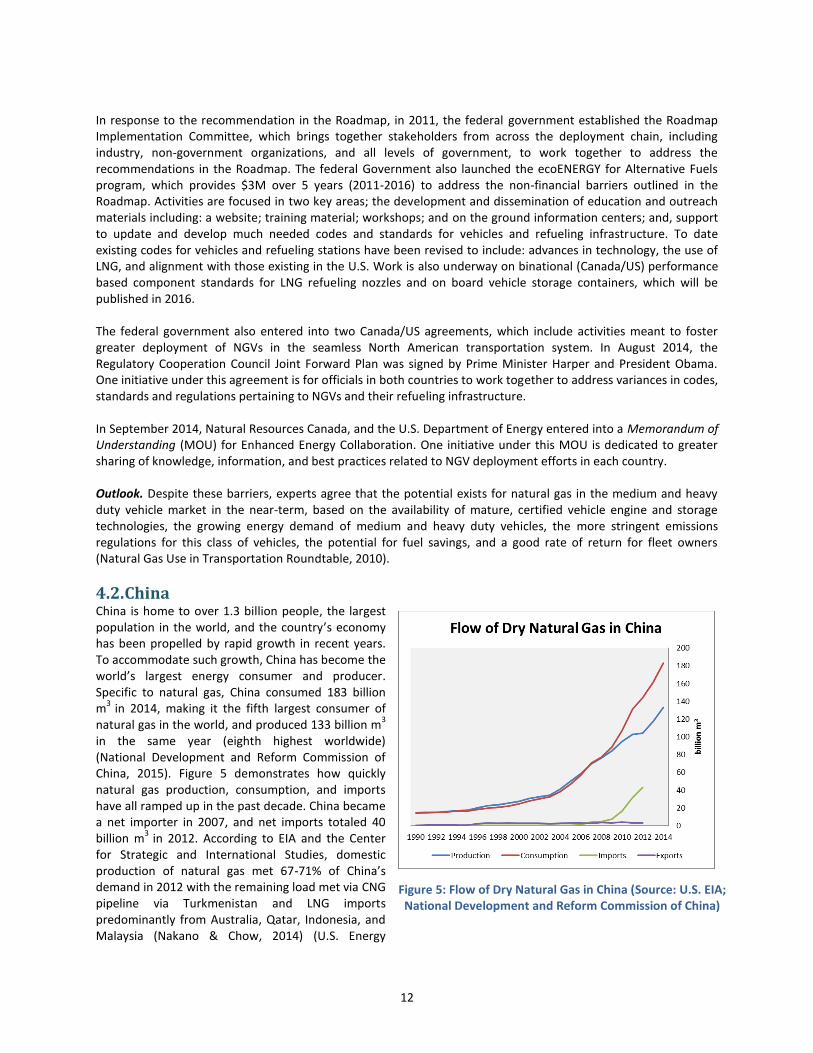
12
In response to the recommendation in the Roadmap, in 2011, the federal government established the Roadmap Implementation Committee, which brings together stakeholders from across the deployment chain, including industry, non-government organizations, and all levels of government, to work together to address the recommendations in the Roadmap. The federal Government also launched the ecoENERGY for Alternative Fuels program, which provides $3M over 5 years (2011-2016) to address the non-financial barriers outlined in the Roadmap. Activities are focused in two key areas; the development and dissemination of education and outreach materials including: a website; training material; workshops; and on the ground information centers; and, support to update and develop much needed codes and standards for vehicles and refueling infrastructure. To date existing codes for vehicles and refueling stations have been revised to include: advances in technology, the use of LNG, and alignment with those existing in the U.S. Work is also underway on binational (Canada/US) performance based component standards for LNG refueling nozzles and on board vehicle storage containers, which will be published in 2016. The federal government also entered into two Canada/US agreements, which include activities meant to foster greater deployment of NGVs in the seamless North American transportation system. In August 2014, the Regulatory Cooperation Council Joint Forward Plan was signed by Prime Minister Harper and President Obama. One initiative under this agreement is for officials in both countries to work together to address variances in codes, standards and regulations pertaining to NGVs and their refueling infrastructure. In September 2014, Natural Resources Canada, and the U.S. Department of Energy entered into a Memorandum of Understanding (MOU) for Enhanced Energy Collaboration. One initiative under this MOU is dedicated to greater sharing of knowledge, information, and best practices related to NGV deployment efforts in each country. Outlook. Despite these barriers, experts agree that the potential exists for natural gas in the medium and heavy duty vehicle market in the near-term, based on the availability of mature, certified vehicle engine and storage technologies, the growing energy demand of medium and heavy duty vehicles, the more stringent emissions regulations for this class of vehicles, the potential for fuel savings, and a good rate of return for fleet owners (Natural Gas Use in Transportation Roundtable, 2010).
4.2. China China is home to over 1.3 billion people, the largest population in the world, and the country’s economy has been propelled by rapid growth in recent years. To accommodate such growth, China has become the world’s largest energy consumer and producer. Specific to natural gas, China consumed 183 billion m
3 in 2014, making it the fifth largest consumer of
natural gas in the world, and produced 133 billion m3
in the same year (eighth highest worldwide) (National Development and Reform Commission of China, 2015). Figure 5 demonstrates how quickly natural gas production, consumption, and imports have all ramped up in the past decade. China became a net importer in 2007, and net imports totaled 40 billion m
3 in 2012. According to EIA and the Center
for Strategic and International Studies, domestic production of natural gas met 67-71% of China’s demand in 2012 with the remaining load met via CNG pipeline via Turkmenistan and LNG imports predominantly from Australia, Qatar, Indonesia, and Malaysia (Nakano & Chow, 2014) (U.S. Energy
Figure 5: Flow of Dry Natural Gas in China (Source: U.S. EIA; National Development and Reform Commission of China)
13
Natural gas use in China has climbed sharply in recent years as it works to transition to cleaner fuel and energy sources. In parallel, the presence of NGVs has also skyrocketed with no sign of slowing down.
CH
INA
Information Administration, 2014b) (International Energy Agency, 2012). China possesses sizable conventional and unconventional natural gas reserves, including the world’s largest shale gas resources. According to EIA estimates, China’s proven natural gas reserves stood at 4.4 trillion m
3 in 2014 (U.S.
Energy Information Administration, 2014b). NGV Fleet and Infrastructure. Of the approximately 109 million vehicles on Chinese roads in 2012, almost 4 million of them were NGVs (OICA, 2012), comprising 3.67% of the total vehicle fleet. These 4 million NGVs are broken down into 2.6 million cars/LDVs, 1 million medium and heavy duty buses, 330,000 medium and heavy duty trucks, and 50,000 other (NGV Communications Group, 2015). This higher than average NGV penetration rate, which has accelerated rapidly starting in 2010, reflects the fact that while natural gas prices in China are historically higher than in the United States, the incremental cost of NGVs is much lower, allowing buyers to more quickly recoup the extra cost in certain cases (Li, Ip, & Suttikulpanich, 2012). Nationwide, in 2013, approximately 600,000 taxis run on dual fuel (natural gas and gasoline) (China Gas Association, 2012). To expand access of available natural gas to vehicles, China has been ramping up construction of natural gas fueling infrastructure. As of 2014, over 6,500 natural gas filling stations (6,300 public, 200 private) had been installed across China to support these NGVs (NGV Communications Group, 2015). China’s transportation authority hopes to have this number up to 12,000 by 2020 (Alton, 2013). Looking specifically at supporting infrastructure for LNG, six LNG terminals were in operation in 2013 with a total capacity of 29.3 billion m
3, and eight additional
terminals are under construction (Houser & Bao, 2013). Thirty-five million tons of LNG receiving capacity was in place at the end of 2014 (Office of the Federal Coordinator, 2015). Fuel Comparison. Like in Canada, the price differential between natural gas and petroleum fuels is quite large, potentially favoring natural gas use in the transportation sector. In 2014, conventional CNG was available at a relatively low cost of 0.67 USD/m
3 (China Economic Times, 2015). This translates to 0.63 USD/L of gasoline
equivalent and 0.73 USD/L of diesel equivalent, with gasoline priced at 1.31 USD/L and diesel at 1.35 USD/L last year. Therefore, the price of CNG was only 48% of the price of gasoline and 54% of the price of diesel. Biomethane (primarily derived from LFG) is also available to consumers for 0.41 USD/m
3. Electricity prices to
households are relatively low in China at approximately 0.08 USD/kWh. Other transportation fuel retail prices of interest include LPG at 0.25 USD/L and methanol at 0.38 USD/L. A summary of China’s transportation fuel prices can be found in Table 1. Upstream Operations and Logistics. Despite rapid growth, China’s NGV market has been constrained by inadequate fueling infrastructure, compounded by limited natural gas supply. When supply cannot cover demand, such as in the peak heating season, priority for natural gas is given to the residential sector (Bloomberg, 2014). Supply is especially a
factor in eastern and southern China (Chen, 2013). As a result, LPG vehicles dominate the clean vehicle market in Hong Kong and Guangzhou; this proves to be the case only in China’s southern provinces. The country is working to relieve the bottleneck around natural gas supply by constructing new pipelines and new long-term supply contracts (Li, Ip, & Suttikulpanich, 2012). Three main pipeline corridors supply imported natural gas from Central Asia, Myanmar, and Russia as shown in Figure 6 (Chen, 2013).
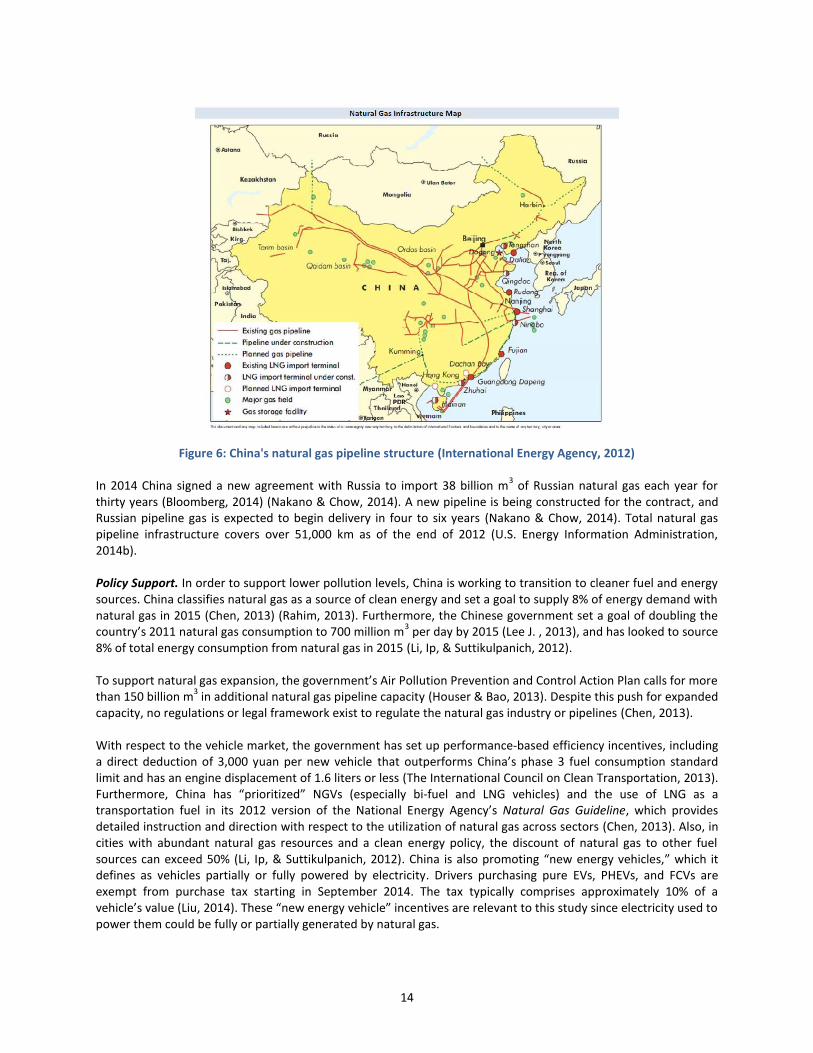
14
Figure 6: China's natural gas pipeline structure (International Energy Agency, 2012)
In 2014 China signed a new agreement with Russia to import 38 billion m
3 of Russian natural gas each year for
thirty years (Bloomberg, 2014) (Nakano & Chow, 2014). A new pipeline is being constructed for the contract, and Russian pipeline gas is expected to begin delivery in four to six years (Nakano & Chow, 2014). Total natural gas pipeline infrastructure covers over 51,000 km as of the end of 2012 (U.S. Energy Information Administration, 2014b). Policy Support. In order to support lower pollution levels, China is working to transition to cleaner fuel and energy sources. China classifies natural gas as a source of clean energy and set a goal to supply 8% of energy demand with natural gas in 2015 (Chen, 2013) (Rahim, 2013). Furthermore, the Chinese government set a goal of doubling the country’s 2011 natural gas consumption to 700 million m
3 per day by 2015 (Lee J. , 2013), and has looked to source
8% of total energy consumption from natural gas in 2015 (Li, Ip, & Suttikulpanich, 2012). To support natural gas expansion, the government’s Air Pollution Prevention and Control Action Plan calls for more than 150 billion m
3 in additional natural gas pipeline capacity (Houser & Bao, 2013). Despite this push for expanded
capacity, no regulations or legal framework exist to regulate the natural gas industry or pipelines (Chen, 2013). With respect to the vehicle market, the government has set up performance-based efficiency incentives, including a direct deduction of 3,000 yuan per new vehicle that outperforms China’s phase 3 fuel consumption standard limit and has an engine displacement of 1.6 liters or less (The International Council on Clean Transportation, 2013). Furthermore, China has “prioritized” NGVs (especially bi-fuel and LNG vehicles) and the use of LNG as a transportation fuel in its 2012 version of the National Energy Agency’s Natural Gas Guideline, which provides detailed instruction and direction with respect to the utilization of natural gas across sectors (Chen, 2013). Also, in cities with abundant natural gas resources and a clean energy policy, the discount of natural gas to other fuel sources can exceed 50% (Li, Ip, & Suttikulpanich, 2012). China is also promoting “new energy vehicles,” which it defines as vehicles partially or fully powered by electricity. Drivers purchasing pure EVs, PHEVs, and FCVs are exempt from purchase tax starting in September 2014. The tax typically comprises approximately 10% of a vehicle’s value (Liu, 2014). These “new energy vehicle” incentives are relevant to this study since electricity used to power them could be fully or partially generated by natural gas.
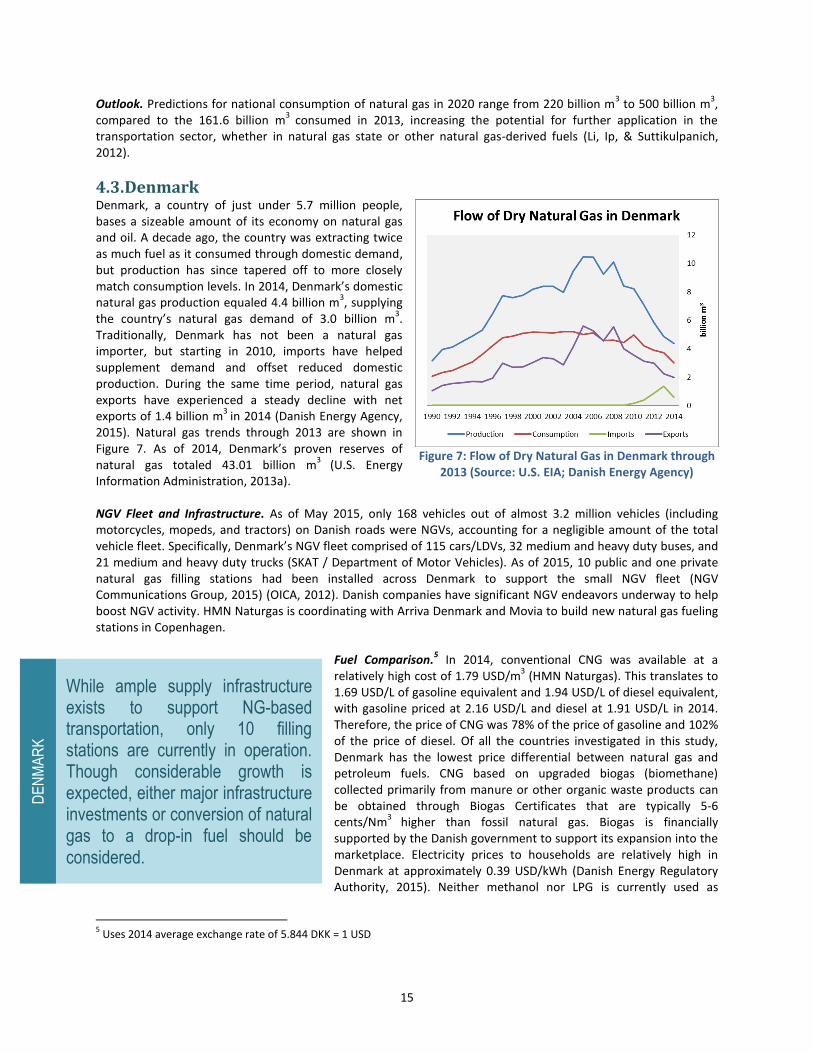
15
While ample supply infrastructure exists to support NG-based transportation, only 10 filling stations are currently in operation. Though considerable growth is expected, either major infrastructure investments or conversion of natural gas to a drop-in fuel should be considered.
DE
NM
AR
K
Outlook. Predictions for national consumption of natural gas in 2020 range from 220 billion m3 to 500 billion m
3,
compared to the 161.6 billion m3
consumed in 2013, increasing the potential for further application in the transportation sector, whether in natural gas state or other natural gas-derived fuels (Li, Ip, & Suttikulpanich, 2012).
4.3. Denmark Denmark, a country of just under 5.7 million people, bases a sizeable amount of its economy on natural gas and oil. A decade ago, the country was extracting twice as much fuel as it consumed through domestic demand, but production has since tapered off to more closely match consumption levels. In 2014, Denmark’s domestic natural gas production equaled 4.4 billion m
3, supplying
the country’s natural gas demand of 3.0 billion m3.
Traditionally, Denmark has not been a natural gas importer, but starting in 2010, imports have helped supplement demand and offset reduced domestic production. During the same time period, natural gas exports have experienced a steady decline with net exports of 1.4 billion m
3 in 2014 (Danish Energy Agency,
2015). Natural gas trends through 2013 are shown in Figure 7. As of 2014, Denmark’s proven reserves of natural gas totaled 43.01 billion m
3 (U.S. Energy
Information Administration, 2013a). NGV Fleet and Infrastructure. As of May 2015, only 168 vehicles out of almost 3.2 million vehicles (including motorcycles, mopeds, and tractors) on Danish roads were NGVs, accounting for a negligible amount of the total vehicle fleet. Specifically, Denmark’s NGV fleet comprised of 115 cars/LDVs, 32 medium and heavy duty buses, and 21 medium and heavy duty trucks (SKAT / Department of Motor Vehicles). As of 2015, 10 public and one private natural gas filling stations had been installed across Denmark to support the small NGV fleet (NGV Communications Group, 2015) (OICA, 2012). Danish companies have significant NGV endeavors underway to help boost NGV activity. HMN Naturgas is coordinating with Arriva Denmark and Movia to build new natural gas fueling stations in Copenhagen.
Fuel Comparison.5 In 2014, conventional CNG was available at a
relatively high cost of 1.79 USD/m3 (HMN Naturgas). This translates to
1.69 USD/L of gasoline equivalent and 1.94 USD/L of diesel equivalent, with gasoline priced at 2.16 USD/L and diesel at 1.91 USD/L in 2014. Therefore, the price of CNG was 78% of the price of gasoline and 102% of the price of diesel. Of all the countries investigated in this study, Denmark has the lowest price differential between natural gas and petroleum fuels. CNG based on upgraded biogas (biomethane) collected primarily from manure or other organic waste products can be obtained through Biogas Certificates that are typically 5-6 cents/Nm
3 higher than fossil natural gas. Biogas is financially
supported by the Danish government to support its expansion into the marketplace. Electricity prices to households are relatively high in Denmark at approximately 0.39 USD/kWh (Danish Energy Regulatory Authority, 2015). Neither methanol nor LPG is currently used as
5 Uses 2014 average exchange rate of 5.844 DKK = 1 USD
Figure 7: Flow of Dry Natural Gas in Denmark through 2013 (Source: U.S. EIA; Danish Energy Agency)
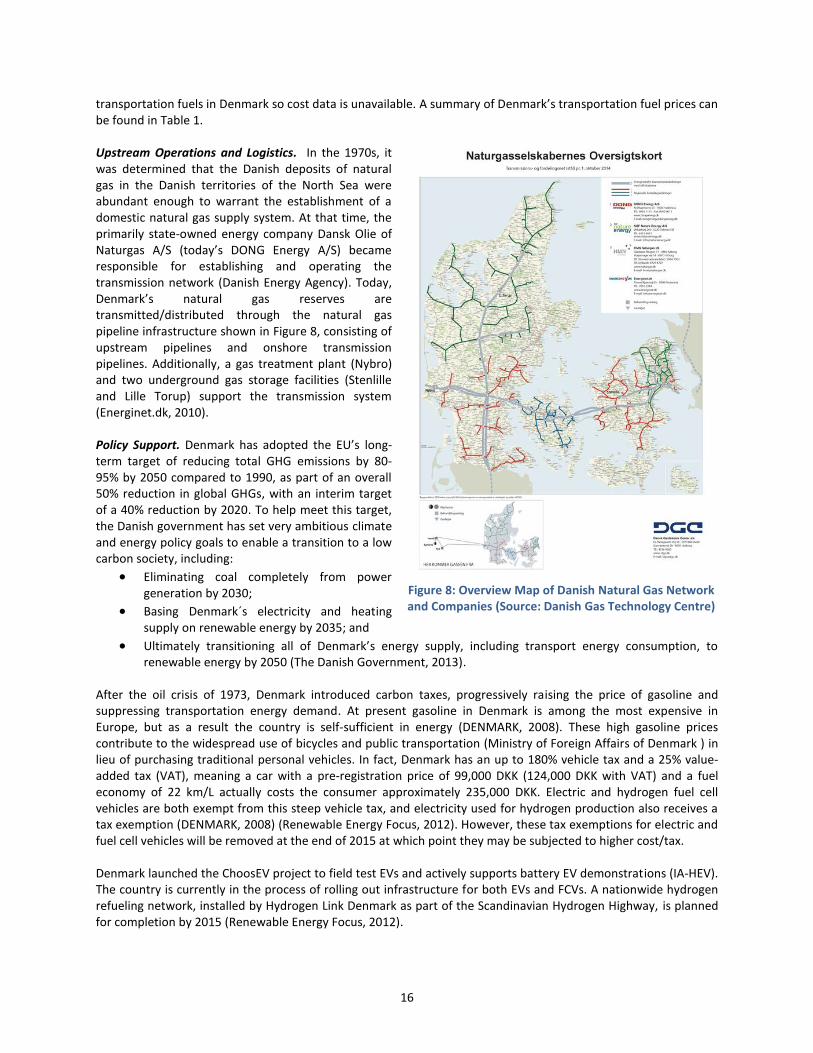
16
transportation fuels in Denmark so cost data is unavailable. A summary of Denmark’s transportation fuel prices can be found in Table 1. Upstream Operations and Logistics. In the 1970s, it was determined that the Danish deposits of natural gas in the Danish territories of the North Sea were abundant enough to warrant the establishment of a domestic natural gas supply system. At that time, the primarily state-owned energy company Dansk Olie of Naturgas A/S (today’s DONG Energy A/S) became responsible for establishing and operating the transmission network (Danish Energy Agency). Today, Denmark’s natural gas reserves are transmitted/distributed through the natural gas pipeline infrastructure shown in Figure 8, consisting of upstream pipelines and onshore transmission pipelines. Additionally, a gas treatment plant (Nybro) and two underground gas storage facilities (Stenlille and Lille Torup) support the transmission system (Energinet.dk, 2010). Policy Support. Denmark has adopted the EU’s long-term target of reducing total GHG emissions by 80-95% by 2050 compared to 1990, as part of an overall 50% reduction in global GHGs, with an interim target of a 40% reduction by 2020. To help meet this target, the Danish government has set very ambitious climate and energy policy goals to enable a transition to a low carbon society, including:
Eliminating coal completely from power generation by 2030;
Basing Denmark´s electricity and heating supply on renewable energy by 2035; and
Ultimately transitioning all of Denmark’s energy supply, including transport energy consumption, to renewable energy by 2050 (The Danish Government, 2013).
After the oil crisis of 1973, Denmark introduced carbon taxes, progressively raising the price of gasoline and suppressing transportation energy demand. At present gasoline in Denmark is among the most expensive in Europe, but as a result the country is self-sufficient in energy (DENMARK, 2008). These high gasoline prices contribute to the widespread use of bicycles and public transportation (Ministry of Foreign Affairs of Denmark ) in lieu of purchasing traditional personal vehicles. In fact, Denmark has an up to 180% vehicle tax and a 25% value-added tax (VAT), meaning a car with a pre-registration price of 99,000 DKK (124,000 DKK with VAT) and a fuel economy of 22 km/L actually costs the consumer approximately 235,000 DKK. Electric and hydrogen fuel cell vehicles are both exempt from this steep vehicle tax, and electricity used for hydrogen production also receives a tax exemption (DENMARK, 2008) (Renewable Energy Focus, 2012). However, these tax exemptions for electric and fuel cell vehicles will be removed at the end of 2015 at which point they may be subjected to higher cost/tax. Denmark launched the ChoosEV project to field test EVs and actively supports battery EV demonstrations (IA-HEV). The country is currently in the process of rolling out infrastructure for both EVs and FCVs. A nationwide hydrogen refueling network, installed by Hydrogen Link Denmark as part of the Scandinavian Hydrogen Highway, is planned for completion by 2015 (Renewable Energy Focus, 2012).
Figure 8: Overview Map of Danish Natural Gas Network and Companies (Source: Danish Gas Technology Centre)
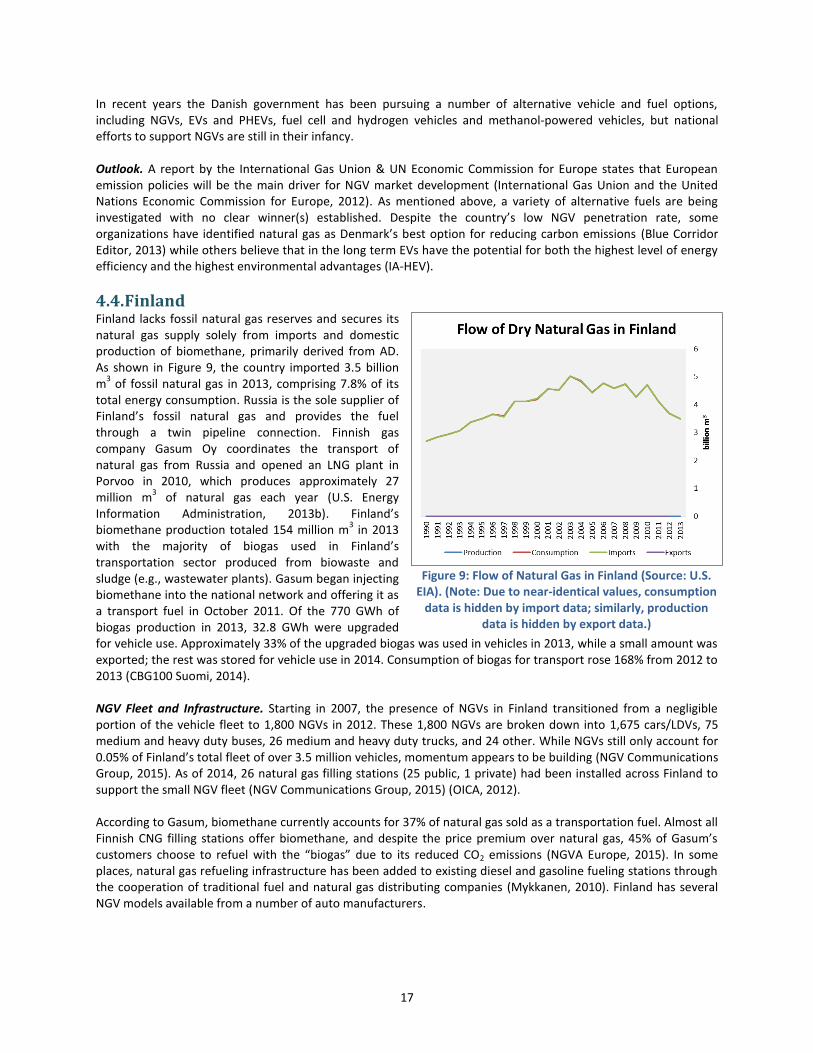
17
In recent years the Danish government has been pursuing a number of alternative vehicle and fuel options, including NGVs, EVs and PHEVs, fuel cell and hydrogen vehicles and methanol-powered vehicles, but national efforts to support NGVs are still in their infancy. Outlook. A report by the International Gas Union & UN Economic Commission for Europe states that European emission policies will be the main driver for NGV market development (International Gas Union and the United Nations Economic Commission for Europe, 2012). As mentioned above, a variety of alternative fuels are being investigated with no clear winner(s) established. Despite the country’s low NGV penetration rate, some organizations have identified natural gas as Denmark’s best option for reducing carbon emissions (Blue Corridor Editor, 2013) while others believe that in the long term EVs have the potential for both the highest level of energy efficiency and the highest environmental advantages (IA-HEV).
4.4. Finland Finland lacks fossil natural gas reserves and secures its natural gas supply solely from imports and domestic production of biomethane, primarily derived from AD. As shown in Figure 9, the country imported 3.5 billion m
3 of fossil natural gas in 2013, comprising 7.8% of its
total energy consumption. Russia is the sole supplier of Finland’s fossil natural gas and provides the fuel through a twin pipeline connection. Finnish gas company Gasum Oy coordinates the transport of natural gas from Russia and opened an LNG plant in Porvoo in 2010, which produces approximately 27 million m
3 of natural gas each year (U.S. Energy
Information Administration, 2013b). Finland’s biomethane production totaled 154 million m
3 in 2013
with the majority of biogas used in Finland’s transportation sector produced from biowaste and sludge (e.g., wastewater plants). Gasum began injecting biomethane into the national network and offering it as a transport fuel in October 2011. Of the 770 GWh of biogas production in 2013, 32.8 GWh were upgraded for vehicle use. Approximately 33% of the upgraded biogas was used in vehicles in 2013, while a small amount was exported; the rest was stored for vehicle use in 2014. Consumption of biogas for transport rose 168% from 2012 to 2013 (CBG100 Suomi, 2014). NGV Fleet and Infrastructure. Starting in 2007, the presence of NGVs in Finland transitioned from a negligible portion of the vehicle fleet to 1,800 NGVs in 2012. These 1,800 NGVs are broken down into 1,675 cars/LDVs, 75 medium and heavy duty buses, 26 medium and heavy duty trucks, and 24 other. While NGVs still only account for 0.05% of Finland’s total fleet of over 3.5 million vehicles, momentum appears to be building (NGV Communications Group, 2015). As of 2014, 26 natural gas filling stations (25 public, 1 private) had been installed across Finland to support the small NGV fleet (NGV Communications Group, 2015) (OICA, 2012). According to Gasum, biomethane currently accounts for 37% of natural gas sold as a transportation fuel. Almost all Finnish CNG filling stations offer biomethane, and despite the price premium over natural gas, 45% of Gasum’s customers choose to refuel with the “biogas” due to its reduced CO2 emissions (NGVA Europe, 2015). In some places, natural gas refueling infrastructure has been added to existing diesel and gasoline fueling stations through the cooperation of traditional fuel and natural gas distributing companies (Mykkanen, 2010). Finland has several NGV models available from a number of auto manufacturers.
Figure 9: Flow of Natural Gas in Finland (Source: U.S. EIA). (Note: Due to near-identical values, consumption
data is hidden by import data; similarly, production data is hidden by export data.)
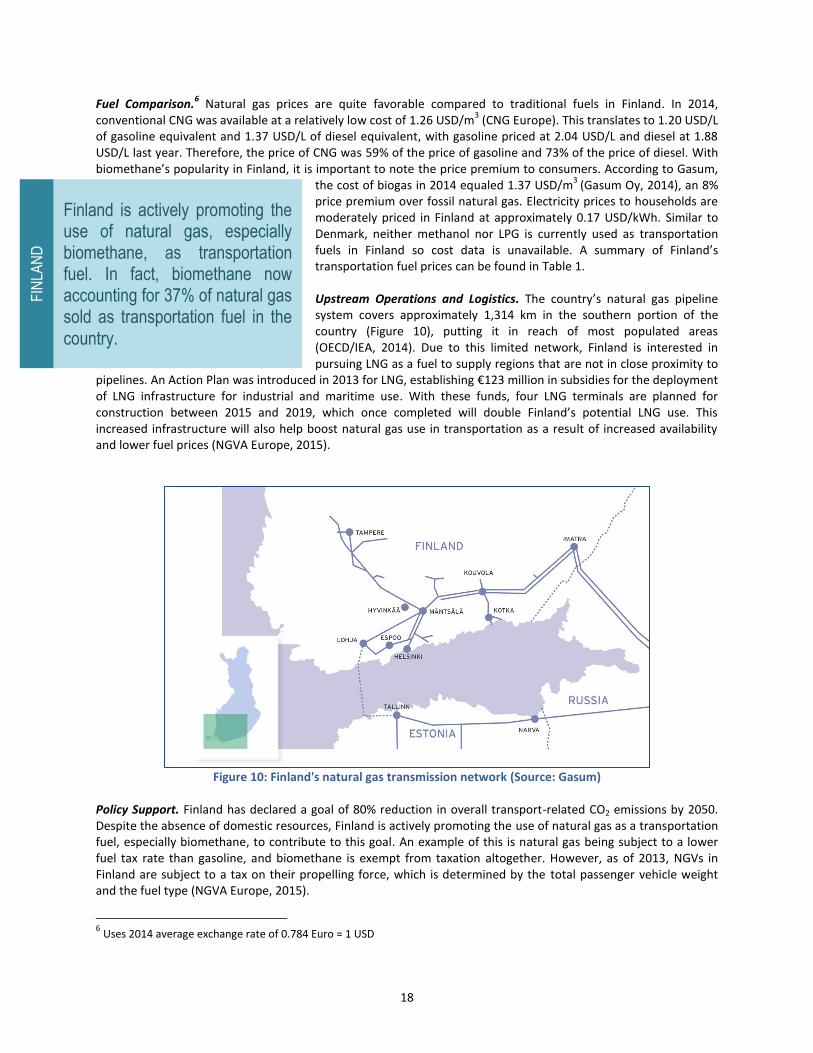
18
Finland is actively promoting the use of natural gas, especially biomethane, as transportation fuel. In fact, biomethane now accounting for 37% of natural gas sold as transportation fuel in the country.
FIN
LAN
D
Fuel Comparison.6 Natural gas prices are quite favorable compared to traditional fuels in Finland. In 2014,
conventional CNG was available at a relatively low cost of 1.26 USD/m3 (CNG Europe). This translates to 1.20 USD/L
of gasoline equivalent and 1.37 USD/L of diesel equivalent, with gasoline priced at 2.04 USD/L and diesel at 1.88 USD/L last year. Therefore, the price of CNG was 59% of the price of gasoline and 73% of the price of diesel. With biomethane’s popularity in Finland, it is important to note the price premium to consumers. According to Gasum,
the cost of biogas in 2014 equaled 1.37 USD/m3
(Gasum Oy, 2014), an 8% price premium over fossil natural gas. Electricity prices to households are moderately priced in Finland at approximately 0.17 USD/kWh. Similar to Denmark, neither methanol nor LPG is currently used as transportation fuels in Finland so cost data is unavailable. A summary of Finland’s transportation fuel prices can be found in Table 1. Upstream Operations and Logistics. The country’s natural gas pipeline system covers approximately 1,314 km in the southern portion of the country (Figure 10), putting it in reach of most populated areas (OECD/IEA, 2014). Due to this limited network, Finland is interested in pursuing LNG as a fuel to supply regions that are not in close proximity to
pipelines. An Action Plan was introduced in 2013 for LNG, establishing €123 million in subsidies for the deployment of LNG infrastructure for industrial and maritime use. With these funds, four LNG terminals are planned for construction between 2015 and 2019, which once completed will double Finland’s potential LNG use. This increased infrastructure will also help boost natural gas use in transportation as a result of increased availability and lower fuel prices (NGVA Europe, 2015).
Figure 10: Finland's natural gas transmission network (Source: Gasum)
Policy Support. Finland has declared a goal of 80% reduction in overall transport-related CO2 emissions by 2050. Despite the absence of domestic resources, Finland is actively promoting the use of natural gas as a transportation fuel, especially biomethane, to contribute to this goal. An example of this is natural gas being subject to a lower fuel tax rate than gasoline, and biomethane is exempt from taxation altogether. However, as of 2013, NGVs in Finland are subject to a tax on their propelling force, which is determined by the total passenger vehicle weight and the fuel type (NGVA Europe, 2015).
6 Uses 2014 average exchange rate of 0.784 Euro = 1 USD
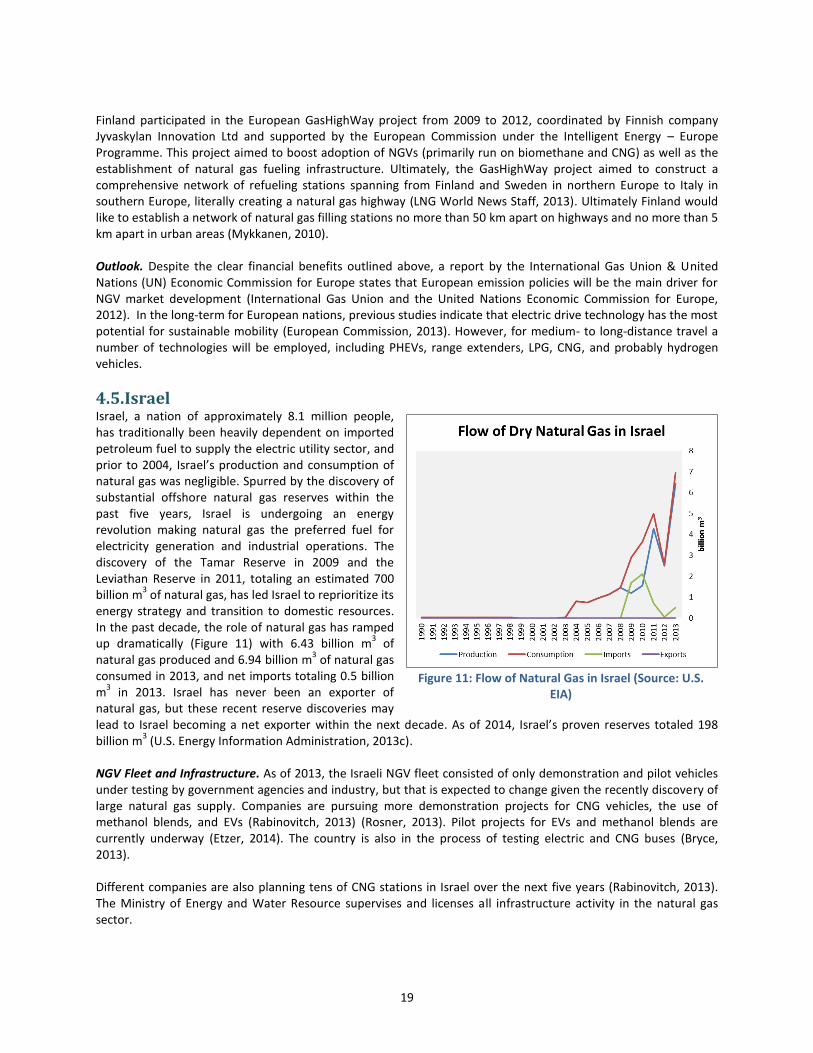
19
Finland participated in the European GasHighWay project from 2009 to 2012, coordinated by Finnish company Jyvaskylan Innovation Ltd and supported by the European Commission under the Intelligent Energy – Europe Programme. This project aimed to boost adoption of NGVs (primarily run on biomethane and CNG) as well as the establishment of natural gas fueling infrastructure. Ultimately, the GasHighWay project aimed to construct a comprehensive network of refueling stations spanning from Finland and Sweden in northern Europe to Italy in southern Europe, literally creating a natural gas highway (LNG World News Staff, 2013). Ultimately Finland would like to establish a network of natural gas filling stations no more than 50 km apart on highways and no more than 5 km apart in urban areas (Mykkanen, 2010). Outlook. Despite the clear financial benefits outlined above, a report by the International Gas Union & United Nations (UN) Economic Commission for Europe states that European emission policies will be the main driver for NGV market development (International Gas Union and the United Nations Economic Commission for Europe, 2012). In the long-term for European nations, previous studies indicate that electric drive technology has the most potential for sustainable mobility (European Commission, 2013). However, for medium- to long-distance travel a number of technologies will be employed, including PHEVs, range extenders, LPG, CNG, and probably hydrogen vehicles.
4.5. Israel Israel, a nation of approximately 8.1 million people, has traditionally been heavily dependent on imported petroleum fuel to supply the electric utility sector, and prior to 2004, Israel’s production and consumption of natural gas was negligible. Spurred by the discovery of substantial offshore natural gas reserves within the past five years, Israel is undergoing an energy revolution making natural gas the preferred fuel for electricity generation and industrial operations. The discovery of the Tamar Reserve in 2009 and the Leviathan Reserve in 2011, totaling an estimated 700 billion m
3 of natural gas, has led Israel to reprioritize its
energy strategy and transition to domestic resources. In the past decade, the role of natural gas has ramped up dramatically (Figure 11) with 6.43 billion m
3 of
natural gas produced and 6.94 billion m3 of natural gas
consumed in 2013, and net imports totaling 0.5 billion m
3 in 2013. Israel has never been an exporter of
natural gas, but these recent reserve discoveries may lead to Israel becoming a net exporter within the next decade. As of 2014, Israel’s proven reserves totaled 198 billion m
3 (U.S. Energy Information Administration, 2013c).
NGV Fleet and Infrastructure. As of 2013, the Israeli NGV fleet consisted of only demonstration and pilot vehicles under testing by government agencies and industry, but that is expected to change given the recently discovery of large natural gas supply. Companies are pursuing more demonstration projects for CNG vehicles, the use of methanol blends, and EVs (Rabinovitch, 2013) (Rosner, 2013). Pilot projects for EVs and methanol blends are currently underway (Etzer, 2014). The country is also in the process of testing electric and CNG buses (Bryce, 2013). Different companies are also planning tens of CNG stations in Israel over the next five years (Rabinovitch, 2013). The Ministry of Energy and Water Resource supervises and licenses all infrastructure activity in the natural gas sector.
Figure 11: Flow of Natural Gas in Israel (Source: U.S. EIA)
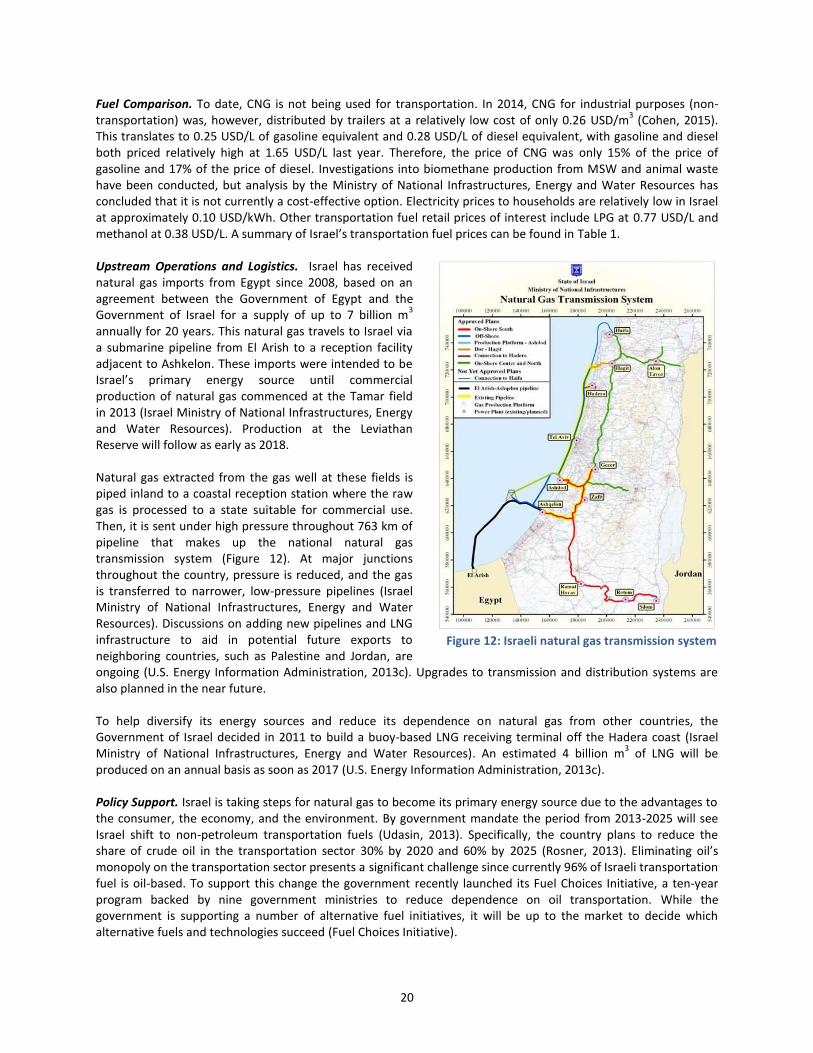
20
Fuel Comparison. To date, CNG is not being used for transportation. In 2014, CNG for industrial purposes (non-transportation) was, however, distributed by trailers at a relatively low cost of only 0.26 USD/m
3 (Cohen, 2015).
This translates to 0.25 USD/L of gasoline equivalent and 0.28 USD/L of diesel equivalent, with gasoline and diesel both priced relatively high at 1.65 USD/L last year. Therefore, the price of CNG was only 15% of the price of gasoline and 17% of the price of diesel. Investigations into biomethane production from MSW and animal waste have been conducted, but analysis by the Ministry of National Infrastructures, Energy and Water Resources has concluded that it is not currently a cost-effective option. Electricity prices to households are relatively low in Israel at approximately 0.10 USD/kWh. Other transportation fuel retail prices of interest include LPG at 0.77 USD/L and methanol at 0.38 USD/L. A summary of Israel’s transportation fuel prices can be found in Table 1. Upstream Operations and Logistics. Israel has received natural gas imports from Egypt since 2008, based on an agreement between the Government of Egypt and the Government of Israel for a supply of up to 7 billion m
3
annually for 20 years. This natural gas travels to Israel via a submarine pipeline from El Arish to a reception facility adjacent to Ashkelon. These imports were intended to be Israel’s primary energy source until commercial production of natural gas commenced at the Tamar field in 2013 (Israel Ministry of National Infrastructures, Energy and Water Resources). Production at the Leviathan Reserve will follow as early as 2018.
Natural gas extracted from the gas well at these fields is piped inland to a coastal reception station where the raw gas is processed to a state suitable for commercial use. Then, it is sent under high pressure throughout 763 km of pipeline that makes up the national natural gas transmission system (Figure 12). At major junctions throughout the country, pressure is reduced, and the gas is transferred to narrower, low-pressure pipelines (Israel Ministry of National Infrastructures, Energy and Water Resources). Discussions on adding new pipelines and LNG infrastructure to aid in potential future exports to neighboring countries, such as Palestine and Jordan, are ongoing (U.S. Energy Information Administration, 2013c). Upgrades to transmission and distribution systems are also planned in the near future. To help diversify its energy sources and reduce its dependence on natural gas from other countries, the Government of Israel decided in 2011 to build a buoy-based LNG receiving terminal off the Hadera coast (Israel Ministry of National Infrastructures, Energy and Water Resources). An estimated 4 billion m
3 of LNG will be
produced on an annual basis as soon as 2017 (U.S. Energy Information Administration, 2013c). Policy Support. Israel is taking steps for natural gas to become its primary energy source due to the advantages to the consumer, the economy, and the environment. By government mandate the period from 2013-2025 will see Israel shift to non-petroleum transportation fuels (Udasin, 2013). Specifically, the country plans to reduce the share of crude oil in the transportation sector 30% by 2020 and 60% by 2025 (Rosner, 2013). Eliminating oil’s monopoly on the transportation sector presents a significant challenge since currently 96% of Israeli transportation fuel is oil-based. To support this change the government recently launched its Fuel Choices Initiative, a ten-year program backed by nine government ministries to reduce dependence on oil transportation. While the government is supporting a number of alternative fuel initiatives, it will be up to the market to decide which alternative fuels and technologies succeed (Fuel Choices Initiative).
Figure 12: Israeli natural gas transmission system
21
Spurred by the recent discovery of substantial offshore natural gas reserves, Israel is undergoing an energy revolution, which may play a vital role in its self-sufficiency and lead to the redesign of the vehicle fleet.
ISR
AE
L
To spur purchases of more environmentally friendly vehicles, Israel changed the tax rates imposed on the purchase of vehicles in recent years in order to reflect the air pollution emissions. In 2009, the recommendations of an inter-ministerial committee (with the participation of the Ministries of Finance, Transport and Road Safety, National Infrastructures, and Environmental Protection) to implement a “green” reform in the taxation of private vehicles came into effect. In accordance with the recommendations, the average tax rate remained as it was, but a scale of purchase tax rates was created based on 15 pollution ratings. Within this framework, the base purchase tax rate was raised from 72–75 percent to up to 90 percent, before a tax benefit appropriate to the level of pollution of each model.
7 The actual tax rates—after the benefit—ranged between 30 and 83 percent. As a result, the prices of
less polluting vehicles were significantly lowered, while vehicles that pollute more became more expensive (Bank of Israel, 2014). Later, a January 2013 Government resolution directed the Israel Tax Authority to organize an inter-departmental committee to look at the relevant taxation issues regarding the diversification of energy resources for the transportation sector. The committee's mandate is to formulate a new differentiated taxation policy for the
three fields of energy for transportation: infrastructure, fuel types and motor vehicles. Other government efforts include a board established by the Ministry of Energy & Water Resources to incorporate fuels derived from natural gas, such as CNG, GTL and methanol; a 2013 directive by the Minister of National Infrastructure permitting CNG use in vehicles; and methanol legislation, which is currently under development (Fuel Choices Initiative) (Bryce, 2013). The national government has also instructed the Transportation Ministry to coordinate with automakers on the development of vehicles capable of running on gasoline-methanol blends (Sternlicht & Staff, 2013).
Outlook. While the government is leaving the integration of alternative transportation up to the market, some broad predictions have been made, resulting in a wide range of potential success stories. Some experts believe, based on the composition of its natural gas, the likelihood of a GTL plant being developed in Israel is very low (Henderson, 2013). Furthermore, the long distances required for LNG to be viable mean the fuel is not a cost-effective option for most members of the Israeli transportation sector (Bar-Eli, 2013). Therefore, over the next five years, these experts believe that transportation innovation will be dominated by CNG and methanol derived from natural gas (Rabinovitch, 2013). The Israeli government, on the contrary, see EVs as the optimal solution for LDVs, but due to issues with battery production capacity, several years may be required for EVs to successfully capture a sizeable portion the market (Israel Ministry of National Infrastructures, Energy and Water Resources). As evidenced by these various efforts, Israel has turned itself into a test bed for alternative-vehicle fuels (Fuel Choices Initiative).
7 Around 130 models—about 1/10 of total gasoline fueled private models imported in 2012—do not belong to the pollution
grade that is appropriate for their engine size. More than 2/3 of them pollute less than expected, with the remaining 1/3 polluting more than expected. See: http://taxes.gov.il/About/Reforms/Documents/MisuiYarok2009/polutionMisuiyarok010813.xls
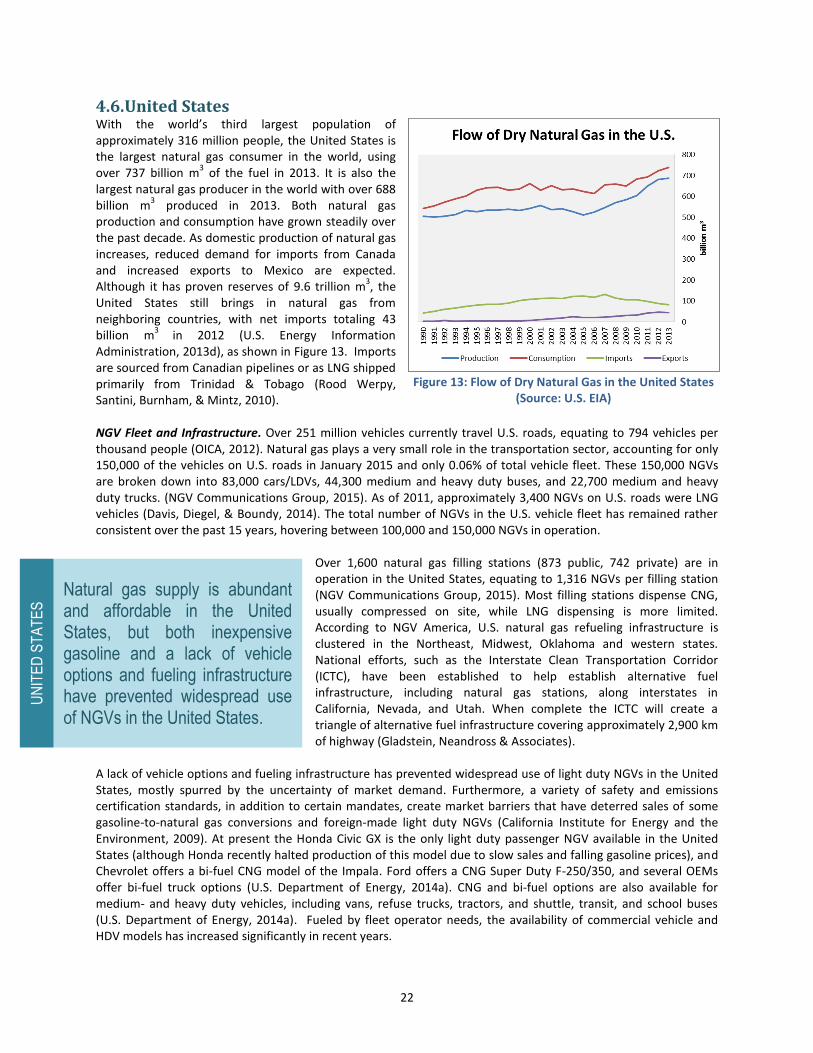
22
Natural gas supply is abundant and affordable in the United States, but both inexpensive gasoline and a lack of vehicle options and fueling infrastructure have prevented widespread use of NGVs in the United States.
UN
ITE
D S
TA
TE
S
4.6. United States With the world’s third largest population of approximately 316 million people, the United States is the largest natural gas consumer in the world, using over 737 billion m
3 of the fuel in 2013. It is also the
largest natural gas producer in the world with over 688 billion m
3 produced in 2013. Both natural gas
production and consumption have grown steadily over the past decade. As domestic production of natural gas increases, reduced demand for imports from Canada and increased exports to Mexico are expected. Although it has proven reserves of 9.6 trillion m
3, the
United States still brings in natural gas from neighboring countries, with net imports totaling 43 billion m
3 in 2012 (U.S. Energy Information
Administration, 2013d), as shown in Figure 13. Imports are sourced from Canadian pipelines or as LNG shipped primarily from Trinidad & Tobago (Rood Werpy, Santini, Burnham, & Mintz, 2010). NGV Fleet and Infrastructure. Over 251 million vehicles currently travel U.S. roads, equating to 794 vehicles per thousand people (OICA, 2012). Natural gas plays a very small role in the transportation sector, accounting for only 150,000 of the vehicles on U.S. roads in January 2015 and only 0.06% of total vehicle fleet. These 150,000 NGVs are broken down into 83,000 cars/LDVs, 44,300 medium and heavy duty buses, and 22,700 medium and heavy duty trucks. (NGV Communications Group, 2015). As of 2011, approximately 3,400 NGVs on U.S. roads were LNG vehicles (Davis, Diegel, & Boundy, 2014). The total number of NGVs in the U.S. vehicle fleet has remained rather consistent over the past 15 years, hovering between 100,000 and 150,000 NGVs in operation.
Over 1,600 natural gas filling stations (873 public, 742 private) are in operation in the United States, equating to 1,316 NGVs per filling station (NGV Communications Group, 2015). Most filling stations dispense CNG, usually compressed on site, while LNG dispensing is more limited. According to NGV America, U.S. natural gas refueling infrastructure is clustered in the Northeast, Midwest, Oklahoma and western states. National efforts, such as the Interstate Clean Transportation Corridor (ICTC), have been established to help establish alternative fuel infrastructure, including natural gas stations, along interstates in California, Nevada, and Utah. When complete the ICTC will create a triangle of alternative fuel infrastructure covering approximately 2,900 km of highway (Gladstein, Neandross & Associates).
A lack of vehicle options and fueling infrastructure has prevented widespread use of light duty NGVs in the United States, mostly spurred by the uncertainty of market demand. Furthermore, a variety of safety and emissions certification standards, in addition to certain mandates, create market barriers that have deterred sales of some gasoline-to-natural gas conversions and foreign-made light duty NGVs (California Institute for Energy and the Environment, 2009). At present the Honda Civic GX is the only light duty passenger NGV available in the United States (although Honda recently halted production of this model due to slow sales and falling gasoline prices), and Chevrolet offers a bi-fuel CNG model of the Impala. Ford offers a CNG Super Duty F-250/350, and several OEMs offer bi-fuel truck options (U.S. Department of Energy, 2014a). CNG and bi-fuel options are also available for medium- and heavy duty vehicles, including vans, refuse trucks, tractors, and shuttle, transit, and school buses (U.S. Department of Energy, 2014a). Fueled by fleet operator needs, the availability of commercial vehicle and HDV models has increased significantly in recent years.
Figure 13: Flow of Dry Natural Gas in the United States (Source: U.S. EIA)
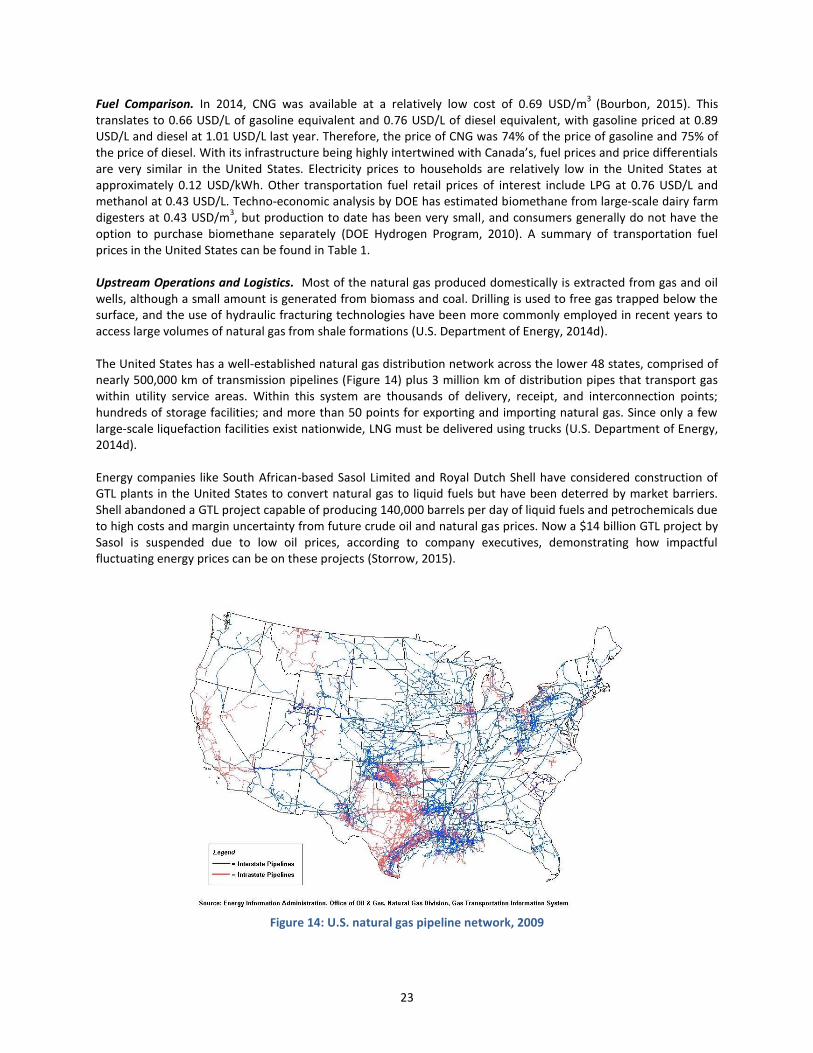
23
Fuel Comparison. In 2014, CNG was available at a relatively low cost of 0.69 USD/m3
(Bourbon, 2015). This translates to 0.66 USD/L of gasoline equivalent and 0.76 USD/L of diesel equivalent, with gasoline priced at 0.89 USD/L and diesel at 1.01 USD/L last year. Therefore, the price of CNG was 74% of the price of gasoline and 75% of the price of diesel. With its infrastructure being highly intertwined with Canada’s, fuel prices and price differentials are very similar in the United States. Electricity prices to households are relatively low in the United States at approximately 0.12 USD/kWh. Other transportation fuel retail prices of interest include LPG at 0.76 USD/L and methanol at 0.43 USD/L. Techno-economic analysis by DOE has estimated biomethane from large-scale dairy farm digesters at 0.43 USD/m
3, but production to date has been very small, and consumers generally do not have the
option to purchase biomethane separately (DOE Hydrogen Program, 2010). A summary of transportation fuel prices in the United States can be found in Table 1. Upstream Operations and Logistics. Most of the natural gas produced domestically is extracted from gas and oil wells, although a small amount is generated from biomass and coal. Drilling is used to free gas trapped below the surface, and the use of hydraulic fracturing technologies have been more commonly employed in recent years to access large volumes of natural gas from shale formations (U.S. Department of Energy, 2014d). The United States has a well-established natural gas distribution network across the lower 48 states, comprised of nearly 500,000 km of transmission pipelines (Figure 14) plus 3 million km of distribution pipes that transport gas within utility service areas. Within this system are thousands of delivery, receipt, and interconnection points; hundreds of storage facilities; and more than 50 points for exporting and importing natural gas. Since only a few large-scale liquefaction facilities exist nationwide, LNG must be delivered using trucks (U.S. Department of Energy, 2014d). Energy companies like South African-based Sasol Limited and Royal Dutch Shell have considered construction of GTL plants in the United States to convert natural gas to liquid fuels but have been deterred by market barriers. Shell abandoned a GTL project capable of producing 140,000 barrels per day of liquid fuels and petrochemicals due to high costs and margin uncertainty from future crude oil and natural gas prices. Now a $14 billion GTL project by Sasol is suspended due to low oil prices, according to company executives, demonstrating how impactful fluctuating energy prices can be on these projects (Storrow, 2015).
Figure 14: U.S. natural gas pipeline network, 2009
24
Policy Support. Increased utilization of its vast domestic natural gas resources could potentially aid in the United States’ effort to reduce its dependence on foreign oil; however, efforts on a national level to promote the use of natural gas vehicles have been limited. A 50¢/gallon tax incentive was available for CNG and LNG through 2014, and a 30% tax credit was available for natural gas fueling equipment from January 1, 2006 to December 31, 2013. NGVs are also exempt from HOV lane requirements in some states through September 30, 2017. A Presidential memorandum on Federal Fleet Performance, issued in May 2011, requires all new LDVs purchased or leased by the U.S. government to run on alternative fuels by the end of 2015, including those run on CNG, LNG, and biomethane (The White House, 2011). It also encompasses hybrid electric vehicles (HEV), battery electric vehicles, and biofuel vehicles (Obama, 2011). Currently, the federal government offers a tax credit of $2,500 to $7,500 for the purchase of a PEV, and a $4,000 fuel cell vehicle tax credit was offered through 2014 (U.S. Department of Energy, 2014b). Outlook. Significant potential exists in the United States to use natural gas in vehicles due to the large domestic reserves and production, and the extensive natural gas pipeline infrastructure. Due to the abundance of domestic reserves, price volatility of natural gas is expected to be minimal. This stability of supply and cost will continue to be a strong factor promoting natural gas use, whether for use in NGVs or for electricity generation to power EVs, as the fluctuations in oil price continue.
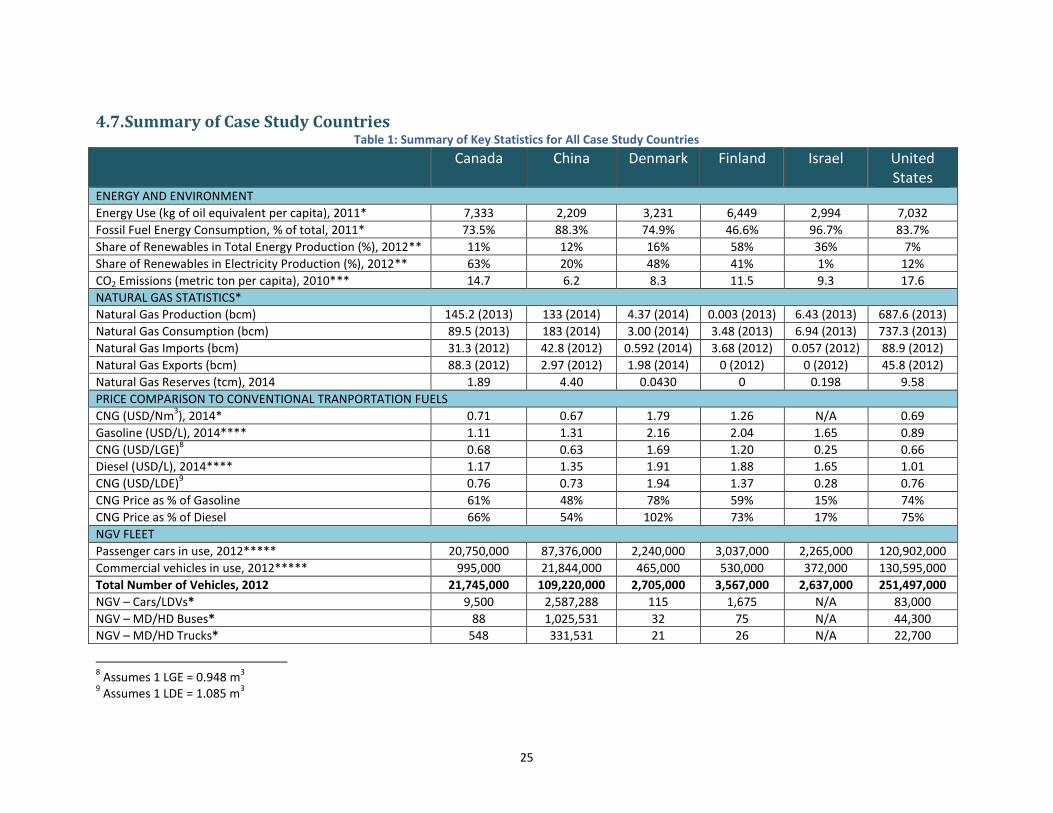
25
4.7. Summary of Case Study Countries Table 1: Summary of Key Statistics for All Case Study Countries
Canada China Denmark Finland Israel United States
ENERGY AND ENVIRONMENT
Energy Use (kg of oil equivalent per capita), 2011* 7,333 2,209 3,231 6,449 2,994 7,032
Fossil Fuel Energy Consumption, % of total, 2011* 73.5% 88.3% 74.9% 46.6% 96.7% 83.7%
Share of Renewables in Total Energy Production (%), 2012** 11% 12% 16% 58% 36% 7%
Share of Renewables in Electricity Production (%), 2012** 63% 20% 48% 41% 1% 12%
CO2 Emissions (metric ton per capita), 2010*** 14.7 6.2 8.3 11.5 9.3 17.6
NATURAL GAS STATISTICS*
Natural Gas Production (bcm) 145.2 (2013) 133 (2014) 4.37 (2014) 0.003 (2013) 6.43 (2013) 687.6 (2013)
Natural Gas Consumption (bcm) 89.5 (2013) 183 (2014) 3.00 (2014) 3.48 (2013) 6.94 (2013) 737.3 (2013)
Natural Gas Imports (bcm) 31.3 (2012) 42.8 (2012) 0.592 (2014) 3.68 (2012) 0.057 (2012) 88.9 (2012)
Natural Gas Exports (bcm) 88.3 (2012) 2.97 (2012) 1.98 (2014) 0 (2012) 0 (2012) 45.8 (2012)
Natural Gas Reserves (tcm), 2014 1.89 4.40 0.0430 0 0.198 9.58
PRICE COMPARISON TO CONVENTIONAL TRANPORTATION FUELS
CNG (USD/Nm3), 2014* 0.71 0.67 1.79 1.26 N/A 0.69
Gasoline (USD/L), 2014**** 1.11 1.31 2.16 2.04 1.65 0.89
CNG (USD/LGE)8 0.68 0.63 1.69 1.20 0.25 0.66
Diesel (USD/L), 2014**** 1.17 1.35 1.91 1.88 1.65 1.01
CNG (USD/LDE)9 0.76 0.73 1.94 1.37 0.28 0.76
CNG Price as % of Gasoline 61% 48% 78% 59% 15% 74%
CNG Price as % of Diesel 66% 54% 102% 73% 17% 75%
NGV FLEET
Passenger cars in use, 2012***** 20,750,000 87,376,000 2,240,000 3,037,000 2,265,000 120,902,000
Commercial vehicles in use, 2012***** 995,000 21,844,000 465,000 530,000 372,000 130,595,000
Total Number of Vehicles, 2012 21,745,000 109,220,000 2,705,000 3,567,000 2,637,000 251,497,000
NGV – Cars/LDVs* 9,500 2,587,288 115 1,675 N/A 83,000
NGV – MD/HD Buses* 88 1,025,531 32 75 N/A 44,300
NGV – MD/HD Trucks* 548 331,531 21 26 N/A 22,700
8 Assumes 1 LGE = 0.948 m
3
9 Assumes 1 LDE = 1.085 m
3
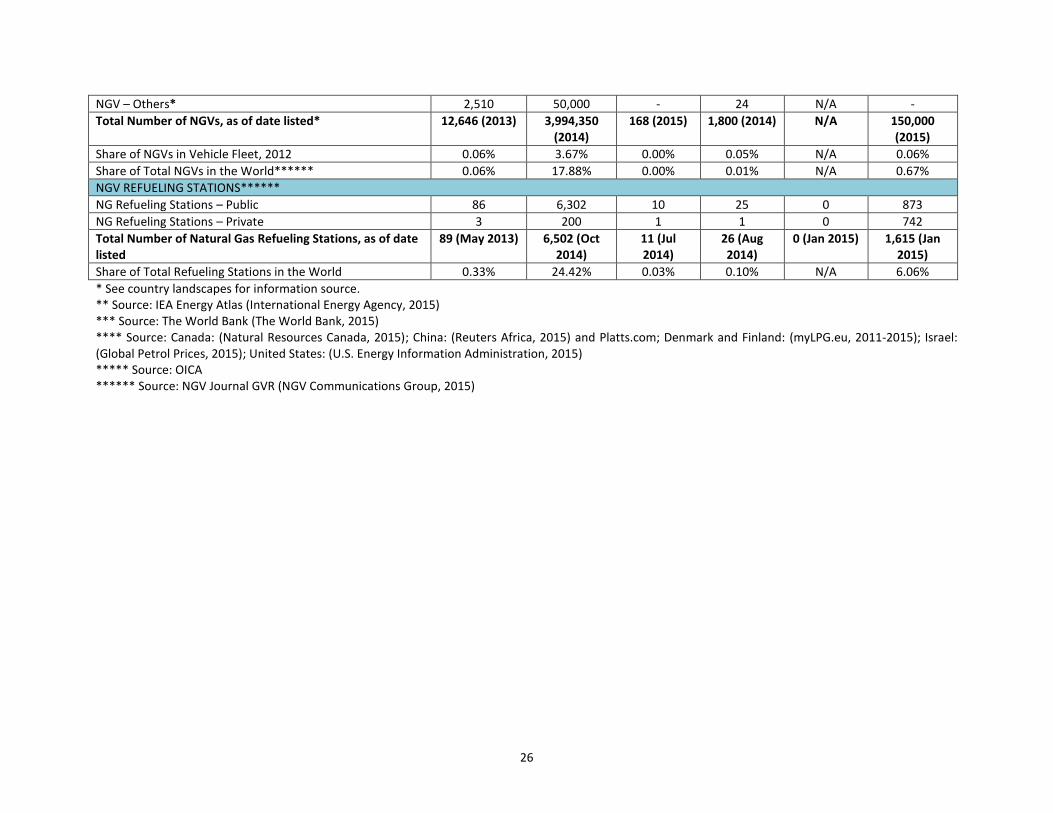
26
NGV – Others* 2,510 50,000 - 24 N/A -
Total Number of NGVs, as of date listed* 12,646 (2013) 3,994,350 (2014)
168 (2015) 1,800 (2014) N/A 150,000 (2015)
Share of NGVs in Vehicle Fleet, 2012 0.06% 3.67% 0.00% 0.05% N/A 0.06%
Share of Total NGVs in the World****** 0.06% 17.88% 0.00% 0.01% N/A 0.67%
NGV REFUELING STATIONS******
NG Refueling Stations – Public 86 6,302 10 25 0 873
NG Refueling Stations – Private 3 200 1 1 0 742
Total Number of Natural Gas Refueling Stations, as of date listed
89 (May 2013) 6,502 (Oct 2014)
11 (Jul 2014)
26 (Aug 2014)
0 (Jan 2015) 1,615 (Jan 2015)
Share of Total Refueling Stations in the World 0.33% 24.42% 0.03% 0.10% N/A 6.06%
* See country landscapes for information source. ** Source: IEA Energy Atlas (International Energy Agency, 2015) *** Source: The World Bank (The World Bank, 2015) **** Source: Canada: (Natural Resources Canada, 2015); China: (Reuters Africa, 2015) and Platts.com; Denmark and Finland: (myLPG.eu, 2011-2015); Israel: (Global Petrol Prices, 2015); United States: (U.S. Energy Information Administration, 2015) ***** Source: OICA ****** Source: NGV Journal GVR (NGV Communications Group, 2015)
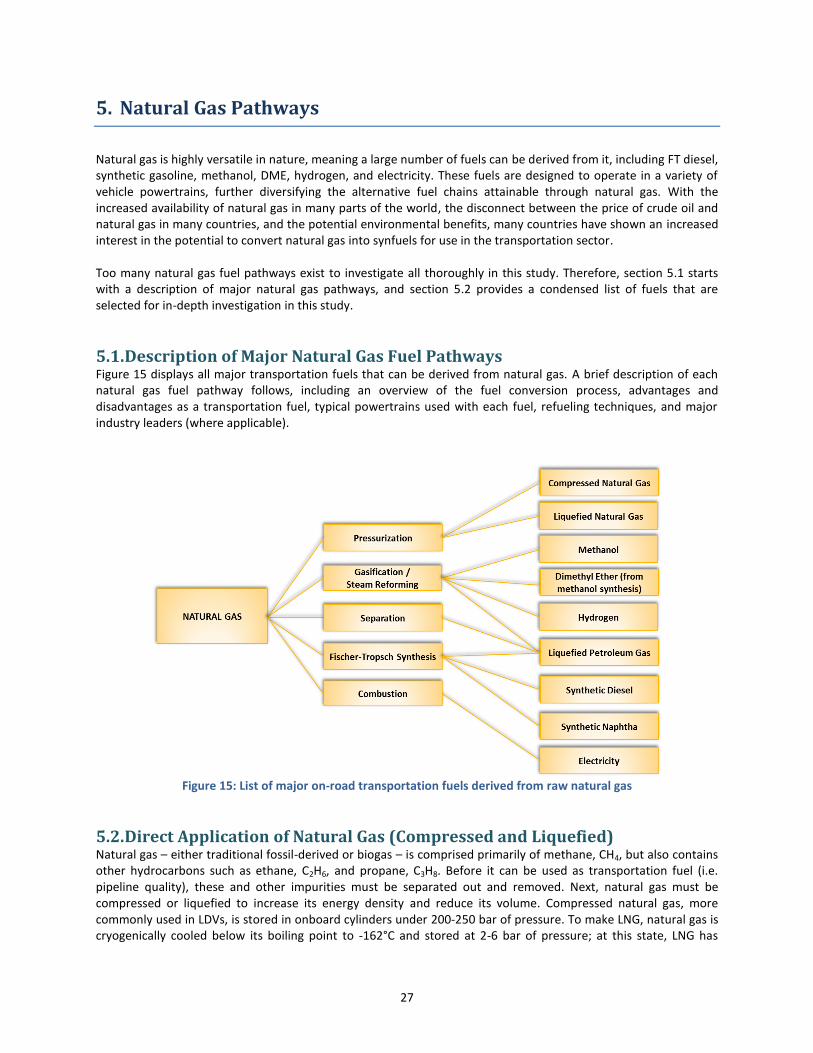
27
5. Natural Gas Pathways
Natural gas is highly versatile in nature, meaning a large number of fuels can be derived from it, including FT diesel, synthetic gasoline, methanol, DME, hydrogen, and electricity. These fuels are designed to operate in a variety of vehicle powertrains, further diversifying the alternative fuel chains attainable through natural gas. With the increased availability of natural gas in many parts of the world, the disconnect between the price of crude oil and natural gas in many countries, and the potential environmental benefits, many countries have shown an increased interest in the potential to convert natural gas into synfuels for use in the transportation sector. Too many natural gas fuel pathways exist to investigate all thoroughly in this study. Therefore, section 5.1 starts with a description of major natural gas pathways, and section 5.2 provides a condensed list of fuels that are selected for in-depth investigation in this study.
5.1. Description of Major Natural Gas Fuel Pathways Figure 15 displays all major transportation fuels that can be derived from natural gas. A brief description of each natural gas fuel pathway follows, including an overview of the fuel conversion process, advantages and disadvantages as a transportation fuel, typical powertrains used with each fuel, refueling techniques, and major industry leaders (where applicable).
Figure 15: List of major on-road transportation fuels derived from raw natural gas
5.2. Direct Application of Natural Gas (Compressed and Liquefied) Natural gas – either traditional fossil-derived or biogas – is comprised primarily of methane, CH4, but also contains other hydrocarbons such as ethane, C2H6, and propane, C3H8. Before it can be used as transportation fuel (i.e. pipeline quality), these and other impurities must be separated out and removed. Next, natural gas must be compressed or liquefied to increase its energy density and reduce its volume. Compressed natural gas, more commonly used in LDVs, is stored in onboard cylinders under 200-250 bar of pressure. To make LNG, natural gas is cryogenically cooled below its boiling point to -162°C and stored at 2-6 bar of pressure; at this state, LNG has
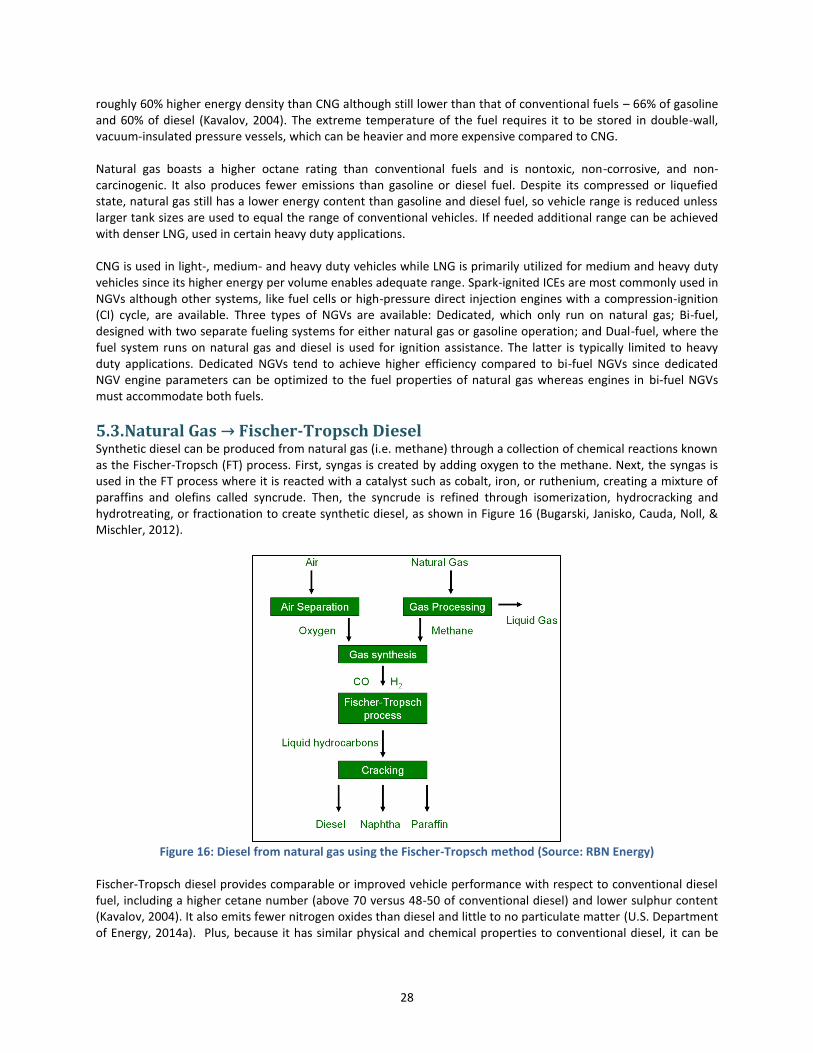
28
roughly 60% higher energy density than CNG although still lower than that of conventional fuels – 66% of gasoline and 60% of diesel (Kavalov, 2004). The extreme temperature of the fuel requires it to be stored in double-wall, vacuum-insulated pressure vessels, which can be heavier and more expensive compared to CNG. Natural gas boasts a higher octane rating than conventional fuels and is nontoxic, non-corrosive, and non-carcinogenic. It also produces fewer emissions than gasoline or diesel fuel. Despite its compressed or liquefied state, natural gas still has a lower energy content than gasoline and diesel fuel, so vehicle range is reduced unless larger tank sizes are used to equal the range of conventional vehicles. If needed additional range can be achieved with denser LNG, used in certain heavy duty applications. CNG is used in light-, medium- and heavy duty vehicles while LNG is primarily utilized for medium and heavy duty vehicles since its higher energy per volume enables adequate range. Spark-ignited ICEs are most commonly used in NGVs although other systems, like fuel cells or high-pressure direct injection engines with a compression-ignition (CI) cycle, are available. Three types of NGVs are available: Dedicated, which only run on natural gas; Bi-fuel, designed with two separate fueling systems for either natural gas or gasoline operation; and Dual-fuel, where the fuel system runs on natural gas and diesel is used for ignition assistance. The latter is typically limited to heavy duty applications. Dedicated NGVs tend to achieve higher efficiency compared to bi-fuel NGVs since dedicated NGV engine parameters can be optimized to the fuel properties of natural gas whereas engines in bi-fuel NGVs must accommodate both fuels.
5.3. Natural Gas → Fischer-Tropsch Diesel Synthetic diesel can be produced from natural gas (i.e. methane) through a collection of chemical reactions known as the Fischer-Tropsch (FT) process. First, syngas is created by adding oxygen to the methane. Next, the syngas is used in the FT process where it is reacted with a catalyst such as cobalt, iron, or ruthenium, creating a mixture of paraffins and olefins called syncrude. Then, the syncrude is refined through isomerization, hydrocracking and hydrotreating, or fractionation to create synthetic diesel, as shown in Figure 16 (Bugarski, Janisko, Cauda, Noll, & Mischler, 2012).
Figure 16: Diesel from natural gas using the Fischer-Tropsch method (Source: RBN Energy)
Fischer-Tropsch diesel provides comparable or improved vehicle performance with respect to conventional diesel fuel, including a higher cetane number (above 70 versus 48-50 of conventional diesel) and lower sulphur content (Kavalov, 2004). It also emits fewer nitrogen oxides than diesel and little to no particulate matter (U.S. Department of Energy, 2014a). Plus, because it has similar physical and chemical properties to conventional diesel, it can be
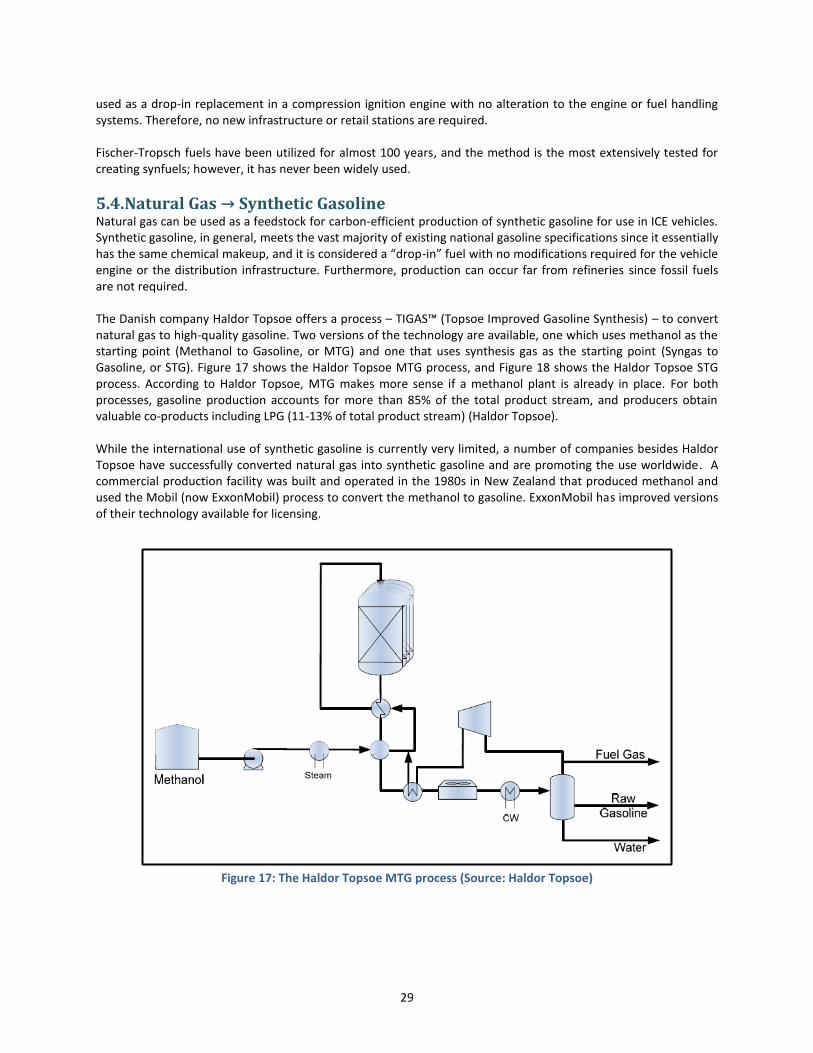
29
used as a drop-in replacement in a compression ignition engine with no alteration to the engine or fuel handling systems. Therefore, no new infrastructure or retail stations are required. Fischer-Tropsch fuels have been utilized for almost 100 years, and the method is the most extensively tested for creating synfuels; however, it has never been widely used.
5.4. Natural Gas → Synthetic Gasoline Natural gas can be used as a feedstock for carbon-efficient production of synthetic gasoline for use in ICE vehicles. Synthetic gasoline, in general, meets the vast majority of existing national gasoline specifications since it essentially has the same chemical makeup, and it is considered a “drop-in” fuel with no modifications required for the vehicle engine or the distribution infrastructure. Furthermore, production can occur far from refineries since fossil fuels are not required. The Danish company Haldor Topsoe offers a process – TIGAS™ (Topsoe Improved Gasoline Synthesis) – to convert natural gas to high-quality gasoline. Two versions of the technology are available, one which uses methanol as the starting point (Methanol to Gasoline, or MTG) and one that uses synthesis gas as the starting point (Syngas to Gasoline, or STG). Figure 17 shows the Haldor Topsoe MTG process, and Figure 18 shows the Haldor Topsoe STG process. According to Haldor Topsoe, MTG makes more sense if a methanol plant is already in place. For both processes, gasoline production accounts for more than 85% of the total product stream, and producers obtain valuable co-products including LPG (11-13% of total product stream) (Haldor Topsoe). While the international use of synthetic gasoline is currently very limited, a number of companies besides Haldor Topsoe have successfully converted natural gas into synthetic gasoline and are promoting the use worldwide. A commercial production facility was built and operated in the 1980s in New Zealand that produced methanol and used the Mobil (now ExxonMobil) process to convert the methanol to gasoline. ExxonMobil has improved versions of their technology available for licensing.
Figure 17: The Haldor Topsoe MTG process (Source: Haldor Topsoe)
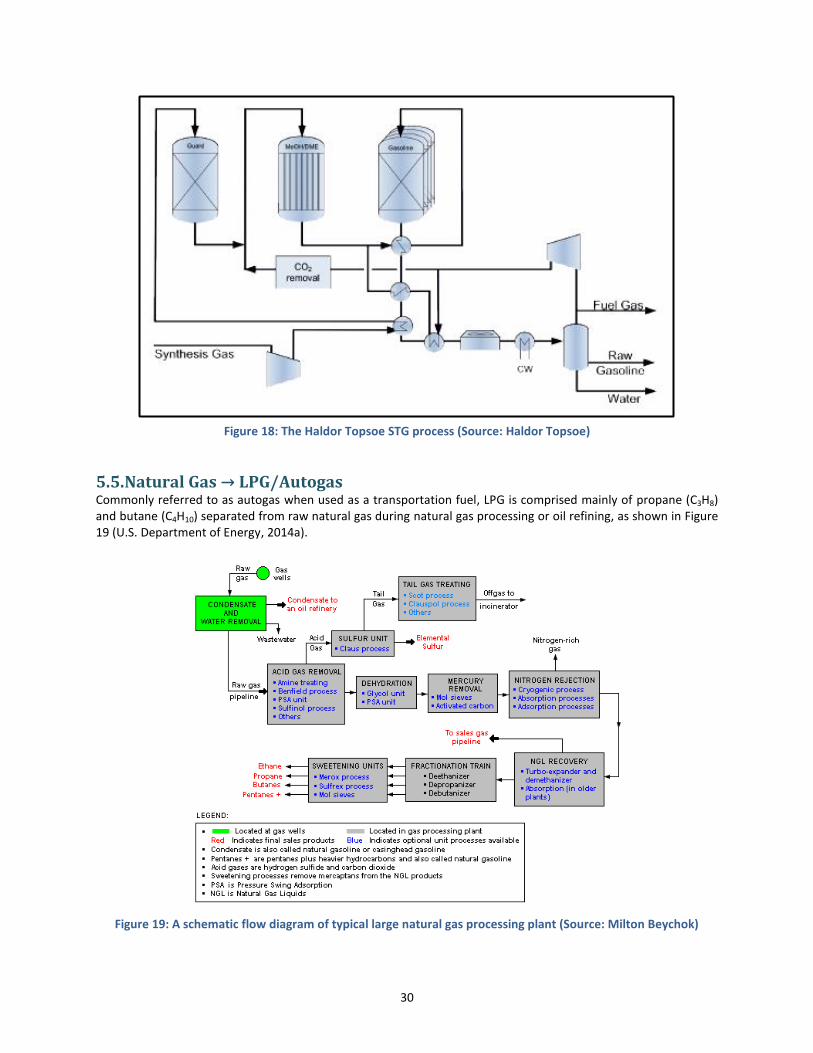
30
Figure 18: The Haldor Topsoe STG process (Source: Haldor Topsoe)
5.5. Natural Gas → LPG/Autogas Commonly referred to as autogas when used as a transportation fuel, LPG is comprised mainly of propane (C3H8) and butane (C4H10) separated from raw natural gas during natural gas processing or oil refining, as shown in Figure 19 (U.S. Department of Energy, 2014a).
Figure 19: A schematic flow diagram of typical large natural gas processing plant (Source: Milton Beychok)
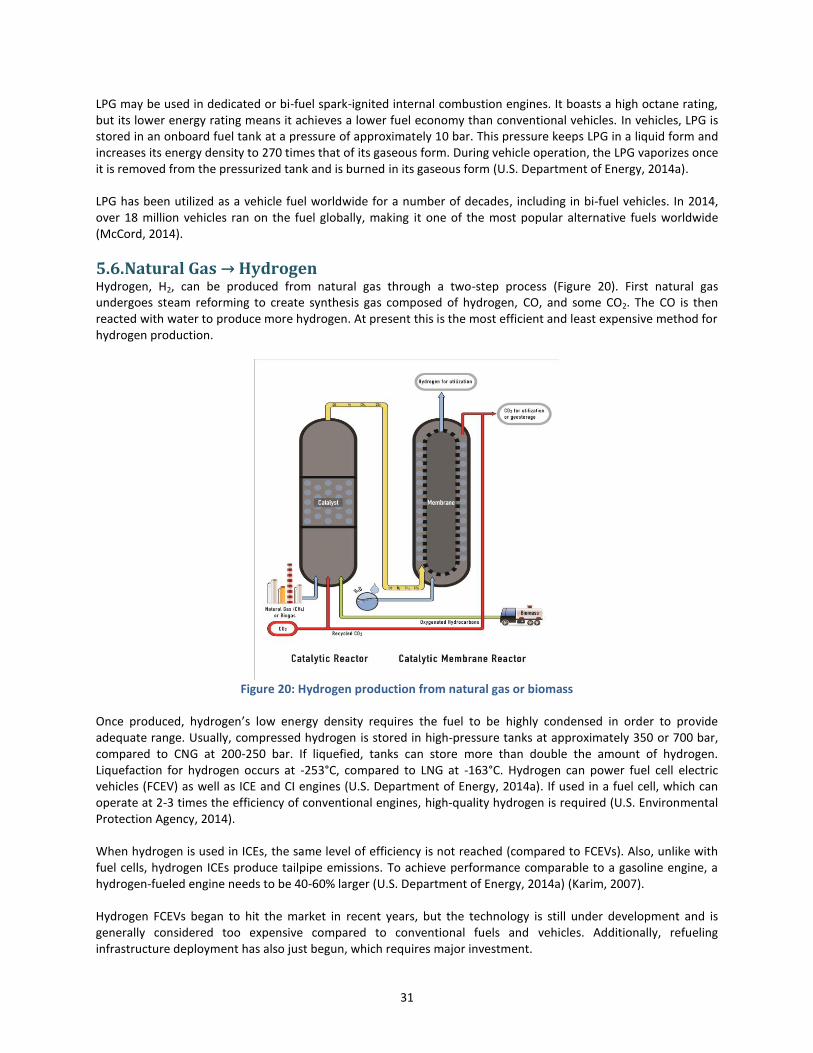
31
LPG may be used in dedicated or bi-fuel spark-ignited internal combustion engines. It boasts a high octane rating, but its lower energy rating means it achieves a lower fuel economy than conventional vehicles. In vehicles, LPG is stored in an onboard fuel tank at a pressure of approximately 10 bar. This pressure keeps LPG in a liquid form and increases its energy density to 270 times that of its gaseous form. During vehicle operation, the LPG vaporizes once it is removed from the pressurized tank and is burned in its gaseous form (U.S. Department of Energy, 2014a). LPG has been utilized as a vehicle fuel worldwide for a number of decades, including in bi-fuel vehicles. In 2014, over 18 million vehicles ran on the fuel globally, making it one of the most popular alternative fuels worldwide (McCord, 2014).
5.6. Natural Gas → Hydrogen Hydrogen, H2, can be produced from natural gas through a two-step process (Figure 20). First natural gas undergoes steam reforming to create synthesis gas composed of hydrogen, CO, and some CO2. The CO is then reacted with water to produce more hydrogen. At present this is the most efficient and least expensive method for hydrogen production.
Figure 20: Hydrogen production from natural gas or biomass
Once produced, hydrogen’s low energy density requires the fuel to be highly condensed in order to provide adequate range. Usually, compressed hydrogen is stored in high-pressure tanks at approximately 350 or 700 bar, compared to CNG at 200-250 bar. If liquefied, tanks can store more than double the amount of hydrogen. Liquefaction for hydrogen occurs at -253°C, compared to LNG at -163°C. Hydrogen can power fuel cell electric vehicles (FCEV) as well as ICE and CI engines (U.S. Department of Energy, 2014a). If used in a fuel cell, which can operate at 2-3 times the efficiency of conventional engines, high-quality hydrogen is required (U.S. Environmental Protection Agency, 2014). When hydrogen is used in ICEs, the same level of efficiency is not reached (compared to FCEVs). Also, unlike with fuel cells, hydrogen ICEs produce tailpipe emissions. To achieve performance comparable to a gasoline engine, a hydrogen-fueled engine needs to be 40-60% larger (U.S. Department of Energy, 2014a) (Karim, 2007). Hydrogen FCEVs began to hit the market in recent years, but the technology is still under development and is generally considered too expensive compared to conventional fuels and vehicles. Additionally, refueling infrastructure deployment has also just begun, which requires major investment.
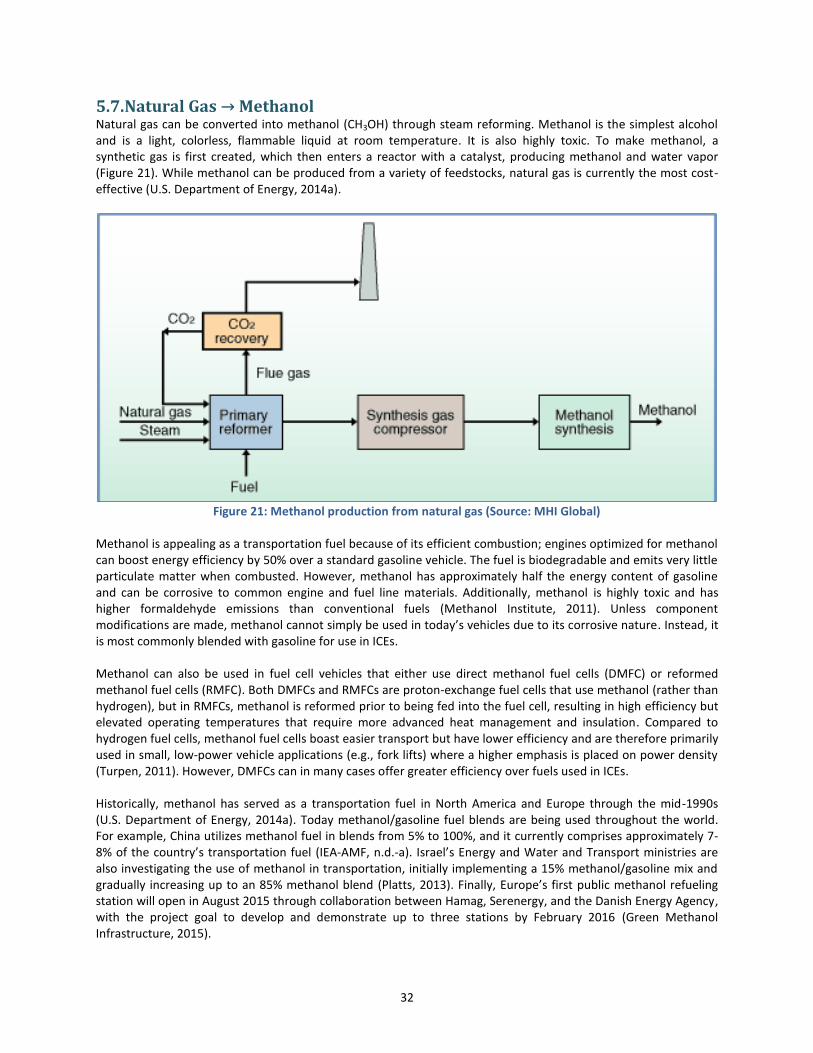
32
5.7. Natural Gas → Methanol Natural gas can be converted into methanol (CH3OH) through steam reforming. Methanol is the simplest alcohol and is a light, colorless, flammable liquid at room temperature. It is also highly toxic. To make methanol, a synthetic gas is first created, which then enters a reactor with a catalyst, producing methanol and water vapor (Figure 21). While methanol can be produced from a variety of feedstocks, natural gas is currently the most cost-effective (U.S. Department of Energy, 2014a).
Figure 21: Methanol production from natural gas (Source: MHI Global)
Methanol is appealing as a transportation fuel because of its efficient combustion; engines optimized for methanol can boost energy efficiency by 50% over a standard gasoline vehicle. The fuel is biodegradable and emits very little particulate matter when combusted. However, methanol has approximately half the energy content of gasoline and can be corrosive to common engine and fuel line materials. Additionally, methanol is highly toxic and has higher formaldehyde emissions than conventional fuels (Methanol Institute, 2011). Unless component modifications are made, methanol cannot simply be used in today’s vehicles due to its corrosive nature. Instead, it is most commonly blended with gasoline for use in ICEs. Methanol can also be used in fuel cell vehicles that either use direct methanol fuel cells (DMFC) or reformed methanol fuel cells (RMFC). Both DMFCs and RMFCs are proton-exchange fuel cells that use methanol (rather than hydrogen), but in RMFCs, methanol is reformed prior to being fed into the fuel cell, resulting in high efficiency but elevated operating temperatures that require more advanced heat management and insulation. Compared to hydrogen fuel cells, methanol fuel cells boast easier transport but have lower efficiency and are therefore primarily used in small, low-power vehicle applications (e.g., fork lifts) where a higher emphasis is placed on power density (Turpen, 2011). However, DMFCs can in many cases offer greater efficiency over fuels used in ICEs. Historically, methanol has served as a transportation fuel in North America and Europe through the mid-1990s (U.S. Department of Energy, 2014a). Today methanol/gasoline fuel blends are being used throughout the world. For example, China utilizes methanol fuel in blends from 5% to 100%, and it currently comprises approximately 7-8% of the country’s transportation fuel (IEA-AMF, n.d.-a). Israel’s Energy and Water and Transport ministries are also investigating the use of methanol in transportation, initially implementing a 15% methanol/gasoline mix and gradually increasing up to an 85% methanol blend (Platts, 2013). Finally, Europe’s first public methanol refueling station will open in August 2015 through collaboration between Hamag, Serenergy, and the Danish Energy Agency, with the project goal to develop and demonstrate up to three stations by February 2016 (Green Methanol Infrastructure, 2015).
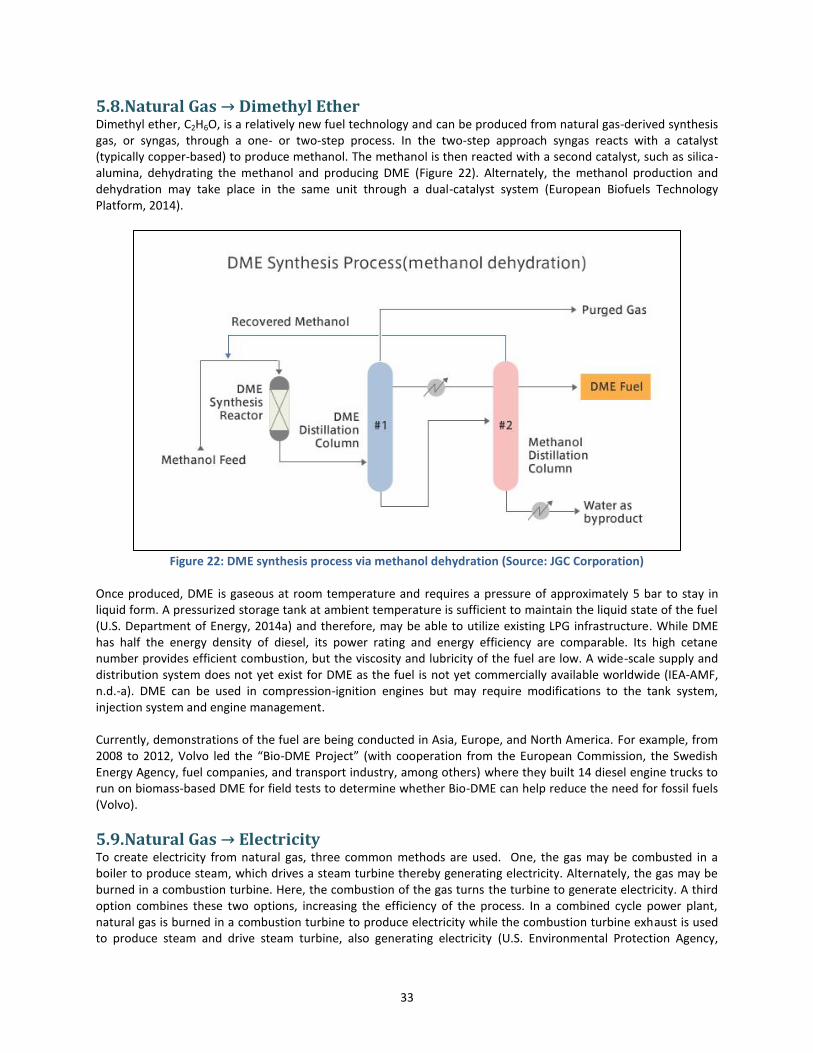
33
5.8. Natural Gas → Dimethyl Ether Dimethyl ether, C2H6O, is a relatively new fuel technology and can be produced from natural gas-derived synthesis gas, or syngas, through a one- or two-step process. In the two-step approach syngas reacts with a catalyst (typically copper-based) to produce methanol. The methanol is then reacted with a second catalyst, such as silica-alumina, dehydrating the methanol and producing DME (Figure 22). Alternately, the methanol production and dehydration may take place in the same unit through a dual-catalyst system (European Biofuels Technology Platform, 2014).
Figure 22: DME synthesis process via methanol dehydration (Source: JGC Corporation)
Once produced, DME is gaseous at room temperature and requires a pressure of approximately 5 bar to stay in liquid form. A pressurized storage tank at ambient temperature is sufficient to maintain the liquid state of the fuel (U.S. Department of Energy, 2014a) and therefore, may be able to utilize existing LPG infrastructure. While DME has half the energy density of diesel, its power rating and energy efficiency are comparable. Its high cetane number provides efficient combustion, but the viscosity and lubricity of the fuel are low. A wide-scale supply and distribution system does not yet exist for DME as the fuel is not yet commercially available worldwide (IEA-AMF, n.d.-a). DME can be used in compression-ignition engines but may require modifications to the tank system, injection system and engine management. Currently, demonstrations of the fuel are being conducted in Asia, Europe, and North America. For example, from 2008 to 2012, Volvo led the “Bio-DME Project” (with cooperation from the European Commission, the Swedish Energy Agency, fuel companies, and transport industry, among others) where they built 14 diesel engine trucks to run on biomass-based DME for field tests to determine whether Bio-DME can help reduce the need for fossil fuels (Volvo).
5.9. Natural Gas → Electricity To create electricity from natural gas, three common methods are used. One, the gas may be combusted in a boiler to produce steam, which drives a steam turbine thereby generating electricity. Alternately, the gas may be burned in a combustion turbine. Here, the combustion of the gas turns the turbine to generate electricity. A third option combines these two options, increasing the efficiency of the process. In a combined cycle power plant, natural gas is burned in a combustion turbine to produce electricity while the combustion turbine exhaust is used to produce steam and drive steam turbine, also generating electricity (U.S. Environmental Protection Agency,

34
2013). Fuel cells may eventually offer a cleaner method for generating electricity from natural gas, but this process has yet to become cost competitive. If natural gas, including biogas, is to be used at a power plant, it must first be purified. This factor, in addition to avoiding the cost to transport the biogas, can make combustion of the gas onsite may be more economical. Electricity may be used in EVs and PHEVs. In either case, the electricity is stored in a battery and fed to an electric motor. The motor powers the drive train, which propels the wheels. Due to range limitations, electricity is not well suited for heavy duty applications. Electric vehicle batteries may be recharged at most electrical outlets. Depending on the battery capacity and the voltage used, a full recharge of a battery can take less than an hour to nearly a day. Ranges on a fully-charged battery range significantly, from approximately 120 km to over 500 km. Electric vehicles operate at a much higher efficiency than gasoline or diesel vehicles, transferring approximately 59-62% of electricity from the grid into vehicle power while conventional vehicles convert approximately 17-21% of the energy stored in fuel into vehicle power. EVs produce no tailpipe emissions and require less maintenance than gasoline or diesel vehicles (FuelEconomy.gov). According to the Centre for Solar Energy and Hydrogen Research Baden-Württemberg (ZSW), over 740,000 PEVs were on the road in January 2015. The United States boasts the largest fleet of PEVs with approximately 290,000, followed by Japan with just over 100,000 and China with just under 100,000. With PEVs as a percentage of the vehicle fleet, however, Norway leads with PEVs comprising 1.6% of registered vehicles (Centre for Solar Energy and Hydrogen Research Baden-Wurttemberg, 2015).
5.10. Condensed List of Feasible Pathways Most of the possible natural gas fuel pathways displayed in Figure 15 are investigated in this study, but some were excluded due to brevity of the study and modeling availability. Table 2 summarizes all of the down-selected fuel/powertrain combinations investigated for both LDV and HDVs.
Table 2: NG-derived end-use fuels and corresponding powertrains investigated in this study
Light Duty Vehicles END USE FUEL POWERTRAIN
Natural gas (compressed; fossil or biomethane) ICE
FT Diesel ICE
Synthetic Gasoline ICE
Hydrogen (compressed) Fuel cell
Methanol (M85) ICE
LPG* ICE
Electricity EV, PHEV (40/50km)
Heavy Duty Vehicles END USE FUEL POWERTRAIN
Natural gas (compressed or liquefied; fossil or biomethane)
ICE
FT Diesel ICE
Synthetic Gasoline ICE
Methanol (M85) ICE
LPG* ICE
Hydrogen (compressed) Fuel cell
Dimethyl Ether (DME) ICE * LPG composition varies by country. The following propane/butane ratio are used in this study: Canada: 95/5, China: 50/50, Denmark: 70/30, Finland: 95/5, Israel: 20/80, and United States: 95/5.
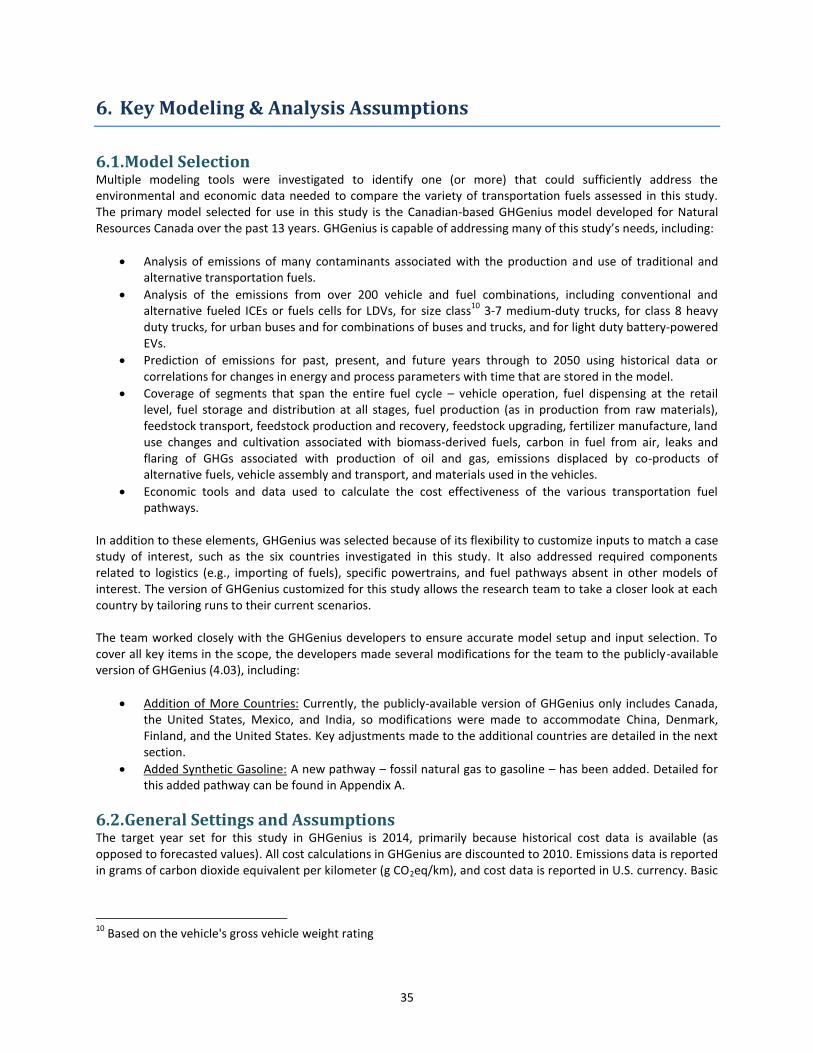
35
6. Key Modeling & Analysis Assumptions
6.1. Model Selection Multiple modeling tools were investigated to identify one (or more) that could sufficiently address the environmental and economic data needed to compare the variety of transportation fuels assessed in this study. The primary model selected for use in this study is the Canadian-based GHGenius model developed for Natural Resources Canada over the past 13 years. GHGenius is capable of addressing many of this study’s needs, including:
Analysis of emissions of many contaminants associated with the production and use of traditional and alternative transportation fuels.
Analysis of the emissions from over 200 vehicle and fuel combinations, including conventional and alternative fueled ICEs or fuels cells for LDVs, for size class
10 3-7 medium-duty trucks, for class 8 heavy
duty trucks, for urban buses and for combinations of buses and trucks, and for light duty battery-powered EVs.
Prediction of emissions for past, present, and future years through to 2050 using historical data or correlations for changes in energy and process parameters with time that are stored in the model.
Coverage of segments that span the entire fuel cycle – vehicle operation, fuel dispensing at the retail level, fuel storage and distribution at all stages, fuel production (as in production from raw materials), feedstock transport, feedstock production and recovery, feedstock upgrading, fertilizer manufacture, land use changes and cultivation associated with biomass-derived fuels, carbon in fuel from air, leaks and flaring of GHGs associated with production of oil and gas, emissions displaced by co-products of alternative fuels, vehicle assembly and transport, and materials used in the vehicles.
Economic tools and data used to calculate the cost effectiveness of the various transportation fuel pathways.
In addition to these elements, GHGenius was selected because of its flexibility to customize inputs to match a case study of interest, such as the six countries investigated in this study. It also addressed required components related to logistics (e.g., importing of fuels), specific powertrains, and fuel pathways absent in other models of interest. The version of GHGenius customized for this study allows the research team to take a closer look at each country by tailoring runs to their current scenarios. The team worked closely with the GHGenius developers to ensure accurate model setup and input selection. To cover all key items in the scope, the developers made several modifications for the team to the publicly-available version of GHGenius (4.03), including:
Addition of More Countries: Currently, the publicly-available version of GHGenius only includes Canada, the United States, Mexico, and India, so modifications were made to accommodate China, Denmark, Finland, and the United States. Key adjustments made to the additional countries are detailed in the next section.
Added Synthetic Gasoline: A new pathway – fossil natural gas to gasoline – has been added. Detailed for this added pathway can be found in Appendix A.
6.2. General Settings and Assumptions The target year set for this study in GHGenius is 2014, primarily because historical cost data is available (as opposed to forecasted values). All cost calculations in GHGenius are discounted to 2010. Emissions data is reported in grams of carbon dioxide equivalent per kilometer (g CO2eq/km), and cost data is reported in U.S. currency. Basic
10
Based on the vehicle's gross vehicle weight rating
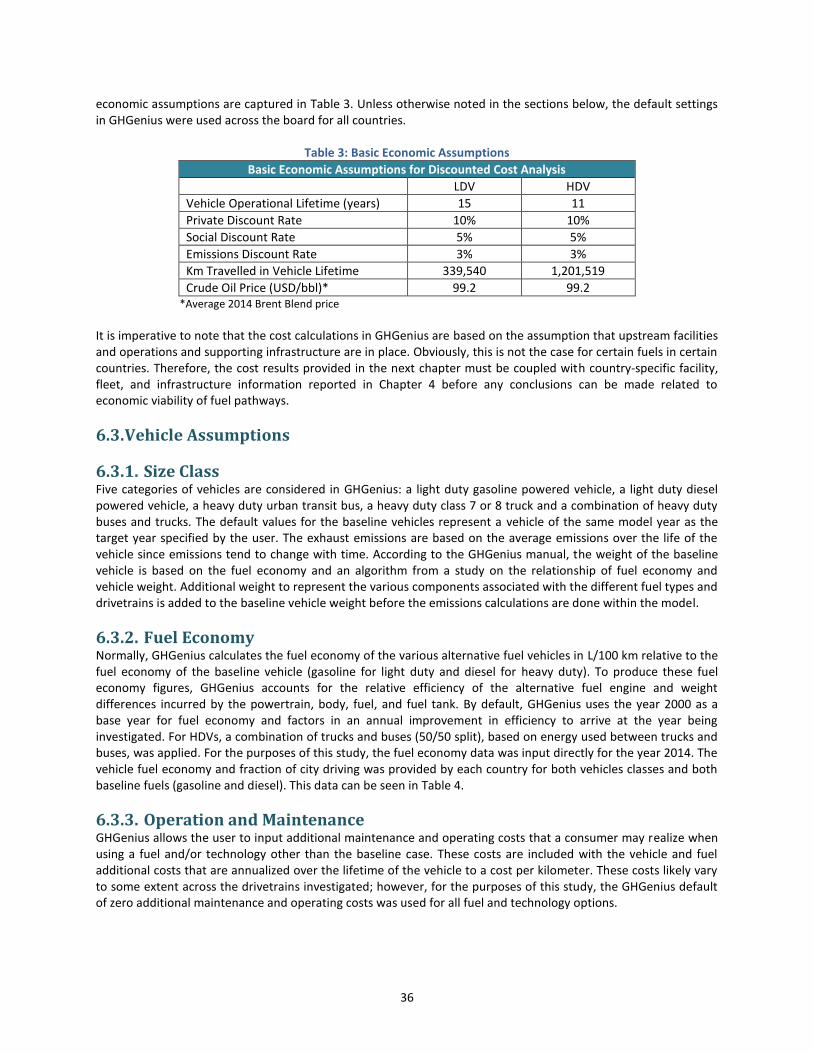
36
economic assumptions are captured in Table 3. Unless otherwise noted in the sections below, the default settings in GHGenius were used across the board for all countries.
Table 3: Basic Economic Assumptions
Basic Economic Assumptions for Discounted Cost Analysis
LDV HDV
Vehicle Operational Lifetime (years) 15 11
Private Discount Rate 10% 10%
Social Discount Rate 5% 5%
Emissions Discount Rate 3% 3%
Km Travelled in Vehicle Lifetime 339,540 1,201,519
Crude Oil Price (USD/bbl)* 99.2 99.2 *Average 2014 Brent Blend price
It is imperative to note that the cost calculations in GHGenius are based on the assumption that upstream facilities and operations and supporting infrastructure are in place. Obviously, this is not the case for certain fuels in certain countries. Therefore, the cost results provided in the next chapter must be coupled with country-specific facility, fleet, and infrastructure information reported in Chapter 4 before any conclusions can be made related to economic viability of fuel pathways.
6.3. Vehicle Assumptions
6.3.1. Size Class Five categories of vehicles are considered in GHGenius: a light duty gasoline powered vehicle, a light duty diesel powered vehicle, a heavy duty urban transit bus, a heavy duty class 7 or 8 truck and a combination of heavy duty buses and trucks. The default values for the baseline vehicles represent a vehicle of the same model year as the target year specified by the user. The exhaust emissions are based on the average emissions over the life of the vehicle since emissions tend to change with time. According to the GHGenius manual, the weight of the baseline vehicle is based on the fuel economy and an algorithm from a study on the relationship of fuel economy and vehicle weight. Additional weight to represent the various components associated with the different fuel types and drivetrains is added to the baseline vehicle weight before the emissions calculations are done within the model.
6.3.2. Fuel Economy Normally, GHGenius calculates the fuel economy of the various alternative fuel vehicles in L/100 km relative to the fuel economy of the baseline vehicle (gasoline for light duty and diesel for heavy duty). To produce these fuel economy figures, GHGenius accounts for the relative efficiency of the alternative fuel engine and weight differences incurred by the powertrain, body, fuel, and fuel tank. By default, GHGenius uses the year 2000 as a base year for fuel economy and factors in an annual improvement in efficiency to arrive at the year being investigated. For HDVs, a combination of trucks and buses (50/50 split), based on energy used between trucks and buses, was applied. For the purposes of this study, the fuel economy data was input directly for the year 2014. The vehicle fuel economy and fraction of city driving was provided by each country for both vehicles classes and both baseline fuels (gasoline and diesel). This data can be seen in Table 4.
6.3.3. Operation and Maintenance GHGenius allows the user to input additional maintenance and operating costs that a consumer may realize when using a fuel and/or technology other than the baseline case. These costs are included with the vehicle and fuel additional costs that are annualized over the lifetime of the vehicle to a cost per kilometer. These costs likely vary to some extent across the drivetrains investigated; however, for the purposes of this study, the GHGenius default of zero additional maintenance and operating costs was used for all fuel and technology options.
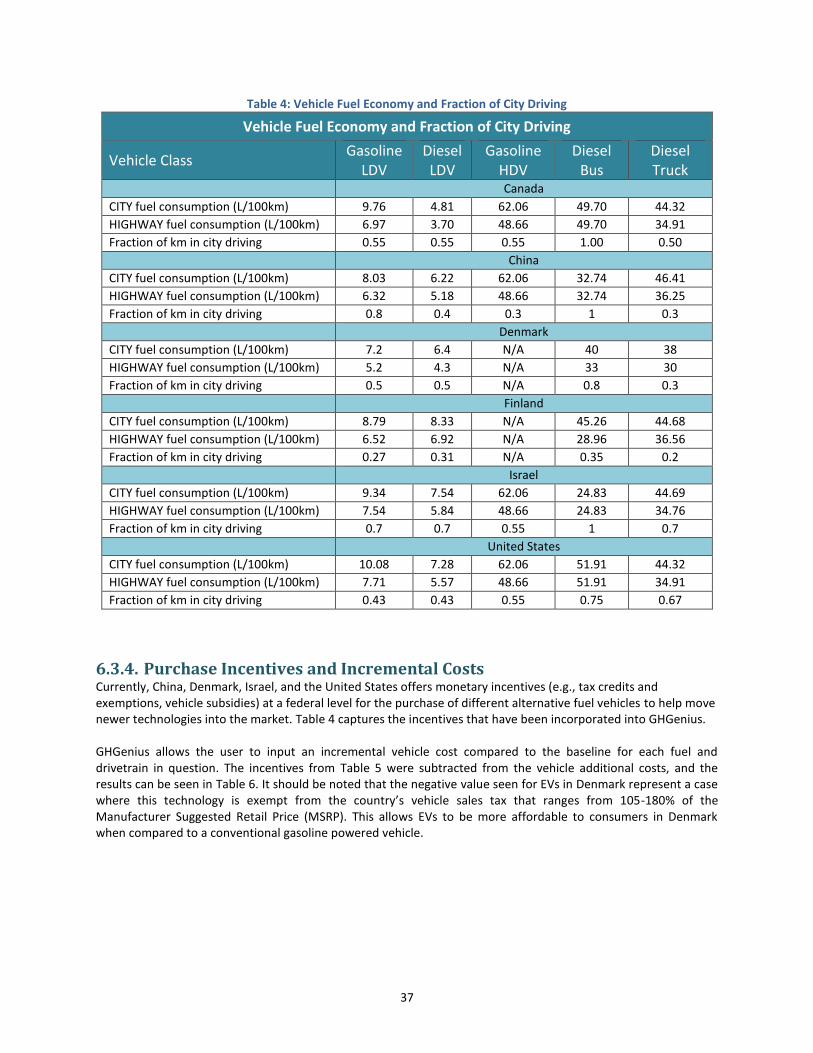
37
Table 4: Vehicle Fuel Economy and Fraction of City Driving
Vehicle Fuel Economy and Fraction of City Driving
Vehicle Class Gasoline
LDV Diesel LDV
Gasoline HDV
Diesel Bus
Diesel Truck
Canada
CITY fuel consumption (L/100km) 9.76 4.81 62.06 49.70 44.32
HIGHWAY fuel consumption (L/100km) 6.97 3.70 48.66 49.70 34.91
Fraction of km in city driving 0.55 0.55 0.55 1.00 0.50
China
CITY fuel consumption (L/100km) 8.03 6.22 62.06 32.74 46.41
HIGHWAY fuel consumption (L/100km) 6.32 5.18 48.66 32.74 36.25
Fraction of km in city driving 0.8 0.4 0.3 1 0.3
Denmark
CITY fuel consumption (L/100km) 7.2 6.4 N/A 40 38
HIGHWAY fuel consumption (L/100km) 5.2 4.3 N/A 33 30
Fraction of km in city driving 0.5 0.5 N/A 0.8 0.3
Finland
CITY fuel consumption (L/100km) 8.79 8.33 N/A 45.26 44.68
HIGHWAY fuel consumption (L/100km) 6.52 6.92 N/A 28.96 36.56
Fraction of km in city driving 0.27 0.31 N/A 0.35 0.2
Israel
CITY fuel consumption (L/100km) 9.34 7.54 62.06 24.83 44.69
HIGHWAY fuel consumption (L/100km) 7.54 5.84 48.66 24.83 34.76
Fraction of km in city driving 0.7 0.7 0.55 1 0.7
United States
CITY fuel consumption (L/100km) 10.08 7.28 62.06 51.91 44.32
HIGHWAY fuel consumption (L/100km) 7.71 5.57 48.66 51.91 34.91
Fraction of km in city driving 0.43 0.43 0.55 0.75 0.67
6.3.4. Purchase Incentives and Incremental Costs Currently, China, Denmark, Israel, and the United States offers monetary incentives (e.g., tax credits and exemptions, vehicle subsidies) at a federal level for the purchase of different alternative fuel vehicles to help move newer technologies into the market. Table 4 captures the incentives that have been incorporated into GHGenius. GHGenius allows the user to input an incremental vehicle cost compared to the baseline for each fuel and drivetrain in question. The incentives from Table 5 were subtracted from the vehicle additional costs, and the results can be seen in Table 6. It should be noted that the negative value seen for EVs in Denmark represent a case where this technology is exempt from the country’s vehicle sales tax that ranges from 105-180% of the Manufacturer Suggested Retail Price (MSRP). This allows EVs to be more affordable to consumers in Denmark when compared to a conventional gasoline powered vehicle.
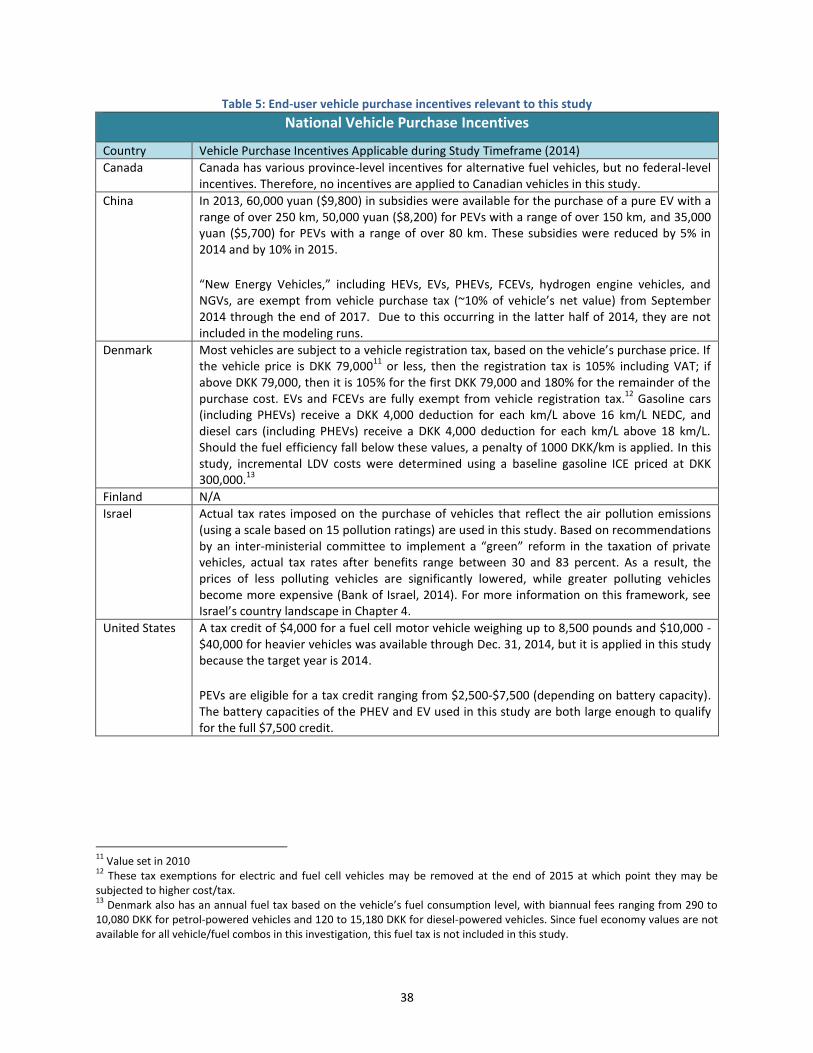
38
Table 5: End-user vehicle purchase incentives relevant to this study
National Vehicle Purchase Incentives
Country Vehicle Purchase Incentives Applicable during Study Timeframe (2014)
Canada Canada has various province-level incentives for alternative fuel vehicles, but no federal-level incentives. Therefore, no incentives are applied to Canadian vehicles in this study.
China In 2013, 60,000 yuan ($9,800) in subsidies were available for the purchase of a pure EV with a range of over 250 km, 50,000 yuan ($8,200) for PEVs with a range of over 150 km, and 35,000 yuan ($5,700) for PEVs with a range of over 80 km. These subsidies were reduced by 5% in 2014 and by 10% in 2015.
“New Energy Vehicles,” including HEVs, EVs, PHEVs, FCEVs, hydrogen engine vehicles, and NGVs, are exempt from vehicle purchase tax (~10% of vehicle’s net value) from September 2014 through the end of 2017. Due to this occurring in the latter half of 2014, they are not included in the modeling runs.
Denmark Most vehicles are subject to a vehicle registration tax, based on the vehicle’s purchase price. If the vehicle price is DKK 79,000
11 or less, then the registration tax is 105% including VAT; if
above DKK 79,000, then it is 105% for the first DKK 79,000 and 180% for the remainder of the purchase cost. EVs and FCEVs are fully exempt from vehicle registration tax.
12 Gasoline cars
(including PHEVs) receive a DKK 4,000 deduction for each km/L above 16 km/L NEDC, and diesel cars (including PHEVs) receive a DKK 4,000 deduction for each km/L above 18 km/L. Should the fuel efficiency fall below these values, a penalty of 1000 DKK/km is applied. In this study, incremental LDV costs were determined using a baseline gasoline ICE priced at DKK 300,000.
13
Finland N/A
Israel Actual tax rates imposed on the purchase of vehicles that reflect the air pollution emissions (using a scale based on 15 pollution ratings) are used in this study. Based on recommendations by an inter-ministerial committee to implement a “green” reform in the taxation of private vehicles, actual tax rates after benefits range between 30 and 83 percent. As a result, the prices of less polluting vehicles are significantly lowered, while greater polluting vehicles become more expensive (Bank of Israel, 2014). For more information on this framework, see Israel’s country landscape in Chapter 4.
United States A tax credit of $4,000 for a fuel cell motor vehicle weighing up to 8,500 pounds and $10,000 - $40,000 for heavier vehicles was available through Dec. 31, 2014, but it is applied in this study because the target year is 2014.
PEVs are eligible for a tax credit ranging from $2,500-$7,500 (depending on battery capacity). The battery capacities of the PHEV and EV used in this study are both large enough to qualify for the full $7,500 credit.
11
Value set in 2010 12
These tax exemptions for electric and fuel cell vehicles may be removed at the end of 2015 at which point they may be subjected to higher cost/tax. 13
Denmark also has an annual fuel tax based on the vehicle’s fuel consumption level, with biannual fees ranging from 290 to 10,080 DKK for petrol-powered vehicles and 120 to 15,180 DKK for diesel-powered vehicles. Since fuel economy values are not available for all vehicle/fuel combos in this investigation, this fuel tax is not included in this study.
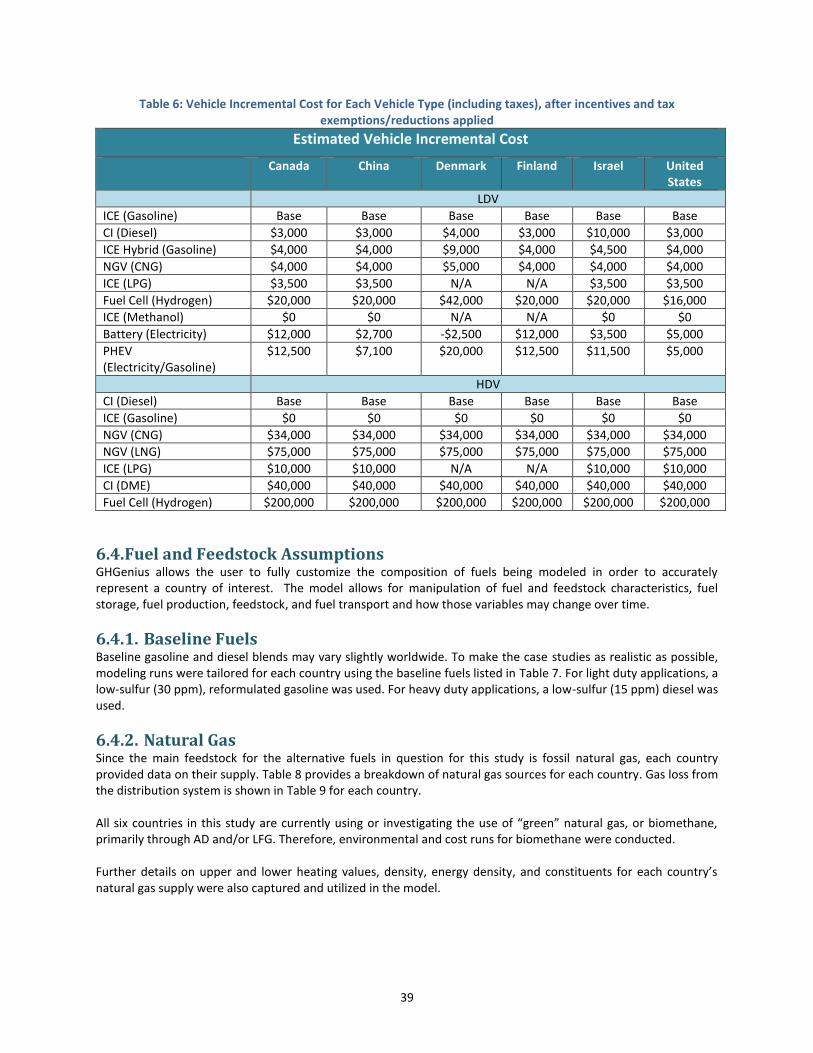
39
Table 6: Vehicle Incremental Cost for Each Vehicle Type (including taxes), after incentives and tax exemptions/reductions applied
Estimated Vehicle Incremental Cost
Canada China Denmark Finland Israel United States
LDV
ICE (Gasoline) Base Base Base Base Base Base
CI (Diesel) $3,000 $3,000 $4,000 $3,000 $10,000 $3,000
ICE Hybrid (Gasoline) $4,000 $4,000 $9,000 $4,000 $4,500 $4,000
NGV (CNG) $4,000 $4,000 $5,000 $4,000 $4,000 $4,000
ICE (LPG) $3,500 $3,500 N/A N/A $3,500 $3,500
Fuel Cell (Hydrogen) $20,000 $20,000 $42,000 $20,000 $20,000 $16,000
ICE (Methanol) $0 $0 N/A N/A $0 $0
Battery (Electricity) $12,000 $2,700 -$2,500 $12,000 $3,500 $5,000
PHEV (Electricity/Gasoline)
$12,500 $7,100 $20,000 $12,500 $11,500 $5,000
HDV
CI (Diesel) Base Base Base Base Base Base
ICE (Gasoline) $0 $0 $0 $0 $0 $0
NGV (CNG) $34,000 $34,000 $34,000 $34,000 $34,000 $34,000
NGV (LNG) $75,000 $75,000 $75,000 $75,000 $75,000 $75,000
ICE (LPG) $10,000 $10,000 N/A N/A $10,000 $10,000
CI (DME) $40,000 $40,000 $40,000 $40,000 $40,000 $40,000
Fuel Cell (Hydrogen) $200,000 $200,000 $200,000 $200,000 $200,000 $200,000
6.4. Fuel and Feedstock Assumptions GHGenius allows the user to fully customize the composition of fuels being modeled in order to accurately represent a country of interest. The model allows for manipulation of fuel and feedstock characteristics, fuel storage, fuel production, feedstock, and fuel transport and how those variables may change over time.
6.4.1. Baseline Fuels Baseline gasoline and diesel blends may vary slightly worldwide. To make the case studies as realistic as possible, modeling runs were tailored for each country using the baseline fuels listed in Table 7. For light duty applications, a low-sulfur (30 ppm), reformulated gasoline was used. For heavy duty applications, a low-sulfur (15 ppm) diesel was used.
6.4.2. Natural Gas Since the main feedstock for the alternative fuels in question for this study is fossil natural gas, each country provided data on their supply. Table 8 provides a breakdown of natural gas sources for each country. Gas loss from the distribution system is shown in Table 9 for each country. All six countries in this study are currently using or investigating the use of “green” natural gas, or biomethane, primarily through AD and/or LFG. Therefore, environmental and cost runs for biomethane were conducted. Further details on upper and lower heating values, density, energy density, and constituents for each country’s natural gas supply were also captured and utilized in the model.
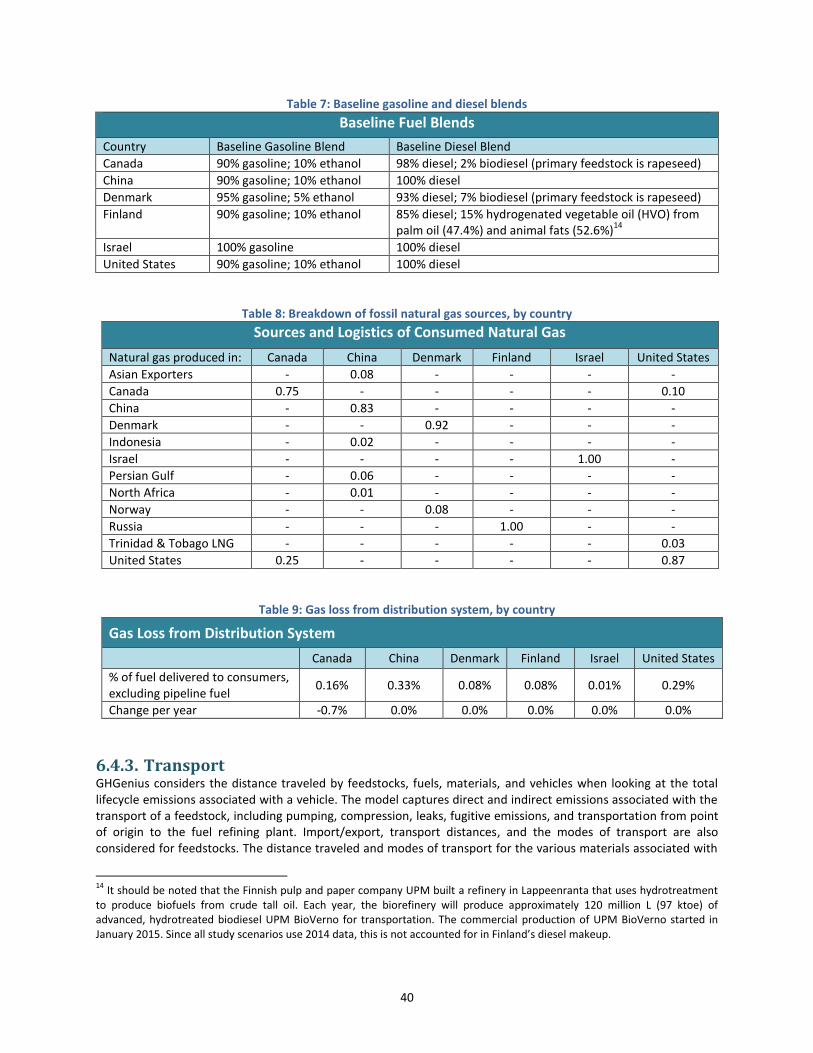
40
Table 7: Baseline gasoline and diesel blends
Baseline Fuel Blends
Country Baseline Gasoline Blend Baseline Diesel Blend
Canada 90% gasoline; 10% ethanol 98% diesel; 2% biodiesel (primary feedstock is rapeseed)
China 90% gasoline; 10% ethanol 100% diesel
Denmark 95% gasoline; 5% ethanol 93% diesel; 7% biodiesel (primary feedstock is rapeseed)
Finland 90% gasoline; 10% ethanol 85% diesel; 15% hydrogenated vegetable oil (HVO) from palm oil (47.4%) and animal fats (52.6%)
14
Israel 100% gasoline 100% diesel
United States 90% gasoline; 10% ethanol 100% diesel
Table 8: Breakdown of fossil natural gas sources, by country
Sources and Logistics of Consumed Natural Gas
Natural gas produced in: Canada China Denmark Finland Israel United States
Asian Exporters - 0.08 - - - -
Canada 0.75 - - - - 0.10
China - 0.83 - - - -
Denmark - - 0.92 - - -
Indonesia - 0.02 - - - -
Israel - - - - 1.00 -
Persian Gulf - 0.06 - - - -
North Africa - 0.01 - - - -
Norway - - 0.08 - - -
Russia - - - 1.00 - -
Trinidad & Tobago LNG - - - - - 0.03
United States 0.25 - - - - 0.87
Table 9: Gas loss from distribution system, by country
Gas Loss from Distribution System
Canada China Denmark Finland Israel United States
% of fuel delivered to consumers, excluding pipeline fuel
0.16% 0.33% 0.08% 0.08% 0.01% 0.29%
Change per year -0.7% 0.0% 0.0% 0.0% 0.0% 0.0%
6.4.3. Transport GHGenius considers the distance traveled by feedstocks, fuels, materials, and vehicles when looking at the total lifecycle emissions associated with a vehicle. The model captures direct and indirect emissions associated with the transport of a feedstock, including pumping, compression, leaks, fugitive emissions, and transportation from point of origin to the fuel refining plant. Import/export, transport distances, and the modes of transport are also considered for feedstocks. The distance traveled and modes of transport for the various materials associated with
14
It should be noted that the Finnish pulp and paper company UPM built a refinery in Lappeenranta that uses hydrotreatment to produce biofuels from crude tall oil. Each year, the biorefinery will produce approximately 120 million L (97 ktoe) of advanced, hydrotreated biodiesel UPM BioVerno for transportation. The commercial production of UPM BioVerno started in January 2015. Since all study scenarios use 2014 data, this is not accounted for in Finland’s diesel makeup.
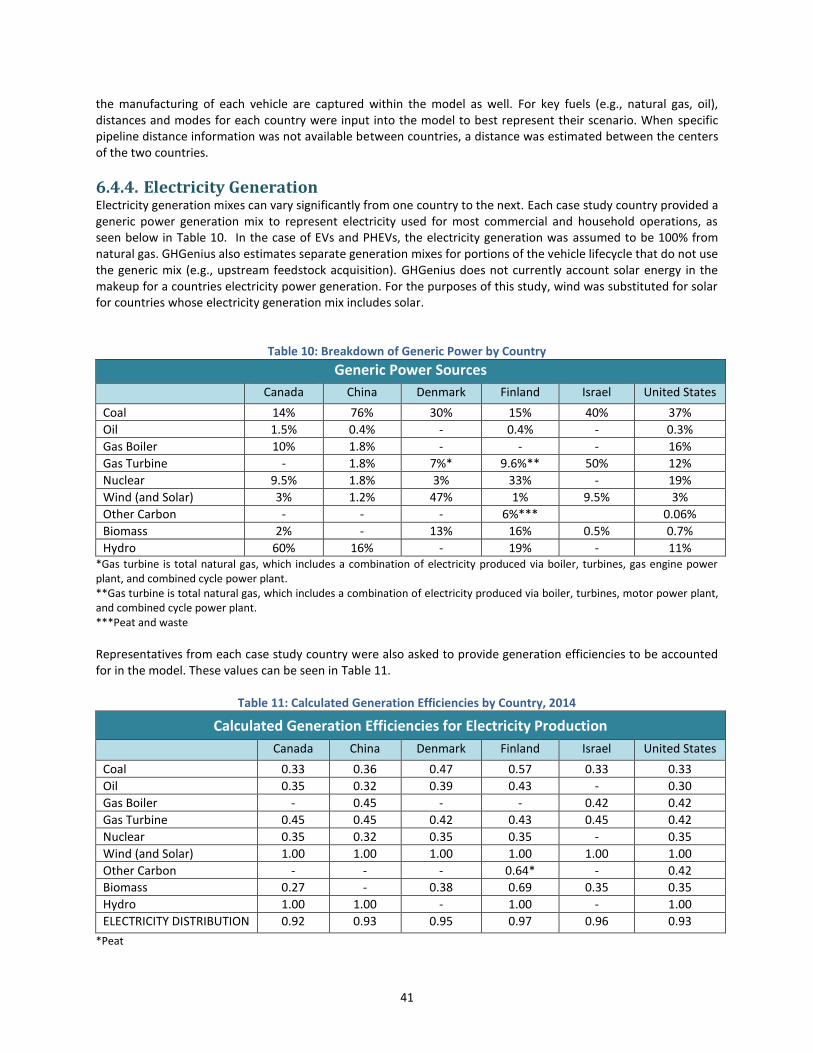
41
the manufacturing of each vehicle are captured within the model as well. For key fuels (e.g., natural gas, oil), distances and modes for each country were input into the model to best represent their scenario. When specific pipeline distance information was not available between countries, a distance was estimated between the centers of the two countries.
6.4.4. Electricity Generation Electricity generation mixes can vary significantly from one country to the next. Each case study country provided a generic power generation mix to represent electricity used for most commercial and household operations, as seen below in Table 10. In the case of EVs and PHEVs, the electricity generation was assumed to be 100% from natural gas. GHGenius also estimates separate generation mixes for portions of the vehicle lifecycle that do not use the generic mix (e.g., upstream feedstock acquisition). GHGenius does not currently account solar energy in the makeup for a countries electricity power generation. For the purposes of this study, wind was substituted for solar for countries whose electricity generation mix includes solar.
Table 10: Breakdown of Generic Power by Country
Generic Power Sources
Canada China Denmark Finland Israel United States
Coal 14% 76% 30% 15% 40% 37%
Oil 1.5% 0.4% - 0.4% - 0.3%
Gas Boiler 10% 1.8% - - - 16%
Gas Turbine - 1.8% 7%* 9.6%** 50% 12%
Nuclear 9.5% 1.8% 3% 33% - 19%
Wind (and Solar) 3% 1.2% 47% 1% 9.5% 3%
Other Carbon - - - 6%*** 0.06%
Biomass 2% - 13% 16% 0.5% 0.7%
Hydro 60% 16% - 19% - 11% *Gas turbine is total natural gas, which includes a combination of electricity produced via boiler, turbines, gas engine power plant, and combined cycle power plant. **Gas turbine is total natural gas, which includes a combination of electricity produced via boiler, turbines, motor power plant, and combined cycle power plant. ***Peat and waste
Representatives from each case study country were also asked to provide generation efficiencies to be accounted for in the model. These values can be seen in Table 11.
Table 11: Calculated Generation Efficiencies by Country, 2014
Calculated Generation Efficiencies for Electricity Production
Canada China Denmark Finland Israel United States
Coal 0.33 0.36 0.47 0.57 0.33 0.33
Oil 0.35 0.32 0.39 0.43 - 0.30
Gas Boiler - 0.45 - - 0.42 0.42
Gas Turbine 0.45 0.45 0.42 0.43 0.45 0.42
Nuclear 0.35 0.32 0.35 0.35 - 0.35
Wind (and Solar) 1.00 1.00 1.00 1.00 1.00 1.00
Other Carbon - - - 0.64* - 0.42
Biomass 0.27 - 0.38 0.69 0.35 0.35
Hydro 1.00 1.00 - 1.00 - 1.00
ELECTRICITY DISTRIBUTION 0.92 0.93 0.95 0.97 0.96 0.93
*Peat
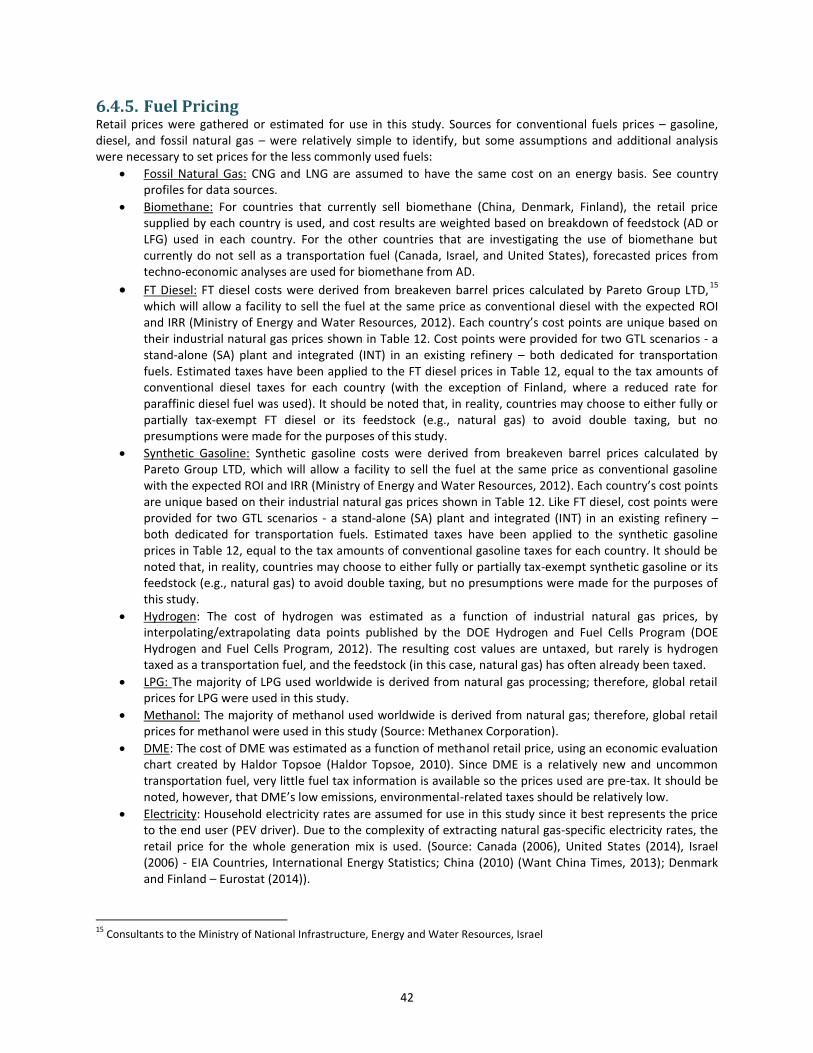
42
6.4.5. Fuel Pricing Retail prices were gathered or estimated for use in this study. Sources for conventional fuels prices – gasoline, diesel, and fossil natural gas – were relatively simple to identify, but some assumptions and additional analysis were necessary to set prices for the less commonly used fuels:
Fossil Natural Gas: CNG and LNG are assumed to have the same cost on an energy basis. See country profiles for data sources.
Biomethane: For countries that currently sell biomethane (China, Denmark, Finland), the retail price supplied by each country is used, and cost results are weighted based on breakdown of feedstock (AD or LFG) used in each country. For the other countries that are investigating the use of biomethane but currently do not sell as a transportation fuel (Canada, Israel, and United States), forecasted prices from techno-economic analyses are used for biomethane from AD.
FT Diesel: FT diesel costs were derived from breakeven barrel prices calculated by Pareto Group LTD,15
which will allow a facility to sell the fuel at the same price as conventional diesel with the expected ROI and IRR (Ministry of Energy and Water Resources, 2012). Each country’s cost points are unique based on their industrial natural gas prices shown in Table 12. Cost points were provided for two GTL scenarios - a stand-alone (SA) plant and integrated (INT) in an existing refinery – both dedicated for transportation fuels. Estimated taxes have been applied to the FT diesel prices in Table 12, equal to the tax amounts of conventional diesel taxes for each country (with the exception of Finland, where a reduced rate for paraffinic diesel fuel was used). It should be noted that, in reality, countries may choose to either fully or partially tax-exempt FT diesel or its feedstock (e.g., natural gas) to avoid double taxing, but no presumptions were made for the purposes of this study.
Synthetic Gasoline: Synthetic gasoline costs were derived from breakeven barrel prices calculated by Pareto Group LTD, which will allow a facility to sell the fuel at the same price as conventional gasoline with the expected ROI and IRR (Ministry of Energy and Water Resources, 2012). Each country’s cost points are unique based on their industrial natural gas prices shown in Table 12. Like FT diesel, cost points were provided for two GTL scenarios - a stand-alone (SA) plant and integrated (INT) in an existing refinery – both dedicated for transportation fuels. Estimated taxes have been applied to the synthetic gasoline prices in Table 12, equal to the tax amounts of conventional gasoline taxes for each country. It should be noted that, in reality, countries may choose to either fully or partially tax-exempt synthetic gasoline or its feedstock (e.g., natural gas) to avoid double taxing, but no presumptions were made for the purposes of this study.
Hydrogen: The cost of hydrogen was estimated as a function of industrial natural gas prices, by interpolating/extrapolating data points published by the DOE Hydrogen and Fuel Cells Program (DOE Hydrogen and Fuel Cells Program, 2012). The resulting cost values are untaxed, but rarely is hydrogen taxed as a transportation fuel, and the feedstock (in this case, natural gas) has often already been taxed.
LPG: The majority of LPG used worldwide is derived from natural gas processing; therefore, global retail prices for LPG were used in this study.
Methanol: The majority of methanol used worldwide is derived from natural gas; therefore, global retail prices for methanol were used in this study (Source: Methanex Corporation).
DME: The cost of DME was estimated as a function of methanol retail price, using an economic evaluation chart created by Haldor Topsoe (Haldor Topsoe, 2010). Since DME is a relatively new and uncommon transportation fuel, very little fuel tax information is available so the prices used are pre-tax. It should be noted, however, that DME’s low emissions, environmental-related taxes should be relatively low.
Electricity: Household electricity rates are assumed for use in this study since it best represents the price to the end user (PEV driver). Due to the complexity of extracting natural gas-specific electricity rates, the retail price for the whole generation mix is used. (Source: Canada (2006), United States (2014), Israel (2006) - EIA Countries, International Energy Statistics; China (2010) (Want China Times, 2013); Denmark and Finland – Eurostat (2014)).
15
Consultants to the Ministry of National Infrastructure, Energy and Water Resources, Israel
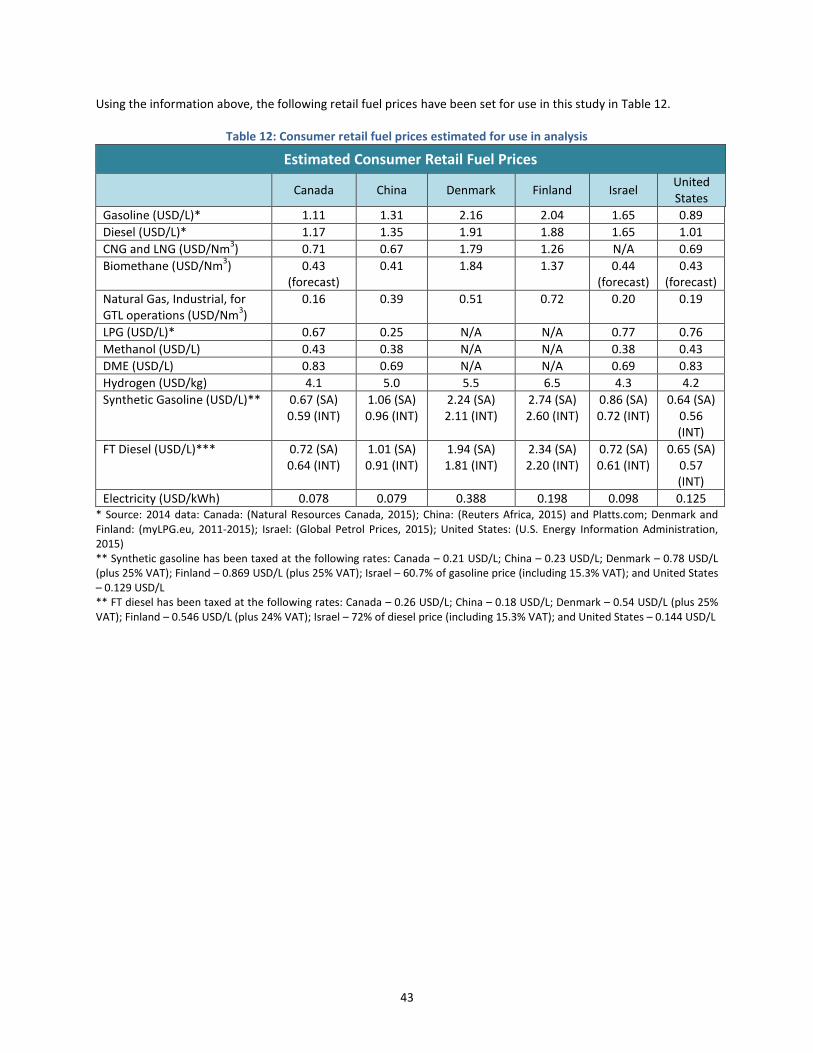
43
Using the information above, the following retail fuel prices have been set for use in this study in Table 12.
Table 12: Consumer retail fuel prices estimated for use in analysis
Estimated Consumer Retail Fuel Prices
Canada China Denmark Finland Israel
United States
Gasoline (USD/L)* 1.11 1.31 2.16 2.04 1.65 0.89
Diesel (USD/L)* 1.17 1.35 1.91 1.88 1.65 1.01
CNG and LNG (USD/Nm3) 0.71 0.67 1.79 1.26 N/A 0.69
Biomethane (USD/Nm3) 0.43
(forecast) 0.41 1.84 1.37 0.44
(forecast) 0.43
(forecast)
Natural Gas, Industrial, for GTL operations (USD/Nm
3)
0.16 0.39 0.51 0.72 0.20 0.19
LPG (USD/L)* 0.67 0.25 N/A N/A 0.77 0.76
Methanol (USD/L) 0.43 0.38 N/A N/A 0.38 0.43
DME (USD/L) 0.83 0.69 N/A N/A 0.69 0.83
Hydrogen (USD/kg) 4.1 5.0 5.5 6.5 4.3 4.2
Synthetic Gasoline (USD/L)** 0.67 (SA) 0.59 (INT)
1.06 (SA) 0.96 (INT)
2.24 (SA) 2.11 (INT)
2.74 (SA) 2.60 (INT)
0.86 (SA) 0.72 (INT)
0.64 (SA) 0.56 (INT)
FT Diesel (USD/L)*** 0.72 (SA) 0.64 (INT)
1.01 (SA) 0.91 (INT)
1.94 (SA) 1.81 (INT)
2.34 (SA) 2.20 (INT)
0.72 (SA) 0.61 (INT)
0.65 (SA) 0.57 (INT)
Electricity (USD/kWh) 0.078 0.079 0.388 0.198 0.098 0.125 * Source: 2014 data: Canada: (Natural Resources Canada, 2015); China: (Reuters Africa, 2015) and Platts.com; Denmark and Finland: (myLPG.eu, 2011-2015); Israel: (Global Petrol Prices, 2015); United States: (U.S. Energy Information Administration, 2015) ** Synthetic gasoline has been taxed at the following rates: Canada – 0.21 USD/L; China – 0.23 USD/L; Denmark – 0.78 USD/L (plus 25% VAT); Finland – 0.869 USD/L (plus 25% VAT); Israel – 60.7% of gasoline price (including 15.3% VAT); and United States – 0.129 USD/L ** FT diesel has been taxed at the following rates: Canada – 0.26 USD/L; China – 0.18 USD/L; Denmark – 0.54 USD/L (plus 25% VAT); Finland – 0.546 USD/L (plus 24% VAT); Israel – 72% of diesel price (including 15.3% VAT); and United States – 0.144 USD/L
44
7. Technical Analysis Results
With the framework now established, GHGenius simulations were run to calculate costs and benefits for each fuel pathway of interest. Results were analyzed to determine which natural gas pathways appear most environmentally friendly and economically feasible for the consumer for each case study. The results were also compared to traditional oil-based transportation options (e.g., petroleum-derived gasoline, diesel) to see which natural gas pathways are competitive within existing markets.
7.1. Environmental Impact Comparison Figures 23 through 34 present emissions results generated with GHGenius spanning the entire fuel cycle. The primary environmental output in GHGenius is emissions on a g CO2eq basis, or carbon dioxide GHG equivalent based on 100 year global warming potential factors, per kilometer basis. Section 7.1.1 breaks down emissions outputs by country, and Section 7.1.2 breaks down emissions outputs by fuel. Total emissions are broken down into the following 12 subcategories, according to the GHGenius User Manual (Volume 1: Model Background and Structure). It should be noted that some of these emissions components may not be directly relevant to each country since they may occur in other countries, but they are included here as part of the fuel cycle:
Net Vehicle Operation: Emissions associated with the use of the fuel in the vehicle; includes all GHGs. Also includes CO2 emissions credit arising from use of a renewable carbon source that obtains carbon from the air.
Fuel Dispensing: Emissions associated with the transfer of the fuel at the service station from storage into the vehicles; includes electricity for pumping, fugitive emissions, and spills.
Fuel Storage and Distribution: Emissions associated with storage and handling of fuel products at terminals, bulk plants, and service stations; includes storage emissions, electricity for pumping, space heating, and lighting.
Fuel Production: Direct and indirect emissions associated with conversion of the feedstock into a saleable fuel product; includes process emissions, combustion emissions for process heat/steam, electricity generation, fugitive emissions, and emissions from the lifecycle of chemicals used for fuel production cycles.
Feedstock Transport: Direct and indirect emissions from transport of feedstock, including pumping, compression, leaks, fugitive emissions, and transportation from point of origin to the fuel refining plant; import/export, transport distances, and the modes of transport are considered.
Feedstock Recovery: Direct and indirect emissions from recovery and processing of the raw feedstock, including fugitive emissions from storage, handling, upstream processing prior to transmission, and mining.
Feedstock Upgrading: Direct and indirect emissions from the upgrading of bitumen to synthetic crude oil, including fugitive emissions from processing.
Land Use Change and Cultivation: Emissions associated with the change in the land use in cultivation of crops, including N2O from application of fertilizer, changes in soil carbon and biomass, methane emissions from soil and energy used for land cultivation.
Leaks and flaring of GHGs Associated with Production of Oil and Gas: Fugitive hydrocarbon emissions and flaring emissions associated with oil and gas production.
Emissions Displaced by Co-Products of Alternative Fuels: Emissions displaced by co-products of various pathways.
Vehicle Assembly and Transport: Emissions associated with the manufacture and transport of the vehicle to the point of sale, amortized over the life of the vehicle.
Materials Used in Vehicles: Emissions from the manufacture of materials used to manufacture the vehicle, amortized over the life of the vehicle; includes lube oil production and losses from air conditioning systems.
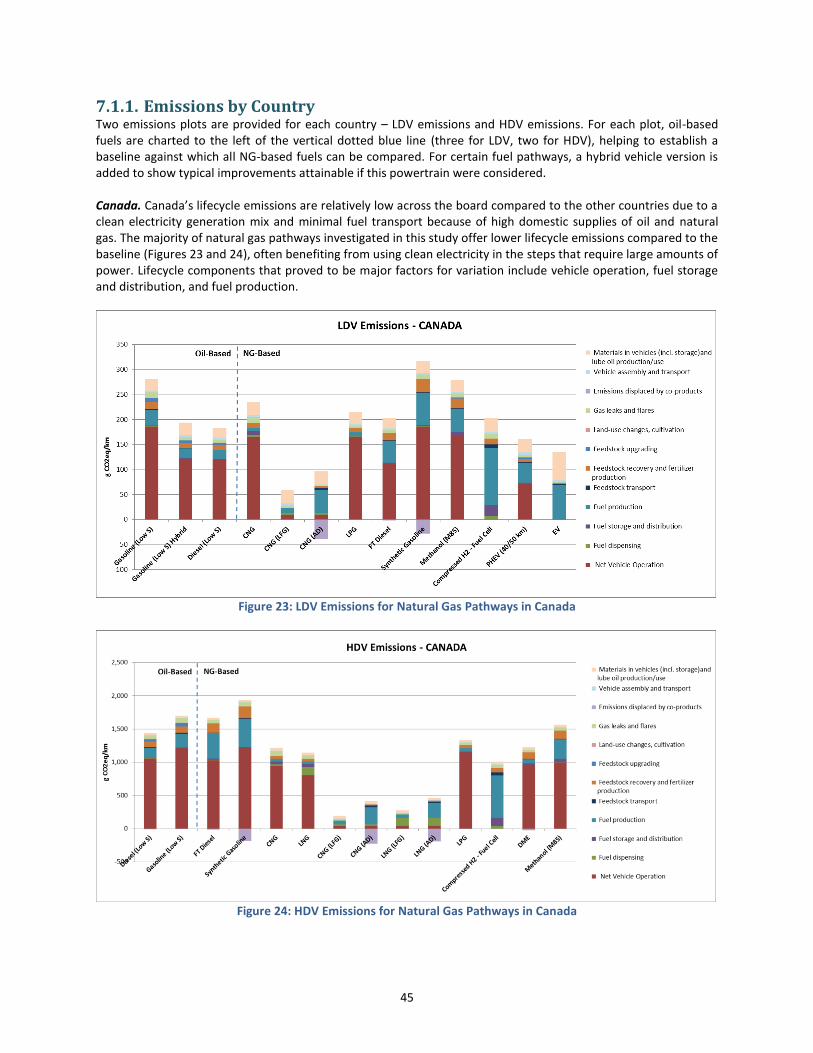
45
7.1.1. Emissions by Country Two emissions plots are provided for each country – LDV emissions and HDV emissions. For each plot, oil-based fuels are charted to the left of the vertical dotted blue line (three for LDV, two for HDV), helping to establish a baseline against which all NG-based fuels can be compared. For certain fuel pathways, a hybrid vehicle version is added to show typical improvements attainable if this powertrain were considered. Canada. Canada’s lifecycle emissions are relatively low across the board compared to the other countries due to a clean electricity generation mix and minimal fuel transport because of high domestic supplies of oil and natural gas. The majority of natural gas pathways investigated in this study offer lower lifecycle emissions compared to the baseline (Figures 23 and 24), often benefiting from using clean electricity in the steps that require large amounts of power. Lifecycle components that proved to be major factors for variation include vehicle operation, fuel storage and distribution, and fuel production.
Figure 23: LDV Emissions for Natural Gas Pathways in Canada
Figure 24: HDV Emissions for Natural Gas Pathways in Canada
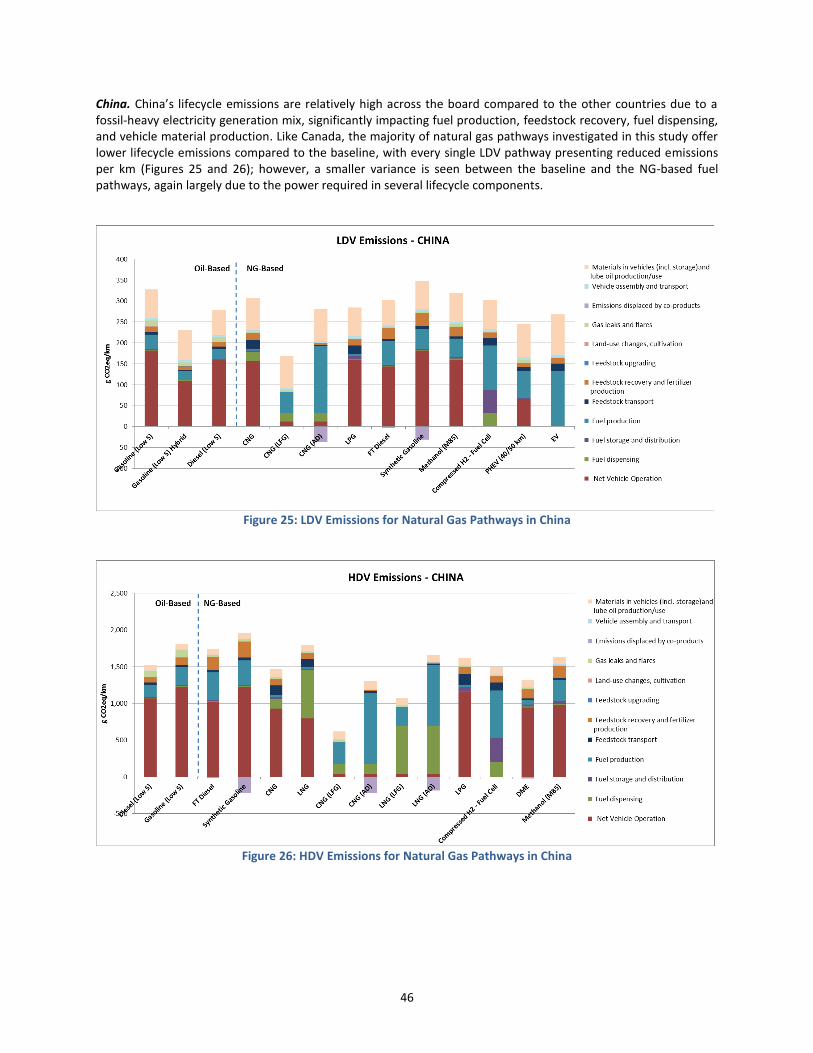
46
China. China’s lifecycle emissions are relatively high across the board compared to the other countries due to a fossil-heavy electricity generation mix, significantly impacting fuel production, feedstock recovery, fuel dispensing, and vehicle material production. Like Canada, the majority of natural gas pathways investigated in this study offer lower lifecycle emissions compared to the baseline, with every single LDV pathway presenting reduced emissions per km (Figures 25 and 26); however, a smaller variance is seen between the baseline and the NG-based fuel pathways, again largely due to the power required in several lifecycle components.
Figure 25: LDV Emissions for Natural Gas Pathways in China
Figure 26: HDV Emissions for Natural Gas Pathways in China
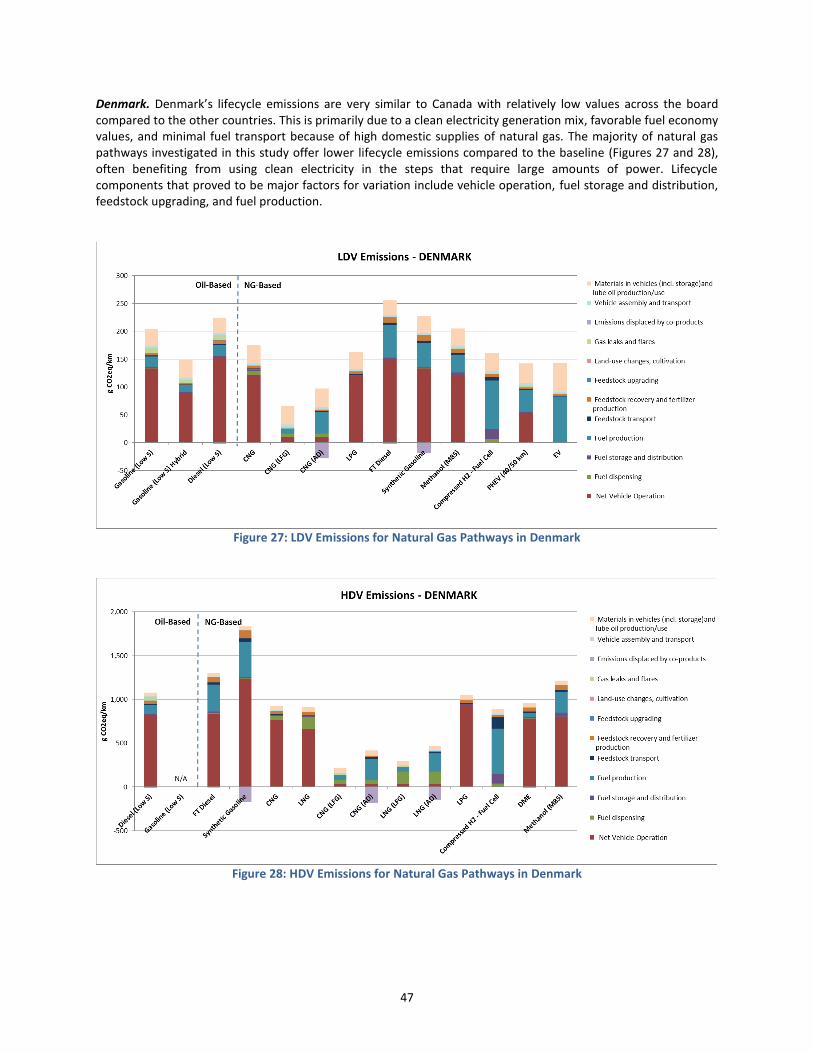
47
Denmark. Denmark’s lifecycle emissions are very similar to Canada with relatively low values across the board compared to the other countries. This is primarily due to a clean electricity generation mix, favorable fuel economy values, and minimal fuel transport because of high domestic supplies of natural gas. The majority of natural gas pathways investigated in this study offer lower lifecycle emissions compared to the baseline (Figures 27 and 28), often benefiting from using clean electricity in the steps that require large amounts of power. Lifecycle components that proved to be major factors for variation include vehicle operation, fuel storage and distribution, feedstock upgrading, and fuel production.
Figure 27: LDV Emissions for Natural Gas Pathways in Denmark
Figure 28: HDV Emissions for Natural Gas Pathways in Denmark
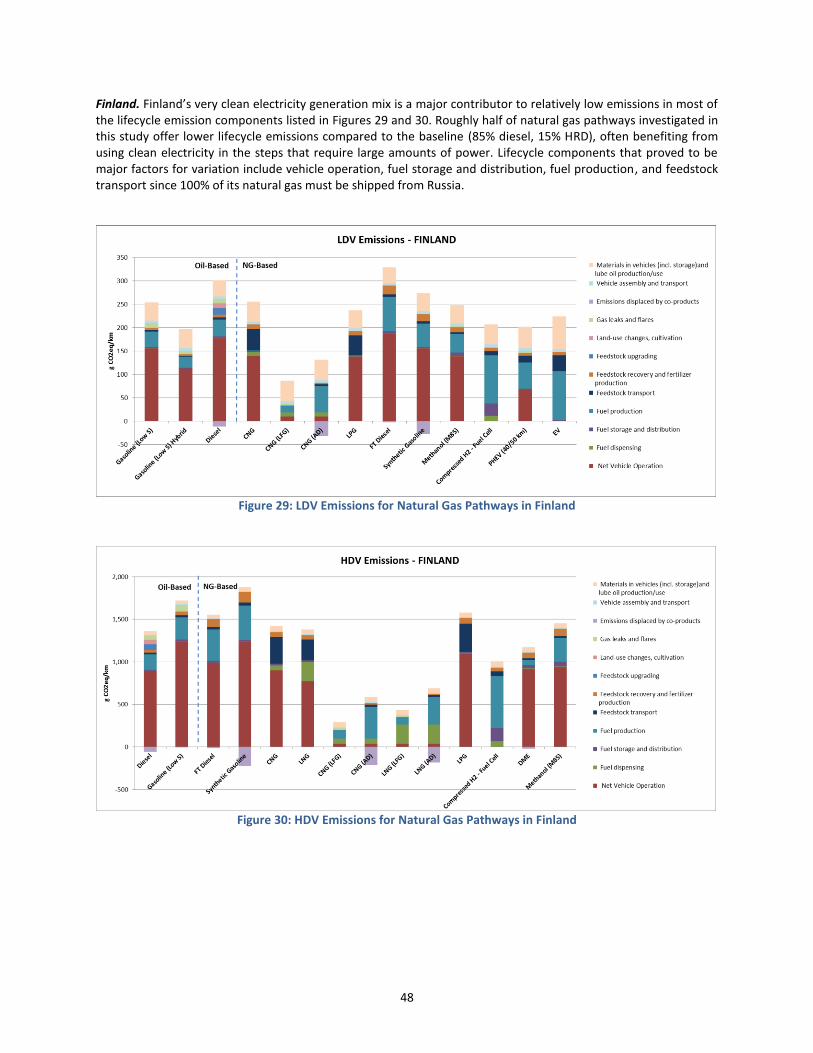
48
Finland. Finland’s very clean electricity generation mix is a major contributor to relatively low emissions in most of the lifecycle emission components listed in Figures 29 and 30. Roughly half of natural gas pathways investigated in this study offer lower lifecycle emissions compared to the baseline (85% diesel, 15% HRD), often benefiting from using clean electricity in the steps that require large amounts of power. Lifecycle components that proved to be major factors for variation include vehicle operation, fuel storage and distribution, fuel production, and feedstock transport since 100% of its natural gas must be shipped from Russia.
Figure 29: LDV Emissions for Natural Gas Pathways in Finland
Figure 30: HDV Emissions for Natural Gas Pathways in Finland
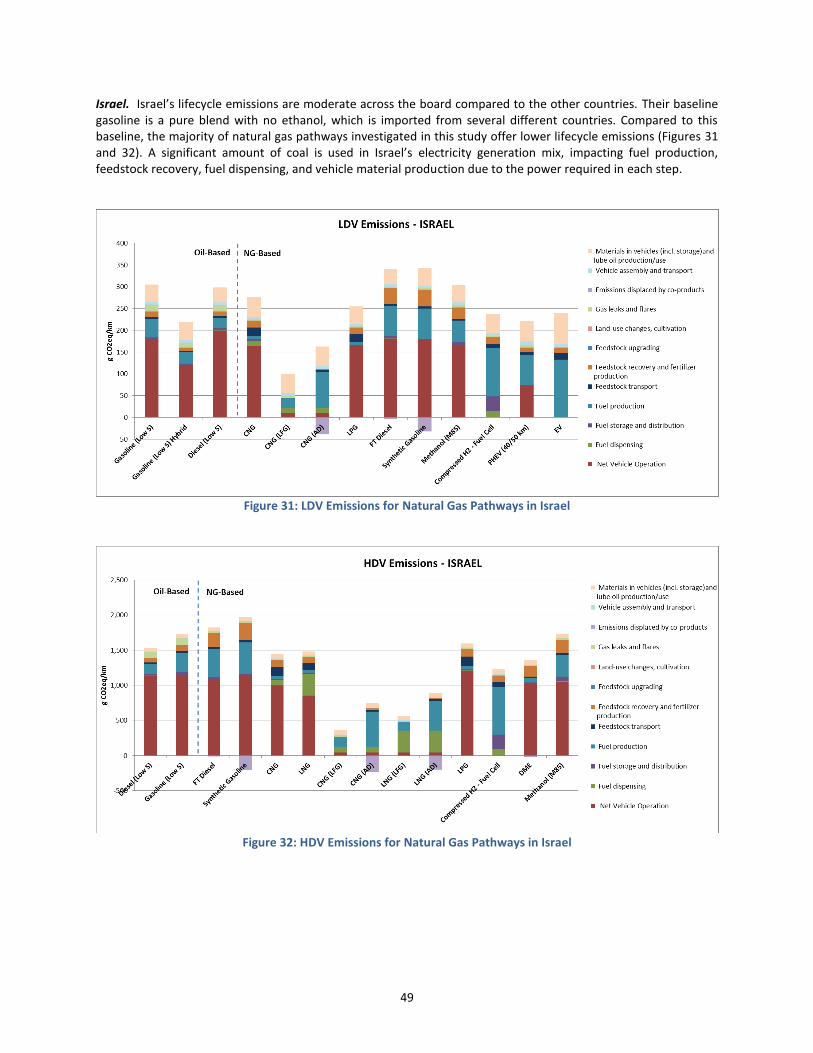
49
Israel. Israel’s lifecycle emissions are moderate across the board compared to the other countries. Their baseline gasoline is a pure blend with no ethanol, which is imported from several different countries. Compared to this baseline, the majority of natural gas pathways investigated in this study offer lower lifecycle emissions (Figures 31 and 32). A significant amount of coal is used in Israel’s electricity generation mix, impacting fuel production, feedstock recovery, fuel dispensing, and vehicle material production due to the power required in each step.
Figure 31: LDV Emissions for Natural Gas Pathways in Israel
Figure 32: HDV Emissions for Natural Gas Pathways in Israel
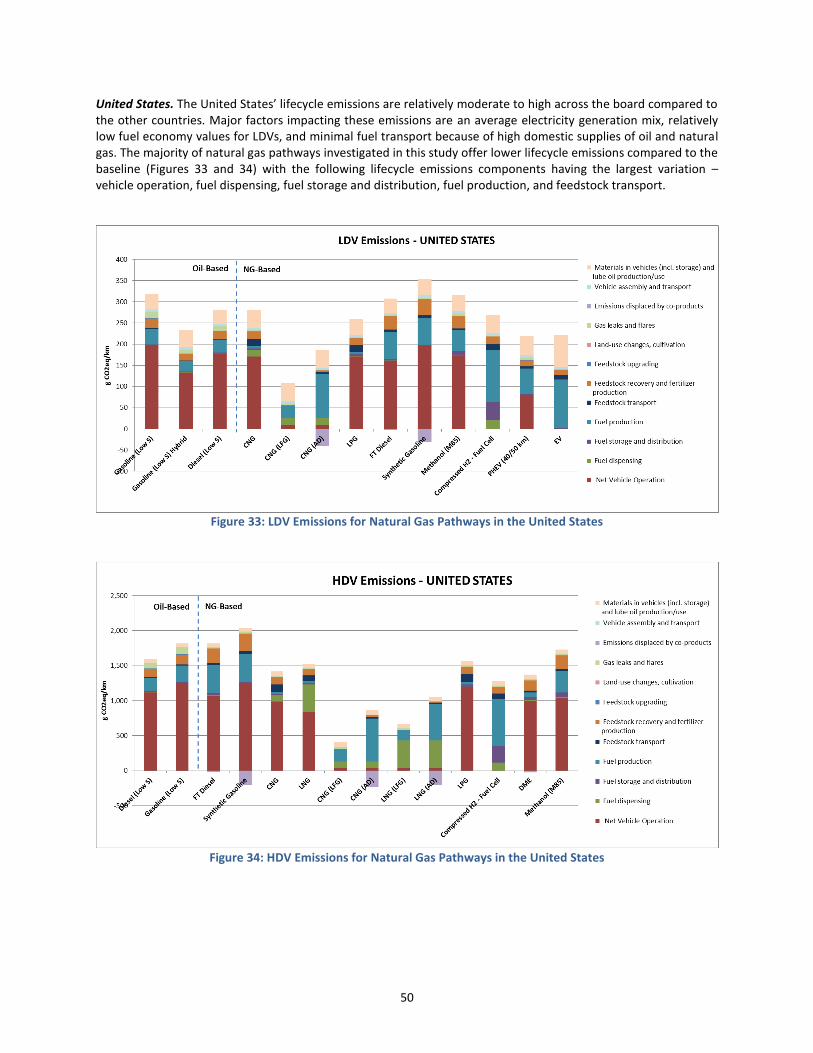
50
United States. The United States’ lifecycle emissions are relatively moderate to high across the board compared to the other countries. Major factors impacting these emissions are an average electricity generation mix, relatively low fuel economy values for LDVs, and minimal fuel transport because of high domestic supplies of oil and natural gas. The majority of natural gas pathways investigated in this study offer lower lifecycle emissions compared to the baseline (Figures 33 and 34) with the following lifecycle emissions components having the largest variation – vehicle operation, fuel dispensing, fuel storage and distribution, fuel production, and feedstock transport.
Figure 33: LDV Emissions for Natural Gas Pathways in the United States
Figure 34: HDV Emissions for Natural Gas Pathways in the United States
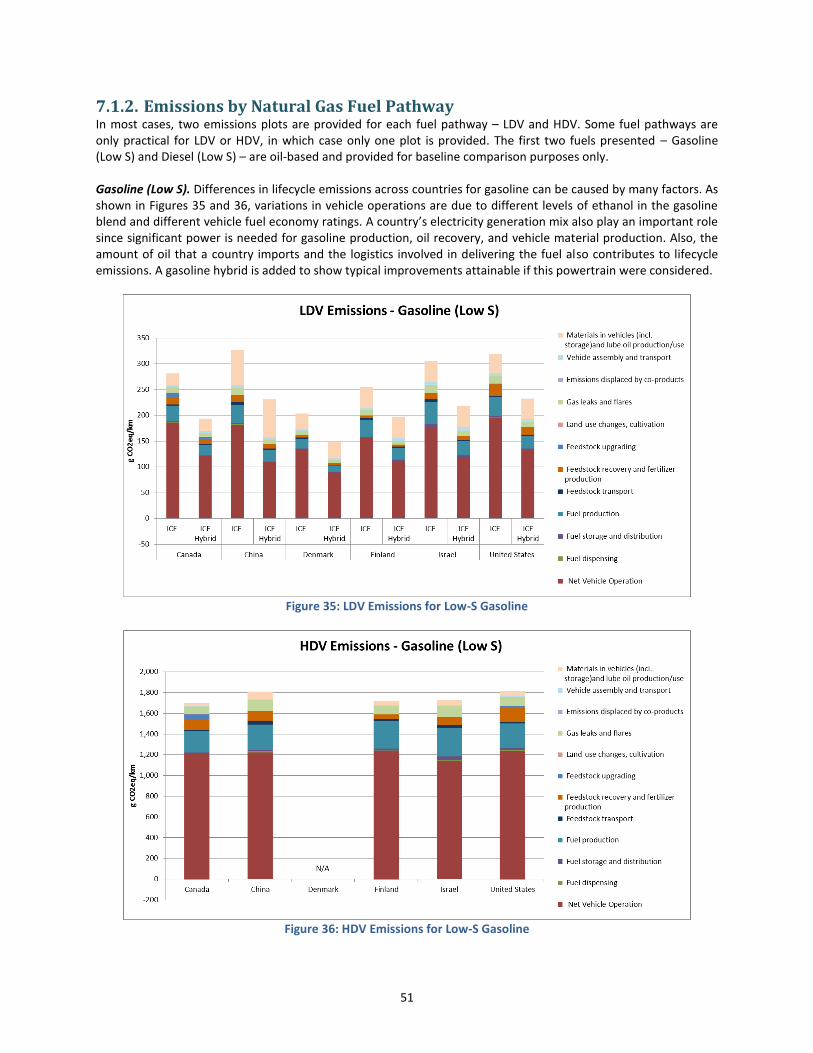
51
7.1.2. Emissions by Natural Gas Fuel Pathway In most cases, two emissions plots are provided for each fuel pathway – LDV and HDV. Some fuel pathways are only practical for LDV or HDV, in which case only one plot is provided. The first two fuels presented – Gasoline (Low S) and Diesel (Low S) – are oil-based and provided for baseline comparison purposes only. Gasoline (Low S). Differences in lifecycle emissions across countries for gasoline can be caused by many factors. As shown in Figures 35 and 36, variations in vehicle operations are due to different levels of ethanol in the gasoline blend and different vehicle fuel economy ratings. A country’s electricity generation mix also play an important role since significant power is needed for gasoline production, oil recovery, and vehicle material production. Also, the amount of oil that a country imports and the logistics involved in delivering the fuel also contributes to lifecycle emissions. A gasoline hybrid is added to show typical improvements attainable if this powertrain were considered.
Figure 35: LDV Emissions for Low-S Gasoline
Figure 36: HDV Emissions for Low-S Gasoline
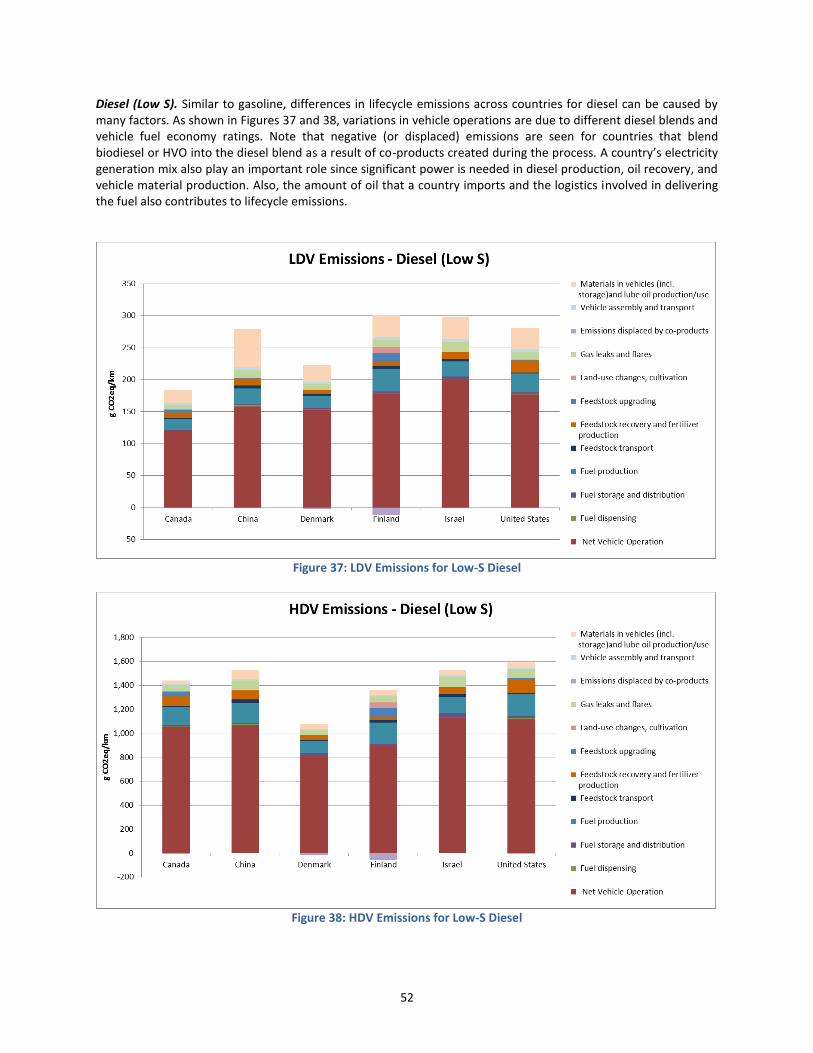
52
Diesel (Low S). Similar to gasoline, differences in lifecycle emissions across countries for diesel can be caused by many factors. As shown in Figures 37 and 38, variations in vehicle operations are due to different diesel blends and vehicle fuel economy ratings. Note that negative (or displaced) emissions are seen for countries that blend biodiesel or HVO into the diesel blend as a result of co-products created during the process. A country’s electricity generation mix also play an important role since significant power is needed in diesel production, oil recovery, and vehicle material production. Also, the amount of oil that a country imports and the logistics involved in delivering the fuel also contributes to lifecycle emissions.
Figure 37: LDV Emissions for Low-S Diesel
Figure 38: HDV Emissions for Low-S Diesel
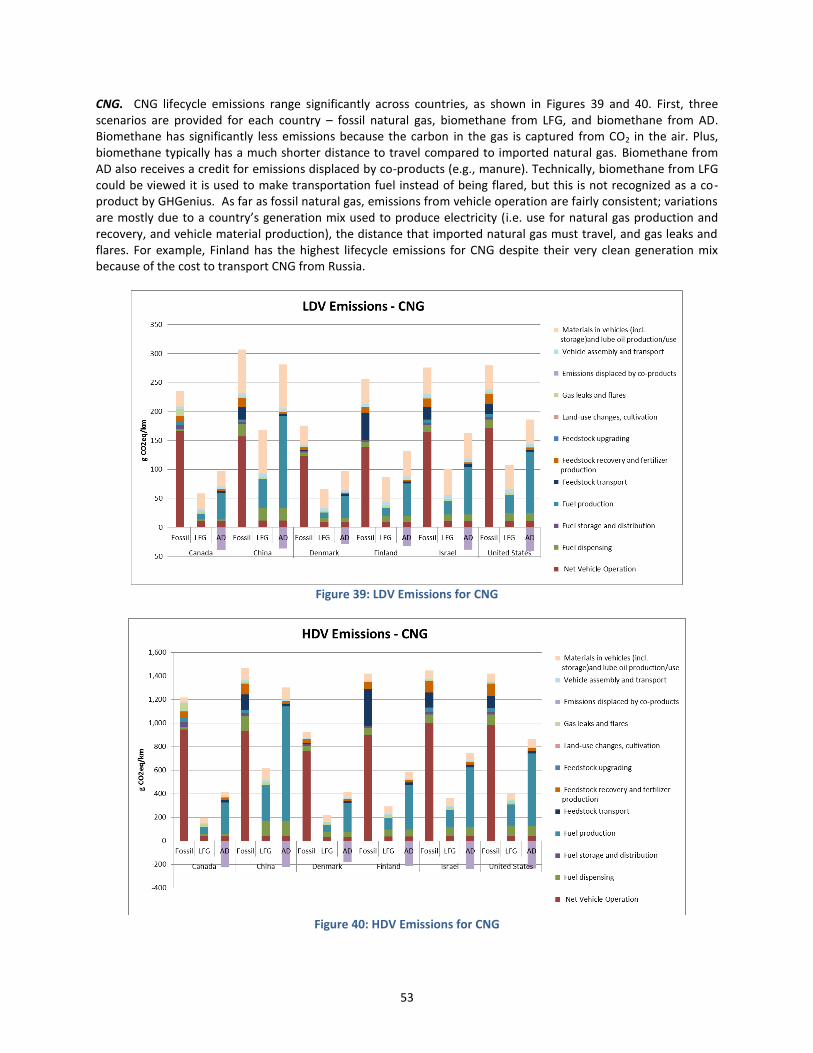
53
CNG. CNG lifecycle emissions range significantly across countries, as shown in Figures 39 and 40. First, three scenarios are provided for each country – fossil natural gas, biomethane from LFG, and biomethane from AD. Biomethane has significantly less emissions because the carbon in the gas is captured from CO2 in the air. Plus, biomethane typically has a much shorter distance to travel compared to imported natural gas. Biomethane from AD also receives a credit for emissions displaced by co-products (e.g., manure). Technically, biomethane from LFG could be viewed it is used to make transportation fuel instead of being flared, but this is not recognized as a co-product by GHGenius. As far as fossil natural gas, emissions from vehicle operation are fairly consistent; variations are mostly due to a country’s generation mix used to produce electricity (i.e. use for natural gas production and recovery, and vehicle material production), the distance that imported natural gas must travel, and gas leaks and flares. For example, Finland has the highest lifecycle emissions for CNG despite their very clean generation mix because of the cost to transport CNG from Russia.
Figure 39: LDV Emissions for CNG
Figure 40: HDV Emissions for CNG
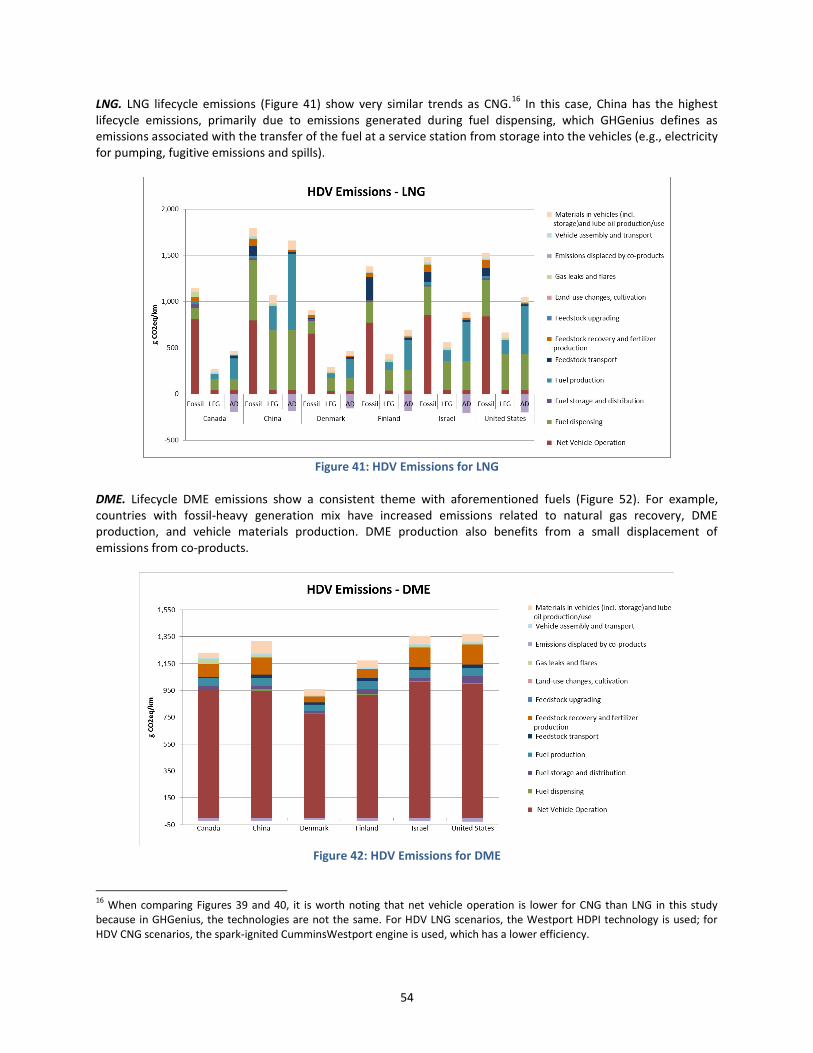
54
LNG. LNG lifecycle emissions (Figure 41) show very similar trends as CNG.16
In this case, China has the highest lifecycle emissions, primarily due to emissions generated during fuel dispensing, which GHGenius defines as emissions associated with the transfer of the fuel at a service station from storage into the vehicles (e.g., electricity for pumping, fugitive emissions and spills).
Figure 41: HDV Emissions for LNG
DME. Lifecycle DME emissions show a consistent theme with aforementioned fuels (Figure 52). For example, countries with fossil-heavy generation mix have increased emissions related to natural gas recovery, DME production, and vehicle materials production. DME production also benefits from a small displacement of emissions from co-products.
Figure 42: HDV Emissions for DME
16
When comparing Figures 39 and 40, it is worth noting that net vehicle operation is lower for CNG than LNG in this study because in GHGenius, the technologies are not the same. For HDV LNG scenarios, the Westport HDPI technology is used; for HDV CNG scenarios, the spark-ignited CumminsWestport engine is used, which has a lower efficiency.

55
LPG. Differences in lifecycle emissions for LPG (Figures 42 and 43) are highly dependent on a country’s electricity generation mix since significant amounts of power are needed in LPG production, natural gas recovery, and vehicle material production. Vehicle operation emissions are fairly consistent across countries; differences would be primarily due to country-specific fuel economies.
Figure 43: LDV Emissions for LPG
Figure 44: HDV Emissions for LPG
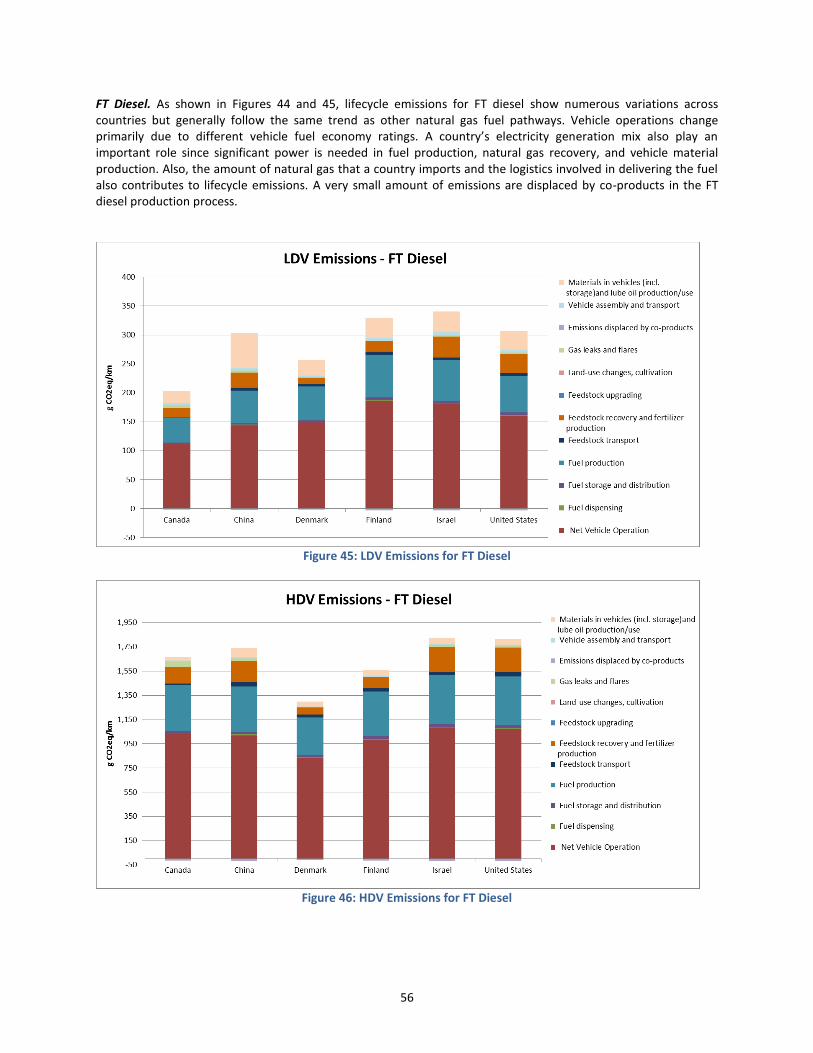
56
FT Diesel. As shown in Figures 44 and 45, lifecycle emissions for FT diesel show numerous variations across countries but generally follow the same trend as other natural gas fuel pathways. Vehicle operations change primarily due to different vehicle fuel economy ratings. A country’s electricity generation mix also play an important role since significant power is needed in fuel production, natural gas recovery, and vehicle material production. Also, the amount of natural gas that a country imports and the logistics involved in delivering the fuel also contributes to lifecycle emissions. A very small amount of emissions are displaced by co-products in the FT diesel production process.
Figure 45: LDV Emissions for FT Diesel
Figure 46: HDV Emissions for FT Diesel
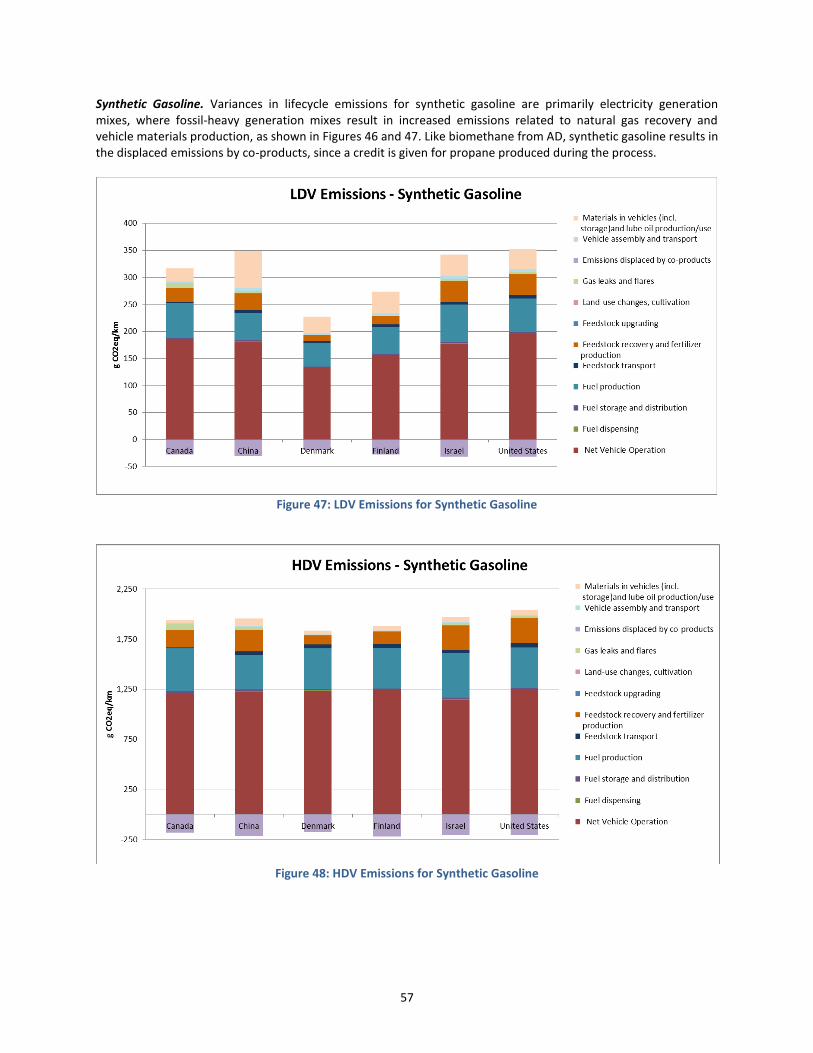
57
Synthetic Gasoline. Variances in lifecycle emissions for synthetic gasoline are primarily electricity generation mixes, where fossil-heavy generation mixes result in increased emissions related to natural gas recovery and vehicle materials production, as shown in Figures 46 and 47. Like biomethane from AD, synthetic gasoline results in the displaced emissions by co-products, since a credit is given for propane produced during the process.
Figure 47: LDV Emissions for Synthetic Gasoline
Figure 48: HDV Emissions for Synthetic Gasoline
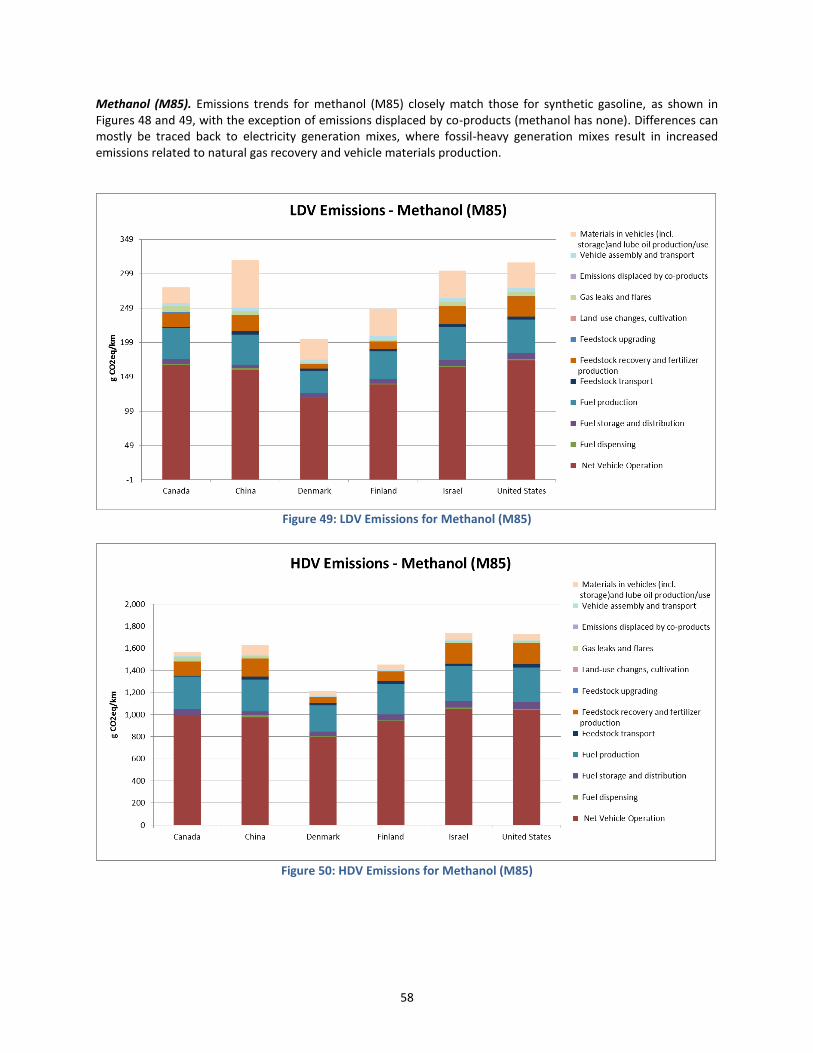
58
Methanol (M85). Emissions trends for methanol (M85) closely match those for synthetic gasoline, as shown in Figures 48 and 49, with the exception of emissions displaced by co-products (methanol has none). Differences can mostly be traced back to electricity generation mixes, where fossil-heavy generation mixes result in increased emissions related to natural gas recovery and vehicle materials production.
Figure 49: LDV Emissions for Methanol (M85)
Figure 50: HDV Emissions for Methanol (M85)
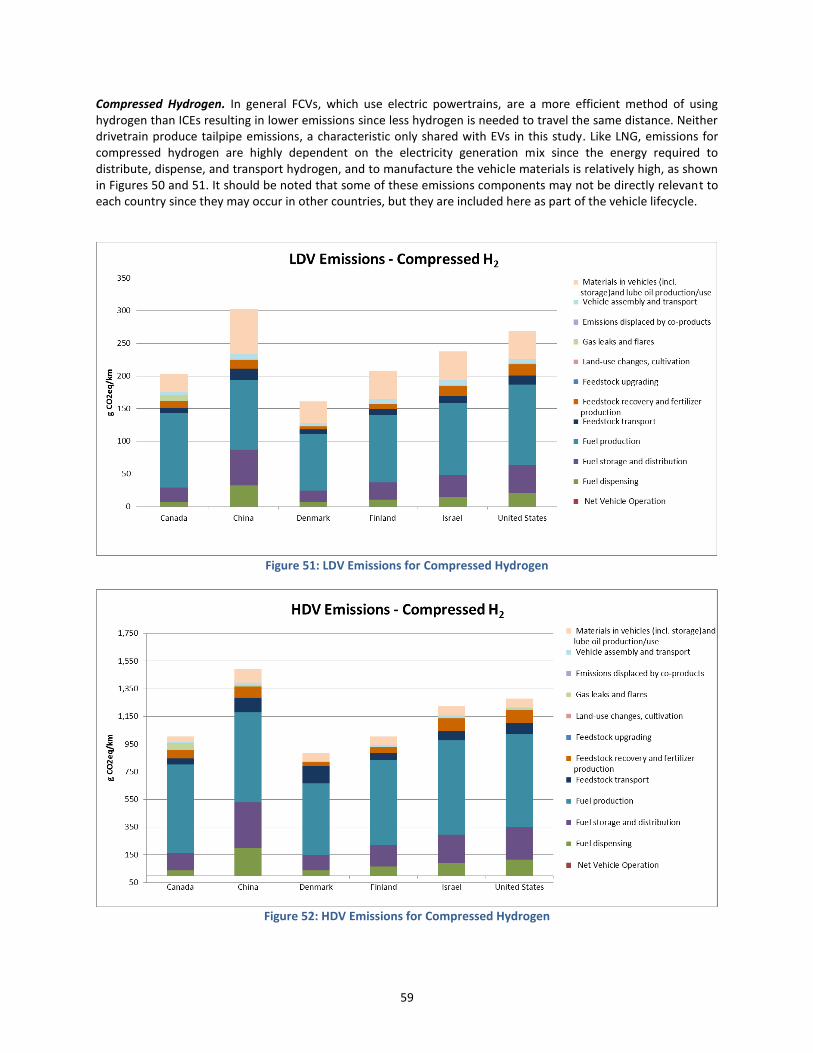
59
Compressed Hydrogen. In general FCVs, which use electric powertrains, are a more efficient method of using hydrogen than ICEs resulting in lower emissions since less hydrogen is needed to travel the same distance. Neither drivetrain produce tailpipe emissions, a characteristic only shared with EVs in this study. Like LNG, emissions for compressed hydrogen are highly dependent on the electricity generation mix since the energy required to distribute, dispense, and transport hydrogen, and to manufacture the vehicle materials is relatively high, as shown in Figures 50 and 51. It should be noted that some of these emissions components may not be directly relevant to each country since they may occur in other countries, but they are included here as part of the vehicle lifecycle.
Figure 51: LDV Emissions for Compressed Hydrogen
Figure 52: HDV Emissions for Compressed Hydrogen
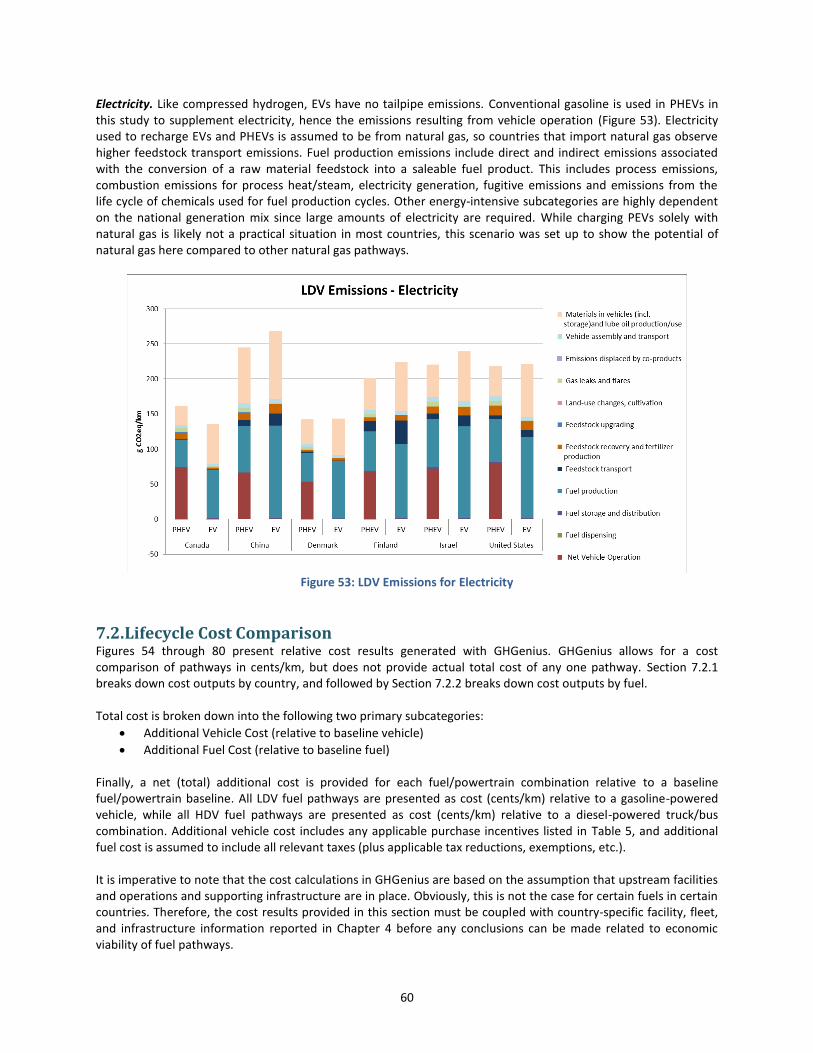
60
Electricity. Like compressed hydrogen, EVs have no tailpipe emissions. Conventional gasoline is used in PHEVs in this study to supplement electricity, hence the emissions resulting from vehicle operation (Figure 53). Electricity used to recharge EVs and PHEVs is assumed to be from natural gas, so countries that import natural gas observe higher feedstock transport emissions. Fuel production emissions include direct and indirect emissions associated with the conversion of a raw material feedstock into a saleable fuel product. This includes process emissions, combustion emissions for process heat/steam, electricity generation, fugitive emissions and emissions from the life cycle of chemicals used for fuel production cycles. Other energy-intensive subcategories are highly dependent on the national generation mix since large amounts of electricity are required. While charging PEVs solely with natural gas is likely not a practical situation in most countries, this scenario was set up to show the potential of natural gas here compared to other natural gas pathways.
Figure 53: LDV Emissions for Electricity
7.2. Lifecycle Cost Comparison Figures 54 through 80 present relative cost results generated with GHGenius. GHGenius allows for a cost comparison of pathways in cents/km, but does not provide actual total cost of any one pathway. Section 7.2.1 breaks down cost outputs by country, and followed by Section 7.2.2 breaks down cost outputs by fuel. Total cost is broken down into the following two primary subcategories:
Additional Vehicle Cost (relative to baseline vehicle)
Additional Fuel Cost (relative to baseline fuel) Finally, a net (total) additional cost is provided for each fuel/powertrain combination relative to a baseline fuel/powertrain baseline. All LDV fuel pathways are presented as cost (cents/km) relative to a gasoline-powered vehicle, while all HDV fuel pathways are presented as cost (cents/km) relative to a diesel-powered truck/bus combination. Additional vehicle cost includes any applicable purchase incentives listed in Table 5, and additional fuel cost is assumed to include all relevant taxes (plus applicable tax reductions, exemptions, etc.). It is imperative to note that the cost calculations in GHGenius are based on the assumption that upstream facilities and operations and supporting infrastructure are in place. Obviously, this is not the case for certain fuels in certain countries. Therefore, the cost results provided in this section must be coupled with country-specific facility, fleet, and infrastructure information reported in Chapter 4 before any conclusions can be made related to economic viability of fuel pathways.
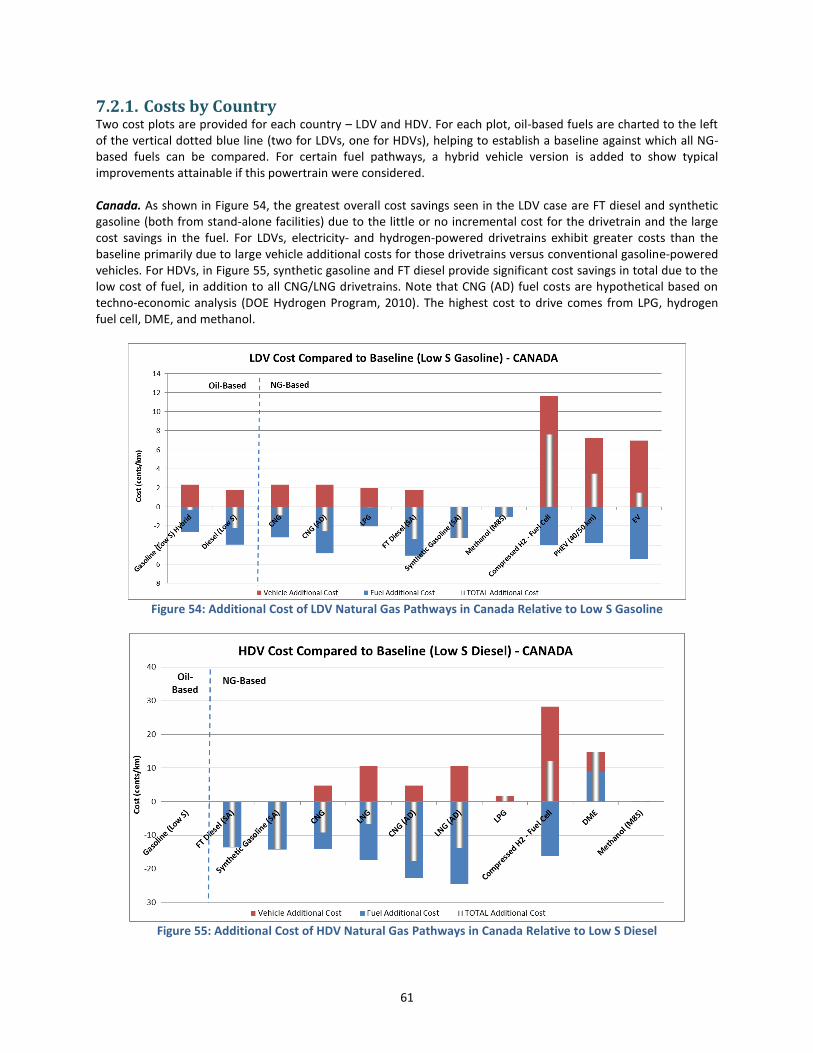
61
7.2.1. Costs by Country Two cost plots are provided for each country – LDV and HDV. For each plot, oil-based fuels are charted to the left of the vertical dotted blue line (two for LDVs, one for HDVs), helping to establish a baseline against which all NG-based fuels can be compared. For certain fuel pathways, a hybrid vehicle version is added to show typical improvements attainable if this powertrain were considered. Canada. As shown in Figure 54, the greatest overall cost savings seen in the LDV case are FT diesel and synthetic gasoline (both from stand-alone facilities) due to the little or no incremental cost for the drivetrain and the large cost savings in the fuel. For LDVs, electricity- and hydrogen-powered drivetrains exhibit greater costs than the baseline primarily due to large vehicle additional costs for those drivetrains versus conventional gasoline-powered vehicles. For HDVs, in Figure 55, synthetic gasoline and FT diesel provide significant cost savings in total due to the low cost of fuel, in addition to all CNG/LNG drivetrains. Note that CNG (AD) fuel costs are hypothetical based on techno-economic analysis (DOE Hydrogen Program, 2010). The highest cost to drive comes from LPG, hydrogen fuel cell, DME, and methanol.
Figure 54: Additional Cost of LDV Natural Gas Pathways in Canada Relative to Low S Gasoline
Figure 55: Additional Cost of HDV Natural Gas Pathways in Canada Relative to Low S Diesel
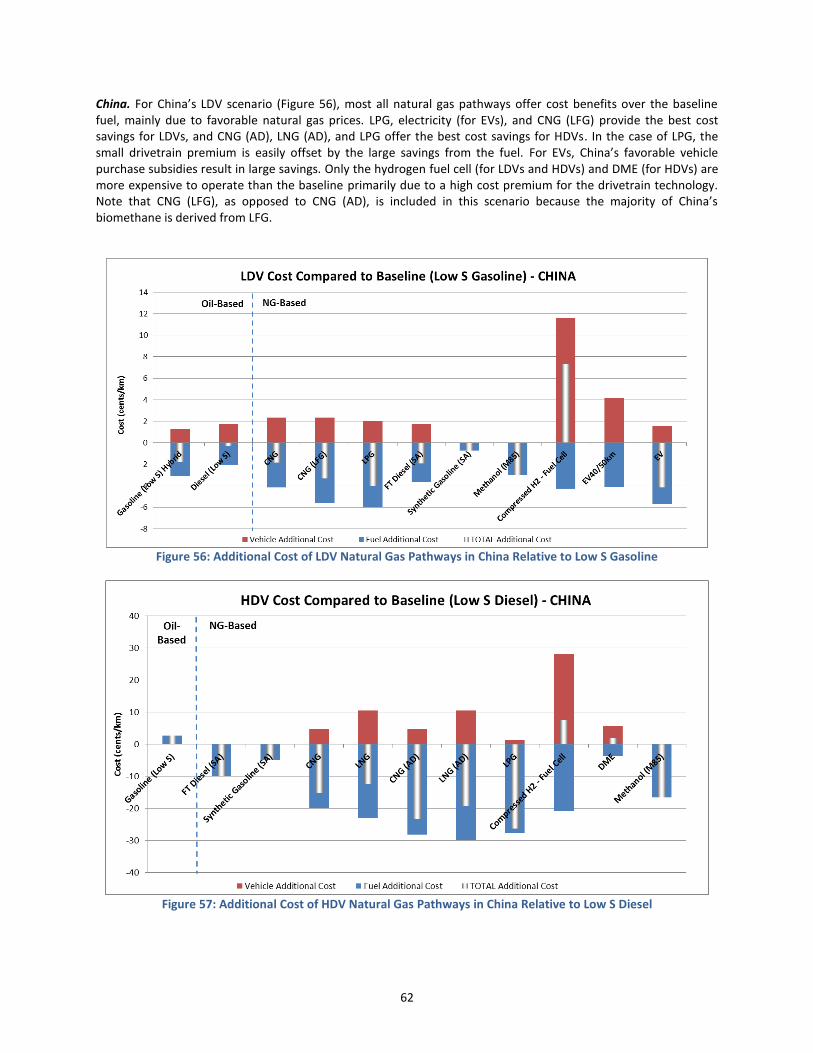
62
China. For China’s LDV scenario (Figure 56), most all natural gas pathways offer cost benefits over the baseline fuel, mainly due to favorable natural gas prices. LPG, electricity (for EVs), and CNG (LFG) provide the best cost savings for LDVs, and CNG (AD), LNG (AD), and LPG offer the best cost savings for HDVs. In the case of LPG, the small drivetrain premium is easily offset by the large savings from the fuel. For EVs, China’s favorable vehicle purchase subsidies result in large savings. Only the hydrogen fuel cell (for LDVs and HDVs) and DME (for HDVs) are more expensive to operate than the baseline primarily due to a high cost premium for the drivetrain technology. Note that CNG (LFG), as opposed to CNG (AD), is included in this scenario because the majority of China’s biomethane is derived from LFG.
Figure 56: Additional Cost of LDV Natural Gas Pathways in China Relative to Low S Gasoline
Figure 57: Additional Cost of HDV Natural Gas Pathways in China Relative to Low S Diesel
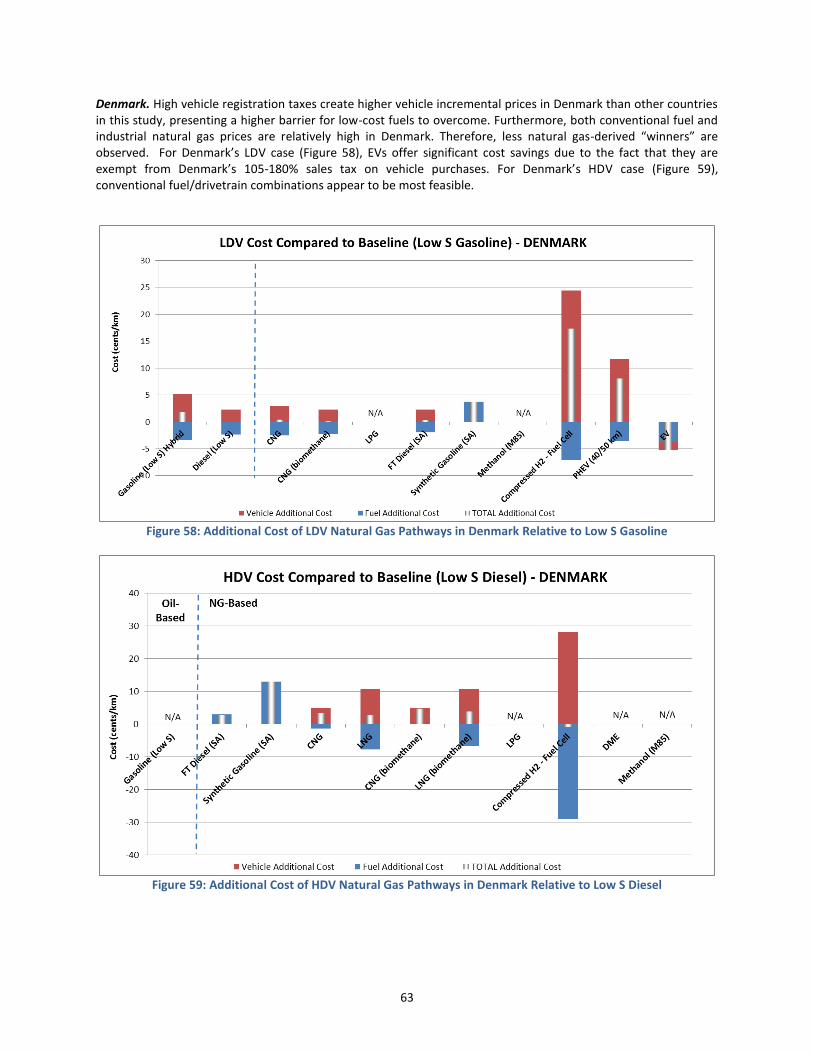
63
Denmark. High vehicle registration taxes create higher vehicle incremental prices in Denmark than other countries in this study, presenting a higher barrier for low-cost fuels to overcome. Furthermore, both conventional fuel and industrial natural gas prices are relatively high in Denmark. Therefore, less natural gas-derived “winners” are observed. For Denmark’s LDV case (Figure 58), EVs offer significant cost savings due to the fact that they are exempt from Denmark’s 105-180% sales tax on vehicle purchases. For Denmark’s HDV case (Figure 59), conventional fuel/drivetrain combinations appear to be most feasible.
Figure 58: Additional Cost of LDV Natural Gas Pathways in Denmark Relative to Low S Gasoline
Figure 59: Additional Cost of HDV Natural Gas Pathways in Denmark Relative to Low S Diesel
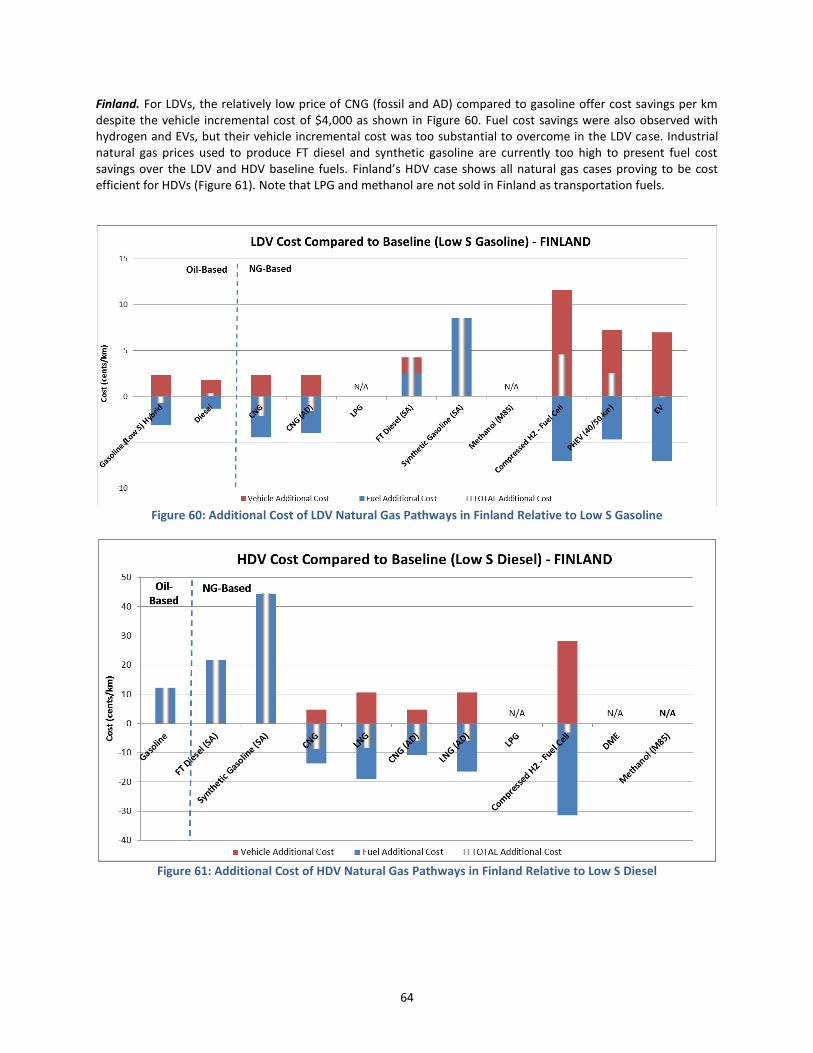
64
Finland. For LDVs, the relatively low price of CNG (fossil and AD) compared to gasoline offer cost savings per km despite the vehicle incremental cost of $4,000 as shown in Figure 60. Fuel cost savings were also observed with hydrogen and EVs, but their vehicle incremental cost was too substantial to overcome in the LDV case. Industrial natural gas prices used to produce FT diesel and synthetic gasoline are currently too high to present fuel cost savings over the LDV and HDV baseline fuels. Finland’s HDV case shows all natural gas cases proving to be cost efficient for HDVs (Figure 61). Note that LPG and methanol are not sold in Finland as transportation fuels.
Figure 60: Additional Cost of LDV Natural Gas Pathways in Finland Relative to Low S Gasoline
Figure 61: Additional Cost of HDV Natural Gas Pathways in Finland Relative to Low S Diesel
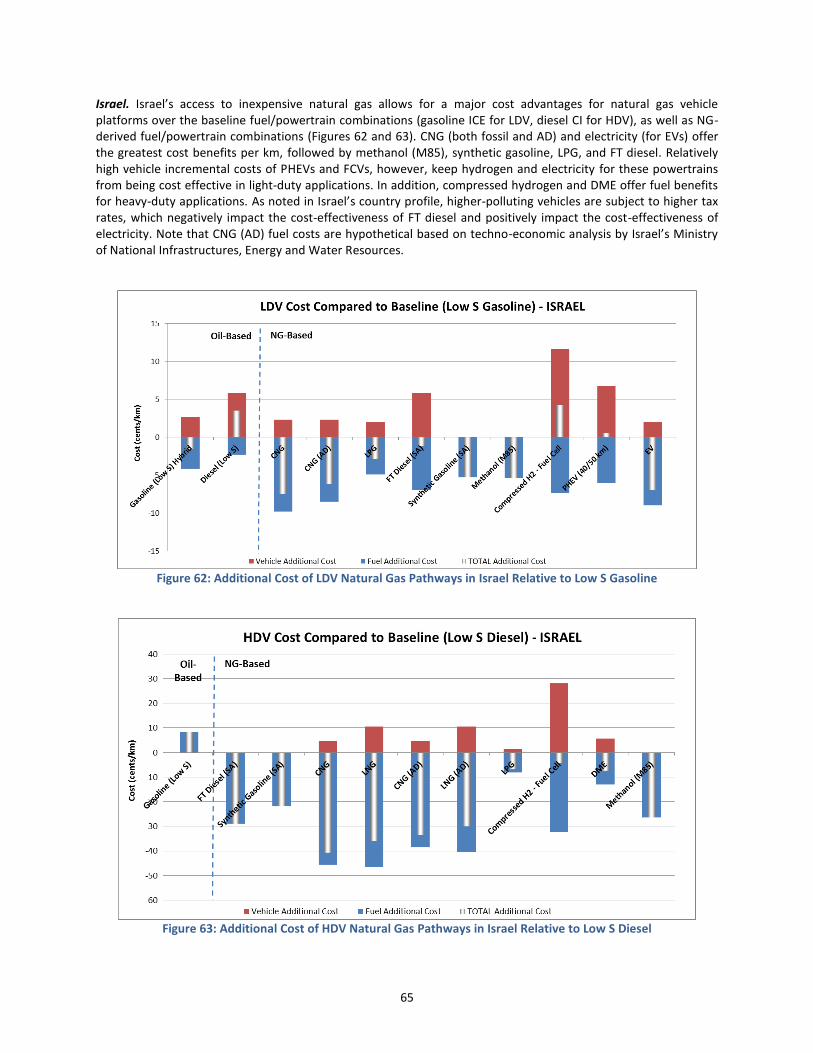
65
Israel. Israel’s access to inexpensive natural gas allows for a major cost advantages for natural gas vehicle platforms over the baseline fuel/powertrain combinations (gasoline ICE for LDV, diesel CI for HDV), as well as NG-derived fuel/powertrain combinations (Figures 62 and 63). CNG (both fossil and AD) and electricity (for EVs) offer the greatest cost benefits per km, followed by methanol (M85), synthetic gasoline, LPG, and FT diesel. Relatively high vehicle incremental costs of PHEVs and FCVs, however, keep hydrogen and electricity for these powertrains from being cost effective in light-duty applications. In addition, compressed hydrogen and DME offer fuel benefits for heavy-duty applications. As noted in Israel’s country profile, higher-polluting vehicles are subject to higher tax rates, which negatively impact the cost-effectiveness of FT diesel and positively impact the cost-effectiveness of electricity. Note that CNG (AD) fuel costs are hypothetical based on techno-economic analysis by Israel’s Ministry of National Infrastructures, Energy and Water Resources.
Figure 62: Additional Cost of LDV Natural Gas Pathways in Israel Relative to Low S Gasoline
Figure 63: Additional Cost of HDV Natural Gas Pathways in Israel Relative to Low S Diesel
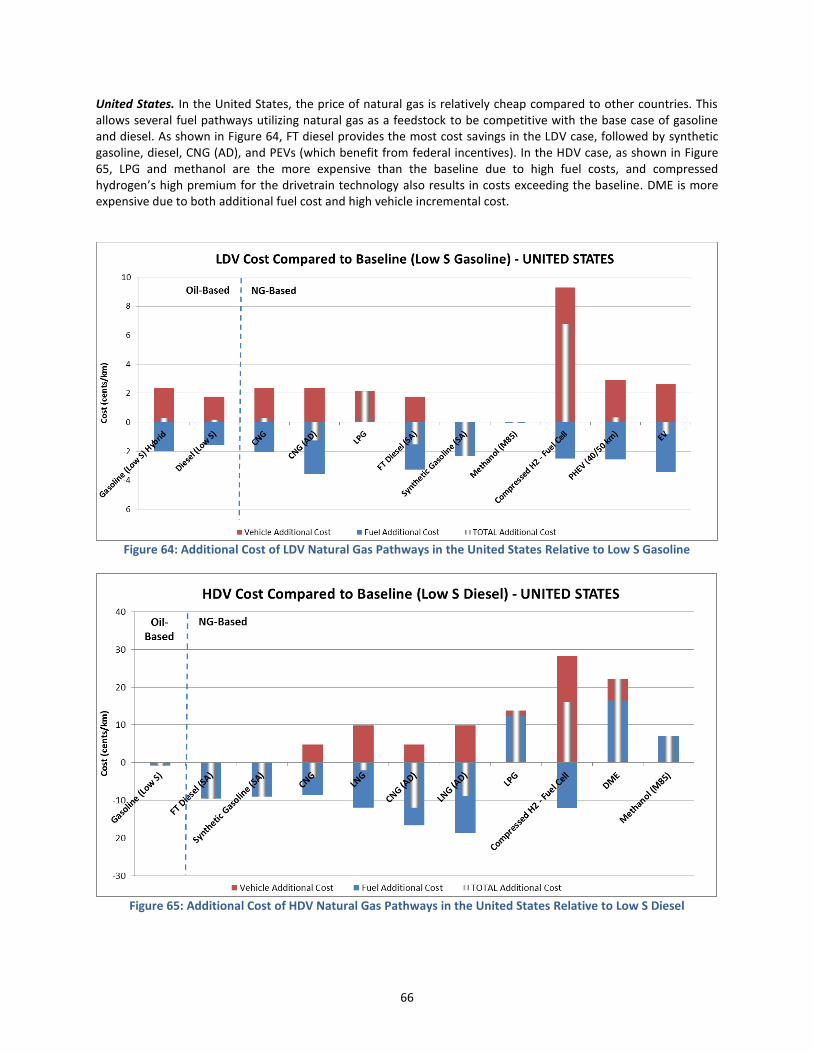
66
United States. In the United States, the price of natural gas is relatively cheap compared to other countries. This allows several fuel pathways utilizing natural gas as a feedstock to be competitive with the base case of gasoline and diesel. As shown in Figure 64, FT diesel provides the most cost savings in the LDV case, followed by synthetic gasoline, diesel, CNG (AD), and PEVs (which benefit from federal incentives). In the HDV case, as shown in Figure 65, LPG and methanol are the more expensive than the baseline due to high fuel costs, and compressed hydrogen’s high premium for the drivetrain technology also results in costs exceeding the baseline. DME is more expensive due to both additional fuel cost and high vehicle incremental cost.
Figure 64: Additional Cost of LDV Natural Gas Pathways in the United States Relative to Low S Gasoline
Figure 65: Additional Cost of HDV Natural Gas Pathways in the United States Relative to Low S Diesel
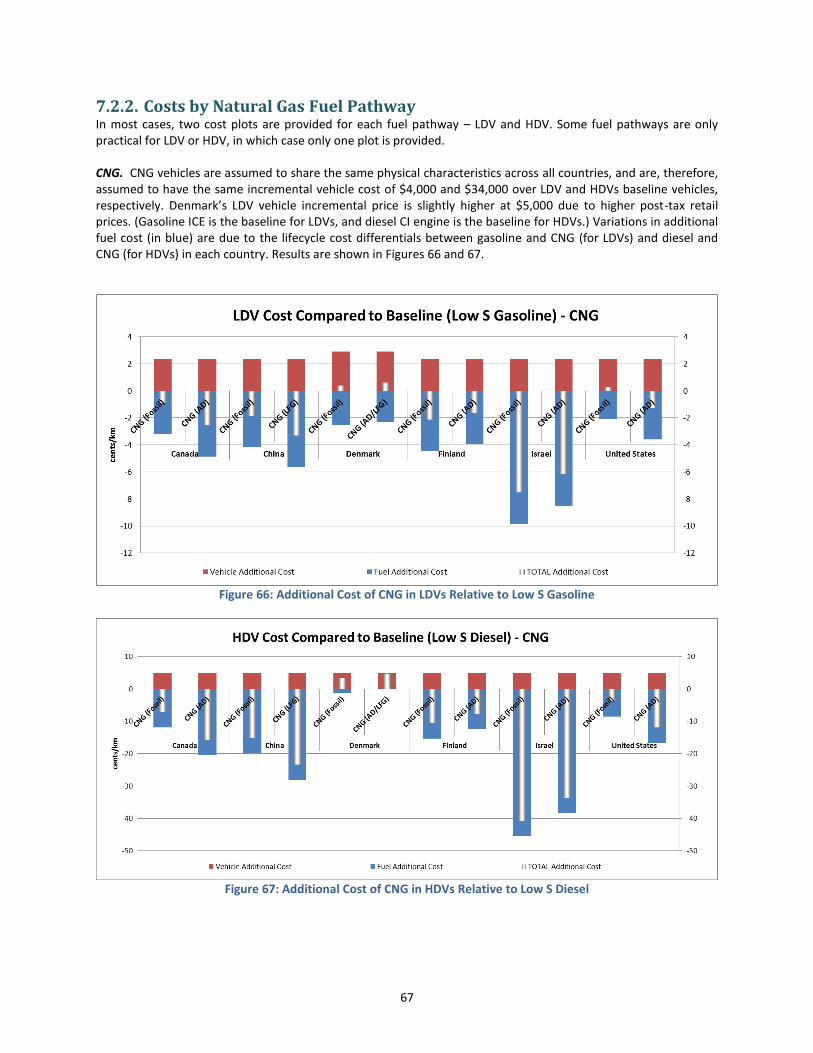
67
7.2.2. Costs by Natural Gas Fuel Pathway In most cases, two cost plots are provided for each fuel pathway – LDV and HDV. Some fuel pathways are only practical for LDV or HDV, in which case only one plot is provided. CNG. CNG vehicles are assumed to share the same physical characteristics across all countries, and are, therefore, assumed to have the same incremental vehicle cost of $4,000 and $34,000 over LDV and HDVs baseline vehicles, respectively. Denmark’s LDV vehicle incremental price is slightly higher at $5,000 due to higher post-tax retail prices. (Gasoline ICE is the baseline for LDVs, and diesel CI engine is the baseline for HDVs.) Variations in additional fuel cost (in blue) are due to the lifecycle cost differentials between gasoline and CNG (for LDVs) and diesel and CNG (for HDVs) in each country. Results are shown in Figures 66 and 67.
Figure 66: Additional Cost of CNG in LDVs Relative to Low S Gasoline
Figure 67: Additional Cost of CNG in HDVs Relative to Low S Diesel
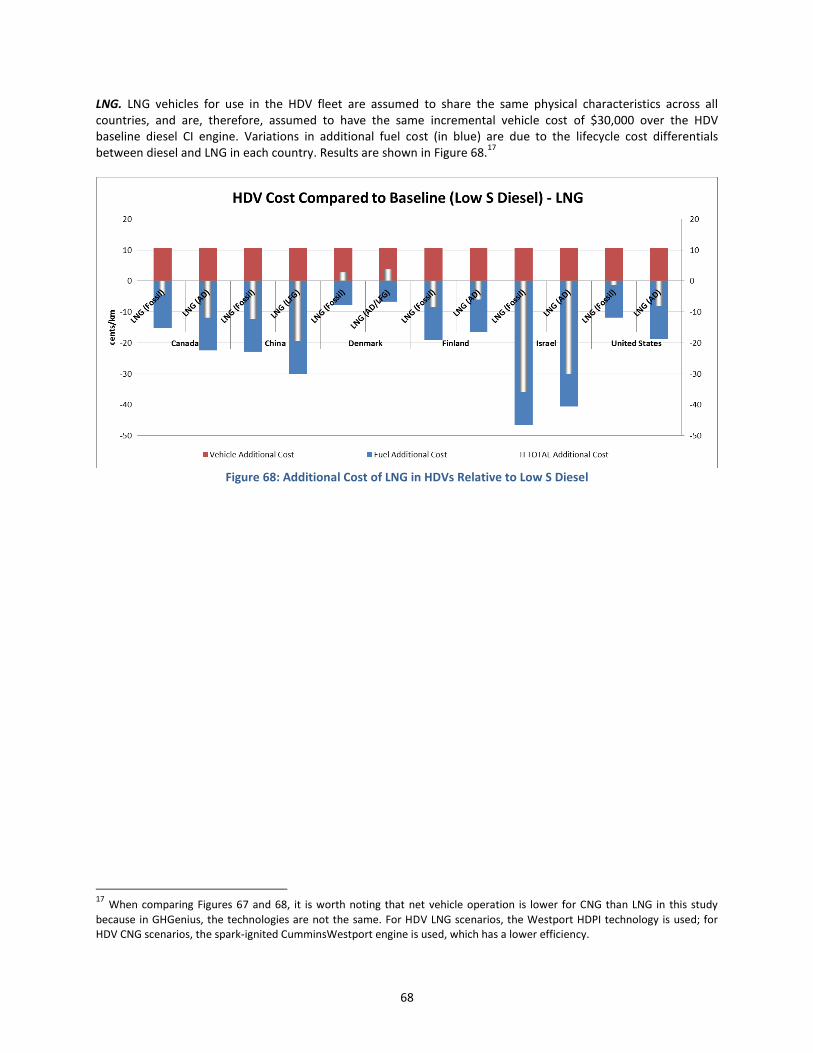
68
LNG. LNG vehicles for use in the HDV fleet are assumed to share the same physical characteristics across all countries, and are, therefore, assumed to have the same incremental vehicle cost of $30,000 over the HDV baseline diesel CI engine. Variations in additional fuel cost (in blue) are due to the lifecycle cost differentials between diesel and LNG in each country. Results are shown in Figure 68.
17
Figure 68: Additional Cost of LNG in HDVs Relative to Low S Diesel
17
When comparing Figures 67 and 68, it is worth noting that net vehicle operation is lower for CNG than LNG in this study
because in GHGenius, the technologies are not the same. For HDV LNG scenarios, the Westport HDPI technology is used; for HDV CNG scenarios, the spark-ignited CumminsWestport engine is used, which has a lower efficiency.
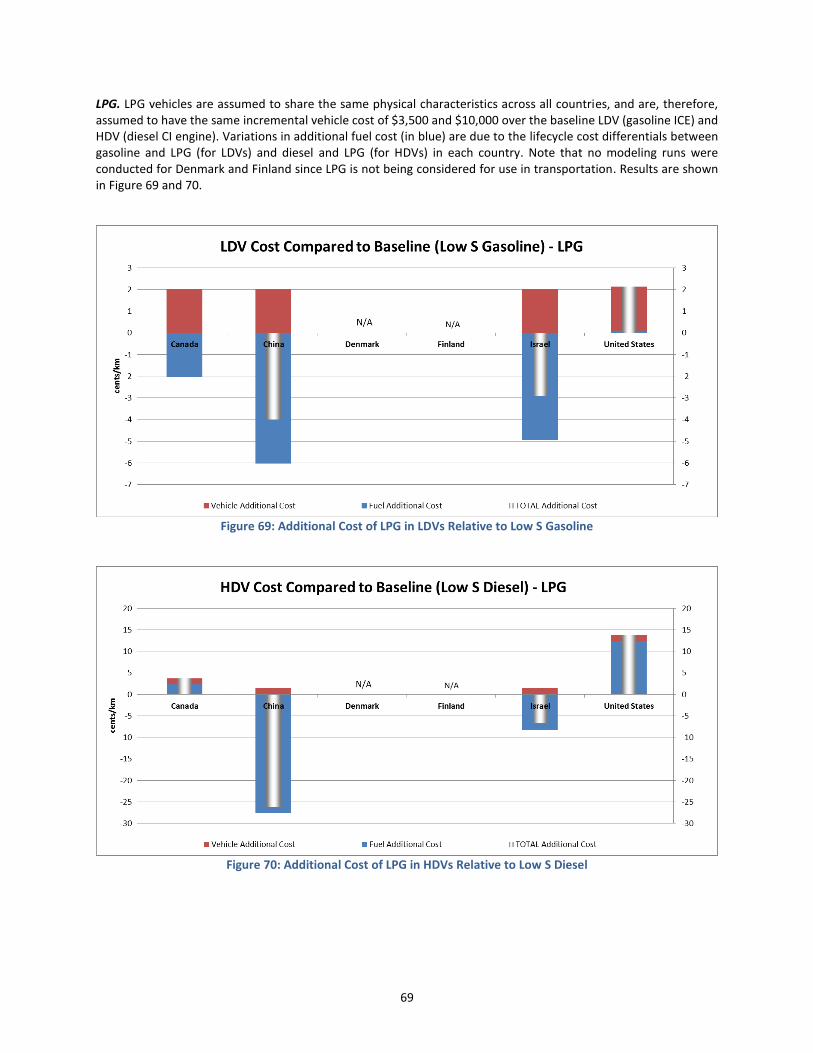
69
LPG. LPG vehicles are assumed to share the same physical characteristics across all countries, and are, therefore, assumed to have the same incremental vehicle cost of $3,500 and $10,000 over the baseline LDV (gasoline ICE) and HDV (diesel CI engine). Variations in additional fuel cost (in blue) are due to the lifecycle cost differentials between gasoline and LPG (for LDVs) and diesel and LPG (for HDVs) in each country. Note that no modeling runs were conducted for Denmark and Finland since LPG is not being considered for use in transportation. Results are shown in Figure 69 and 70.
Figure 69: Additional Cost of LPG in LDVs Relative to Low S Gasoline
Figure 70: Additional Cost of LPG in HDVs Relative to Low S Diesel
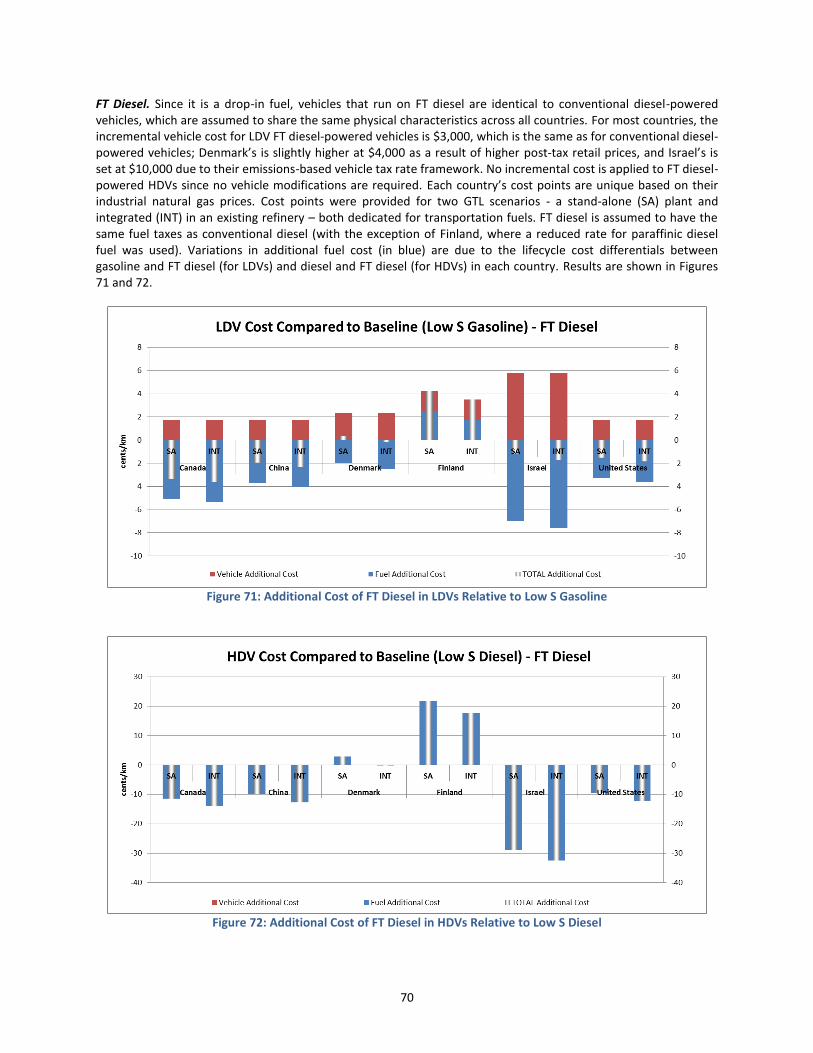
70
FT Diesel. Since it is a drop-in fuel, vehicles that run on FT diesel are identical to conventional diesel-powered vehicles, which are assumed to share the same physical characteristics across all countries. For most countries, the incremental vehicle cost for LDV FT diesel-powered vehicles is $3,000, which is the same as for conventional diesel-powered vehicles; Denmark’s is slightly higher at $4,000 as a result of higher post-tax retail prices, and Israel’s is set at $10,000 due to their emissions-based vehicle tax rate framework. No incremental cost is applied to FT diesel-powered HDVs since no vehicle modifications are required. Each country’s cost points are unique based on their industrial natural gas prices. Cost points were provided for two GTL scenarios - a stand-alone (SA) plant and integrated (INT) in an existing refinery – both dedicated for transportation fuels. FT diesel is assumed to have the same fuel taxes as conventional diesel (with the exception of Finland, where a reduced rate for paraffinic diesel fuel was used). Variations in additional fuel cost (in blue) are due to the lifecycle cost differentials between gasoline and FT diesel (for LDVs) and diesel and FT diesel (for HDVs) in each country. Results are shown in Figures 71 and 72.
Figure 71: Additional Cost of FT Diesel in LDVs Relative to Low S Gasoline
Figure 72: Additional Cost of FT Diesel in HDVs Relative to Low S Diesel
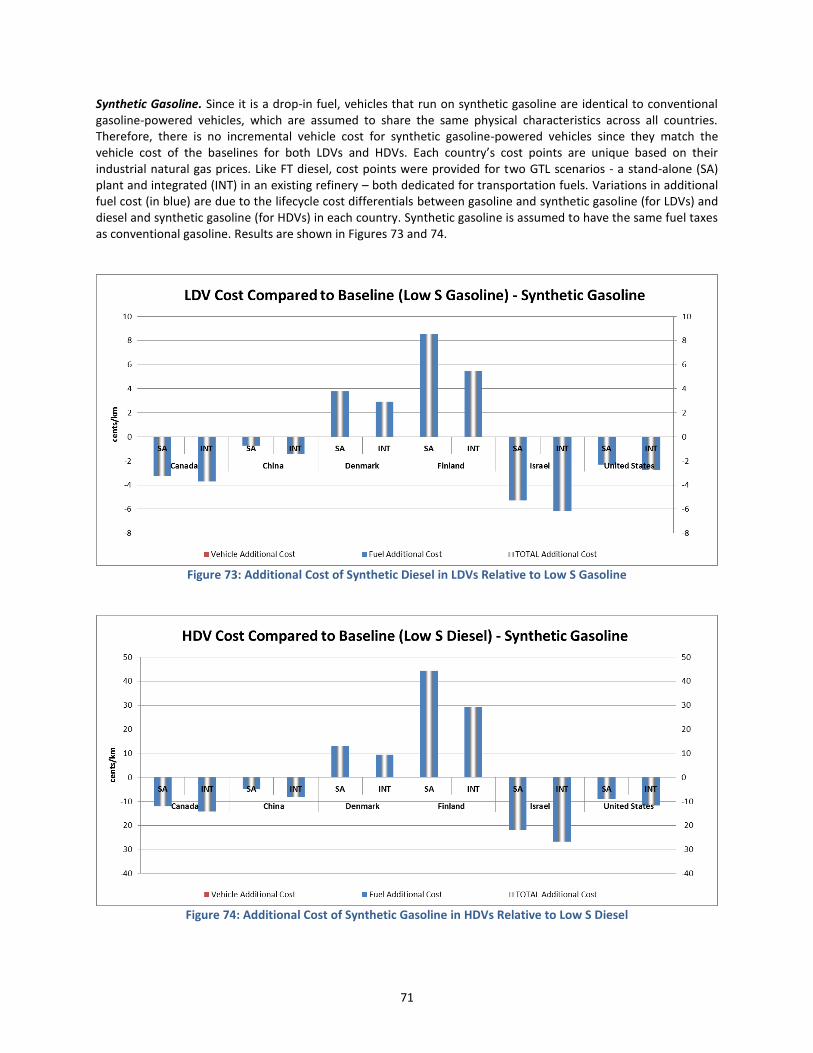
71
Synthetic Gasoline. Since it is a drop-in fuel, vehicles that run on synthetic gasoline are identical to conventional gasoline-powered vehicles, which are assumed to share the same physical characteristics across all countries. Therefore, there is no incremental vehicle cost for synthetic gasoline-powered vehicles since they match the vehicle cost of the baselines for both LDVs and HDVs. Each country’s cost points are unique based on their industrial natural gas prices. Like FT diesel, cost points were provided for two GTL scenarios - a stand-alone (SA) plant and integrated (INT) in an existing refinery – both dedicated for transportation fuels. Variations in additional fuel cost (in blue) are due to the lifecycle cost differentials between gasoline and synthetic gasoline (for LDVs) and diesel and synthetic gasoline (for HDVs) in each country. Synthetic gasoline is assumed to have the same fuel taxes as conventional gasoline. Results are shown in Figures 73 and 74.
Figure 73: Additional Cost of Synthetic Diesel in LDVs Relative to Low S Gasoline
Figure 74: Additional Cost of Synthetic Gasoline in HDVs Relative to Low S Diesel
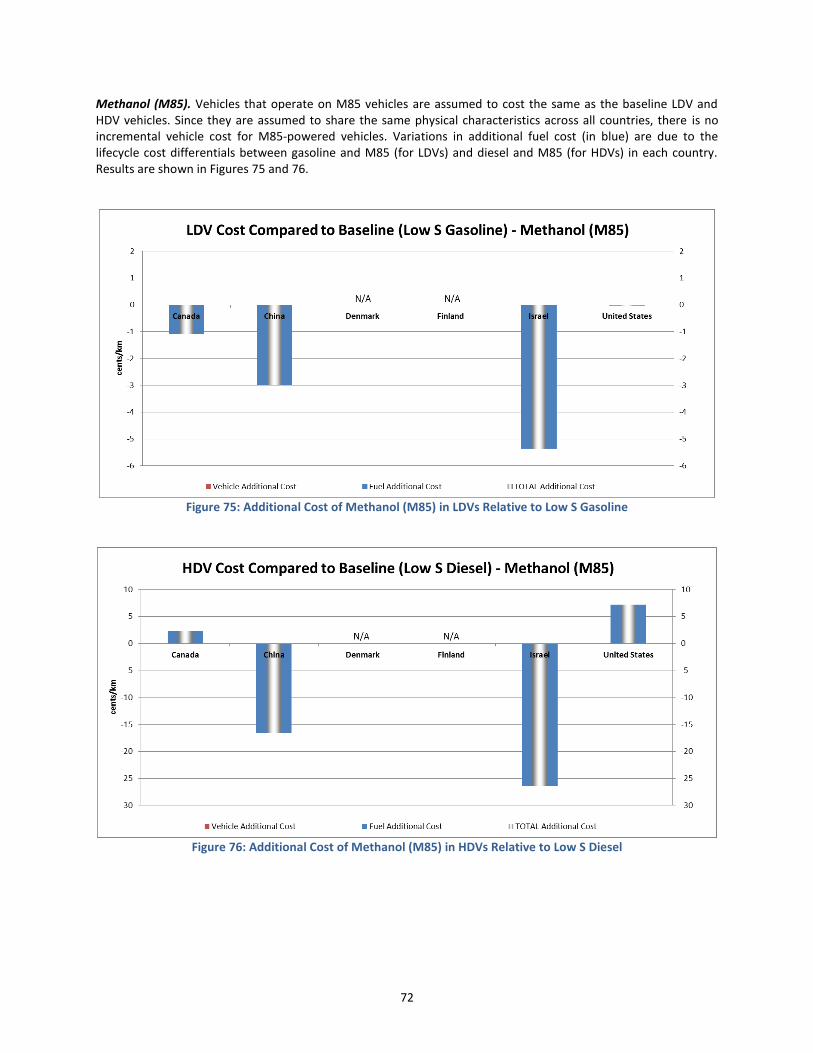
72
Methanol (M85). Vehicles that operate on M85 vehicles are assumed to cost the same as the baseline LDV and HDV vehicles. Since they are assumed to share the same physical characteristics across all countries, there is no incremental vehicle cost for M85-powered vehicles. Variations in additional fuel cost (in blue) are due to the lifecycle cost differentials between gasoline and M85 (for LDVs) and diesel and M85 (for HDVs) in each country. Results are shown in Figures 75 and 76.
Figure 75: Additional Cost of Methanol (M85) in LDVs Relative to Low S Gasoline
Figure 76: Additional Cost of Methanol (M85) in HDVs Relative to Low S Diesel
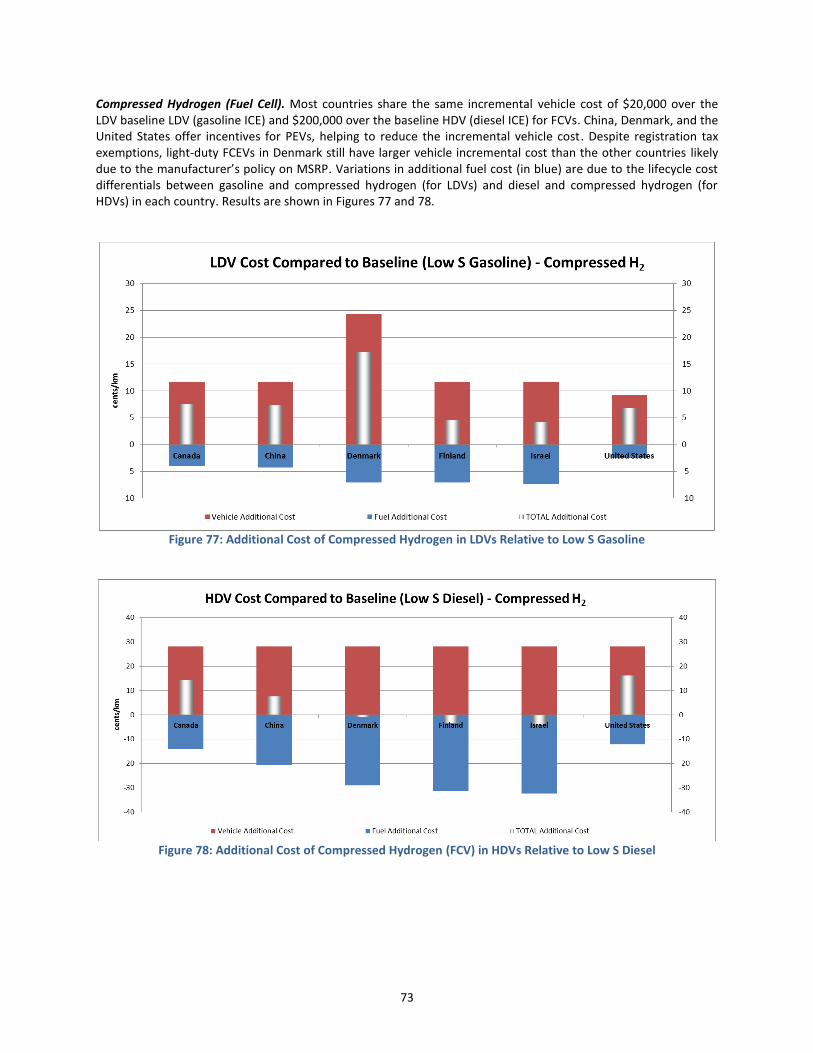
73
Compressed Hydrogen (Fuel Cell). Most countries share the same incremental vehicle cost of $20,000 over the LDV baseline LDV (gasoline ICE) and $200,000 over the baseline HDV (diesel ICE) for FCVs. China, Denmark, and the United States offer incentives for PEVs, helping to reduce the incremental vehicle cost. Despite registration tax exemptions, light-duty FCEVs in Denmark still have larger vehicle incremental cost than the other countries likely due to the manufacturer’s policy on MSRP. Variations in additional fuel cost (in blue) are due to the lifecycle cost differentials between gasoline and compressed hydrogen (for LDVs) and diesel and compressed hydrogen (for HDVs) in each country. Results are shown in Figures 77 and 78.
Figure 77: Additional Cost of Compressed Hydrogen in LDVs Relative to Low S Gasoline
Figure 78: Additional Cost of Compressed Hydrogen (FCV) in HDVs Relative to Low S Diesel
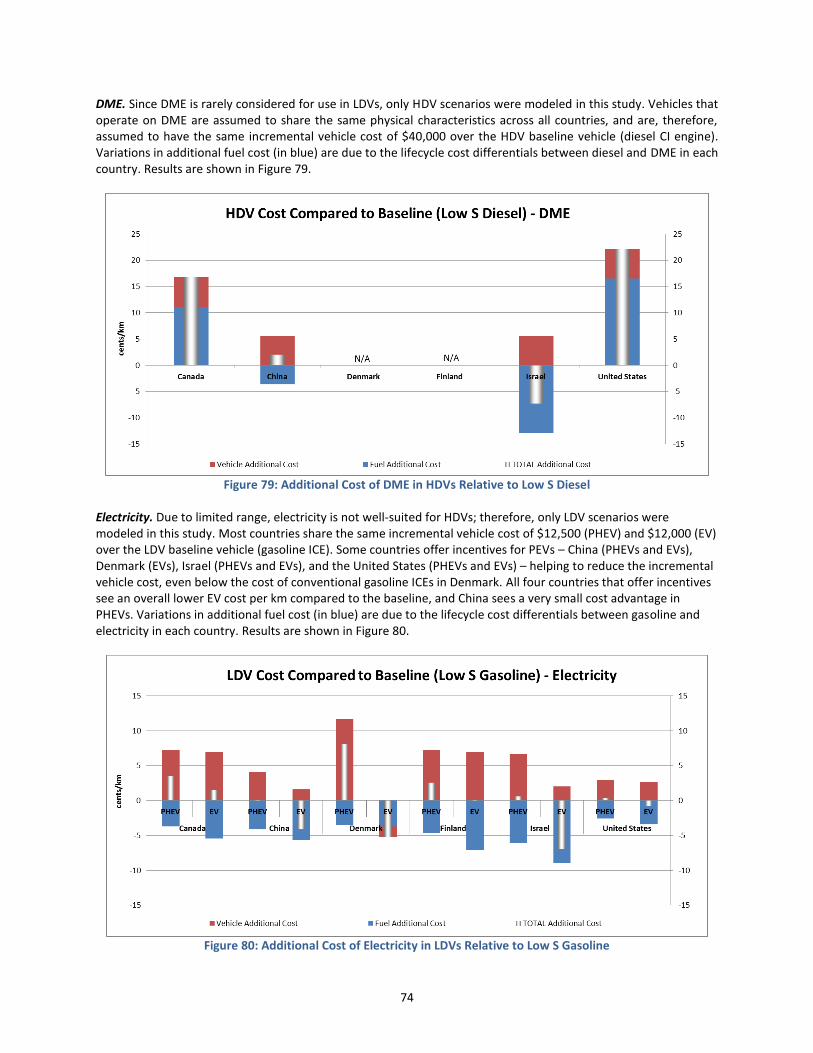
74
DME. Since DME is rarely considered for use in LDVs, only HDV scenarios were modeled in this study. Vehicles that operate on DME are assumed to share the same physical characteristics across all countries, and are, therefore, assumed to have the same incremental vehicle cost of $40,000 over the HDV baseline vehicle (diesel CI engine). Variations in additional fuel cost (in blue) are due to the lifecycle cost differentials between diesel and DME in each country. Results are shown in Figure 79.
Figure 79: Additional Cost of DME in HDVs Relative to Low S Diesel
Electricity. Due to limited range, electricity is not well-suited for HDVs; therefore, only LDV scenarios were modeled in this study. Most countries share the same incremental vehicle cost of $12,500 (PHEV) and $12,000 (EV) over the LDV baseline vehicle (gasoline ICE). Some countries offer incentives for PEVs – China (PHEVs and EVs), Denmark (EVs), Israel (PHEVs and EVs), and the United States (PHEVs and EVs) – helping to reduce the incremental vehicle cost, even below the cost of conventional gasoline ICEs in Denmark. All four countries that offer incentives see an overall lower EV cost per km compared to the baseline, and China sees a very small cost advantage in PHEVs. Variations in additional fuel cost (in blue) are due to the lifecycle cost differentials between gasoline and electricity in each country. Results are shown in Figure 80.
Figure 80: Additional Cost of Electricity in LDVs Relative to Low S Gasoline
75
8. Conclusions
As demonstrated throughout this report, all six countries exhibit very different scenarios when considering the introduction of new on-road transportation fuels, in this case natural gas and/or NG-derived fuels. Modeling tools enabled the authors to investigate environmental and economic impacts for the various fuel pathways, but literature reviews and discussions with country representatives were critical in also understanding and applying the qualitative aspects that modeling simulations simply cannot fully assess such as policy trends, consumer behaviors, energy security considerations, breadth of infrastructure, and geographical factors. The following sections recap major takeaways for all six countries, including:
A summary of most (and least) feasible natural gas pathways across all six countries,
“Cost effectiveness” values to help understand which pathways enable GHG emissions reduction in a cost effective manner, and
Country considerations that address unique aspects (e.g., policy/goals, natural gas resources, and infrastructure) described in Chapter 4’s Country Landscapes.
8.1. Country Summaries Table 13 summarizes results across all six countries of the most feasible natural gas pathways from an environmental and economic perspective, in comparison to baseline fuels, using the assumptions defined in Chapter 6. Green and yellow cells indicate clear and marginal winners, respectively, relative to the baseline fuel (gasoline for LDVs and diesel for HDVs). It is important to note that, for cost simulations, GHGenius assumes fully realized infrastructure and does not account for the cost to establish it. Table 14 captures consensus negatives across all six countries, meaning that a particular fuel pathway is either always cost ineffective or never offers emissions savings, using the study assumptions. Red cells do not necessarily mean that the fuel pathway is not viable; instead, other benefits (i.e., cost, environmental, energy security) are needed to outweigh this drawback. It is important to remember that while this country comparison provides insight into what natural gas pathways may be feasible worldwide, only six countries are investigated in this study, so blanket conclusions should not be made based on these consensus negatives. Again, it should be noted that the results are based on a specific set of assumptions that are subject to variations; therefore, changes to these assumptions can alter the results and, consequently, the conclusions.
8.2. Cost Effectiveness While reducing emissions in the transportation sector is a common goal for most countries, it should be achieved in a cost effective manner. To assess this aspect for alternative fuel pathways, GHGenius calculates the “cost effectiveness” of CO2-equivalent, or GHG, emissions reduced by integrating information on the relative costs of each pathway with the emissions results to arrive at the cost of emission reductions. Since taxes are assumed to be included in the cost aspect of this calculation, the results are likely more relevant to consumers who account for taxes when shopping for a new vehicle, but government agencies can still use the results to reach high-level conclusions. Possible cost effectiveness results are:
1. “GHG Rises” – CO2-equivalent emissions are the same or increase as a result of the switch to the alternative vehicle/fuel combination.
2. Positive number – CO2-equivalent emissions decrease as a result of the switch to the alternative vehicle/fuel combination, but the alternative pathway costs more (ownership and operation) than the base case of gasoline (for LDVs) or diesel (for HDVs). Smaller numbers reflect the most cost effective solutions.
3. Negative number – CO2-equivalent emissions decrease as a result of the switch to the alternative vehicle/fuel combination, and the alternative pathway has a lower cost compared to the baseline. The magnitude of the number requires further investigation to determine attractiveness of the option.
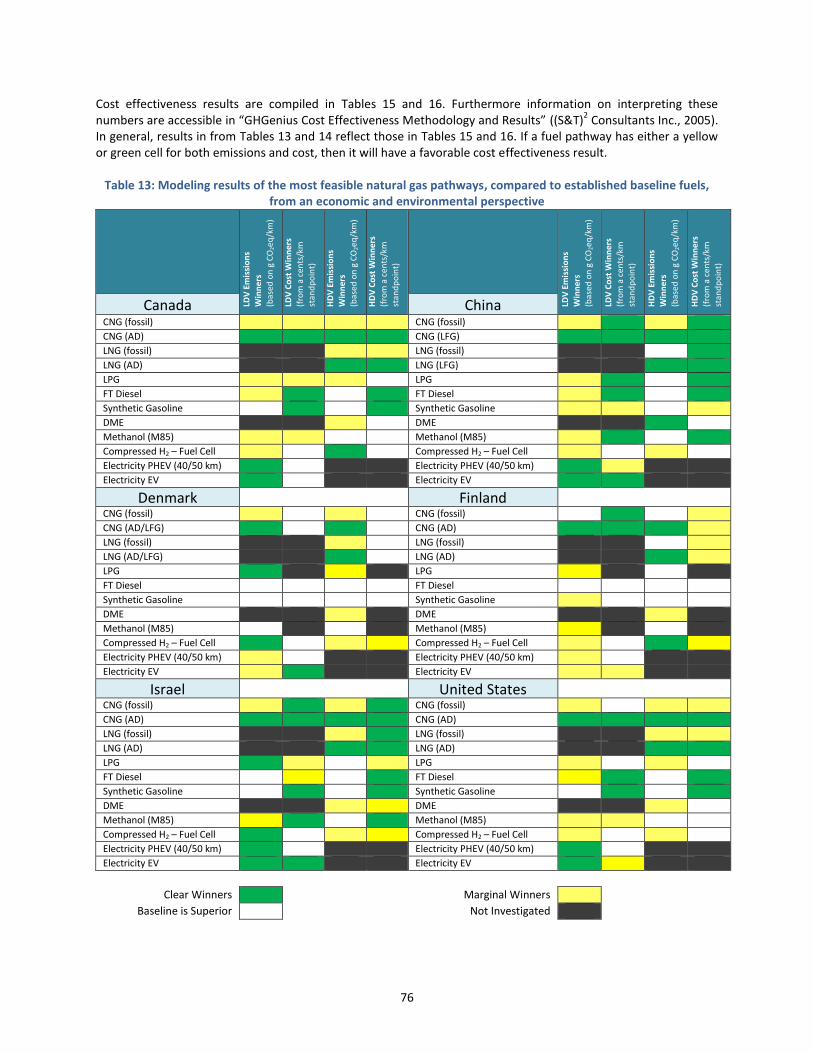
76
Cost effectiveness results are compiled in Tables 15 and 16. Furthermore information on interpreting these numbers are accessible in “GHGenius Cost Effectiveness Methodology and Results” ((S&T)
2 Consultants Inc., 2005).
In general, results in from Tables 13 and 14 reflect those in Tables 15 and 16. If a fuel pathway has either a yellow or green cell for both emissions and cost, then it will have a favorable cost effectiveness result.
Table 13: Modeling results of the most feasible natural gas pathways, compared to established baseline fuels, from an economic and environmental perspective
LDV
Em
issi
on
s
Win
ner
s
(bas
ed o
n g
CO
2eq
/km
)
LDV
Co
st W
inn
ers
(fro
m a
cen
ts/k
m
stan
dp
oin
t)
HD
V E
mis
sio
ns
Win
ner
s
(bas
ed o
n g
CO
2eq
/km
)
HD
V C
ost
Win
ner
s
(fro
m a
cen
ts/k
m
stan
dp
oin
t)
LDV
Em
issi
on
s
Win
ner
s
(bas
ed o
n g
CO
2eq
/km
)
LDV
Co
st W
inn
ers
(fro
m a
cen
ts/k
m
stan
dp
oin
t)
HD
V E
mis
sio
ns
Win
ner
s
(bas
ed o
n g
CO
2eq
/km
)
HD
V C
ost
Win
ner
s
(fro
m a
cen
ts/k
m
stan
dp
oin
t)
Canada China CNG (fossil) CNG (fossil) CNG (AD) CNG (LFG) LNG (fossil) LNG (fossil) LNG (AD) LNG (LFG) LPG LPG FT Diesel FT Diesel Synthetic Gasoline Synthetic Gasoline DME DME Methanol (M85) Methanol (M85) Compressed H2 – Fuel Cell Compressed H2 – Fuel Cell Electricity PHEV (40/50 km) Electricity PHEV (40/50 km) Electricity EV Electricity EV
Denmark Finland
CNG (fossil) CNG (fossil) CNG (AD/LFG) CNG (AD) LNG (fossil) LNG (fossil) LNG (AD/LFG) LNG (AD) LPG LPG FT Diesel FT Diesel Synthetic Gasoline Synthetic Gasoline DME DME Methanol (M85) Methanol (M85) Compressed H2 – Fuel Cell Compressed H2 – Fuel Cell Electricity PHEV (40/50 km) Electricity PHEV (40/50 km) Electricity EV Electricity EV
Israel United States
CNG (fossil) CNG (fossil) CNG (AD) CNG (AD) LNG (fossil) LNG (fossil) LNG (AD) LNG (AD) LPG LPG FT Diesel FT Diesel Synthetic Gasoline Synthetic Gasoline DME DME Methanol (M85) Methanol (M85) Compressed H2 – Fuel Cell Compressed H2 – Fuel Cell Electricity PHEV (40/50 km) Electricity PHEV (40/50 km) Electricity EV Electricity EV
Clear Winners Marginal Winners Baseline is Superior Not Investigated

77
Table 14: Consensus negatives across all six countries
LDV
Em
issi
on
s
Win
ne
rs
(bas
ed o
n g
CO
2eq
/km
)
LDV
Co
st W
inn
ers
(fro
m a
ce
nts
/km
st
and
po
int)
HD
V E
mis
sio
ns
Win
ne
rs
(bas
ed o
n g
C
O2e
q/k
m)
HD
V C
ost
Win
ne
rs
(fro
m a
ce
nts
/km
stan
dp
oin
t)
CNG (fossil or biomethane) LNG (fossil or biomethane) LPG FT Diesel Synthetic Gasoline DME Methanol (M85) Compressed H2 – Fuel Cell Electricity
Table 15: Cost Effectiveness for LDV Alternative Fuel Pathways (Compared to Baseline Low S Gasoline)
Cost Effectiveness – LDVs*
Canada China Denmark Finland Israel United States
CNG (Fossil) -160 -641 90 GHG rises -1,743 49
CNG (LFG) -97 -176 37 -79 -253 -50
CNG (AD) -97 -328 37 -85 -285 -60
LPG -3 -731 N/A N/A -447 279
FT Diesel (SA) -312 -460 GHG rises GHG rises GHG rises -415
FT Diesel (INT) -323 -552 GHG rises GHG rises GHG rises -500
Syn. Gasoline (SA) GHG rises -617 GHG rises 8,925 GHG rises GHG rises
Syn. Gasoline (INT) GHG rises -1,195 GHG rises 5,725 GHG rises GHG rises
Methanol (M85) -2,804 -2,210 N/A N/A -8,709 -33
Compressed H2 (FCV) 460 1,796 2,501 608 440 870
PHEV (40/50 km) 232 -0.63 858 297 53 26
EV 81 GHG rises -459 -10 -715 -63
*If GREEN, the fuel pathway offers both reduced emissions and cost using study assumptions.
Table 16: Cost Effectiveness for HDV Alternative Fuel Pathways (Compared to Baseline Low S Diesel)
Cost Effectiveness – HDVs*
Canada China Denmark Finland Israel United States
CNG (Fossil) -452 -3,855 264 GHG rises -6,090 -229
CNG (LFG) -151 -236 51 -69 -265 -92
CNG (AD) -150 -497 52 -75 -304 -113
LNG (fossil) -198 GHG rises 206 GHG rises -11,036 -255
LNG (LFG) -117 -401 54 -141 -284 -81
LNG (AD) -116 -4,987 52 -154 -328 -102
LPG 865 GHG rises N/A N/A GHG rises 4,897
FT Diesel (SA) GHG rises GHG rises GHG rises GHG rises GHG rises GHG rises
FT Diesel (INT) GHG rises GHG rises GHG rises GHG rises GHG rises GHG rises
Syn. Gasoline (SA) GHG rises GHG rises GHG rises GHG rises GHG rises GHG rises
Syn. Gasoline (INT) GHG rises GHG rises GHG rises GHG rises GHG rises GHG rises
DME 478 80 N/A N/A -327 790
Methanol (M85) GHG rises GHG rises N/A N/A GHG rises GHG rises
Compressed H2 (FCV) 164 2,160 -18 -148 -125 2,637
*If GREEN, the fuel pathway offers both reduced emissions and cost using study assumptions.
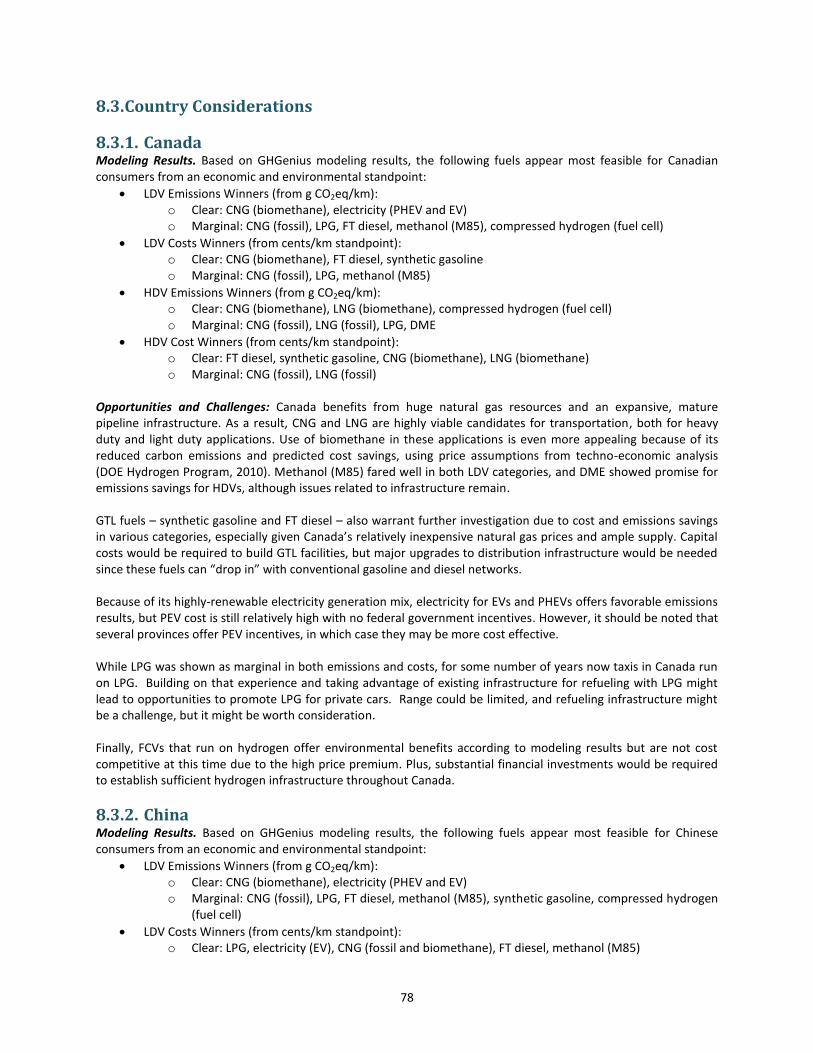
78
8.3. Country Considerations
8.3.1. Canada Modeling Results. Based on GHGenius modeling results, the following fuels appear most feasible for Canadian consumers from an economic and environmental standpoint:
LDV Emissions Winners (from g CO2eq/km): o Clear: CNG (biomethane), electricity (PHEV and EV) o Marginal: CNG (fossil), LPG, FT diesel, methanol (M85), compressed hydrogen (fuel cell)
LDV Costs Winners (from cents/km standpoint): o Clear: CNG (biomethane), FT diesel, synthetic gasoline o Marginal: CNG (fossil), LPG, methanol (M85)
HDV Emissions Winners (from g CO2eq/km): o Clear: CNG (biomethane), LNG (biomethane), compressed hydrogen (fuel cell) o Marginal: CNG (fossil), LNG (fossil), LPG, DME
HDV Cost Winners (from cents/km standpoint): o Clear: FT diesel, synthetic gasoline, CNG (biomethane), LNG (biomethane) o Marginal: CNG (fossil), LNG (fossil)
Opportunities and Challenges: Canada benefits from huge natural gas resources and an expansive, mature pipeline infrastructure. As a result, CNG and LNG are highly viable candidates for transportation, both for heavy duty and light duty applications. Use of biomethane in these applications is even more appealing because of its reduced carbon emissions and predicted cost savings, using price assumptions from techno-economic analysis (DOE Hydrogen Program, 2010). Methanol (M85) fared well in both LDV categories, and DME showed promise for emissions savings for HDVs, although issues related to infrastructure remain. GTL fuels – synthetic gasoline and FT diesel – also warrant further investigation due to cost and emissions savings in various categories, especially given Canada’s relatively inexpensive natural gas prices and ample supply. Capital costs would be required to build GTL facilities, but major upgrades to distribution infrastructure would be needed since these fuels can “drop in” with conventional gasoline and diesel networks. Because of its highly-renewable electricity generation mix, electricity for EVs and PHEVs offers favorable emissions results, but PEV cost is still relatively high with no federal government incentives. However, it should be noted that several provinces offer PEV incentives, in which case they may be more cost effective. While LPG was shown as marginal in both emissions and costs, for some number of years now taxis in Canada run on LPG. Building on that experience and taking advantage of existing infrastructure for refueling with LPG might lead to opportunities to promote LPG for private cars. Range could be limited, and refueling infrastructure might be a challenge, but it might be worth consideration. Finally, FCVs that run on hydrogen offer environmental benefits according to modeling results but are not cost competitive at this time due to the high price premium. Plus, substantial financial investments would be required to establish sufficient hydrogen infrastructure throughout Canada.
8.3.2. China Modeling Results. Based on GHGenius modeling results, the following fuels appear most feasible for Chinese consumers from an economic and environmental standpoint:
LDV Emissions Winners (from g CO2eq/km): o Clear: CNG (biomethane), electricity (PHEV and EV) o Marginal: CNG (fossil), LPG, FT diesel, methanol (M85), synthetic gasoline, compressed hydrogen
(fuel cell)
LDV Costs Winners (from cents/km standpoint): o Clear: LPG, electricity (EV), CNG (fossil and biomethane), FT diesel, methanol (M85)
79
o Marginal: Synthetic gasoline, electricity (PHEV)
HDV Emissions Winners (from g CO2eq/km): o Clear: CNG (LFG), LNG (LFG), DME o Marginal: CNG (fossil), compressed hydrogen (fuel cell)
HDV Cost Winners (from cents/km standpoint): o Clear: CNG (fossil and biomethane), LNG (fossil and biomethane), LPG, methanol (M85), FT diesel o Marginal: Synthetic gasoline
Opportunities and Challenges: Due to limited supply and inadequate fueling infrastructure, natural gas has not been highly considered by China for use in the transportation sector in the past. However, because it is considered a source of clean energy, the Chinese government is now pushing to significantly increase its use and expand pipeline capacity. According to model results, many natural gas pathways can offer environmental and cost savings over conventional fuels. Furthermore, sizeable transitions to any of these fuels would have a major global impact given China’s huge population and vehicle fleet. According to the model, CNG and LNG are highly viable candidates for transportation, both for heavy duty and light duty applications, especially biomethane because of its reduced carbon emissions. Electricity used in PEVs shows benefits in both categories, partially due to supportive vehicle purchase incentives, and extensive efforts have been made to infrastructure nationwide to accommodate China’s PEV fleet. FT diesel and synthetic gasoline also fared well in both categories, which is especially appealing since no new distribution infrastructure would be required for the introduction of these drop-in fuels; however, capital costs would be required to build GTL facilities. FCVs that run on hydrogen offer marginal environmental benefits according to modeling results in both light duty and heavy duty application, but do not offer cost benefits in over baseline fuels. If China decided to seriously pursue hydrogen as a transportation fuel, substantial financial investments would be required to establish sufficient infrastructure throughout a country as large as China. Finally, LPG and methanol (M85) mostly present emissions and cost benefits over baseline fuels, but issues related to infrastructure would first need to be addressed.
8.3.3. Denmark Modeling Results. Based on GHGenius modeling results, the following fuels appear most feasible for Danish consumers from an economic and environmental standpoint:
LDV Emissions Winners (from g CO2eq/km): o Clear: CNG (biomethane), compressed hydrogen (fuel cell), LPG o Marginal: CNG (fossil), electricity (PHEV and EV)
LDV Costs Winners (from cents/km standpoint): o Clear: Electricity (EV) o Marginal: None
HDV Emissions Winners (from g CO2eq/km): o Clear: CNG (biomethane) and LNG (biomethane) o Marginal: CNG (fossil), LNG (fossil), DME, compressed hydrogen (fuel cell), LPG
HDV Cost Winners (from cents/km standpoint): o Clear: None. o Marginal: Compressed hydrogen (fuel cell)
Opportunities and Challenges: With Denmark’s ample natural gas reserves, using unconventional fuels would seem to be a good long term strategy to reduce any dependence on petroleum for transportation fuels. This falls in line with the Denmark government’s pursuit of a diverse set of fuel and vehicle options, such as NGVs, PEVs, and FCVs. The model suggests that electricity (for LDVs) and compressed hydrogen (for HDVs) might deliver twofold wins, that is, low emissions along with low cost to the consumer. For natural gas, this is primarily due to domestic
80
supply and high conventional fuel prices; for electricity, EV cost advantages are primarily due to heavy support from vehicle registration tax exemptions. If these exemptions were to expire (which they are scheduled to do in 2016), EVs may no longer offer cost benefits. Companies in Denmark are in the process of rolling out infrastructure for EVs nationwide. LNG (fossil or biomethane) is also very suitable for use in heavy duty trucks in Denmark since it greatly reduces emissions and provides a longer driving range compared to CNG. However, LNG for use in HDVs has a higher cost per km compared to traditional diesel, and according to the cost effectiveness value in Table 16, the switch may not be as feasible for HDVs as other fuels like hydrogen fuel cell vehicles. Regardless, significant capital investment in infrastructure for transport and dispensing of either fuel will be needed. Industrial natural gas prices in Denmark, needed for GTL processing (i.e. FT diesel and synthetic gasoline), is still quite expensive, presenting obstacles for economic feasibility of these fuels. If overcome, existing vehicles could continue to operate even if petroleum is abandoned, and no major distribution infrastructure investments would be necessary since synthetic gasoline is a drop-in fuel. Given that Denmark has one of the highest densities of fuel stations in Europe, it may face more challenges in transitioning to a new fuel, and a relatively large amount of the fleet would need to switch to the fuel to allow reasonable payback time for the investment. It helps that baseline fuels (gasoline and diesel) are relatively expensive in Denmark so consumers may be more amenable to the introduction of new fuels compared to countries with access to inexpensive fossil fuels..
8.3.4. Finland Modeling Results. Based on GHGenius modeling results, the following fuels appear most feasible for Finnish consumers from an economic and environmental standpoint:
LDV Emissions Winners (from g CO2eq/km): o Clear: CNG (biomethane) o Marginal: Electricity (PHEV and EV), compressed hydrogen (fuel cell), synthetic gasoline, LPG
LDV Costs Winners (from cents/km standpoint): o Clear: CNG (fossil and biomethane) o Marginal: Electricity (EV)
HDV Emissions Winners (from g CO2eq/km): o Clear: CNG (biomethane), LNG (biomethane), compressed hydrogen (fuel cell) o Marginal: DME
HDV Cost Winners (from cents/km standpoint): o Clear: CNG (fossil and biomethane), LNG (fossil and biomethane) o Marginal: Compressed hydrogen (fuel cell)
Opportunities and Challenges: Finland has been very aggressive in recent years in the uptake of technologies for use of natural gas in transportation. This is despite the fact that natural gas is relatively expensive since it is all imported from Russia and must traverse through pipelines to Finland. Biomethane, however, can be domestically produced and currently accounts for 37% of all natural gas currently sold in Finland. Modeling results support Finland’s movement toward biomethane from anaerobic digestion as the clear environmental winner as well as being a strong cost competitor. Electricity and hydrogen also provide potential improvements in both categories, according to GHGenius results. Finland’s PEV fleet has grown in recent years, and basic charging infrastructure is fairly well established especially since engine pre-warming is often required in the cold winters (although such climates may reduce electric range). Hydrogen, on the contrary, would require substantial financial investments to establish sufficient infrastructure across Finland.

81
LNG, primarily biomethane, is very suitable for use in heavy duty trucks and provides a longer driving range when compared to CNG. Availability of capital investment in infrastructure for transport and dispensing of fuel for both CNG and LNG will be crucial. With sophisticated refinery expertise in Finland, the notion of using “gas-to-liquid” to make synthetic gasoline might be considered, and it was found to have a marginal environmental edge on gasoline in certain cases. However, industrial natural gas prices in Finland, needed for GTL processing, is still quite expensive, presenting obstacles for feasibility. If overcome, existing vehicles could continue to operate even if petroleum is abandoned, and no major distribution infrastructure investments would be necessary since synthetic gasoline is a drop-in fuel. Like Denmark, Finland has one of the highest densities of fuel stations in Europe, so it may face more challenges in transitioning to a new fuel, and a relatively large amount of the fleet would need to switch to the fuel to allow reasonable payback time for the investment. It helps that baseline fuels (gasoline and diesel) are relatively expensive in Denmark so consumers may be more amenable to the introduction of new fuels compared to countries with access to inexpensive fossil fuels.
8.3.5. Israel Modeling Results. Based on GHGenius modeling results, the following fuels appear most feasible for Israeli consumers from an economic and environmental standpoint:
LDV Emissions Winners (from g CO2eq/km): o Clear: CNG (biomethane), electricity (PHEV and EV), compressed hydrogen (fuel cell), LPG o Marginal: CNG (fossil), methanol (M85)
LDV Costs Winners (from cents/km standpoint): o Clear: CNG (fossil and biomethane), electricity (EV), synthetic gasoline, methanol (M85) o Marginal: LPG, FT diesel
HDV Emissions Winners (from g CO2eq/km): o Clear: CNG (biomethane), LNG (biomethane) o Marginal: CNG (fossil), LNG (fossil), compressed hydrogen (fuel cell), DME
HDV Cost Winners (from cents/km standpoint): o Clear: CNG (fossil and biomethane), LNG (fossil and biomethane), FT diesel, methanol (M85),
synthetic gasoline o Marginal: LPG, DME, compressed hydrogen (fuel cell)
Opportunities and Challenges: The results of the GHGenius model suggest that CNG and LNG, especially biomethane, can be leaders in bringing about the change that Israel seeks to achieve by getting away from petroleum and replacing oil with natural gas and electricity. Both CNG and LNG are “clean fuels” and produce considerably lower particulate emissions as well as GHGs compared to fossil fuels. Given Israel’s recent discovery of significant reserves, it seems logical that natural gas will play a key role in future transportation decisions and helping to diversify their fuel portfolio. GTL fuels – synthetic gasoline, FT diesel, and methanol – from natural gas present significant cost benefits over the baseline conventional fuels, aligning well with Israel’s energy goals. In addition to cost savings, methanol provides marginal emissions reduction for LDVs. Today’s light duty engines will accommodate synthetic gasoline and FT diesel without any modifications. Capital costs for expansion of GTL facilities may be required, but distribution infrastructure would be minimal due to GTL’s “drop-in” characteristic. For LDVs, electricity does not only offer a more environmentally friendly transportation fuel but also proves to be cost effective, at least for EVs, in part due to Israel’s emission-based vehicle tax system. Compressed hydrogen also fared well in both categories, but unlike drop-in fuels, major investments in vehicles and infrastructure would be required to realize a sizeable penetration of hydrogen in the Israeli market. DME and LPG derived from natural gas also fare well from a cost perspective.
82
In many countries of larger land masses, there always arises a concern about vehicle range when considering natural gas as a transportation fuel. This may not be the case in Israel where the land mass is relatively small and population densities can be large. Thus, the capital investment required for sufficient fueling stations might not be as daunting as in some other nations.
8.3.6. United States Modeling Results. Based on GHGenius modeling results, the following fuels appear most feasible for U.S. consumers from an economic and environmental standpoint:
LDV Emissions Winners (from g CO2eq/km): o Clear: CNG (biomethane) and electricity (PHEV and EV) o Marginal: CNG (fossil), LPG, methanol (M85), compressed hydrogen (fuel cell), FT diesel
LDV Costs Winners (from cents/km standpoint): o Clear: FT diesel, synthetic gasoline, CNG (biomethane) o Marginal: Electricity (EV), CNG (fossil), methanol (M85)
HDV Emissions Winners (from g CO2eq/km): o Clear: CNG (biomethane), LNG (biomethane) o Marginal: CNG (fossil), LNG (fossil), LPG, compressed hydrogen (fuel cell), DME
HDV Cost Winners (from cents/km standpoint): o Clear: CNG (biomethane), FT diesel, synthetic gasoline, LNG (biomethane) o Marginal: CNG (fossil), LNG (fossil)
Opportunities and Challenges: A number of possible winners arose from the model results for the United States. CNG (both fossil and biomethane) scored well in both cost and emissions. The most interesting results, however, may be with the potential for synthetic gasoline and FT diesel, both made from natural gas. Both fuels offer significant cost improvements when compared to the baseline fuels and engines, and FT diesel shows emissions improvements when used in the LDV fleet. In order to pursue these avenues one must consider the capital costs of GTL facilities. In recent years some construction of such plants in the United States has been put on hold due to falling oil prices. Nevertheless, the concept of gas-to-liquid, if implemented, could likely relieve the United States of dependence on foreign oil. An added benefit would be that fact that synthetic fuels can be transported widely through existing pipelines, thus obviating the need for additional capital investment. Results for natural gas-derived electricity for use in PEVs are very favorable for the United States, partially due to government financial support. The country already produces a lot of electricity from natural gas, and EVs and PHEVs are starting to gain traction in the market. Challenges for PEVs in America have proven to include limited driving range between recharging, lack of sufficient charging infrastructure, and relatively slow recharging times (when fast charging options are not available). Several auto manufacturers and industry partners are working on newer technologies to help eliminate these issues. In the meantime, EVs are well suited for “day cars,” cars that might be confined to inner cities and recharged overnight, while PHEVs sufficiently address range anxiety. According to modeling results, LNG is a double winner for emissions and cost for the heavy duty sector. While the use of LNG for trucks is very small in the United States, these model results might help to spur more interest in the concept. Adequate refilling infrastructure might be a challenge. DME also fared well from an emissions standpoint, but fuel cost per km is higher than conventional fuels, and infrastructure issues would need to be addressed. Compressed hydrogen show promise for reducing emissions, but unlike drop-in fuels, major investments in vehicles and infrastructure would be required to realize a sizeable penetration of hydrogen in the U.S. market.

83
9. Next Steps
9.1. GHGenius Enhancements GHGenius was determined to be the best-suited modeling tool for this study because of its high adaptability to scenarios of interest. However, to date, the model has only been tailored to model a few countries in great detail, including Canada and the United States. If more time and effort were invested to enhance the data needed to tailor countries of interest, outputs would undoubtedly be more solid. China and Israel, for example, were modeled using a combination of data provided by country representatives and literature review, but numerous assumptions were made in order to complete the study as scheduled. Further research to fully develop these countries would be very valuable. Should similar work be conducted in the future, allowing GHGenius developers to take a more active role from the project development stage (possibly as a study partner) may be very beneficial.
9.2. Sensitivity Studies As evidenced in Chapter 6, many assumptions were set in this study in order to develop country-specific scenarios. Some factors, like electricity generation mix, are considered relatively stable, while others, such as gasoline retail prices, have proven to be highly volatile over the years. Sensitivity studies would help to capture the overall impact of key factors as they change. Thresholds that determine when certain fuels become competitive with traditional fuels could be identified. Furthermore, governments often choose to implement policies, incentives, and regulations that support the market penetration of certain alternative fuels and vehicles by improving its competitiveness within the market. Sensitivity studies could to run to help governments determine how impactful different types of incentives could potentially be from an economic and environmental perspective and what might be the optimal monetary level and timeframe for such incentives. The Monte Carlo simulator tool in GHGenius is capable of investigating such uncertainty and allows the user to vary up to five input values in the model.
9.3. Implementation Plans Now that analysis has been conducted to assess the most feasible natural gas pathways for Canada, China, Denmark, Finland, Israel and the United States, follow-on efforts in the form of a Roadmap could focus on the steps necessary to actually implement promising fuels for each country. Key items may include the cost of building fuel production and processing plants, as well as supporting vehicles and infrastructure; economic feasibility of vehicles and fuels for end users; environmental policies; safety concerns; government incentives; energy security; feedstock adequacy and reliability; transition plans; etc. From an economic perspective, this study only investigated the costs on a consumer basis; therefore, further investigation would be necessary on what transportation fuel options are most feasible from a societal perspective. Such Roadmaps should take the needs of the four critical stakeholder groups – the customers, the government, the fuel industry, and the automotive industry – into consideration, as the probability of a fuel’s successful introduction is maximized when all of their needs are met (Risch & Santini, 2011). If relevant, Roadmaps could be tailored to match on specific policy action plans, emissions standards, or environmental goals set by the country (i.e. 10% of fleet should be comprised of zero-emitting vehicles by 2025).

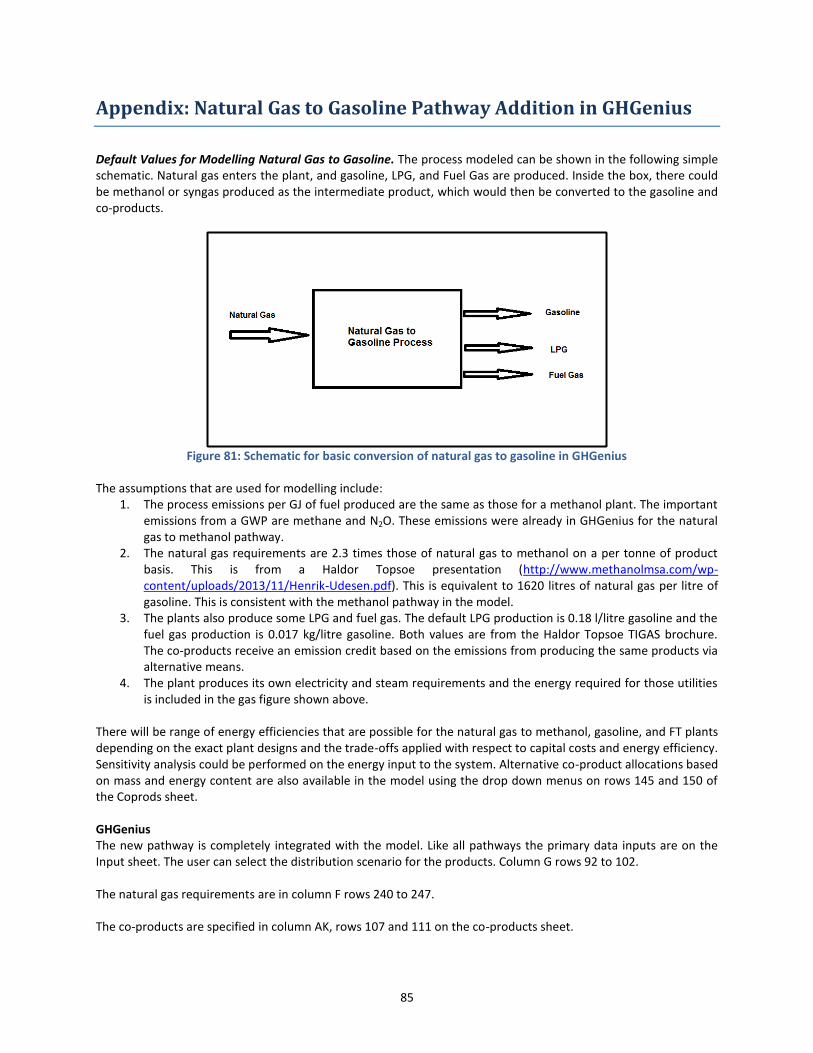
85
Appendix: Natural Gas to Gasoline Pathway Addition in GHGenius
Default Values for Modelling Natural Gas to Gasoline. The process modeled can be shown in the following simple schematic. Natural gas enters the plant, and gasoline, LPG, and Fuel Gas are produced. Inside the box, there could be methanol or syngas produced as the intermediate product, which would then be converted to the gasoline and co-products.
Figure 81: Schematic for basic conversion of natural gas to gasoline in GHGenius
The assumptions that are used for modelling include:
1. The process emissions per GJ of fuel produced are the same as those for a methanol plant. The important emissions from a GWP are methane and N2O. These emissions were already in GHGenius for the natural gas to methanol pathway.
2. The natural gas requirements are 2.3 times those of natural gas to methanol on a per tonne of product basis. This is from a Haldor Topsoe presentation (http://www.methanolmsa.com/wp-content/uploads/2013/11/Henrik-Udesen.pdf). This is equivalent to 1620 litres of natural gas per litre of gasoline. This is consistent with the methanol pathway in the model.
3. The plants also produce some LPG and fuel gas. The default LPG production is 0.18 l/litre gasoline and the fuel gas production is 0.017 kg/litre gasoline. Both values are from the Haldor Topsoe TIGAS brochure. The co-products receive an emission credit based on the emissions from producing the same products via alternative means.
4. The plant produces its own electricity and steam requirements and the energy required for those utilities is included in the gas figure shown above.
There will be range of energy efficiencies that are possible for the natural gas to methanol, gasoline, and FT plants depending on the exact plant designs and the trade-offs applied with respect to capital costs and energy efficiency. Sensitivity analysis could be performed on the energy input to the system. Alternative co-product allocations based on mass and energy content are also available in the model using the drop down menus on rows 145 and 150 of the Coprods sheet. GHGenius The new pathway is completely integrated with the model. Like all pathways the primary data inputs are on the Input sheet. The user can select the distribution scenario for the products. Column G rows 92 to 102. The natural gas requirements are in column F rows 240 to 247. The co-products are specified in column AK, rows 107 and 111 on the co-products sheet.
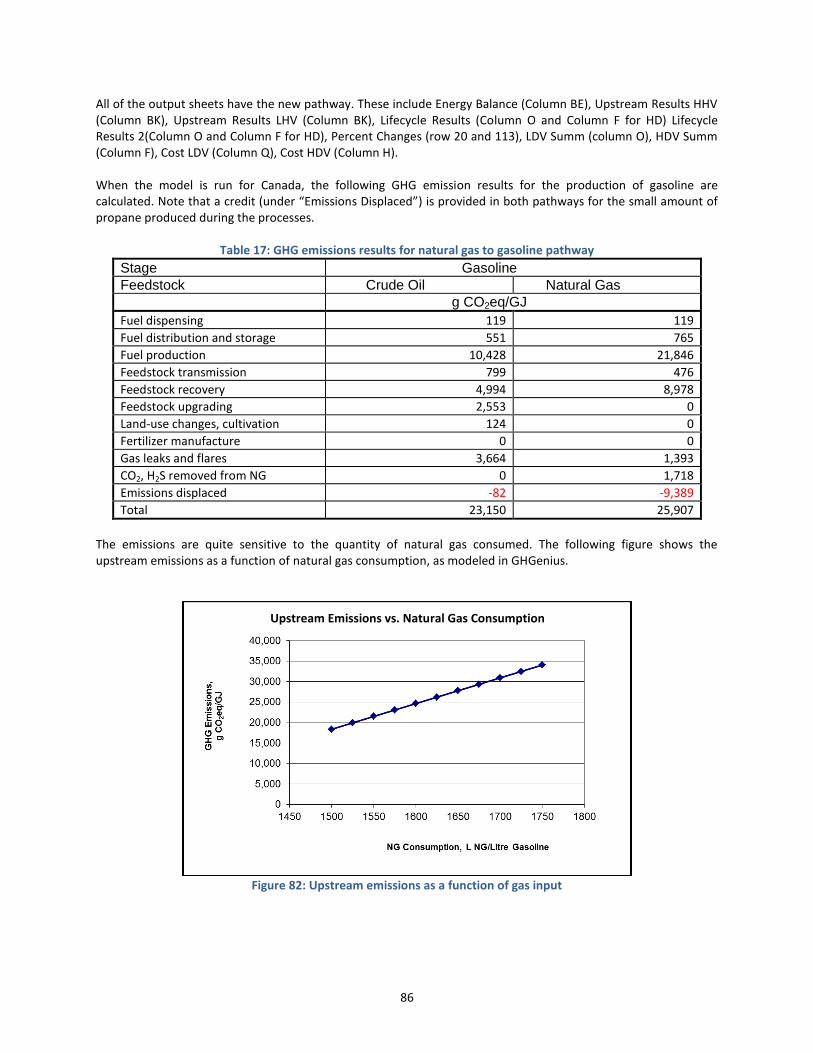
86
All of the output sheets have the new pathway. These include Energy Balance (Column BE), Upstream Results HHV (Column BK), Upstream Results LHV (Column BK), Lifecycle Results (Column O and Column F for HD) Lifecycle Results 2(Column O and Column F for HD), Percent Changes (row 20 and 113), LDV Summ (column O), HDV Summ (Column F), Cost LDV (Column Q), Cost HDV (Column H). When the model is run for Canada, the following GHG emission results for the production of gasoline are calculated. Note that a credit (under “Emissions Displaced”) is provided in both pathways for the small amount of propane produced during the processes.
Table 17: GHG emissions results for natural gas to gasoline pathway
Stage Gasoline
Feedstock Crude Oil Natural Gas
g CO2eq/GJ
Fuel dispensing 119 119 Fuel distribution and storage 551 765 Fuel production 10,428 21,846 Feedstock transmission 799 476 Feedstock recovery 4,994 8,978 Feedstock upgrading 2,553 0 Land-use changes, cultivation 124 0 Fertilizer manufacture 0 0 Gas leaks and flares 3,664 1,393 CO2, H2S removed from NG 0 1,718 Emissions displaced -82 -9,389 Total 23,150 25,907
The emissions are quite sensitive to the quantity of natural gas consumed. The following figure shows the upstream emissions as a function of natural gas consumption, as modeled in GHGenius.
Figure 82: Upstream emissions as a function of gas input
Upstream Emissions vs. Natural Gas Consumption
87
References
(S&T)2 Consultants Inc. (2005). GHGenius Cost Effectiveness Methodology and Results. Natural Resources Canada. Alton, J. (2013, June 11). Beijing Looks to Increase Natural Gas Buses and Taxis, Natural Gas Vehicles Make
Headway in China. MacroCurrent. Bank of Israel. (2014, 11 3). "Green" taxation and changes in purchasing patterns of private vehicles. Retrieved
from Bank of Israel - Publications: http://bankisrael.gov.il/en/NewsAndPublications/PressReleases/Pages/11-03-2014-GreenTax.aspx
Bar-Eli, A. (2013, November 29). Israel to Get First Natural Gas Filling Station Next Year. Retrieved from Haaretz: http://www.haaretz.com/business/.premium-1.560816
Bauer Kompressoren. (2015). Natural gas: New CNG Stations. BNEWS - The Bauer Kompressoren Newsletter(1/15), p. 2.
Bloomberg. (2014, July 4). Choking Smog Puts Chinese Driver in Natural Gas Fast Lane. Retrieved from Bloomberg Business: http://www.bloomberg.com/news/2014-07-04/choking-smog-puts-chinese-driver-in-natural-gas-fast-lane.html
Blue Corridor Editor. (2013, October 10). NGVs Show Potential to Reduce Denmark's Carbon Emissions. Retrieved from Blue Corridor: http://www.bluecorridor.org/blue-corridor-events/blue-corridor-ngv-rally-2013/stage-8/ngvs-show-potential-reduce-denmarks-carbon-emissions/
Bourbon, E. (2015). Clean Cities Alternative Fuel Price Report. Landover, MD: New West Technologies, LLC. Bryce, A. (2013, April 18). Israel Planning to Put M15 and M57 on the Market. Retrieved from Blue Fuel Energy:
http://bluefuelenergy.com/methanol-cars/testing-of-m57-vehicles-in-israel/ Bugarski, A. D., Janisko, S. J., Cauda, E. G., Noll, J. D., & Mischler, S. E. (2012). Controlling Exposure to Diesel
Emissions in Underground Mines. SME. California Institute for Energy and the Environment. (2009). Natural Gas Vehicle Research Roadmap . CEC-500-
2008-044-F, Public Interest Energy Research Program. Canadian Natural Gas Vehicle Alliance. (2014). Presentation: Challenges & Opportunities Deploying Alternative
Fuels . Ottawa. CBG100 Suomi. (2014, September). Finnish biogas statistics 2013-2014. Retrieved April 2015, from
http://www.cbg100.net/products/finnish-biogas-statistics-2013-2014/ Centre for Solar Energy and Hydrogen Research Baden-Wurttemberg. (2015, March 23). More than 740,000 Cars
Worldwide Powered by Electricity. Retrieved from Centre for Solar Energy and Hydrogen Research Baden-Wurttemberg: http://www.zsw-bw.de/uploads/media/pi06-2015-ZSW-E-Mobility.pdf
Chen, Y. (2013). Development Strategies of the Chinese Natural Gas Market. Clingendael International Energy Programme.
China Economic Times. (2015). Natural Gas. Retrieved from China Economic Times: http://www.cet.com.cn/nypd/trq/index.shtml
China Gas Association. (2012). Industry News. Retrieved from China Gas Association: http://www.chinagas.org.cn/hangye/news/
Clancy, S. (2010, September). The pipeline developers building energy lifelines in Canada. Retrieved from Pipelines International: http://pipelinesinternational.com/news/the_pipeline_developers_building_energy_lifelines_in_canada/043731/
CNG Europe. (n.d.). Retrieved from http://cngeurope.com/countries/finland/ Cohen, B. (2015). Egypt Business Body Hails Decision to Import Israeli Natural Gas . Retrieved from The Algemeiner:
http://www.algemeiner.com/2015/02/02/egypt-business-body-hails-decision-to-import-israeli-natural-gas/
Danish Energy Agency. (2015). Monthly Statistics. Retrieved from Danish Energy Agency: http://www.ens.dk/en/info/facts-figures/energy-statistics-indicators-energy-efficiency/monthly-statistics
Danish Energy Agency. (n.d.). History of natural gas in Denmark. Retrieved May 6, 2015, from http://www.ens.dk/en/supply/history-natural-gas-denmark
88
Danish Energy Regulatory Authority. (2015). Price Statistics. Retrieved from Danish Energy Regulatory Authority: http://www.energitilsynet.dk/el/priser/prisstatistik-el-forsyningspligt/
Dansk Gas Forening. (2001). Natural Gas in Denmark. Hørsholm, Denmark: Dansk Gas Forening (Danish Gas Association).
Davis, S. C., Diegel, S. W., & Boundy, R. G. (2014). Transportation Energy Data Book - Edition 33. Oak Ridge National Laboratory.
DENMARK. (2008). Retrieved from Think Global Green: http://www.thinkglobalgreen.org/DENMARK.html DOE Hydrogen and Fuel Cells Program. (2012). Hydrogen Production Cost Using Low-Cost Natural Gas. U.S.
Department of Energy. DOE Hydrogen Program. (2010). "Biogas Resources Characterization" from FY 2010 Annual Progress Report. U.S.
Department of Energy. Energinet.dk. (2010). Gas in Denmark 2010 - Security of supply and development. Fredericia, Denmark. Etzer, O. (2014, March 26). Ministry of Transport to Test Mini Car Program. Retrieved from Israeli National News:
http://www.israelnationalnews.com/News/News.aspx/178928#.VUbLOptOVkc European Biofuels Technology Platform. (2014). Dimethyl ether (DME) Fact Sheet. Retrieved from European
Biofuels Technology Platform: http://www.biofuelstp.eu/factsheets/dme-fact-sheet.html European Commission. (2013). European Green Cars Initiative PPP: Multi-Annual Roadmap and Long-term
Strategy. Directorate-General for Research and Innovation. European Commission. (2015, March 26). EU greenhouse gas emissions and targets. Retrieved from CLIMATE
ACTION: http://ec.europa.eu/clima/policies/g-gas/index_en.htm Fuel Choices Initiative. (n.d.). Retrieved 2014, from Israeli Prime Minister Office:
http://www.fuelchoicesinitiative.com/index.php?language=eng FuelEconomy.gov. (n.d.). All-Electric Vehicles. Retrieved from FuelEconomy.gov:
http://www.fueleconomy.gov/feg/evtech.shtml Gasum Oy. (2014, May 2). Lower natural gas and biogas prices at Gasum gas filling stations. Retrieved from
Gasum: http://www.gasum.com/Corporate_info/News/lower-natural-gas-and-biogas-prices-at-gasum-gas-filling-stations/
Gasum Oy. (2014). The production and future of biogas in Finland. Retrieved from http://www.gasum.com/responsibility/environmental-responsibility/production-chain/the-production-and-future-of-biogas-in-finland/
Gladstein, Neandross & Associates. (n.d.). About the Interstate Clean Transportation Corridor. Retrieved March 19, 2014, from Interstate Clean Transportation Corridor: http://ictc.gladstein.org/aboutictc.html
Globa lPetrol Prices. (2015). Retrieved from www.GlobalPetrolPrices.com Global Petrol Prices. (2015). Retrieved from www.GlobalPetrolPrices.com Green Car Congress. (2014, July 30). DOE announces steps to help modernize natural gas infrastructure. Retrieved
from http://www.greencarcongress.com/2014/07/20140730-doemethane.html Green Methanol Infrastructure. (2015). Methanol as a Fuel. Retrieved from Green Methanol Infrastructure:
http://greenmethanol.dk/en/methanol-as-a-fuel Haldor Topsoe. (2010). DME Production Technology Overview. 4th International DME Conference. Stockholm,
Sweden. Haldor Topsoe. (n.d.). Gasoline Synthesis (TIGAS). Retrieved May 2015, from Haldor Topsoe:
http://www.topsoe.com/subprocess/gasoline-synthesis-tigas Henderson, S. (2013). Natural Gas Export Options for Israel and Cyprus. Mediterranean Paper Series 2013. Higashi, N. (2009). Natural Gas in China: Market Evolution and Strategy, Working Paper Series. International Energy
Agency. HMN Naturgas. (n.d.). Gas til transport. Retrieved from
https://www.naturgas.dk/grongas/transport/gastankstationer/ Houser, T., & Bao, B. (2013). The Geopolitics of Natural Gas: Charting China’s Natural Gas Future. Rice University,
James A. Baker III Institute for Public Policy. IA-HEV. (n.d.). Denmark. Retrieved March 6, 2014, from IEA Hybrid & Electric Vehicle Implementing Agreement:
http://www.ieahev.org/by-country/denmark/ IEA-AMF. (n.d.-a). Fuel Information. Retrieved from IEA AMF - Implementing Agreement for Advanced Motor Fuels:
http://www.iea-amf.org/content/fuel_information/fuel_info_home
89
IEA-AMF. (n.d.-b). Methanol. Retrieved from IEA Advanced Motor Fuels: http://www.iea-amf.org/content/fuel_information/methanol
International Energy Agency. (2012). “People’s Republic of China.” Oil & Gas Security: Emergency Response of IEA Countries.
International Energy Agency. (2014a). CO2 Emissions from Fuel Combustion - Highlights. Paris, France: OECD/IEA. International Energy Agency. (2014b). Key World Energy Statistics. Paris, France: OECD/IEA. International Energy Agency. (2015). IEA Energy Atlas. Retrieved from International Energy Agency:
http://www.iea.org/statistics/ieaenergyatlas/ International Gas Union and the United Nations Economic Commission for Europe. (2012). NATURAL GAS FOR
VEHICLES – IGU & UN ECE JOINT REPORT. Kuala Lumpur 2012 World Gas Conference. Kuala Lumpur . Israel Ministry of National Infrastructures, Energy and Water Resources. (n.d.). Retrieved from http://energy.gov.il Karim, G. A. (2007). Hydrogen as an Engine Fuel Some Pros and Cons. Journal of KONES Powertrain and Transport,
14(4). Kavalov, B. (2004). Techno-economic analysis of Natural Gas application as an energy source for road transport in
the EU. European Communities. Lee, A., Zinaman, O., & Logan, J. (2012). Opportunities for Synergy Between Natural Gas and Renewable Energy in
the Electric Power and Transportation Sectors. Technical Report, National Renewable Energy Laboratory, Golden, CO.
Lee, J. (2013, August 21). China and India Hope Higher Prices Will Spur Gas Production. Retrieved from Alaska Natural Gas Transportation Projects - Office of the Federal Coordinator: http://www.arcticgas.gov/china-and-india-hope-higher-prices-will-spur-gas-production
Li, E., Ip, D., & Suttikulpanich, D. (2012). China natural gas vehicles - Fuel of Opportunities. Standard Chartered Bank.
Liu, C. (2014, July 25). China Pushes Harder to Boost Electric Car Sales. (E. a. Publishing, Editor) Retrieved from ClimateWire: http://www.eenews.net/stories/1060003494
LNG World News Staff. (2013, January 16). European GasHighWay Project Proves to Be Highly Successful. Retrieved from LNG World News.
McCord, M. (2014, February 21). Propane autogas: the top green fuel for vehicles you’ve probably never heard of . Retrieved from NH Business Review: http://www.nhbr.com/February-21-2014/Propane-autogas-the-top-green-fuel-for-vehicles-youve-probably-never-heard-of/
Methanol Institute. (2011). Methanol Transportation Fuel. Retrieved from Methanol Institute: http://www.methanol.org/Energy/Transportation-Fuel.aspx
Ministry of Energy and Water Resources. (2012). Economic Model and Complementary Qualitative Analysis for: CNG, Methanol, & GTL.
Ministry of Foreign Affairs of Denmark . (n.d.). Transport Infrastructure in Denmark. Retrieved April 2015, from Denmark - Official Website of Denmark: http://denmark.dk/en/practical-info/work-in-denmark/transport-infrastructure-in-denmark/
Mykkanen, E. (2010, October). Optimal Locations for New Gas Filling Stations by 2020: Finland. Jyvaskyla Innovation.
myLPG.eu. (2011-2015). LPG stations in Europe. Retrieved from myLPG.eu: http://www.mylpg.eu/stations/ Nakano, J., & Chow, E. C. (2014, May 28). Russia-China Natural Gas Agreement Crosses the Finish Line. Retrieved
from Center for Strategic & International Studies: http://csis.org/publication/russia-china-natural-gas-agreement-crosses-finish-line
National Development and Reform Commission of China. (2015). Economic Situation. Retrieved from National Development and Reform Commission of China: http://www.sdpc.gov.cn/jjxsfx/
Natural Gas Use in Transportation Roundtable. (2010). Natural Gas Use in the Canadian Transportation Sector: Deployment Roadmap.
Natural Resources Canada. (2015). Average Retail Prices in Canada. Retrieved from Natural Resources Canada: http://www2.nrcan.gc.ca/eneene/sources/pripri/prices_byyear_e.cfm?ProductID=1
NGV Communications Group. (2015). The Gas Vehicles Report - April 2015. 14 #2(159). NGV Global. (2013, November). Current Natural Gas Vehicle Statistics. Retrieved 2015, from
http://www.iangv.org/current-ngv-stats/
90
NGVA Europe. (2015, March 26). Finland. Retrieved from Natural & bio Gas Vehicle Association: http://www.ngvaeurope.eu/finland
NGVA Europe and the GVR. (2013, September 23). Comparison of fuel prices worldwide. Retrieved from Worldwide NGV Statistics: http://www.ngvaeurope.eu/worldwide-ngv-statistics
Obama, B. (2011, May 24). Presidential Memorandum--Federal Fleet Performance. OECD/IEA. (2014). Energy Supply Security 2014. Office of the Federal Coordinator. (2015, February 23). China’s LNG import terminals operated at 55% capacity in
2014. Retrieved April 2015, from Alaska Natural Gas Transportation Projects: china-lng-import-terminals-operated-55-capacity-2014
OICA. (2012). Country rankings using data from official sources. Retrieved from The Global Economy. Olson, B. (2013, December 5). Shell Halts $20 Billion Louisiana Gas-to-Liquids Project . Retrieved from
http://www.bloomberg.com/news/articles/2013-12-05/shell-halts-20-billion-louisiana-gas-to-liquids-project
Platts. (2013, November 13). Israel's Dor to double methanol imports to meet transport demand surge. Retrieved from http://www.platts.com/latest-news/petrochemicals/jerusalem/israels-dor-to-double-methanol-imports-to-meet-27628729
Rabinovitch, A. (2013, December 24). Israel’s New Motor Fuels Strategy Leans on Gas. Retrieved from Reuters: http://uk.reuters.com/article/2013/12/24/us-israel-cars-fuels-idUKBRE9BN0BC20131224
Rahim, S. (2013, June 20). Transportation: Policy is the Muscle Behind Natural Gas Vehicles in China. EnergyWire. Retrieved from EnergyWire: http://www.eenews.net/stories/1059983182
Randall, T. (2013, February 13). Highest & Cheapest Gas Prices by Country. Retrieved from Bloomberg Business: http://www.bloomberg.com/slideshow/2013-02-13/highest-cheapest-gas-prices-by-country.html#slide11
Renewable Energy Focus. (2012, March 23). Denmark to Launch Hydrogen Infrastructure Programme, Keep Fuel Cell Tax Exemptions. Retrieved from Renewable Energy Focus: http://www.renewableenergyfocus.com/view/24734/denmark-to-launch-hydrogen-infrastructure-programme-keep-fuel-cell-vehicle-tax-exemptions/
Reuters Africa. (2015, January 12). TABLE-China's retail gasoline, diesel prices since 2013. Retrieved from Reuters Africa: http://af.reuters.com/article/energyOilNews/idAFL3N0UR2QC20150112
Risch, C., & Santini, D. J. (2011). Checklist for Transition to New Highway Fuel(s). Argonne National Laboratory, Energy Systems Division.
Rood Werpy, M., Santini, D., Burnham, A., & Mintz, M. (2010). Natural Gas Vehicles: Status, Barriers, and Opportunities. Energy Systems Division, Argonne National Laboratory, Center for Transportation Research. Argonne, IL: Argonne National Laboratory.
Rosner, K. (2013, April 17). Fuels for Thought: A competitive fuels future in Israel. Journal of Energy Security. Sternlicht, H., & Staff, H. (2013, January 14). Israel Aims to Replace Gasoline with Natural Gas to Fuel
Transportation. Retrieved from Israel Hayom: http://www.israelhayom.com/site/newsletter_article.php?id=7052
Storrow, B. (2015, February 15). Wyoming pursues gas-to-liquid plants, as companies around the world drop similar ideas. Retrieved April 20, 2015, from http://trib.com/business/energy/wyoming-pursues-gas-to-liquid-plants-as-companies-around-the/article_48a1bb8c-c6c8-5fba-b2d1-c1150a175d53.html
Sylvia, D. (2013, September 18). Natural Gas-to-Gasoline Conversion Means Lower Prices and Less Foreign Oil. Retrieved from Hardhatters: http://www.hardhatters.com/2013/09/natural-gas-to-gasoline-conversion/
The Algemeiner. (2015, February 2). Egypt Business Body Hails Decision to Import Israeli Natural Gas . Retrieved from The Algemeiner: http://www.algemeiner.com/2015/02/02/egypt-business-body-hails-decision-to-import-israeli-natural-gas/
The Danish Government. (2013). The Danish Climate Policy Plan Towards a Low Carbon Society. Copenhagen: The Danish Government.
The International Council on Clean Transportation. (2013). Policy Update - Renewed and Enhanced Subsidies for Energy-Efficient Vehicles in China .
The Kent Group. (2015). Petroleum Prices. Retrieved from The Kent Group Ltd.: http://kentreports.com/wpps.aspx (2008). The Report of the Interministerial Committee on ‘Green’ Taxation—Ministries of Finance, Transport and
Road Safety, National Infrastructures, Environmental Protection. The White House. (2011, May 24). Presidential Memorandum--Federal Fleet Performance. Washington, D.C.
91
The World Bank. (2015). Retrieved from Data: http://data.worldbank.org/ Turpen, A. (2011). Methanol Fuel Cell. Retrieved from FutureCars.com:
http://www.futurecars.com/articles/technology/methanol-fuel-cell U.S. Department of Energy. (2014a). Alternative Fuel and Advanced Vehicles. Retrieved May 3, 2015, from
Alternative Fuels Data Center: http://www.afdc.energy.gov/fuels U.S. Department of Energy. (2014b). Federal Laws and Incentives. Retrieved from Alternative Fuels Data Center:
http://www.afdc.energy.gov/laws/fed_summary U.S. Department of Energy. (2014c). Natural Gas. Retrieved from Alternative Fuels Data Center:
http://www.afdc.energy.gov/vehicles/natural_gas.html U.S. Department of Energy. (2014d). Natural Gas Production and Distribution. Retrieved from Alternative Fuels
Data Center: http://www.afdc.energy.gov/fuels/natural_gas_production.html U.S. Department of Energy. (2015a). Dimethyl Ether (DME) as a Transportation Fuel. Retrieved from Alternative
Fuels Data Center: http://www.afdc.energy.gov/bulletins/2014_01_05_DME.html U.S. Department of Energy. (2015b). Methanol. Retrieved from Alternative Fuels Data Center:
http://www.afdc.energy.gov/fuels/emerging_methanol.html U.S. Department of Energy. (2015c). xTL Fuels. Retrieved from Alternative Fuels Data Center:
http://www.afdc.energy.gov/fuels/emerging_xtl_fuels.html U.S. Department of Energy. (Multiple Years). Countries - International Energy Statistics. Retrieved from
http://www.eia.gov/countries/data.cfm#undefined U.S. Energy Information Administration. (2013a). Denmark - Overview data for Denmark. Retrieved from
http://www.eia.gov/countries/country-data.cfm?fips=DA&trk=m U.S. Energy Information Administration. (2013b). Finland - Overview data for Finland. Retrieved from
http://www.eia.gov/countries/country-data.cfm?fips=FI U.S. Energy Information Administration. (2013c). Israel - Country Analysis Note. Retrieved from
http://www.eia.gov/countries/country-data.cfm?fips=IS U.S. Energy Information Administration. (2013d). United States - Overview data for United States. Retrieved from
http://www.eia.gov/countries/country-data.cfm?fips=US#ng U.S. Energy Information Administration. (2014a). Canada - Country Analysis Brief Overview. Retrieved from
http://www.eia.gov/countries/country-data.cfm?fips=CA U.S. Energy Information Administration. (2014b). China - Country Analysis Brief Overview. Retrieved from
http://www.eia.gov/countries/country-data.cfm?fips=CH&trk=m U.S. Energy Information Administration. (2015). Short-Term Energy and Summer Fuels Outlook. Retrieved from U.S.
Energy Information Administration: http://www.eia.gov/forecasts/steo/report/prices.cfm U.S. Energy Information Administration. (n.d.). All Flows. Retrieved April 15, 2015, from International Energy
Statistics: http://www.eia.gov/cfapps/ipdbproject/IeDIndex3.cfm?tid=3&eyid=1992&syid=1992&reverseAxes=0&cid=&cid=CA&cid=CH&cid=DA&cid=FI&cid=US&pid=26&aid=24&updateB=UPDATE
U.S. Environmental Protection Agency. (2013). Natural Gas. Retrieved from Clean Energy: http://www.epa.gov/cleanenergy/energy-and-you/affect/natural-gas.html
U.S. Environmental Protection Agency. (2014). Basic Information. Retrieved from Fuel Cells & Vehicles: http://www.epa.gov/fuelcell/basicinfo.htm
Udasin, S. (2013, January 14). Integrate Alternatives to Gas in Public Transport: Experts Say that Israeli Target is to Reduce Oil in Transportation Sector by 30% in 2020 and 60% by 2025. Retrieved from The Jerusalem Post: http://www.jpost.com/Enviro-Tech/Integrate-alternatives-to-gas-in-public-transport
Volvo. (n.d.). Volvo Bio-DME. Want China Times. (2013, May 15). The price of power: China's confusing electricity rates. Retrieved from Want
China Times: http://www.wantchinatimes.com/news-subclass-cnt.aspx?id=20130515000080&cid=1102


