Amine-based solvents for exfoliating graphite to graphene outperform
the dispersing capacity of N-methyl-pyrrolidone and surfactants
Zhenyu Sun,* a,b Xing Huang,c Fang Liu,d Xiaoning Yang,*d Christoph Rösler,e Roland A. Fischer,e Martin
Muhlerb and Wolfgang Schuhmanna
a Analytical Chemistry - Center for Electrochemical Sciences (CES), Ruhr-Universität Bochum, D-
44780 Bochum, Germany. E-mail: [email protected] Laboratory of Industrial Chemistry, Ruhr-Universität Bochum, D-44780 Bochum, Germanyc Fritz Haber Institute of the Max Planck Society, D-14195 Berlin, Germanyd College of Chemistry and Chemical Engineering, Nanjing University of Technology, 210009 Nanjing,
the People's Republic of Chinae Inorganic Chemistry, Ruhr-Universität Bochum, 44780 Bochum, Germany
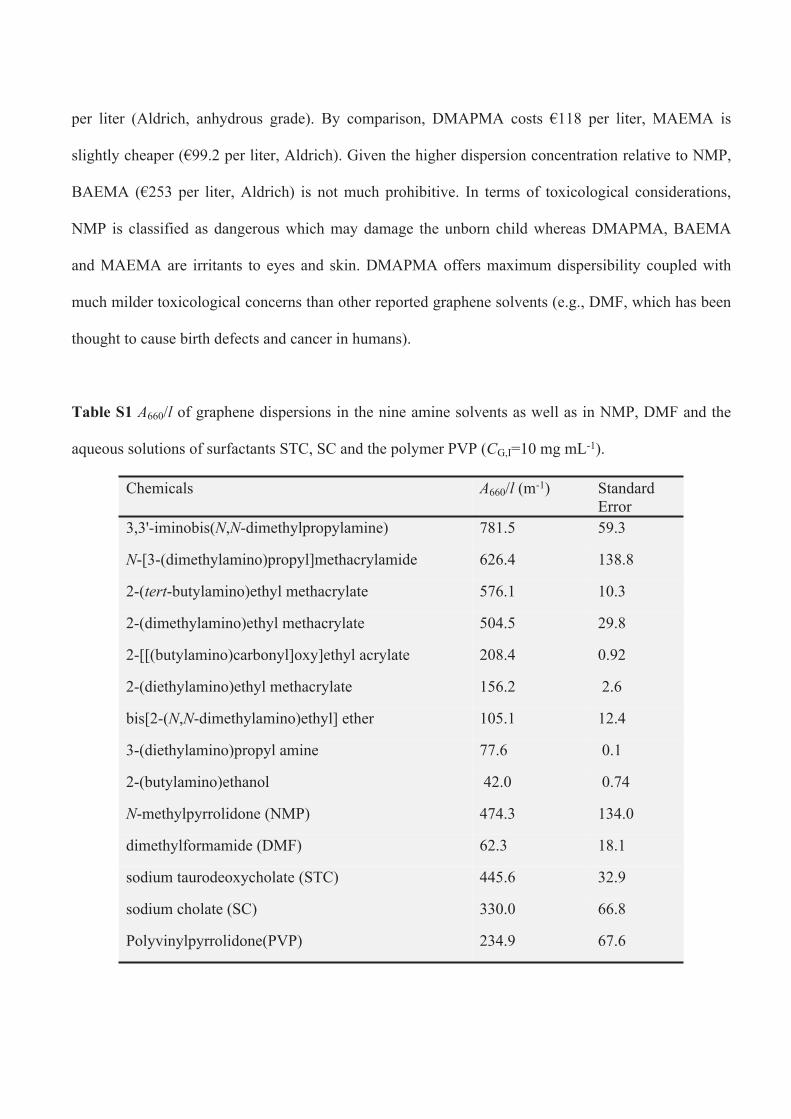
Experimental
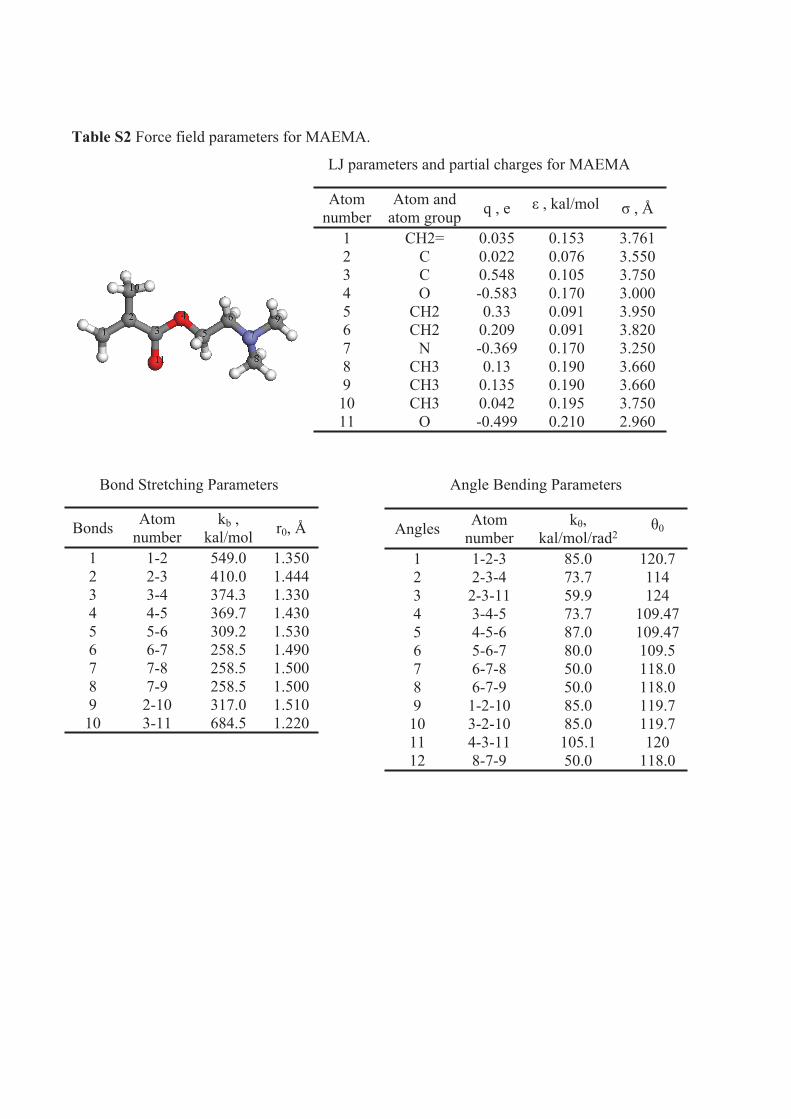
Materials: All chemicals were of analytical grade and used as supplied. 3,3'-iminobis(N,N-
dimethylpropylamine) (product number 348554), N-[3-(dimethylamino)propyl]methacrylamide (pro-
duct number 409472), bis[2-(N,N-dimethylamino)ethyl] ether (product number 667609), 2-(tert-
butylamino)ethyl methacrylate (product number 444332), 2-(dimethylamino)ethyl methacrylate
(product number 234907), 2-[[(butylamino)carbonyl]oxy]ethyl acrylate (product number 496952), 2-
(diethylamino)ethyl methacrylate (product number 408980), 3-(diethylamino)propylamine (product
number 549975), 2-(butylamino)ethanol (product number 471496), N-methyl-2-pyrrolidinone (product
number 328624), N,N-dimethylformamide (product number 227056), anionic surfactants sodium
taurodeoxycholate (product number T0875) and sodium cholate (product number C1254),
polyvinylpyrrolidone (product number 856568), and 2-methylimidazole (product number M50850)
were purchased from Sigma-Aldrich. Graphite powder (product number 332461) was also acquired
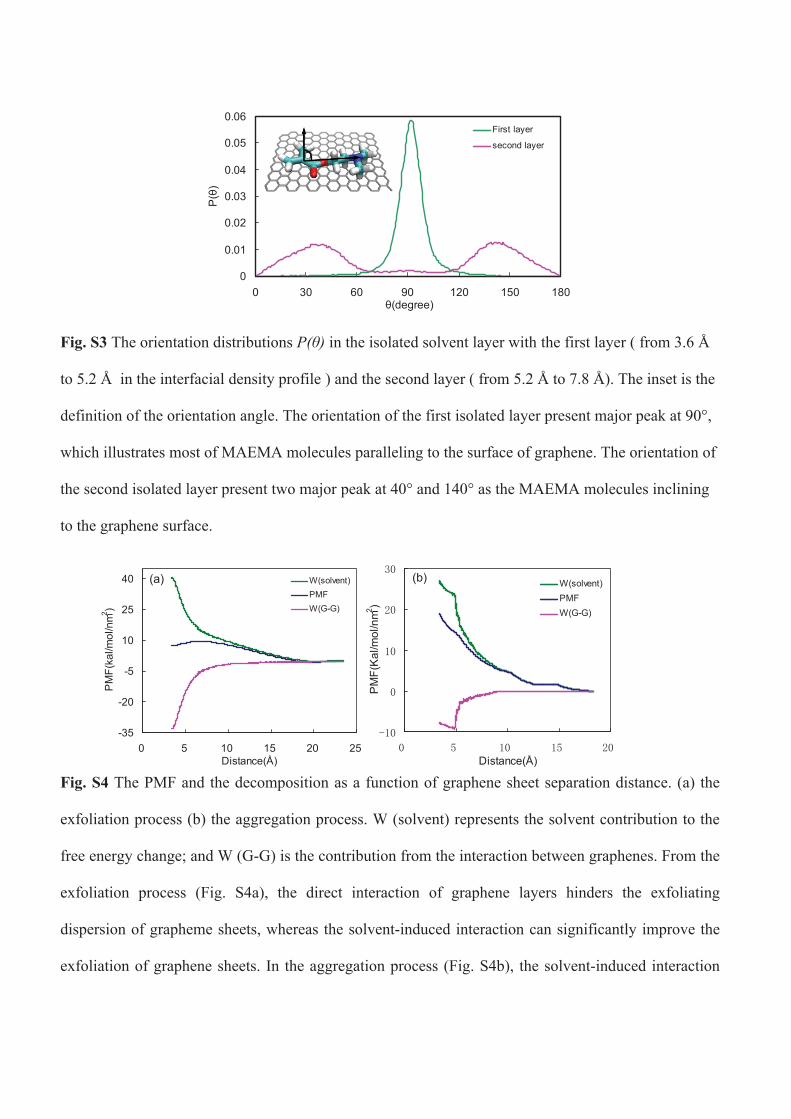
Fig. S3 The orientation distributions P(θ) in the isolated solvent layer with the first layer ( from 3.6 Å
to 5.2 Å in the interfacial density profile ) and the second layer ( from 5.2 Å to 7.8 Å). The inset is the
definition of the orientation angle. The orientation of the first isolated layer present major peak at 90°,
which illustrates most of MAEMA molecules paralleling to the surface of graphene. The orientation of
the second isolated layer present two major peak at 40° and 140° as the MAEMA molecules inclining
to the graphene surface.
Fig. S4 The PMF and the decomposition as a function of graphene sheet separation distance. (a) the
exfoliation process (b) the aggregation process. W (solvent) represents the solvent contribution to the
free energy change; and W (G-G) is the contribution from the interaction between graphenes. From the
exfoliation process (Fig. S4a), the direct interaction of graphene layers hinders the exfoliating
dispersion of grapheme sheets, whereas the solvent-induced interaction can significantly improve the
exfoliation of graphene sheets. In the aggregation process (Fig. S4b), the solvent-induced interaction
-35
-20
-5
10
25
40
0 5 10 15 20 25Distance(Å)
PM
F(ka
l/mol
/nm2 )
W(solvent)PMFW(G-G)
(a)
Distance(Å)
PM
F(K
al/m
ol/n
m2 )
W(solvent)PMFW(G-G)
(b)
had a repulsive action on the aggregation of graphene sheets. For the separation distance near 5 Å, the
abnormally changed free-energy might come from the slanting graphene during the aggregating
process.
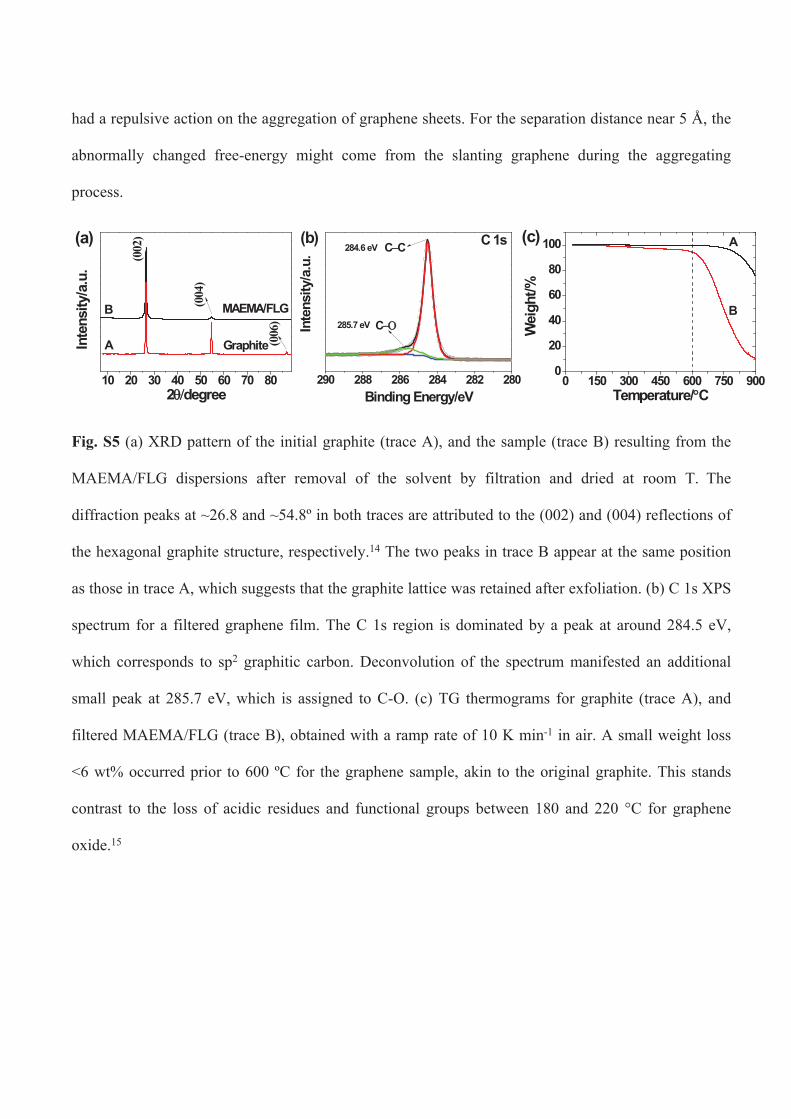
Fig. S5 (a) XRD pattern of the initial graphite (trace A), and the sample (trace B) resulting from the
MAEMA/FLG dispersions after removal of the solvent by filtration and dried at room T. The
diffraction peaks at ~26.8 and ~54.8º in both traces are attributed to the (002) and (004) reflections of
the hexagonal graphite structure, respectively.14 The two peaks in trace B appear at the same position
as those in trace A, which suggests that the graphite lattice was retained after exfoliation. (b) C 1s XPS
spectrum for a filtered graphene film. The C 1s region is dominated by a peak at around 284.5 eV,
which corresponds to sp2 graphitic carbon. Deconvolution of the spectrum manifested an additional
small peak at 285.7 eV, which is assigned to C-O. (c) TG thermograms for graphite (trace A), and
filtered MAEMA/FLG (trace B), obtained with a ramp rate of 10 K min-1 in air. A small weight loss
<6 wt% occurred prior to 600 ºC for the graphene sample, akin to the original graphite. This stands
contrast to the loss of acidic residues and functional groups between 180 and 220 °C for graphene
oxide.15
0 150 300 450 600 750 9000
20
40
60
80
100
B
Wei
ght/%
Temperature/°°C
(c) A
290 288 286 284 282 280
C−Ο285.7 eV
284.6 eV C−C
C 1s
Inte
nsity
/a.u
.
Binding Energy/eV
(b)
10 20 30 40 50 60 70 80
MAEMA/FLG
Graphite
(004
)
(006
)
(002
)
Inte
nsity
/a.u
.
2θ/degree
(a)
A
B
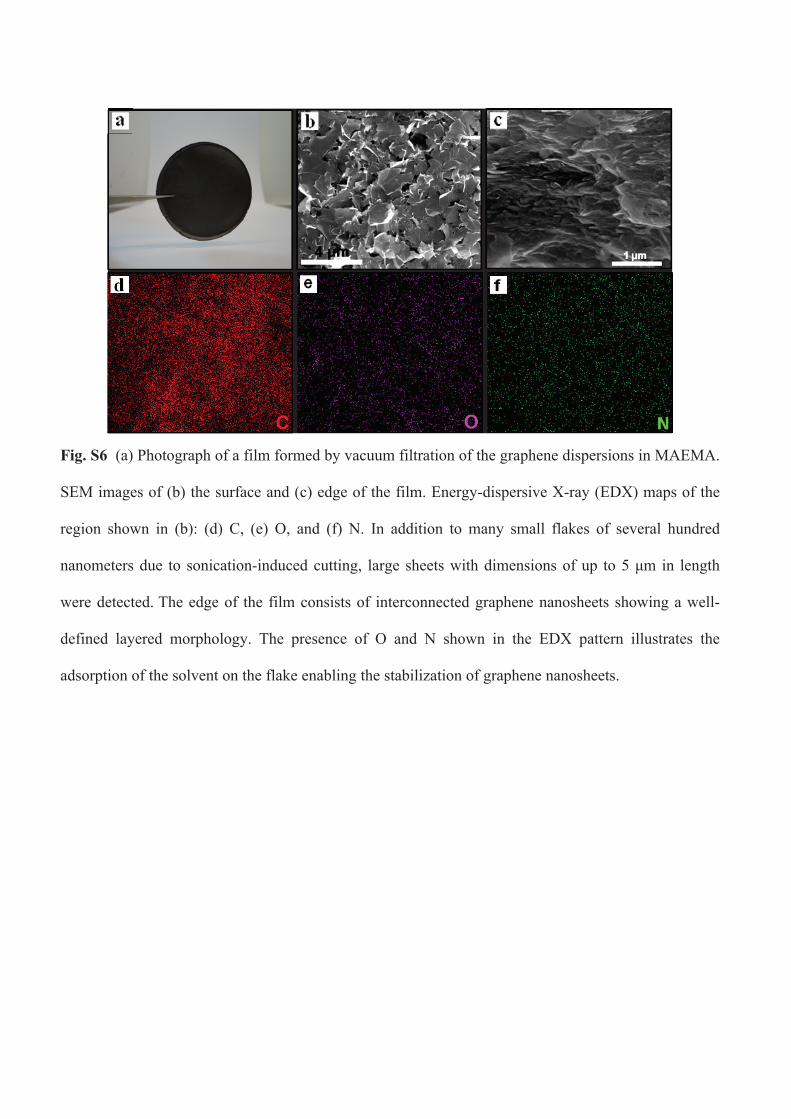
Fig. S6 (a) Photograph of a film formed by vacuum filtration of the graphene dispersions in MAEMA.
SEM images of (b) the surface and (c) edge of the film. Energy-dispersive X-ray (EDX) maps of the
region shown in (b): (d) C, (e) O, and (f) N. In addition to many small flakes of several hundred
nanometers due to sonication-induced cutting, large sheets with dimensions of up to 5 μm in length
were detected. The edge of the film consists of interconnected graphene nanosheets showing a well-
defined layered morphology. The presence of O and N shown in the EDX pattern illustrates the
adsorption of the solvent on the flake enabling the stabilization of graphene nanosheets.
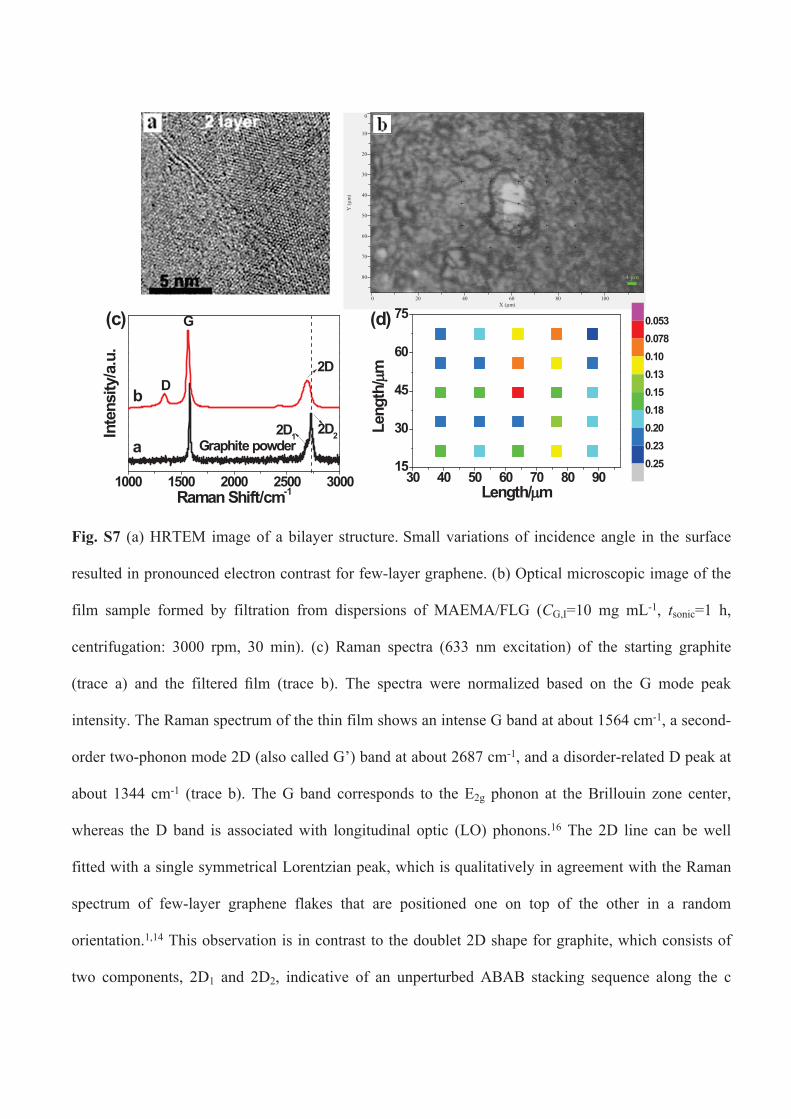
Fig. S7 (a) HRTEM image of a bilayer structure. Small variations of incidence angle in the surface
resulted in pronounced electron contrast for few-layer graphene. (b) Optical microscopic image of the
film sample formed by filtration from dispersions of MAEMA/FLG (CG,I=10 mg mL-1, tsonic=1 h,
centrifugation: 3000 rpm, 30 min). (c) Raman spectra (633 nm excitation) of the starting graphite
(trace a) and the filtered film (trace b). The spectra were normalized based on the G mode peak
intensity. The Raman spectrum of the thin film shows an intense G band at about 1564 cm-1, a second-
order two-phonon mode 2D (also called G’) band at about 2687 cm-1, and a disorder-related D peak at
about 1344 cm-1 (trace b). The G band corresponds to the E2g phonon at the Brillouin zone center,
whereas the D band is associated with longitudinal optic (LO) phonons.16 The 2D line can be well
fitted with a single symmetrical Lorentzian peak, which is qualitatively in agreement with the Raman
spectrum of few-layer graphene flakes that are positioned one on top of the other in a random
orientation.1,14 This observation is in contrast to the doublet 2D shape for graphite, which consists of
two components, 2D1 and 2D2, indicative of an unperturbed ABAB stacking sequence along the c
0
10
20
30
40
50
60
70
80
Y (μ
m)
0 20 40 60 80 100X (μm)
4 μm
30 40 50 60 70 80 9015
30
45
60
75
Leng
th/μ
m
Length/μm
0.0530.0780.100.130.150.180.200.230.25
(d)
1000 1500 2000 2500 3000
Graphite powder2D22D1
b
2D
G
D
Inte
nsity
/a.u
.
Raman Shift/cm-1
a
(c)
direction of the bulk material. A shift of approximately 37 cm-1 to lower wavenumbers occurs for the
2D band of the film sample relative to graphite. (d) Two-dimensional Raman map of the regions for
the film as shown in (b). The color gradient bar to the right of the map represents the D-to-G peak
intensity ratio.
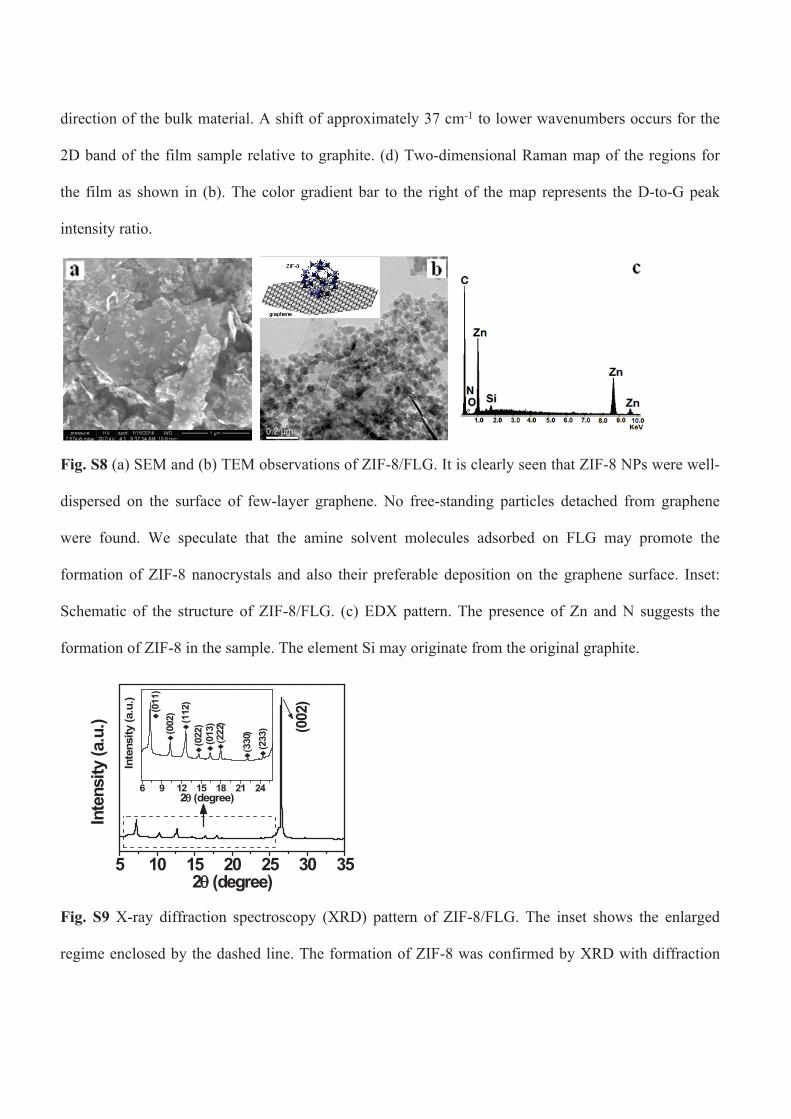
Fig. S8 (a) SEM and (b) TEM observations of ZIF-8/FLG. It is clearly seen that ZIF-8 NPs were well-
dispersed on the surface of few-layer graphene. No free-standing particles detached from graphene
were found. We speculate that the amine solvent molecules adsorbed on FLG may promote the
formation of ZIF-8 nanocrystals and also their preferable deposition on the graphene surface. Inset:
Schematic of the structure of ZIF-8/FLG. (c) EDX pattern. The presence of Zn and N suggests the
formation of ZIF-8 in the sample. The element Si may originate from the original graphite.
5 10 15 20 25 30 35
6 9 12 15 18 21 24
♦(0
22)
♦(2
33)
♦(3
30)
♦(2
22)
♦(0
13)♦(1
12)
♦(0
02)♦(0
11)
Inte
nsity
(a.u
.)
2θ (degree)
� (0
02)
Inte
nsity
(a.u
.)
2θ (degree)
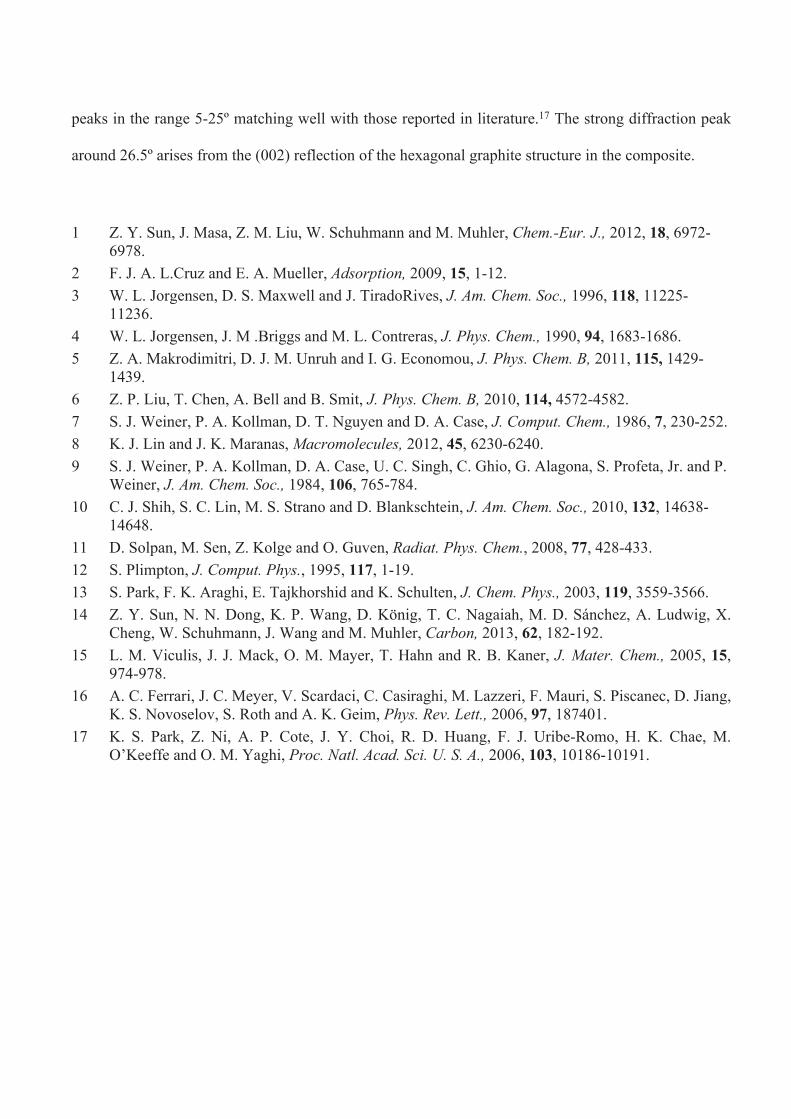
Fig. S9 X-ray diffraction spectroscopy (XRD) pattern of ZIF-8/FLG. The inset shows the enlarged
regime enclosed by the dashed line. The formation of ZIF-8 was confirmed by XRD with diffraction
peaks in the range 5-25º matching well with those reported in literature.17 The strong diffraction peak
around 26.5º arises from the (002) reflection of the hexagonal graphite structure in the composite.
1 Z. Y. Sun, J. Masa, Z. M. Liu, W. Schuhmann and M. Muhler, Chem.-Eur. J., 2012, 18, 6972-6978.
2 F. J. A. L.Cruz and E. A. Mueller, Adsorption, 2009, 15, 1-12.3 W. L. Jorgensen, D. S. Maxwell and J. TiradoRives, J. Am. Chem. Soc., 1996, 118, 11225-
11236.4 W. L. Jorgensen, J. M .Briggs and M. L. Contreras, J. Phys. Chem., 1990, 94, 1683-1686.5 Z. A. Makrodimitri, D. J. M. Unruh and I. G. Economou, J. Phys. Chem. B, 2011, 115, 1429-
1439.6 Z. P. Liu, T. Chen, A. Bell and B. Smit, J. Phys. Chem. B, 2010, 114, 4572-4582.7 S. J. Weiner, P. A. Kollman, D. T. Nguyen and D. A. Case, J. Comput. Chem., 1986, 7, 230-252.8 K. J. Lin and J. K. Maranas, Macromolecules, 2012, 45, 6230-6240.9 S. J. Weiner, P. A. Kollman, D. A. Case, U. C. Singh, C. Ghio, G. Alagona, S. Profeta, Jr. and P.
Weiner, J. Am. Chem. Soc., 1984, 106, 765-784.10 C. J. Shih, S. C. Lin, M. S. Strano and D. Blankschtein, J. Am. Chem. Soc., 2010, 132, 14638-
14648.11 D. Solpan, M. Sen, Z. Kolge and O. Guven, Radiat. Phys. Chem., 2008, 77, 428-433.12 S. Plimpton, J. Comput. Phys., 1995, 117, 1-19.13 S. Park, F. K. Araghi, E. Tajkhorshid and K. Schulten, J. Chem. Phys., 2003, 119, 3559-3566.14 Z. Y. Sun, N. N. Dong, K. P. Wang, D. König, T. C. Nagaiah, M. D. Sánchez, A. Ludwig, X.
Cheng, W. Schuhmann, J. Wang and M. Muhler, Carbon, 2013, 62, 182-192.15 L. M. Viculis, J. J. Mack, O. M. Mayer, T. Hahn and R. B. Kaner, J. Mater. Chem., 2005, 15,
974-978.16 A. C. Ferrari, J. C. Meyer, V. Scardaci, C. Casiraghi, M. Lazzeri, F. Mauri, S. Piscanec, D. Jiang,
K. S. Novoselov, S. Roth and A. K. Geim, Phys. Rev. Lett., 2006, 97, 187401.17 K. S. Park, Z. Ni, A. P. Cote, J. Y. Choi, R. D. Huang, F. J. Uribe-Romo, H. K. Chae, M.
O’Keeffe and O. M. Yaghi, Proc. Natl. Acad. Sci. U. S. A., 2006, 103, 10186-10191.