Aminoglycoside-derived Liposomes for Synergistic Drug Delivery Kaushal Rege Associate Professor of Chemical Engineering Arizona State University Tempe, AZ 85287-6106, USA 1 Co-PI: Prof. Sandra Gendler, Mayo Clinic Scottsdale, AZ
Transcript
Aminoglycoside-derived Liposomes for
Synergistic Drug Delivery
Kaushal Rege
Associate Professor of Chemical Engineering
Arizona State University
Tempe, AZ 85287-6106, USA
1
Co-PI: Prof. Sandra Gendler, Mayo Clinic Scottsdale, AZ
2
Cancer statistics, 2015. Siegel RL, Miller KD, Jemal A. CA Cancer J Clin. 2015;65(1):5-29.
Aim 1. Identification of the genetic causes of undiagnosed
neuromuscular disease in Arizona infants and children
Aim 2. We have developed a mouse model to further
understand XL-SMA
Aim 3. Exciting finding of a novel neuromuscular disease-
causing gene and functional characterization
TRANSLATIONAL GENOMICS RESEARCH INSTITUTE
Whole exome sequencing
• Sequence all ~25,000
genes at once
• Use supercomputer to
identify changes in the
sequence that cause
SMA and related
neuromuscular disease.
~2000-2005 2006-Present
TRANSLATIONAL GENOMICS RESEARCH INSTITUTE
Summary of ABRC exome studies
2014-2016
Families enrolled in exome studies 18
Families with exomes completed 12
Individuals in exome studies 70
Individual exomes completed 45
Affected individuals sequenced 26
Families with mutations identified 9*
*All were clinically confirmed by Sanger sequencing of proband
• Many of the families had only one affected individual
• All the cases had numerous diagnostic tests without
receiving a diagnosis prior to exome sequencing.
TRANSLATIONAL GENOMICS RESEARCH INSTITUTE
Family 74 Phenotype
Congenital severe global
hypotonia
Trach/vent dependent
G-tube dependent
Arthrogryposis
Bicuspid aortic valve
Cryptorchidism
Underdeveloped lung
Eventrated diaphragm
Missing 2 ribs
Deafness
Mother has history of
miscarriages
Currently ~11 mo. of age
Muscle biopsy nemaline
bodies and myofibrillary
disorganization
Pathogenic Variants
Novel splice variant at exon
59 and previously reported
pathogenic inversion splice
variant at exon 37
Nemaline Myopathy
NEB Compound Heterozygous Recessive
Nebulin (NEB)
* Essential structural
component of muscle
that stabilizes actin
filaments
* Loss of function
mutations in NEB
cause Nemaline
myopathy
Splice Ex-59
>
Splice Ex-37
Splice Ex-59 Splice Ex-37
Aff
ec
ted
Ma
le
Mo
the
r
Un
aff
ec
ted
Fa
the
r u
na
ffe
cte
d
NEB
Mother
unaffected
Father
unaffected
Affected
Male
Exon 37 Exon 59
TRANSLATIONAL GENOMICS RESEARCH INSTITUTE
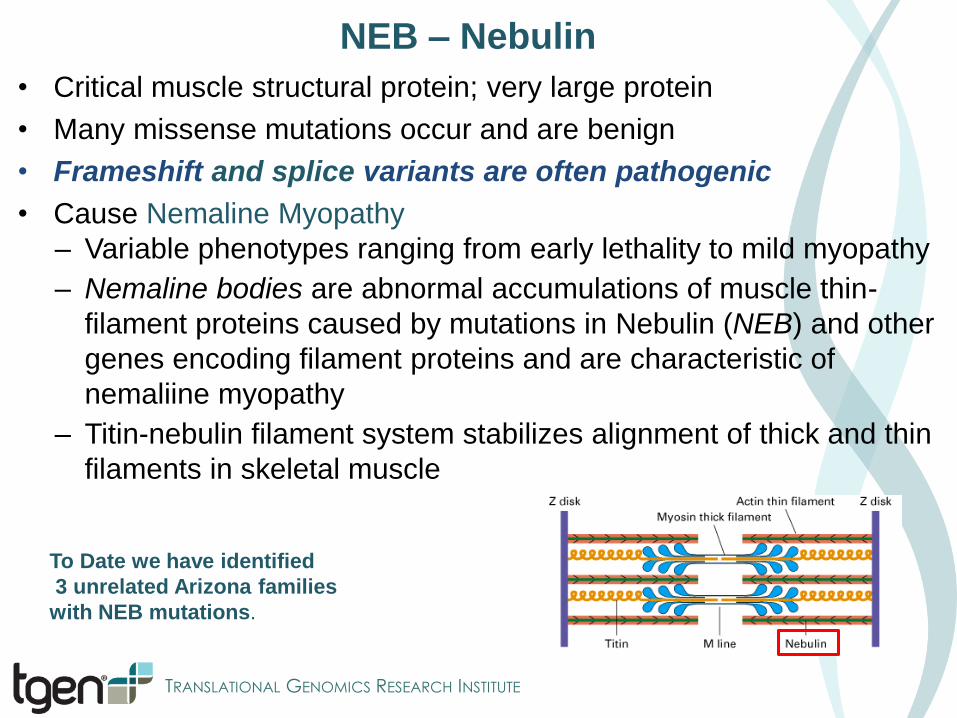
NEB – Nebulin
• Critical muscle structural protein; very large protein
• Many missense mutations occur and are benign
• Frameshift and splice variants are often pathogenic
• Cause Nemaline Myopathy
– Variable phenotypes ranging from early lethality to mild myopathy
– Nemaline bodies are abnormal accumulations of muscle thin-
filament proteins caused by mutations in Nebulin (NEB) and other
genes encoding filament proteins and are characteristic of
nemaliine myopathy
– Titin-nebulin filament system stabilizes alignment of thick and thin
filaments in skeletal muscle
To Date we have identified
3 unrelated Arizona families
with NEB mutations.
TRANSLATIONAL GENOMICS RESEARCH INSTITUTE
Family 79 Phenotype
Global neuromuscular
delay
Crawled but regressed
Progressive cerebellar
atrophy
Generalized hypotonia
Mild spine deformation
Bilateral coxa valga
Weight loss
Normal CPK
Mild microcephaly
Onset ~9mo. of age
Currently ~3yrs of age
Pathogenic Variants
Novel p.D283G
missense and pL651fs.
Not present in ExAC
Infantile Neuroaxonal Dystrophy
PLA2G6 Compound Heterozygous Recessive
PLA2G6
* Calcium-independent
phospholipase (A2 group
VIA)
* essential for membrane
phospholipid remodeling
in axons and synapses
* Mutations in PLA2G6
cause Infantile
neuroaxonal dystrophy, a
very rare disorder
Aff
ec
ted
Ma
le
Mo
the
r
un
aff
ec
ted
M
ale
Sib
lin
g
un
aff
ec
ted
Fa
the
r
un
aff
ec
ted
PLA2G6
p.L651fs p.D283G
p.L651fs p.D283G
> p.D283G p.L651fs p.L651fs
Affected Male Unaffected Male
Unaffected
Father
Unaffected
Mother
TRANSLATIONAL GENOMICS RESEARCH INSTITUTE
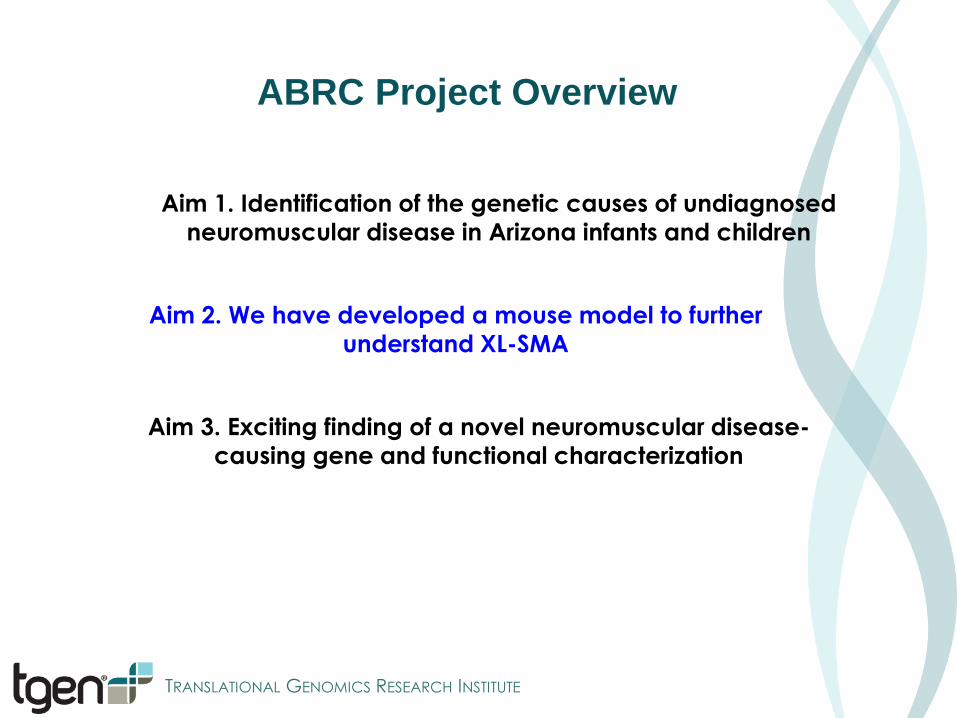
ABRC Project Overview
Aim 1. Identification of the genetic causes of undiagnosed
neuromuscular disease in Arizona infants and children
Aim 2. We have developed a mouse model to further
understand XL-SMA
Aim 3. Exciting finding of a novel neuromuscular disease-
causing gene and functional characterization
TRANSLATIONAL GENOMICS RESEARCH INSTITUTE
IAD FCCH 4HB IAD AAD SCCH AAD UFD
AS
P5
76
*
Se
r54
7G
ly
Asn
57
7A
sn
Me
t53
9Il
e
Cys6
32
* 1
a.a. # 204 309 390 439 838 950 1058 626
52
5
58
1
Exon 15
Inferred domain boundaries
*Critical residues:
adenylation (Lys 528 Asp576)
Ub thiolester (Cys 632) Glu
55
7V
al
LY
S5
28
*
Variant used in UBA1 mouse model
UBA1 Mutations
Exon 15
In silico predicted CpG Island
Exon 16
Methylated CpGs
(c.1731 C>T
p.Asn577Asn)
(c.1639 A>G
p.Ser547Gly)
(c.1617 G>T
p.Met539Ile)
CpG Island CpG Island CpG Island
5‘ 3‘2 1615 26
Human K L K S D T A A A A V R Q M N P H I R V T S H Q N R V G P D T E R I Y D D D F F Q N L D G V A N A L D N V D A R
Mouse K L K S D T A A A A V R Q M N P Y I Q V T S H Q N R V G P D T E R I Y D D D F F Q N L D G V A N A L D N I D A R
Rat K L K S D T A A A A V R Q M N P Y I Q V T S H Q N R V G P D T E R I Y D D D F F Q N L D G V A N A L D N V D A R
Rabbit K L K S D T A A A A V R H M N P H I R V T S H Q N R V G P D T E R I Y D D D F F Q T L D G V A N V L D N V D A
Dog K L K S D T A A A A V R Q M N P H I R V T S H Q N R V G P D T E R I Y D D D F F Q N L D G V A N A L D N V D A R
Opossum K L K S D T A A A A V R Q M N P Q I H V T S H Q N R V G P D T E R I Y D D D F F Q A L D G V T N A L D N V D A R
Xenopus K M K S E T A A A A V R K M N P N L R V T A H Q N R V G T E T E K V Y D D D F F E A L D G V A N A L D N I D A
Tetraodon K M K S D T A A M A V R K M N P A L K I T A H Q N R V G P D T E R I Y N D D F F E S L D G V T N A L D N V D A R
11a
CpG Island CpG Island
A
B
C
(Ramser et al 2008 Am J Hum Genet 82:188-93)
TRANSLATIONAL GENOMICS RESEARCH INSTITUTE
• UBA1 is the initiating pinnacle
enzyme in the Ubiquitin
Proteasome System (UPS)
• UBA1 is expressed in every
cell with highest expression in
the spinal cord
• The UPS is responsible for the
degradation of most proteins
• Uses Ubiquitin as a death tag,
targeting other proteins for
destruction via the proteasome
• Complete loss of UBA1
function is lethal
Why is UBA1 Important?
Ubiquitin Proteasome System
UniProt/Swiss-Prot: UBE1_HUMAN, P22314
TRANSLATIONAL GENOMICS RESEARCH INSTITUTE
UBA1 Conditional Targeted Mouse Design
1. This partial mini-
gene will express
wt UBA1 until removed
by breeding with a
CRE-expressing
mouse
The endogenous mouse exon 15 contains the UBA1 S547G mutation but
it will not be expressed until bred with CRE-expressing mouse
2. After breeding with
CRE-expressing mouse
the wt partial minigene
will be removed and the
mouse will express UBA1
with the S547G mutation
that causes XL-SMA
Initial development of the UBA1 mouse model was made
possible by a Flinn Foundation Grant and the ARBC
We have Southern blot confirmation of
heterozygous female mice with the conditional
targeted knock-in allele (see poster).
TRANSLATIONAL GENOMICS RESEARCH INSTITUTE
Examples of Immunolabeling of motor neurons in normal mice
Investigate Mechanisms of Disease in UBA1 Mouse Model
UBA1S547G mouse model expansion and survival
We will first test whether the UBA1S547G/y hemizygous (male) mouse
mutants have similar perinatal lethality as observed in humans
Neuromuscular development in UBA1S547G mutant mice
We will evaluate whether UBA1S547G/y mutant mice exhibit aberrant
development or degeneration of the neuromuscular system.
Spinal motor neuron number, axonal outgrowth, and NMJ formation will
be evaluated at distinct stages of development using immunolabeling,
motor neuron specific reporter mice, and microscopy.
Image courtesy of J. Newbern ASU collaborator
TRANSLATIONAL GENOMICS RESEARCH INSTITUTE
ABRC Project Overview
Aim 1. Identification of the genetic causes of undiagnosed
neuromuscular disease in Arizona infants and children
Aim 2. We have developed a mouse model to further
understand XL-SMA
Aim 3. Exciting finding of a novel neuromuscular disease-
causing gene and functional characterization
TRANSLATIONAL GENOMICS RESEARCH INSTITUTE
EE
EE
E
Family 9
Phenotype (Neonatal Males)
Clear X-linkage
Neonatal lethality
Arthrogryposis
Cerebellar hypoplasia
Cardiac anomalies
Pathogenic Variant
Novel M1V start loss in
SCML2 in obligate carrier
and affected son
Family 3
Phenotype (Neonatal Males)
Clear X-linkage
Neonatal lethality
Dysmorphic facies
Arthrogryposis
Microcephaly
Hypospadias
Distal limb deformities
Subarachnoid hemorrhages
Potential Pathogenic Variant
Novel N76S missense in SCML2
W
T MT
Affected
Obligate carrier
Male
SB
SBAFF
E
ET T T
T
SCML2 Mutation Families
SCML2
* Never reported as
NMD gene
* Key component of
polycomb repressor
complex (2)
* Maintains
repression of
developmental
genes
TRANSLATIONAL GENOMICS RESEARCH INSTITUTE
We have developed a collaboration with
investigators in Italy, Switzerland, and
Germany to study SCML2 mutations.
• A knock out mouse model with an 11bp frame shift
mutation in SCML2 exon 4 resulting in premature
stop codon in the MBT1 domain was generated
(confirmed by Sanger Sequencing)
• SCML2KO males have fertility issues from
hypogonadism and spermatogeneis defects
• Crossing wild type males with SCML2+/- females
produced SCML2KO males for study
• Mice exhibited:
Impaired inhibitory synapse in spinal motor neurons
Impairment of inhibitory currents & synapses
Spontaneous cortical hyperexitabilty
Susceptibility to seizures
Variants in cell line study
Variant found by collaborators
SCML2 Mutation Functional Study: Mouse Model
Portions of these studies are in revision
/review at Nature Neuroscience
Knock out of Scml2 was confirmed
by immunostaining
TRANSLATIONAL GENOMICS RESEARCH INSTITUTE
ABRC Project Overview
Aim 1. Identification of the genetic causes of neuromuscular disease in
Arizona infants and children by whole exome sequencing
Aim 2. Characterization of neuromuscular development in an
UBA1 mouse model of XL-SMA
Aim 3. Functional characterization of a novel neuromuscular
disease-causing genetic variant
The study of rare diseases provides greater insights into mechanisms
which may be relevant to more common related diseases
TRANSLATIONAL GENOMICS RESEARCH INSTITUTE
Acknowledgements This research was generously supported by the MDA (MDA186435), The Flinn Foundation, and TGen., We would like to thank all members of XL-SMA research team, especially Therese De La Torre (project manager), Jose Ramirez and Stephanie Althoff (Clinical Coordinators) for their dedicated help with this research.
Acknowledgements This research was generously supported by the MDA (MDA186435), The Flinn Foundation, and TGen., We would like to thank all members of XL-SMA research team, especially Therese De La Torre (project manager), Jose Ramirez and Stephanie Althoff (Clinical Coordinators) for their dedicated help with this research.
Insert picture here
Special thanks to Jesse Hunter, Chris Balak, and Mary Ellen Ahearn
"No matter how heavy you are, you will significantly lower your blood sugar if you lose some weight” Cathy Nonas, MS, RD Spokeswoman for the American Dietetic Association Professor at Mount Sinai School of Medicine, NY
Type 2 Diabetes
Weight Loss
Diabetes Research Program
The Motivation • 2.1 billion people, or ~30% world’s population, are overweight or obese in 2013 • Obesity is known to cause many chronic diseases, including heart diseases,
stroke, diabetes, metabolism syndrome, and some cancers (CDC). • People spend ~$600 billion per year, yet most are frustrated with the results
2 out 3 Americans are overweight or Obese
5
The Problem
How much should I eat? How much should I
exercise? Why is my weight like yo-yo?
• Most people know weight management requires balanced diet and exercises, but few know:
H. Seagle, G. W. Strain, A. Makris, and R. S. Reeves, "Position of the American Dietetic Association: Weight Management," Journal of the American Dietetic Association, vol. 109, pp. 330-346, 2009.
•The participants from the control group had an iPad with My Fitness Pal App to track calorie intake, an activity tracker to track steps and floors, and a weight scale.
• Each participant in the control group was recommended a 500-calorie deficit intake based on the Harris Benedict Equation
• The intervention group had the same gadgets as the control group, as well as a Breezing Tracker. • Both groups were followed up with a Standard-of-Care procedure for 6 months, and were reached by e-mail every 2-3 weeks with general health information.
Control Group (CG)
Intervention Group (IG)
* Most of participants had T2 Diabetes, or were at risk of Diabetes
Characteristics of the population
Dr. Craig Stump, MD
13 www.breezing.co
Clinical study in an overweight and obese population*
* Most of participants had T2 Diabetes, or were at risk of Diabetes
Difference of Calculated REE* – True (measured) REE
42% of the cases in the pilot study group (overweight and T2 diabetes) had slower metabolic rates that the
predicted from equation
14
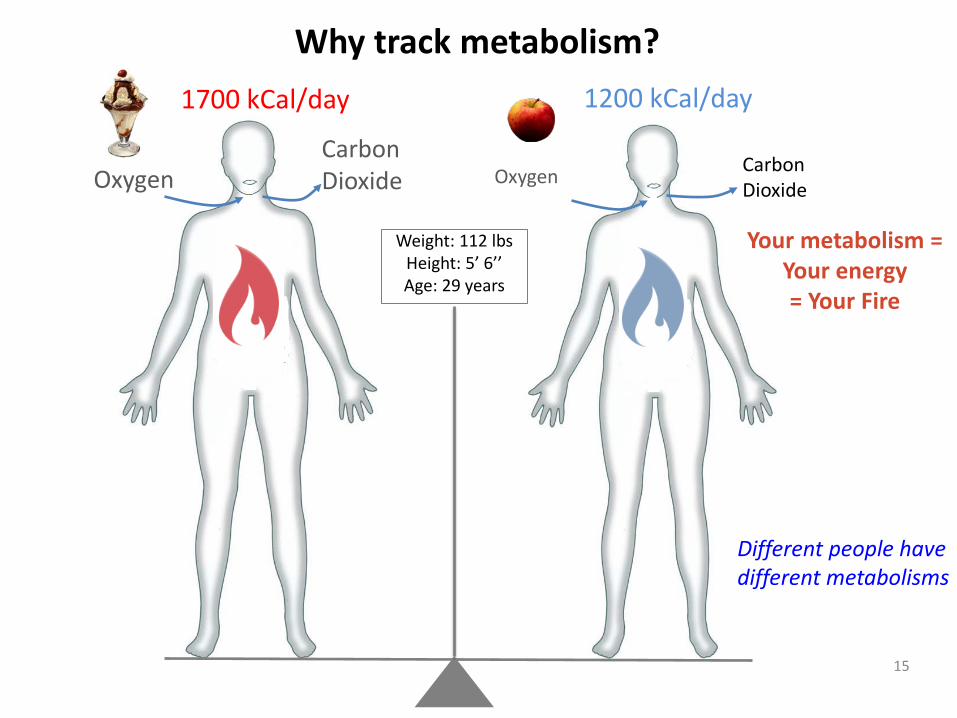
Oxygen Carbon Dioxide Oxygen Carbon
Dioxide
1700 kCal/day 1200 kCal/day
Your metabolism = Your energy = Your Fire
Why track metabolism?
Weight: 112 lbs Height: 5’ 6’’ Age: 29 years
15
Different people have different metabolisms
Why we can’t use equations to calculate REE ?
16
An actual REE value (from indirect calorimetry measurement) can differ from an estimated REE value (from the Harris-Benedict calculation).
The results show that for people of same gender and weight (e.g. men and 63 kg) the difference in actual REE values can be as high as 520 kCal/day.
If, for instance, subject A’s goal is to maintain weight, and the estimated REE (1640 kcal/day) is higher than the body’s actual REE (1480 kcal/day), a calorie recommendation based on the REE estimate will lead to weight gain.
Therefore, accurately measuring REE is crucial in establishing an effective weight management plan.
Plot from J. Arthur Harris and Francis G. Benedict, A Biometric Study of Human Basal Metabolism, Proc Natl Acad Sci U S A. 1918 December; 4(12): 370–373. Criscione, L. & Durr-Gross, M. Eating healthy and dying obese. Vitasanas GmbH, http://www.vitasanas.ch, ISBN: 978-3-0033-02225-6 (2010).
Observation: Weight change is accounted from 1st day the participant use MFP (baseline period) up to 6 months after the study
-50 -40 -30 -20 -10 0 10 20 30
123456789
1011121314151617181920
Weight change (lbs)
Part
icip
ants
CG IG
17 www.breezing.co
Intervention Group: 17 of 19 participants (89%) lost weight, 1 stayed steady and 1 (5%) gained 1.9 lbs.
Control Group: 11 of 20 participants (55%) lost weight, 1 stayed steady and 8 (40%) gained 2+ lbs.
Other results: Weight loss Greater Than 6 lbs: CG: 40% (8/20) vs IG: 68% (13/19)
-250
-200
-150
-100
-50
01 2
Case #2: Weight & Body Mass Index (BMI) changes W
eigh
t cha
nge
aver
age
(lb)
Group
Control Intervention
*Statistical significant (p= 0.03)
The Intervention group’s total weight loss 3x’s Greater than control group The difference in BMI changes in intervention group was statistically significantly different with respect with control group Intervention group’s drop of BMI from 35.5 resulted in change from Obese Class II Group to Obese Class I Group
Control Intervention
BMI:-1.9
BMI:-0.5
18
Control group’s drop of BMI from 36.9 was not large enough to move out of Obese Class II Group
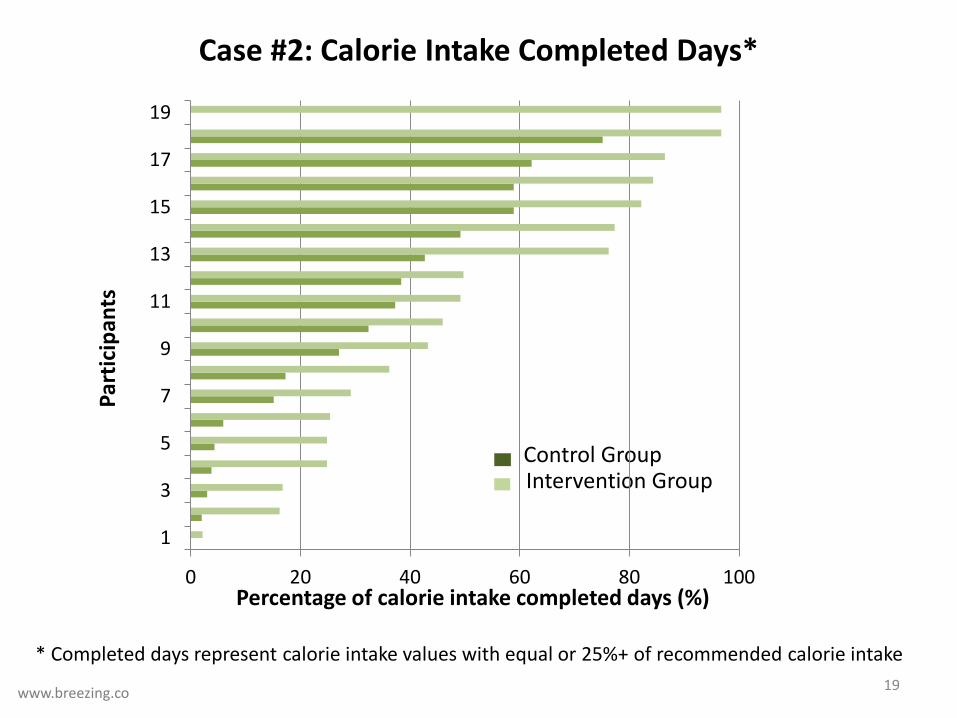
Control Group Intervention Group
Percentage of calorie intake completed days (%)
Part
icip
ants
19 www.breezing.co
0 20 40 60 80 100
1
3
5
7
9
11
13
15
17
19
Case #2: Calorie Intake Completed Days*
* Completed days represent calorie intake values with equal or 25%+ of recommended calorie intake
Perc
enta
ge a
vera
ge o
f ca
lorie
inta
ke co
mpl
eted
da
ys (%
)
Group Control Intervention
Statistically significant (p= 0.05)
20 www.breezing.co
0
10
20
30
40
50
60
1 2
The Intervention group had 70% more entries of completed daily calorie intake than the control group
Case #2: Calorie Intake Complete Days*
* Completed days represent calorie intake values with equal or 25%+ of recommended calorie intake
Case #2: Calorie Intake Entries
0 25 50 75 100 125 150
SENDCMBAGPNDJMJGDSAD
LJJSJJ
GVRDGCFV
WNAvg MFP
SDAvg MFP+B
CBDTVVLPYSSGARDLSBAAOFJF
AMMHMSBBJHJSJG
Total Measures
Number of Entries
Part
icip
ants
Cont
rol G
roup
In
terv
entio
n G
roup
My Fitness Pal (MFP)’s Volume Entries (including diet, activity, weight, comments) Breezing Entries
63 = MFP’s entry average 79 = MFP’s entry average
Intervention Group: 25% more entries vs. control group
www.breezing.co
Case #2: Benefits of weight loss in blood parameters
22
Intervention group had a better outcome for HDL cholesterol (increased HDL cholesterol with a significant difference of p = 0.037 with respect to the control group
-25 -15 -5 5 15 25
123456789
1011121314151617181920
Series2
Series1Controls Intervention
HDL change
Diastolic Blood Pressure Intervention group had a better outcome for reduction of diastolic blood pressure: a decrease with a significant difference of p = 0.07 with respect to the control group
Summary of facts from the study
1. Breezing users had:
i) Effectively lost more weight (89% vs 55% controls)
ii) Completed 70% more calorie intake inputs to Calorie Counter App
iii) More comprehensive use of calorie counter app via entry volumes of diet, activity, weight, and comments.
iv) Better HDL cholesterol and Diastolic Blood Pressure parameter outcomes
2. How does knowing Correct Calories Burned relate to Weight Loss?
89% efficiency of weight loss (IG) vs. 55% efficiency of weight loss (CG)
5% of weight gain (IG) vs. 40% of weight gain (CG) 23 www.breezing.co
HbA1c reduction
24
-3.5 -3 -2.5 -2 -1.5 -1 -0.5 0 0.5 1
1
3
5
7
9
11
13
15
17
19Series2
Series1
Controls Intervention
Controls Intervention
General weight loss effect in T2 diabetes
The weight reduction resulted in a reduction of glycated hemoglobin in both groups (p < 0.1) Since both groups had a relatively high rate of weight loss (89%-IG and 55%-CG), there was not significant difference between groups in regard to improvements of glycated hemoglobin (both groups did improved the T2 diabetes parameter) CONCLUSION: weight loss is a great intervention for decreasing T2 diabetes and risk of Diabetes
Between groups: no difference
Data Analysis
VOCs
Medical and tracking devices
Type 2 Diabetes Weight
Loss = - [ + ]
Demo of Metabolism Tracking
26
• Miscellaneous slides
27
28
Six-month study design
•The participants from the control group had an iPad with My Fitness Pal App to track calorie intake, an activity tracker to track steps and floors, and a weight scale.
• Each participant in the control group was recommended a 500-calorie deficit intake based on the Harris Benedict Equation
• The intervention group had the same gadgets as the control group, as well as a Breezing Tracker. • Both groups were followed up with a Standard-of-Care procedure for 6 months, and were reached by e-mail every 2-3 weeks with general health information.
Control Group (CG)
Intervention Group (IG)
* Most of participants had T2 Diabetes, or were at risk of Diabetes
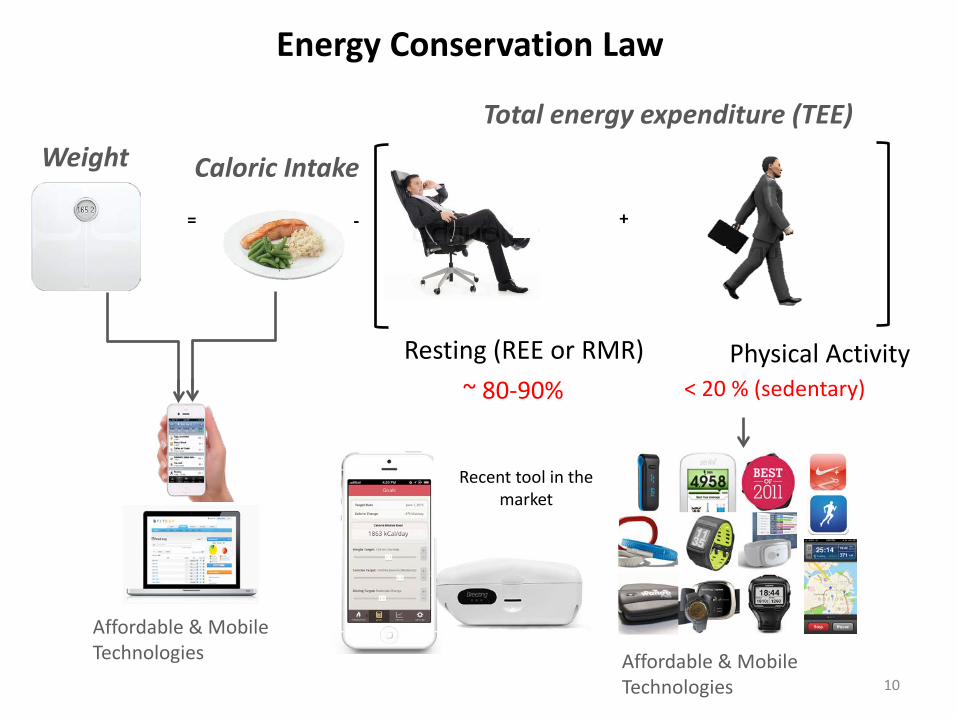
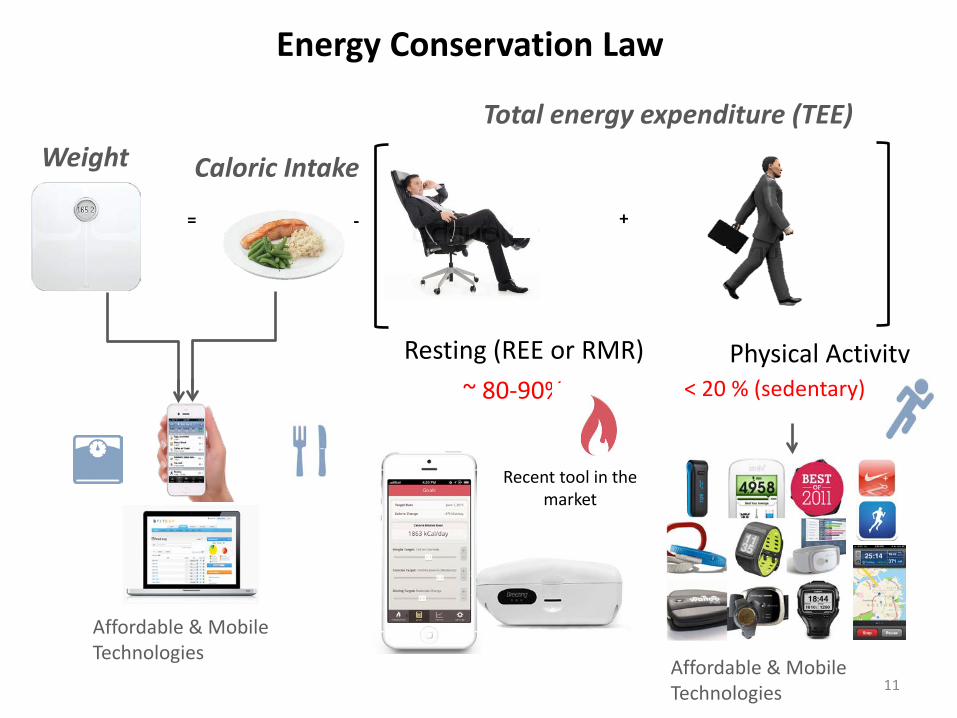
80-90 % < 20 % (sedentary)
Total energy expenditure (TEE)
= -
Weight Caloric Intake
+
Physical Activity
Affordable & Mobile Technologies
Affordable & Mobile Technologies
29
First Law of Thermodynamics: Energy Conservation Law
Metabolic Rate Tracker
Resting Metabolic Rate (RMR)
(sedentary)
A
What about the variability of REE?
= - [ + ] Resting Activity
30
Food
Total Energy Expenditure (TEE) = Calories burned
Calorie Intake
PA
REE
Physical Activity
REE pr Metabolism (80-90 % in sedentary persons)
Energy Balance – How we can modify it?
31
Total Energy Expenditure (TEE)
PA
REE
Physical Activity
Metabolism
32
Metabolism (RMR) and Physical Activity*
PA
REE
Exercise PA
REE
*Speakman et.al., Proceeding of the nutrition society, 2003, 62, 621-634 (Fig.2 reproduction)
Total Effect of Sustained Exercise
Resting Energy Expenditure (REE) Resting Metabolic Rate (RMR)
Food + Oxygen
Carbon Dioxide + ATP (heat), storage
O2 CO2
Resting Metabolism: ✓ Sustains life ✓ Majority of our daily total energy expenditure
• VO2 consumed oxygen rate
• VCO2 produced carbon dioxide rate
33
How does it work?
• Indirect calorimetry (Breezing measures consumed oxygen rate and produced carbon dioxide rate)
• Recommended by AND, WHO, ACSM, ADA
Indirect Calorimetry Principle
Weir, J. B. D. (1949). "New Methods For Calculating Metabolic Rate With Special Reference To Protein Metabolism." Journal Of Physiology-London 109(1-2): 1-9. Weir, J. B. D. (1990). "Nutrition Metabolism Classic - New Methods For Calculating Metabolic-Rate With Special Reference To Protein-Metabolism." Nutrition 6(3): 213-221.
Resting Metabolic rate or Resting Energy Expenditure
Physical Activity
70-90 %
<30 %
*McArdle, Katch & Katch, Ex. Physiology, 2009
1 2 3 4 5 60
20
40
60
80
100Mean: 85.1%Standard Deviation: 2.9%
REE
/ TEE
(%)
Subject (#)
1 2 3 4 5 6 70
4
8
12
16
20
24Driving
Bench Work
Watching TV
Walking
Office WorkSleepingDa
ily A
ctivi
ty (h
s)
Subject (#)
Leisure
Most of daily total energy expenditure (TEE) is spent to maintain basic body functions (energy expenditure at resting state, REE)
How Sedentary Are We? Total Energy Expenditure*
Physical Activity < 5 % 15% 5%
Work from Arizona State University, 2013
REE (>80%)
Basal Metabolic rate
Thermogenesis
41 www.breezing.co
The risk of using calorie intake recommendations from an equation-based REE value
42 www.breezing.co
Tracking Metabolism for Better Health Diet Changes in diet can significantly change metabolism. For example, a crash diet can cause drastic reduction in metabolic rate, leading to a “weight loss plateau”. See slides in next class.
Exercise Exercise can affect metabolism. For example, muscle-building increases metabolism and High Intensity Intermittent Training (HIIT) creates an “afterburn” effect. See slides in next class. Hormones/medication Hormonal changes and medications can change metabolism. Monitoring metabolism helps screen for potential hyper- or hypo-thyroidism. See slides in next class.
Pregnancy Metabolism changes significantly throughout pregnancy and after giving birth. Tracking metabolism helps the mother maintain and achieve the proper weight for the baby’s healthy growth. See slides in next class.
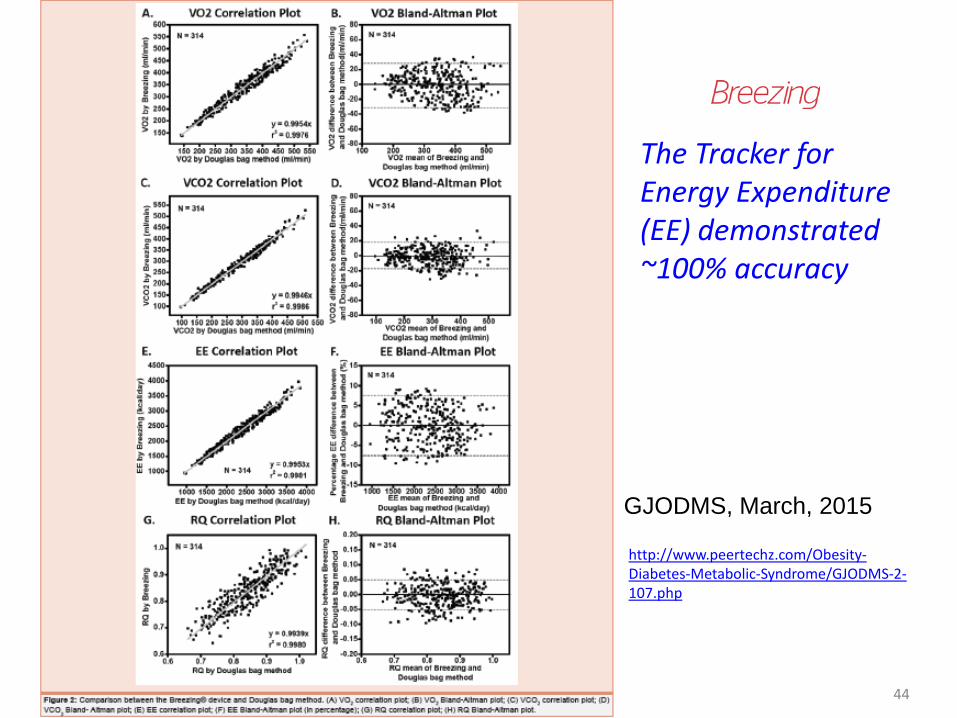
GJODMS, March, 2015
Tracker for Resting Energy Expenditure (REE) or Resting Metabolic Rate
43
GJODMS, March, 2015
The Tracker for Energy Expenditure (EE) demonstrated ~100% accuracy
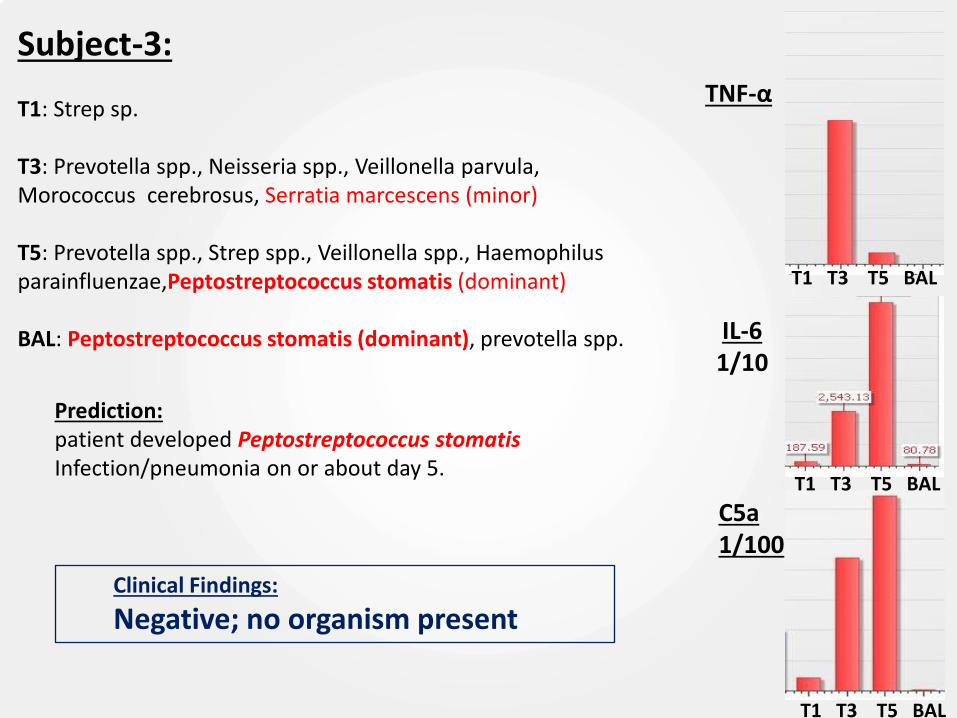
Longitudinal progression from innate immunity to activation of an adaptive immune response.
Inversed trends suggests shift in homeostatic balance, activation of humoral response, potentially triggered by Ureaplasma urealyticum (NGS).
Gradual increase in humoral response, plateau on day 5
Innate response increases up to day 3, decrease beyond might be related to antibiotic response.
Overlapping host responses to infection may be caused by multiple pathogens; Serratia marcescens at day 3, and Peptostreptococcus stomatis at day 5 (NGS).
Subject 3 Subject 2
Expression of complement proteins
0
100
200
300
400
500
600
700
C3 C4a C4b C5
Pro
tein
ab
un
dan
ce
(Sp
ect
ral C
ou
nt)
Complement Proteins
Day 1
Day 3
0
100
200
300
400
500
600
C3 C4a C4b C5
Pro
tein
ab
un
dan
ce
(Sp
ect
ral C
ou
nts
)
Complement Proteins
Day 1
Day 3
Day 5
Increase in expression of complement components C3, C4 and C5 in both subjects highlight complex relationship between innate and humoral immune response
The complement C4 gene generates to classes of polymorphic protein products (protein cleavage of C4 to C4A (~9kDa) and C4B (~190kDa): C4A high binding affinity to –NH2 groups (peptide antigens) and complement receptor CR1, long
half-life, role in immuno-clearance and possibly a link between innate and adaptive responses. C4B faster reaction rate toward carbohydrates and –OH, short half-life and propagates
complement activation pathways Absence of C4B during Day 1, but presence of the cleaved C4A may suggest binding to bacterial
carbohydrate groups
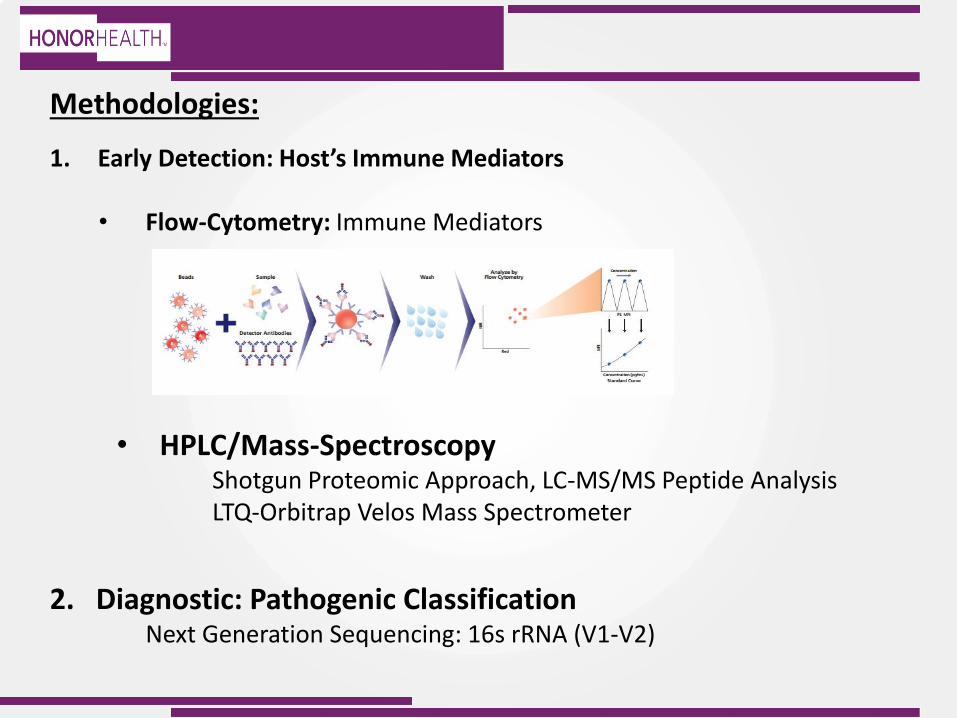
• 16s Ribosomal RNA: Next Generation Sequencing (NGS)