49
Measurement of W Boson Helicity in Top Quark Decay Amitabha Das University of Arizona DZERO Experiment at Fermilab

Measurement of W Boson Helicity
in Top Quark Decay
Amitabha Das
University of Arizona DZERO Experiment at Fermilab

OUTLINE
Introduction
Experimental apparatus
Analysis
Conclusion

INTRODUCTION

Particle Physics Study the fundamental particles and forces of nature
The Standard Model
Theoretical basis of
modern particle physics.
All the fundamental
particles proposed by the
SM, except the Higgs
boson, have been
observed experimentally.
However that is not the
end of the story !
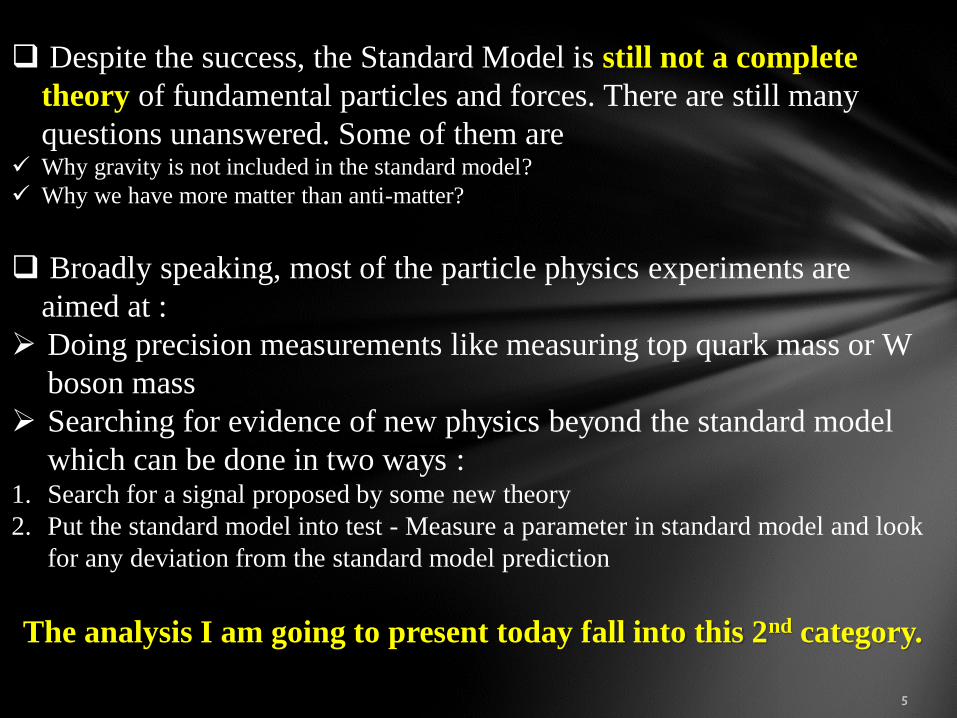
Despite the success, the Standard Model is still not a complete
theory of fundamental particles and forces. There are still many
questions unanswered. Some of them are Why gravity is not included in the standard model?
Why we have more matter than anti-matter?
Broadly speaking, most of the particle physics experiments are
aimed at :
Doing precision measurements like measuring top quark mass or W
boson mass
Searching for evidence of new physics beyond the standard model
which can be done in two ways : 1. Search for a signal proposed by some new theory
2. Put the standard model into test - Measure a parameter in standard model and look
for any deviation from the standard model prediction
The analysis I am going to present today fall into this 2nd category.

So let’s stop for a while and look at the title of this talk :
Measurement of - We know what that means!
W boson – know that too…
Helicity – What is that ? How do we measure that?
in Top Quark Decay – Why top quark?
What is so unique about top quark?
The top quark is the most recently discovered quark , discovered
at Fermilab in 1995
It is the most massive quark
The coupling of the top quark to Higgs ~ 1
It decays before hadronizing, transferring its properties to the decay
products, which we can observe and study experimentally.
After 15 years and almost 100 times more data now we have
thousands of top events and increasing….

Top quark pair production at Tevatron
Top quark decays ~100% to W and b quark
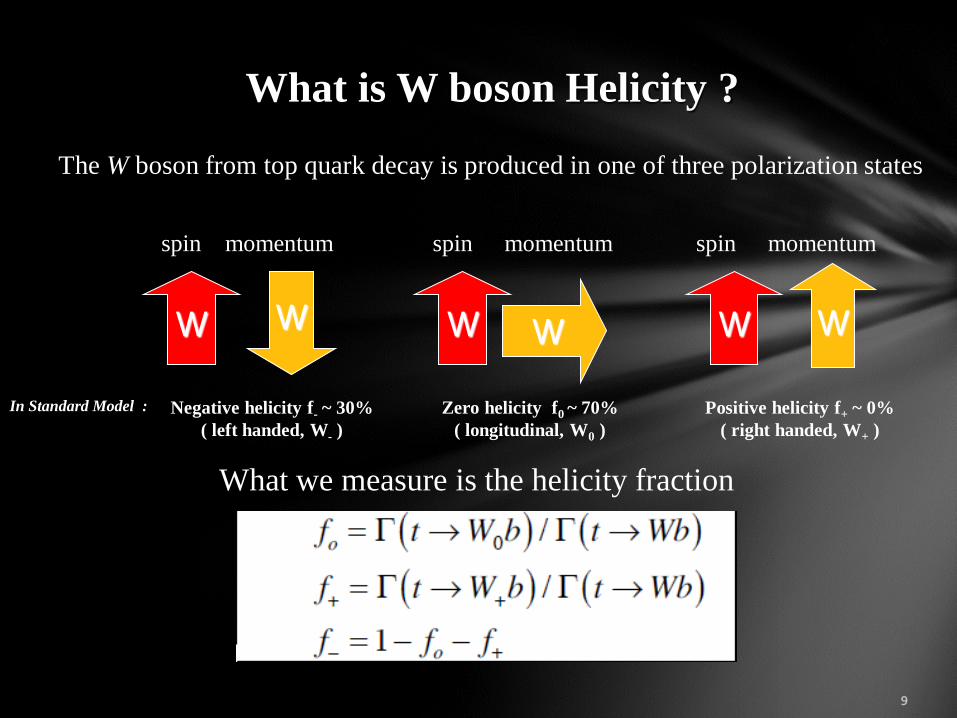
What is W boson Helicity ?
The W boson from top quark decay is produced in one of three polarization states
W W
spin momentum
W W
spin
W
momentum spin
W
momentum
Negative helicity f- ~ 30%
( left handed, W- )
Zero helicity f0 ~ 70%
( longitudinal, W0 )
Positive helicity f+ ~ 0%
( right handed, W+ )
In Standard Model :
What we measure is the helicity fraction

MOTIVATION
The uncertainties in the Standard Model prediction are far smaller than
the precision we can achieve experimentally.
Any significant deviation from the SM values
would be a clear signature of new physics.

How do we measure W Helicity
We can get W helicity fractions (f0 and f+ ) from the cos* distribution
||||
).(cos *
bl
blc
This is the basis of this measurement.

Experimental Apparatus

D0 detector at Fermilab

Calorimeters Tracker
Muon
System
Beamline
Shielding
Electronics
protons
20 m
Tracker Calorimeter
Anti-protons
D0 is a general purpose detector capable of variety of physics measurements.

Interaction Protons Anti
protons
Tracker : track reconstruction of charged particles
Calorimeter : measurement of particle energy and particle
identification.
Muon : Identify muons
Part
icle
movin
g
THE GOAL IDENTIFY THE PARTICLE
and
MEASURE THE ENERGY OR MOMENTUM OF THE PARTICLE

D0 Trigger System
Through a fast selection, only keep the events which have properties
matching the characteristics of physics events of interest.
100 Hz
100 Hz

D0 Trigger System
Through a fast selection, only keep the events which have properties
matching the characteristics of physics events of interest.
100 Hz
100 Hz

D0 Trigger System
Silicon Track Trigger (L2STT) : Fast selection of events with ‘b’ quarks
Level 1 Muon (L1MUO) : Fast selection of events with muons based on
inputs from all the muon sub-detectors and tracker.
Level 1 Cal Track (L1CTK) : Gives the D0 Level 1 trigger system additional
rejection power required to accommodate Tevatron’s high luminosity based on
inputs from calorimeter and tracker.
The hardware
I worked on

ANALYSIS

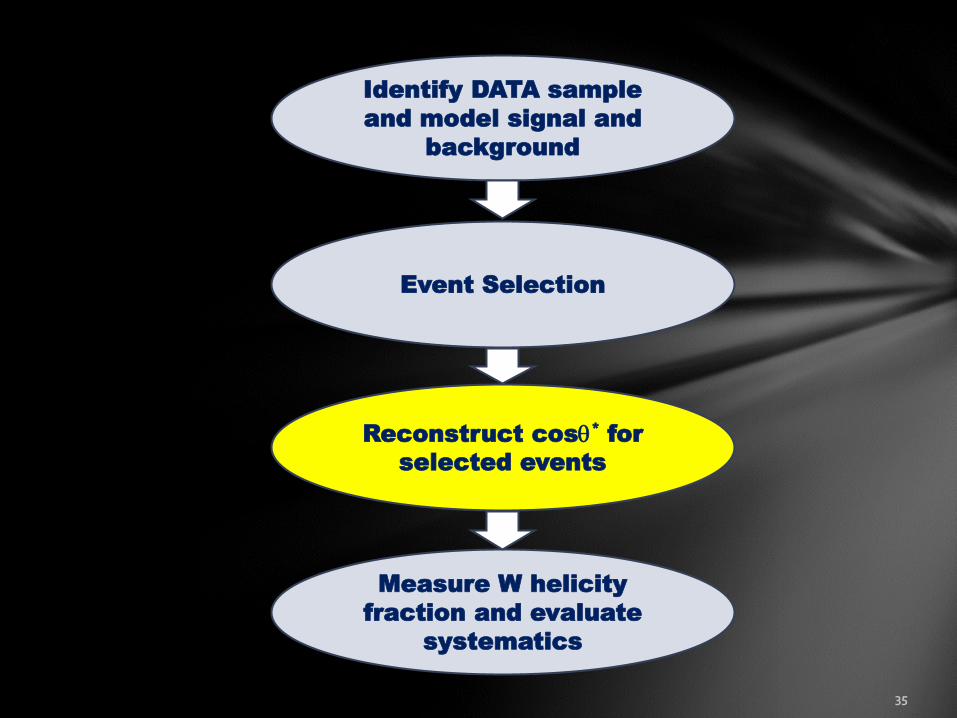
Identify DATA sample
and model signal and
background
Event Selection
Reconstruct cos* for
selected events
Measure W helicity
fraction and evaluate
systematics

Identify DATA sample
and model signal and
background
Event Selection
Reconstruct cos* for
selected events
Measure W helicity
fraction and evaluate
systematics

Data used for this analysis was collected between April 2002 and June
2009 which corresponds to a total integrated luminosity of 5.4 fb-1.
Simulated samples (Monte Carlo) were used to model the data.
Data Analyzed
Integrated Luminosity x Cross-section = Number of events

We are doing this measurement in top quark decay.
So what final state do we look at??
For this analysis, we
used events with the
following 5 final
states or channels:
1. Electron + Jet
2. Muon + Jet
3. Di-electron
4. Di-muon
5. Electron + Muon
The quarks and gluons produced in the final state develops into a shower of particles
(called hadronization). We call this shower, observed in the detector, a JET.
Large background

Signal Events for this analysis Final state Final state

Background events for this analysis
There are two categories of background
1. Physics background from standard model physics process having
similar final state as from top pair, e.g.
Simulated sample (MC) used to model the physics background
2. Instrumental background where a final state object is misidentified,
e.g. a hadronic jet misidentified as an electron.
Data control sample is used to model the instrumental background

Identify DATA sample
and model signal and
background
Event Selection
Reconstruct cos* for
selected events
Measure W helicity
fraction and evaluate
systematics

The event selection is done in two steps Remember : Our goal is to get a sample enriched with pure top pair events
Pre-selection Apply well understood selection criteria to identify each object
expected in the final state of an event with top pair.
Example : for lepton+jet final state, we select events with
At least 4 or more jets with a minimum energy
1 well identified lepton (electron or muon) depending
on the final state
Missing energy to account for the neutrino
Final selection Use a multivariate discriminant to separate background from signal
events and apply a cut to get a sample enriched with top quark.
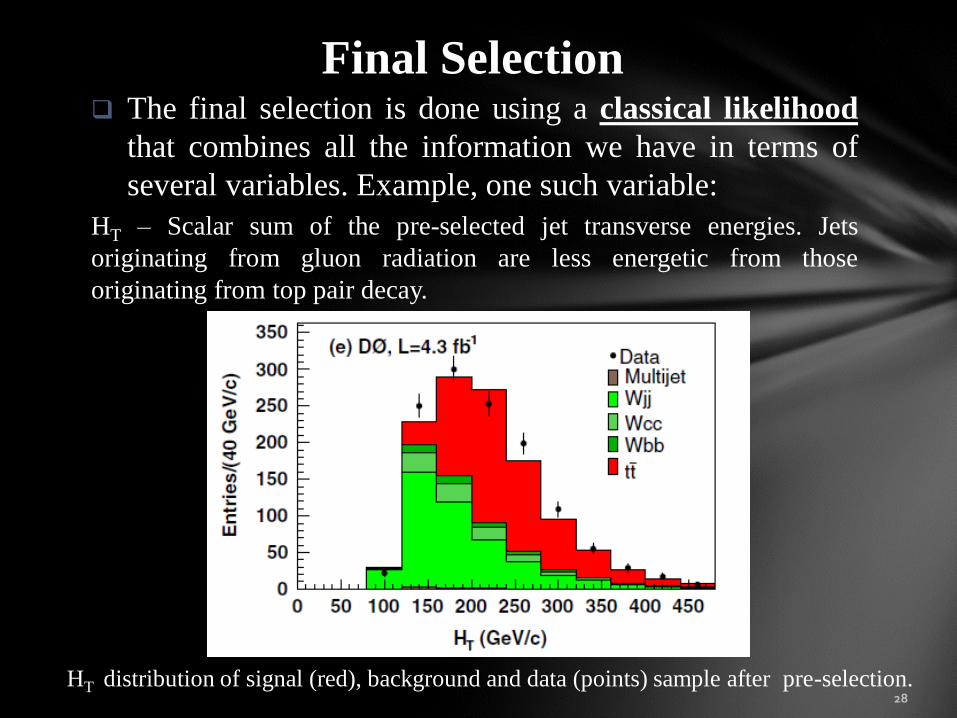
The final selection is done using a classical likelihood
that combines all the information we have in terms of
several variables. Example, one such variable:
HT – Scalar sum of the pre-selected jet transverse energies. Jets
originating from gluon radiation are less energetic from those
originating from top pair decay.
Final Selection
HT distribution of signal (red), background and data (points) sample after pre-selection.
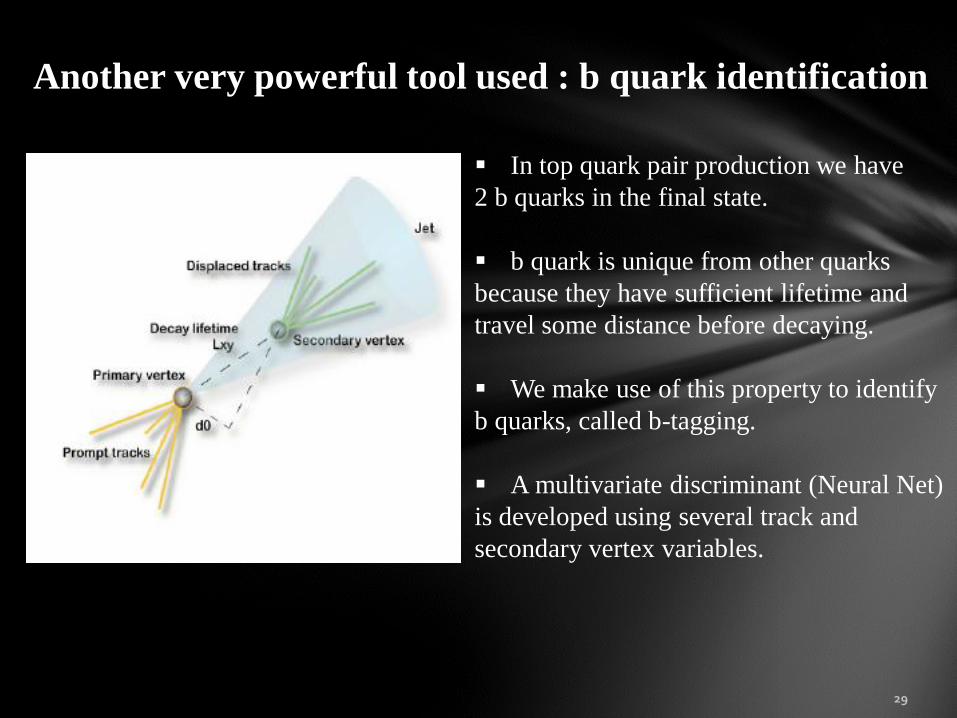
Another very powerful tool used : b quark identification
In top quark pair production we have
2 b quarks in the final state.
b quark is unique from other quarks
because they have sufficient lifetime and
travel some distance before decaying.
We make use of this property to identify
b quarks, called b-tagging.
A multivariate discriminant (Neural Net)
is developed using several track and
secondary vertex variables.

The output of this neural net is called NNb
Instead of applying a cut on NNb , we use this as an input variable to
our Likelihood used for final selection.

Optimization is done by trying all possible combinations of
variables, and all possible cut points on the likelihood, to
find the one that maximizes the following figure of merit:
B is a term that reflects the quality of data/MC agreement
in the variables used in the likelihood
Optimization of final selection
FOM S
S B B
2S = Signal
B = Background

One Example ……
Electron + Jet final state

One Example ……
Electron + Jet final state
Remove these events

For each of the 5 channels, we get one such optimized likelihood
distribution
We apply the optimized selection criteria
Now we have a highly pure top quark sample used for our measurement
Final State Electron
+
JETS
Muon
+
JETS
Electron
+
Electron
Muon
+
Muon
Electron
+
Muon
Signal purity
before Lt cut
(PRE-SELECTED
SAMPLE)
41% 49% 2% 2% 55%
Signal Purity
after Lt cut
(FINAL SAMPLE)
73% 71% 83% 65% 82%
Identify DATA sample
and model signal and
background
Event Selection
Reconstruct cos* for
selected events
Measure W helicity
fraction and evaluate
systematics
||||
).(cos *
bl
blc
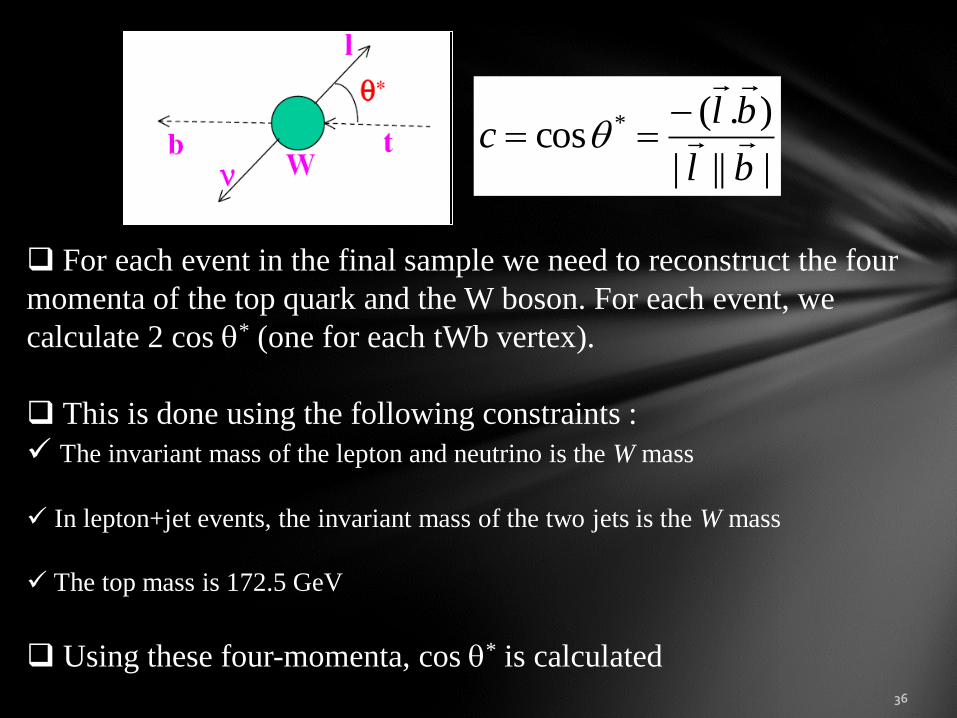
For each event in the final sample we need to reconstruct the four
momenta of the top quark and the W boson. For each event, we
calculate 2 cos * (one for each tWb vertex).
This is done using the following constraints :
The invariant mass of the lepton and neutrino is the W mass
In lepton+jet events, the invariant mass of the two jets is the W mass
The top mass is 172.5 GeV
Using these four-momenta, cos * is calculated

Further Challenges !! Lepton + jet final state
We have 4 jets but none are assigned to any initial parton. Total 12 possibilities
Choose the combination with highest combined probability of kinematic and NNb
probability.
Di-lepton final state
We have 2 leptons and 2 jets but there is an ambiguity of which lepton and jet
should we pair.
Take average over all solutions to get cos * for each tWb vertex.

Identify DATA sample
and model signal and
background
Event Selection
Reconstruct cos* for
selected events
Measure W helicity
fraction and evaluate
systematics
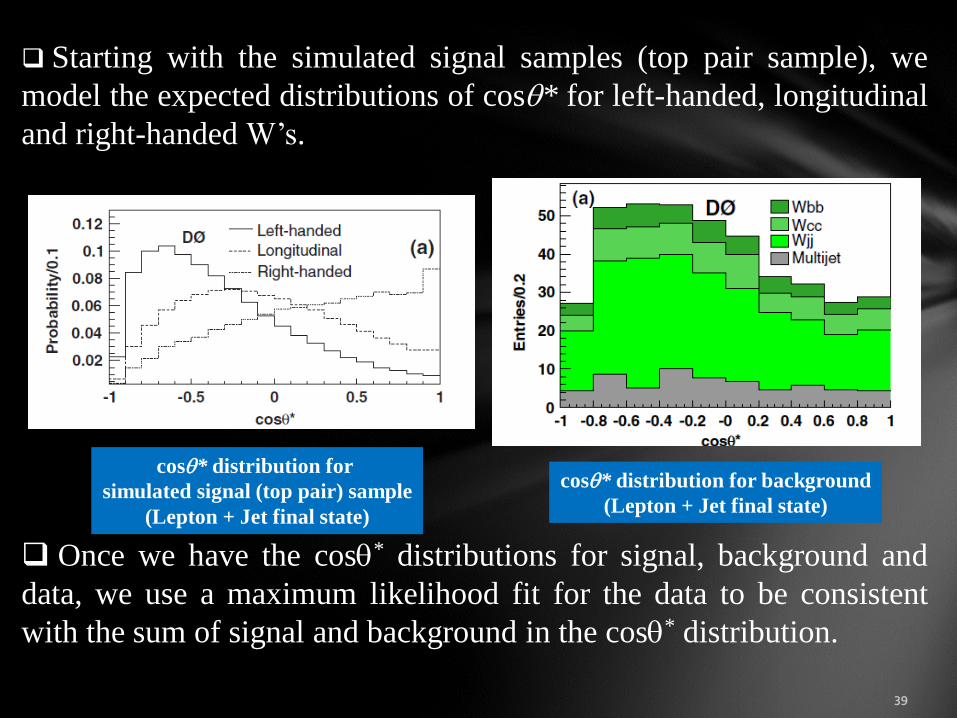
Starting with the simulated signal samples (top pair sample), we
model the expected distributions of cos* for left-handed, longitudinal
and right-handed W’s.
Once we have the cos* distributions for signal, background and
data, we use a maximum likelihood fit for the data to be consistent
with the sum of signal and background in the cos* distribution.
cos* distribution for background
(Lepton + Jet final state)
cos* distribution for
simulated signal (top pair) sample
(Lepton + Jet final state)

Maximum Likelihood Fit to extract f0 and f+
The fit parameters include the W helicity fractions f0 and f+
Example : lepton+jet final state
Comparison of the cos* distribution in data (points with error bars) and the global best-fit model (solid open
histograms) for lepton+jet events. The dashed open histograms show the SM expectation, and the shaded histograms
represent the background contribution.

Cross check – Ensemble tests! Make sure the maximum likelihood fit method actually works
We create several toy experiments where we make mock data
sample by using random events from the simulated samples.
Each toy experiment gives us a mock data cos* distribution and
we perform the maximum likelihood fit which returns a for f0 and f+
Known input values Avg fit output
fo
Avg fit output
f+
f0 = 0.7 & f+ = 0.3 0.708 0.002 0.304 0.001
f0 = 0.7 & f+ = 0.0 0.702 0.002 -0.004 0.001

SYSTEMATIC UNCERTAINTIES

Analyzing a data sample corresponding to 5.4 fb-1
of proton anti-proton collisions collected by the
D0 detector at Fermilab
RESULT
The consistency of this result with the standard model value is 98%
Compare to SM values : f0 = 0.698 & f+ = 3.6 10-4
.)](034.0.)(041.0[053.0023.0
.)](065.0.)(078.0[102.0669.00
syststatf
syststatf

The ellipses are the 68% and 95% C.L. contours, the triangle
borders the physically allowed region where f0 and f+ sum to one
or less, and the star denotes the SM values.

Future Prospects Tevatron :
There is no plan to update this measurement with full D0 dataset
There is a plan to do a combination of the D0 and CDF result which
is now underway
LHC :
The top pair production cross-section at LHC will be almost 100
times more compared to the Tevatron.
With full energy and high statistics of top sample with 10 fb-1 of
data, the uncertainty for these measurements is expected to go down
to ~ 1-2%.

CONCLUSION
After analyzing 5.4 fb-1 of data collected through the D0 detector,
we find the measured values of the W helicity fractions consistent
with the standard model value.
Hence we state that we found no evidence
of new physics at the tWb decay vertex.
This is the world's most precise measurement of W boson helicity
published in PRD [ Phys. Rev. D 83, 032009 (2011)]

THANK YOU

BACKUP

Classical Likelihood For each variable ‘i’ (e.g. HT), we compute the functional form for Sig/Bkg
Example…
The likelihood is
calculated using
the equation
Signal(RED)
Background (BLUE)


