The credit rating is not a recommendation to purchase, sell or hold a security, inasmuch as it does not comment on the securi ty‟s market price or its suitability for a particular investor, nor does it involve any audit by RAM Ratings. The credit rating also does not reflect the legality and enforceability of financial obligations, transfer and convertibility risks, repatriation risk, currency risk or any other risk apart from credit risk. May 2012 AMMB HOLDINGS BERHAD Proposed up to RM2 billion Medium-Term Notes Programme
Transcript
The credit rating is not a recommendation to purchase, sell or hold a security, inasmuch as it does not comment on the securi ty‟s market price or its suitability for a particular investor, nor does it involve any audit by RAM Ratings. The credit rating also does not reflect the legality and enforceability of financial obligations, transfer and convertibility risks, repatriation risk, currency risk or any other risk apart from credit risk.
May 2012
AMMB HOLDINGS BERHAD
Proposed up to RM2 billion Medium-Term Notes Programme
The credit rating is not a recommendation to purchase, sell or hold a security, inasmuch as it does not comment on the securi ty‟s market price or its suitability for a particular investor, nor does it involve any audit by RAM Ratings. The credit rating also does not reflect the legality and enforceability of financial obligations, transfer and convertibility risks, repatriation risk, currency risk or any other risk apart from credit risk.
CREDIT RATING RATIONALE
CORPORATE RATINGS
MAY 2012
AMMB HOLDINGS BERHAD
– Initial Rating
Summary
RAM Ratings has assigned respective long- and short-term corporate credit
ratings (“CCRs”) of A1 and P1 to AMMB Holdings Berhad (“AMMB” or “the
Company”). Concurrently, RAM Ratings has also assigned respective final long-
term ratings of A1 and A2 to the senior medium-term notes (“MTN”) and
subordinated MTN to be issued under the Company‟s Proposed up to RM2 billion
MTN Programme (“Proposed Issue”). All the long-term ratings have a stable
outlook. The 1-notch differential between the rating of the subordinated MTN and
the senior MTN reflects the former‟s subordination in terms of rights and priority
of payment over all the senior obligations of AMMB.
As a non-operating investment-holding company, AMMB‟s earnings are highly
dependent on dividend income from its subsidiaries to service its financial
obligations. In this regard, AMMB‟s key banking subsidiaries, i.e. AmBank (M)
Berhad (“AmBank”), AmIslamic Bank Berhad (“AmIslamic”) and AmInvestment
Bank Berhad (“AmInvestment”) (all rated AA3/Stable/P1 by RAM Ratings)1, are
regulated financial institutions. AMMB‟s ratings are anchored by the credit
strength of its key banking subsidiaries, apart from its own company-level credit
metrics. The 1-notch differential between AMMB‟s long-term CCR and the ratings
of its key subsidiaries reflects the Company‟s structural subordination given that
it has lower priority as a shareholder compared to the direct creditors of its key
subsidiaries; it also incorporates AMMB‟s sound stand-alone credit fundamentals
and comfortable financial leverage ratios.
Moving forward, AMMB and its subsidiaries (collectively, “the AMMB Group” or
“the Group”) is envisaged to continue receiving firm operational support from its
largest substantial shareholder, Australia and New Zealand Banking Group
Limited (“ANZ”), which owns a 23.8%-stake. Notably, ANZ has been actively
participating in the strategic direction and operations of the Group through its
representation in the latter‟s key management line-up and board.
1 RAM Ratings reaffirmed the AA3/Stable/P1 financial institution ratings of AmBank, AmIslamic and
AmInvestment in December 2011.
Analysts: Kwan Ji-Ling (603) 7628 1115 [email protected] Chan Yin Huei (603) 7628 1180 [email protected] Principal Activity: AMMB Holdings Berhad is an investment-holding company Instruments: Proposed Senior Medium-Term Notes (“MTN”) and/or Subordinated MTN under the Proposed up to RM2 billion MTN Programme Ratings: Corporate Credit Ratings: A1/P1 [Assigned] Senior MTN: A1 [Assigned] Subordinated MTN: A2 [Assigned] Rating Outlook: Stable Coupon Rate: To be determined prior to each MTN issuance Tenure: Up to 30 years for each MTN issuance Lead Arranger: AmInvestment Bank Berhad Trustee: Pacific Trustees Berhad
AMMB Holdings Berhad 2
Company Background
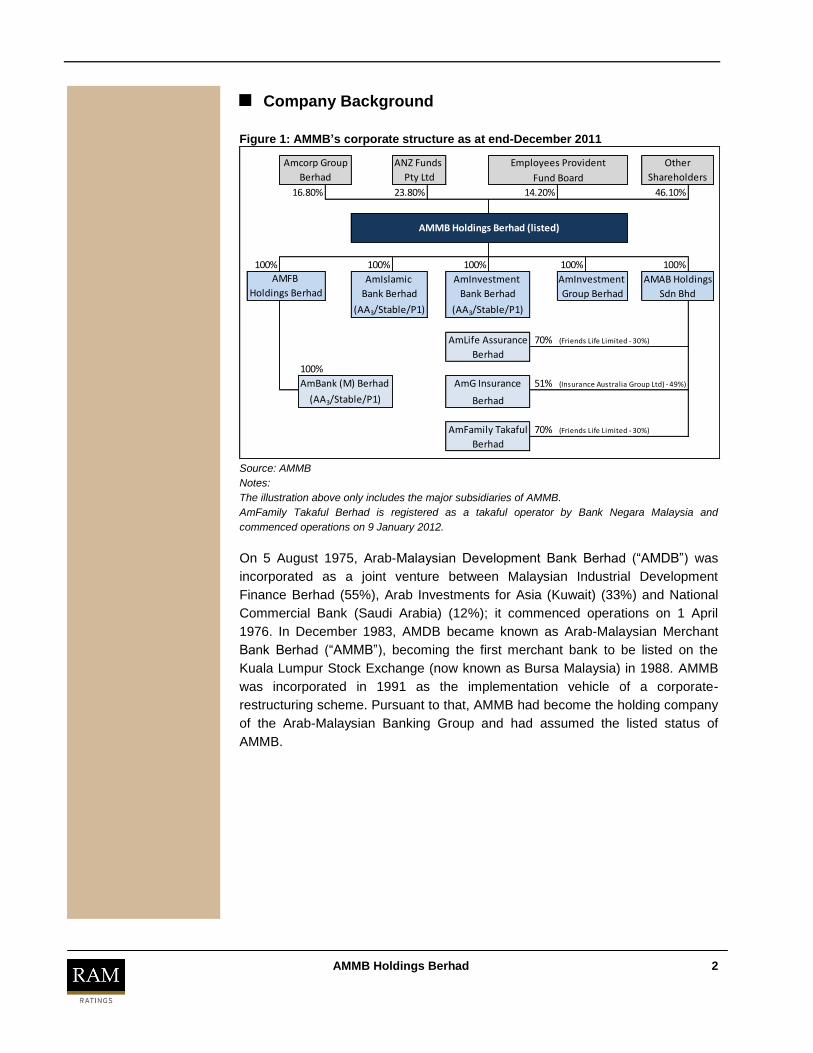
Figure 1: AMMB’s corporate structure as at end-December 2011
23.80% 46.10%
100% 100% 100% 100% 100%
70% (Friends Life Limited - 30%)
100%
AmBank (M) Berhad 51% (Insurance Australia Group Ltd) - 49%)
70% (Friends Life Limited - 30%)
Other
Shareholders
Bank Berhad
AmInvestment
Group Berhad
Berhad
16.80%
AMMB Holdings Berhad (listed)
ANZ Funds
Pty Ltd
Berhad
Bank Berhad
AMFB AMAB Holdings
Sdn Bhd
AmLife Assurance
AmIslamic
(AA3/Stable/P1) (AA3/Stable/P1)
AmInvestment
(AA3/Stable/P1) Berhad
AmG Insurance
AmFamily Takaful
Berhad
Employees Provident
Fund Board
14.20%
Holdings Berhad
Amcorp Group
Source: AMMB
Notes:
The illustration above only includes the major subsidiaries of AMMB.
AmFamily Takaful Berhad is registered as a takaful operator by Bank Negara Malaysia and
commenced operations on 9 January 2012.
On 5 August 1975, Arab-Malaysian Development Bank Berhad (“AMDB”) was
incorporated as a joint venture between Malaysian Industrial Development
Finance Berhad (55%), Arab Investments for Asia (Kuwait) (33%) and National
Commercial Bank (Saudi Arabia) (12%); it commenced operations on 1 April
1976. In December 1983, AMDB became known as Arab-Malaysian Merchant
Bank Berhad (“AMMB”), becoming the first merchant bank to be listed on the
Kuala Lumpur Stock Exchange (now known as Bursa Malaysia) in 1988. AMMB
was incorporated in 1991 as the implementation vehicle of a corporate-
restructuring scheme. Pursuant to that, AMMB had become the holding company
of the Arab-Malaysian Banking Group and had assumed the listed status of
AMMB.
AMMB Holdings Berhad 3
As at end-December 2011, ANZ, via its wholly owned subsidiary – ANZ Funds
Pty Ltd - remained the largest shareholder of the AMMB Group with a 23.8%-
stake; its other major shareholders comprised Amcorp Group Berhad (16.8%)2
and the Employees Provident Fund Board (14.2%). ANZ came in as a strategic
partner and major investor of the AMMB Group in May 2007, and entered into a
technical services agreement with AmBank in November 2008. The partnership
has led to ANZ‟s active support during the AMMB Group‟s business
transformation, with the provision of technical expertise through the appointment
of ANZ representatives as key senior management personnel and board
members to facilitate the Group‟s long-term growth.
Following the completion of a reorganisation exercise on 28 February 2011,
AmIslamic is now directly held by AMMB, instead of being wholly owned by
AmBank. The corporate reorganisation represents part of AMMB‟s capital-
management strategy - aimed to improve AmBank‟s capitalisation and to prepare
for stricter capital requirements under the impending Basel III framework.
AMMB is principally a non-operating investment-holding company, the principal
assets of which comprise investments in banks and non-bank subsidiaries
engaged in a wide range of conventional and Islamic financial services such as
retail and business banking, corporate and institutional banking, investment
banking including funds management and stockbroking, general and life
insurance, as well as takaful. Within AMMB, key banking activities have been
streamlined into 4 principal business groups under its universal-banking platform:
the Banking Group, the Capital-Markets Group, the Asset-Management Group
and the Insurance Group. As at end-December 2011, AMMB ranked sixth out of
the total of 8 domestic banking groups, based on its asset base of RM107.2
billion.
Objectives of the Proposed Issue
The proceeds from the Proposed Issue have been earmarked for AMMB‟s capital
expenditure, investments, working capital, payment of fees and expenses in
relation to the debt facility, and the general funding requirements of AMMB
and/or its subsidiaries.
2 Indirect interest held by YBhg Tan Sri Azman Hashim.
AMMB – investment-holding
company
ANZ – strategic
shareholder
AMMB Holdings Berhad 4
Business Strategies
Following its strategic partnership with ANZ in mid-2007, the AMMB Group has
embarked on various improvement initiatives by leveraging on the former‟s
international best practices and capabilities. Continuous efforts in tightening
underwriting standards and risk-management capabilities have translated into a
significant improvement in AmBank‟s asset quality. Notably, ANZ has been
actively participating in the Group‟s strategic direction and operations, with
representation in AMMB‟s key management line-up and board of directors.
AMMB‟s Medium Term Aspirations is to become Malaysia's preferred banking
group with international connectivity while expanding its cross-border operations
– by leveraging on ANZ‟s growing regional footprint.
As part of the Group‟s loan portfolio rebalancing and diversification strategy
initiated since 2008, the Group‟s lending focus has shifted to the business and
corporate segments, which are viewed to yield better risk-adjusted returns and
greater cross-selling opportunities. Over the past 2 years, these segments have
been the key growth drivers for both AmBank and AmIslamic. This has
augmented the Group‟s loan exposure to non-individuals, from 40% as at end-
March 2010 to 46% as at end-December 2011, while its share of floating-rate
loans has risen from 44% to 55%. Corporate loans will be targeted at project
financing with government support, government-linked companies, and multi-
national corporations.
In line with the Group‟s focus on risk-adjusted returns, AmBank and AmIslamic
have maintained their less aggressive strategy in pursuing automobile financing
amid the stiff price competition. This, coupled with their efforts to diversify into
other segments for a more balanced portfolio, had resulted in a noticeable
decline in AmBank‟s and AmIslamic‟s combined proportion of automobile
financing to around 32% as at end-December 2011 (end-March 2010: 36%).
Similarly, competition among banks in the residential mortgage market has been
rife, with aggressive pricing still seen in the market. Against this backdrop, the
management expects retail lending growth to remain modest in FYE 31 March
2012 (“FY Mar 2012”).
Moving ahead, the management will continue emphasising deposit growth to
improve AmBank‟s funding profile. This has been reinforced with key
performance indicators being put in place to promote deposit growth across all
business units, supported by the adoption of a fund-transfer-pricing mechanism.
Other initiatives include launching new deposit products, increasing the utilisation
of cash-management facilities and trade services, and cross-selling to the
Group's customers.
ANZ – formidable strategic partner with international connectivity
Focus on risk-adjusted returns instead of purely market-share
expansion
Ongoing emphasis on deposit growth
Continue rebalancing loan
portfolio
AMMB Holdings Berhad 5
The Group‟s priorities in FY Mar 2012 include expanding its non-interest income.
In this regard, the Group intends to derive at least one-third of its gross income
from non-interest income sources (FY Mar 2011: 28%) over the medium term by
seeking to capture opportunities in areas such as transaction banking, which
focuses on cash management and international trade, as well as wealth
management and bancassurance. In collaboration with ANZ, AMMB will continue
to expand its product offerings and distribution platform for its foreign exchange
(“forex”) and derivatives businesses, to better cater to the needs of its small- and
medium-sized enterprise (“SME”) and corporate clients. Forex and derivatives
businesses generated close to 3% of the Group‟s gross income in FY Mar 2011,
and are expected to further diversify its earnings base in future.
Loans to deposits ratio (%) 88.73 92.37 93.45 97.39
Overall RWCAR (%) 14.62 14.91 14.09 14.55
Source: AmBank
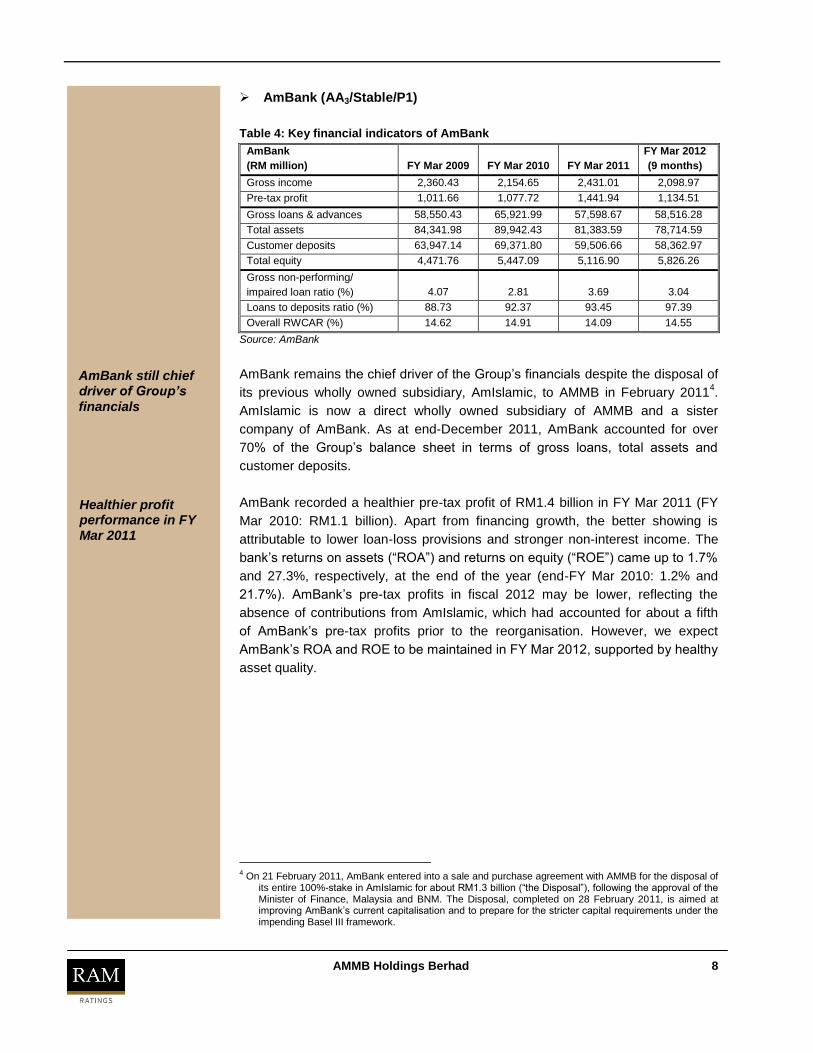
AmBank remains the chief driver of the Group‟s financials despite the disposal of
its previous wholly owned subsidiary, AmIslamic, to AMMB in February 20114.
AmIslamic is now a direct wholly owned subsidiary of AMMB and a sister
company of AmBank. As at end-December 2011, AmBank accounted for over
70% of the Group‟s balance sheet in terms of gross loans, total assets and
customer deposits.
AmBank recorded a healthier pre-tax profit of RM1.4 billion in FY Mar 2011 (FY
Mar 2010: RM1.1 billion). Apart from financing growth, the better showing is
attributable to lower loan-loss provisions and stronger non-interest income. The
bank‟s returns on assets (“ROA”) and returns on equity (“ROE”) came up to 1.7%
and 27.3%, respectively, at the end of the year (end-FY Mar 2010: 1.2% and
21.7%). AmBank‟s pre-tax profits in fiscal 2012 may be lower, reflecting the
absence of contributions from AmIslamic, which had accounted for about a fifth
of AmBank‟s pre-tax profits prior to the reorganisation. However, we expect
AmBank‟s ROA and ROE to be maintained in FY Mar 2012, supported by healthy
asset quality.
4 On 21 February 2011, AmBank entered into a sale and purchase agreement with AMMB for the disposal of
its entire 100%-stake in AmIslamic for about RM1.3 billion (“the Disposal”), following the approval of the Minister of Finance, Malaysia and BNM. The Disposal, completed on 28 February 2011, is aimed at improving AmBank‟s current capitalisation and to prepare for the stricter capital requirements under the impending Basel III framework.
AmBank still chief driver of Group’s
financials
Healthier profit performance in FY Mar 2011
AMMB Holdings Berhad 9
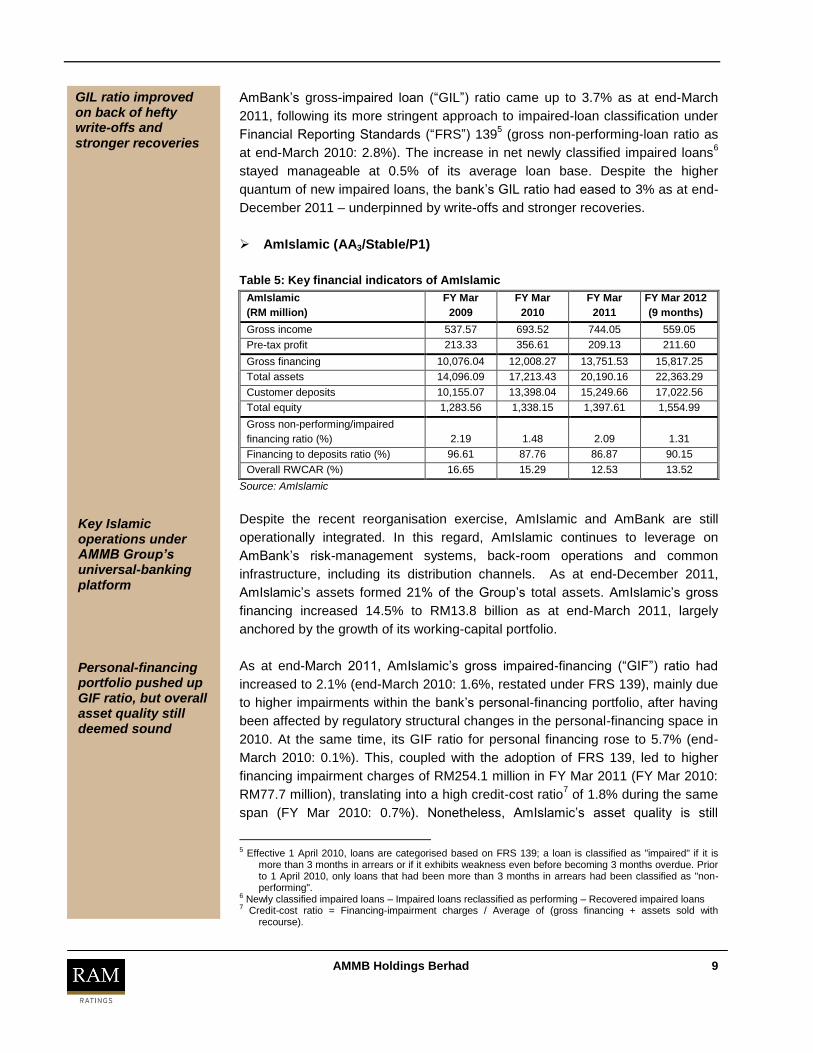
AmBank‟s gross-impaired loan (“GIL”) ratio came up to 3.7% as at end-March
2011, following its more stringent approach to impaired-loan classification under
Financial Reporting Standards (“FRS”) 1395 (gross non-performing-loan ratio as
at end-March 2010: 2.8%). The increase in net newly classified impaired loans6
stayed manageable at 0.5% of its average loan base. Despite the higher
quantum of new impaired loans, the bank‟s GIL ratio had eased to 3% as at end-
December 2011 – underpinned by write-offs and stronger recoveries.
Financing to deposits ratio (%) 96.61 87.76 86.87 90.15
Overall RWCAR (%) 16.65 15.29 12.53 13.52
Source: AmIslamic
Despite the recent reorganisation exercise, AmIslamic and AmBank are still
operationally integrated. In this regard, AmIslamic continues to leverage on
AmBank‟s risk-management systems, back-room operations and common
infrastructure, including its distribution channels. As at end-December 2011,
AmIslamic‟s assets formed 21% of the Group‟s total assets. AmIslamic‟s gross
financing increased 14.5% to RM13.8 billion as at end-March 2011, largely
anchored by the growth of its working-capital portfolio.
As at end-March 2011, AmIslamic‟s gross impaired-financing (“GIF”) ratio had
increased to 2.1% (end-March 2010: 1.6%, restated under FRS 139), mainly due
to higher impairments within the bank‟s personal-financing portfolio, after having
been affected by regulatory structural changes in the personal-financing space in
2010. At the same time, its GIF ratio for personal financing rose to 5.7% (end-
March 2010: 0.1%). This, coupled with the adoption of FRS 139, led to higher
financing impairment charges of RM254.1 million in FY Mar 2011 (FY Mar 2010:
RM77.7 million), translating into a high credit-cost ratio7 of 1.8% during the same
span (FY Mar 2010: 0.7%). Nonetheless, AmIslamic‟s asset quality is still
5 Effective 1 April 2010, loans are categorised based on FRS 139; a loan is classified as "impaired" if it is
more than 3 months in arrears or if it exhibits weakness even before becoming 3 months overdue. Prior to 1 April 2010, only loans that had been more than 3 months in arrears had been classified as "non-performing".
6 Newly classified impaired loans – Impaired loans reclassified as performing – Recovered impaired loans 7 Credit-cost ratio = Financing-impairment charges / Average of (gross financing + assets sold with
recourse).
Key Islamic operations under AMMB Group’s universal-banking platform
Personal-financing portfolio pushed up GIF ratio, but overall asset quality still deemed sound
GIL ratio improved on back of hefty write-offs and stronger recoveries
AMMB Holdings Berhad 10
deemed sound despite the setback in its personal-financing portfolio. The bank‟s
GIF coverage stood at a strong 209.1% as at end-December 2011 (end-March
2010: 137.0%). Following higher write-offs in the first nine months of FY Mar
2012 (“9M FY Mar 2012”), the bank‟s GIF ratio had declined to 1.3% as at end-
December 2011 while its credit-cost ratio had eased to 1% (annualised).
AmIslamic‟s profit performance in FY Mar 2011 had been affected by higher
financing impairment charges. The bank‟s pre-tax profit fell to RM209.1 million
last year, dragging its ROA down to 1.1% (FY Mar 2010: 2.3%). We expect its
profit performance to pick up in fiscal 2012, on the back of reduced financing-
impairment charges. The bank recorded a pre-tax profit of RM211.6 million in 9M
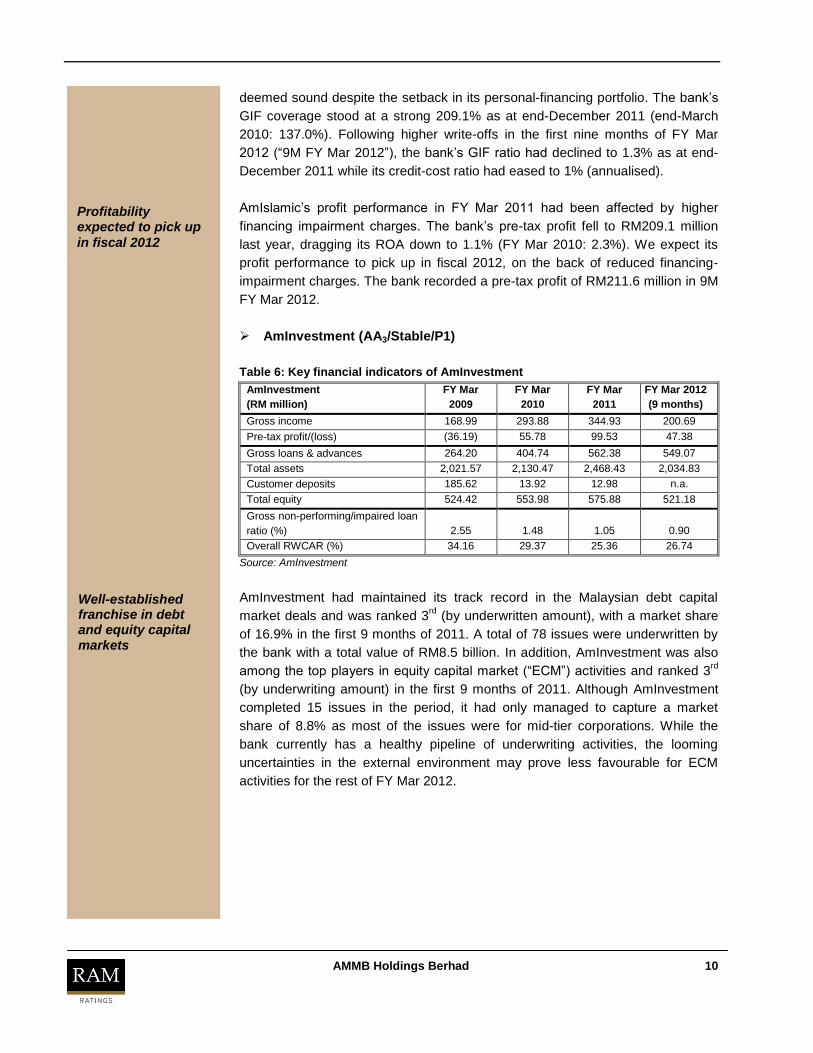
AmInvestment had maintained its track record in the Malaysian debt capital
market deals and was ranked 3rd
(by underwritten amount), with a market share
of 16.9% in the first 9 months of 2011. A total of 78 issues were underwritten by
the bank with a total value of RM8.5 billion. In addition, AmInvestment was also
among the top players in equity capital market (“ECM”) activities and ranked 3rd
(by underwriting amount) in the first 9 months of 2011. Although AmInvestment
completed 15 issues in the period, it had only managed to capture a market
share of 8.8% as most of the issues were for mid-tier corporations. While the
bank currently has a healthy pipeline of underwriting activities, the looming
uncertainties in the external environment may prove less favourable for ECM
activities for the rest of FY Mar 2012.
Profitability expected to pick up
in fiscal 2012
Well-established franchise in debt and equity capital markets
AMMB Holdings Berhad 11
AmInvestment‟s pre-tax profits almost doubled to RM99.5 million in FY Mar 2011
(FY Mar 2010: RM55.8 million), largely driven by contributions from its equity
derivatives businesses of around RM28 million. Equity derivatives income was
previously booked entirely under AmBank; this income is now shared based on a
50:50 arrangement8 between AmBank and AmInvestment. The better showing
was also attributable to higher corporate advisory fees as well as gains from the
disposal of available-for-sale investments. As a result, AmInvestment‟s ROA and
ROE both rose to 4.3% and 17.6%, respectively, in FY Mar 2011 (FY Mar 2010:
2.7% and 10.4%). Nevertheless, in 9M FY Mar 2012, AmInvestment reported a
30% year-on-year (“y-o-y”) decline in pre-tax profit to RM47.4 million (9M FY Mar
2011: RM67.3 million) due to a drop in fee income from corporate advisory and
loans.
For more details on AmBank, AmIslamic and AmInvestment, please refer to their
respective rating rationales published in February 2012.
AmG
AmG is one of the larger general insurers in Malaysia and ranked 8th based on
gross premium as at end-June 2011 (5th by net premium). Motor policies account
for 79% of AmG‟s portfolio and there is a clear strategy to diversify its business
by expanding its non-motor to 30% by 2015, driven by strong growth in its
commercial business lines.
AmG recorded a 20% y-o-y increase in its pre-tax profit to RM48.9 million in 1H
FY Mar 2012 (1H FY Mar 2011: RM40.6 million). Meanwhile, its claims ratio9 and
combined ratio10
stood at a respective 67% and 92% in 1H FY Mar 2012 (FY Mar
2011: 68% and 94%). Its CAR is above the regulatory minimum of 130% under
BNM‟s risk-based capital (“RBC”) framework.
AmG is a joint partnership between AMMB (51%)11
and Insurance Australia
Group Ltd (“IAG”) (49%). The strong strategic partnership allows AmG to
leverage on IAG‟s technical expertise, strategic planning, as well as sales and
business development capabilities. Its board of directors, senior management
(including its chief executive officer (“CEO”), Duncan Brain) and consultants also
consist of personnel from IAG.
8 On all realised and unrealised gains and losses arising from the trading and investment of equity
derivatives. 9 (Claims paid + changes in provision for outstanding claims) / Earned premiums
10 (Claims + Expenses) / Earned premiums 11
Via its wholly-owned subsidiary, AMAB Holdings Berhad.
Among top 5 players in motor
insurance
Leveraging on strategic partnership with
IAG
Pre-tax profit almost doubled in FY Mar 2011
AMMB Holdings Berhad 12
On 12 April 2012, AmG entered into a conditional sale and purchase agreement
with Kurnia Asia Berhad for the proposed acquisition of a 100% equity interest in
Kurnia Insurans (Malaysia) Berhad (“Kurnia Insurans”). The cash purchase price
of RM1.55 billion will be funded by AmG with capital injections from its
shareholders based on their respective shareholdings. The combined business of
AmG and Kurnia Insurans will emerge as the largest domestic general insurer
and market leader in motor insurance. RAM Ratings will continue monitoring the
progress of the proposed acquisition.
Kurnia Insurans, a wholly-owned subsidiary of Kurnia Asia Berhad, is among the
top 5 general insurers in Malaysia with a strong footing in motor insurance. In 1H
FY Dec 2011, it recorded a pre-tax profit of RM57 million (-1% y-o-y) with gross
earned premiums of RM518 million. It recorded a claims ratio of 69% in 1H FY
Dec 2011 (FY Dec 2010: 76%) while its combined ratio stood at 99% (end-FY
Dec 2010: 105%).
AmLife
AmLife, which is ranked eleventh in the market by total new business premiums,
is currently undergoing an internal review of its business operating model. A new
CEO is expected to be appointed before the end of FY Mar 2012. Meanwhile,
AmLife‟s current Deputy CEO, Adrian John Nurse, is the Acting CEO.
Besides filling the gap at top management level, the internal review and
restructuring also involve a turnaround plan for the company‟s agency force,
which has contracted to about 2,000 agents from around 4,000 in 2010. The
contraction resulted from the company‟s efforts to retain quality agents who are
productive and provide exemplary service to policyholders. The turnaround plan,
which is expected to be completed by June 2012, aims to build a stronger pool of
agents by ensuring that training programmes are up to par and agents act in full
compliance in their course of duties.
Apart from AmBank, AmLife entered into a new bank distribution agreement with
Alliance Bank Berhad in January 2012. Other key partners besides AmBank are
Standard Chartered Bank Malaysia Berhad, Bank Simpanan Nasional and
Malaysia Building Society Berhad.
In 1H FY Mar 2012, AmLife‟s gross premiums declined 39% y-o-y to RM194.9
million (1H FY Mar 2011: RM318.8 million), following the cessation of the sale of
its structured-notes products, a slowdown in the growth of AmBank‟s mortgage
and automobile loans, and the contraction of its agency force.
The drop in gross premiums had led to a net underwriting loss of RM25.8 million
in 1H FY Mar 2012, despite lower claims incurred. The lower gross premiums
had also translated into a weaker pre-tax profit in 1H FY Mar 2012, which slid
Among smaller players in life insurance
Weaker gross premium growth in
1H FY Mar 2012
Proposed acquisition of
Kurnia Insurans
AMMB Holdings Berhad 13
14% y-o-y to RM45 million; this made up 4% of the Group‟s pre-tax profit during
the same period. Meanwhile, its claims ratio and combined ratio came up to a
respective 71% and 112% in 1H FY Mar 2012 (FY Mar 2011: 76% and 113%)
while its CAR as at end-June 2011 was well above the regulatory minimum of
130% required under BNM‟s RBC framework.
Apart from the 70%-shareholding of AMMB via AMAB Holdings Berhad, the
remaining 30% is owned by the United Kingdom‟s Friends Life Limited (“Friends
Life”). AmLife‟s board of directors, senior management and consultants also
consist of personnel from Friends Life.
Tapping strategic partnership with global insurance
partner
AMMB Holdings Berhad 14
Corporate Information – AMMB Holdings Berhad
Date of Incorporation:
15 August 1991
Commencement of Business:
1991
Major Shareholders (as at 31 December 2011):
ANZ Funds Pty Ltd Amcorp Group Berhad Employees Provident Fund Board
23.8% 16.8% 14.2%
Directors (as at 31 December 2011):
Tan Sri Azman Hashim Dato‟ Azlan Hashim Tun Mohammed Hanif Omar Tan Sri Datuk Clifford Francis Herbert Tan Sri Datuk Dr Aris Othman Datuk Rohana Tan Sri Mahmood Dato‟ Izham Mahmud (resigned with effect from 15 October 2011) Alexander Vincent Thursby Dr Robert John Edgar Mark David Whelan Cheah Tek Kuang (resigned with effect from 2 April 2012) Ashok Ramamurthy (appointed with effect from 2 April 2012) Soo Kim Wai Alistair Marshall Bulloch (alternate director to Alexander Vincent Thursby and Mark David Whelan) Mark Timothy Robinson (alternate director to Dr Robert John Edgar)
Auditor:
Ernst & Young
Listing:
Main Market of Bursa Malaysia
Group Key Management:
Cheah Tek Kuang Ashok Ramamurthy Datuk Mohamed Azmi Mahmood Dato‟ James Lim Cheng Poh Kok Tuck Cheong Pushpa Rajadurai Yvonne Phe Kheng Peng Teng Chean Choy Duncan Victor Brain Datuk Mahdi Murad Dato‟ Wan Zamri bin Wan Zain Adrian John Nurse Andrew Strain Kerr Ross Neil Foden Charles Tan Keng Lock Thein Kim Mon Wong Jee Seng Sim How Chuah Tan Chin Aun
Group Managing Director (resigned with effect from 2 April 2012) Deputy Group Managing Director and Chief Financial Officer (appointed as Group Managing Director with effect from 2 April 2012) Managing Director, Retail Banking Managing Director, Business Banking Managing Director, Investment Banking Managing Director, Corporate & Institutional Banking Managing Director, Markets Division Managing Director, Group Managing Director‟s Office Chief Executive Officer – AmG Insurance Berhad Chief Executive Officer – AmIslamic Bank Berhad Chief Executive Officer – AmFamily Takaful Berhad Acting Chief Executive Officer – AmLife Insurance Berhad Chief Risk Officer Chief Operations Officer Chief Information Officer Chief Internal Auditor Senior General Manager, Group Corporate Strategy Senior General Manager, Business Banking Senior General Manager, Transaction Banking
Major Subsidiaries:
AmBank (M) Berhad AmIslamic Bank Berhad AmInvestment Bank Berhad AMFB Holdings Berhad AMAB Holdings Sdn Bhd AmInvestment Group Berhad AmG Insurance Berhad AmLife Insurance Berhad AmFamily Takaful Berhad
100% 100% 100% 100% 100% 100% 51% 70% 70%
***** ***** - ***,***
AMMB Holdings Berhad 15
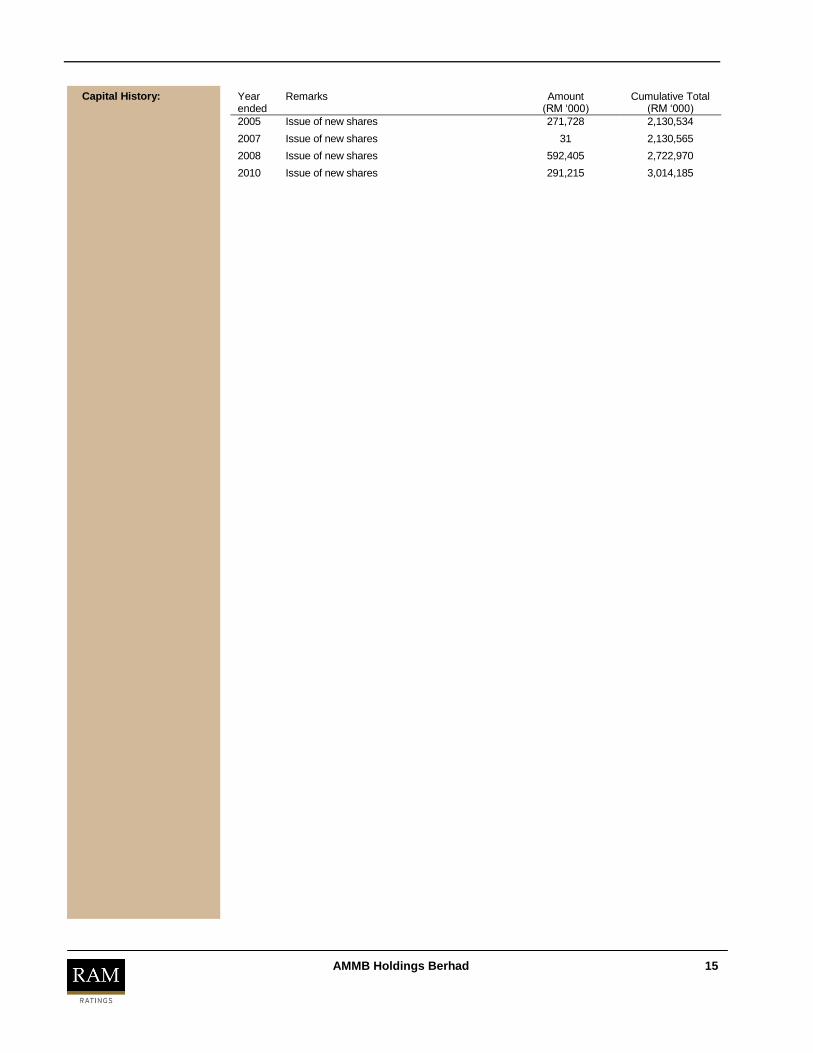
Capital History:
Year ended
Remarks Amount (RM „000)
Cumulative Total (RM „000)
2005 Issue of new shares 271,728 2,130,534
2007 Issue of new shares 31 2,130,565
2008 Issue of new shares 592,405 2,722,970
2010 Issue of new shares 291,215 3,014,185
AMMB Holdings Berhad 16
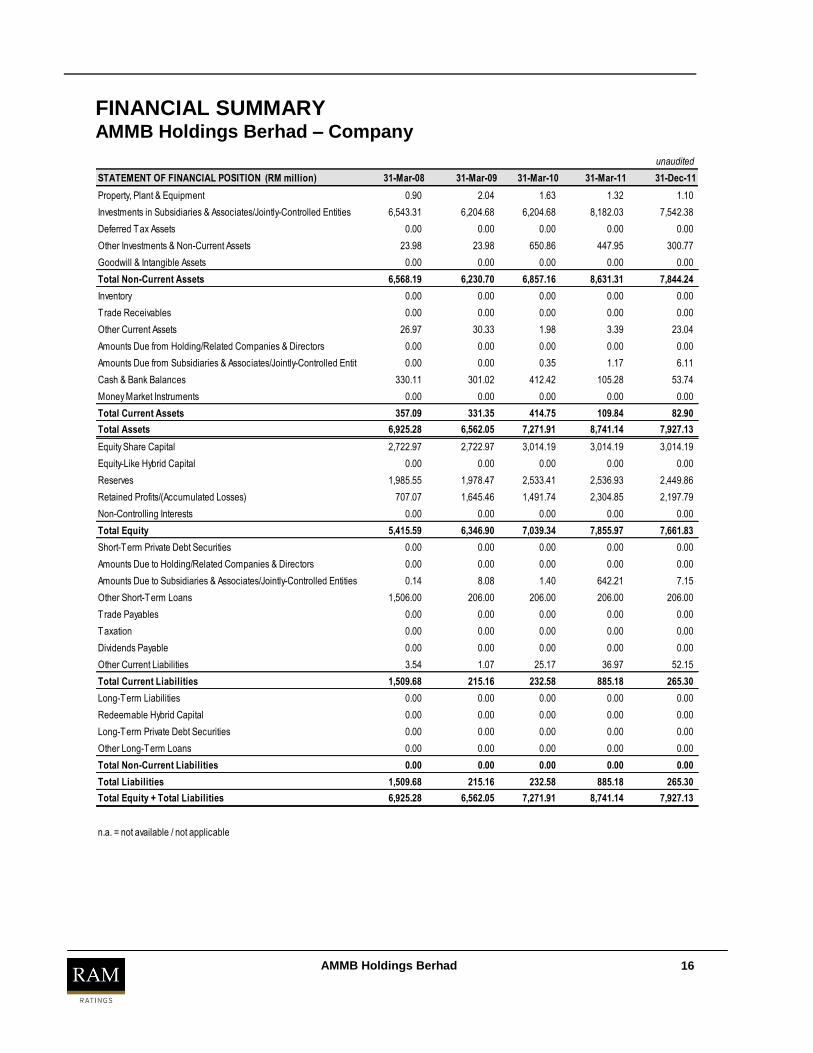
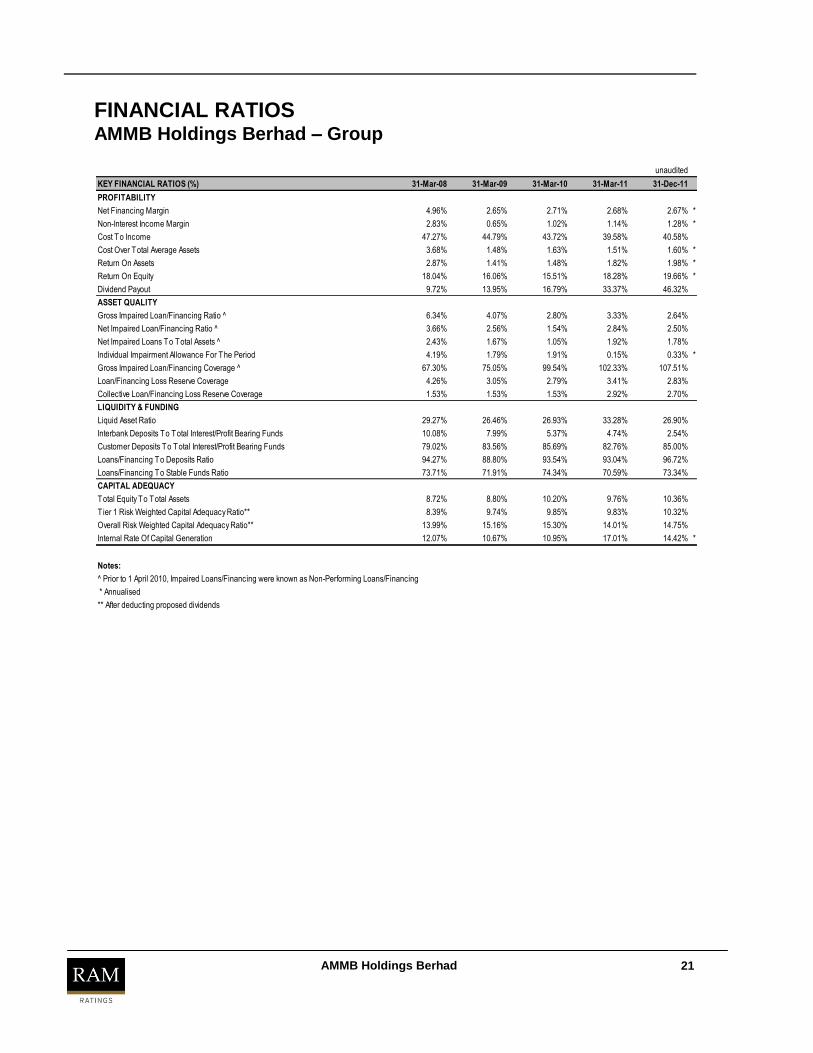
unaudited
STATEMENT OF FINANCIAL POSITION (RM million) 31-Mar-08 31-Mar-09 31-Mar-10 31-Mar-11 31-Dec-11
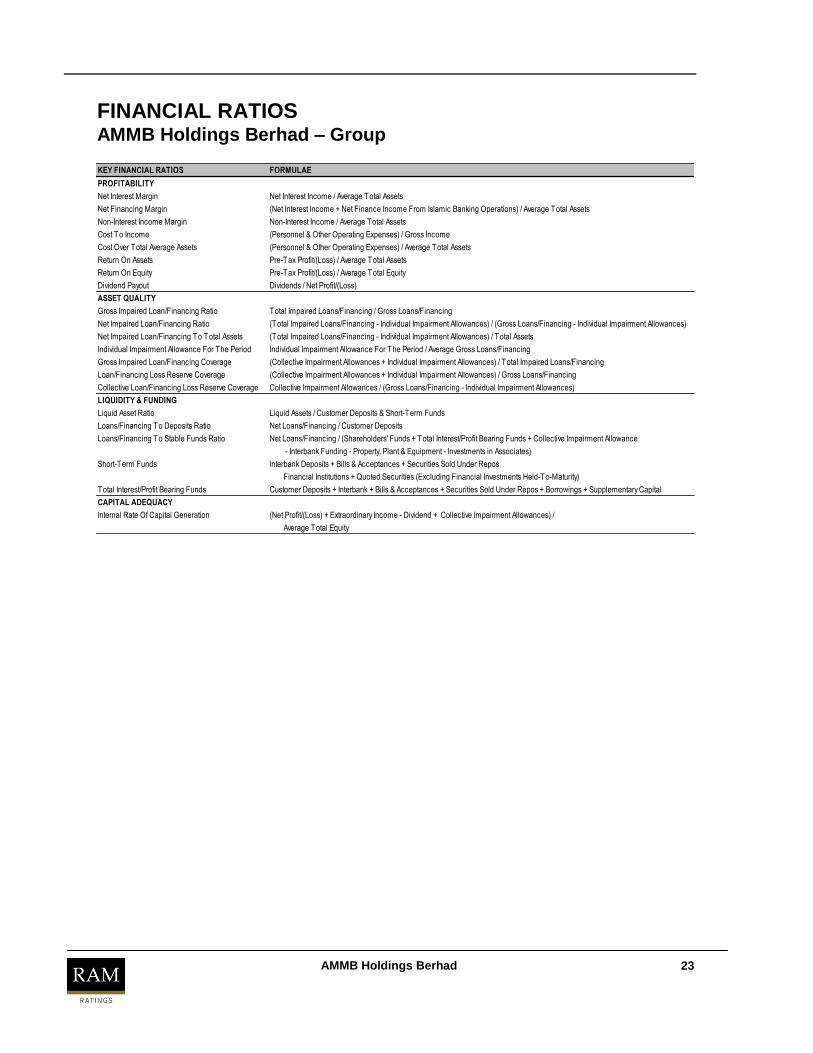
Loans/Financing To Deposits Ratio Net Loans/Financing / Customer Deposits
Loans/Financing To Stable Funds Ratio Net Loans/Financing / (Shareholders' Funds + Total Interest/Profit Bearing Funds + Collective Impairment Allowance
Total Interest/Profit Bearing Funds Customer Deposits + Interbank + Bills & Acceptances + Securities Sold Under Repos + Borrowings + Supplementary Capital
CAPITAL ADEQUACY
Internal Rate Of Capital Generation (Net Profit/(Loss) + Extraordinary Income - Dividend + Collective Impairment Allowances) /
Average Total Equity
FINANCIAL RATIOS AMMB Holdings Berhad – Group
AMMB Holdings Berhad 24
CREDIT RATING DEFINITIONS
Corporate Credit Ratings
Long-Term Ratings
AAA
AA
A
BBB
BB
B
C
D
Short-Term Ratings
P1
P2
P3
NP
D
An entity rated AAA has a superior capacity to meet its financial obligations. This is the highest long-term CCR assignedby RAM Ratings.
An entity rated AA has a strong capacity to meet its financial obligations. The entity is resilient against adverse changesin circumstances, economic conditions and/oroperating environments.
An entity rated A has an adequate capacity to meet its financial obligations. The entity is more susceptible to adversechanges in circumstances, economic conditions and/or operating environments than those in higher-rated categories.
An entity rated BBB has a moderate capacity to meet its financial obligations. The entity is more likely to be weakened byadverse changes in circumstances, economic conditions and/or operating environments than those in higher-rated
categories. This is the lowest investment-grade category.
An entity rated BB has a weak capacity to meet its financial obligations. The entity is highly vulnerable to adversechanges in circumstances, economic conditions and/or operating environments.
An entity rated B has a very weak capacity to meet its financial obligations. The entity has a limited ability to withstandadverse changes in circumstances, economic conditions and/oroperating environments.
An entity rated C has a high likelihood of defaulting on its financial obligations. The entity is highly dependent onfavourable changes in circumstances, economic conditions and/or operating environments, the lack of which would likely
result in it defaulting on its financial obligations.
An entity rated D is currently in default on either all or a substantial portion of its financial obligations, whether or notformally declared. The D rating may also reflect the filing of bankruptcy and/or other actions pertaining to the entity that
could jeopardise thepayment of financial obligations.
An entity rated P1 has a strong capacity to meet its short-term financial obligations. This is the highest short-term CCRassigned by RAM Ratings.
An entity rated P2 has an adequate capacity to meet its short-term financial obligations. The entity is more susceptible tothe effects of deteriorating circumstances than those in the highest-rated category.
An entity rated P3 has a moderate capacity to meet its short-term financial obligations. The entity is more likely to beweakened by the effects of deteriorating circumstances than those in higher-rated categories. This is the lowest
investment-grade category.
An entity rated NP has a doubtful capacity to meet its short-term financial obligations. The entity faces major uncertaintiesthat could compromise its capacity forpayment of financial obligations.
An entity rated D is currently in default on either all or a substantial portion of its financial obligations, whether or notformally declared. The D rating may also reflect the filing of bankruptcy and/or other actions pertaining to the entity that
could jeopardise thepayment of financial obligations.
For long-term ratings, RAM Ratings applies subscripts 1, 2 or 3 in each rating category from AA to C. The subscript 1 indicates that theentity ranks at the higher end of its generic rating category; the subscript 2 indicates a mid-ranking; and the subscript 3 indicates that the
entity ranks at the lower end of its generic rating category.
A Corporate Credit Rating (“CCR”) is RAM Ratings' current opinion on the overall capacity of an entity to meet its financialobligations. The opinion is not specific to any particular financial obligation, as it does not take into account the expressedterms and conditions of any specific financial obligation.
AMMB Holdings Berhad 25
CREDIT RATING DEFINITIONS
Issue Ratings
Long-Term Ratings
AAA
AA
A
BBB
BB
B
C
D
Short-Term Ratings
P1
P2
P3
NP
D
An issue rated AAA has superior safety for payment of financial obligations . This is the highest long-term Issue Rating
assigned by RAM Ratings .
An issue rated AA has high safety for payment of financial obligations . The issuer is resilient against adverse changes in
An issue rated C has a high likelihood of default . The issuer is highly dependent on favourable changes in circumstances ,
economic conditions and/or operating environments, the lack of which would likely result in it defaulting on a particular
debt issue .
An issue rated D is either currently in default or faces imminent default on its financial obligations, whether or not formally
declared . The D rating may also reflect a distressed exchange, the filing of bankruptcy and/or other actions pertaining to
the issuer that could jeopardise the payment of a particular debt issue .
An issue rated P1 has high safety for payment of financial obligations in the short term . This is the highest short -term
Issue Rating assigned by RAM Ratings .
An issue rated P2 has adequate safety for payment of financial obligations in the short term . The issuer is more
susceptible to the effects of deteriorating circumstances than those in the highest -rated category .
An issue rated P3 has moderate safety for payment of financial obligations in the short term . The issuer is more likely to
be weakened by the effects of deteriorating circumstances than those in higher -rated categories . This is the lowest
investment -grade category.
An issue rated NP has doubtful safety for payment of financial obligations in the short term . The issuer faces major
uncertainties that could compromise its capacity for payment of a particular debt issue .
An issue rated D is either currently in default or faces imminent default on its financial obligations, whether or not formally
declared . The D rating may also reflect a distressed exchange, the filing of bankruptcy and/or other actions pertaining to
the issuer that could jeopardise the payment of a particular debt issue .
For long-term ratings, RAM Ratings applies subscripts 1, 2 or 3 in each rating category from AA to C. The subscript 1 indicates that the
issue ranks at the higher end of its generic rating category; the subscript 2 indicates a mid-ranking ; and the subscript 3 indicates that the
issue ranks at the lower end of its generic rating category . In addition, RAM Ratings applies the suffixes (bg) or (s) to ratings which have
been enhanced by a bank guarantee or other supports, respectively .
An Issue Rating is RAM Ratings' current opinion on the creditworthiness of a particular debt issue. It reflects the overallcapacity and willingness of an issuer to meet the financial obligations on a particular debt issue on a full and timely basis,taking into account its expressed terms and conditions .
AMMB Holdings Berhad 26
RAM Ratings receives compensation for its rating services, normally paid by the issuers of such securities or the rated entity, and sometimes
third parties participating in marketing the securities, insurers, guarantors, other obligors, underwriters, etc. The receipt of this compensation has
no influence on RAM Ratings‟ credit opinions or other analytical processes. In all instances, RAM Ratings is committed to preserving the
objectivity, integrity and independence of its ratings. Rating fees are communicated to clients prior to the issuance of rating opinions. While RAM
Ratings reserves the right to disseminate the ratings, it receives no payment for doing so, except for subscriptions to its publications.
RAM Ratings, its rating committee members and the analysts involved in the rating exercise have not encountered and/or are not aware of any
conflict of interest relating to the rating exercise. RAM Ratings will adequately disclose all related information in the report if there are such
instances.
Published by RAM Rating Services Berhad
Reproduction or transmission in any form is prohibited except by