32
The Innovator in Healthcare Workforce Solutions and Staffing Services AMN Healthcare Investor Presentation June 2018

The Innovator in Healthcare Workforce Solutions and Staffing Services
AMN Healthcare Investor Presentation
June 2018
Forward-Looking Statements
This investor presentation contains “forward-
looking statements” within the meaning of
Section 27A of the Securities Act of 1933,
as amended, and Section 21E of the
Securities Exchange Act of 1934, as
amended. The Company bases these
forward-looking statements on its current
beliefs, expectations, estimates, forecasts
and projections about future events and the
industry in which it operates. Forward-looking
statements are identified by words such as
“believe,” “anticipate,” “expect,” “intend,”
“plan,” “will,” “should,” “would,” “project,”
“may,” variations of such words and other
similar expressions. In addition, statements
that refer to performance; plans, objectives
and strategies for future operations;
and other characterizations of future
events or circumstances, are
forward-looking statements.
The Company’s actual results could
differ materially from those discussed in,
or implied by, these forward-looking
statements. Factors that could cause
actual results to differ from those
discussed in or implied by the forward-
looking statements contained in this
presentation are set forth in the Company's
Annual Report on Form 10-K for the year
ended December 31, 2017 and its other
periodic reports, its current reports and its
other filings with the SEC. Developments
subsequent to this presentation are likely
to cause these statements to become
outdated with the passage of time.
2

Our Mission
Every day, we . . .
Deliver the best talent and insights to
help healthcare organizations optimize
their workforce
Give healthcare professionals
opportunities to do their best work
towards quality patient care
Create a values-based culture of
innovation where our team members
can achieve their goals
3

A Recognized Leader
2011
Since 2011 AMN MSP (Managed Service
Program) has been
granted the "Peer
Reviewed by
HFMA®" designation
2017
Named Largest Healthcare Staffing
Company & MSP
Provider in the U.S.
Re-Certified through 2018
First Corporate
Certification for Staffing
Services by the
Joint Commission
2016
Exemplary Compensation
Discussion & Analysis
(CD&A) Award Winner
2016
Healthcare Leader
Based on Customer
Satisfaction and
Quality
2017
The Top HealthcareProvider
Based on Customer
Satisfaction and Quality
2017
2015
Corporate Governance Team of the Year
2017
Top three-year performer
in revenue, profits, and
stock returns.
2013
#1 RPO in Healthcare
Based on Customer
Satisfaction
and Quality
2015
Best Compliance & Ethics Program
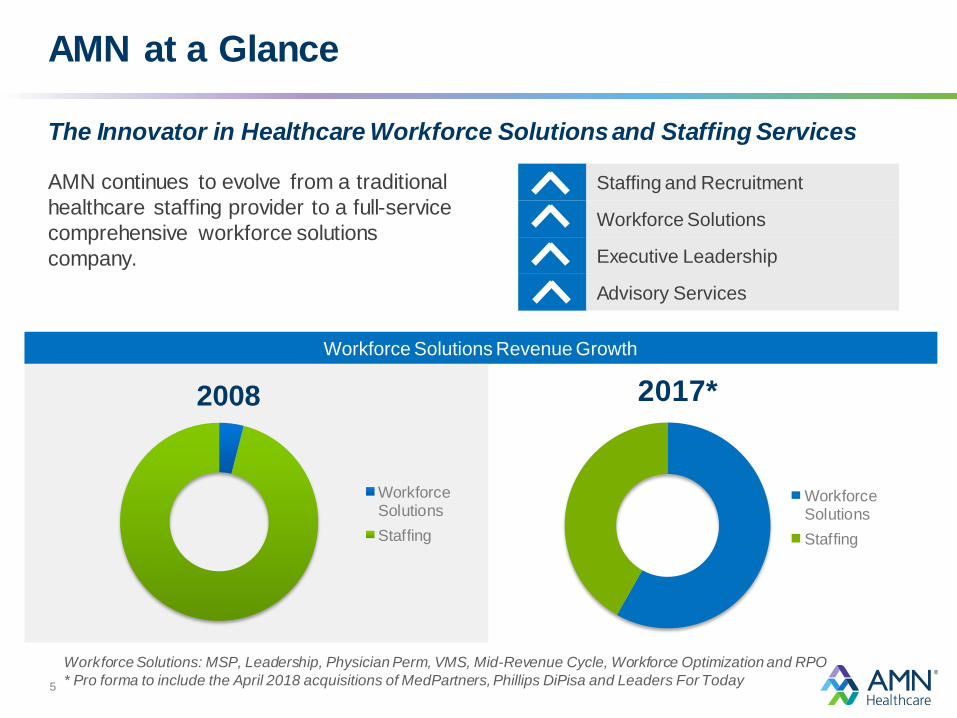
AMN at a Glance
5
AMN continues to evolve from a traditional
healthcare staffing provider to a full-service
comprehensive workforce solutions
company.
2008
WorkforceSolutions
Staffing
WorkforceSolutions
Staffing
Workforce Solutions Revenue Growth
Staffing and Recruitment
Workforce Solutions
Executive Leadership
Advisory Services
The Innovator in Healthcare Workforce Solutions and Staffing Services
Workforce Solutions: MSP, Leadership, Physician Perm, VMS, Mid-Revenue Cycle, Workforce Optimization and RPO
* Pro forma to include the April 2018 acquisitions of MedPartners, Phillips DiPisa and Leaders For Today
2017*

Continued Evolution in Workforce Solutions
Travel NurseAmerican Mobile Nurses: A founding company
1980s
1990sNurse and Allied ExpansionAmerican Mobile Healthcare, MedicalExpress
2010 -
2013
2014 -
2015
2000-
2008
Workforce Solutions: MSP, RPO and VMSMedFinders, ShiftWise
Nurse, Physician, VMS, Leadership, Predictive Modeling Onward Healthcare, Locum Leaders, Medefis, The First String, MillicanSolutions, Avantas
Physician, Allied, Nurse and Search ExpansionMerritt Hawkins, StaffCare, MedTravelers, O’Grady Peyton
2016
Interim Leadership and Executive Search, Rapid/Project Staffing, Medical CodingBE Smith, HealthSource Global,Peak Health Solutions
6
2018
Mid-Revenue Cycle, C-Suite Search and Expanded Interim LeadershipMedPartners, Phillips DiPisa, Leaders For Today

Strengthening Executive Search and Interim Leadership
Recent Acquisitions
Healthcare-focused executivesearch firm
Fast-growing provider of interim and permanent leadership
7
Mid-Revenue Cycle Workforce Solutions
Leading provider of mid-revenue cycle workforce solutions, enabling healthcare facilities to optimize revenue, improve patient care
management, and support quality/outcomes reporting requirements

MedPartners Acquisition
Leading provider of mid-revenue cycle workforce
solutions, enabling AMN to support clients with
revenue and quality initiatives
Workforce Solutions:
Clinical Documentation Improvement • Registry
Case Management • Medical Coding
• 2017 annual revenue $125 million
• Adjusted EBITDA margin: 16%
• Purchase price: $195 million - $25 million NPV
tax benefit
• Immediately accretive
8

Phillips DiPisa and Leaders For Today
Phillips DiPisa: Highly regarded
healthcare executive search firm with
strong C-suite expertise
Leaders For Today: Growing interim and
permanent leadership staffing firm
• 2017 annual revenue: $23 million
• Adjusted EBITDA margin: 20%
• Purchase price: $30 million - $4 million
NPV tax benefit
• Immediately accretive
9

Financial Growth with Leverage
10
Revenue Adjusted EBITDA
($ in Millions)
$1,012 $1,036
$1,463
$1,902 $1,988
FY 2013 FY 2014 FY 2015 FY 2016 FY 2017
$85 $91
$165
$237 $256
FY 2013 FY 2014 FY 2015 FY 2016 FY 2017

Business Overview
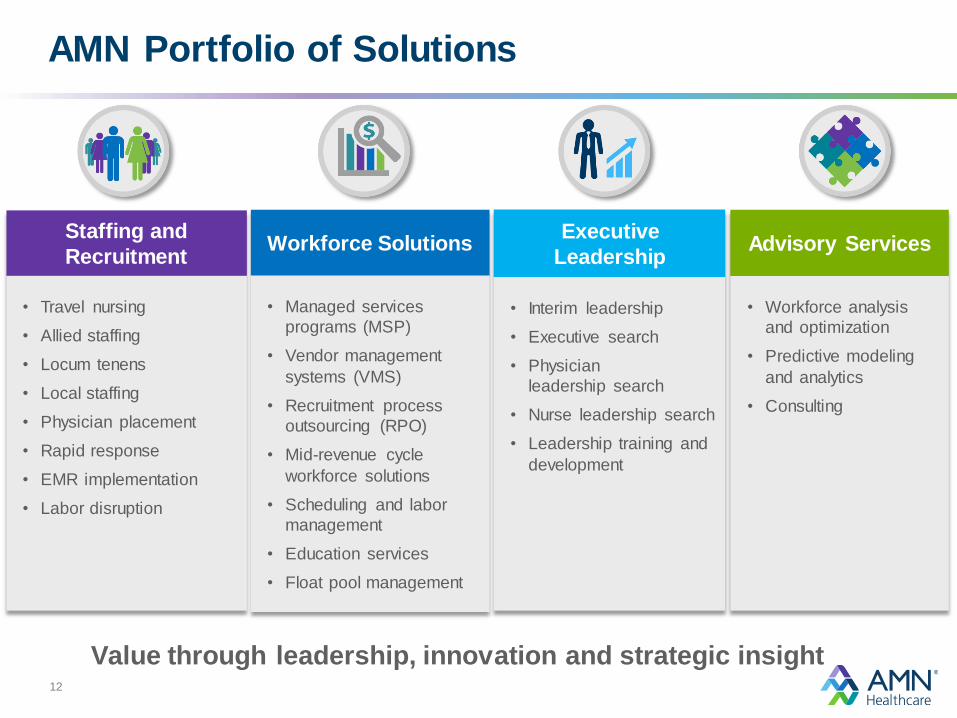
Staffing and
Recruitment
• Travel nursing
• Allied staffing
• Locum tenens
• Local staffing
• Physician placement
• Rapid response
• EMR implementation
• Labor disruption
Workforce Solutions
• Managed services
programs (MSP)
• Vendor management
systems (VMS)
• Recruitment process
outsourcing (RPO)
• Mid-revenue cycle
workforce solutions
• Scheduling and labor
management
• Education services
• Float pool management
Advisory Services
• Workforce analysis
and optimization
• Predictive modeling
and analytics
• Consulting
AMN Portfolio of Solutions
Executive
Leadership
• Interim leadership
• Executive search
• Physician
leadership search
• Nurse leadership search
• Leadership training and
development
12
Value through leadership, innovation and strategic insight
Shortage of nurses
Shift to MSP relationships
Shift to flexible staffing models
Aging U.S. and clinical population
Favorable economy and
low unemployment
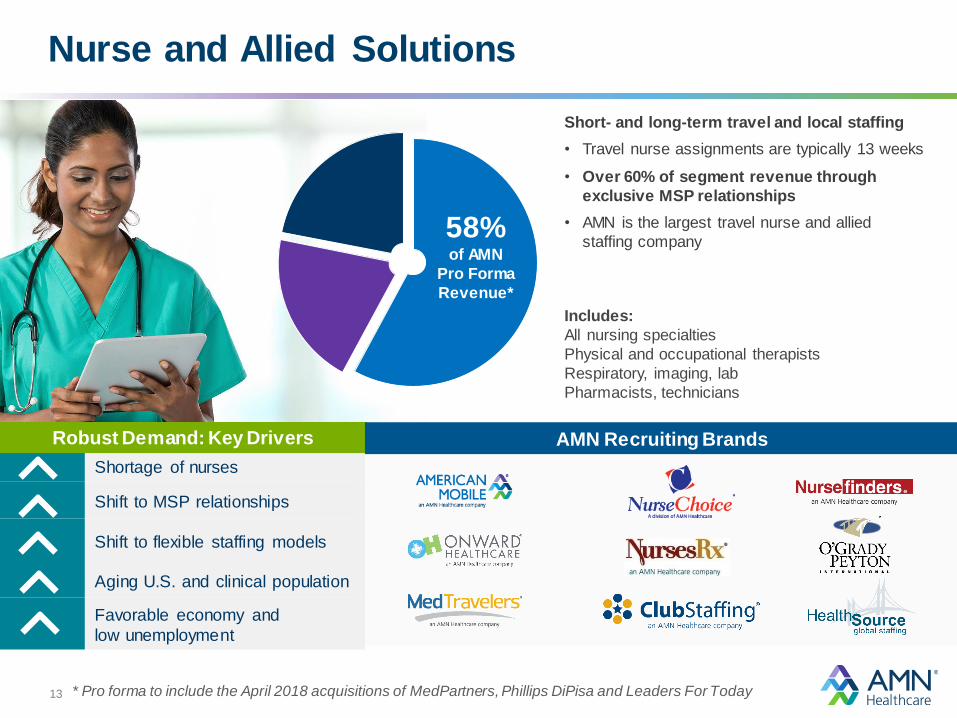
Nurse and Allied Solutions
13
Robust Demand: Key Drivers
Short- and long-term travel and local staffing
• Travel nurse assignments are typically 13 weeks
• Over 60% of segment revenue through
exclusive MSP relationships
• AMN is the largest travel nurse and allied
staffing company
AMN Recruiting Brands
Includes:
All nursing specialties
Physical and occupational therapists
Respiratory, imaging, lab
Pharmacists, technicians
58%of AMN
Pro Forma
Revenue*
* Pro forma to include the April 2018 acquisitions of MedPartners, Phillips DiPisa and Leaders For Today

Locum Tenens Solutions
14
Shortage of physicians
Growing demand for healthcare services
Specialty specific demand
Aging physician population
Robust Demand: Key Drivers AMN Brands
All physician and advanced practice specialties, including:
Primary Care & Internal Medicine
Psychiatry
Hospitalists
Surgery
Emergency Medicine
Radiology
Dentistry
Emergency Medicine
Typical assignments range from days to multiple months
20%

Other Workforce Solutions
Workforce and leadership shortages
Rising healthcare costs
Increased administrative complexity
Revenue integrity/capture, quality reporting
Increased need for data-driven insights
Key Drivers Brands
15
• Interim and permanent executive
leadership and permanent physician
placement across all healthcare settings
• Vendor Management Systems are
proprietary SaaS-based technology
solutions for managing contingent labor
• Mid-Revenue Cycle Solutions provide
hard-to-find specialized talent for case
management, clinical documentation,
registry and medical coding
• Workforce Optimization Solutions
include consulting, data analytics,
predictive modeling and SaaS-based
scheduling technology
Informed Decision Making Reduce Complexity Flexible Access to Skilled Talent Drive Optimal Workforce Mix
22%

Leader in Managed Services Programs (MSP)
16
• Outsourced partner to manage all supplemental workforce needs under
one contract
• Recruitment, credentialing, clinical support, reporting, consolidated invoicing
Higher fill rates
Improved fulfillment time
Staffing optimization
Cross-selling opportunities
Recruitment advantages
Less cyclicality
500+ affiliates
Controlled spend
Accountability
Regulatory compliance
Improved demand visibility
Strong client relationships
High client retention
Client Perspective AMN Perspective
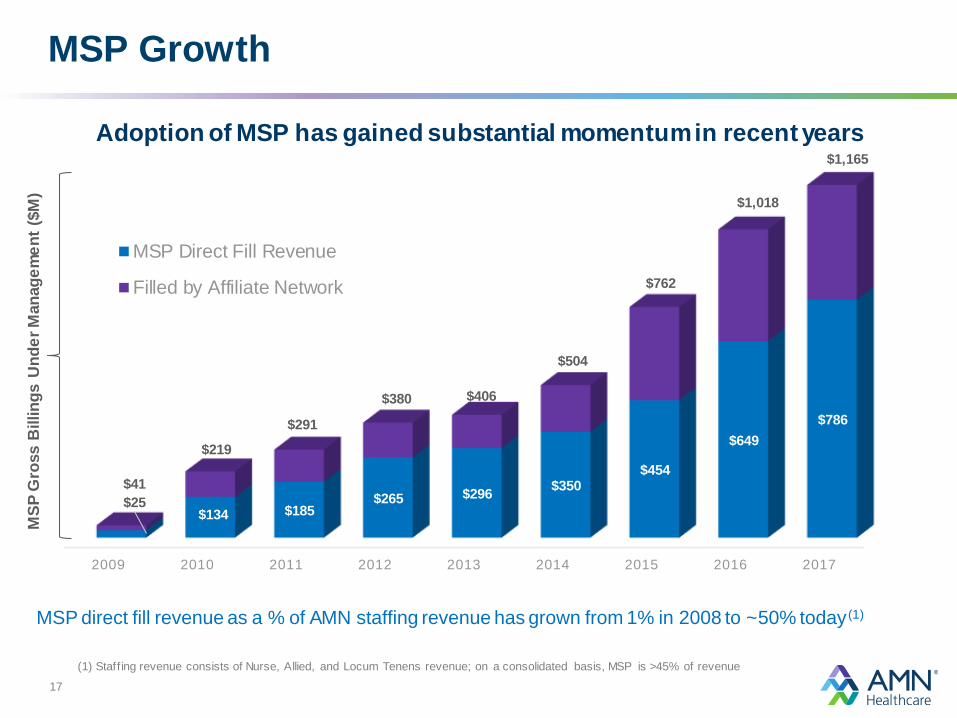
MSP Growth
17
Adoption of MSP has gained substantial momentum in recent years
(1) Staff ing revenue consists of Nurse, Allied, and Locum Tenens revenue; on a consolidated basis, MSP is >45% of revenue
MSP direct fill revenue as a % of AMN staffing revenue has grown from 1% in 2008 to ~50% today (1)
2009 2010 2011 2012 2013 2014 2015 2016 2017
$25$134 $185
$265 $296$350
$454
$649
$786
MSP Direct Fill Revenue
Filled by Affiliate Network
$406
$504
$762
$1,018
$41
$219
$291
$380
MS
P G
ross B
illin
gs U
nd
er
Man
ag
em
en
t ($
M)
$1,165

Leader in Vendor Management Systems (VMS)
Cloud based technology that
automates temporary and
float pool staffing through
online order and fulfillment,
scheduling, credential
tracking, time keeping,
invoicing and reporting
Fill rates
Clinician quality
Efficiency
Staffing optimization
Controlled spend
~ $1.3 Billion Annualized Spend Under Management
18

Leader in Workforce Optimization: Predictive Analytics & Forecasting
Typical savings:
4% to 7% of
nurse labor
spend
Labor spend is approximately 50% of hospital budget
Workforce predictive analytics
Business intelligence
Optimization and advisory services
Centralized resource management
Scheduling technology & tools
19

Evolving AMN’s Workforce Solutions Strategy
20
Perm
Float
Contingent
Recruit Develop Retain Optimize
Talent Supply Mix
Workforce Solutions
Trusted Workforce
Solutions Partner
Fill Clinical Positions
Forecast / Predict Need
Talent Engagement /
Reduce Turnover
Measure /
Manage Performance
Education, Training
Leadership Development
1
2
3
4
5
Top Workforce Pain Points
Source: Top Tier Consulting and
AMN Analytics Survey and interviews of health system executives across the US

Diverse Client Base
“AMN knows the national landscape. They know what’s out there and what the trends are. They bring that valuable information to us so that we can better plan as partners.”
- Chief Nursing Officer,
Large Integrated Health System & AMN MSP Client
21
As the market leader, AMN has over 100 MSP clients, including many blue chip healthcare systems

Industry Overview
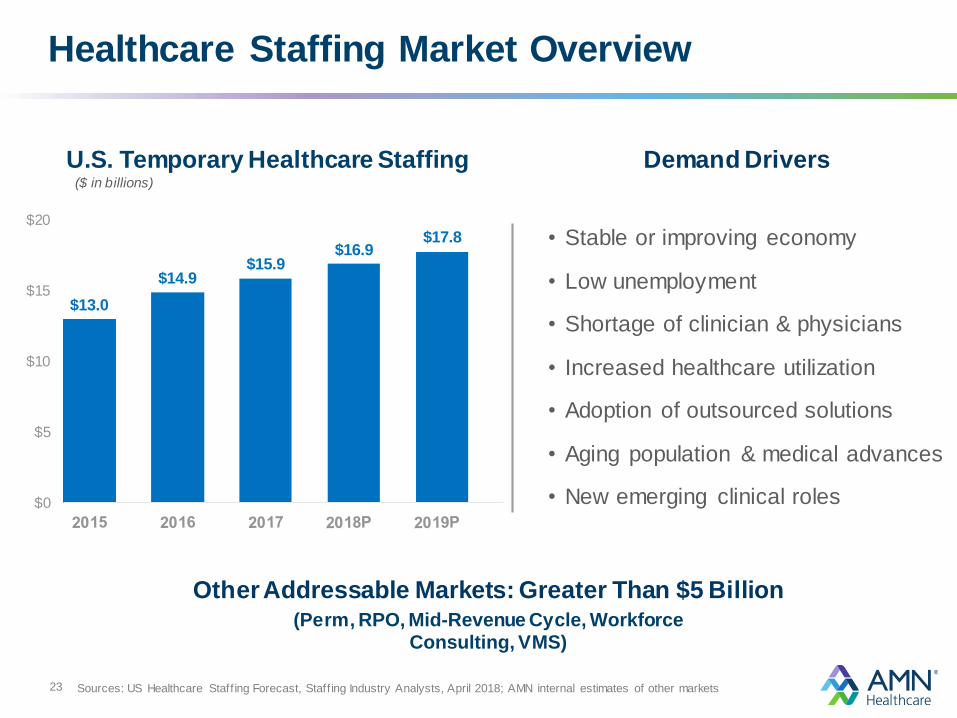
Healthcare Staffing Market Overview
Sources: US Healthcare Staff ing Forecast, Staff ing Industry Analysts, April 2018; AMN internal estimates of other markets
U.S. Temporary Healthcare Staffing
23
• Stable or improving economy
• Low unemployment
• Shortage of clinician & physicians
• Increased healthcare utilization
• Adoption of outsourced solutions
• Aging population & medical advances
• New emerging clinical roles
Demand Drivers($ in billions)
$13.0
$14.9$15.9
$16.9$17.8
$0
$5
$10
$15
$20
Other Addressable Markets: Greater Than $5 Billion(Perm, RPO, Mid-Revenue Cycle, Workforce
Consulting, VMS)
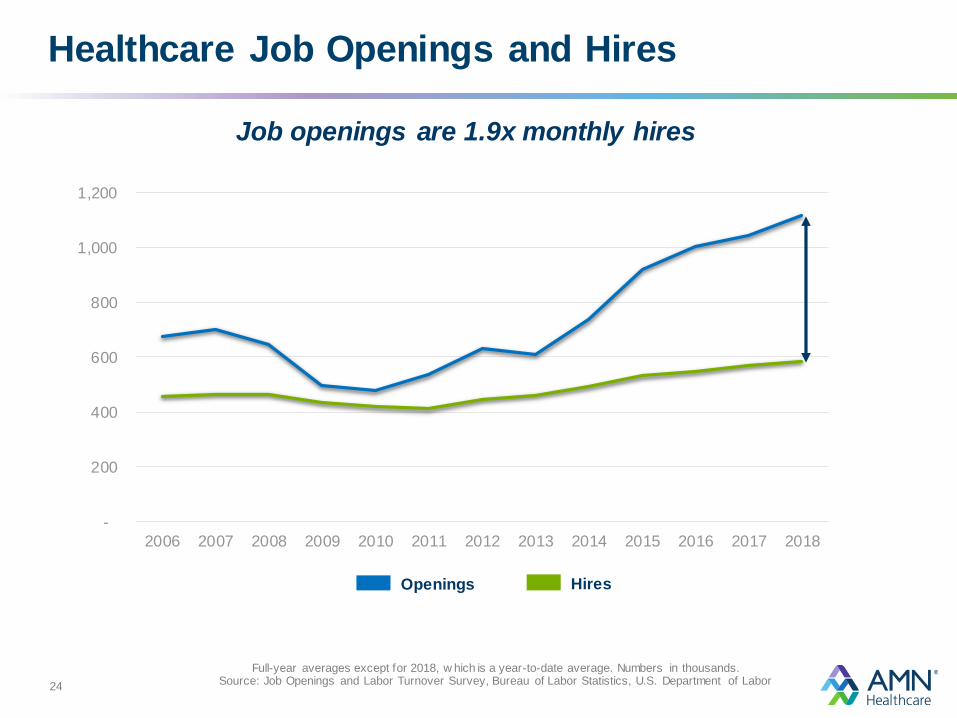
Healthcare Job Openings and Hires
24
Job openings are 1.9x monthly hires
Full-year averages except for 2018, w hich is a year-to-date average. Numbers in thousands.Source: Job Openings and Labor Turnover Survey, Bureau of Labor Statistics, U.S. Department of Labor
Openings Hires
-
200
400
600
800
1,000
1,200
2006 2007 2008 2009 2010 2011 2012 2013 2014 2015 2016 2017 2018

+4 Million More
Healthcare Jobs
Healthcare will add more
jobs than any other
industry
Fast-Growing
Healthcare Jobs
2016: 19 million
2026: 23 million
Growth in Healthcare Employment
Source: Bureau of Labor Statistics – Employment Projections, 2016 - 2026
PhysicalTherapists
RegisteredNurses
PhysicianAssistants
NursePractitioners
Physicians
37% 36% 25% 15%15%
25

Projected Healthcare Labor Shortage in 2025Aging Healthcare Professionals
~ 50% of RNs and physicians are age 50+
Annual Growth in Healthcare Spend Aging Population and Healthcare Utilization
Drivers of Healthcare Employment Growth
Sources: National Council of State Boards of Nursing and The Forum of State Nursing Workforce Centers – 2013 data and Association of American Medical Colleges
April 5, 2016; AMN Healthcare survey, November 2017; AMA Physician Master File and 2012 Physicians Foundation Survey conducted by Merritt Hawkins – 2012 data; National
Health Expenditure Projections – CMS, February 2017; AMN Healthcare 2013 Clinical Workforce Survey of Hospital Leaders; Association of American Medical Colleges, April 5,
2016; Future of the Nursing Workforce, Health Resources and Services Administration, December 2014.
• Over 65 - 3x more
hospital days
• Over 75 - 4x more healthcare days
2010 2015 2020 2025 2030
Source: U.S. Department of Health and Human Services
5.6%
4.8%
5.8%
40
72
U.S. population aged 65+in millions
55% of RNs who plan to retire will do so by 2020
~38% of active physicians are age 56 & older
26
94,700 physician shortage
Regional & specialty nurse shortages
2016–20252015 2016

Financial Overview

Long-term Adjusted EBITDA Margin Target
Note: The information set forth herein are based on our current belief of how we may be able to achieve our long-term goal.
Please refer to page 2 of this presentation titled “Forw ard-Looking Statements.”
11.3%AEBITDA Margin
14%AEBITDA Margin
30-70 bp
40-80 bp
40-100 bp
60-120 bp
7.2%AEBITDA Margin
$1.5 BRevenue
$2.3-2.5BRevenue
$0.9 BRevenue
28
2015Operating
Leverage
SG&A
Efficiency
WFS
Growth
Gross Margin
ImprovementBy 20202011

Historical Financial Summary
Total Revenue Gross Profit
Adjusted EBITDA Return on Invested Capital
29 ($ in Millions)
$1,036
$1,463
$1,902 $1,988 $2,016
$-
$500
$1,000
$1,500
$2,000
$2,500
FY 2014 FY 2015 FY 2016 FY 2017 LTM
$316
$469
$620 $644 $651
30.5%
32.1%32.6% 32.4% 32.3%
25%
30%
35%
40%
$0
$200
$400
$600
FY 2014 FY 2015 FY 2016 FY 2017 LTM
$91
$165
$237
$256 $260
8.8%
11.3%12.5% 12.9% 12.9%
0%
5%
10%
15%
20%
25%
$0
$50
$100
$150
$200
$250
FY 2014 FY 2015 FY 2016 FY 2017 LTM
9%
16%14%
16% 17%
0%
5%
10%
15%
FY 2014 FY 2015 FY 2016 FY 2017 LTM
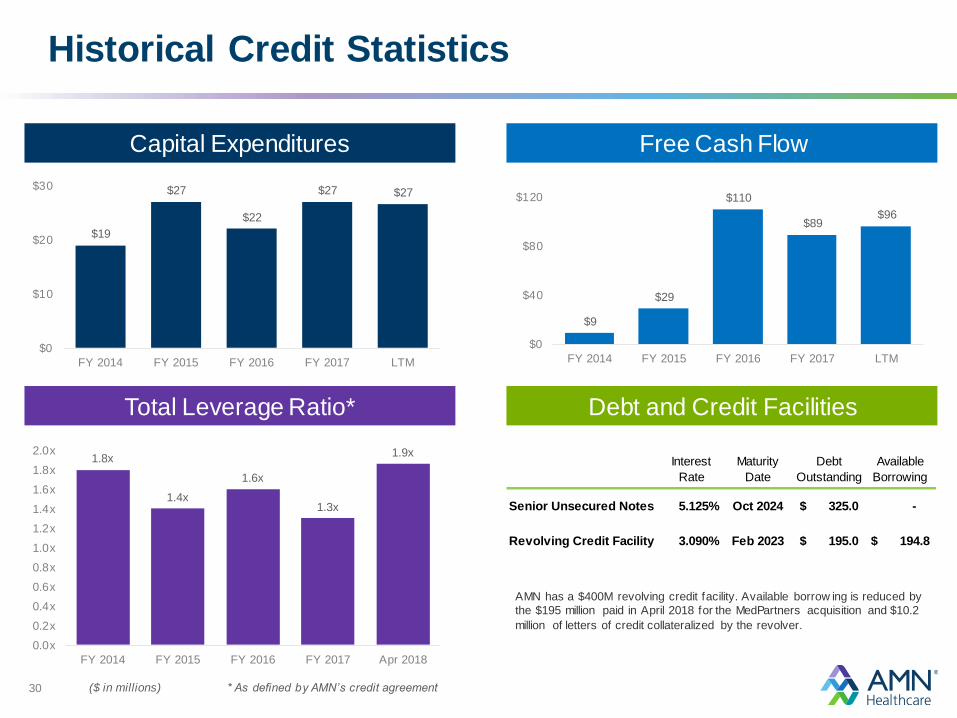
Historical Credit Statistics
30
Capital Expenditures Free Cash Flow
Total Leverage Ratio* Debt and Credit Facilities
($ in millions)
$19
$27
$22
$27 $27
$0
$10
$20
$30
FY 2014 FY 2015 FY 2016 FY 2017 LTM
$9
$29
$110
$89$96
$0
$40
$80
$120
FY 2014 FY 2015 FY 2016 FY 2017 LTM
1.8x
1.4x
1.6x
1.3x
1.9x
0.0x
0.2x
0.4x
0.6x
0.8x
1.0x
1.2x
1.4x
1.6x
1.8x
2.0x
FY 2014 FY 2015 FY 2016 FY 2017 Apr 2018
* As defined by AMN’s credit agreement
Interest
Rate
Maturity
Date
Debt
Outstanding
Available
Borrowing
Senior Unsecured Notes 5.125% Oct 2024 325.0$ -
Revolving Credit Facility 3.090% Feb 2023 195.0$ 194.8$
AMN has a $400M revolving credit facility. Available borrow ing is reduced by
the $195 million paid in April 2018 for the MedPartners acquisition and $10.2
million of letters of credit collateralized by the revolver.
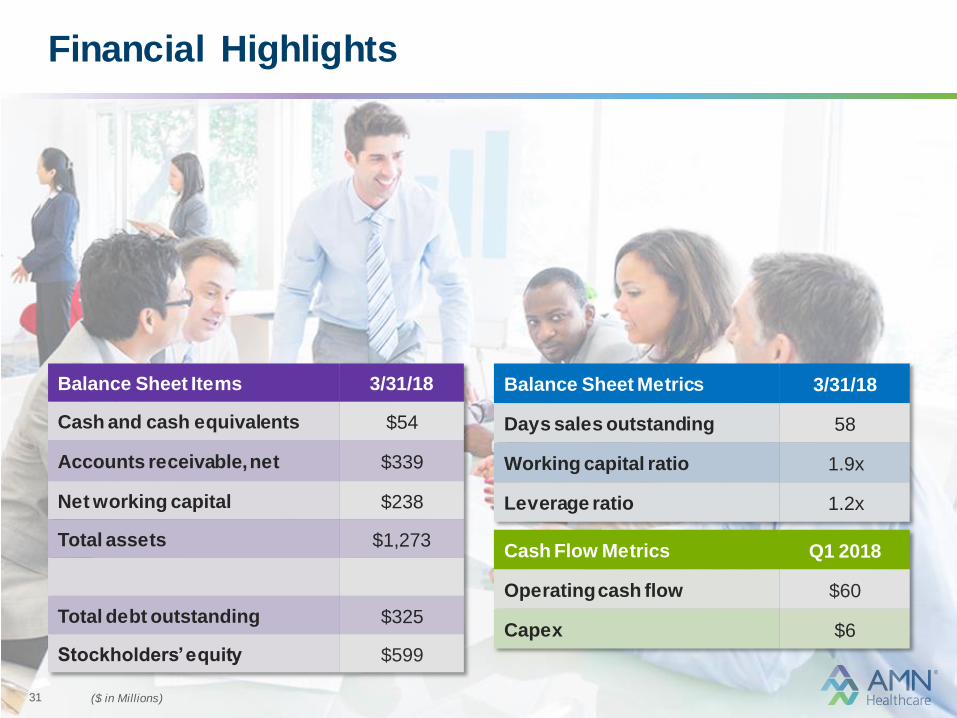
Cash Flow Metrics Q1 2018
Operating cash flow $60
Capex $6
Balance Sheet Items 3/31/18
Cash and cash equivalents $54
Accounts receivable, net $339
Net working capital $238
Total assets $1,273
Total debt outstanding $325
Stockholders’ equity $599
Balance Sheet Metrics 3/31/18
Days sales outstanding 58
Working capital ratio 1.9x
Leverage ratio 1.2x
Financial Highlights
31 ($ in Millions)

Key Investor Highlights
Market leader and trusted partner in healthcare staffing
services - nurse, allied, locums, physician and executive
search, interim leadership
Innovator in healthcare workforce solutions: MSP, VMS,
RPO, medical coding, workforce optimization; expanding
solutions to support clients
Strong demand environment supported by aging
population and clinical labor shortages
Positive macro and secular trends support growth
Investment in technology differentiates AMN services,
enhances recruiting capabilities, and reduces costs
Scalable operating model with leverage
Stable with strong cash flow & balance sheet
32


