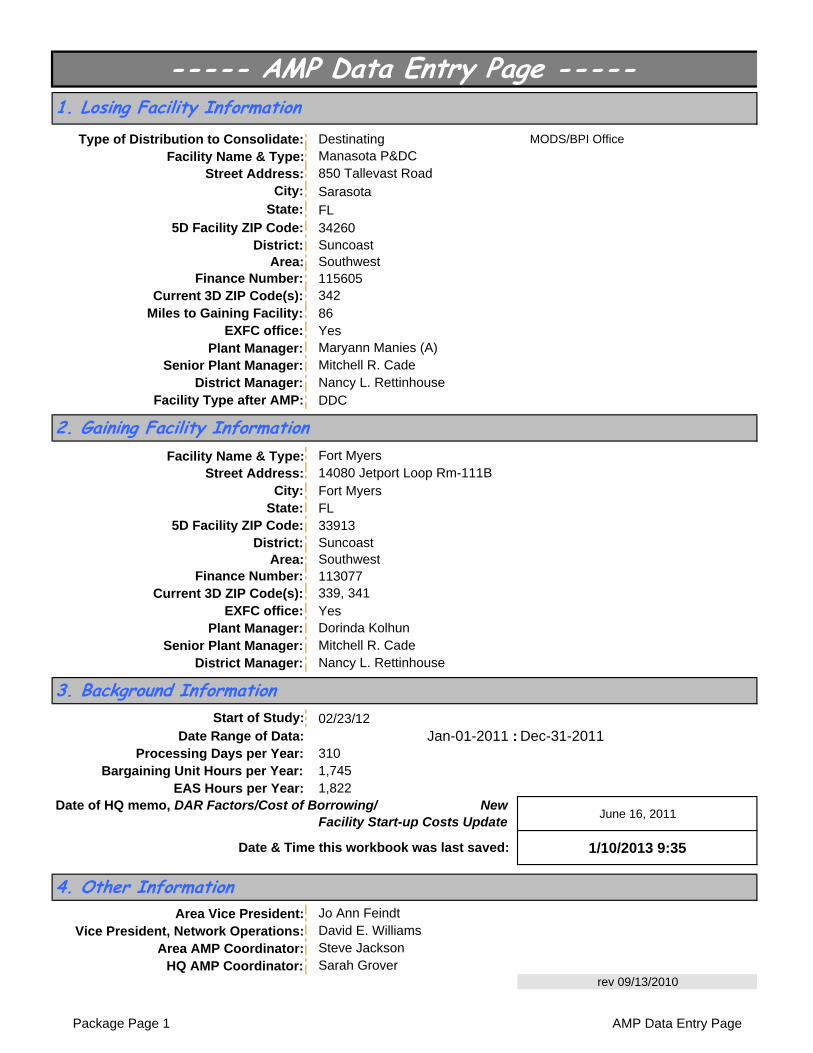
Type of Distribution to Consolidate: Destinating MODS/BPI Office Facility Name & Type: Street Address: City: Sarasota State: FL 5D Facility ZIP Code: 34260 District: Suncoast Area: Southwest Finance Number: 115605 Current 3D ZIP Code(s): Miles to Gaining Facility: 86 EXFC office: Yes Plant Manager: Senior Plant Manager: District Manager: Facility Type after AMP: DDC Facility Name & Type: Street Address: City: Fort Myers State: FL 5D Facility ZIP Code: 33913 District: Suncoast Area: Southwest Finance Number: 113077 Current 3D ZIP Code(s): EXFC office: Yes Plant Manager: Senior Plant Manager: District Manager: Start of Study: 02/23/12 Date Range of Data: Jan-01-2011 : Dec-31-2011 Processing Days per Year: 310 Bargaining Unit Hours per Year: 1,745 EAS Hours per Year: 1,822 June 16, 2011 1/10/2013 9:35 Area Vice President: Vice President, Network Operations: Area AMP Coordinator: HQ AMP Coordinator: rev 09/13/2010 ----- AMP Data Entry Page ----- Manasota P&DC 850 Tallevast Road Maryann Manies (A) 1. Losing Facility Information Sarah Grover 342 Mitchell R. Cade Nancy L. Rettinhouse Jo Ann Feindt David E. Williams Nancy L. Rettinhouse Fort Myers 14080 Jetport Loop Rm-111B Dorinda Kolhun 4. Other Information Mitchell R. Cade 339, 341 2. Gaining Facility Information Steve Jackson Date & Time this workbook was last saved: 3. Background Information Date of HQ memo, DAR Factors/Cost of Borrowing/ New Facility Start-up Costs Update Package Page 1 AMP Data Entry Page
Transcript
Type of Distribution to Consolidate: Destinating MODS/BPI OfficeFacility Name & Type:
Street Address:City: Sarasota
State: FL5D Facility ZIP Code: 34260
District: SuncoastArea: Southwest
Finance Number: 115605Current 3D ZIP Code(s):
Miles to Gaining Facility: 86EXFC office: Yes
Plant Manager:Senior Plant Manager:
District Manager:Facility Type after AMP: DDC
Facility Name & Type:Street Address:
City: Fort MyersState: FL
5D Facility ZIP Code: 33913District: Suncoast
Area: SouthwestFinance Number: 113077
Current 3D ZIP Code(s):EXFC office: Yes
Plant Manager:Senior Plant Manager:
District Manager:
Start of Study: 02/23/12Date Range of Data: Jan-01-2011 : Dec-31-2011
Processing Days per Year: 310Bargaining Unit Hours per Year: 1,745
EAS Hours per Year: 1,822
June 16, 2011
1/10/2013 9:35
Area Vice President:Vice President, Network Operations:
Area AMP Coordinator:HQ AMP Coordinator:
rev 09/13/2010
----- AMP Data Entry Page -----
Manasota P&DC850 Tallevast Road
Maryann Manies (A)
1. Losing Facility Information
Sarah Grover
342
Mitchell R. CadeNancy L. Rettinhouse
Jo Ann FeindtDavid E. Williams
Nancy L. Rettinhouse
Fort Myers14080 Jetport Loop Rm-111B
Dorinda Kolhun
4. Other Information
Mitchell R. Cade
339, 341
2. Gaining Facility Information
Steve Jackson
Date & Time this workbook was last saved:
3. Background Information
Date of HQ memo, DAR Factors/Cost of Borrowing/ New Facility Start-up Costs Update
Package Page 1 AMP Data Entry Page
Losing Facility Name and Type:Street Address:
City, State:Current 3D ZIP Code(s):
Type of Distribution to Consolidate:
Gaining Facility Name and Type:Current 3D ZIP Code(s):
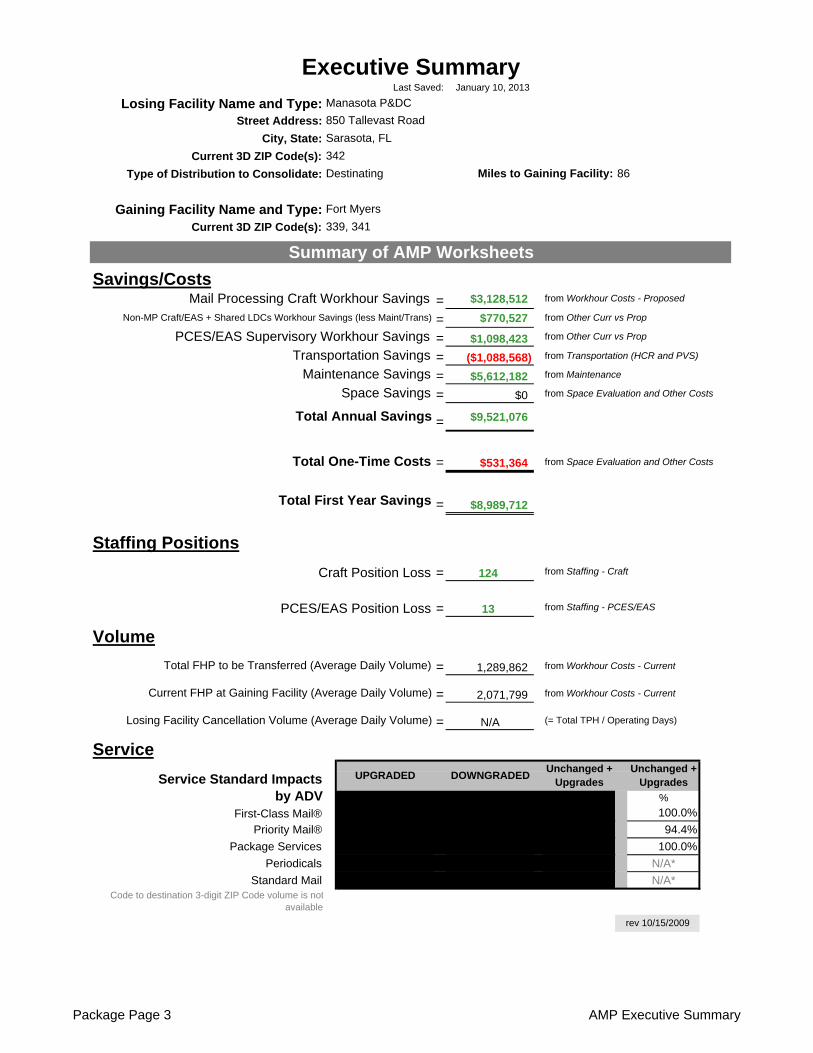
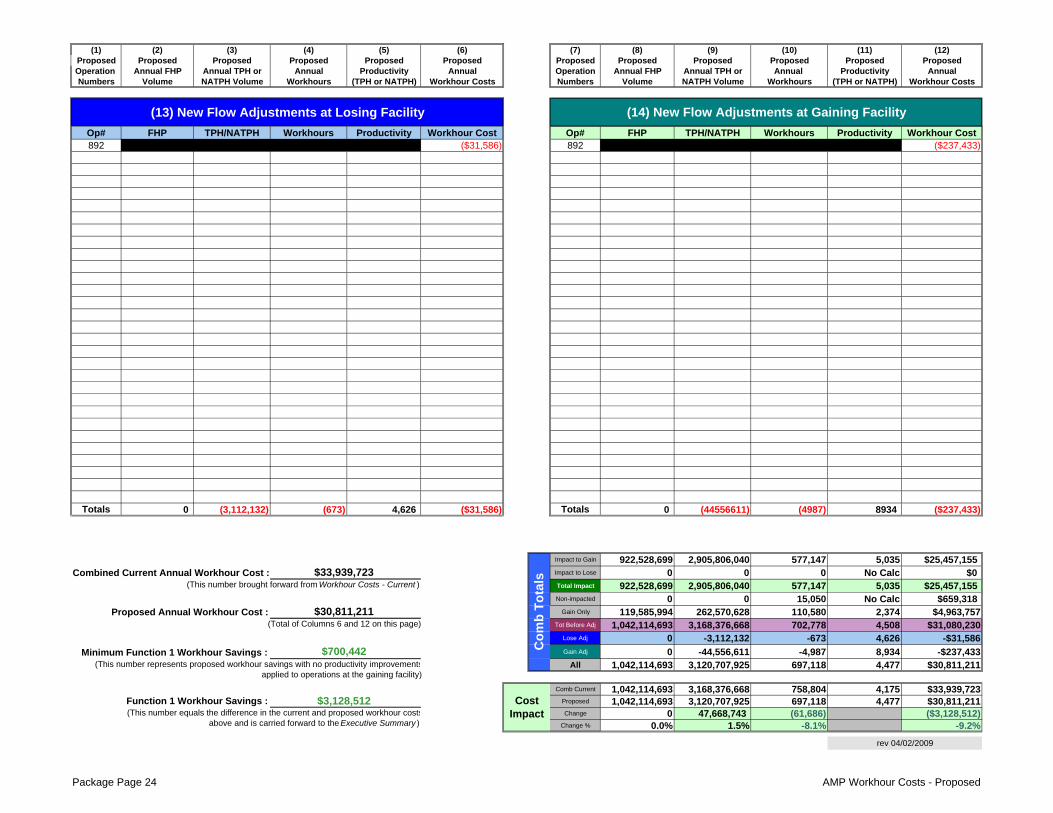
= $3,128,512
= $770,527
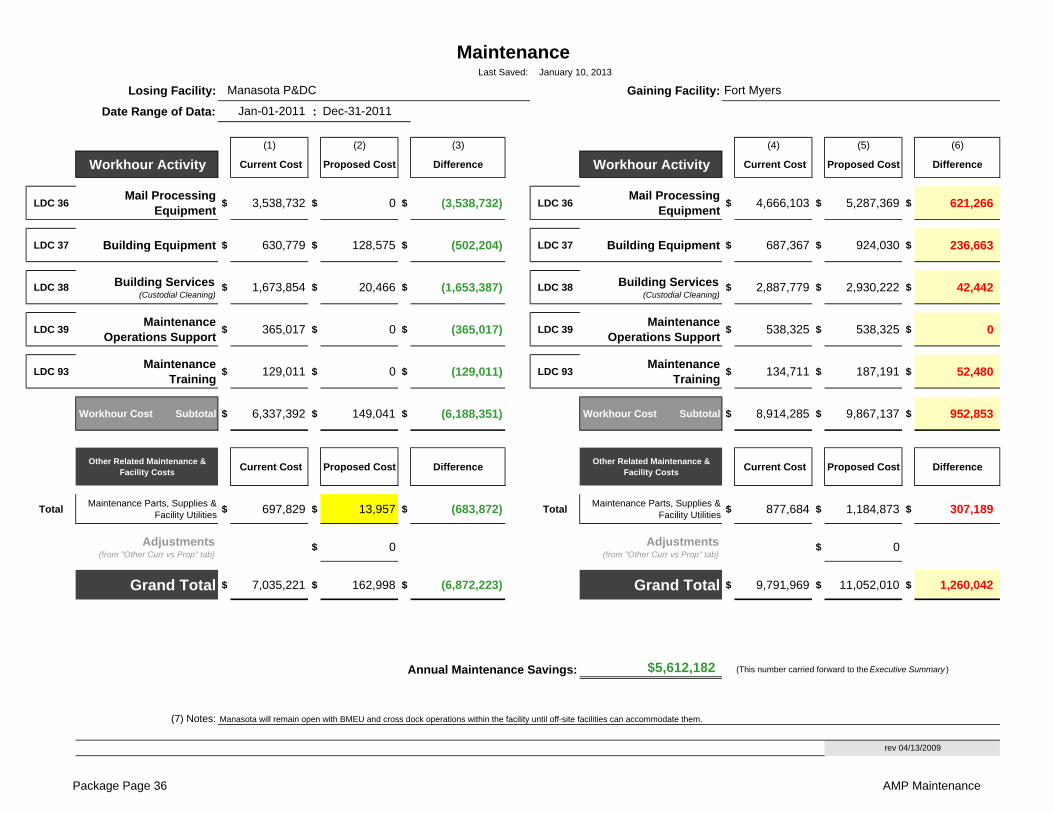
= $1,098,423= ($1,088,568) from Transportation (HCR and PVS)
Losing Facility Name and Type:Current 3D ZIP Code(s):
Type of Distribution to Consolidate:
Gaining Facility Name and Type:Current 3D ZIP Code(s):
rev 06/10/2009
January 10, 2013
339, 341
Destinating
Summary NarrativeLast Saved:
Manasota P&DC
Fort Myers
342
BACKGROUND This is a summary of the feasibility study for the consolidation of Destinating and all remaining mail types from the Manasota P&DC (ZIP 342) to the Fort Myers P&DC (ZIP 339,341) with the intent of closing theManasota P&DC facility to all mail processing operations. This AMP feasibility study is due to the significant decline in originating and destinating volumes and to increase efficiencies. The current FHP to be transferred (average Daily Volume) from Manasota P&DC is1,289,862 pieces. Cancellation volumes for SCF 342 are processed at the Tampa P&DC due to a previous AMP and will remain in that facility no matter the outcome of this study. Fort Myers currently does not process any ZIP 342 mail volumes of any class. The Tampa L&DC currently processes the Originating and Destinating Priority Mail, FCM SPR’s for SCF’s339, 341, 342, and would maintain those mail type distribution responsibilities. Fort Myers is currently processing all Originating and Destinating mail for Zip Codes 339 and 341. All ZIP 339 & 341 collections are processed at the Tampa P&DC on Saturdays per previous consolidation efforts. The Fort Myers P&DC is approximately 90 miles from the Manasota P&DC. FINANCIAL SUMMARY The annual baseline data for this AMP feasibility study is taken from the period of January 1, 2011 – December 31, 2011. Financial savings proposed for this consolidation of an average daily volume of 1,289,862 FHP destinating pieces from the Manasota P&DC (342) into the Fort Myers FL P&DC are: Total First Year Savings $ 8,989,712 Total Annual Savings $ 9,521,076 A one-time cost of $ 531,364 will be incurred for the employee relocation and site prep for mail processing equipment transferred from the Manasota P&DC to the Fort Myers FL P&DC. Of the $ 531,364 in one-time costs, $ 181,364 is directly associated with the relocation of the equipment, $100,000 is for facility costs and $250,000 for employee relocation costs. CUSTOMER & SERVICE IMPACTS Specific service standard changes associated with this Area Mail Processing consolidation are contingent upon the resolution of both (a) the rulemaking in which current market dominant product service standards in 39 CFR Part 121 are being evaluated, and (b) all remaining AMP consolidation proposals that are part of the same network rationalization initiative. A complete file reflecting any new service standards will be published at www.usps.com once all of the related AMP decisions that provide the foundation for new service standards are made. Priority and Express Mail service standards will be based upon the capability of the network.
EMPLOYEE IMPACTS The movement of all remaining mail processing operations will also require the movement of personnel. In this feasibility study, 109 craft and 13 management positions will be impacted. It is projected that 94additional craft positions will be required at the Fort Myers FL P&DC after AMP implementation. The 94craft position includes 52 clerks, 19 mail handlers, and 23 maintenance employees. Five custodians will remain at Manasota for building services. Thirteen mail handlers and 7 clerks will remain at Manasota forcross docking (hub) operations and 1 SDO. The remaining clerks at Manasota are needed to handleRegistry mail cross dock procedures and BMEU operations. Fort Myers P&DC will fill its current vacant EAS positions up to the current authorized staffing levels. Staffing gains due to this study are an increasein 2 management positions at the Supervisors Distribution Operations level. As a matter of policy, the Postal Service follows the Worker Adjustment and Retraining Notification Act's ("WARN") notification requirements when the number of employees experiencing an employment loss within the meaning of WARN would trigger WARN's requirements. Some or all of the impacted employees described above may not experience an employment loss within the meaning of WARN due to transfers or reassignments. The proposed complement changes are summarized below.
RETAIL AND BUSINESS MAIL ENTRY UNIT (BMEU) IMPACTS There are no anticipated changes at this time to BMEU times as a result of the AMP implementation. The BMEU located at the Manasota P&DC will remain at this site until a different site can be found, and proper notice can be given to our customers. The new location will not be known until the NODE Study is completed and the results are found. Local collection box pick up times will remain unchanged. If this facility is closed, then the collection boxes at this facility will be relocated to another site. The closest Post Office to the Manasota P&DC is Tallevast PO. This office is 1.2 miles from Manasota P&DC. A local postmark will continue to be available at local offices.
TRANSPORTATION Transportation supporting both the Fort Myers and Manasota P&DC’s are exclusively HCR service.There is one inbound from Fort Myers on route 33510 at 1315 and two outbound trips to Fort Myers, one each on 339KE and 328AJ. The 339KE is mail from Memphis and the 328AJ is from Orlando STC.There is not enough space on these trips to transport DPS mail, empty DPS racks, MTE, and all classesof mail. No transportation exists between Fort Myers and any of the SCF 342 offices. All costs per mile used were from the existing routes, as per SWA instructions. Two scenarios were evaluated in transporting the destinating mail (letters and flats) to Manasota SCF 342offices. The first scenario used the existing transportation from the SCF 342 offices round-trip into Fort Myers P&DC for Destinating volumes. This was not cost-effective due to the distance from the SCF 342offices to Fort Myers P&DC. It is approximately 90 miles from the Fort Myers P&DC and Manasota P&DC. The second scenario is both cost-effective and service-responsive. The proposed transportation to support this study will be operated at an increased cost of $1,088,568 from current costs. Theseadditional costs includes a new HCR route, adjusting existing routes 33551, 339KE, 328 AJ, and 32290 totransport destinating volumes from the Manasota P&DC to Fort Myers P&DC (339) and eliminating route 33510. Adjustments to Routes 339KE and 328AJ: 328AJ travels between Fort Myers and the Orlando P&DC. We deleted one round trip from this route, and added an in-line stop on the 339KE (Atlanta STC trip) to Orlando. There was sufficient cube space on the 339KE to handle this move, saving $130,702 in costs. The new HCR route will consist of seven round trips from Fort Myers P&DC directly to Manasota P&DC. These trips are designated to transport destinating volumes to Manasota, and are scheduled to arrive before the existing trips to the AO’s leave. Since these routes are not currently traveled between these plants, new routes will be bid if the AMP study is approved. This may affect the total costs fortransportation. Route 33551 will have six inline stops added at the Fort Myers P&DC. The route will start at Manasota,stop at Tampa P&DC and Fort Myers, and terminate at Manasota. This trip will transport all of the destinating volumes. Manasota sends out between 220 and 290 GPMC’s of DPS mail to its AO’sdepending on the day and time of year. This does not account for non-DPS mail and/or needed MTE. Route 32290 is transportation between Jacksonville NDC and Manasota. Manasota currently receives 5trips from the NDC. They contain both working and direct volumes. Three of these 5 trips will need to take the working volumes on to Fort Myers for processing. This is an added cost of $192,921. Route 33510 will be eliminated due to the in-line stops being added onto route 33551. The elimination of 33510 is a savings of $611,198 annually. Routes 328AJ and 339KE will each have in-line stops at Manasota removed. This is a savings of $12,197. All SCF 342 mail classes, including Priority Mail, Express Mail, Registry, DPS, and Destinating volumes,will be sent directly to/from the Manasota P&DC to all SCF 342 offices. All SCF 342 offices transportation will remain the same at this time. There will not be any savings from those routes given no change inmileage or direction. All of the current Express Mail runs and trips from Manasota P&DC will remain.
EQUIPMENT RELOCATION AND MAINTENANCE IMPACTS The AMP feasibility study projects an annual Maintenance savings of $ 4,250,707. Equipment identified for relocation from the Manasota P&DC to support operations at the Fort Myers FL P&DC includes 1AFSM, 5 powered industrial equipment, and 17 stacker modules. The 4 CIOSS’s will be transferred in from the St Petersburg P&DC. A one-time cost of $ 100,000 will be required for the site preparation, of the relocated equipment indentified. Remaining equipment at the Manasota P&DC will be excessed to other sites with no costs incurred to this AMP study. SPACE IMPACTS If the AMP feasibility study is approved, 255,727 sq ft of the 280,978 interior sq ft Manasota P&DC facilitywill be gained from this AMP. The 255,727 sq ft is the current mail processing area of the work room floorand does not include any office space. This space will be reviewed for other future Function 4 facility consolidations and or closure/ sale once the NODE Study findings are known. IMPLEMENTATION PLAN The implementation of the mail movement would be accomplished in multiple phases. The processing of 3-digit volumes will be transferred first. Then the remainder mail volumes will transfer in the second stage. Due to the complexity of excessing and transportation, the amount of stages is limited. OTHER CONCURRENT INITIATIVES In this feasibility study, volume, staffing and workhours (destinating only) for the Manasota P&DC (342)and Fort Myers P&DC (339, 341) are included, as per the format of the Headquarters AMP feasibility study. Fort Myers currently AMP’s originating mail into Tampa P&DC on Saturdays. Manasota currently AMP’s originating volumes into Tampa 6 days a week. SUMMARY There is a first year savings of $ 8,989,712. The first year savings reflects only the operations included in this AMP study. This figure does not include the relocation costs associated with the remaining mailprocessing equipment at the Manasota P&DC facility. This also does not account for the workload, cost, and savings from other concurrent initiatives being conducted at these facilities. The Manasota P&DC will remain open as a cross dock (hub), BMEU site facility after all mail processing operations have been relocated to Fort Myers until an alternate site is found by the SWA FSO. A NODE Study is being conducted and the full results are not known at this time. The Area Mail Processing project to consolidate all of the Manasota P&DC (342) destinating operations into the Fort Myers Fl P&DC will result in a savings to the Postal Service of approximately $9,521,076 peryear if approved. There are additional savings from the sale of the facility which are not included in the study. This consolidation of operations will increase processing efficiency, create substantial financial savings, and be accomplished with no inconvenience to our customers.
Package Page 7 AMP Summary Narrative
Losing Facility Name and Type:Current 3D ZIP Code(s):
Type of Distribution to Consolidate:
Gaining Facility Name and Type:Current 3D ZIP Code(s):
rev 04/2/2008
24 Hour ClockLast Saved:
Manasota P&DC
Fort Myers
342
January 10, 2013
339, 341
Destinating
80% 100% 100% 100% Millions 100% 100% 86.9%
Wee
kly
Tren
dsBeg
inni
ng D
ay
Faci
lity
Can
celle
d by
200
0D
ata
Sou
rce
= ED
W M
CR
S
OG
P C
lear
ed b
y 23
00D
ata
Sour
ce =
ED
W E
OR
OG
S C
lear
ed b
y 24
00D
ata
Sour
ce =
ED
W E
OR
MM
P C
lear
ed b
y 24
00D
ata
Sour
ce =
ED
W E
OR
MM
P V
olum
e O
n H
and
at 2
400
Dat
a Sou
rce
= ED
W M
CR
S
Mai
l Ass
igne
d C
omm
erci
al /
FedE
x By
0230
Dat
a Sou
rce
= ED
W S
ASS
DPS 2
nd P
ass
Cle
ared
by
0700
Dat
a So
urce
= E
DW
EO
R
Trip
s O
n-Ti
me
0400
- 09
00D
ata
Sour
ce =
ED
W T
IMES
%
16-Apr SAT 4/16 MANASOTA P&DC #VALUE! 100.0% 99.5%23-Apr SAT 4/23 MANASOTA P&DC #VALUE! 100.0% 92.2%30-Apr SAT 4/30 MANASOTA P&DC #VALUE! 100.0% 97.0%7-May SAT 5/7 MANASOTA P&DC #VALUE! 100.0% 97.9%
14-May SAT 5/14 MANASOTA P&DC #VALUE! 99.8% 99.0%21-May SAT 5/21 MANASOTA P&DC #VALUE! 100.0% 100.0%28-May SAT 5/28 MANASOTA P&DC #VALUE! 100.0% 98.3%
4-Jun SAT 6/4 MANASOTA P&DC #VALUE! 99.8% 98.5%11-Jun SAT 6/11 MANASOTA P&DC #VALUE! 100.0% 98.4%18-Jun SAT 6/18 MANASOTA P&DC #VALUE! 99.7% 99.0%25-Jun SAT 6/25 MANASOTA P&DC #VALUE! 99.8% 99.0%
2-Jul SAT 7/2 MANASOTA P&DC #VALUE! 100.0% 97.1%9-Jul SAT 7/9 MANASOTA P&DC #VALUE! 99.7% 99.0%
16-Jul SAT 7/16 MANASOTA P&DC #VALUE! 100.0% 94.7%23-Jul SAT 7/23 MANASOTA P&DC #VALUE! 99.9% 100.0%30-Jul SAT 7/30 MANASOTA P&DC #VALUE! 99.1% 99.5%6-Aug SAT 8/6 MANASOTA P&DC #VALUE! 100.0% 100.0%
13-Aug SAT 8/13 MANASOTA P&DC #VALUE! 100.0% 100.0%20-Aug SAT 8/20 MANASOTA P&DC #VALUE! 100.0% 97.4%27-Aug SAT 8/27 MANASOTA P&DC #VALUE! 99.8% 98.9%
3-Sep SAT 9/3 MANASOTA P&DC #VALUE! 100.0% 95.5%
24 Hour Indicator Report
80% 100% 100% 100% Millions 100% 100% 86.9%
Wee
kly
Tren
dsB
egin
ning
Day
Faci
lity
Can
celle
d by
200
0D
ata
Sou
rce
= E
DW
MC
RS
OG
P C
lear
ed b
y 23
00D
ata
Sou
rce
= ED
W E
OR
OG
S C
lear
ed b
y 24
00D
ata
Sou
rce
= ED
W E
OR
MM
P C
lear
ed b
y 24
00D
ata
Sou
rce
= ED
W E
OR
MM
P V
olum
e O
n H
and
at 2
400
Dat
a S
ourc
e =
ED
W M
CR
S
Mai
l Ass
igne
d C
omm
erci
al /
FedE
x By
023
0D
ata
Sou
rce
= E
DW
SAS
S
DP
S 2
nd P
ass
Cle
ared
by
0700
Dat
a S
ourc
e =
EDW
EO
R
Trip
s O
n-Ti
me
0400
- 09
00D
ata
Sour
ce =
ED
W T
IME
S
%
16-Apr SAT 4/16 FT MYERS P&DC 107.0% 96.6% 66.0% 0.6 100.0% 100.0% 89.0%23-Apr SAT 4/23 FT MYERS P&DC 89.8% 98.8% 60.0% 0.5 100.0% 100.0% 94.9%30-Apr SAT 4/30 FT MYERS P&DC 81.9% 94.7% 100.0% 66.8% 0.4 100.0% 100.0% 91.4%7-May SAT 5/7 FT MYERS P&DC 90.4% 100.0% 100.0% 68.4% 0.3 100.0% 100.0% 99.5%
14-May SAT 5/14 FT MYERS P&DC 93.0% 100.0% 100.0% 63.0% 0.4 100.0% 100.0% 96.9%21-May SAT 5/21 FT MYERS P&DC 91.1% 99.7% 95.0% 67.1% 0.3 100.0% 100.0% 96.6%28-May SAT 5/28 FT MYERS P&DC 83.7% 100.0% 100.0% 69.2% 0.1 100.0% 100.0% 96.2%
4-Jun SAT 6/4 FT MYERS P&DC 89.3% 100.0% 100.0% 72.0% 0.2 100.0% 100.0% 99.0%11-Jun SAT 6/11 FT MYERS P&DC 87.6% 100.0% 100.0% 72.4% 0.3 100.0% 100.0% 96.8%18-Jun SAT 6/18 FT MYERS P&DC 88.4% 100.0% 100.0% 62.2% 0.2 100.0% 100.0% 99.8%25-Jun SAT 6/25 FT MYERS P&DC 80.8% 99.9% 100.0% 74.2% 0.2 100.0% 100.0% 99.5%
2-Jul SAT 7/2 FT MYERS P&DC 80.7% 100.0% 69.3% 0.2 100.0% 100.0% 98.9%9-Jul SAT 7/9 FT MYERS P&DC 91.9% 100.0% 75.6% 0.2 100.0% 100.0% 99.8%
16-Jul SAT 7/16 FT MYERS P&DC 88.6% 100.0% 72.0% 0.1 100.0% 100.0% 99.8%23-Jul SAT 7/23 FT MYERS P&DC 88.0% 100.0% 71.1% 0.1 100.0% 100.0% 99.5%30-Jul SAT 7/30 FT MYERS P&DC 87.3% 100.0% 70.5% 0.1 100.0% 100.0% 96.9%6-Aug SAT 8/6 FT MYERS P&DC 88.5% 100.0% 64.6% 0.2 100.0% 100.0% 96.9%
13-Aug SAT 8/13 FT MYERS P&DC 84.9% 100.0% 68.8% 0.1 100.0% 100.0% 96.9%20-Aug SAT 8/20 FT MYERS P&DC 85.4% 100.0% 60.7% 0.2 100.0% 100.0% 96.7%27-Aug SAT 8/27 FT MYERS P&DC 82.2% 100.0% 65.6% 0.1 100.0% 100.0% 94.8%3-Sep SAT 9/3 FT MYERS P&DC 96.6% 98.9% 69.6% 0.2 100.0% 100.0% 94.0%
24 Hour Indicator Report
Package Page 8 AMP 24 Hour Clock
Last Saved:
Losing Facility Name and Type:Current 3D ZIP Code(s):
Miles to Gaining Facility:
Gaining Facility Name and Type:Current 3D ZIP Code(s):
Service Standard Changes - Average Daily Volume (data obtained from ODIS is derived from sampling and may vary from actual volume)
PSVC ALL CLASSES
rev 10/16/2009
Losing Facility 3D ZIP Code(s):
mm/dd/yyyy
Selected summary fields are transferred to the Executive Summary
PER STD
January 10, 2013
Losing Facility:
Service Standard Impacts
PRI ALL CLASSESSTD *FCM PER *
Based on report prepared by Network Integration Support dated:
Last Saved:
Package Page 10 AMP Service Standard Impacts
Last Saved: Stakeholder Notification Page 1AMP Event: Start of Study
rev 07/16/2008
Stakeholders Notification Losing Facility:
January 10, 2013(WorkBook Tab Notification - 1)Manasota P&DC
Package Page 11 AMP Stakeholders Notification
Last Saved:
01/01/11 <<=== : ===>> 12/31/11
LDC LDC LDC LDC
11 $46.96 41 $0.00 11 $47.61 41 $0.00
12 $48.05 42 $0.00 12 $40.49 42 $0.00
13 $54.39 43 $0.00 13 $46.38 43 $0.00
14 $46.54 44 $0.00 14 $47.66 44 $0.00
15 $38.35 45 $0.00 15 $41.85 45 $0.00
16 $0.00 46 $0.00 16 $0.00 46 $0.00
17 $44.63 47 $0.00 17 $42.13 47 $0.00
18 $43.11 48 $0.00 18 $38.41 48 $36.99
(1) (2) (3) (4) (5) (6) (7) (8) (9) (10) (11) (12) (13) (14)Current Current Current Current Current Current Current Current Current Current Current Current
Operation Annual FHP Annual TPH or Annual Productivity Annual Operation Annual FHP Annual TPH or Annual Productivity AnnualNumbers Volume NATPH Volume Workhours (TPH or NATPH) Workhour Costs Numbers Volume NATPH Volume Workhours (TPH or NATPH) Workhour Costs
Losing Facility: Gaining Facility:Date Range of Data:
Function 1
Gaining Current Workhour Rate by LDC
Function 4
Package Page 12 AMP Workhour Costs - Current
(1) (2) (3) (4) (5) (6) (7) (8) (9) (10) (11) (12) (13) (14)Current Current Current Current Current Current Current Current Current Current Current Current
Operation Annual FHP Annual TPH or Annual Productivity Annual Operation Annual FHP Annual TPH or Annual Productivity AnnualNumbers Volume NATPH Volume Workhours (TPH or NATPH) Workhour Costs Numbers Volume NATPH Volume Workhours (TPH or NATPH) Workhour Costs
Moved to Gain 399,857,140 1,095,864,677 234,154 4,680 $10,770,678 Impact to Gain 522,671,559 1,809,941,363 395,002 4,582 $17,350,411Impact to Lose 0 0 0 No Calc $0 Moved to Lose 0 0 0 No Calc $0Total Impact 399,857,140 1,095,864,677 234,154 4,680 $10,770,678 Total Impact 522,671,559 1,809,941,363 395,002 4,582 $17,350,411Non-impacted 0 0 10,484 No Calc $466,938 Non-impacted 0 0 4,567 No Calc $192,380
Gain Only 119,585,994 262,570,628 114,598 2,291 $5,159,316All 399,857,140 1,095,864,677 244,637 4,480 $11,237,616 All 642,257,553 2,072,511,991 514,166 4,031 $22,702,107
Impact to Gain 922,528,699 2,905,806,040 629,156 4,619 $28,121,089Impact to Lose 0 0 0 No Calc $0Total Impact 922,528,699 2,905,806,040 629,156 4,619 $28,121,089Non-impacted 0 0 15,050 No Calc $659,318
Gain Only 119,585,994 262,570,628 114,598 2,291 $5,159,316All 1,042,114,693 3,168,376,668 758,804 4,175 $33,939,723
.
rev 06/11/2008
Comb Totals
Totals Totals
(This number is carried forward to AMP Worksheet Executive Summary )
Combined Current Workhour Annual Workhour Costs :
1,289,862 Total FHP to be Transferred (Average Daily Volume) :
(This number is carried forward to the bottom of AMP Worksheet Workhour Costs-Proposed )$33,939,723
Current FHP at Gaining Facility (Average Daily Volume) : 2,071,799 (This number is carried forward to AMP Worksheet Executive Summary )
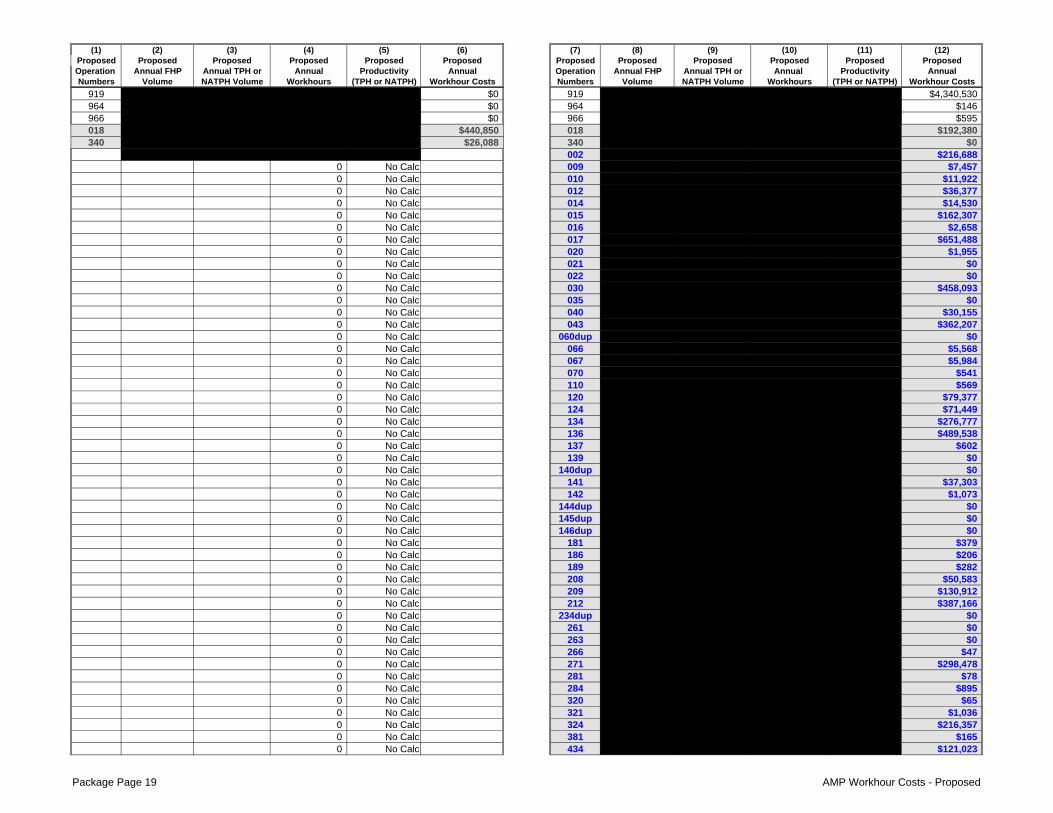
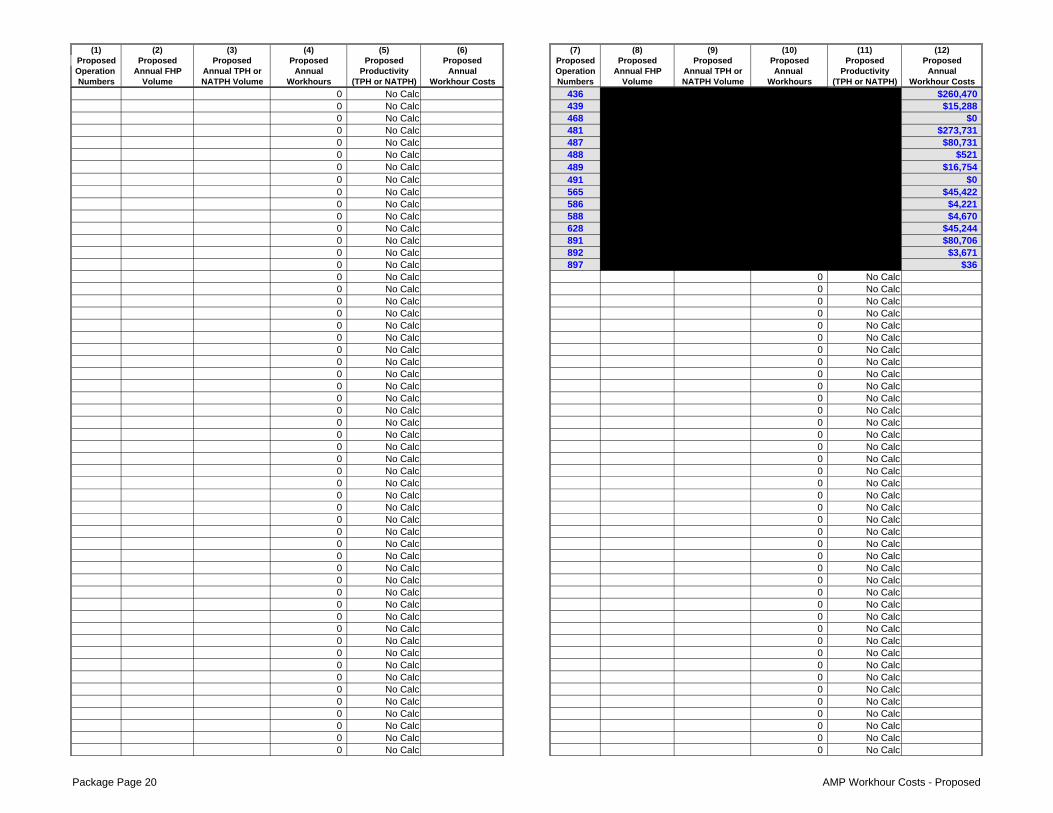
0 No Calc 436 0 1,377,064 5,616 245.2 $260,4700 No Calc 439 80,821 80,821 330 245.2 $15,2880 No Calc 468 0 565,118 0 No Calc $00 No Calc 481 43,859,419 45,002,777 5,750 7,827.0 $273,7310 No Calc 487 0 445,684 1,929 231.1 $80,7310 No Calc 488 0 109,531 11 10,000.0 $5210 No Calc 489 0 3,519,223 352 10,000.0 $16,7540 No Calc 491 0 0 0 No Calc $00 No Calc 565 0 0 1,183 No Calc $45,4220 No Calc 586 0 0 110 No Calc $4,2210 No Calc 588 0 0 122 No Calc $4,6700 No Calc 628 0 511,135 975 524.0 $45,2440 No Calc 891 13,940,434 14,111,375 1,695 8,324.3 $80,7060 No Calc 892 0 641,797 77 8,324.3 $3,6710 No Calc 897 1,248 6,374 1 8,324.3 $360 No Calc 0 No Calc0 No Calc 0 No Calc0 No Calc 0 No Calc0 No Calc 0 No Calc0 No Calc 0 No Calc0 No Calc 0 No Calc0 No Calc 0 No Calc0 No Calc 0 No Calc0 No Calc 0 No Calc0 No Calc 0 No Calc0 No Calc 0 No Calc0 No Calc 0 No Calc0 No Calc 0 No Calc0 No Calc 0 No Calc0 No Calc 0 No Calc0 No Calc 0 No Calc0 No Calc 0 No Calc0 No Calc 0 No Calc0 No Calc 0 No Calc0 No Calc 0 No Calc0 No Calc 0 No Calc0 No Calc 0 No Calc0 No Calc 0 No Calc0 No Calc 0 No Calc0 No Calc 0 No Calc0 No Calc 0 No Calc0 No Calc 0 No Calc0 No Calc 0 No Calc0 No Calc 0 No Calc0 No Calc 0 No Calc0 No Calc 0 No Calc0 No Calc 0 No Calc0 No Calc 0 No Calc0 No Calc 0 No Calc0 No Calc 0 No Calc0 No Calc 0 No Calc0 No Calc 0 No Calc0 No Calc 0 No Calc0 No Calc 0 No Calc0 No Calc 0 No Calc
0 No Calc 0 No Calc0 No Calc 0 No Calc0 No Calc 0 No Calc0 No Calc 0 No Calc0 No Calc 0 No Calc0 No Calc 0 No Calc0 No Calc 0 No Calc0 No Calc 0 No Calc0 No Calc 0 No Calc0 No Calc 0 No Calc0 No Calc 0 No Calc0 No Calc 0 No Calc0 No Calc 0 No Calc0 No Calc 0 No Calc0 No Calc 0 No Calc0 No Calc 0 No Calc0 No Calc 0 No Calc0 No Calc 0 No Calc0 No Calc 0 No Calc0 No Calc 0 No Calc0 No Calc 0 No Calc0 No Calc 0 No Calc0 No Calc 0 No Calc0 No Calc 0 No Calc0 No Calc 0 No Calc0 No Calc 0 No Calc0 No Calc 0 No Calc0 No Calc 0 No Calc0 No Calc 0 No Calc0 No Calc 0 No Calc0 No Calc 0 No Calc0 No Calc 0 No Calc0 No Calc 0 No Calc0 No Calc 0 No Calc0 No Calc 0 No Calc0 No Calc 0 No Calc0 No Calc 0 No Calc0 No Calc 0 No Calc0 No Calc 0 No Calc0 No Calc 0 No Calc0 No Calc 0 No Calc0 No Calc 0 No Calc0 No Calc 0 No Calc0 No Calc 0 No Calc0 No Calc 0 No Calc0 No Calc 0 No Calc0 No Calc 0 No Calc0 No Calc 0 No Calc0 No Calc 0 No Calc0 No Calc 0 No Calc0 No Calc 0 No Calc0 No Calc 0 No Calc0 No Calc 0 No Calc0 No Calc 0 No Calc0 No Calc 0 No Calc
0 No Calc 0 No Calc0 No Calc 0 No Calc0 No Calc 0 No Calc0 No Calc 0 No Calc0 No Calc 0 No Calc0 No Calc 0 No Calc0 No Calc 0 No Calc0 No Calc 0 No Calc0 No Calc 0 No Calc0 No Calc 0 No Calc0 No Calc 0 No Calc0 No Calc 0 No Calc0 No Calc 0 No Calc0 No Calc 0 No Calc0 No Calc 0 No Calc0 No Calc 0 No Calc0 No Calc 0 No Calc0 No Calc 0 No Calc0 No Calc 0 No Calc0 No Calc 0 No Calc0 No Calc 0 No Calc0 No Calc 0 No Calc0 No Calc 0 No Calc0 No Calc 0 No Calc0 No Calc 0 No Calc0 No Calc 0 No Calc0 No Calc 0 No Calc0 No Calc 0 No Calc0 No Calc 0 No Calc0 No Calc 0 No Calc0 No Calc 0 No Calc0 No Calc 0 No Calc0 No Calc 0 No Calc0 No Calc 0 No Calc0 No Calc 0 No Calc0 No Calc 0 No Calc0 No Calc 0 No Calc0 No Calc 0 No Calc0 No Calc 0 No Calc0 No Calc 0 No Calc0 No Calc 0 No Calc0 No Calc 0 No Calc0 No Calc 0 No Calc0 No Calc 0 No Calc0 No Calc 0 No Calc0 No Calc 0 No Calc0 No Calc 0 No Calc0 No Calc 0 No Calc0 No Calc 0 No Calc0 No Calc 0 No Calc0 No Calc 0 No Calc0 No Calc 0 No Calc0 No Calc 0 No Calc0 No Calc 0 No Calc0 No Calc 0 No Calc
0 No Calc 0 No Calc0 No Calc 0 No Calc0 No Calc 0 No Calc0 No Calc 0 No Calc0 No Calc 0 No Calc0 No Calc 0 No Calc0 No Calc 0 No Calc0 No Calc 0 No Calc0 No Calc 0 No Calc0 No Calc 0 No Calc0 No Calc 0 No Calc0 No Calc 0 No Calc0 No Calc 0 No Calc0 No Calc 0 No Calc0 No Calc 0 No Calc0 No Calc 0 No Calc0 No Calc 0 No Calc0 No Calc 0 No Calc0 No Calc 0 No Calc0 No Calc 0 No Calc0 No Calc 0 No Calc0 No Calc 0 No Calc0 No Calc 0 No Calc0 No Calc 0 No Calc0 No Calc 0 No Calc0 No Calc 0 No Calc0 No Calc 0 No Calc0 No Calc 0 No Calc0 No Calc 0 No Calc0 No Calc 0 No Calc0 No Calc 0 No Calc0 No Calc 0 No Calc0 No Calc 0 No Calc0 No Calc 0 No Calc0 No Calc 0 No Calc0 No Calc 0 No Calc0 No Calc 0 No Calc0 No Calc 0 No Calc0 No Calc 0 No Calc0 No Calc 0 No Calc0 No Calc 0 No Calc
Moved to Gain 0 76,533 14,734 5 $654,534 Impact to Gain 922,528,699 2,905,729,507 562,413 5,167 $24,802,621Impact to Lose 0 0 0 No Calc $0 Moved to Lose 0 0 0 No Calc $0Total Impact 0 76,533 14,734 5 $654,534 Total Impact 922,528,699 2,905,729,507 562,413 5,167 $24,802,621Non Impacted 0 0 10,484 No Calc $466,938 Non Impacted 0 0 4,567 No Calc $192,380
Gain Only 119,585,994 262,570,628 110,580 2,374 $4,963,757All 0 76,533 25,218 3 $1,121,472 All 1,042,114,693 3,168,300,135 677,560 4,676 $29,958,758
Notes:1) less Ops going to 'Trans-PVS' & 'Maintenance' Tabs
2) going to Trans-PVS tab3) going to Maintenance tab
Supervisory Ops
ChangeProposed + Special Adjustments - Combined -Current - Combined
Workhour Change
(1,929)(114,882)
(17,354)Maintenance Ops (note 3)
Transportation Ops (note 2)
Summary by FacilitySpecial Adjustments at Losing Site
(835)Supv/Craft Joint Ops (note 4)Total (149,778)
Supervisory
LDC Proposed Annual Workhours
Proposed Annual Workhour Cost ($)
Supervisor Summary Supervisor Summary
LDC Current Annual Workhours
Current Annual Workhour Cost
($)LDC Current Annual
Workhours
Current Annual Workhour Cost
($)
Maintenance
Current Annual Workhours
Maintenance
Proposed Annual Workhour Cost ($)
Proposed Annual WorkhoursLDCProposed Annual
WorkhoursLDC
Proposed Annual Workhours
Losing Facility Summary
Combined Summary
Proposed Annual Workhours
Proposed Annual Workhour Cost
($)
Proposed Annual Workhour Cost
($)
Proposed Annual Workhours
Proposed MODS
Operation Number
Proposed Annual Workhours
Proposed Annual Workhour Cost
($)
Proposed MODS
Operation Number
Proposed Annual Workhour Cost
($)
Special Adjustments at Gaining Site
Maintenance
Current Annual Workhour Cost
($)
Summary by Sub-GroupSpecial Adjustments -
Combined -
Gaining Facility Summary
Maintenance
LDC LDCCurrent Annual Workhours
Current Annual Workhour Cost
($)
Proposed Annual Workhour Cost ($)
Supervisory
LDC Proposed Annual Workhours
Proposed Annual Workhour Cost ($)
Package Page 30 AMP Other Curr vs Prop
rev 06/17/2008
Package Page 31 AMP Other Curr vs Prop
Last Saved:
Losing Facility:Data Extraction Date:
(2) (3) (4) (5) (6)
Level Current Auth Staffing
Current On-Rolls
Proposed Staffing Difference
1 EAS-25 1 0 0 0
2 EAS-22 2 2 0 -2
3 EAS-22 1 1 0 -1
4 EAS-19 1 1 0 -1
5 EAS-19 1 1 0 -1
6 EAS-18 1 1 0 -1
7 EAS-17 2 1 0 -1
8 EAS-17 7 7 1 -6
9 EAS-17 6 4 0 -4
10 EAS-16 1 1 0 -1
11 EAS-12 1 1 0 -1
12 0
13141516171819202122232425262728293031
Staffing - Management
115605
January 10, 2013
Manasota P&DC
Line
(1)
Position TitleMGR PROCESSING/DISTRIBUTION
Management Positions
SUPV DISTRIBUTION OPERATIONSSUPV MAINTENANCE OPERATIONSNETWORKS SPECIALISTADMINISTRATIVE ASSISTANT (FLD)
Finance Number:
MGR DISTRIBUTION OPERATIONSMGR MAINTENANCEMGR MAINTENANCE OPERATIONSMGR MAINTENANCE OPERATIONS SUPPTOPERATIONS SUPPORT SPECIALISTOPERATIONS SUPPORT SPECIALIST
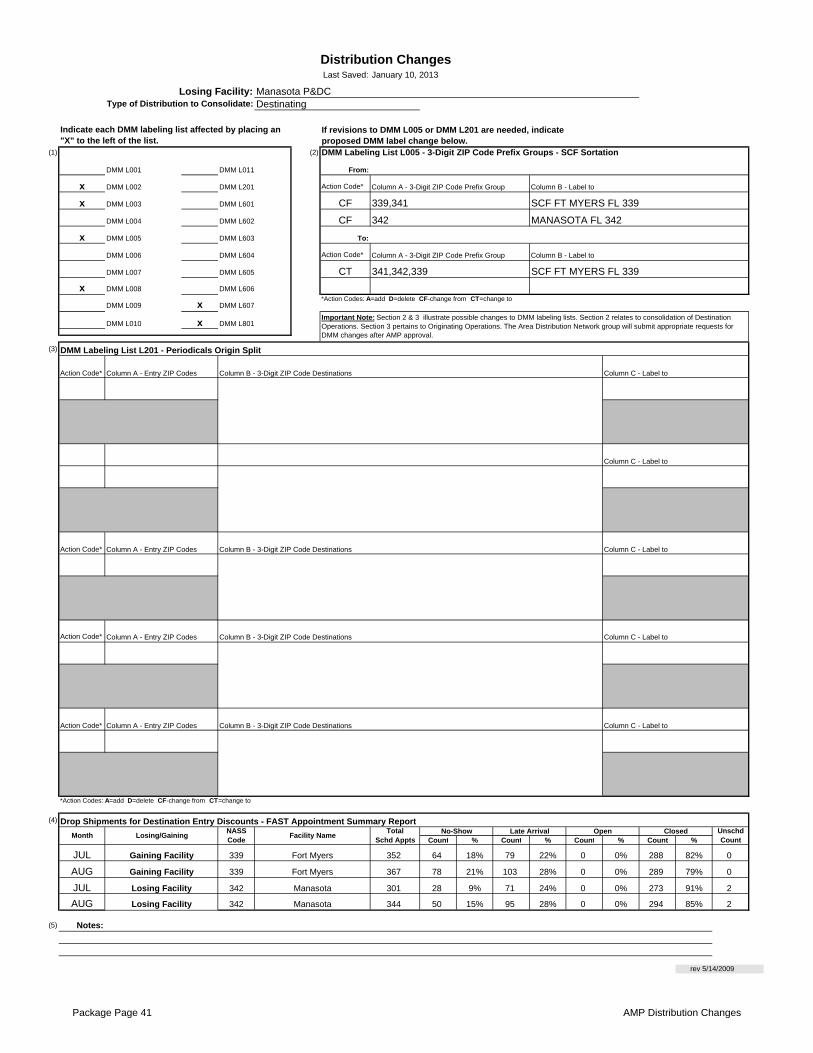
x DMM L201 Action Code* Column A - 3-Digit ZIP Code Prefix Group
x DMM L601 CF
DMM L602 CF
x DMM L603 To:
DMM L604 Action Code* Column A - 3-Digit ZIP Code Prefix Group
DMM L605 CTx DMM L606
x DMM L607
x DMM L801
(3)
Action Code*
Action Code*
Action Code*
Action Code*
(4)
Count % Count % Count % Count %
JUL 339 352 64 18% 79 22% 0 0% 288 82% 0
AUG 339 367 78 21% 103 28% 0 0% 289 79% 0
JUL 342 301 28 9% 71 24% 0 0% 273 91% 2
AUG 342 344 50 15% 95 28% 0 0% 294 85% 2
(5) Notes:
*Action Codes: A=add D=delete CF-change from CT=change to
Important Note: Section 2 & 3 illustrate possible changes to DMM labeling lists. Section 2 relates to consolidation of Destination Operations. Section 3 pertains to Originating Operations. The Area Distribution Network group will submit appropriate requests for DMM changes after AMP approval.
Column A - Entry ZIP Codes Column B - 3-Digit ZIP Code Destinations Column C - Label to
Column A - Entry ZIP Codes Column B - 3-Digit ZIP Code Destinations Column C - Label to
SCF FT MYERS FL 339
DMM L009
DMM L010
DMM L005
DMM L006
DMM L007
DMM L008
341,342,339
DMM L003
DMM L004 MANASOTA FL 342
DMM L001
DMM L002
342
Distribution Changes
Indicate each DMM labeling list affected by placing an "X" to the left of the list.
Losing Facility:Type of Distribution to Consolidate:
If revisions to DMM L005 or DMM L201 are needed, indicate proposed DMM label change below.
Last Saved: January 10, 2013
Manasota P&DC
DMM Labeling List L005 - 3-Digit ZIP Code Prefix Groups - SCF Sortation
339,341
Column B - Label to
SCF FT MYERS FL 339
*Action Codes: A=add D=delete CF-change from CT=change to
Column B - Label to
rev 5/14/2009
Drop Shipments for Destination Entry Discounts - FAST Appointment Summary ReportMonth Losing/Gaining NASS
Code Facility Name Total Schd Appts
Unschd Count
Gaining Facility Fort Myers
Gaining Facility Fort Myers
No-Show Late Arrival Open Closed
Losing Facility Manasota
Losing Facility Manasota
DMM Labeling List L201 - Periodicals Origin Split
Column A - Entry ZIP Codes Column B - 3-Digit ZIP Code Destinations Column C - Label to
Column C - Label to
Column A - Entry ZIP Codes Column B - 3-Digit ZIP Code Destinations Column C - Label to
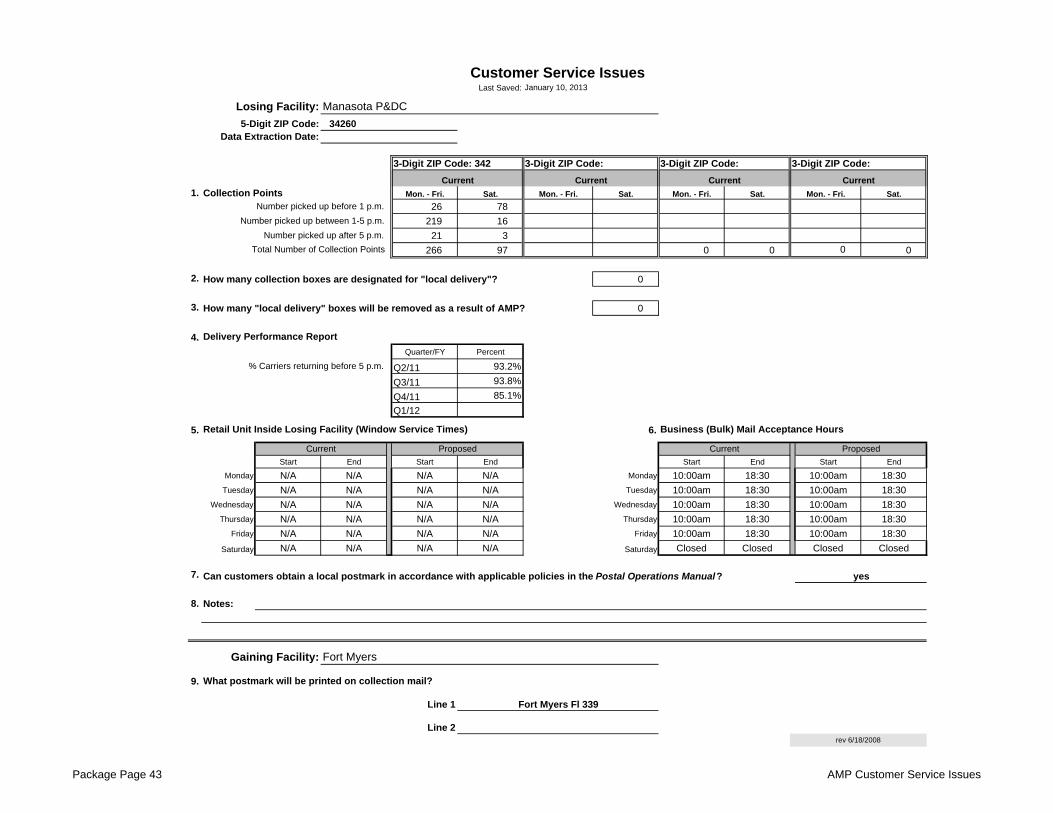
Can customers obtain a local postmark in accordance with applicable policies in the Postal Operations Manual?
Gaining Facility:
What postmark will be printed on collection mail?
Proposed
% Carriers returning before 5 p.m.
Mon. - Fri.
Customer Service Issues
Current Proposed
Number picked up after 5 p.m. Number picked up between 1-5 p.m.
Total Number of Collection Points
Delivery Performance Report
Retail Unit Inside Losing Facility (Window Service Times)
Losing Facility:5-Digit ZIP Code:
Data Extraction Date:
3-Digit ZIP Code: 342
Number picked up before 1 p.m.
Business (Bulk) Mail Acceptance Hours
Fort Myers
yes
0
Package Page 43 AMP Customer Service Issues
Last Saved:
1.
2. Lease Information. (If not leased skip to 3 below.)
3.
4. Planned use for acquired space from approved AMP
5. Facility Costs
(This number shown below under One-Time Costs section.
6. Savings Information
(This number carried forward to the Executive Summary )
7. Notes
(This number carried forward to Executive Summary )
$100,000
$531,364
850 Tellevast RoadSarasota, FL 34260
Ownedn/a
$0
Manasota to Fort Myers is 90 miles. Relocation will need to be paid for the mail handlers that
$250,000
Facility Costs:
Manasota P&DC Fort Myers
Space Evaluation and Other Costs
Street Address:City, State ZIP:
Losing Facility:
Space Evaluation
Affected FacilityFacility Name:
January 10, 2013
Manasota P&DC
Manasota P&DC
Mail Processing Equipment Relocation Costs: (from MPE Inventory )
Space Savings ($):
One-Time Costs
Employee Relocation Costs:
go to FTM. Any clerk that does not remain at Manasota or receives a residual with in 50 miles willbe placed on Stand-By until a position is opened.
$181,364
Gaining Facility:Losing Facility:
n/a
280,978255,727
$100,000
The space on the work room floor will be de-activated storage. The dock will be use for cross dockoperaitons. The BMEU will remain as it is now. A NODE study is being conducted at this time to determine if worth of the facility and if it should be sold.
Enter any projected one-time facility costs:
Enter annual lease cost:
Enter the total interior square footage of the facility:Enter gained square footage expected with the AMP:
Enter lease options/terms:
Current Square Footage
Enter lease expiration date:
(from above)
Total One-Time Costs:
Remote Encoding Center Cost per 1000
Package Page 44 AMP Space Evaluation and Other Costs