Two major goals in the development of new DNA typing tech-nology for forensic use have always been: (1) to achieve the high-est power of discrimination possible using a valid and reliablemethod, and (2) to preserve limited evidentiary samples by utiliz-ing the smallest portion possible for analysis. The discovery of theSTR markers (1–3) as well as the development of fluorescence de-tection instruments (4–9) provided forensic scientists with sophis-ticated means of achieving their original goals. The development ofhighly discriminatory megaplex STR systems used in a fluores-cence-based detection mode significantly increased the capabilityfor analyzing a larger number of samples that have a limitedamount of biological material (10–16). This combined approachoffered great sensitivity and accuracy as well as facilitated the in-terpretation of DNA mixtures by providing data, such as peakheight and peak area, that can be integrated into formulas and sub-sequently analyzed to assist in profile interpretation (17–20).
Many validation studies have been published that indicate thatSTR systems, in multiplex formats, provide excellent typing resultsfor samples subjected to a variety of environmental and experi-mental conditions (15,21–27). Despite this valuable information,newly developed STR multiplex systems must be subjected, by thepracticing forensic community, to a thorough examination in orderto define their limitations and establish their robustness and relia-bility under specific circumstances and/or experimental conditions.
Only from such studies can scientifically sound interpretationguidelines be derived and a universal consensus for data sharingamong different forensic laboratories be obtained.
This report presents some of the studies that were conducted dur-ing the validation of the AmpF�STR® Profiler Plus™ STR ampli-fication system using reduced PCR volume conditions (i.e., 25�L). Although the manufacturers of the AmpF�STR® commercialkits recommend the use of 50 �L as the PCR volume (15,28), pre-vious experience gained using STR multiplexes under reducedPCR volume conditions (21,29) and our involvement in the FBISTR Standardization Project suggested the evaluation of the am-plification conditions described in this report. Six different cate-gories of Profiler Plus™ profiles were defined following the pro-cessing of 275 biological evidence in 25-�L PCR volume.Examples for each category are presented along with data collectedand used to develop our interpretation guidelines. As a means toimprove the odds of obtaining balanced and complete profiles forcasework samples showing partial profiles or profiles with a slope,several amplification conditions are presented. In addition, a seriesof simulated mixtures representing ten different mixture scenarioswas prepared to establish the limit of detection of a minor profileusing the Profiler Plus™ multiplex system. Two different amountsof total DNA (1 and 2 ng) and different ratios ranging from 1:20 to20:1 were selected to cover a wide range of potential caseworkmixtures. Finally, the specificity of the Profiler Plus™ multiplexamplification reaction was also examined under reduced PCR vol-ume conditions using a large spectrum of nonhuman DNAs, vary-ing the amounts of template DNA (2.5 and 50 ng). The results ob-tained from these studies are described below.
Chantal J. Frégeau,1 Ph.D.; Kathy L. Bowen,1 B.Sc.; Benoît Leclair,1,2 Ph.D.; Isabelle Trudel,1 M.Sc.;Lucy Bishop,1 B.Sc.; and Ron M. Fourney,1 Ph.D.
AmpF�STR® Profiler Plus™ Short TandemRepeat DNA Analysis of Casework Samples,Mixture Samples, and Nonhuman DNA SamplesAmplified under Reduced PCR VolumeConditions (25 �L)
ABSTRACT: As part of the validation of the AmpF�STR® Profiler Plus™ short tandem repeat (STR) system, under reduced polymerase chain re-action (PCR) volume conditions (i.e., 25 �L), a total of 275 casework samples were processed. Examples of profiles are presented along with am-plification conditions to improve the odds of obtaining balanced and complete profiles for samples showing partial results or profiles with a de-scending slope. Data collected and used to develop our interpretation guidelines are included. From the mixture studies, full profiles were obtainedfor minor contributors, using 2 ng of DNA, with ratios of 10:1 or 1:20 and using 1 ng of DNA, with ratios of 10:1 and 1:8. The specificity of theProfiler Plus™ amplification reaction performed in 25 �L was examined and confirmed using a large spectrum of nonhuman DNAs. This reportsupports the use of the AmpF�STR® Profiler Plus™ STR system for casework DNA typing under reduced PCR volume conditions.
J Forensic Sci, September 2003, Vol. 48, No. 5Paper ID JFS2002188_485
Available online at: www.astm.org
1
1 Royal Canadian Mounted Police, Forensic Laboratory Services, NationalDNA Data Bank of Canada, 1200 Vanier Parkway, Ottawa, Ontario.
2 Myriad Genetic Laboratories, 320 Wakara Way, Salt Lake City, Utah.Received 29 May 2002; and in revised form 2 Nov. 2002; accepted 30 March
2003; published 4 Aug. 2003.
2 JOURNAL OF FORENSIC SCIENCES
Methods
DNA Extraction and Quantitation
Casework specimens from the RCMP and the Bureau of Crimi-nal Apprehension of the State of Minnesota, as well as blood fromanimals, were subjected to standard DNA extraction protocols us-ing organic solvents and ethanol precipitation (30). Differential ex-tractions were performed on specimens potentially containing se-men in order to separate the female cell component (referred to asthe F2 fraction) from the male cell component (F3 fraction) (30).All DNA extracts were further purified using Microcon-100 size-exclusion columns (Amicon Inc., Beverly, MA) following the rec-ommendations from the manufacturer and stored at �20°C in fil-tered, autoclaved, and deionized (FAD) water.
Quantitation of human genomic DNA extracted from the RCMPcasework samples was determined using a slot blot hybridizationprocedure with chemiluminescence-based detection (31). A bio-tinylated primate-specific D17Z1 �-satellite probe was used to hy-bridize to the casework and reference samples, i.e., two-fold serialdilutions of the control cell line GM9947A (32; NIST StandardReference Material No. 2391 PCR-based DNA Profiling Kit) im-mobilized on a membrane. Nonhuman DNA samples were quanti-fied by UV spectrophotometry and by spectrofluorometry using aPicoGreen-based assay (Molecular Probes, Inc., Eugene, OR).
Amplification Conditions
Simultaneous amplification of the nine STR systems comprisedin the AmpF�STR® Profiler Plus™ amplification system (28), aswell as the gender determination marker, amelogenin, was con-ducted in a 25-�L final reaction volume containing 2.5 ng of ge-nomic DNA (or as specified in the text or in the figure legends; ina total sample volume of 10 �L, with FAD water completing thevolume), 9.5 �L of the AmpF�STR PCR Reaction Mix, 5 �L of theAmpF�STR Profiler Plus™ Primer Set Solution and 0.5 �L ofAmpliTaq Gold™ DNA Polymerase (5 U/�L stock). The reagentswere kept in the same proportions for DNA samples amplified infinal volumes of 5 and 10 �L. In these cases, the amounts of inputDNA tested were 0.5, 1, and 2 ng; the DNA aliquots were dried outin the amplification tubes under vacuum prior to the addition of thecocktail mix and oil to prevent evaporation.
The reaction mixtures were subjected to a hot start at 95°C for 11min in order to activate the AmpliTaq Gold™ DNA Polymerase.Amplifications were carried out for 28 cycles using the followingparameters: denaturation for 60 s at 94°C, annealing of primers for90 s at 59°C, and extension for 90 s at 72°C. These cycling param-eters differ from those recommended by the manufacturer of theAmpF�STR® Profiler Plus™ kit. An increase in the annealing stepand the extension step by 30 s (i.e., using 90 s instead of 60 s foreach cycle) was found to enhance the yield of amplicons by a fac-tor of 2 to 3 in reduced amplification volumes (33). A final exten-sion at 60°C for 45 min, followed by an overnight incubation atroom temperature, were also included as these conditions were re-quired to promote the 3� terminal transferase activity of the Ampli-Taq Gold™ DNA Polymerase. All amplifications were conductedusing a Perkin Elmer GeneAmp™PCR System 9600 thermal cy-cler and thin-walled 0.2-mL MicroAmp™Reaction Tubes.
Analysis of Profiler Plus™ Fluorescent Amplification Products
An aliquot of 1 to 1.5 �L of each PCR reaction was mixed with0.5 �L of ABI GeneScan-500 Internal Lane Size Standard (labeledwith 6-carboxy-X-rhodamine [ROX, a fluorescent dye from ABI])
and 4 �L of denaturing loading buffer (20 mg/mL blue dextran, 7.3M urea, 2X TBE, 20 mM EDTA). Following denaturation at 95°Cfor 2 to 3 min, samples were snap-cooled in ice-cold water and 1.5-�L aliquots were loaded on a 4% (19:1) acrylamide:bisacrylamidegel containing 6 M urea (36-cm well-to-read glass plate format;prerun at constant voltage (1000 V) for 30 min and equilibrated to51°C). Electrophoresis was conducted for 2.5 h at constant voltage(3000 V) in 1X TBE using an ABI PRISM® 377 DNA Sequencerwith the laser power set at 40 mW. Allele sizes were determined us-ing the GeneScan® Analysis v.2.1 software and the Local Southernsize calling method. Automatic allele designation was achieved us-ing the Genotyper® v.2.0 software (Applied Biosystems Divisionof Perkin Elmer).
Validation Experiments
Casework Study
In total, 275 miscellaneous samples (111 knowns, 164 questionedsources) representing 48 cases (22 homicides, 19 sexual assaults, 7other crimes such as incest, impaired driving causing death, andbreak and enter) were examined. These samples were provided asDNA extracts remaining from concluded RFLP and PCR cases bythe Royal Canadian Mounted Police (RCMP) Biology OperationsSection (38 cases dated 1990–1994) and by the Bureau of CriminalApprehension of the State of Minnesota (ten cases dated1994–1996). The known samples consisted of 99 bloodstains, sevenscalp hair samples, three pubic hair samples, one semen sample, andone saliva sample. The questioned specimens consisted of 94 blood-stains, four hair samples, 25 semen stains, 28 vaginal swabs, threepubic hair samples in cervix (three separate and distinct samples),seven anal/rectal swabs, one sample of fingernail scrapings, onesample of human tissue, and one cigarette butt.
Following DNA quantitation, 33 of the 275 samples showedvery light chemiluminescence signals (�0.2 ng of total DNA) or nosignals at all. Only specimens with larger amounts of DNA (i.e.,�0.2 ng of total DNA) were processed further. For some samples(those � 2.5 ng of total DNA), the entire DNA extract was con-sumed during PCR amplification, but, in the majority of cases, 2.5ng of DNA were used in a 25-�L PCR reaction volume with 28 cy-cles of amplification.
Mixture Study
DNA extracts from blood of 14 individuals (males and females),selected from one of the RCMP Caucasian databases, were used toprepare ten different mixture scenarios (Table 1). The amount oftotal template DNA used was set at both 1 and 2 ng in ratios rang-ing from 20:1 to 1:20 (i.e., 20:1, 10:1, 8:1, 6:1, 4:1, 2:1, 1:1, 1:2,1:4, 1:6, 1:8, 1:10, 1:20).
NonHuman DNA Study
The specificity of the primer sets included in AmpF�STR® Pro-filer Plus™ was evaluated under reduced PCR volume conditionsusing different amounts of DNA from a large survey of animals andmicroorganisms from the vaginal flora and intestinal tract. Manyrepresentatives from the higher primates were evaluated, and re-sults for those samples will be presented in another paper. The 26nonprimate species and number of specimens tested included: dog[6], cat [3], pig [4], cow [5], horse [5], mouse [5], hamster [1],sheep [6], goat [4], deer [11], moose [2], bison [2], elk [3], caribou[2], antelope [2], lemming [2], kangaroo [1], ostrich [2], goose [1],whale [2], dolphin [1], penguin [3], shark [2], fish [14], turtle [2],
sea lamprey [1]. The 13 bacterial and yeast strains examined in-cluded: Bacteroides vulgatis, Bacteroides fragilis, Bacteroidesthetaiotaomicon, Streptococcus agalactiae, Streptococcus inter-medius, Clostridium perfringens, Gardnerella vaginalis, Lacto-bacillus acidophilus, Lactobacillus fermentum, Peptostreptococ-cus asaccharolyticus, Escherichia coli HB101, Candida albicans,and Saccharomyces cerevisiae. The amount of DNA amplified wasequivalent to that used in standard casework assays (i.e., 2 to 2.5ng). To mimic extreme situations of contamination, 50 ng of tem-plate DNA was also amplified.
Results and Discussion
Casework Study
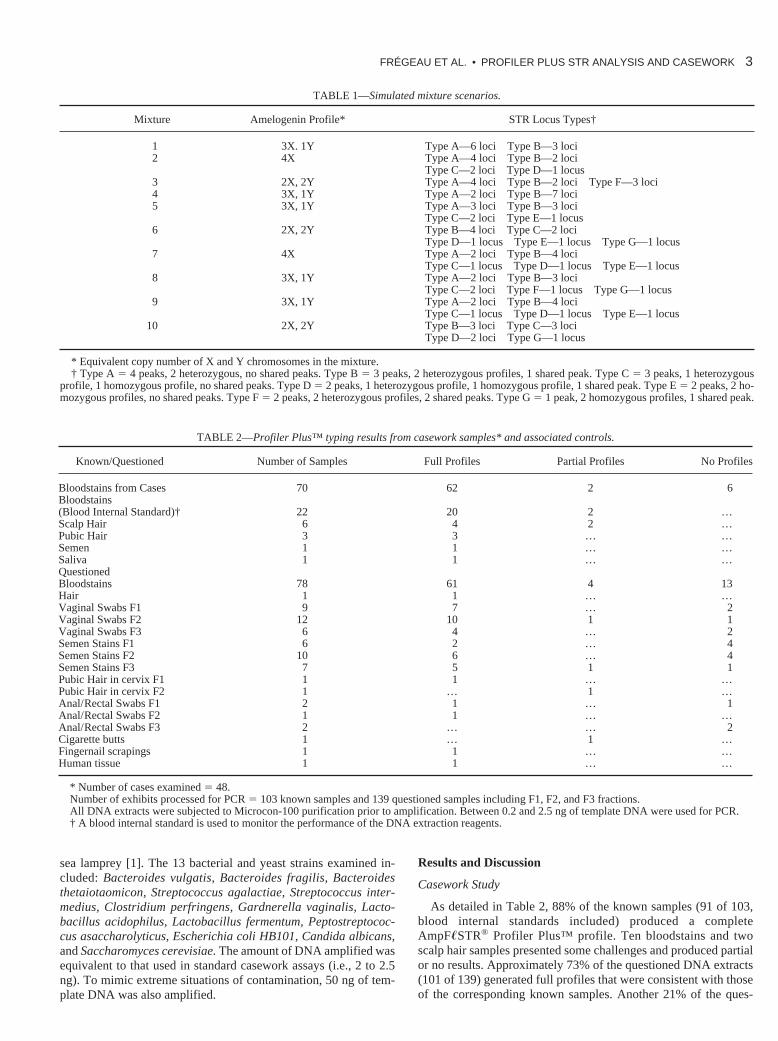
As detailed in Table 2, 88% of the known samples (91 of 103,blood internal standards included) produced a completeAmpF�STR® Profiler Plus™ profile. Ten bloodstains and twoscalp hair samples presented some challenges and produced partialor no results. Approximately 73% of the questioned DNA extracts(101 of 139) generated full profiles that were consistent with thoseof the corresponding known samples. Another 21% of the ques-
FRÉGEAU ET AL. • PROFILER PLUS STR ANALYSIS AND CASEWORK 3
TABLE 1—Simulated mixture scenarios.
Mixture Amelogenin Profile* STR Locus Types†
1 3X. 1Y Type A—6 loci Type B—3 loci2 4X Type A—4 loci Type B—2 loci
Type C—2 loci Type D—1 locus3 2X, 2Y Type A—4 loci Type B—2 loci Type F—3 loci4 3X, 1Y Type A—2 loci Type B—7 loci5 3X, 1Y Type A—3 loci Type B—3 loci
Type C—2 loci Type E—1 locus6 2X, 2Y Type B—4 loci Type C—2 loci
Type D—1 locus Type E—1 locus Type G—1 locus7 4X Type A—2 loci Type B—4 loci
Type C—1 locus Type D—1 locus Type E—1 locus8 3X, 1Y Type A—2 loci Type B—3 loci
Type C—2 loci Type F—1 locus Type G—1 locus9 3X, 1Y Type A—2 loci Type B—4 loci
Type C—1 locus Type D—1 locus Type E—1 locus10 2X, 2Y Type B—3 loci Type C—3 loci
Type D—2 loci Type G—1 locus
* Equivalent copy number of X and Y chromosomes in the mixture.† Type A � 4 peaks, 2 heterozygous, no shared peaks. Type B � 3 peaks, 2 heterozygous profiles, 1 shared peak. Type C � 3 peaks, 1 heterozygous
profile, 1 homozygous profile, no shared peaks. Type D � 2 peaks, 1 heterozygous profile, 1 homozygous profile, 1 shared peak. Type E � 2 peaks, 2 ho-mozygous profiles, no shared peaks. Type F � 2 peaks, 2 heterozygous profiles, 2 shared peaks. Type G � 1 peak, 2 homozygous profiles, 1 shared peak.
TABLE 2—Profiler Plus™ typing results from casework samples* and associated controls.
Known/Questioned Number of Samples Full Profiles Partial Profiles No Profiles
* Number of cases examined � 48.Number of exhibits processed for PCR � 103 known samples and 139 questioned samples including F1, F2, and F3 fractions.All DNA extracts were subjected to Microcon-100 purification prior to amplification. Between 0.2 and 2.5 ng of template DNA were used for PCR.† A blood internal standard is used to monitor the performance of the DNA extraction reagents.
4 JOURNAL OF FORENSIC SCIENCES
tioned specimens failed to amplify, whereas 6% showed partial re-sults. In total, full profiles were generated for 79% of the samples(192 of 242). Partial profiles were observed in 6% of samples (14of 242), and failure to obtain a profile was apparent in 15% of theextracts examined (36 of 242).
Table 3 presents the AmpF�STR® Profiler Plus™ results ob-tained according to the amount of target DNA used for amplifica-tion. The majority of specimens had sufficient DNA to permit theuse of the recommended amount of DNA (i.e., 2.5 ng). Even so,there were twelve samples (6%) in that group that failed to produceany typing results. Other exhibits had enough DNA remainingfrom previous typing analyses for only one round of PCR (0.5 to 2ng). The majority of samples in this category gave results, but a sig-nificant number of them (34%) produced no amplicons. Anothersubset of exhibits had suboptimal amounts of DNA for amplifica-tion (0.2 ng) but were nonetheless processed with AmpF�STR®
Profiler Plus™. Interestingly, two samples of the 13 specimens inthis group (15%) gave full profiles. However, the majority of theseexhibits (69%) provided no genetic information.
The recommended optimal range of template DNA for amplifi-cation using AmpF�STR® Profiler Plus™ in 25-�L PCR reaction
volume was established between 0.5 to 2.5 ng, although limitedtyping results were obtained using as low as 0.2 ng of templateDNA. The success rate for amplification of samples using 0.5 to 2.5ng of input DNA was 83%.
All AmpF�STR® Profiler Plus™ profiles generated from case-work specimens could be grouped into six different categories.
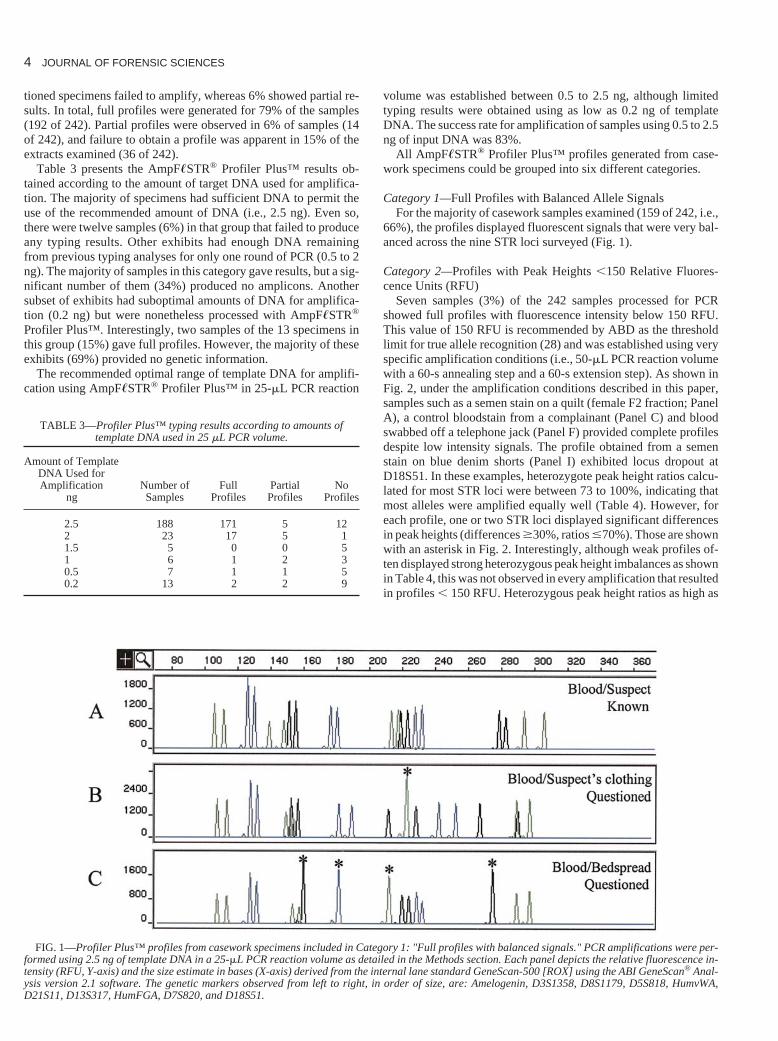
Category 1—Full Profiles with Balanced Allele SignalsFor the majority of casework samples examined (159 of 242, i.e.,
66%), the profiles displayed fluorescent signals that were very bal-anced across the nine STR loci surveyed (Fig. 1).
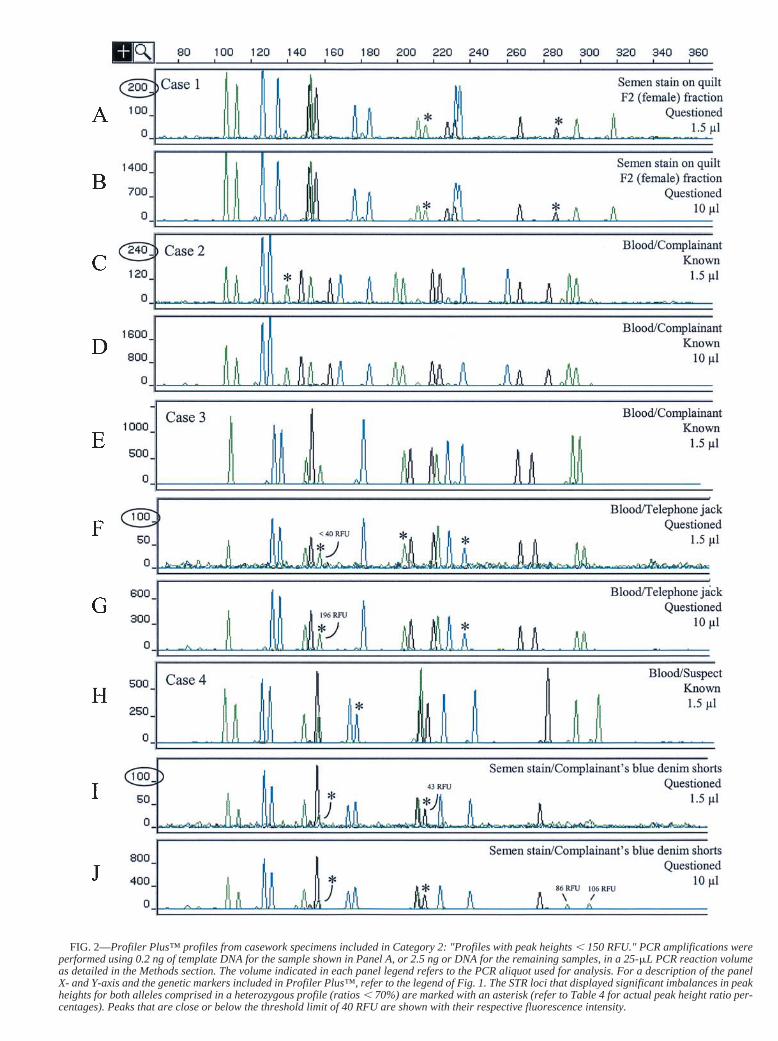
Category 2—Profiles with Peak Heights �150 Relative Fluores-cence Units (RFU)
Seven samples (3%) of the 242 samples processed for PCRshowed full profiles with fluorescence intensity below 150 RFU.This value of 150 RFU is recommended by ABD as the thresholdlimit for true allele recognition (28) and was established using veryspecific amplification conditions (i.e., 50-�L PCR reaction volumewith a 60-s annealing step and a 60-s extension step). As shown inFig. 2, under the amplification conditions described in this paper,samples such as a semen stain on a quilt (female F2 fraction; PanelA), a control bloodstain from a complainant (Panel C) and bloodswabbed off a telephone jack (Panel F) provided complete profilesdespite low intensity signals. The profile obtained from a semenstain on blue denim shorts (Panel I) exhibited locus dropout atD18S51. In these examples, heterozygote peak height ratios calcu-lated for most STR loci were between 73 to 100%, indicating thatmost alleles were amplified equally well (Table 4). However, foreach profile, one or two STR loci displayed significant differencesin peak heights (differences �30%, ratios �70%). Those are shownwith an asterisk in Fig. 2. Interestingly, although weak profiles of-ten displayed strong heterozygous peak height imbalances as shownin Table 4, this was not observed in every amplification that resultedin profiles � 150 RFU. Heterozygous peak height ratios as high as
TABLE 3—Profiler Plus™ typing results according to amounts oftemplate DNA used in 25 �L PCR volume.
Amount of TemplateDNA Used forAmplification Number of Full Partial No
FIG. 1—Profiler Plus™ profiles from casework specimens included in Category 1: "Full profiles with balanced signals." PCR amplifications were per-formed using 2.5 ng of template DNA in a 25-�L PCR reaction volume as detailed in the Methods section. Each panel depicts the relative fluorescence in-tensity (RFU, Y-axis) and the size estimate in bases (X-axis) derived from the internal lane standard GeneScan-500 [ROX] using the ABI GeneScan® Anal-ysis version 2.1 software. The genetic markers observed from left to right, in order of size, are: Amelogenin, D3S1358, D8S1179, D5S818, HumvWA,D21S11, D13S317, HumFGA, D7S820, and D18S51.
FIG. 2—Profiler Plus™ profiles from casework specimens included in Category 2: "Profiles with peak heights � 150 RFU." PCR amplifications wereperformed using 0.2 ng of template DNA for the sample shown in Panel A, or 2.5 ng or DNA for the remaining samples, in a 25-�L PCR reaction volumeas detailed in the Methods section. The volume indicated in each panel legend refers to the PCR aliquot used for analysis. For a description of the panelX- and Y-axis and the genetic markers included in Profiler Plus™, refer to the legend of Fig. 1. The STR loci that displayed significant imbalances in peakheights for both alleles comprised in a heterozygous profile (ratios � 70%) are marked with an asterisk (refer to Table 4 for actual peak height ratio per-centages). Peaks that are close or below the threshold limit of 40 RFU are shown with their respective fluorescence intensity.
6 JOURNAL OF FORENSIC SCIENCES
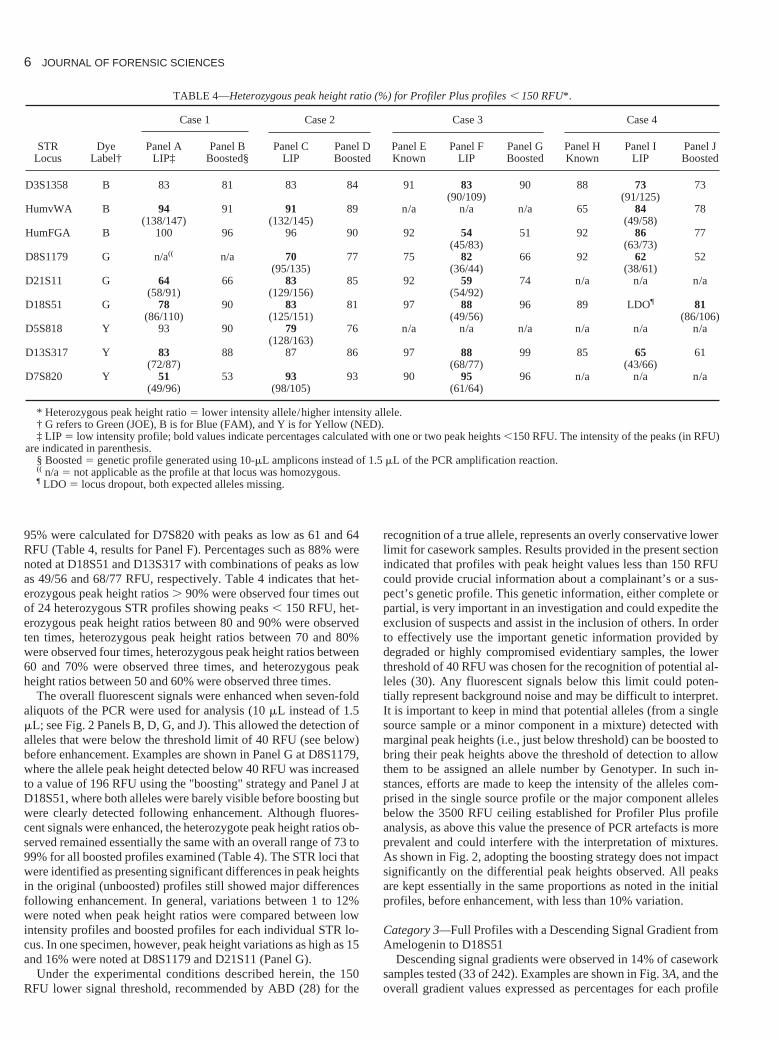
95% were calculated for D7S820 with peaks as low as 61 and 64RFU (Table 4, results for Panel F). Percentages such as 88% werenoted at D18S51 and D13S317 with combinations of peaks as lowas 49/56 and 68/77 RFU, respectively. Table 4 indicates that het-erozygous peak height ratios 90% were observed four times outof 24 heterozygous STR profiles showing peaks � 150 RFU, het-erozygous peak height ratios between 80 and 90% were observedten times, heterozygous peak height ratios between 70 and 80%were observed four times, heterozygous peak height ratios between60 and 70% were observed three times, and heterozygous peakheight ratios between 50 and 60% were observed three times.
The overall fluorescent signals were enhanced when seven-foldaliquots of the PCR were used for analysis (10 �L instead of 1.5�L; see Fig. 2 Panels B, D, G, and J). This allowed the detection ofalleles that were below the threshold limit of 40 RFU (see below)before enhancement. Examples are shown in Panel G at D8S1179,where the allele peak height detected below 40 RFU was increasedto a value of 196 RFU using the "boosting" strategy and Panel J atD18S51, where both alleles were barely visible before boosting butwere clearly detected following enhancement. Although fluores-cent signals were enhanced, the heterozygote peak height ratios ob-served remained essentially the same with an overall range of 73 to99% for all boosted profiles examined (Table 4). The STR loci thatwere identified as presenting significant differences in peak heightsin the original (unboosted) profiles still showed major differencesfollowing enhancement. In general, variations between 1 to 12%were noted when peak height ratios were compared between lowintensity profiles and boosted profiles for each individual STR lo-cus. In one specimen, however, peak height variations as high as 15and 16% were noted at D8S1179 and D21S11 (Panel G).
Under the experimental conditions described herein, the 150RFU lower signal threshold, recommended by ABD (28) for the
recognition of a true allele, represents an overly conservative lowerlimit for casework samples. Results provided in the present sectionindicated that profiles with peak height values less than 150 RFUcould provide crucial information about a complainant’s or a sus-pect’s genetic profile. This genetic information, either complete orpartial, is very important in an investigation and could expedite theexclusion of suspects and assist in the inclusion of others. In orderto effectively use the important genetic information provided bydegraded or highly compromised evidentiary samples, the lowerthreshold of 40 RFU was chosen for the recognition of potential al-leles (30). Any fluorescent signals below this limit could poten-tially represent background noise and may be difficult to interpret.It is important to keep in mind that potential alleles (from a singlesource sample or a minor component in a mixture) detected withmarginal peak heights (i.e., just below threshold) can be boosted tobring their peak heights above the threshold of detection to allowthem to be assigned an allele number by Genotyper. In such in-stances, efforts are made to keep the intensity of the alleles com-prised in the single source profile or the major component allelesbelow the 3500 RFU ceiling established for Profiler Plus profileanalysis, as above this value the presence of PCR artefacts is moreprevalent and could interfere with the interpretation of mixtures.As shown in Fig. 2, adopting the boosting strategy does not impactsignificantly on the differential peak heights observed. All peaksare kept essentially in the same proportions as noted in the initialprofiles, before enhancement, with less than 10% variation.
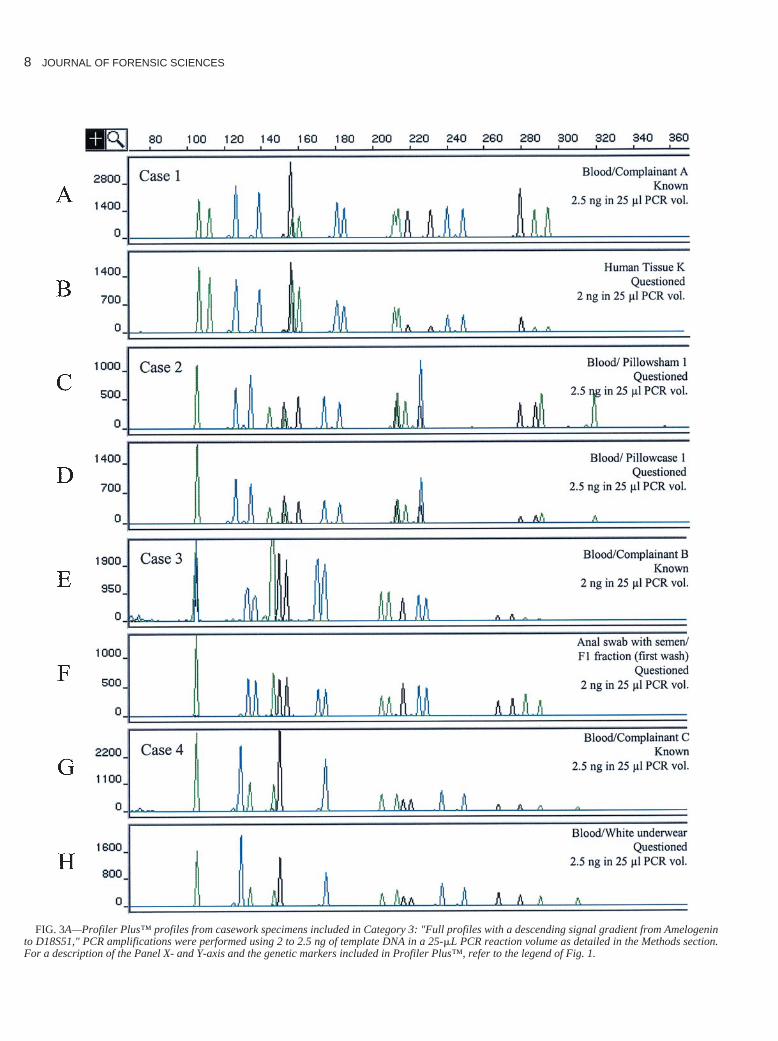
Category 3—Full Profiles with a Descending Signal Gradient fromAmelogenin to D18S51
Descending signal gradients were observed in 14% of caseworksamples tested (33 of 242). Examples are shown in Fig. 3A, and theoverall gradient values expressed as percentages for each profile
TABLE 4—Heterozygous peak height ratio (%) for Profiler Plus profiles � 150 RFU*.
Case 1 Case 2 Case 3 Case 4
STR Dye Panel A Panel B Panel C Panel D Panel E Panel F Panel G Panel H Panel I Panel JLocus Label† LIP‡ Boosted§ LIP Boosted Known LIP Boosted Known LIP Boosted
* Heterozygous peak height ratio � lower intensity allele/higher intensity allele.† G refers to Green (JOE), B is for Blue (FAM), and Y is for Yellow (NED).‡ LIP � low intensity profile; bold values indicate percentages calculated with one or two peak heights �150 RFU. The intensity of the peaks (in RFU)
are indicated in parenthesis.§ Boosted � genetic profile generated using 10-�L amplicons instead of 1.5 �L of the PCR amplification reaction.(( n/a � not applicable as the profile at that locus was homozygous.¶ LDO � locus dropout, both expected alleles missing.
the same as those obtained using 1 ng of DNA, i.e., very balancedacross all nine STR loci (see Table 5), with the exception of the flu-orescence signal strength, which was proportionately reduced com-pared to the one noted for the profiles generated using 1 and 2 to2.5 ng (data not shown).
PCR inhibition appeared to be overcome by reducing the amountof DNA extract used for amplification in a 25-�L reaction. How-ever, using a limited quantity of DNA in a large PCR volume re-duces the overall allele peak heights. In order to enhance the fluo-rescence signal of samples, we examined the effect of asimultaneous reduction of the volume of DNA extract and PCR re-action. We were interested in finding out if the inhibition seenusing 2 to 2.5 ng in 25 �L, which disappeared using 1 or 0.5 ng in25 �L, be observed again using 1 or 0.5 ng in 5 or 10 �L. Figures4A and 4B present the results of the samples that showed the mostsignificant slopes in Fig. 3A (Panels B, D, E, and G), suggesting themost inhibition under the amplification conditions used. Theyshould be the most affected when amplified under reduced condi-tions of input DNA and reaction volume. Inhibition was indeednoted in the case of 1 ng of DNA in 5 �L for all samples shown(Figs. 4A and 4B, Panels B and F). All four profiles displayed thedescending slope observed initially when 2 to 2.5 ng of DNA wereused in 25-�L PCR volume. The average gradient values for thethree colored sets of STRs were very similar to those calculated forprofiles generated using 2 to 2.5 ng in 25 �L (see Table 5). In pro-files generated using 1 ng in 5 �L, n/n 1 products were even de-tected, which is indicative of the suboptimal amplification condi-tions. Using 1 ng of DNA in 10-�L PCR reaction provided verygood typing results in all four samples (Figs. 4A and 4B, Panels Dand H), and so did the use of 0.5 ng of DNA in 10-�L PCR reac-tion (Figs. 4A and 4B, Panels C and G) and 0.5 ng of DNA in 5-�L
FRÉGEAU ET AL. • PROFILER PLUS STR ANALYSIS AND CASEWORK 7
generated using 2 to 2.5 ng of DNA in a 25-�L PCR volume areprovided in Table 5. Gradients were calculated using the lowest al-lele peak height value over the highest allele peak height value inthe profile for each colored set of STR loci and using half the peakheight value for homozygous loci. The average of the three gradi-ent values calculated is provided for comparison. As depicted inTable 5, under the amplification conditions selected for theAmpF�STR® Profiler Plus validation, different specimens pro-duced different profile gradients.
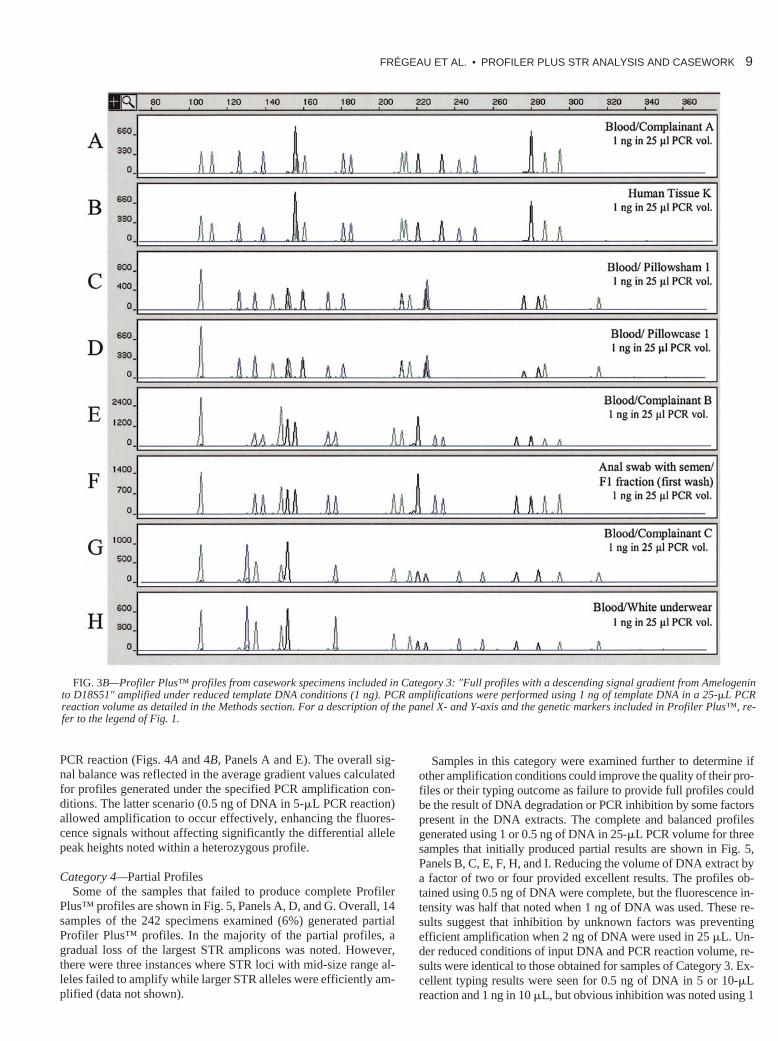
This pattern observed could be the result of progressive DNAdegradation or inhibition by unknown factors still present in theDNA extracts even after performing the Microcon-100 purificationstep following DNA extraction. Such factors may have an adverseeffect on amplification by preventing effective polymerization ofthe larger STR loci products. If the latter possibility was true, thenreducing the volume of DNA extract used for amplification shoulddecrease the concentration of potential PCR inhibitors and improvethe quality of the profiles. The Profiler Plus™ typing results gen-erated using 1 ng of DNA, instead of the initial 2 to 2.5 ng DNA foreach sample shown in Fig. 3A, are exhibited in Fig. 3B. The reduc-tion in the volume of DNA extract resulted in the production ofvery balanced profiles for all samples retested (11 out of 33 sam-ples as some were used up during validation), suggesting that theoriginal pattern observed was indeed due to PCR inhibition. Thisoverall improvement in the fluorescent signal balance was re-flected in the average gradient values calculated for all profilesgenerated using 1 ng of DNA (see Table 5). The signal balance wasimproved by approximately 9 to 27% and by as much as 53% in thecase of human tissue (19% versus 72%) using less DNA. When thevolume of DNA extract was further reduced by a factor of two, i.e.,using 0.5 ng of input DNA in 25 �L, the profiles were essentially
TABLE 5—Descending signal gradients observed in casework samples.*
Case 1 Case 2
Blood Blood BloodPCR Complainant A, Human Tissue K, Pillowsham 1, Pillowcase 1,
Conditions % % % %
2.5 ng in 25 �L 63 19 58 341 ng in 25 �L 72 72 70 490.5 ng in 25 �L 58 62 56 530.5 ng in 5 �L ND† 26 ND 571 ng in 5 �L ND 20 ND 350.5 ng in 10 �L ND 34 ND 591 ng in 10 �L ND 31 ND 58
Case 3 Case 4
Blood Anal Swab with Blood BloodComplainant B, Semen F1 Fraction, Complainant C, White Underwear,
% % % %
2.5 ng in 25 �L 16 60 27 401 ng in 25 �L 43 71 46 380.5 ng in 25 �L 80 70 42 420.5 ng in 5 �L 57 ND 45 ND1 ng in 5 �L 42 ND 12 ND0.5 ng in 10 �L 65 ND 66 ND1 ng in 10 �L 63 ND 55 ND
* Gradients were calculated using the lowest over the highest allele peak height value for each colored set of STRs. The average of the three gradientvalues is provided for each profile.
† ND � not determined.
8 JOURNAL OF FORENSIC SCIENCES
FIG. 3A—Profiler Plus™ profiles from casework specimens included in Category 3: "Full profiles with a descending signal gradient from Amelogeninto D18S51," PCR amplifications were performed using 2 to 2.5 ng of template DNA in a 25-�L PCR reaction volume as detailed in the Methods section.For a description of the Panel X- and Y-axis and the genetic markers included in Profiler Plus™, refer to the legend of Fig. 1.
FRÉGEAU ET AL. • PROFILER PLUS STR ANALYSIS AND CASEWORK 9
FIG. 3B—Profiler Plus™ profiles from casework specimens included in Category 3: "Full profiles with a descending signal gradient from Amelogeninto D18S51" amplified under reduced template DNA conditions (1 ng). PCR amplifications were performed using 1 ng of template DNA in a 25-�L PCRreaction volume as detailed in the Methods section. For a description of the panel X- and Y-axis and the genetic markers included in Profiler Plus™, re-fer to the legend of Fig. 1.
PCR reaction (Figs. 4A and 4B, Panels A and E). The overall sig-nal balance was reflected in the average gradient values calculatedfor profiles generated under the specified PCR amplification con-ditions. The latter scenario (0.5 ng of DNA in 5-�L PCR reaction)allowed amplification to occur effectively, enhancing the fluores-cence signals without affecting significantly the differential allelepeak heights noted within a heterozygous profile.
Category 4—Partial ProfilesSome of the samples that failed to produce complete Profiler
Plus™ profiles are shown in Fig. 5, Panels A, D, and G. Overall, 14samples of the 242 specimens examined (6%) generated partialProfiler Plus™ profiles. In the majority of the partial profiles, agradual loss of the largest STR amplicons was noted. However,there were three instances where STR loci with mid-size range al-leles failed to amplify while larger STR alleles were efficiently am-plified (data not shown).
Samples in this category were examined further to determine ifother amplification conditions could improve the quality of their pro-files or their typing outcome as failure to provide full profiles couldbe the result of DNA degradation or PCR inhibition by some factorspresent in the DNA extracts. The complete and balanced profilesgenerated using 1 or 0.5 ng of DNA in 25-�L PCR volume for threesamples that initially produced partial results are shown in Fig. 5,Panels B, C, E, F, H, and I. Reducing the volume of DNA extract bya factor of two or four provided excellent results. The profiles ob-tained using 0.5 ng of DNA were complete, but the fluorescence in-tensity was half that noted when 1 ng of DNA was used. These re-sults suggest that inhibition by unknown factors was preventingefficient amplification when 2 ng of DNA were used in 25 �L. Un-der reduced conditions of input DNA and PCR reaction volume, re-sults were identical to those obtained for samples of Category 3. Ex-cellent typing results were seen for 0.5 ng of DNA in 5 or 10-�Lreaction and 1 ng in 10 �L, but obvious inhibition was noted using 1
10 JOURNAL OF FORENSIC SCIENCES
FIG. 4A—Profiler Plus™ profiles from a human tissue specimen and a known blood from a complainant included in Category 3: "Full profiles with adescending signal gradient from Amelogenin to D18S51," amplified under reduced template DNA (0.5, 1 ng) and reduced PCR volume (5 �L, 10 �L) con-ditions. For details on PCR amplifications, refer to the Methods section. For a description of the panel X- and Y-axis and the genetic markers included inProfiler Plus™, refer to the legend of Fig. 1.
ng in 5 �L (Table 5 and data not shown). In addition, under such re-duced amplification conditions (1 ng in 5 �L), n/n 1 products weredetected as previously shown in Figs. 4A and 4B, Panels B and F.
As observed for profiles that exhibited the peak height patterntypical of partially degraded DNA (i.e., showed a slope), partialprofiles could be converted into balanced and complete profilessimply by reamplifying the samples under reduced conditions ofinput DNA. There was no need for further purification of the DNAextracts using another Microcon-100 column as a second amplifi-cation using half or a quarter of the original amount of DNA (i.e.,1 or 0.5 ng) provided excellent results. Although limited to a fewcasework samples, a simultaneous reduction in the input DNA (0.5ng instead of 2 ng) and PCR reaction volume (5 or 10 �L insteadof 25 �L) provided excellent typing results for all samples retested.Such conditions allow the reduction of the cost of the amplificationassay even further by a factor of five (5 �L used instead of 25 �L).A more detailed validation study using casework samples and mix-
tures was carried out under reduced PCR reaction volumes andsimilar conclusions were obtained (33). Under these amplificationstrategies, the AmpF�STR® Profiler Plus™ amplification systemprovided excellent results in more than 85% of the samples. Thispercentage represents an underestimation because many samplesshowing partial or no profiles could not be retested under reducedconditions because they had been used up during validation.
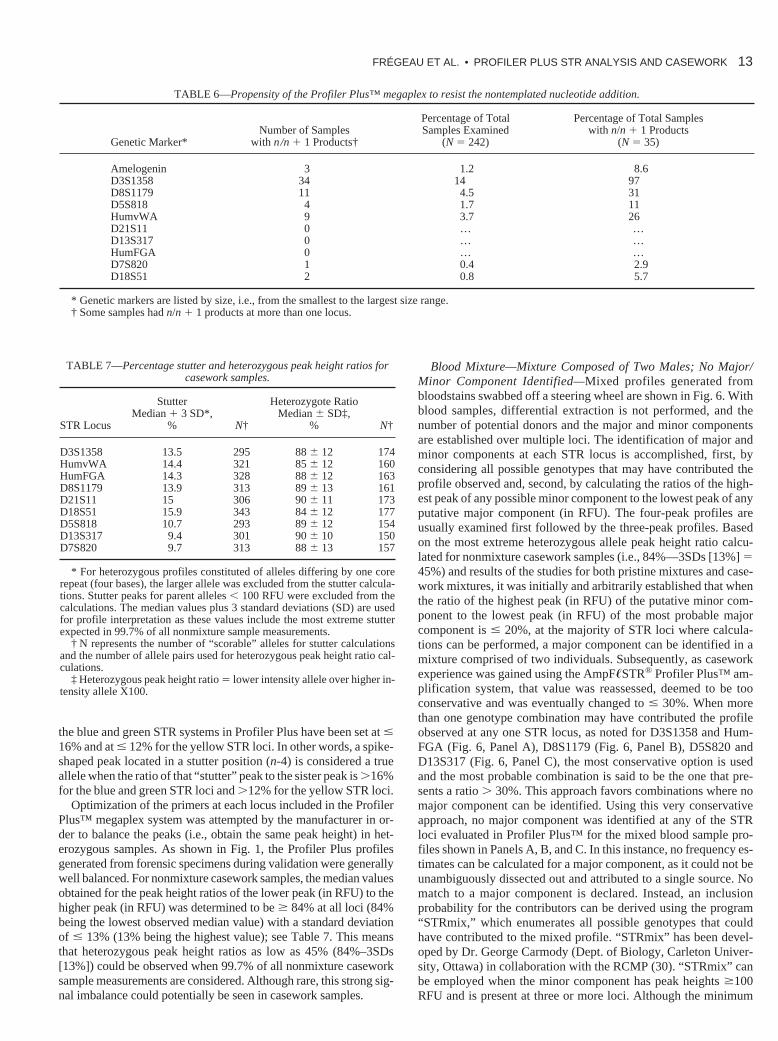
Category 5—Profiles with n/n 1 ProductsProfiles with split peaks (n/n 1) were noted in 35 samples of
the 242 examined (14%). These split peaks were observed despitethe additional extension period of 45 min at 60°C and the overnightincubation at room temperature included in the routine amplifica-tion protocol in order to promote the AmpliTaq DNA polymerase3�-terminal transferase activity. As indicated in Table 6, of the nineSTR loci included in Profiler Plus™, D3S1358, D8S1179, andHumvWA were the most resistant to the nontemplated nucleotide
FRÉGEAU ET AL. • PROFILER PLUS STR ANALYSIS AND CASEWORK 11
FIG. 4B—Profiler Plus™ profiles from a known blood from a complainant and a bloodstain on a pillowcase included in Category 3: "Full profiles witha descending signal gradient from Amelogenin to D18S51," amplified under reduced template DNA (0.5, 1 ng) and reduced PCR volume (5, 10 �L) con-ditions. For details on PCR amplifications, refer to the Methods section. For a description of the panel X- and Y-axis and the genetic markers included inProfiler Plus™, refer to the legend of Fig. 1.
addition, with the highest incidence of n/n 1 products noted withD3S1358 (97% of the total samples exhibiting n/n 1 products).In contrast, none of the 242 profiles produced from casework spec-imens during the validation study presented split peaks at D21S11,D13S317, and HumFGA. The remaining three STR loci (D5S818,D7S820, and D18S51) and amelogenin showed moderate resis-tance to the nontemplated nucleotide addition.
It has been shown that the AmpliTaq DNA polymerase 3� termi-nal transferase activity is influenced by the nucleotide sequence atthe 5� end of the reverse primer (34). Magnuson's study also indi-cated that dATP or dGTP promote the addition of a nucleotide(preferentially dATP) at the 3� end of the duplex molecule, whiledCTP or dTTP are bad substrates for the addition. As the ProfilerPlus primer sequences remain proprietary to ABD, it is not possibleto verify that the D3S1358 reverse primer has indeed a dCTP or adTTP at its 5� end. This would explain the high propensity ofD3S1358 to show n/n 1 split peaks. To minimize the production
of split peaks, amplification conditions described herein have beendesigned to drive the reaction towards the addition of a nucleotideat the 3� end of all blunt-ended amplicons.
Category 6—Mixed ProfilesTwenty samples (8%) of the 242 exhibits tested presented mixed
profiles. Mixed profiles were further dissected using data collectedduring validation of the Profiler Plus system regarding stutteringand heterozygous allele peak height differentials. Table 7 summa-rizes both the stutter percentages and the heterozygote peak heightratios noted for each of the STR loci included in Profiler Plus. Thestutter percentage values were established from all nonmixturecasework samples examined during the validation (35). The FAM-and JOE-labeled STR markers were more prone to stuttering as re-flected in the higher stutter percentage values calculated for thesemarkers (14–16%) versus values obtained for the NED-labeled STRloci (9 to 11%). As a conservative approach, stutter percentages for
12 JOURNAL OF FORENSIC SCIENCES
FIG. 5—Profiler Plus™ profiles from casework specimens included in Category 4: "Partial profiles" amplified under normal and reduced template DNAand PCR volume conditions. PCR amplifications were performed using 2 ng of DNA in a 25-�L PCR reaction volume (Panels A, D, and G), 1 ng of DNAin a 25-�L PCR reaction volume (Panels B, E, and H), 0.5 ng of DNA in a 25-�L PCR reaction volume (Panels C, F, and I) as detailed in the Methodssection. For a description of the panel X- and Y-axis, refer to the legend of Fig. 1. The labeling scheme for the genetic markers is: Amelogenin (1), D3S1358(2), D8S1179 (3), D5S818 (4), HumvWA (5), D21S11 (6), D13S317 (7), HumFGA (8), D7S820 (9), and D18S51 (10).
the blue and green STR systems in Profiler Plus have been set at �16% and at � 12% for the yellow STR loci. In other words, a spike-shaped peak located in a stutter position (n-4) is considered a trueallele when the ratio of that “stutter” peak to the sister peak is 16%for the blue and green STR loci and 12% for the yellow STR loci.
Optimization of the primers at each locus included in the ProfilerPlus™ megaplex system was attempted by the manufacturer in or-der to balance the peaks (i.e., obtain the same peak height) in het-erozygous samples. As shown in Fig. 1, the Profiler Plus profilesgenerated from forensic specimens during validation were generallywell balanced. For nonmixture casework samples, the median valuesobtained for the peak height ratios of the lower peak (in RFU) to thehigher peak (in RFU) was determined to be � 84% at all loci (84%being the lowest observed median value) with a standard deviationof � 13% (13% being the highest value); see Table 7. This meansthat heterozygous peak height ratios as low as 45% (84%–3SDs[13%]) could be observed when 99.7% of all nonmixture caseworksample measurements are considered. Although rare, this strong sig-nal imbalance could potentially be seen in casework samples.
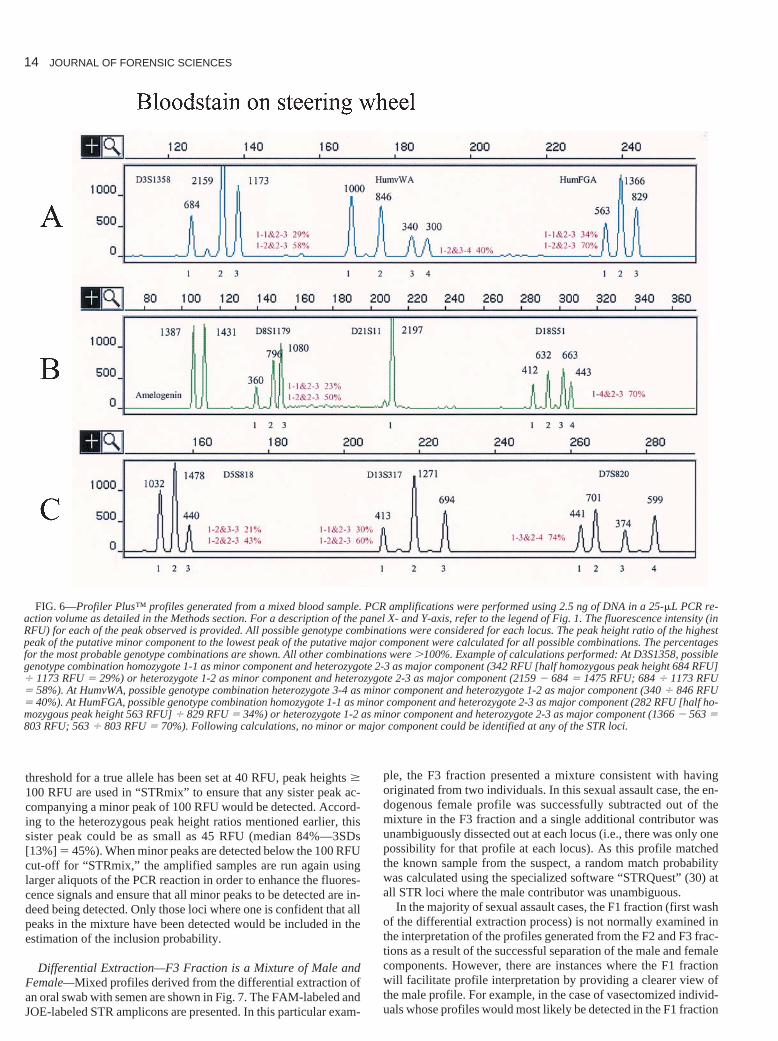
Blood Mixture—Mixture Composed of Two Males; No Major/Minor Component Identified—Mixed profiles generated frombloodstains swabbed off a steering wheel are shown in Fig. 6. Withblood samples, differential extraction is not performed, and thenumber of potential donors and the major and minor componentsare established over multiple loci. The identification of major andminor components at each STR locus is accomplished, first, byconsidering all possible genotypes that may have contributed theprofile observed and, second, by calculating the ratios of the high-est peak of any possible minor component to the lowest peak of anyputative major component (in RFU). The four-peak profiles areusually examined first followed by the three-peak profiles. Basedon the most extreme heterozygous allele peak height ratio calcu-lated for nonmixture casework samples (i.e., 84%—3SDs [13%] �45%) and results of the studies for both pristine mixtures and case-work mixtures, it was initially and arbitrarily established that whenthe ratio of the highest peak (in RFU) of the putative minor com-ponent to the lowest peak (in RFU) of the most probable majorcomponent is � 20%, at the majority of STR loci where calcula-tions can be performed, a major component can be identified in amixture comprised of two individuals. Subsequently, as caseworkexperience was gained using the AmpF�STR® Profiler Plus™ am-plification system, that value was reassessed, deemed to be tooconservative and was eventually changed to � 30%. When morethan one genotype combination may have contributed the profileobserved at any one STR locus, as noted for D3S1358 and Hum-FGA (Fig. 6, Panel A), D8S1179 (Fig. 6, Panel B), D5S820 andD13S317 (Fig. 6, Panel C), the most conservative option is usedand the most probable combination is said to be the one that pre-sents a ratio 30%. This approach favors combinations where nomajor component can be identified. Using this very conservativeapproach, no major component was identified at any of the STRloci evaluated in Profiler Plus™ for the mixed blood sample pro-files shown in Panels A, B, and C. In this instance, no frequency es-timates can be calculated for a major component, as it could not beunambiguously dissected out and attributed to a single source. Nomatch to a major component is declared. Instead, an inclusionprobability for the contributors can be derived using the program“STRmix,” which enumerates all possible genotypes that couldhave contributed to the mixed profile. “STRmix” has been devel-oped by Dr. George Carmody (Dept. of Biology, Carleton Univer-sity, Ottawa) in collaboration with the RCMP (30). “STRmix” canbe employed when the minor component has peak heights �100RFU and is present at three or more loci. Although the minimum
FRÉGEAU ET AL. • PROFILER PLUS STR ANALYSIS AND CASEWORK 13
TABLE 7—Percentage stutter and heterozygous peak height ratios forcasework samples.
Stutter Heterozygote RatioMedian 3 SD*, Median � SD‡,
* For heterozygous profiles constituted of alleles differing by one corerepeat (four bases), the larger allele was excluded from the stutter calcula-tions. Stutter peaks for parent alleles � 100 RFU were excluded from thecalculations. The median values plus 3 standard deviations (SD) are usedfor profile interpretation as these values include the most extreme stutterexpected in 99.7% of all nonmixture sample measurements.
† N represents the number of “scorable” alleles for stutter calculationsand the number of allele pairs used for heterozygous peak height ratio cal-culations.
‡ Heterozygous peak height ratio � lower intensity allele over higher in-tensity allele X100.
TABLE 6—Propensity of the Profiler Plus™ megaplex to resist the nontemplated nucleotide addition.
Percentage of Total Percentage of Total SamplesNumber of Samples Samples Examined with n/n 1 Products
* Genetic markers are listed by size, i.e., from the smallest to the largest size range.† Some samples had n/n 1 products at more than one locus.
14 JOURNAL OF FORENSIC SCIENCES
threshold for a true allele has been set at 40 RFU, peak heights �100 RFU are used in “STRmix” to ensure that any sister peak ac-companying a minor peak of 100 RFU would be detected. Accord-ing to the heterozygous peak height ratios mentioned earlier, thissister peak could be as small as 45 RFU (median 84%—3SDs[13%] � 45%). When minor peaks are detected below the 100 RFUcut-off for “STRmix,” the amplified samples are run again usinglarger aliquots of the PCR reaction in order to enhance the fluores-cence signals and ensure that all minor peaks to be detected are in-deed being detected. Only those loci where one is confident that allpeaks in the mixture have been detected would be included in theestimation of the inclusion probability.
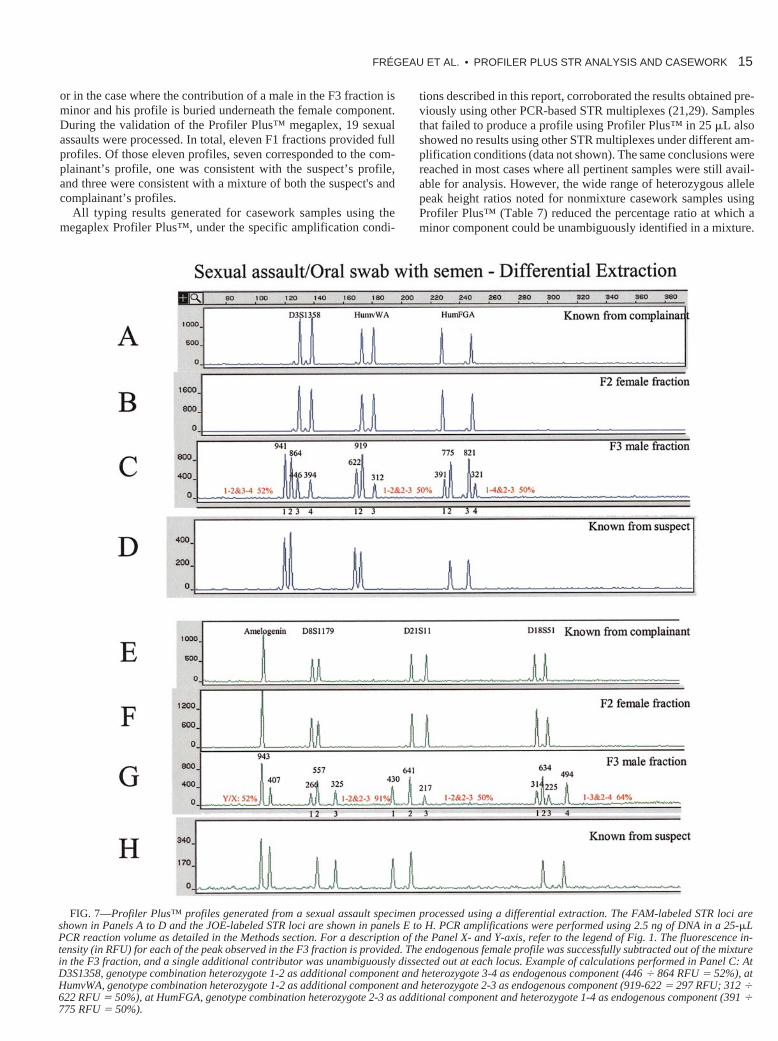
Differential Extraction—F3 Fraction is a Mixture of Male andFemale—Mixed profiles derived from the differential extraction ofan oral swab with semen are shown in Fig. 7. The FAM-labeled andJOE-labeled STR amplicons are presented. In this particular exam-
ple, the F3 fraction presented a mixture consistent with havingoriginated from two individuals. In this sexual assault case, the en-dogenous female profile was successfully subtracted out of themixture in the F3 fraction and a single additional contributor wasunambiguously dissected out at each locus (i.e., there was only onepossibility for that profile at each locus). As this profile matchedthe known sample from the suspect, a random match probabilitywas calculated using the specialized software “STRQuest” (30) atall STR loci where the male contributor was unambiguous.
In the majority of sexual assault cases, the F1 fraction (first washof the differential extraction process) is not normally examined inthe interpretation of the profiles generated from the F2 and F3 frac-tions as a result of the successful separation of the male and femalecomponents. However, there are instances where the F1 fractionwill facilitate profile interpretation by providing a clearer view ofthe male profile. For example, in the case of vasectomized individ-uals whose profiles would most likely be detected in the F1 fraction
FIG. 6—Profiler Plus™ profiles generated from a mixed blood sample. PCR amplifications were performed using 2.5 ng of DNA in a 25-�L PCR re-action volume as detailed in the Methods section. For a description of the panel X- and Y-axis, refer to the legend of Fig. 1. The fluorescence intensity (inRFU) for each of the peak observed is provided. All possible genotype combinations were considered for each locus. The peak height ratio of the highestpeak of the putative minor component to the lowest peak of the putative major component were calculated for all possible combinations. The percentagesfor the most probable genotype combinations are shown. All other combinations were 100%. Example of calculations performed: At D3S1358, possiblegenotype combination homozygote 1-1 as minor component and heterozygote 2-3 as major component (342 RFU [half homozygous peak height 684 RFU]� 1173 RFU � 29%) or heterozygote 1-2 as minor component and heterozygote 2-3 as major component (2159 � 684 � 1475 RFU; 684 � 1173 RFU� 58%). At HumvWA, possible genotype combination heterozygote 3-4 as minor component and heterozygote 1-2 as major component (340 � 846 RFU� 40%). At HumFGA, possible genotype combination homozygote 1-1 as minor component and heterozygote 2-3 as major component (282 RFU [half ho-mozygous peak height 563 RFU] � 829 RFU � 34%) or heterozygote 1-2 as minor component and heterozygote 2-3 as major component (1366 � 563 �803 RFU; 563 � 803 RFU � 70%). Following calculations, no minor or major component could be identified at any of the STR loci.
or in the case where the contribution of a male in the F3 fraction isminor and his profile is buried underneath the female component.During the validation of the Profiler Plus™ megaplex, 19 sexualassaults were processed. In total, eleven F1 fractions provided fullprofiles. Of those eleven profiles, seven corresponded to the com-plainant’s profile, one was consistent with the suspect’s profile,and three were consistent with a mixture of both the suspect's andcomplainant’s profiles.
All typing results generated for casework samples using themegaplex Profiler Plus™, under the specific amplification condi-
tions described in this report, corroborated the results obtained pre-viously using other PCR-based STR multiplexes (21,29). Samplesthat failed to produce a profile using Profiler Plus™ in 25 �L alsoshowed no results using other STR multiplexes under different am-plification conditions (data not shown). The same conclusions werereached in most cases where all pertinent samples were still avail-able for analysis. However, the wide range of heterozygous allelepeak height ratios noted for nonmixture casework samples usingProfiler Plus™ (Table 7) reduced the percentage ratio at which aminor component could be unambiguously identified in a mixture.
FRÉGEAU ET AL. • PROFILER PLUS STR ANALYSIS AND CASEWORK 15
FIG. 7—Profiler Plus™ profiles generated from a sexual assault specimen processed using a differential extraction. The FAM-labeled STR loci areshown in Panels A to D and the JOE-labeled STR loci are shown in panels E to H. PCR amplifications were performed using 2.5 ng of DNA in a 25-�LPCR reaction volume as detailed in the Methods section. For a description of the Panel X- and Y-axis, refer to the legend of Fig. 1. The fluorescence in-tensity (in RFU) for each of the peak observed in the F3 fraction is provided. The endogenous female profile was successfully subtracted out of the mixturein the F3 fraction, and a single additional contributor was unambiguously dissected out at each locus. Example of calculations performed in Panel C: AtD3S1358, genotype combination heterozygote 1-2 as additional component and heterozygote 3-4 as endogenous component (446 � 864 RFU � 52%), atHumvWA, genotype combination heterozygote 1-2 as additional component and heterozygote 2-3 as endogenous component (919-622 � 297 RFU; 312 �622 RFU � 50%), at HumFGA, genotype combination heterozygote 2-3 as additional component and heterozygote 1-4 as endogenous component (391 �775 RFU � 50%).
16 JOURNAL OF FORENSIC SCIENCES
Consequently, some cases for which a minor component was iden-tified using previous STR multiplex systems (21,29) were assignedan inclusion probability to support the contribution of the donors ofknown samples to the mixture.
Mixture Study
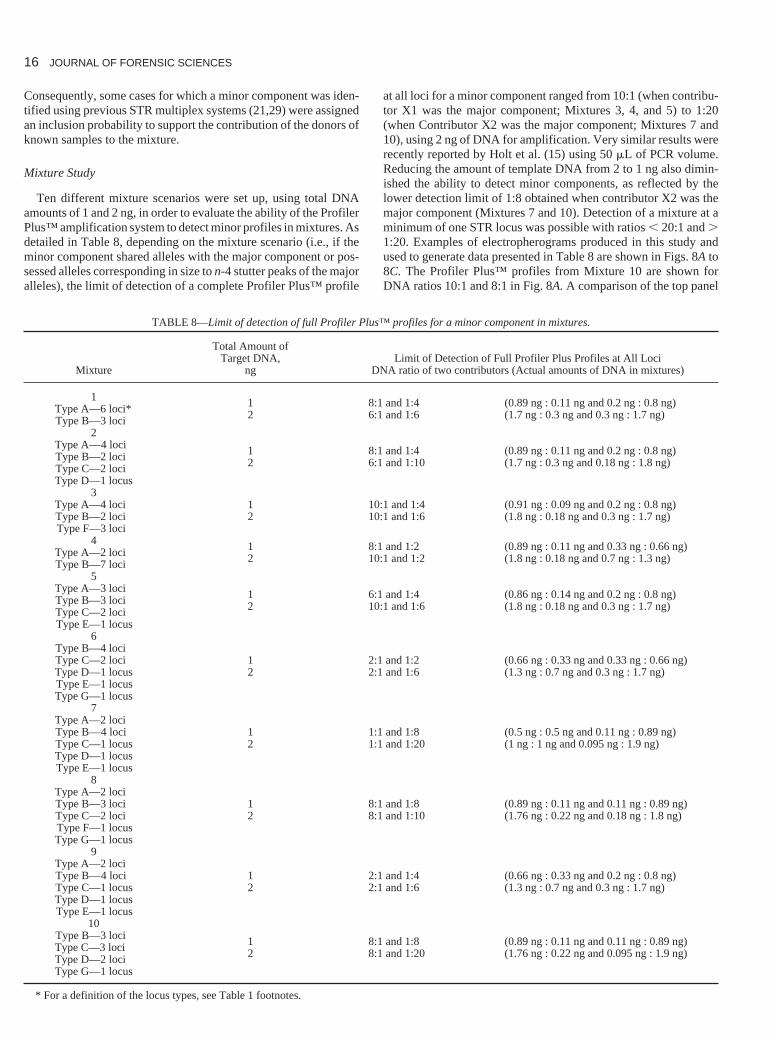
Ten different mixture scenarios were set up, using total DNAamounts of 1 and 2 ng, in order to evaluate the ability of the ProfilerPlus™ amplification system to detect minor profiles in mixtures. Asdetailed in Table 8, depending on the mixture scenario (i.e., if theminor component shared alleles with the major component or pos-sessed alleles corresponding in size to n-4 stutter peaks of the majoralleles), the limit of detection of a complete Profiler Plus™ profile
at all loci for a minor component ranged from 10:1 (when contribu-tor X1 was the major component; Mixtures 3, 4, and 5) to 1:20(when Contributor X2 was the major component; Mixtures 7 and10), using 2 ng of DNA for amplification. Very similar results wererecently reported by Holt et al. (15) using 50 �L of PCR volume.Reducing the amount of template DNA from 2 to 1 ng also dimin-ished the ability to detect minor components, as reflected by thelower detection limit of 1:8 obtained when contributor X2 was themajor component (Mixtures 7 and 10). Detection of a mixture at aminimum of one STR locus was possible with ratios � 20:1 and 1:20. Examples of electropherograms produced in this study andused to generate data presented in Table 8 are shown in Figs. 8A to8C. The Profiler Plus™ profiles from Mixture 10 are shown forDNA ratios 10:1 and 8:1 in Fig. 8A. A comparison of the top panel
TABLE 8—Limit of detection of full Profiler Plus™ profiles for a minor component in mixtures.
Total Amount ofTarget DNA, Limit of Detection of Full Profiler Plus Profiles at All Loci
Mixture ng DNA ratio of two contributors (Actual amounts of DNA in mixtures)
1 1 8:1 and 1:4 (0.89 ng : 0.11 ng and 0.2 ng : 0.8 ng)Type A—6 loci*Type B—3 loci 2 6:1 and 1:6 (1.7 ng : 0.3 ng and 0.3 ng : 1.7 ng)
2Type A—4 loci 1 8:1 and 1:4 (0.89 ng : 0.11 ng and 0.2 ng : 0.8 ng)Type B—2 lociType C—2 loci 2 6:1 and 1:10 (1.7 ng : 0.3 ng and 0.18 ng : 1.8 ng)
Type D—1 locus3
Type A—4 loci 1 10:1 and 1:4 (0.91 ng : 0.09 ng and 0.2 ng : 0.8 ng)Type B—2 loci 2 10:1 and 1:6 (1.8 ng : 0.18 ng and 0.3 ng : 1.7 ng)Type F—3 loci
4 1 8:1 and 1:2 (0.89 ng : 0.11 ng and 0.33 ng : 0.66 ng)Type A—2 lociType B—7 loci 2 10:1 and 1:2 (1.8 ng : 0.18 ng and 0.7 ng : 1.3 ng)
5Type A—3 loci 1 6:1 and 1:4 (0.86 ng : 0.14 ng and 0.2 ng : 0.8 ng)Type B—3 lociType C—2 loci 2 10:1 and 1:6 (1.8 ng : 0.18 ng and 0.3 ng : 1.7 ng)
Type E—1 locus6
Type B—4 lociType C—2 loci 1 2:1 and 1:2 (0.66 ng : 0.33 ng and 0.33 ng : 0.66 ng)Type D—1 locus 2 2:1 and 1:6 (1.3 ng : 0.7 ng and 0.3 ng : 1.7 ng)Type E—1 locusType G—1 locus
7Type A—2 lociType B—4 loci 1 1:1 and 1:8 (0.5 ng : 0.5 ng and 0.11 ng : 0.89 ng)Type C—1 locus 2 1:1 and 1:20 (1 ng : 1 ng and 0.095 ng : 1.9 ng)Type D—1 locusType E—1 locus
8Type A—2 lociType B—3 loci 1 8:1 and 1:8 (0.89 ng : 0.11 ng and 0.11 ng : 0.89 ng)Type C—2 loci 2 8:1 and 1:10 (1.76 ng : 0.22 ng and 0.18 ng : 1.8 ng)Type F—1 locusType G—1 locus
9Type A—2 lociType B—4 loci 1 2:1 and 1:4 (0.66 ng : 0.33 ng and 0.2 ng : 0.8 ng)Type C—1 locus 2 2:1 and 1:6 (1.3 ng : 0.7 ng and 0.3 ng : 1.7 ng)Type D—1 locusType E—1 locus
10Type B—3 loci 1 8:1 and 1:8 (0.89 ng : 0.11 ng and 0.11 ng : 0.89 ng)Type C—3 lociType D—2 loci 2 8:1 and 1:20 (1.76 ng : 0.22 ng and 0.095 ng : 1.9 ng)
Type G—1 locus
* For a definition of the locus types, see Table 1 footnotes.
FRÉGEAU ET AL. • PROFILER PLUS STR ANALYSIS AND CASEWORK 17
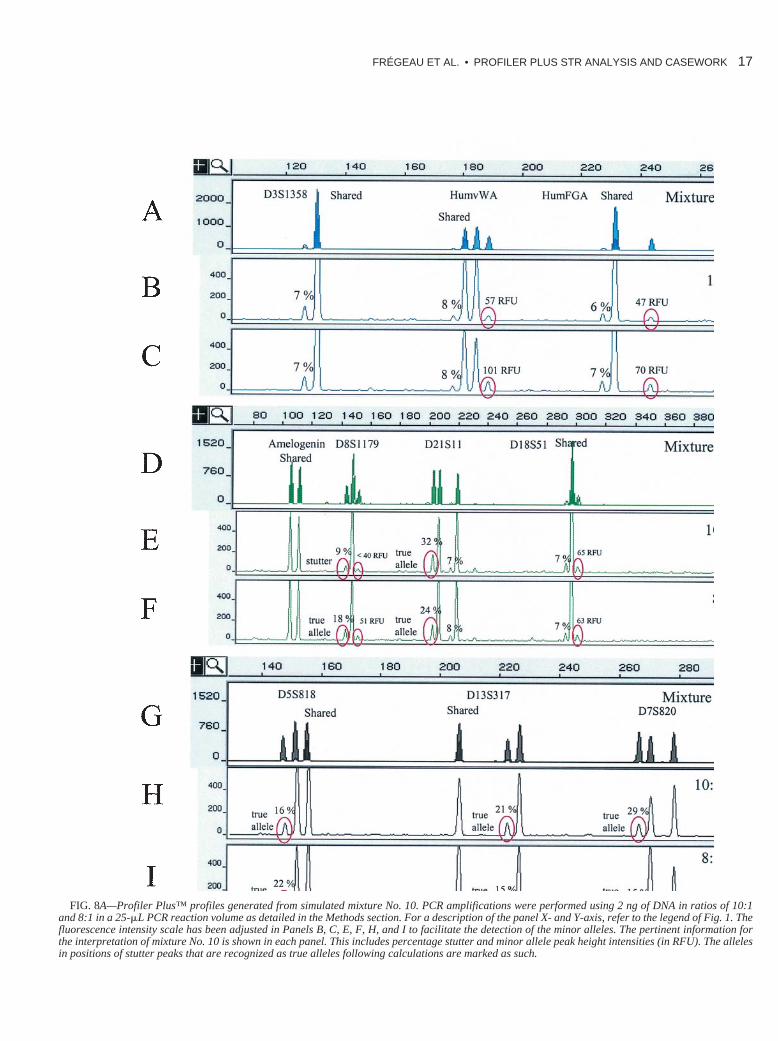
FIG. 8A—Profiler Plus™ profiles generated from simulated mixture No. 10. PCR amplifications were performed using 2 ng of DNA in ratios of 10:1and 8:1 in a 25-�L PCR reaction volume as detailed in the Methods section. For a description of the panel X- and Y-axis, refer to the legend of Fig. 1. Thefluorescence intensity scale has been adjusted in Panels B, C, E, F, H, and I to facilitate the detection of the minor alleles. The pertinent information forthe interpretation of mixture No. 10 is shown in each panel. This includes percentage stutter and minor allele peak height intensities (in RFU). The allelesin positions of stutter peaks that are recognized as true alleles following calculations are marked as such.
18 JOURNAL OF FORENSIC SCIENCES
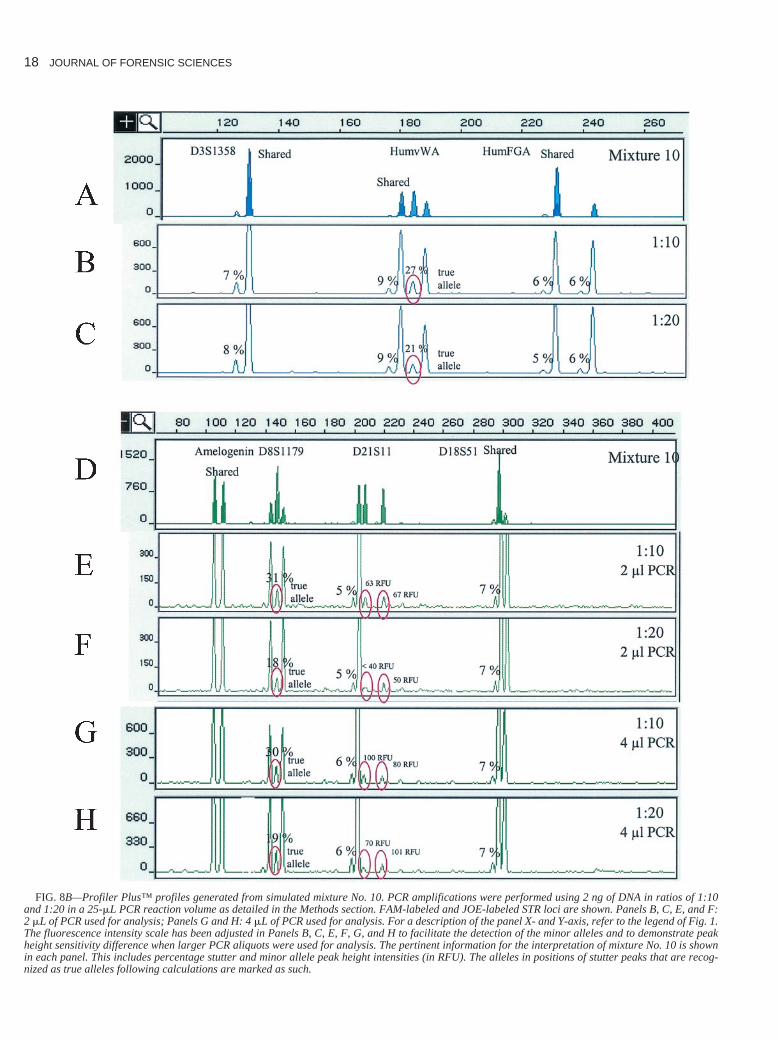
FIG. 8B—Profiler Plus™ profiles generated from simulated mixture No. 10. PCR amplifications were performed using 2 ng of DNA in ratios of 1:10and 1:20 in a 25-�L PCR reaction volume as detailed in the Methods section. FAM-labeled and JOE-labeled STR loci are shown. Panels B, C, E, and F:2 �L of PCR used for analysis; Panels G and H: 4 �L of PCR used for analysis. For a description of the panel X- and Y-axis, refer to the legend of Fig. 1.The fluorescence intensity scale has been adjusted in Panels B, C, E, F, G, and H to facilitate the detection of the minor alleles and to demonstrate peakheight sensitivity difference when larger PCR aliquots were used for analysis. The pertinent information for the interpretation of mixture No. 10 is shownin each panel. This includes percentage stutter and minor allele peak height intensities (in RFU). The alleles in positions of stutter peaks that are recog-nized as true alleles following calculations are marked as such.
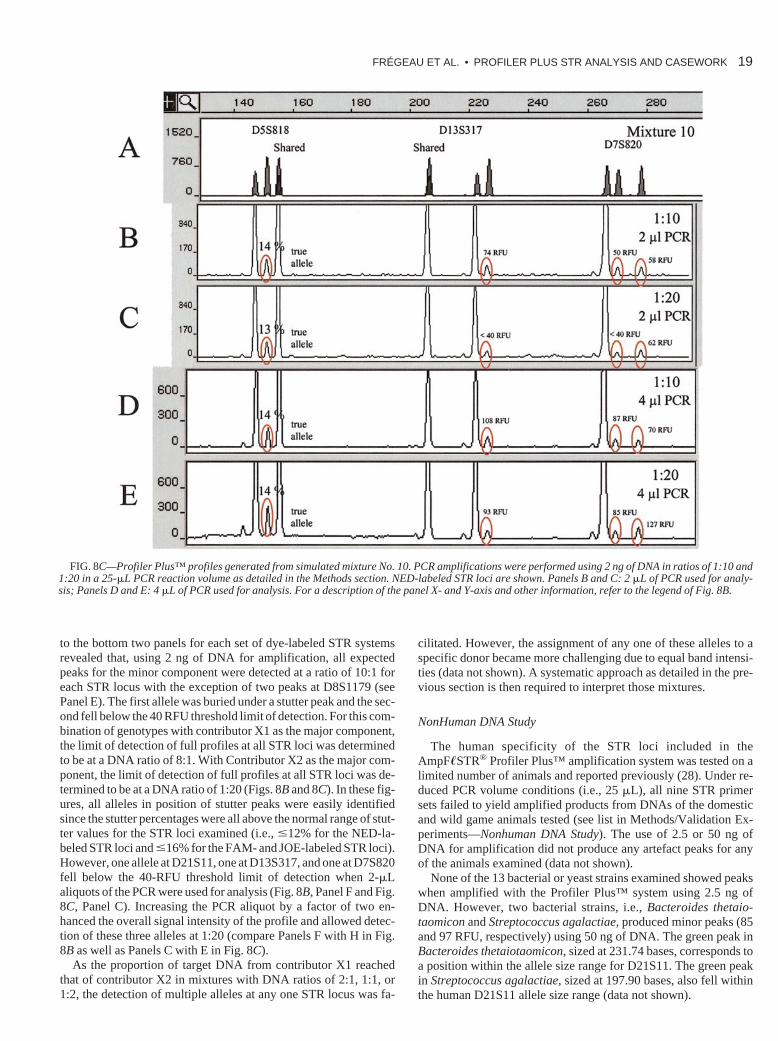
to the bottom two panels for each set of dye-labeled STR systemsrevealed that, using 2 ng of DNA for amplification, all expectedpeaks for the minor component were detected at a ratio of 10:1 foreach STR locus with the exception of two peaks at D8S1179 (seePanel E). The first allele was buried under a stutter peak and the sec-ond fell below the 40 RFU threshold limit of detection. For this com-bination of genotypes with contributor X1 as the major component,the limit of detection of full profiles at all STR loci was determinedto be at a DNA ratio of 8:1. With Contributor X2 as the major com-ponent, the limit of detection of full profiles at all STR loci was de-termined to be at a DNA ratio of 1:20 (Figs. 8B and 8C). In these fig-ures, all alleles in position of stutter peaks were easily identifiedsince the stutter percentages were all above the normal range of stut-ter values for the STR loci examined (i.e., �12% for the NED-la-beled STR loci and �16% for the FAM- and JOE-labeled STR loci).However, one allele at D21S11, one at D13S317, and one at D7S820fell below the 40-RFU threshold limit of detection when 2-�Laliquots of the PCR were used for analysis (Fig. 8B, Panel F and Fig.8C, Panel C). Increasing the PCR aliquot by a factor of two en-hanced the overall signal intensity of the profile and allowed detec-tion of these three alleles at 1:20 (compare Panels F with H in Fig.8B as well as Panels C with E in Fig. 8C).
As the proportion of target DNA from contributor X1 reachedthat of contributor X2 in mixtures with DNA ratios of 2:1, 1:1, or1:2, the detection of multiple alleles at any one STR locus was fa-
cilitated. However, the assignment of any one of these alleles to aspecific donor became more challenging due to equal band intensi-ties (data not shown). A systematic approach as detailed in the pre-vious section is then required to interpret those mixtures.
NonHuman DNA Study
The human specificity of the STR loci included in theAmpF�STR® Profiler Plus™ amplification system was tested on alimited number of animals and reported previously (28). Under re-duced PCR volume conditions (i.e., 25 �L), all nine STR primersets failed to yield amplified products from DNAs of the domesticand wild game animals tested (see list in Methods/Validation Ex-periments—Nonhuman DNA Study). The use of 2.5 or 50 ng ofDNA for amplification did not produce any artefact peaks for anyof the animals examined (data not shown).
None of the 13 bacterial or yeast strains examined showed peakswhen amplified with the Profiler Plus™ system using 2.5 ng ofDNA. However, two bacterial strains, i.e., Bacteroides thetaio-taomicon and Streptococcus agalactiae, produced minor peaks (85and 97 RFU, respectively) using 50 ng of DNA. The green peak inBacteroides thetaiotaomicon, sized at 231.74 bases, corresponds toa position within the allele size range for D21S11. The green peakin Streptococcus agalactiae, sized at 197.90 bases, also fell withinthe human D21S11 allele size range (data not shown).
FRÉGEAU ET AL. • PROFILER PLUS STR ANALYSIS AND CASEWORK 19
FIG. 8C—Profiler Plus™ profiles generated from simulated mixture No. 10. PCR amplifications were performed using 2 ng of DNA in ratios of 1:10 and1:20 in a 25-�L PCR reaction volume as detailed in the Methods section. NED-labeled STR loci are shown. Panels B and C: 2 �L of PCR used for analy-sis; Panels D and E: 4 �L of PCR used for analysis. For a description of the panel X- and Y-axis and other information, refer to the legend of Fig. 8B.
20 JOURNAL OF FORENSIC SCIENCES
Amelogenin results were obtained for the majority of animalstested. Gender determination was not possible in domestic and wildgame animals as only one band sized at 102 bases was detected. Noamplification products were detected in fish or any of the marineanimals tested, with the exception of the whales, which displayed a102-base fragment.
These results indicate that samples that may have come in contactwith nonhuman biological sources, and more specifically with mi-croorganisms, should provide clean and interpretable Profiler Plus™profiles. This is especially true considering the excess target to con-taminant ratio of DNA required before the monosignal is attained.
The ultimate evaluation of any DNA typing system resides in itsperformance with casework and mixture samples. The results pre-sented in this report all point to the robustness and reliability of theAmpF�STR® Profiler Plus™ system when used under the experi-mental conditions described herein. Reducing the PCR volume to25 �L allows major cost savings per sample analysis while main-taining high quality profiles. With this system, very high discrimi-nation can be achieved with minimal analytical consumption ofcrucial evidentiary samples. These represent major advantages forforensic laboratories contemplating ways to reduce cost withoutcompromising high quality service.
Acknowledgments
The authors would like to thank members of the RCMP Foren-sic Laboratory in Ottawa and in Halifax, as well as members of theBureau of Criminal Apprehension of the State of Minnesota, forproviding DNA extracts from some of their completed RFLP andPCR criminal cases for use in this validation study. We also thankDr. John Bowen from the RCMP Forensic Laboratory in Ottawafor his many helpful comments.
References1. Weber JL, May PE. Abundant class of human polymorphisms which can
be typed using the polymerase chain reaction. Am J Hum Genet1989;44:388–96.
2. Edwards A, Civitello A, Hammond HA, Caskey CT. DNA typing andgenetic mapping with trimeric and tetrameric tandem repeats. Am J HumGenet 1991;49:746–56.
3. Hammond HA, Jin L, Zhong Y, Caskey CT, Chakraborty R. Evaluationof 13 short tandem repeat loci for use in personal identification applica-tions. Am J Hum Genet 1994;55:175–89.
4. McBride LJ, O'Neill MD. Automated analysis of mutations responsiblefor genetic diseases in humans. Am Lab November 1991;52–9.
5. Ishino Y, Mineno J, Inoue T, Fujimiya H, Yamamoto K, Tamura T, et al.Practical applications in molecular biology of sensitive fluorescence de-tection by a laser-excited fluorescence image analyzer. BioTechniques1992;13:936–43.
6. Gill P, Kimpton CP, Sullivan K. A rapid polymerase chain reactionmethod for identifying fixed specimens. Electrophoresis 1992;13:173–5.
7. Sullivan KM, Walton A, Kimpton C, Tully G, Gill P. Fluorescence-based DNA segment analysis in forensic science. Biochem SocietyTrans 1993;21:116–20.
8. Frégeau CJ, Fourney RM. DNA typing with fluorescently tagged shorttandem repeats: a sensitive and accurate approach to human identifica-tion. BioTechniques 1993;15:100–19.
9. Frégeau CJ, Bowen KL, Elliott JC, Robertson JM, Fourney RM. PCR-based DNA identification: a transition in forensic science. In: Proceed-ings of the Fourth International Symposium on Human Identification;1993 Sept; Scottsdale (AZ). Madison (WI): Promega Corporation, 1993;107–18.
10. Urquhart A, Oldroyd NJ, Kimpton CP, Gill P. Highly discriminatingheptaplex short tandem repeat PCR system for forensic identification.BioTechniques 1995;18:116–21.
11. Watson S, Kelsey Z, Webb R, Evans J, Gill P. The development of athird generation STR multiplex system (TGM). In: Olaisen B,
Brinkmann B, Lincoln PJ, editors. Progress in forensic genetics. Pro-ceedings of the Seventeenth Congress of the International Society forForensic Haemogenetics; 1997 Sept 2–6; Oslo (Norway). Elsevier Sci-ence BV, 1998;192–4.
12. Schumm JW, Lins AM, Micka KA, Sprecher CJ, Rabbach DR,Bacher JW. Automated fluorescent detection of STR multiplexes—development of the GenePrint™ PowerPlex™ and FFFL multiplexesfor forensic and paternity applications. In: Proceedings from the Sev-enth International Symposium on Human Identification, 1996 Oct9–11, Scottsdale (AZ). Madison (WI): Promega Corporation, 1997;70–88.
13. Lins AM, Micka KA, Sprecher CJ, Taylor JA, Bacher JW, Rabbach DR,et al. Development and population study of an eight-locus short tandemrepeat (STR) multiplex system. J Forensic Sci 1998;43:1–13.
14. Lazaruk K, Holt C, Wallin J, Walsh PS. Optimization of the D8S1179,D21S11 and D18S51 STR loci for incorporation into AmpF�STR™Green II and AmpF�STR Profiler II™. In: Proceedings from the EighthInternational Symposium on Human Identification; 1997 Oct 9–11;Scottsdale (AZ). Madison (WI): Promega Corporation, 1998;86.
15. Holt CL, Buoncristiani M, Wallin JM, Nguyen T, Lazaruk KD, WalshPS. TWGDAM validation of AmpF�STR™PCR amplification kits forforensic DNA casework. J Forensic Sci 2002;47:66–96.
16. Wallin JM, Holt CL, Lazaruk KD, Nguyen TH, Walsh PS. Constructinguniversal multiplex PCR systems for comparative genotyping. J Foren-sic Sci 2002;47:52–65.
17. Gill P, Kimpton CP, Urquhart A, Oldroyd N, Millican ES, Watson SK,et al. Automated short tandem repeat (STR) analysis in forensic case-work—a strategy for the future. Electrophoresis 1995;16:1543–52.
18. Evett IW, Gill PD, Lambert JA. Taking account of peak areas when in-terpreting mixed DNA profiles. J Forensic Sci 1998;43:62–9.
19. Clayton TM, Whitaker JP, Sparkes R, Gill P. Analysis and interpretationof mixed forensic stains using DNA STR profiling. Forensic Sci Int1998;91(1):55–70.
20. Gill P, Sparkes B, Buckleton JS. Interpretation of simple mixtures whenartefacts such as stutters are present—with special reference to multiplexSTRs used by the Forensic Science Service. Forensic Sci Int 1998;95:213–24.
21. Frégeau CJ, Bowen KL, Fourney RM. Validation of highly polymorphicfluorescent multiplex short tandem repeat systems using two generationsof DNA sequencers. J Forensic Sci 1999;44:133–66.
22. Lygo JE, Johnson PE, Holdaway DJ, Woodroffe S, Whitaker JP, Clay-ton TM, et al. The validation of short tandem repeat (STR) loci for use inforensic casework. Int J Leg Med 1994;107:77–89.
23. Micka KA, Sprecher CJ, Lins AM, Comey CT, Koons BW, Crouse C, etal. Validation of multiplex polymorphic STR amplification sets devel-oped for personal identification applications. J Forensic Sci 1996;41:582–90.
24. Sparkes R, Kimpton C, Watson S, Oldroyd N, Clayton T, Barnett L, etal. The validation of a 7-locus multiplex STR test for use in forensiccasework. I. Mixtures, ageing, degradation and species studies. Int J LegMed 1996;109:186–94.
25. Sparkes R, Kimpton C, Gilbard S, Carne P, Andersen J, Oldroyd N, et al.The validation of a 7-locus multiplex STR test for use in forensic case-work. II. Artefacts, casework studies and success rates. Int J Leg Med1996;109:195–204.
26. Wallin JM, Buoncristiani MR, Lazaruk KD, Fildes N, Holt CL, WalshPS. TWGDAM validation of the AmpF�STR™ blue PCR amplificationkit for forensic casework analysis. J Forensic Sci 1998;43:1–17.
27. Moretti TR, Baumstark AL, Defenbaugh DA, Keys KM, Smerick JB,Budowle B. Validation of short tandem repeats (STRs) for forensic us-age: performance testing of fluorescent multiplex STR systems and anal-ysis of authentic and simulated forensic samples. J Forensic Sci 2001;46:647–60.
28. AmpF�STR Profiler Plus™ PCR Amplification Kit User's Manual 1997.Perkin Elmer Applied Biosystems, Human Identification Department,San Jose, CA.
29. Frégeau CJ, Bowen KL, Bowen JH, Gaudette BD, Fourney RM.National casework and national DNA database: The Royal CanadianMounted Police perspective. In: Olaisen B, Brinkmann B, Lincoln PJ,editors. Progress in forensic genetics. Proceedings of the SeventeenthCongress of the International Society for Forensic Haemogenetics; 1997Sept 2–6; Oslo (Norway). Elsevier Science BV 1998;541–3.
30. Royal Canadian Mounted Police, Forensic Laboratory Services Direc-torate. Biology Section Methods Guide. Rev. ed. Ottawa, ON, RCMP,1998.
31. Waye JS, Presley LA, Budowle B, Shutler GG, Fourney RM. A simpleand sensitive method for quantifying human genomic DNA in forensicspecimen extracts. BioTechniques 1989;7:852–5.
32. Frégeau CJ, Aubin RA, Elliott JC, Gill SS, Fourney RM. Characteriza-tion of human lymphoid cell lines GM9947 and GM9948 as intra- andinterlaboratory reference standards for DNA typing. Genomics 1995;28:184–97.
33. Leclair B, Sgueglia JB, Wojtowicz PC, Juston AC, Frégeau CJ, FourneyRM. STR DNA typing: Increased sensitivity and efficient sample con-sumption using reduced PCR reaction volumes. J Forensic Sci 2003;48(5):1–13.
34. Magnuson VL, Ally DS, Nylund SJ, Karanjawala ZE, Rayman JB,Knapp JI, et al. Substrate nucleotide-determined nontemplated addition
of adenine by Taq DNA polymerase: implications for PCR-based geno-typing and cloning. BioTechniques 1996;21:700–9.
35. Leclair B, Frégeau CJ, Bowen KL, Fourney RM. Systematic analysis ofstutter percentages and allele peak height and area ratios at heterozygousloci for casework and database samples. (submitted to J Forensic Sci).
Additional information and reprint requests:Chantal J. Frégeau, Ph.D.Royal Canadian Mounted PoliceForensic Laboratory ServicesNational DNA Data Bank of Canada1200 Vanier ParkwayOttawa, ON K1G 3M8
FRÉGEAU ET AL. • PROFILER PLUS STR ANALYSIS AND CASEWORK 21