S1
Electronic Supplementary Information
Split Aptamer Mediated Endonuclease Amplification for Small-Molecule Detection
Qing Li, Yan-Dan Wang, Guo-Li Shen, Hao Tang*, Ru-Qin Yu and Jian-Hui Jiang*
State Key Laboratory of Chemo/Biosensing and Chemometrics, College of Chemistry
and Chemical Engineering, Hunan University, Changsha 410082, P. R. China
* Corresponding authors. E-mail: [email protected]; [email protected].
Tel.: 86-731-88821961. Fax : 86-731-88821961.
Electronic Supplementary Material (ESI) for ChemComm.This journal is © The Royal Society of Chemistry 2015
S2
Experimental section
Martials and reagents. All the oligonucleotide sequences used in this study were
synthesized and purified through HPLC by Sangon Biotechnology Co., Ltd.
(Shanghai, China), and sequence information was listed in Table S1. Adenosine,
thymine, cytidine, uridine and inosine were purchased from Sangon Biotechnology
Co., Ltd. (Shanghai, China). Morphine hydrochloride (MHC), caffeine, theophylline,
benzoylecgonine and cocaine were obtained from Beijing Institute for Drug Control
(Beijing, China) and used without further purification. The human serum samples
were obtained from the local hospital. The Endonuclease IV and 10 × NEBuffer 3
(1000 mM NaCl, 500 mM Tris-HCl (pH 7.9), 100 mM MgCl2 and 10 mM DTT) were
purchased from New England Biolabs Ltd (Beijing, China). Deionized and sterilized
water (resistance >18.2 MΩ) was used throughout the experiments.
Fluorescence analysis for the three-way junction structure mediated
endonuclease amplification. Detection probe with AP site one-base, two-base, three-
base and four-base away from junction sites were incubated with different DNA
probes ( DNA probe 1 and Endo IV; DNA probe 2 and Endo IV; DNA probe 1, DNA
probe 2 and Endo IV). Detection probe 1 μM, DNA probe 1 100 nM, DNA probe 2
100 nM, Endo IV 1 U, 1 × NEBuffer 3 were used for all the experiments. After 2.5 h
incubation time at 37 ºC, fluorescence spectrum of each sample was recorded at room
temperature in a 100 µL quartz cuvette on a Fluorolog-Tau-3 spectrofluorometer
(Jobin Yvon Inc., NJ) with the slit set to be 2.5 nm for both the excitation and the
emission using 494 nm for excitation. For the Endo IV mediated cleavage reaction
S3
study, a C1000 Thermal Cycler (Bio-Rad, Hercules, CA, USA) with a CFX96 was
used to record real-time fluorescence intensity at 518 nm. Real-time fluorescence
intensity was monitored in 30 s intervals using the FAM/SYBR Green channel. The
cleavage reactions were conducted at different concentrations of DNA substrate with
detection probe at 1 μM and Endo IV at 1 U in 1 × NEBuffer 3. The initial reaction
velocity was determined from the slope of the progress curve from the first 10 min
data points after Endo IV addition.
Gel electrophoresis analysis of SAMEA assay. The assay was performed with
different DNA probes in the presence or in the absence of adenosine. Each sample
was incubated at for 37 ºC 2.5 h. The resultant mixture was collected and analyzed
using gel electrophoresis in 7% (w/w) agarose stained by 0.5 µg/mL goldview and 0.5
µg/mL ethidium bromide. Electrophoresis was performed at a constant voltage of 101
V for 120 min with a load of 10 µL of sample in each lane. The gel was visualized
using a Tocan 240 gel imaging system (Shanghai Tocan Biotechnology Company,
China).
Fluorescence analysis of SAMEA strategy. For adenosine assay, adenosine AFP1,
adenosine AFP2, detection probe were incubated in 1 × NEBuffer 3 at 37 ºC for 20
min. Then, Endo IV was added into the reactions system and incubating at 37 ºC for
2.5 h before allowing fluorescence detection. The final concentration in the 30 μL
reaction system were 100 nM adenosine AFP1, 100 nM adenosine AFP2, 1μM
detection probe and 1 U Endo IV. Concentrations of adenosine were ranged from 0 to
5 mM. For cocaine detection, cocaine AFP1 and cocaine AFP2 were used instead of
S4
adenosine AFP1, adenosine AFP2. Concentrations of cocaine were ranged from 0 to 5
mM. The fluorescence spectra were measured at room temperature in a 100 µL quartz
cuvette on a Fluorolog-Tau-3 spectrofluorometer (Jobin Yvon Inc., NJ) with the slit
set to be 2.5 nm for both the excitation and the emission. Time-dependent
fluorescence responses of the SAMEA assay were performed with a time interval of
30 s in a 384-well black microplate on a Tecan Infinite M-1000 microplate reader.
The excitation wavelength was 494 nm, and the emission wavelength was 518 nm
with both excitation and emission bandwidths of 10 nm.
S5
Results section
Design of three-way junction structure mediated endonuclease amplification.
To investigate the possibility of Endo IV-mediated amplification for split aptamer, we
design a three-way junction structure using two DNA probes, 1 and 2, with a
detection probe (Table S1). As shown in Fig. S1, these two DNA probes can
hybridize with each other to form a DNA duplex with two tail sequences extended at
one side. The detection probe is designed as a dually-labeled probe with an apurinic
or apyrimidinic (AP) site flanked by two sequences complementary to the two tail
sequences of DNA probes, 1 and 2, respectively. This probe delivers a low fluorescent
background in its intact state because of efficient förster resonance energy transfer
(FRET) between these two labels, the fluorophore FITC and the quencher TAMRA.
Detection probe only has a short sequence such that the melting temperature for the
duplex between probe and its perfectly matched sequence is ~50 oC, as calculated by
DNA folding (http://www.bioin- fo.rpi.edu/applications/).1 This design implies that
probe 3 can be annealed on two tail sequences of the DNA duplex between probes 1
and 2 and generate a three-way junction structure. On the other hand, provided that
probe is cleaved by Endo IV, its fragments are too short to stably hybridize with the
tail sequences. That is, provided that probe is cleaved by Endo IV in the three-way
DNA junction, the tail sequences in the duplex of probes 1 and 2 are released and
allowed to hybridize with another detection probe, mediating a cycling of the
cleavage of the detection probe. This cycling is able to activate an intense
fluorescence signal because of the separation of the fluorophore FITC from the
S6
quencher TAMRA and thus creates substantial signal amplification for detecting the
duplex of probes 1 and 2. Fig. S2 depicts typical fluorescence spectral responses of
Endo IV-mediated amplification from this three-way DNA junction. One observed
that incubation of the detection probes separately with probe 1 or 2 mostly gave very
weak fluorescence signals, but the detection probe with the AP site four bases away
from the junction displayed a slightly large fluorescence response. This slight
fluorescence activation was ascribed to cleavage of the detection probe by one of the
tail sequence. In contrast, incubation of the detection probes with the duplex of probes
1 and 2 resulted in fluorescence activation to a degree dependent upon the distance
from the AP site to the junction. In the cases when the AP site was one- or two-base
away from the junction, the fluorescence responses were relatively low, presumably
because the steric hindrance of the junction prevented Endo IV from approach and
cleaving the AP site. For detection probes with the AP site three- or four-base away
from the junction, the fluorescence activation signal became very intense, indicating
efficient cleavage of the detection probe. This maximized signal-to-background ratio
was obtained for the detection probe with the AP site three-base away from the
junction, which was attributed to the minimized steric hindrance and the optimized
selectivity for the three-way junction mediated cleavage of the detection probe. A
further analysis of Endo IV mediated cleavage reactions revealed that the Michaelis
constant for Endo IV mediated cleavage of this three-way junction was ~1.61 μM,
which was merely slightly larger than the Michaelis constant (~0.71 μM) for Endo IV
mediated cleavage of the linear DNA duplex as shown in Fig. S3. These data implied
S7
a finding that the three-way junction was an active substrate for Endo IV, provided
the AP site was three-base away from the junction. It is noteworthy that because the
three-way junction is a very common design in nucleic acid chemistry,2 this finding is
expected to hold great potential for the development of new sensitive strategies for
nucleic acid based analysis.
S8
Table S1. Sequences of DNA probesa
Name Sequence (5′-3′)
DNA probe 1-1
DNA probe 2-1
DNA probe 1-2
DNA probe 2-2
DNA probe 1-3
DNA probe 2-3
DNA probe 1-4
DNA probe 2-4
Cocaine AFP1
ACCTTCCTCCGCA CGAAC TAGATTGTAT
GTTGAGGTAG GTTCGTGCGGAGGAAGGT
ACCTTCCTCCGCA CGAAC GTAGATTGTAT
GTTGAGGTA GTTCGTGCGGAGGAAGGT
ACCTTCCTCCGCA CGAAC AGTAGATTGTAT
GTTGAGGT GTTCGTGCGGAGGAAGGT
ACCTTCCTCCGCA CGAAC TAGTAGATTGTAT
GTTGAGG GTTCGTGCGGAGGAAGGT
GGGAGTCAAGAACAGTAGATTGTAT
Cocaine AFP2 GTTGAGGTGTTCTTCAATGAAGTGGGACGACA
Adenosine AFP1 ACCTGGGGGAGTATCGAACAGTAGATTGTAT
Adenosine AFP2 GTTGAGGTGTTCGTGCGGAGGAAGGT
Detection probe ATACAAT(FITC)CXACT(TAMRA)ACCTCAAC
aBoldface type indicates split aptamer sequences of cocaine and adenosine. Italic type
in AFP 1 and AFP 2 shows tail sequence. The stabilizer sequences are highlighted in
red. X represents abasic sites. DNA probes 1-1 and 2-1, 1-2 and 2-2, 1-3 and 2-3, 1-4
and 2-4 are paired separately with the detection probe to form three–way junction
structures. The AP site in the detection probe is at one-base, two-base, three-base, or
four-base away from the junction site with DNA probes 1-1 and 2-1, 1-2 and 2-2, 1-3
and 2-3, 1-4 and 2-4 accordingly.
S9
Fig. S1. Design of three-way junction structure mediated endonuclease amplification.
S10
Fig. S2. (A) Fluorescence spectral responses for Endo IV-mediated amplification
under different conditions. Detection probe with AP site one-base, two-base, three-
base and four-base away from junction sites incubated with DNA probe 1 and Endo
IV (b, d, f, i); DNA probe 2 and Endo IV (a, c, e, g); DNA probe 1, DNA probe 2 and
Endo IV (h, j, k, l). (B) The corresponding fluorescence peak intensities at 518 nm of
detection probe with AP site one-base (1); two-base (2); three-base (3); and four-base
(4) away from junction sites incubated with different DNA probes and Endo IV.
S11
0 20 40 60 80 100 1200
10000
20000
30000
40000
50000
60000
70000
Time / min
A
Fluo
resc
ence
inte
nsity Linear DNA duplex
Three-way junction
Fig. S3. Fluorescence activation rates of linear DNA duplex and three-way DNA
junction structure. Fluorescence-based progress curves of the Endo IV-catalyzed
reaction as a function of time (A); Double reciprocal (Lineweaver-Burk) plot of the
initial degradation velocity as a function of concentrations of linear DNA duplex (B)
and three-way DNA junction structure (C). Error bars are standard deviation of three
repetitive experiments.
0.0 .5 1.0 1.5 2.0-.5
0.0
.5
1.0
1.5
2.0
2.5
1 / V
(nM
-1se
c)
1 / [DNA] (nM-1)
f=0.0014+0.9924*xKm=0.71 μM
100 200 300 400 500 6002000
4000
6000
8000
10000
12000
14000
16000
Fluo
resc
ence
inte
nsity
Time / sec
10 nM
8 nM
4 nM
1 nM
0.5 nM
B
.001 .002 .003 .004 .0050.0
.2
.4
.6
.8
1.0
1.2
1 / V
(nM
-1se
c)
1 / [DNA] (nM-1)
f=0.1554+250.1908xKm=1.61μM
C
100 200 300 400 500 6003000
4000
5000
6000
7000
8000
9000800 nM
750 nM
600 nM
400 nM
200 nM
Time / sec
Fluo
resc
ence
inte
nsity
S12
Fig. S4. Selectivity for adenosine assay using the SAMEA strategy. The concentration
of each analyte was 5 mM. F and F0 correspond to fluorescence intensities obtained in
the presence or absence of analytes, respectively. Error bars are standard deviation of
three repetitive experiments.
S13
0 500 1000 1500200
400
600
800
1000
1200
1400
1600
1800
Time /sec
Fluo
resc
nce
inte
nsity
5 mM500 μM50 μM
5μM500 nM50 nM5 nM
500 pM50 pM5 pM0 pM
A
0 1e+9 2e+9 3e+9 4e+9 5e+9 6e+90.0
.1
.2
.3
.4
.5
.6
.7
.8
Fluo
resc
ence
act
ivat
ion
rate
s
1 2 3 4 5
.10
.15
.20
.25
.30
Fluo
resc
ence
act
ivat
ion
rate
s
B
Cadenosine / pM
Lg(Cadenosine / pM(
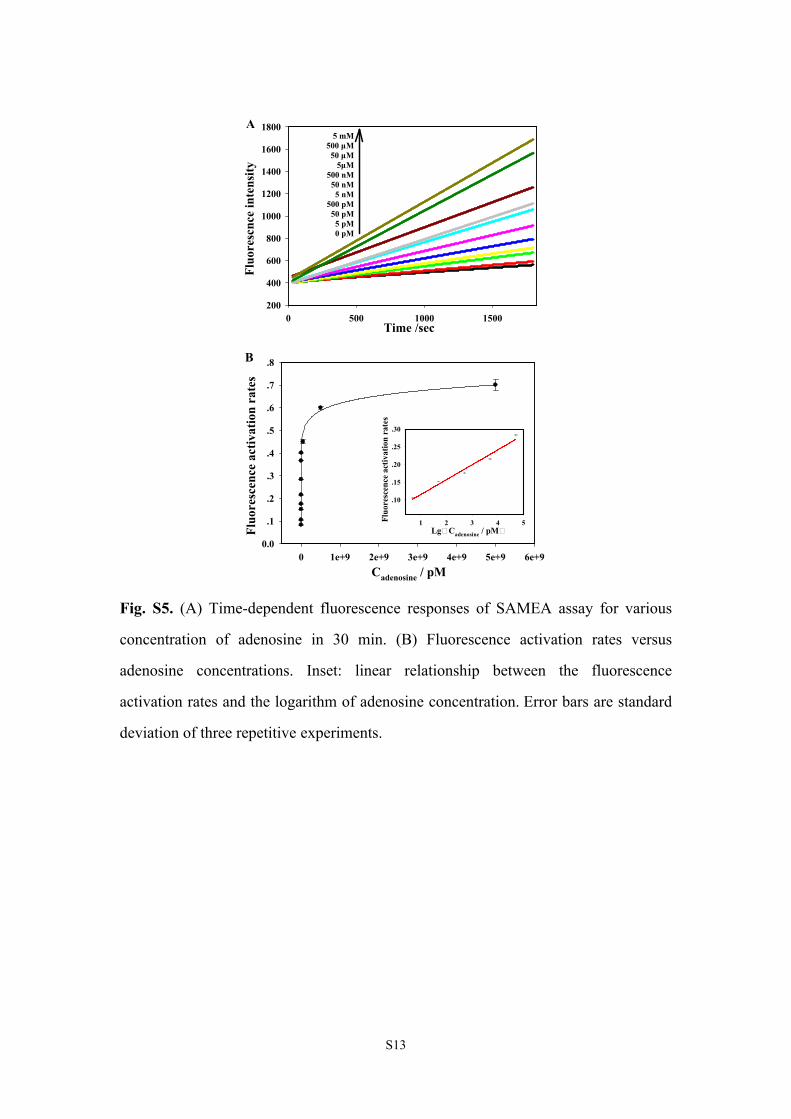
Fig. S5. (A) Time-dependent fluorescence responses of SAMEA assay for various
concentration of adenosine in 30 min. (B) Fluorescence activation rates versus
adenosine concentrations. Inset: linear relationship between the fluorescence
activation rates and the logarithm of adenosine concentration. Error bars are standard
deviation of three repetitive experiments.
S14
0 1e+9 2e+9 3e+9 4e+9 5e+90
5
10
15
20
25
30
35
I F / 1
05 (cps
)
Cadenosine / pM
Fig. S6. The calibration curve for adenosine detection in diluted serum. Error bars
were estimated from three replicate measurements.
S15
Table S2. Recovery experiments of adenosine in 10% human sera samples
Samples Added adenosine (nM) Detected adenosinea (nM) Recovery (%)
1 0 0.0252 ± 0.001
2
3
4
0.005 0.0301 ± 0.001 98.0
0.05 0.073 ± 0.004 95.6
0.5 0.477 ± 0.017 90.4
5 5 5.443 ± 0. 3 108.4
6 50 50.602 ± 2 101.2
aAverage of three determinations ± standard deviation
S16
520 540 560 580 600
5
10
15
20
25
30
I F / 1
05 (cps
)
Wavelength (nm)
Fig. S7. Typical fluorescence spectral responses for cocaine detection. Cocaine AFP1
+ detection probe + Endo IV (red), cocaine AFP2 + detection probe + Endo IV
(green), cocaine AFP1 + cocaine AFP2 + detection probe + Endo IV (cyan),
benzoylecgonine + cocaine AFP1 + cocaine AFP2 + detection probe + Endo IV (blue),
cocaine + cocaine AFP1 + cocaine AFP2 + detection probe + Endo IV (pink).
Reactions were performed at 37 ºC for 2.5 h and detection probe 1 μM, cocaine AFP1
100 nM, cocaine AFP2 100 nM, cocaine 5 mM, benzoylecgonine 5 mM, Endo IV 1U
were used for all experiments.
S17
Fig. S8. Selectivity for cocaine assay using the SAMEA strategy. The concentration
of each analyte was 1 mM. F and F0 correspond to fluorescence intensities obtained in
the presence or absence of analytes, respectively. Error bars are standard deviation of
three repetitive experiments.
S18
520 540 560 580 6000
5
10
15
20
25
30
Wavelength (nm)
5 mM1 mM100 μM10 μM1 μM100 nM10 nM1 nM100 pM10 pM0 pM
A
I F / 1
05 (cps
)
0 2e+9 4e+9 6e+9
0
5
10
15
20
25
30
I F / 1
05 (cps
)
1 2 3 4 58
9
10
11
12
13
14
I F / 1
05 (cps
)
B
Ccocaine / pM
Lg(Ccocaine / pM(
Fig. S9. (A) Fluorescence spectra of SAMEA assay in response to cocaine of various
concentrations. (B) The corresponding fluorescence response at 518 nm of the SAMEA assay.
Inset: linear relationship between fluorescence peak intensity and the logarithm of cocaine
concentration. Error bars are standard deviation of three repetitive experiments.
S19
0 500 1000 1500200
400
600
800
1000
1200
1400
1600
1800
2000
2200
Fluo
resc
nce
inte
nsity
Time /sec
5 mM1 mM
100 μM10 μM
1 μM100 nM
10 nM1 nM
100 pM10 pM
0 pM
A
Fig. S10. (A) Time-dependent fluorescence responses of SAMEA assay for various
concentration of cocaine in 30 min. (B) Fluorescence activation rates versus
adenosine concentrations. Inset: linear relationship between the fluorescence
activation rates and the logarithm of cocaine concentration. Error bars are standard
deviation of three repetitive experiments.
0 1e+9 2e+9 3e+9 4e+9 5e+9 6e+9
0.0
.2
.4
.6
.8
1.0
Fluo
resc
ence
act
ivat
ion
rate
s
1 2 3 4 5.22.24.26.28.30.32.34.36.38.40.42
Fluo
resc
ence
act
ivat
ion
rate
s
B
Ccocaine / pM
Lg(Ccocaine / pM(
S20
0 1e+9 2e+9 3e+9 4e+9 5e+9
0
5
10
15
20
25
30
I F / 1
05 (cps
)
Ccocaine / pM
Fig. S11. The calibration curve for cocaine detection in diluted serum. Error bars were
estimated from three replicate measurements.
S21
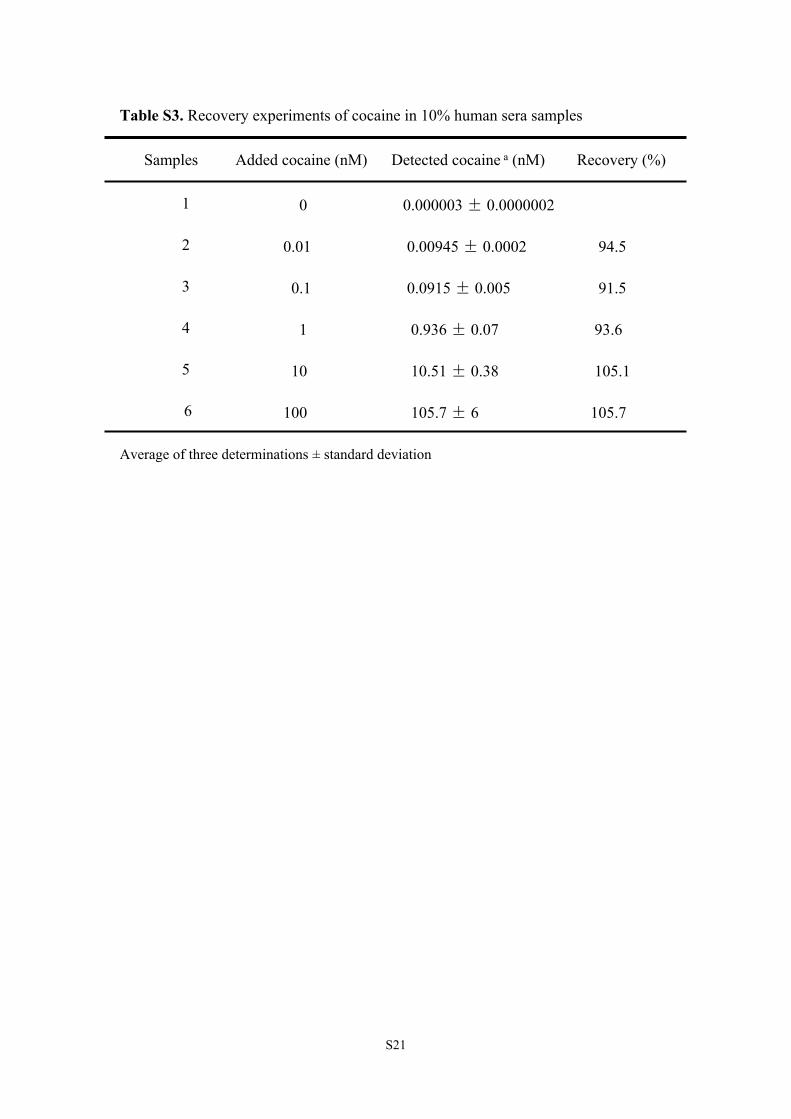
Table S3. Recovery experiments of cocaine in 10% human sera samples
Samples Added cocaine (nM) Detected cocaine a (nM) Recovery (%)
1
2
0 0.000003 ± 0.0000002
0.01 0.00945 ± 0.0002 94.5
3
4
5
0.1 0.0915 ± 0.005 91.5
1 0.936 ± 0.07 93.6
10 10.51 ± 0.38 105.1
6 100 105.7 ± 6 105.7
Average of three determinations ± standard deviation
S22
References:
1. M. Zuker, Nucleic Acids Res., 2003, 31, 3406–3415.
2. F. Li, Y. W. Lin and X. C. Le, Anal. Chem., 2013, 85, 10835 −10841.